Article

A Damage-Based Fully Coupled DFN Study of Fracture-Driven Interactions in Zipper Fracturing for Shale Gas Production

1
Research Center of Coastal and Urban Geotechnical Engineering, College of Civil Engineering and Architecture, Zhejiang University, Hangzhou 310058, China
2
Shaanxi Key Laboratory of Lacustrine Shale Gas Accumulation and Exploitation, Xi’an 710065, China
3
Shale Gas Research Institute, PetroChina Southwest Oil & Gasfield Company, Chengdu 610500, China
*
Author to whom correspondence should be addressed.
Energies 2025, 18(17), 4722; https://doi.org/10.3390/en18174722
Submission received: 25 July 2025 / Revised: 27 August 2025 / Accepted: 3 September 2025 / Published: 4 September 2025

Abstract

As a significant energy source enabling the global energy transition, efficient shale gas development is critical for diversifying supplies and reducing carbon emissions. Zipper fracturing widely enhances the stimulated reservoir volume (SRV) by generating complex fracture networks of shale reservoirs. However, recent trends of reduced well spacing and increased injection intensity have significantly intensified interwell interference, particularly fracture-driven interactions (FDIs), leading to early production decline and well integrity issues. This study develops a fully coupled hydro–mechanical–damage (HMD) numerical model incorporating an explicit discrete fracture network (DFN), opening and closure of fractures, and an aperture–permeability relationship to capture the nonlinear mechanical behavior of natural fractures and their role in FDIs. After model validation, sensitivity analyses are conducted. Results show that when the horizontal differential stress exceeds 12 MPa, fractures tend to propagate as single dominant planes due to stress concentration, increasing the risks of FDIs and reducing effective SRV. Increasing well spacing from 60 m to 110 m delays or eliminates FDIs while significantly improving reservoir stimulation. Fracture approach angle governs the interaction mechanisms between hydraulic and natural fractures, influencing the deflection and branching behavior of primary fractures. Injection rate exerts a dual influence on fracture extension and FDI risk, requiring an optimized balance between stimulation efficiency and interference control. This work enriches the multi-physics coupling theory of FDIs during fracturing processes, for better understanding the fracturing design and optimization in shale gas production.

1. Introduction

Shale gas now constitutes a substantial component of global natural gas production. Its large-scale development facilitates energy diversification and reduces reliance on high-carbon fuels—accelerating the transition toward a low-carbon economy [1]. However, shale reservoirs are characterized by ultra-low porosity and permeability, making gas flow exceedingly difficult. Consequently, conventional production techniques fail in ensuring efficient shale gas recovery [2]. To enhance shale gas production development efficiency, long horizontal wells combined with volumetric fracturing technique are widely adopted. This technique aims to create large-scale complex fracture networks, thereby increasing the stimulated reservoir volume (SRV) and reducing flow resistance, ultimately enabling the efficient development of shale gas resources [3]. As an essential technical choice within the volume fracturing technology system, zipper fracturing not only shortens the completion cycle but also develops complex fracture networks, thereby enhancing the SRV [4,5].
Advances in fracturing technology have driven new trends in shale reservoir design, characterized by reduced well spacing and increased injection volume. During fracturing operation, hydraulic fractures from injection wells frequently interconnect with natural fracture networks near adjacent producers. This enables high-pressure fluid migration between wells, thereby triggering fracture-driven interactions (FDIs). In recent years, FDIs have exhibited marked increases in both occurrence frequency and magnitude, severely compromising well-group productivity and economic returns of field development [6]. Empirical evidence confirms widespread FDI impacts in major shale plays. In the Eagle Ford shale gas region (USA), 65% of wells experienced FDIs when well spacing was reduced below 400 feet, resulting in anomalous pressure surges and erratic gas production rates [7]. Since 2022, the occurrence rate reached 84% in southern Sichuan Basin shale gas fields (China), causing severe production disruptions including proppant flowback, casing deformation/failure events, and non-producible well conditions [8]. Understanding the mechanisms and patterns of FDIs now represents a research priority for both academia and industry practitioners. An in-depth investigation of FDI mechanisms enables optimized well placement and fracture design, thus reducing the risks of FDIs in unconventional shale reservoir, providing significant engineering guidance for enhancing shale gas recovery efficiency.
Field monitoring and experimental studies can be applied to investigate FDIs. Daneshy et al. [9] established two FDI types—fracture intersection and fracture shadowing-through field tests in the Waskada sandstone (Williston Basin), leveraging observation-well pressure responses during hydraulic fracturing. Schaeffer et al. [10] integrated observation well pressure monitoring with microseismic monitoring, including moment tensor inversion (MTI), and microseismic radiation imaging (MRI) techniques, to characterize fracture geometries during multi-stage horizontal well fracturing. This approach identified reservoir-scale natural fracture networks as preferential flow pathways for FDIs between parent-child well pairs. Three fundamental FDI mechanisms between parent-infill well pairs were classified by communication pathways: (1) matrix-based interaction, in which poroelastic effects produce stress shadowing around fracture tips in child wells, resulting in stress-induced interactions affecting parent wells; (2) direct hydraulic connection, hydraulic fractures from child wells directly extend to parent wellbores or fractures; and (3) natural fractures-mediated connectivity, pre-existing natural fractures provide preferential flow linking parent and child wells [11,12]. As diagnostic and monitoring techniques for FDI developed, researchers have begun applying these approaches to optimize fracturing designs. Cipolla et al. [13,14] used real-time microseismic fracture monitoring to track fracture propagation, mapping fracture network coverage and extent. This enabled dynamic adjustments to fracturing operations and active control of fracture propagation directions. Manchanda [15] employed an integrated set of diagnostic techniques, including pressure monitoring, microseismic monitoring, and fluid tracers, to analyze the influence of stage spacing, fracturing sequence, and parameter design on hydraulic fracturing processes. Results suggested extended fracturing duration and modified stage sequencing may effectively reduce FDIs.
Field monitoring delivers critical insights into the patterns of FDIs, enabling better understanding and fracturing design optimization. However, the primary controlling factors governing FDI mechanisms require further investigation. Several numerical methods have been used to explore the mechanisms of FDIs under coupled geomechanics-fluid flow conditions [16,17]. Weng et al. [18] employed the finite element method to investigate the suppression mechanisms of vertical fracture growth influenced by bedding-plane friction coefficients and horizontal stress ratios, proposing vertically staggered well patterns to reduce the risk of FDIs. Cai et al. [19] developed the extended finite element method (XFEM) to distinguish the pressure-response characteristics between two FDI types—direct hydraulic impact and stress shadowing. Sesetty et al. [20] applied XFEM to quantify how elastic modulus anisotropy and fracture toughness may affect fracture propagation, aperture dynamics, and multi-cluster efficiency variations. This established fundamental principles for controlling FDIs in anisotropic reservoirs through optimized fracture design. Nevertheless, these studies failed to establish fully coupled bidirectional interactions between fracture propagation and stress-permeability fields [21]. With advancements in numerical techniques, fully-coupled methods capturing the interaction of geomechanics, fluid flow, and fracture propagation have been used to study FDIs. Rezaei [22], using displacement discontinuity methods (DDM), found that uneven pore pressure during refracturing of depleted wells causes stress reversals. These changes redirect new fractures toward existing ones, thus triggering FDIs. Seth et al. [23], employing finite element analysis, found that stress shadowing resulting from mechanical connection of hydraulic fractures also induces FDIs. However, the above studies assumed homogeneous reservoirs, neglecting the impact of natural fractures. Considering the prevalent natural FDIs in a shale gas field in southern Sichuan, Wang et al. [24] developed a fully-coupled numerical model incorporating regularized natural fracture belts, revealing that natural fractures govern FDI patterns. Wang et al. [25], using FDEM with the same natural fracture belt model, investigated how natural fracture belt parameters control FDI behaviors. Nonetheless, these studies overlooked the stochastic distribution characteristics of natural fractures in actual shale reservoirs and further simplified natural fracture aperture and permeability as static constants.
So far, significant progress has been made in numerical investigations of FDIs [26]. However, several critical challenges remain not fully resolved: (1) Many existing models do not fully couple fracture propagation, geomechanics, and fluid flow. Instead, they rely on stepwise uncoupled approaches that overlook real-time interactions and nonlinear coupling between physical fields. As a result, these models struggle to accurately predict fluid migration paths and failure thresholds, limiting their reliability in complex geological settings. (2) Many studies do not adequately account for the spatially complex distribution and multi-scale characteristics of natural fractures in shale reservoirs, either omitting natural fractures entirely or representing them as regularized fracture belts. Such assumptions fail to capture the inherent randomness and multi-scale characteristics of natural fracture networks observed in logging data, leading to substantial underestimation of FDI risks. (3) Existing numerical frameworks often treat the aperture and permeability of natural fractures as constant values, neglecting the coupled effects of mechanical opening, closure, and frictional slip during fracture activation. This oversimplification ignores dynamic aperture variations driven by effective stress changes and excludes critical permeability alterations resulting from fracture dilation or closure. They cannot consider the impact of stress-dependent fracture stiffness on reservoir permeability and mechanical coupling behavior. These limitations hinder the accurate prediction of transient stress field responses, evolving permeability, and fluid migration patterns within discrete fracture networks.
This paper presents a fully coupled Hydro–Mechanical–Damage (HMD) numerical model for simulating complex fracture evolution and FDIs resulting from zipper fracturing in shale reservoirs. Developed within a finite element framework, the model integrates fracture propagation, geomechanics, and fluid flow in a unified manner, preserving the non-linear interactions typically overlooked in stepwise or uncoupled approaches. To better represent flow characteristics, the model explicitly incorporates discrete natural fracture networks, capturing preferential flow paths. The mechanical constitutive laws account for shear dilation and include dynamically evolving aperture–permeability relationship, enabling a more accurate description of fracture activation mechanisms. By using the proposed numerical framework, systematic multi-parameter sensitivity analyses are performed to evaluate the combined effects of key controlling variables—including horizontal principal stress difference, interwell spacing, fracture approach angle, and injection rate—on FDI behaviors. The numerical results may provide both theoretical insights and practical guidance for optimizing well placement and fracturing designs for shale gas production.

2. Fully Coupled Hydro–Mechanical–Damage Numerical Model

Shale reservoirs with distributed natural fractures belong to fractured porous media, comprising a porous matrix and discrete fracture network (DFN) [27,28]. The complex nature of hydraulic fracturing in fractured porous media results from the coupled interaction of multiple physical fields, including geomechanics, fluid flow, and fracture propagation. Analysis of the hydraulic fracturing process in fractured porous media involves (1) deformation of the porous matrix, (2) initiation and propagation of induced fractures, (3) fluid flow behaviors within fractured porous media, (4) nonlinear mechanical responses of natural fractures.

2.1. Solid Deformation and Damage Evolution

The stress equilibrium equation for fractured porous rock is given by
· σ + f = 0 ,
where σ is the stress tensor, and f is the body force. The stress–strain relationship of the rock material obeys the linear poroelasticity law incorporating an isotropic damage model, and is expressed as [29]
σ ¯ = σ α p I = ( 1 D ) C : ε ,
where σ ¯ is the effective stress tensor, α is the Biot’s coefficient, p is the pore fluid pressure, I is the identity tensor of second order, D is the scalar damage variable, C is the elastic stiffness tensor, and ε is the strain tensor. In this study, tensile stresses and strains are defined as positive, while compressive stresses and strains are defined as negative. The maximum tensile stress criterion and Mohr–Coulomb criterion are employed to determine whether rock damage occurs, expressed by the following yield functions [30],
F 1 = σ ¯ 1 f t
and
F 2 = σ ¯ 3 + σ ¯ 1 1 + s i n ϕ r 1 s i n ϕ r f c
where σ ¯ 1 is the maximum effective principal stress, σ ¯ 3 is the minimum effective principal stress, f t is the tensile strength, f c is the compressive strength, ϕ r is the internal friction angle.
Based on the smoothed Rankine criterion, this study defines the equivalent tensile strain ε ~ t and the equivalent compressive strain ε ~ c as [29]
ε ~ t = C : ε E
and
ε ~ c = C : ε E
where · is the norm operator, · are the Macaulay brackets denoting the positive part and E is the initial Young’s modulus.
An isotropic elastic-brittle damage model [31] is employed to characterize the damage evolution of the rock matrix (Figure 1a,c). When tensile damage occurs in the rock ( F 1 0 ), the relationship between damage scalar D and the equivalent tensile strain ε ~ t can be expressed as [32]
D = 0 ,   ε ~ t < ε t 0 1 f t r E ε ~ t , ε ~ t ε t 0
where f t r is the residual tensile strength defined by f t r = η f t , η is the residual strength ratio, and ε t 0 = f t / E is the limit of elastic tensile strain. When shear damage occurs in the rock ( F 2 0 ), the relationship between the damage scalar D and the equivalent compressive strain ε ~ c can be expressed as [32]
D = 0 ,   ε ~ c > ε c 0 1 f c r E ( ε ~ c ) , ε ~ c ε c 0
where f c r is the residual compressive strength defined by f c r = η f c , and ε c 0 is the limit of elastic compressive strain defined by ε c 0 =   f c / E .

2.2. Normal and Shear Displacements of Fractures

In computational fracture mechanics, fractures can be characterized as internal interfaces with negligible thickness, described by penalty-based contact algorithms [33,34]. The normal and tangential tractions across fracture interfaces adhere to traction continuity
σ ¯ n + = σ ¯ n
and
σ ¯ s + = σ ¯ s
where σ ¯ n is the effective normal stress, σ ¯ s is the effective shear stress, and the superscripts “ + ” and “ ” are used to differentiate the two opposing sides of the fracture interface. The displacement jumps across the fracture interfaces are governed by spring stiffness associated with the discontinuous displacement condition as [35]
σ ¯ n = K n ( b n b 0 )
and
σ ¯ s = K s b s
where K n and K s are the normal and shear stiffness of the natural fracture, respectively, b n is the normal aperture, b 0 is the initial aperture, and b s is the relative shear displacement along the fracture plane. The aperture of natural fractures follows an exponential function relationship (Figure 1b) as [36]
b n = b r + b 0 b r exp ξ σ ¯ n
where b r is the residual aperture of the fracture, ξ = 1 / K n 0 b 0 b r is the stress-aperture correlation coefficient, K n 0 is the initial normal stiffness. The normal stiffness of the fracture under compression thus exhibits a nonlinear behavior as
K n = σ ¯ n b n = b 0 b r b n b r K n 0 = K n 0 exp ( ξ σ ¯ n ) .
The shear behavior of the fracture is assumed to be governed by Coulomb friction law (Figure 1d) [37] as
σ ¯ s = K s b s , b s b p τ p , b s > b p
where b p = σ ¯ s / K s is the peak relative shear displacement, τ p = σ ¯ n tan ϕ f is the peak shear effective stress, and ϕ f is the friction angle. When the relative shear displacement exceeds the peak relative shear displacement, the fracture starts to slip. The shear-induced dilation is related to the shear displacement via an incremental formulation (Figure 1d) [38] as follows,
v s = ( b u b p ) tan ( ϕ d )   ,   b s > b u ( b s b p ) tan ( ϕ d )   ,   b p < b s < b u 0   ,   b s b p ,
where ν s is the shear-induced dilation, b u is the residual relative shear displacement, and ϕ d is the dilation angle. Fractures in shale reservoirs are influenced by the in-situ stress state, undergoing closure, displacement, and dilation processes, which lead to variations in fracture aperture. The fracture aperture is then given by [39]
b f = b n + ν s

2.3. Fluid Flow in Fractured Porous Media

Assuming single-phase flow in the shale reservoir, fluid flow in the rock matrix and fractures adheres to the principle of mass conservation [40] as
( ρ w φ m ) t + · ρ w U m = Q m + Q f m
and
b f ( ρ w φ f ) t + · ( b f ρ w U f ) = b f Q m f
where ρ w is the density of fracturing fluid, φ m and φ f are the porosity of the rock matrix and fractures, respectively, t is the time, U m and U f are the fluid velocity in the matrix and fractures, respectively. Q m is the mass source term in the matrix,  Q f m is mass source term from fractures to the matrix, Q m f is mass source term from the matrix to fractures.
The flow behavior is governed by Darcy’s law [41] as
U m = k m μ w p
and
U f = k f μ w p
where k m and k f are the permeability of the rock matrix and fractures, respectively, μ w is the dynamic viscosity of fracturing fluid. In the porous elastic media, deformation of the rock matrix changes the fluid content in the matrix. Accordingly, the mass source in the matrix is given by
Q m = α ρ w ε v t
where ε v is the volumetric strain of the solid skeleton. The mass source term from fractures to the matrix is given by [42]
Q f m = ρ w k m μ w p · n f ,
where n f denotes the outward unit normal vector on the fracture surface. The mass source term from the matrix to fractures is given by
Q m f = ρ w k m μ w p · ( n f ) = Q f m
The fracturing fluid storage relation is defined as
( ρ w φ m ) t = ρ w S m p t
and
( ρ w φ f ) t = ρ w S f p t
where S m and S f are the storage coefficients of the rock matrix and fractures, respectively. By combining the above equations, the governing flow equations for the rock matrix and fractures can be formulated as [43]
ρ w S m p t · ρ w k m μ w p = α ε v t + Q f m
and
b f ρ w S f p t · b f ρ w k f μ w p = b f Q f m
It’s assumed that there is no infilling material in natural fractures and φ f is fixed to be unity. The permeability of natural fractures is related to the fracture aperture based on the cubic law [44]
k f = b f 3 12
and the storage coefficient of natural fractures is given by the following expression [45]
S f = c w + 1 K n b f
where c w is the compressibility coefficient of fracturing fluid.
For the rock matrix, its porosity is calculated using the following expression [36]
ϕ m = ϕ r + ( ϕ 0 ϕ r ) exp ( ς σ ¯ p ) ,
where ϕ 0 is the initial porosity, ϕ r is the residual porosity, σ ¯ p is the effective mean stress, ς is the porosity–stress correlation coefficient. For undamaged rock elements (D = 0), ς = c m / ( φ 0 φ r ) , for damaged rock element (D > 0), ς = 5 × 1 0 8   P a 1 . The permeability of the rock matrix is calculated using the following expression [46]
k m = k 0 ( φ m φ 0 ) 3 exp ( ζ D )
where k 0 is the initial permeability of the rock matrix, ζ is the permeability–damage correlation coefficient, ζ = 5 × 10 8     P a 1 [47]. The storage coefficient of the rock matrix is calculated using the following expression [45,48]
S m = φ m c w + ( α φ m ) c m ,
where c m = 3 ( 1 2 ν ) / E is the drained compressibility coefficient of the rock matrix.

2.4. Model Solution

In this study, a fully coupled HMD model is developed within a finite element framework. The computational domain is discretized using an unstructured triangular mesh. Initiation and propagation of hydraulic fractures are characterized by element damage evolution, while the natural fractures are represented by joint elements connecting adjacent finite elements. Due to highly nonlinear behavior of the coupled equation system in both temporal and spatial domains, the implicit Backward Differentiation Formula (BDF) method is employed to solve the governing equations.
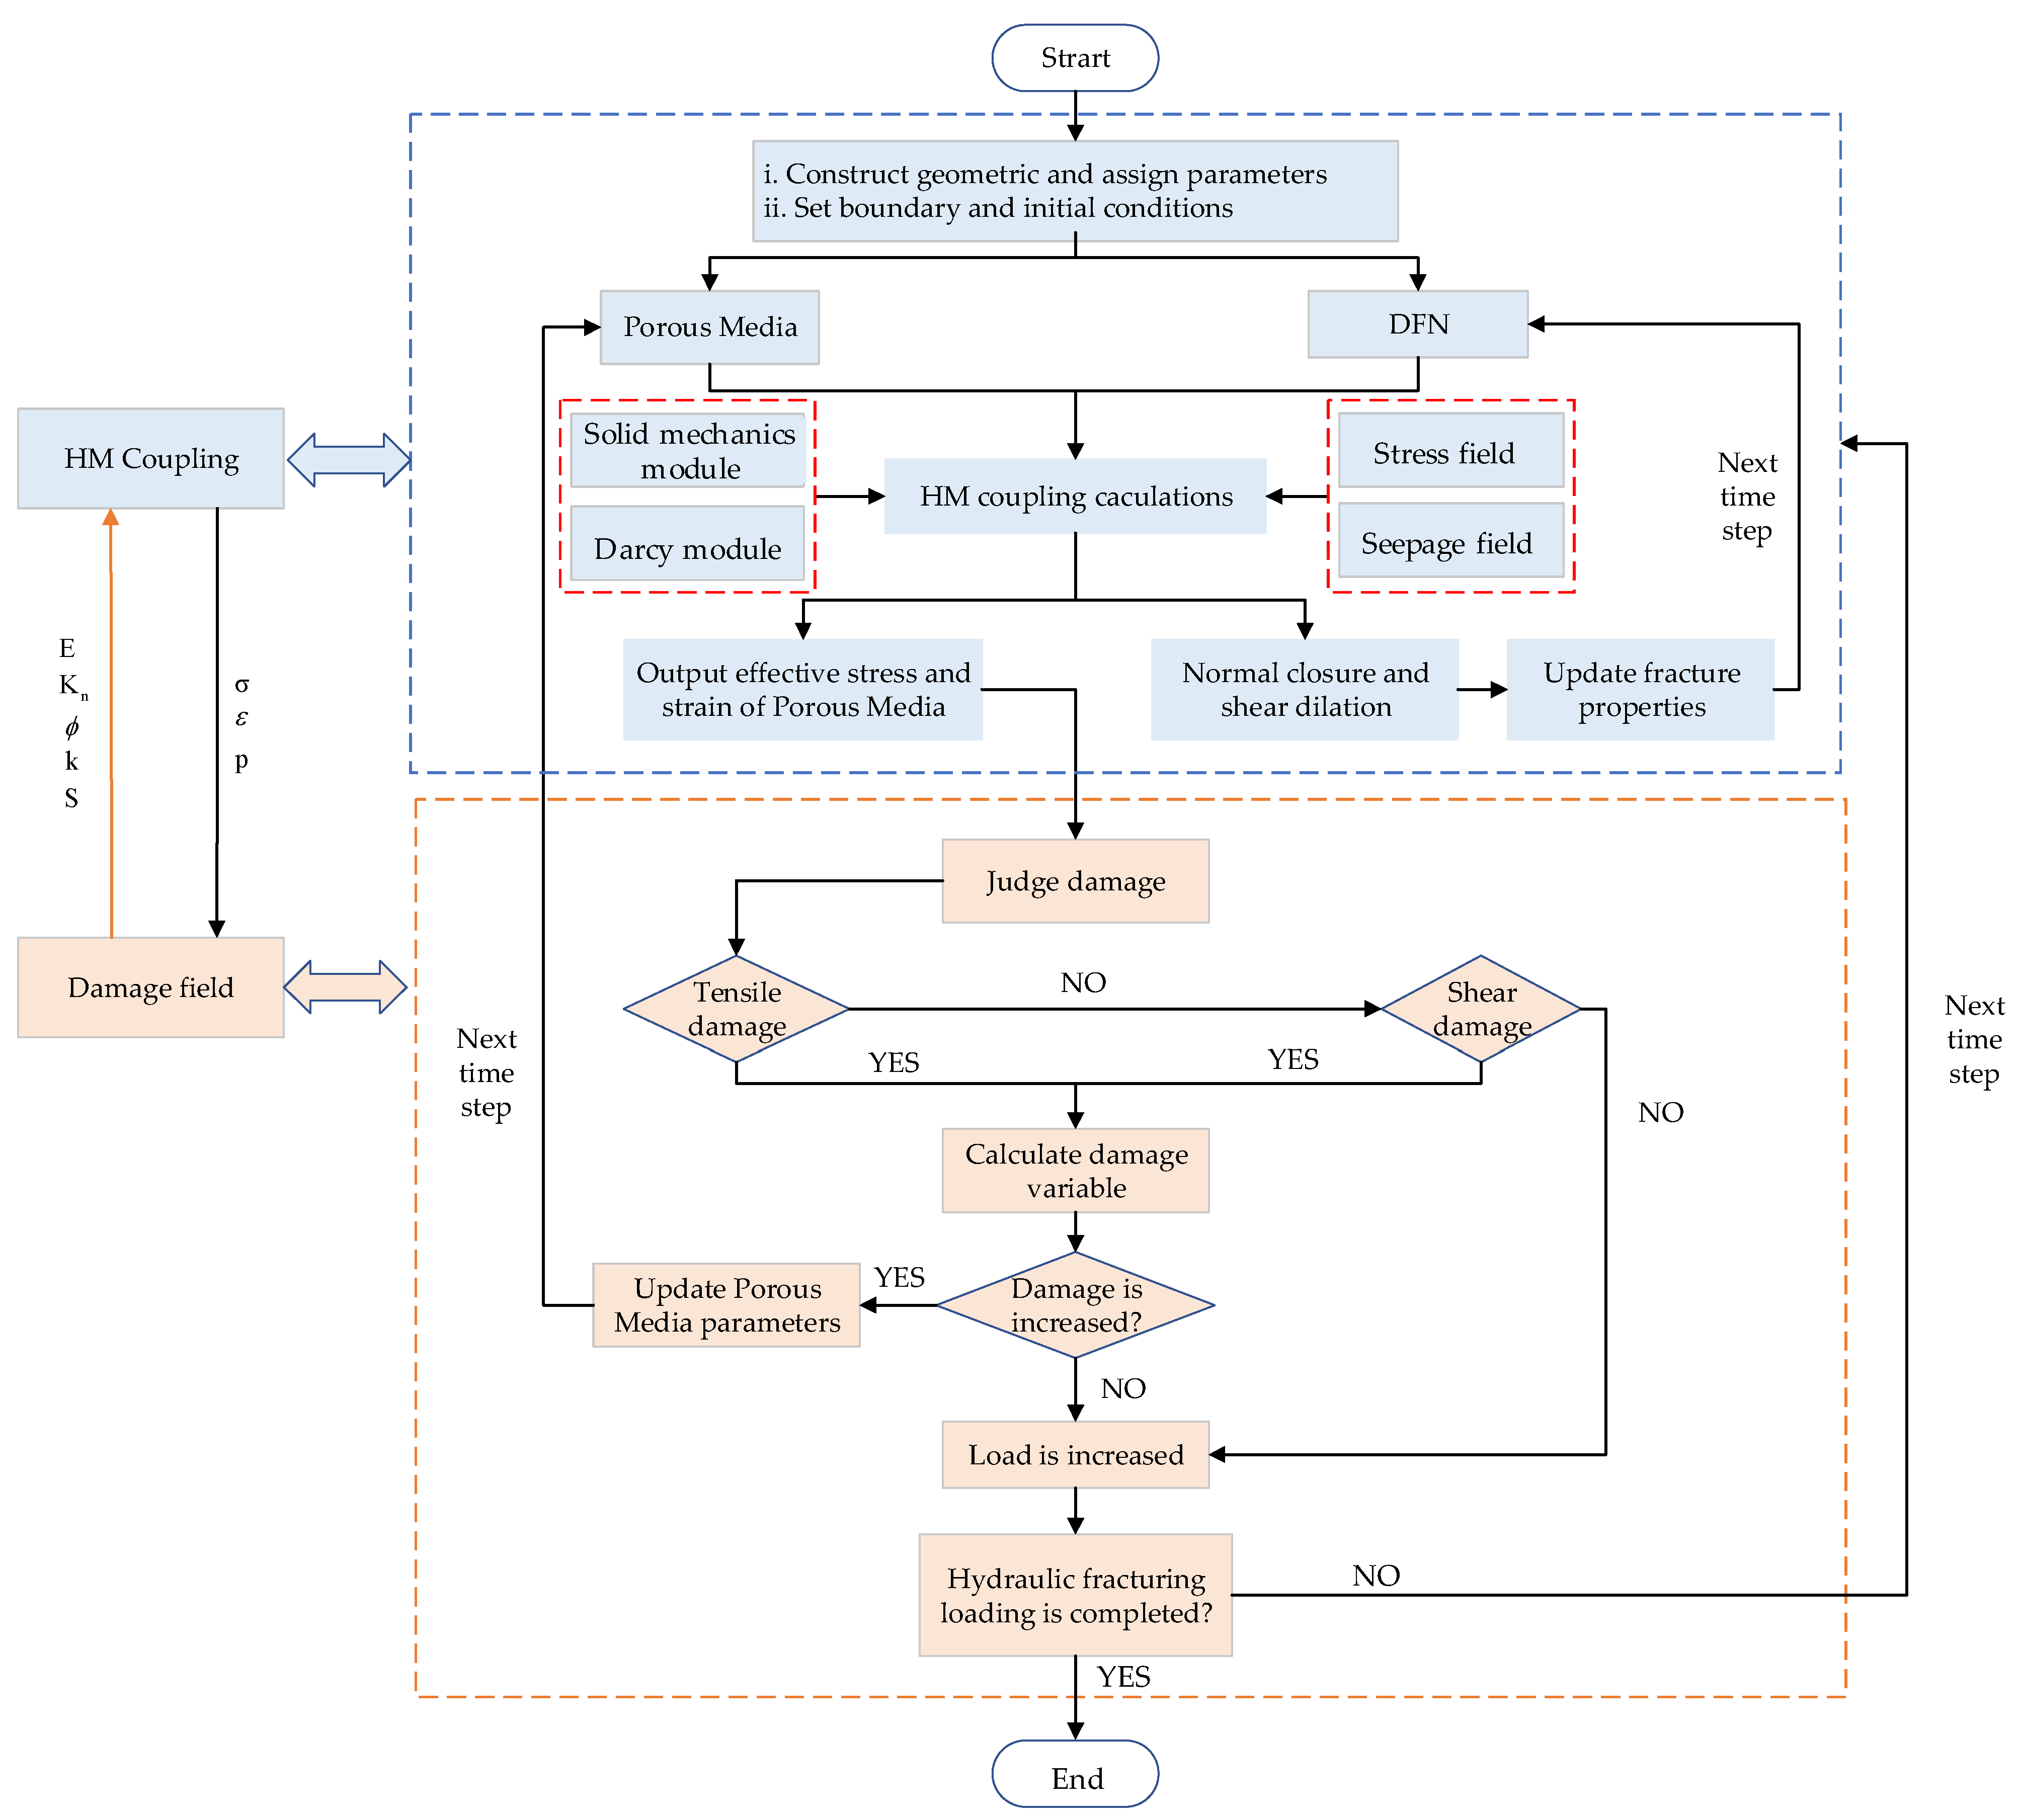
The hydraulic fracturing process in fractured porous media involves coupled multi-physical effects (Figure 2). The seepage field computation encompasses fluid flow through the porous matrix (PM) and the DFN, along with the mass transfer between them. Regarding the hydro-mechanical coupling effects in DFN, fractures are subjected to fluid pressure, total normal stress, and dilatancy forces. These interactions may induce fracture opening or closure, thereby influencing hydraulic pressure and flow velocity within the fractures. Regarding hydro-mechanical-damage coupling in the porous matrix, fluid influx from the injection well into the matrix induces alterations in the stress field. When the effective stress near the wellbore reaches or exceeds the tensile strength of the matrix, damage initiates, triggering hydraulic fractures initiation and propagation. Meanwhile, deformation of the porous matrix provides a mass source due to volumetric strain, thereby influencing pore pressure and fluid flow within the matrix. Within the finite element framework, this study simulates both direct and indirect coupling effects described above. The numerical solution strategy is illustrated in Figure 3, and the detailed solution steps are as follows:
(1)
The geometric model domain of the porous matrix is firstly established, into which a stochastically generated DFN, based on well-logging data, is embedded. Relevant physical parameters are then assigned. Initial and boundary conditions are defined accordingly. In addition, key parameters of the porous matrix and fractures—such as porosity, permeability, and storage coefficient—are defined as functions of local stress or pressure states.
(2)
Based on the computed stress and strain fields within the simulation domain, a damage criterion is applied to determine whether tensile or shear damage occurs at Gauss points of the porous matrix Simultaneously, the normal stiffness and aperture of the DFN fractures are updated, along with corresponding permeability and storage coefficient values.
(3)
For Gauss points of porous matrix that satisfy the tensile or shear damage criteria, the damage scalar D is calculated using Equations (7) and (8). If D increases, the corresponding parameters within the porous matrix—namely porosity, permeability, and storage coefficient—are updated according to Equations (31)–(33).
(4)
If none of the Gauss points satisfy the damage criteria, the loading is incrementally increased, and Steps (2) and (3) are repeated until the hydraulic fracturing process is complete. The simulation is then terminated.

2.5. Model Validation

2.5.1. Comparison with Hydraulic Fracturing Experiment

The initiation and propagation of hydraulic fractures represent critical physical processes in hydraulic fracturing. To validate the reliability of the proposed model in capturing these processes, a two-dimensional model was constructed using the HMD method, matching the dimensions of Jiao’s experimental setup [49]. As shown in Figure 4a,f, a central injection borehole (radius: 1 cm) was positioned within a 0.15 m × 0.15 m square domain. Two pre-existing fractures—1 mm in width and 2 cm in length—were embedded on both sides of the hole. In Model A, the fractures are aligned horizontally; in Model B, they are inclined at 30° to the vertical direction. The normal displacement on all boundaries is fixed to zero, and the fluid pressure is also set to zero. Fluid is continuously injected into the borehole at a constant rate of 0.005 m3/s. As shown in Figure 4b–e,g–j, the results from the HMD model are in good agreement with Jiao’s laboratory experiments, as well as with simulations based on the Numerical Manifold Method (NMM) [50] and the Phase Field Method (PFM) [51]. In all cases, hydraulic fractures initiate at the tips of the pre-existing fractures, propagate in the direction of the original fracture orientation without deviation, and ultimately reach the model boundaries. The final fracture lengths are nearly identical across all methods. This validation example demonstrates the capability of the proposed model to reliably simulate the initiation and propagation of hydraulic fractures during hydraulic fracturing processes.

2.5.2. Hydraulic Fracturing in Toughness-Dominated Regime

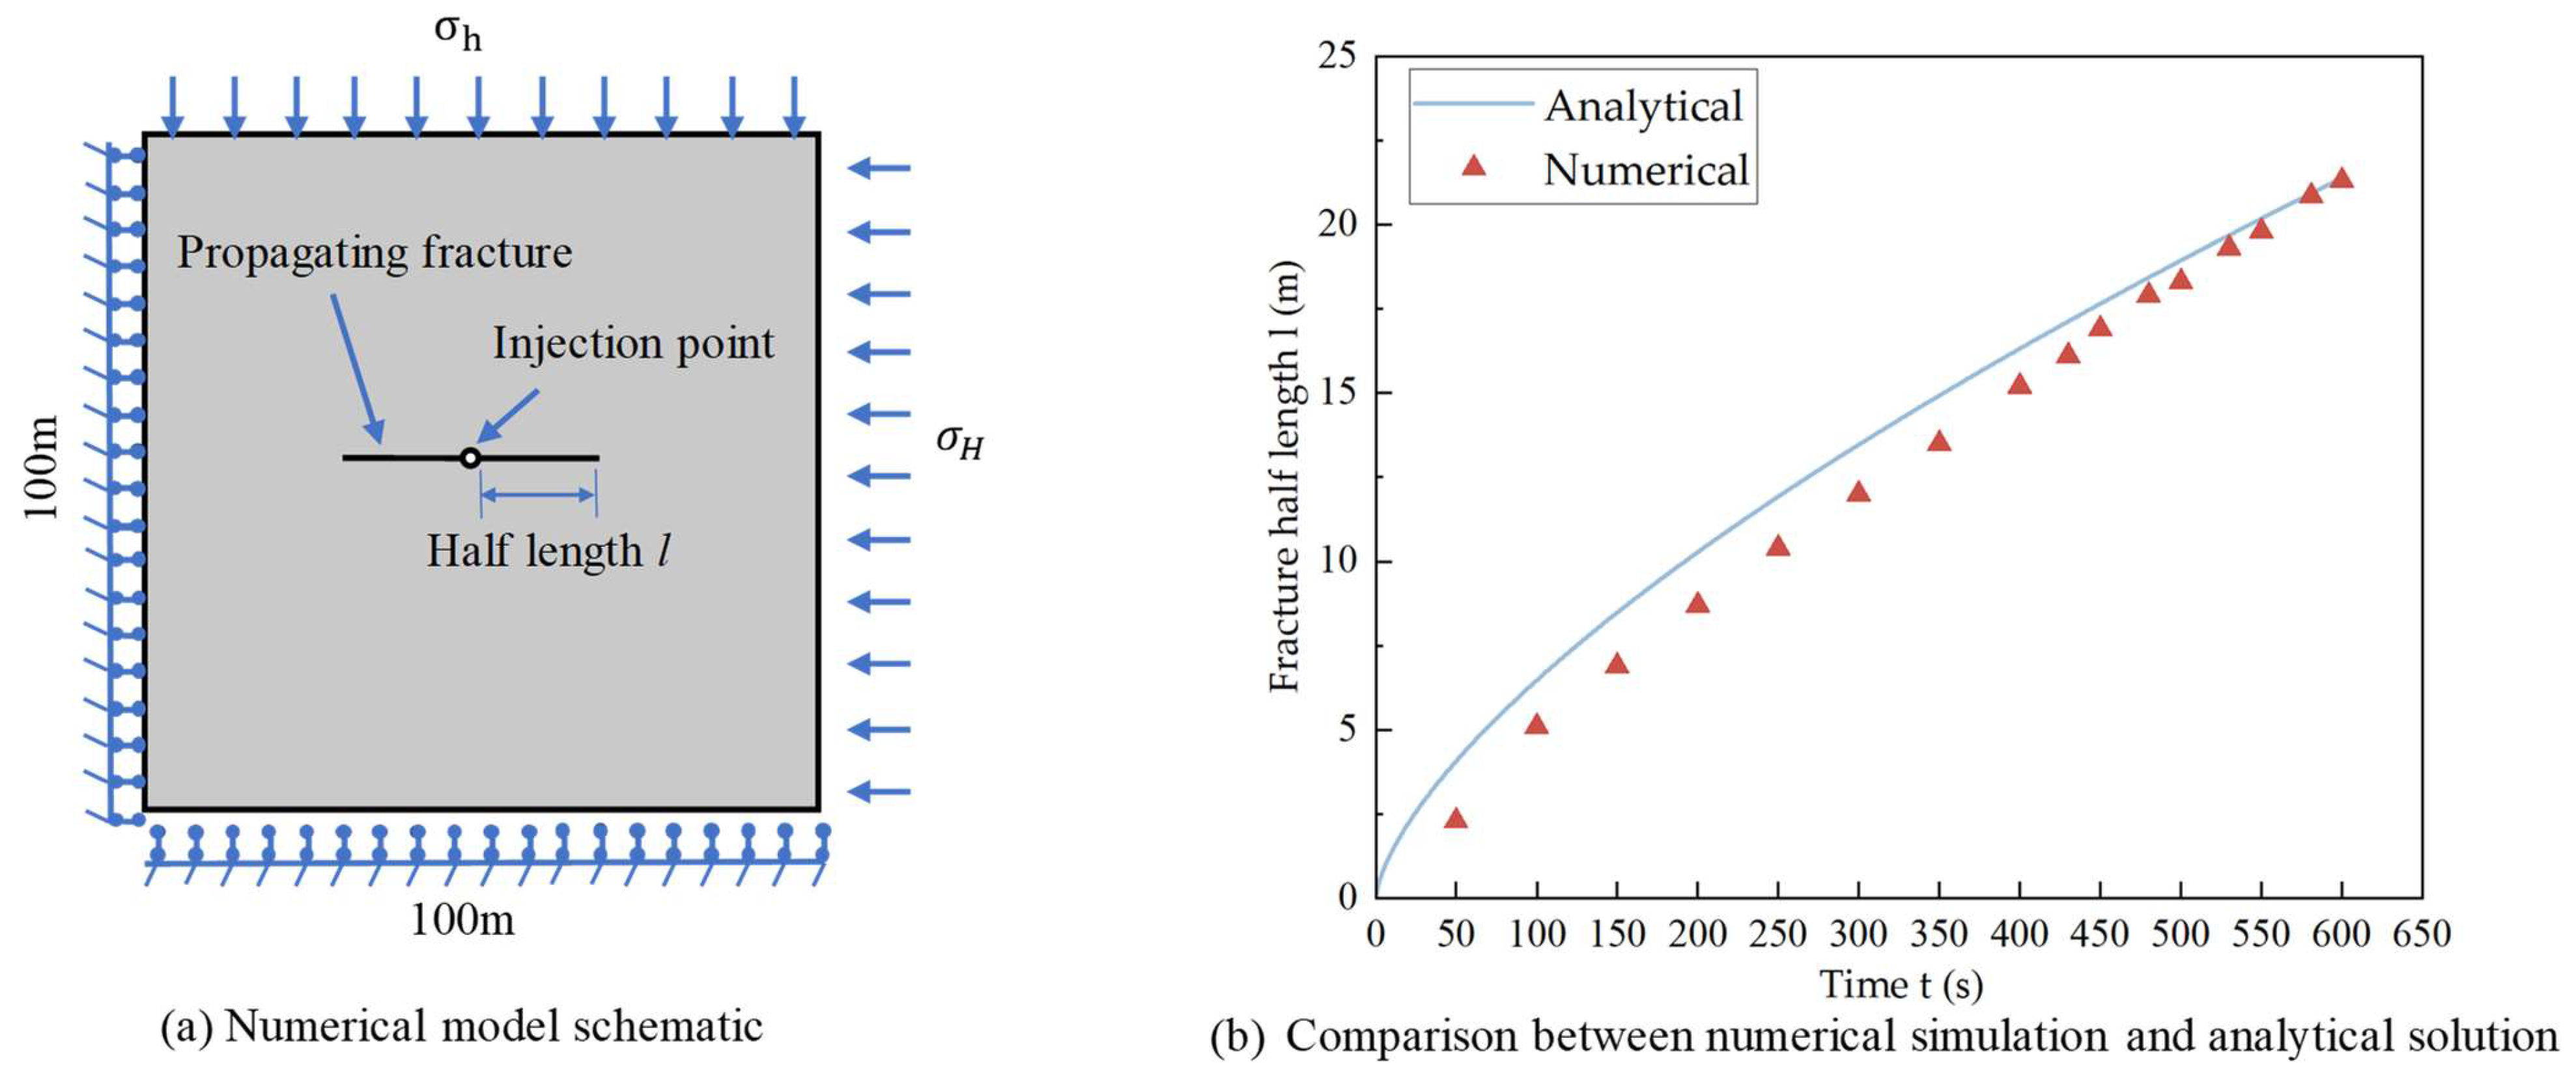
This study also validates the HMD model against the analytical solution for hydraulically-driven fracture propagation within the toughness-dominated regime. The half-length of the propagating fracture l versus injection time t in the analytical solution is given as
l = π 1 / 3 ( q E t K I C ) 2 / 3
where q is the injection rate, E = E / ( 1 ν 2 ) is the plane-strain modulus of elasticity, K I C = f t / 2 ( 1 υ 2 ) is the fracture toughness assuming an elasto-brittle failure. This study built a numerical model with the domain size L = 100 m (Figure 5a). Normal displacement is constrained on all external boundaries, while the maximum horizontal principal stress ( σ H = 90   M P a ) is applied to the right boundary and the minimum horizontal principal stress ( σ h = 46   M P a ) to the top boundary. The initial pore fluid pressure is p 0 = 31   M P a . Young’s modulus is 40 GPa, Poisson’s ratio is 0.25, and tensile strength of rock matrix is 10 MPa. After the model reaches the initial equilibrium state, the fracturing fluid is injected at a constant rate of q = 1 × 10 4   m 2 / s (the injection point is at the center of the domain). During the injection, a fracture initiates from the injection point and propagates along the direction of the maximum horizontal principal stress. This study extracted the half length of the fracture at different time stages and compared the simulation results to the analytical solution, for which a good match is obtained (Figure 5b).

2.5.3. HF-NF Interaction

During hydraulic fracturing in shale reservoirs, it is common for hydraulic fractures (HFs) to intersect with natural fractures (NFs), leading to the activation of NFs and the formation of preferential flow pathways, which may induce fracture-driven interactions between wells. When an HF approaches a weak structural interface such as an NF, its propagation behavior varies under different geological conditions—typically manifesting as either crossing or opening the NF [52]. In studies of HF propagation in shale formations, accurately capturing the interaction behavior between HF and NF is essential for model validation. Based on the Finite-Discrete Element Method (FDEM) and geological parameters from southern Sichuan, Wang et al. [25] developed a numerical model to simulate the intersection of HFs and NFs. This study adopted the same physical model and parameters, but established the HF–NF intersection model using the HMD framework. The model domain measures 10 m × 20 m, with a circular injection borehole (radius: 5 m) placed at the center. A 5 m-long natural fracture is positioned 5 m above the borehole. Under a horizontal stress difference of 2 MPa, an injection rate of 1 m3/min, and a fluid viscosity of 3 mPa·s, this study simulated the HF–NF interaction behavior under varying fracture approach angles while keeping all other model parameters constant. The results show that the HF initiates from the borehole and propagates along the direction of maximum horizontal stress (Figure 6). Upon intersecting with the NF, two distinct interaction modes are observed: when the approach angle is 30° or 45°, the HF opens the NF at the approach of 30 ° or 45 ° while the HF crosses the NF at the approach of 60 ° . These results demonstrate excellent agreement with the results obtained by Wang et al., further validating the accuracy of the present model.
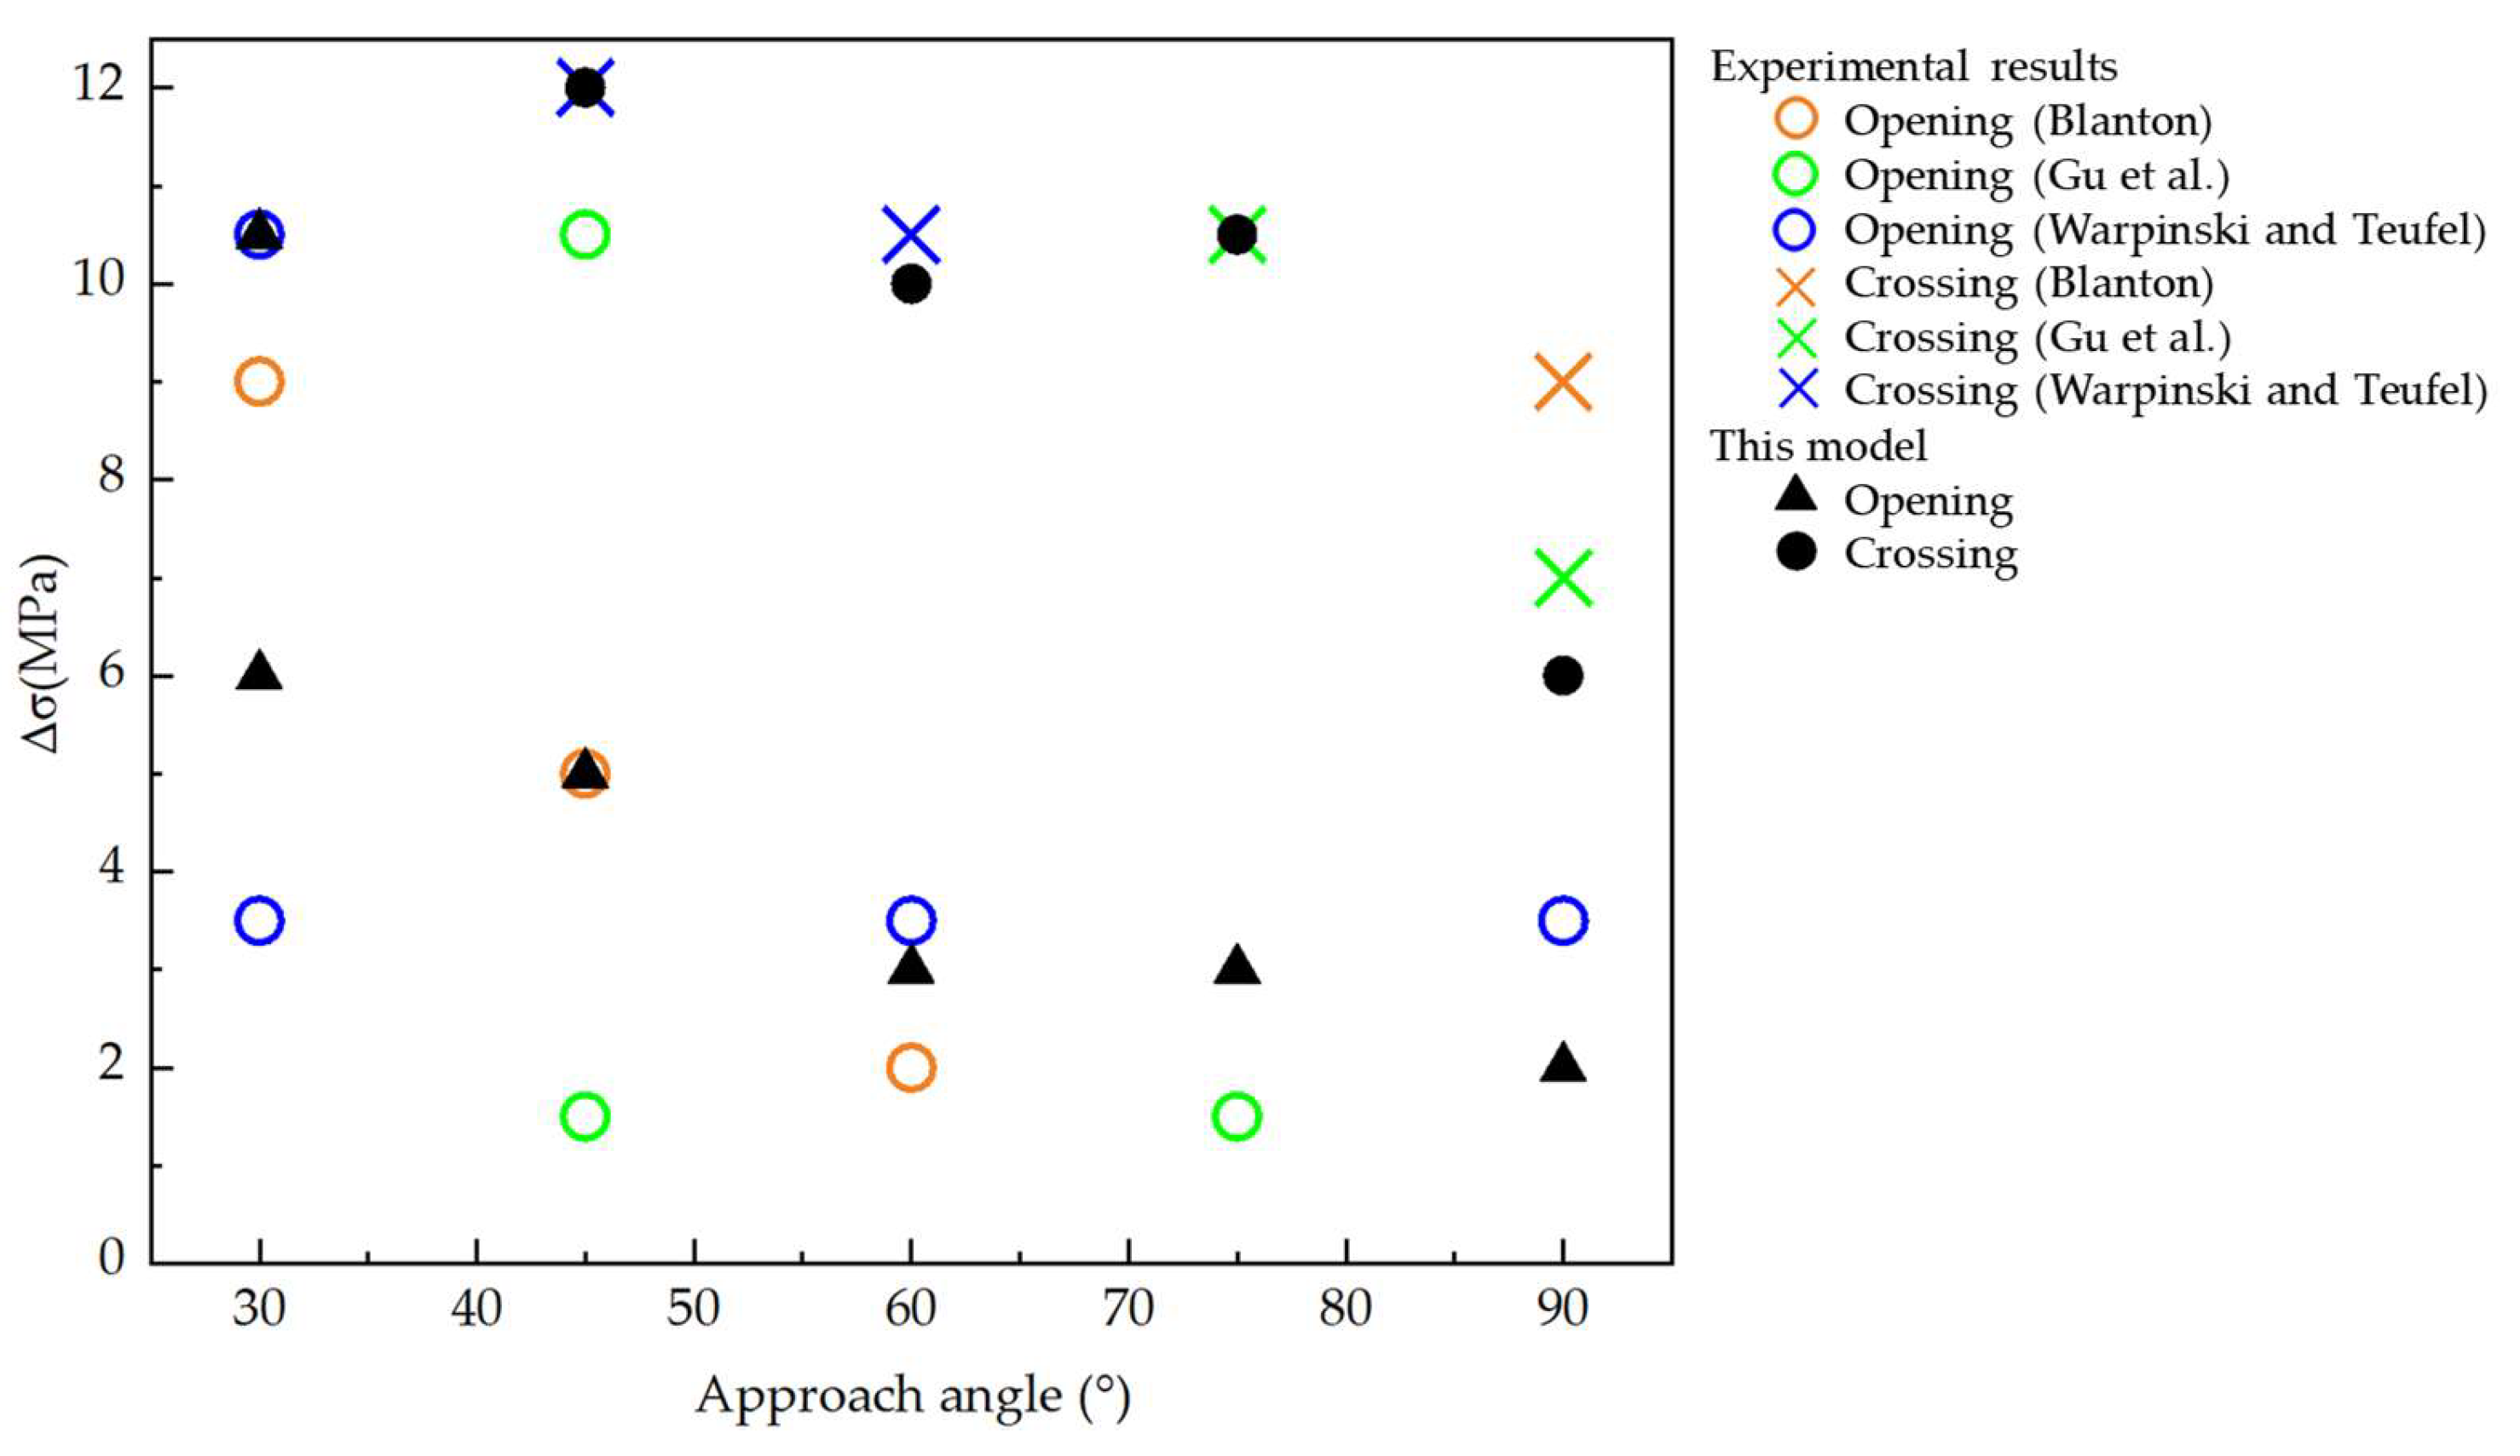
To further validate the accuracy of the proposed model in simulating the interaction between HF and NF, a series of additional numerical experiments were conducted and compared with published experimental results [52,53,54]. A comprehensive comparison between the simulation results and experimental observations is presented in Figure 7. The simulation results indicate that when the approach angle is relatively small, HFs tend to open the NFs rather than cross them. A larger horizontal principal stress difference is required for the HF to penetrate through the NF.

2.5.4. Frictional Contact

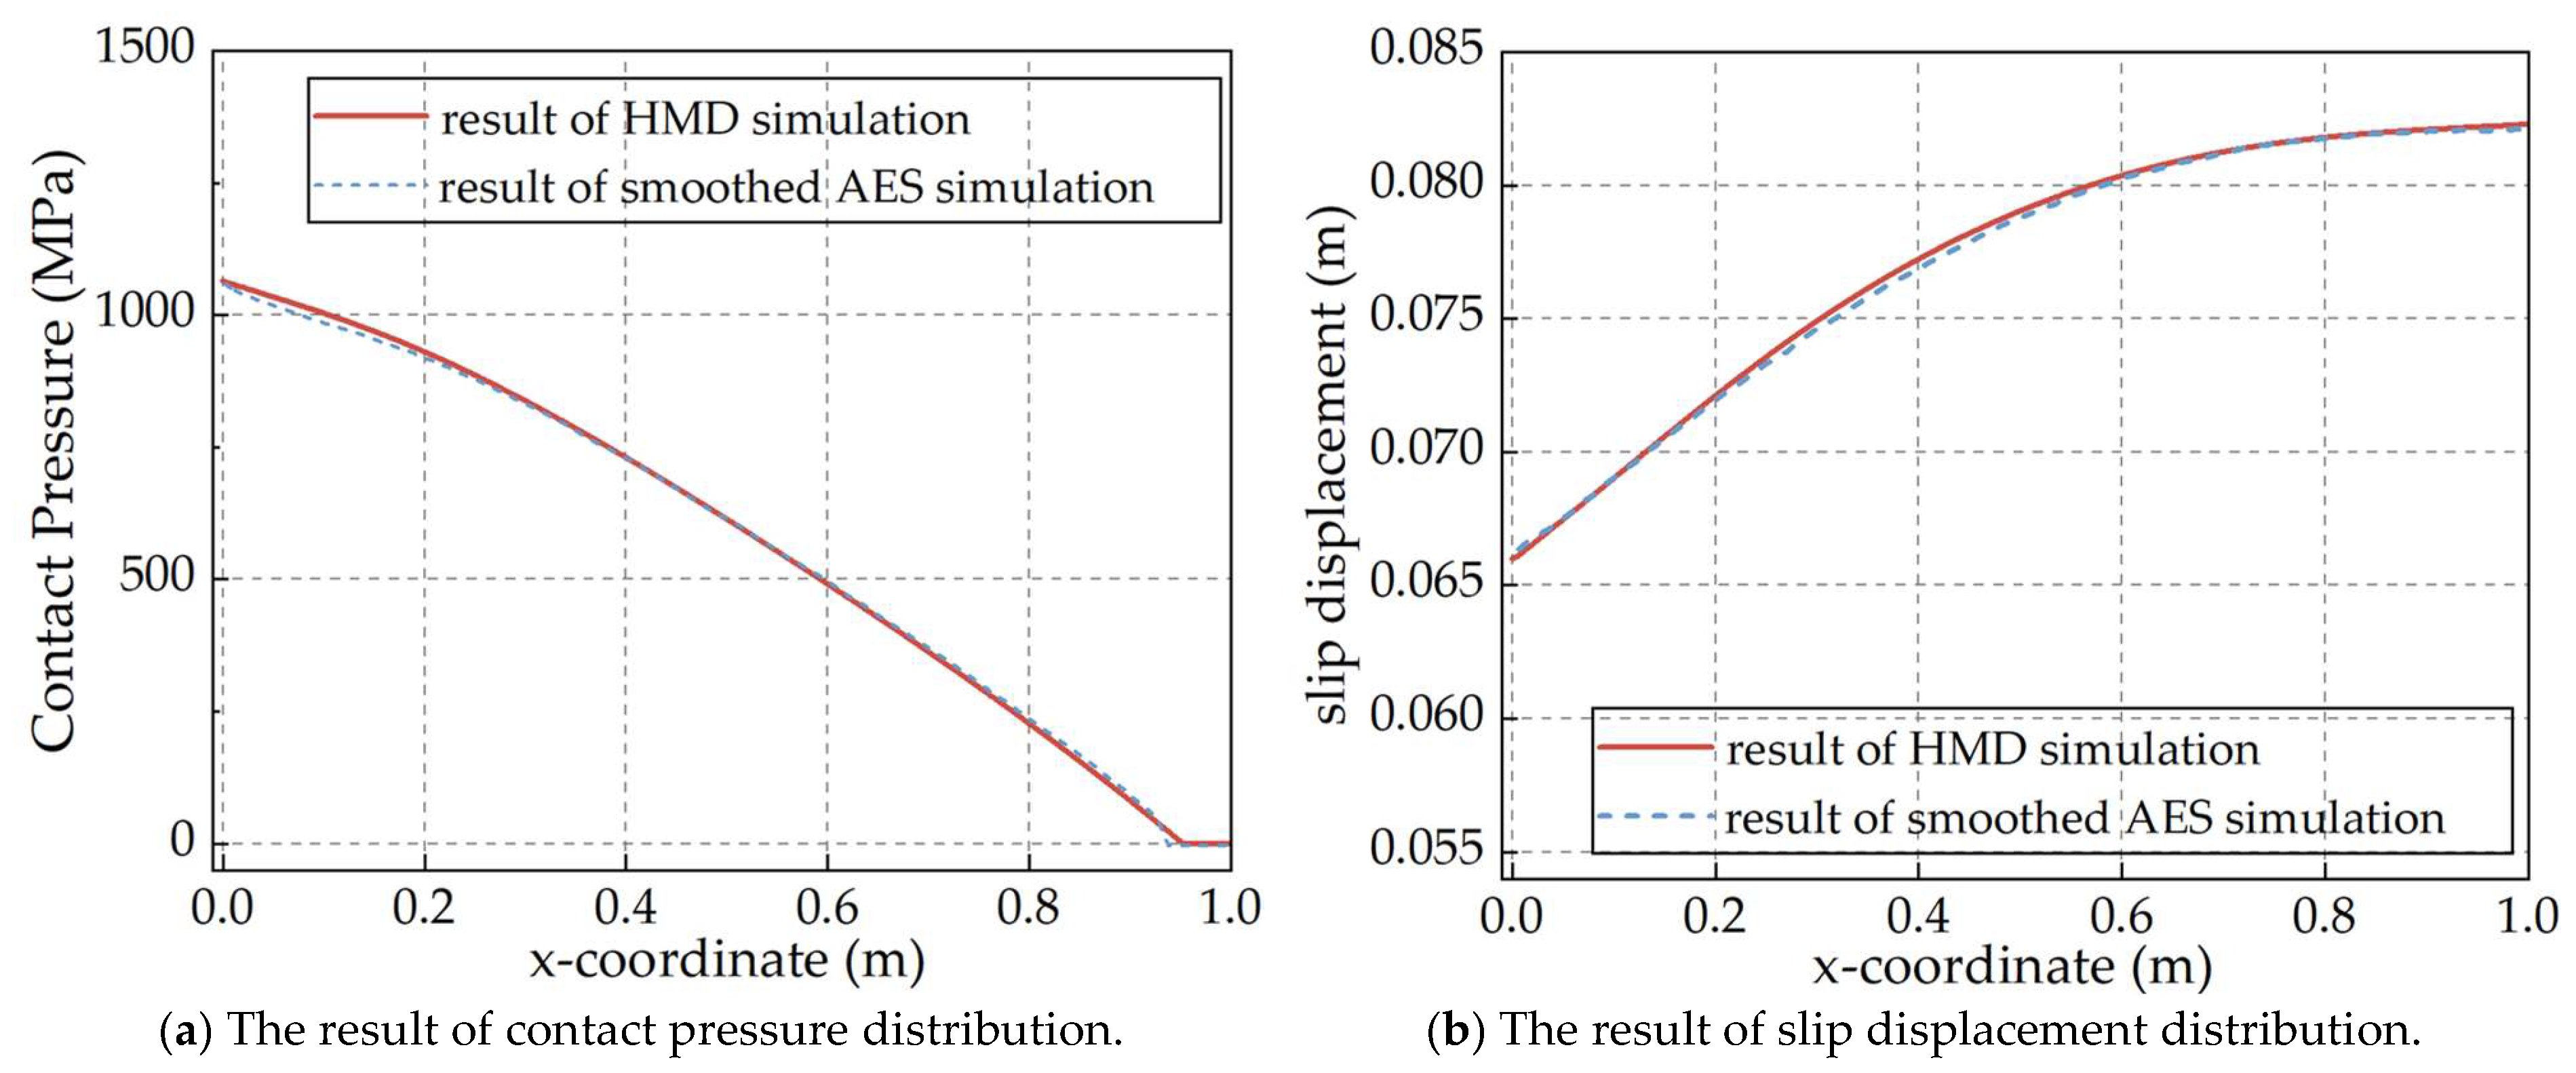
To further validate the reliability and accuracy of the model in simulating frictional slip behavior of fractures, this study conducted a representative case study of horizontal frictional fractures under compression-shear loading conditions. Liu et al. [55] has investigated this problem using the smoothed Assumed Enhanced Strain (smoothed AES) method. As illustrated in Figure 8, this study adopts identical modeling conditions: a 1 m × 1 m square elastic domain containing a single natural fracture. In the model, Young’s modulus is 10 GPa, Poisson’s ratio is 0.3, the friction coefficient of natural fracture surface is 0.1, and the normal and tangential penalty factors is set to 5 × 10 12 MPa/m.
This study conducted numerical experiments employing two different displacement loading cases. In case 1, δ x = 0.05 m and δ y = 0.09x − 0.1 m; in case 2, δ x = 0.05 m and δ y = 0.1x − 0.1 m. Figure 9 and Figure 10 present the resulting contact pressure and frictional slip distance distributions for both cases, respectively. The results demonstrate excellent agreement between the predictions of the HMD model and those obtained using the smoothed AES method. Additionally, due to the smaller applied normal stress on the fracture surface in case 2, separation of the fracture surfaces is observed at the right end, evidenced by zero contact pressure in this region. These results confirm the model’s capability to accurately simulate frictional slip behavior along fractures.

3. Case Study

The numerical case study presented in this work is motivated by field observations from southern Sichuan Province, China, where FDIs have been frequently observed during multi-well zipper fracturing operations in shale reservoirs. This area exhibits distinctive geological characteristics, including a densely developed network of natural fractures and a high in-situ stress regime with a significant horizontal stress difference of approximately 8–10 MPa [56]. These specific geological conditions, especially the extensively developed natural fractures, have directly guided the modeling methodology adopted in this study. This emphasis on natural fracture mechanical behavior and the implementation of a DFN methodology to represent their stochastic distribution and multi-scale characteristics enhances the model’s capability to simulate realistic reservoir conditions.
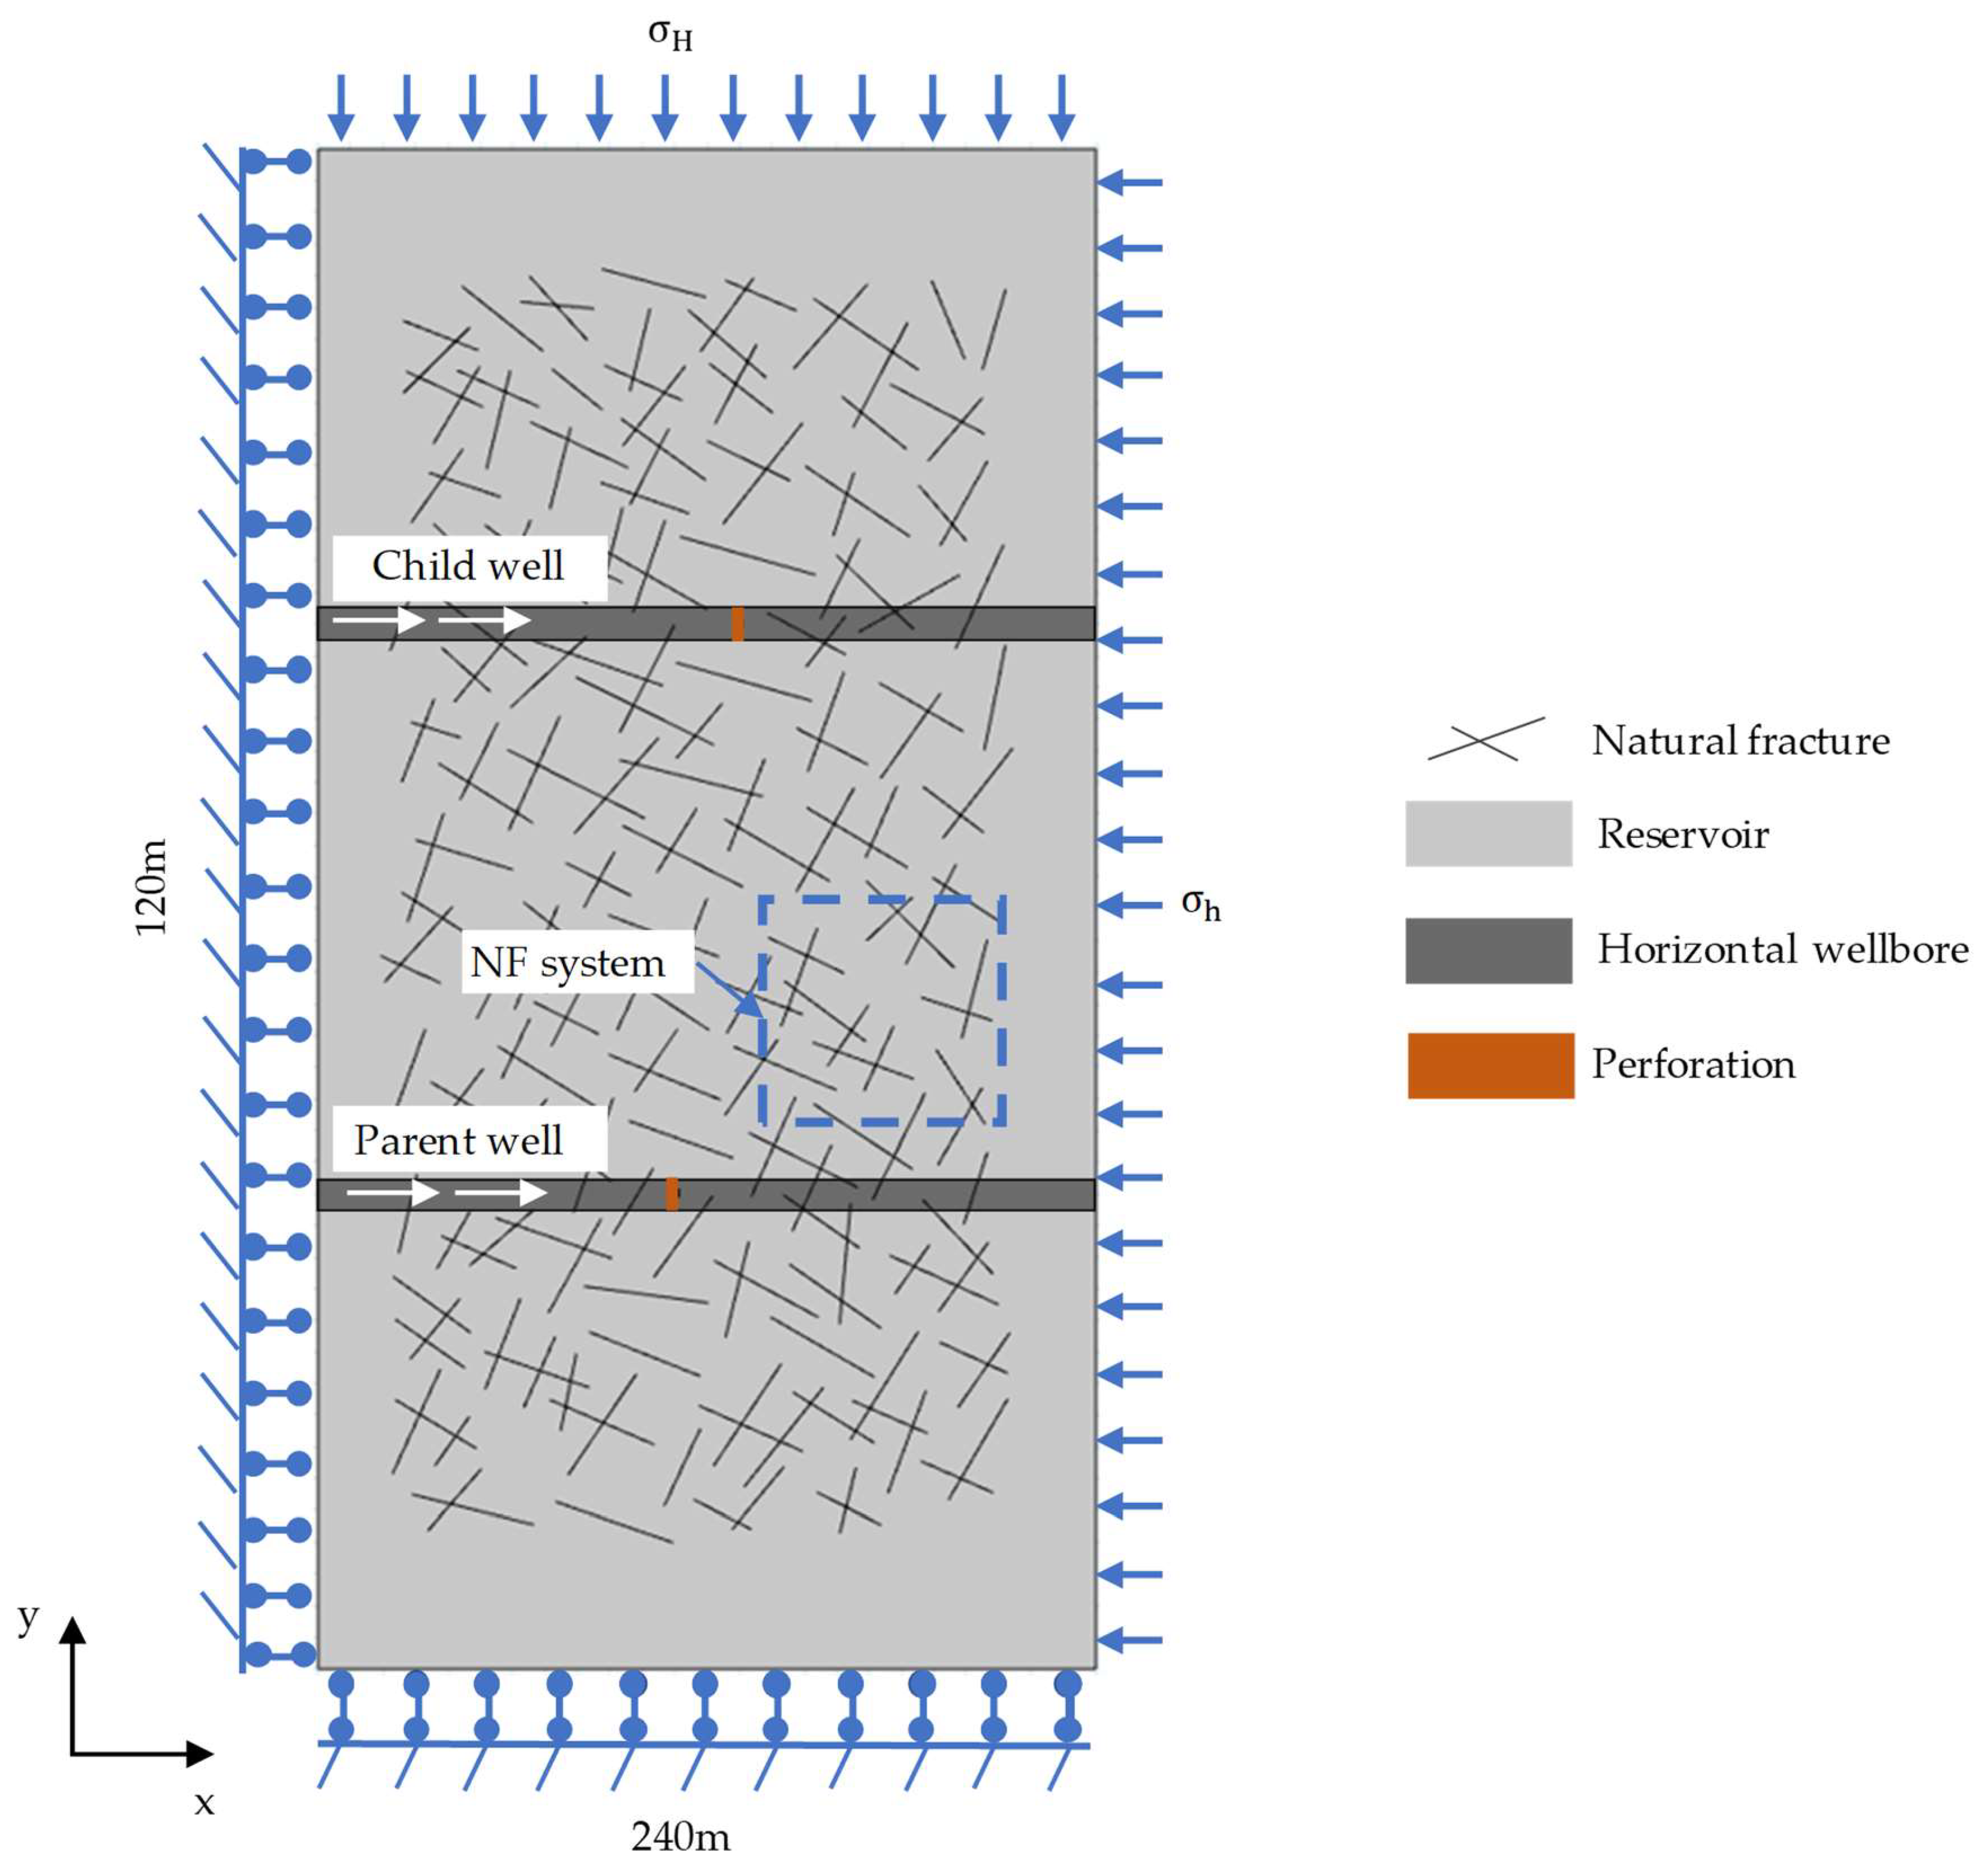
Field experience has shown that well spacing, injection rate, horizontal principal stress difference, and the characteristics of NF development are key factors influencing FDIs between horizontal wells. Conducting sensitivity and mechanism analyses of these parameters on fracture propagation and FDIs during zipper fracturing operations is critical for informing fracturing design and optimizing real-time control strategies. To this end, a zipper fracturing model involving dual horizontal wells was constructed based on the HMD model for fractured porous media. As shown in Figure 11, the computational domain measures 240 m × 120 m. The distance between the child and parent wells is 90 m, and each well contains a single perforation cluster. The horizontal spacing between the perforation clusters of the two wells is 10 m. The NF system includes 300 fractures distributed within a 200 m × 100 m rectangular region centered in the model domain to mitigate boundary effects. A homogeneous Poisson process is used to generate a stochastic sampling model. Fracture center coordinates are determined via a spatial point process, while the spacing, length, and orientation of NFs follow normal distributions. Specifically, fracture lengths are normally distributed with a mean of 15 m and a standard deviation of 5 m; fracture spacing follows a normal distribution with a mean of 5 m and a standard deviation of 2 m. Half of the NFs are oriented with angles normally distributed around 60°, with a standard deviation of 10°, while the other half follow a normal distribution centered at 150°, also with a standard deviation of 10°. Triangular elements are used for mesh generation, with a maximum element size of 1 m. Fractures are embedded as internal boundaries that guide mesh refinement (Figure 12). Following mesh sensitivity analysis, the final mesh contains 81,190 triangular elements, with an average element quality of 0.9206.
The boundary conditions for the model are defined as follows: the displacement in the x-direction is fixed to zero along the bottom boundary, and the displacement in the y-direction is fixed to zero along the left boundary. Displacements on the top and bottom boundaries are otherwise unconstrained. The maximum horizontal principal stress is applied along the right boundary, while the minimum horizontal principal stress is applied along the top boundary. In the baseline model, the minimum horizontal principal stress is set to 46 MPa, with a horizontal principal stress difference of 8 MPa. The initial pore pressure in the reservoir is 31 MPa. The pore pressure at all boundaries is set to 31 MPa. The simulated zipper fracturing operation consists of three stages: (1) Parent well fracturing stage (0.5 h): Fracturing fluid is injected into the parent well perforation at a constant rate of 0.5 m2/s, while the child well remains shut in. (2) Both the parent and child wells are shut in. (3) Child well fracturing stage (0.5 h): The parent well remains shut in, while the child well perforation receives injection at a constant rate of 0.5 m2/s. The parameter settings for the baseline model are summarized in Table 1. Reservoir input parameters are derived from field measurements, while the geometric characteristics of the discrete fracture network are based primarily on well log interpretation. The natural fracture network is generated using probability distribution functions to represent the spatial heterogeneity of fractures in the shale reservoir.

3.1. Horizontal Principal Stress Difference

During hydraulic fracturing in horizontal wells, the horizontal principal stress ( σ ) difference plays a critical role in governing the interaction mechanisms between hydraulic fractures (HFs) and natural fractures (NFs), as well as determining the fracture propagation direction. Consequently, it significantly influences the geometry of the fracture network, the risk of interwell FDIs, and the effective SRV. To investigate these effects, fracture network morphologies and interwell FDIs were simulated under five different horizontal stress contrast conditions—0, 4, 8, 12, and 16 MPa—based on the baseline model parameters. Figure 13 and Figure 14 illustrate the resulting fracture network geometries and pore pressure distributions at three key stages: (1) after parent well fracturing (t = 0.5 h), (2) after the shut-in period (t = 1 h), and (3) after child well fracturing (t = 1.5 h). Herein, in Figure 13, the thicker red line represent the HFs, while the thinner red line denotes the actived NFs.
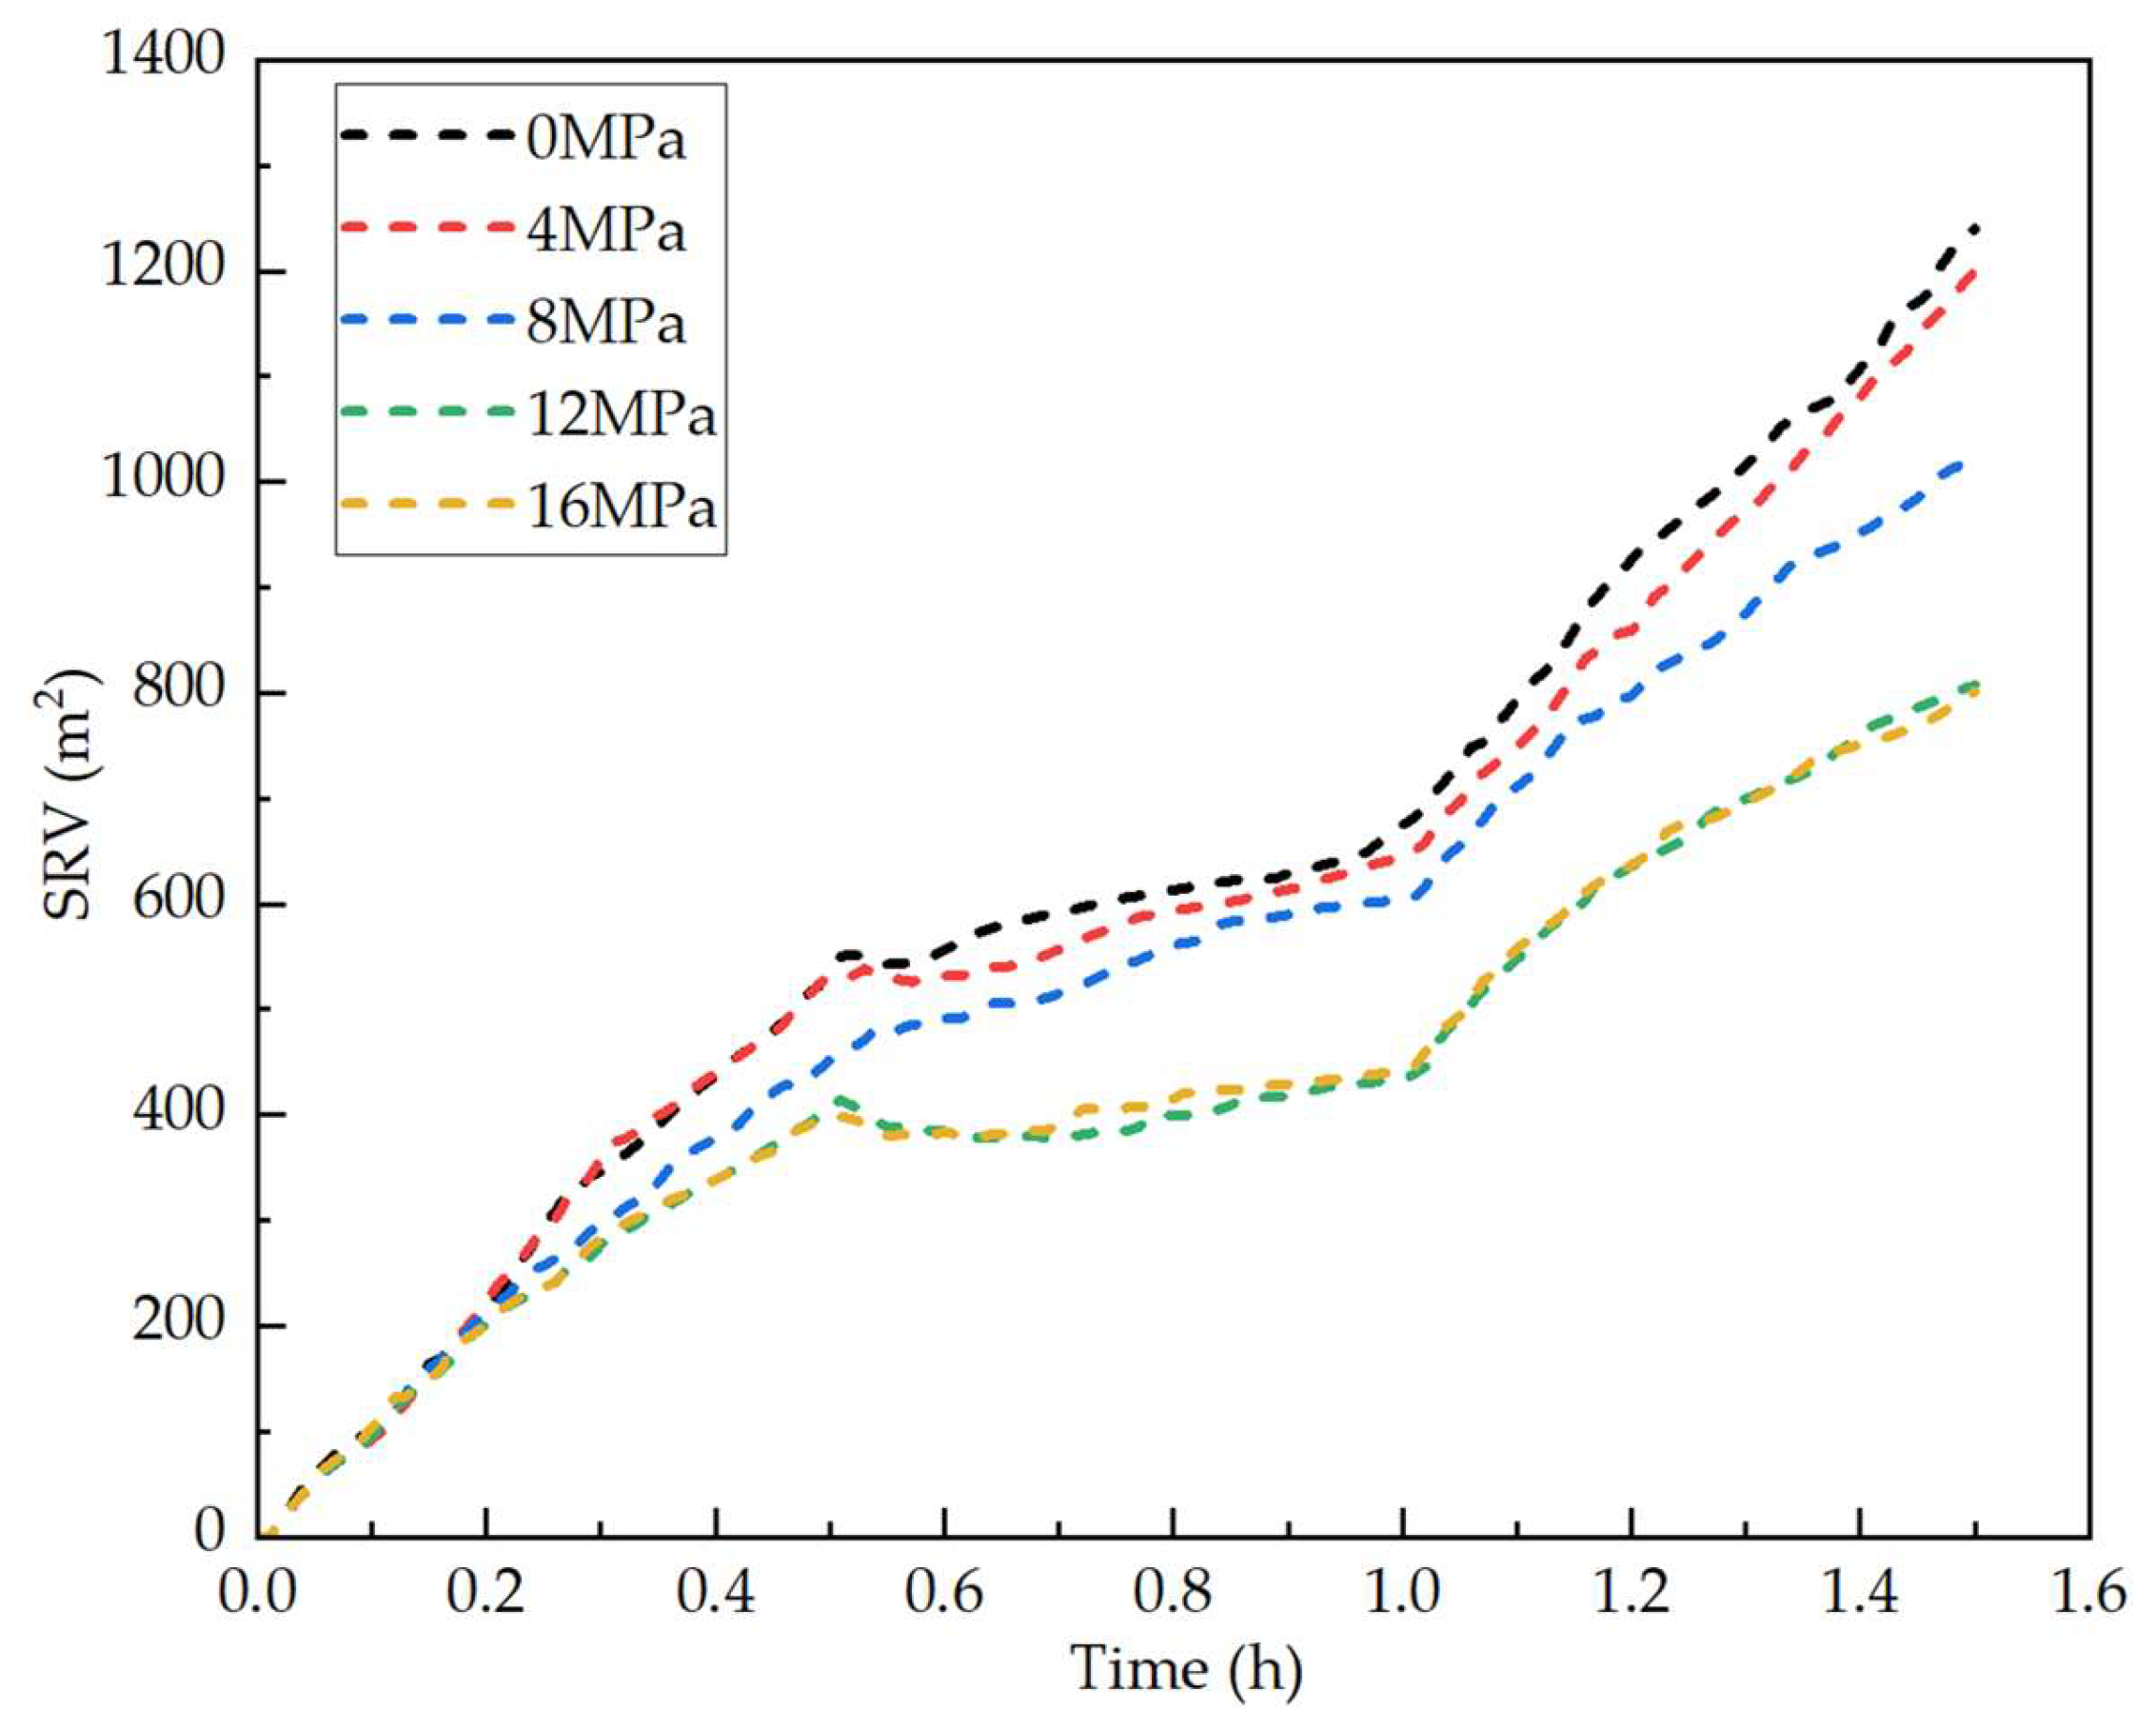
When σ is 0 MPa, HFs tend to open the NFs upon intersection and continue to propagate from the NF’s tips with only minimal deviation in direction. In this case, HFs tend to follow the NF paths. When σ increases to 4 MPa, the influence of the stress field on HF propagation becomes evident. Primary fractures begin to preferentially propagate along the direction of the maximum horizontal principal stress, although NFs still largely dominate the fracture path. Upon intersection, HFs tend to open the NFs and extend from their tips; however, under the mild constraint of the stress field, the propagation trajectory deflects at a certain angle toward the direction of maximum horizontal stress. HF can cross NF at relatively small approach angles (highlighted by blue circle in Figure 13a), but fail to cross NFs at larger approach angles (highlighted by green circle in Figure 13a). This results in one end of the HF along the main fracture path to be blocked, while the other end overextends, thereby increasing the asymmetry of the HF propagation. Overall, under conditions of low horizontal principal stress difference, NF dominate HF propagation paths. This results in pronounced lateral branching, extensive fracture bifurcation, and more thorough activation of the natural fracture network, which enhances the SRV. Moreover, due to the insufficient extension of the primary HF, no interwell connection is established between the child and parent wells (Figure 15), and the physical distance between activated fracture clusters remains large, leading to a weaker stress shadow effect. Thus, the reservoir stimulation is more effective under low horizontal stress conditions (Figure 16). Since this study employs a two-dimensional model, the unit-thickness effective stimulated volume is used to characterize the volumetric stimulation effect. In addition, SRV per unit thickness requires scaling by net pay thickness for field application under the 2D model constraint.
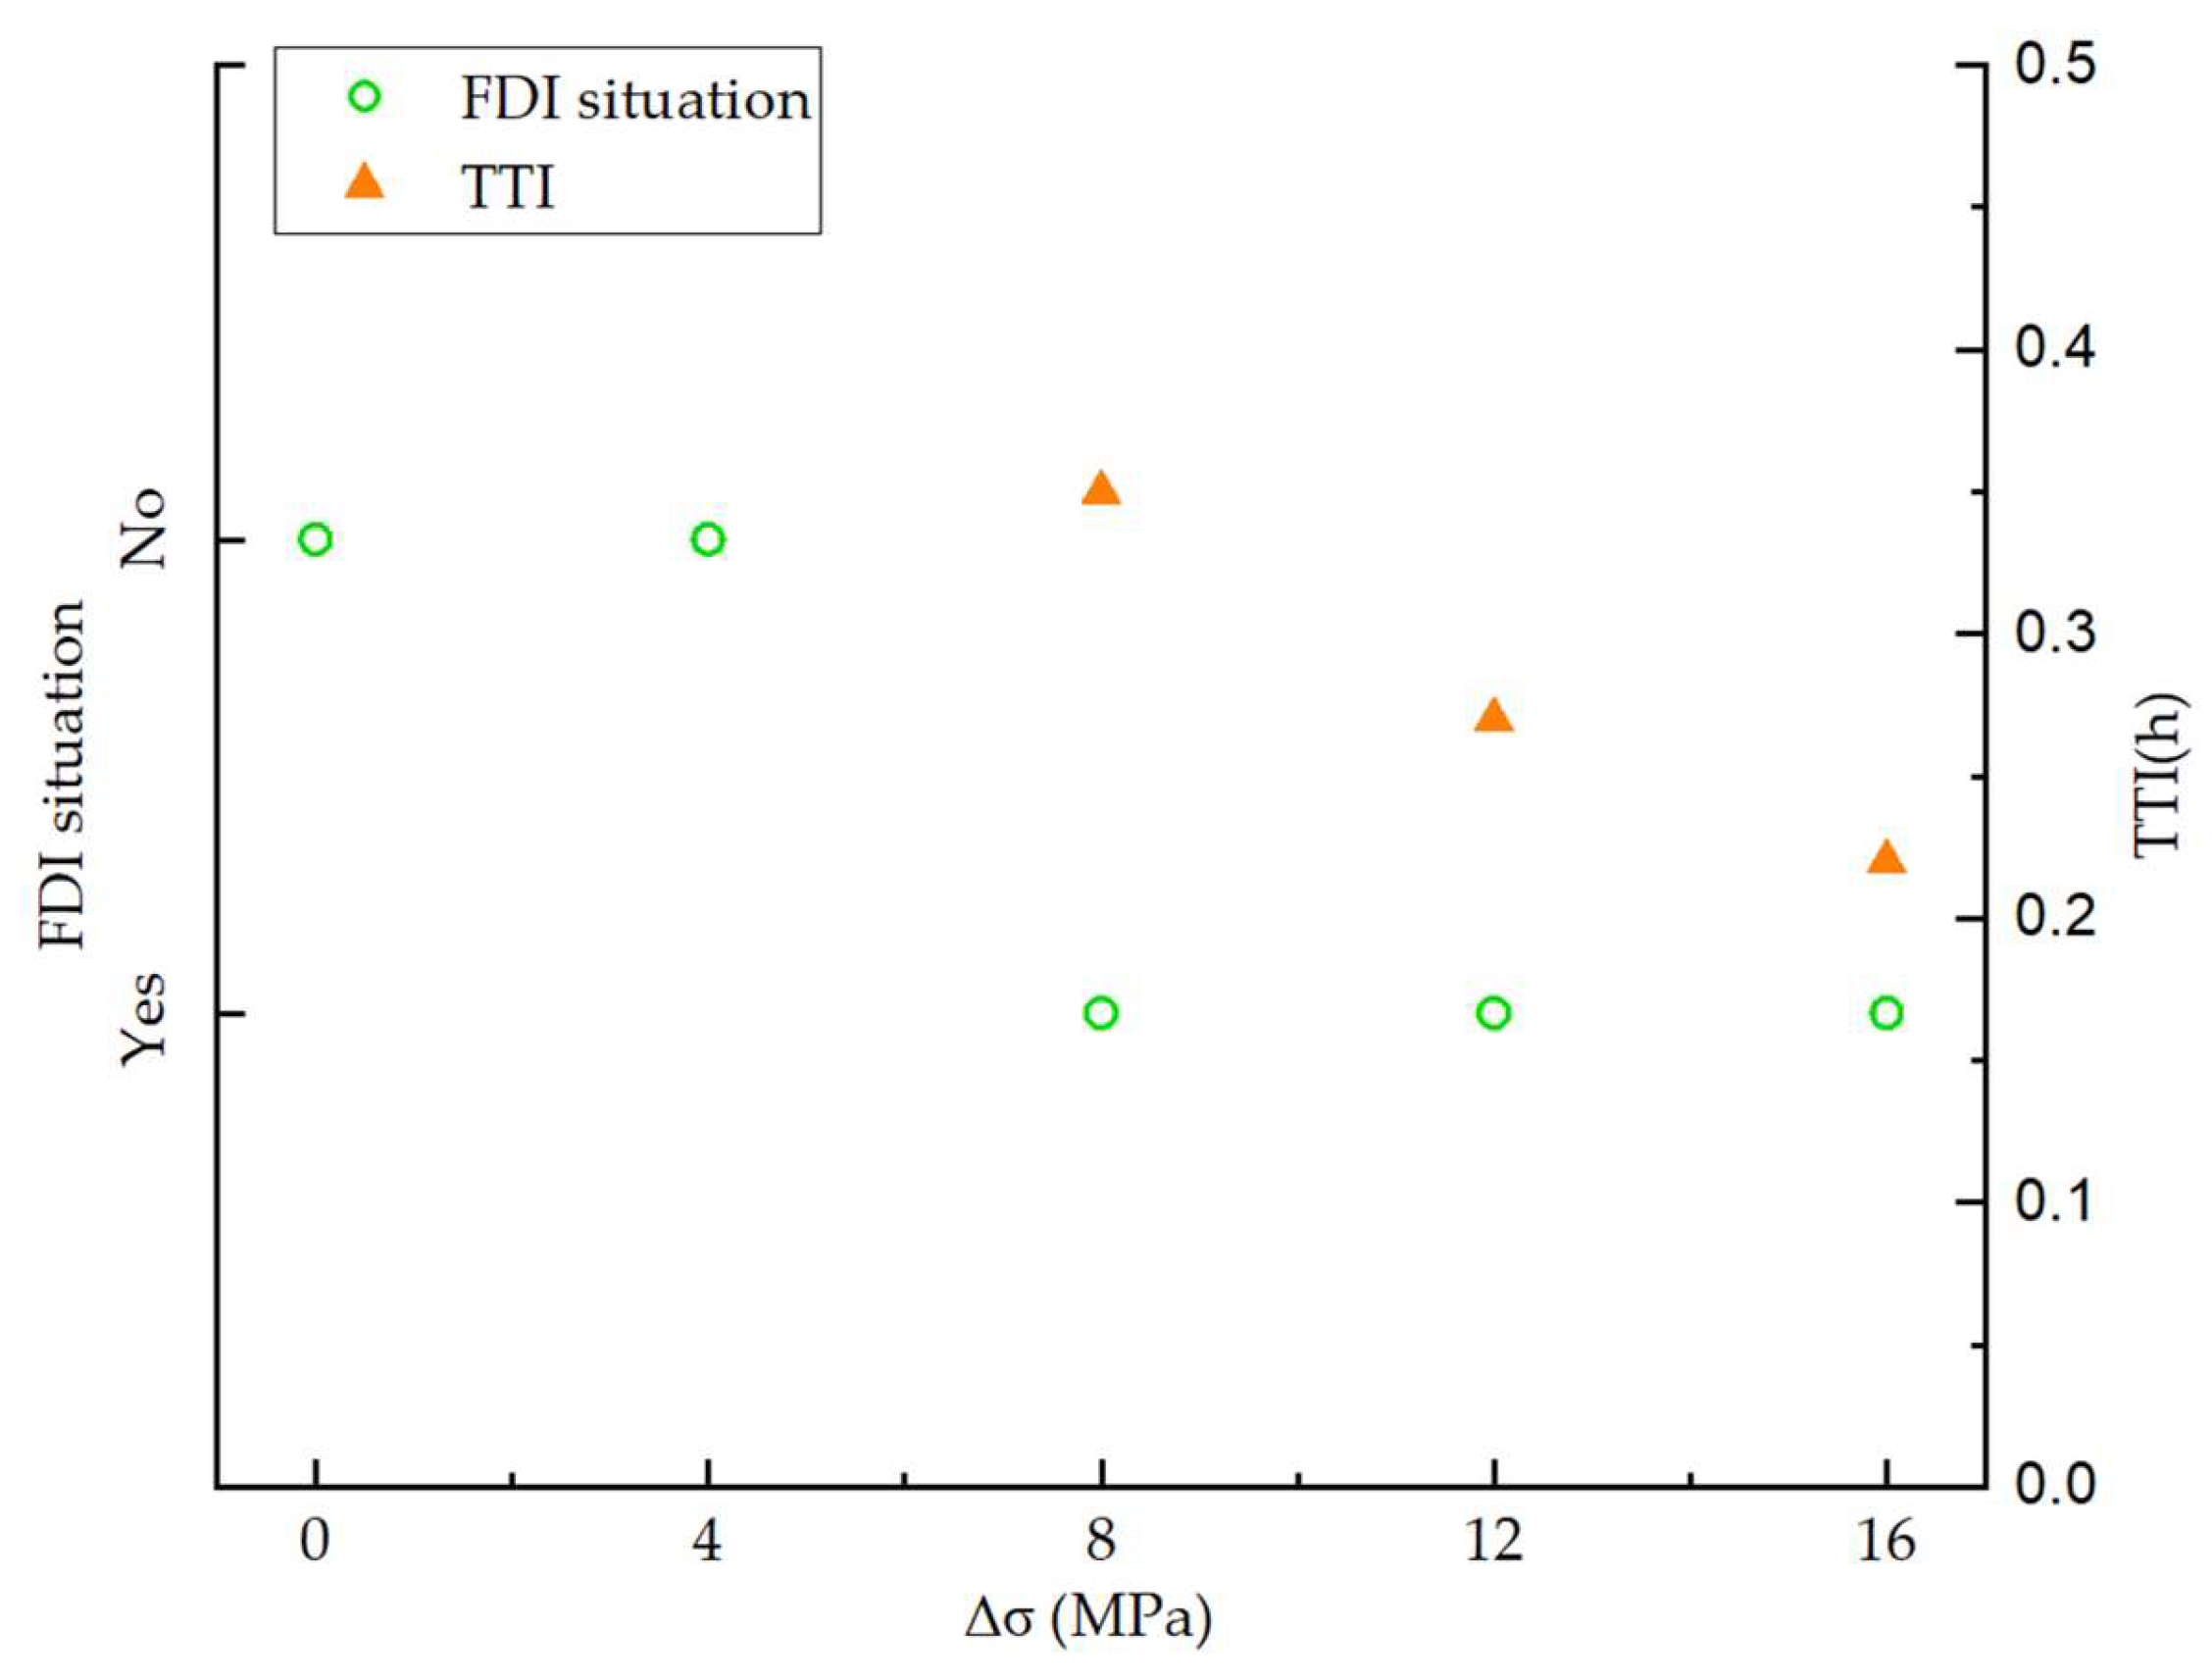
When ∆σ reaches 8 MPa, the HFs tend to cross the NFs with large approach angles, while they tend to open the NFs at smaller approach angles. In the latter case, the HF continues to propagate from the NF’s tips but deflects at a greater angle toward the direction of the maximum horizontal principal stress. This results in a mixed fracture network that combines dominant HF propagation with asymmetric branching. When ∆σ is 12 MPa or 16 MPa, HFs are capable of crossing most of NFs and predominantly propagate along the direction of the maximum horizontal principal stress, forming a single dominant fracture. These results indicate that as the horizontal stress contrast increases, its influence on HF propagation becomes more pronounced, leading to reduced lateral branching, fewer activated NFs, and consequently, a smaller laterally SRV. Meanwhile, primary fractures propagate sufficiently in the longitudinal direction, thereby forming preferential flow pathways between the parent and child wells through the interaction between induced fractures and activated NFs. Under ∆σ of 8, 12, and 16 MPa, interwell FDIs occur between the parent and child wells. The time to interface (TTI)—defined as the time after the child well begins fracturing, is recorded at 0.35 h, 0.27 h, and 0.22 h, respectively (Figure 15).
Under significant horizontal principal stress difference conditions, both the reduced lateral SRV and the occurrence of interwell FDIs suppress the stimulation effectiveness during child well fracturing (Figure 16). Additionally, during the shut-in phase, elevated net pressure sustains HF propagation—despite the absence of external hydraulic perturbations—due to ultra-low permeability and minimal fluid leak-off of shale reservoirs. Xu’s numerical investigation [57] of hydraulic fracturing shut-in phase further reveals that, post-injection, elevated fluid pressure within the fracture system significantly exceeds shale matrix pressure. Combined with ultraslow leak-off rates due to ultralow shale permeability, this pressure difference drives continued HF propagation during shut-in phase. This behavior contrasts with that of high-permeability sandstone reservoirs, where pressure dissipates rapidly during shut-in phase.
In summary, the horizontal principal stress difference is one of the key geological factors governing fracture propagation and fracture network geometry, exerting a significant influence on interwell FDIs and reservoir stimulation effectiveness. Under low horizontal principal stress difference, the resulting fracture networks tend to exhibit a “wide and short” geometry, where longitudinal propagation of primary fracture is limited, making interwell FDIs less likely. However, lateral propagation is enhanced, enabling the activation of more branched NFs and resulting in a larger SRV. In contrast, high horizontal principal stress difference leads to “narrow and long” fracture networks, characterized by extensive propagation of primary fractures, increased likelihood of interwell communication, fewer lateral branches, and reduced overall SRV.

3.2. Approach Angle of Natural Fractures

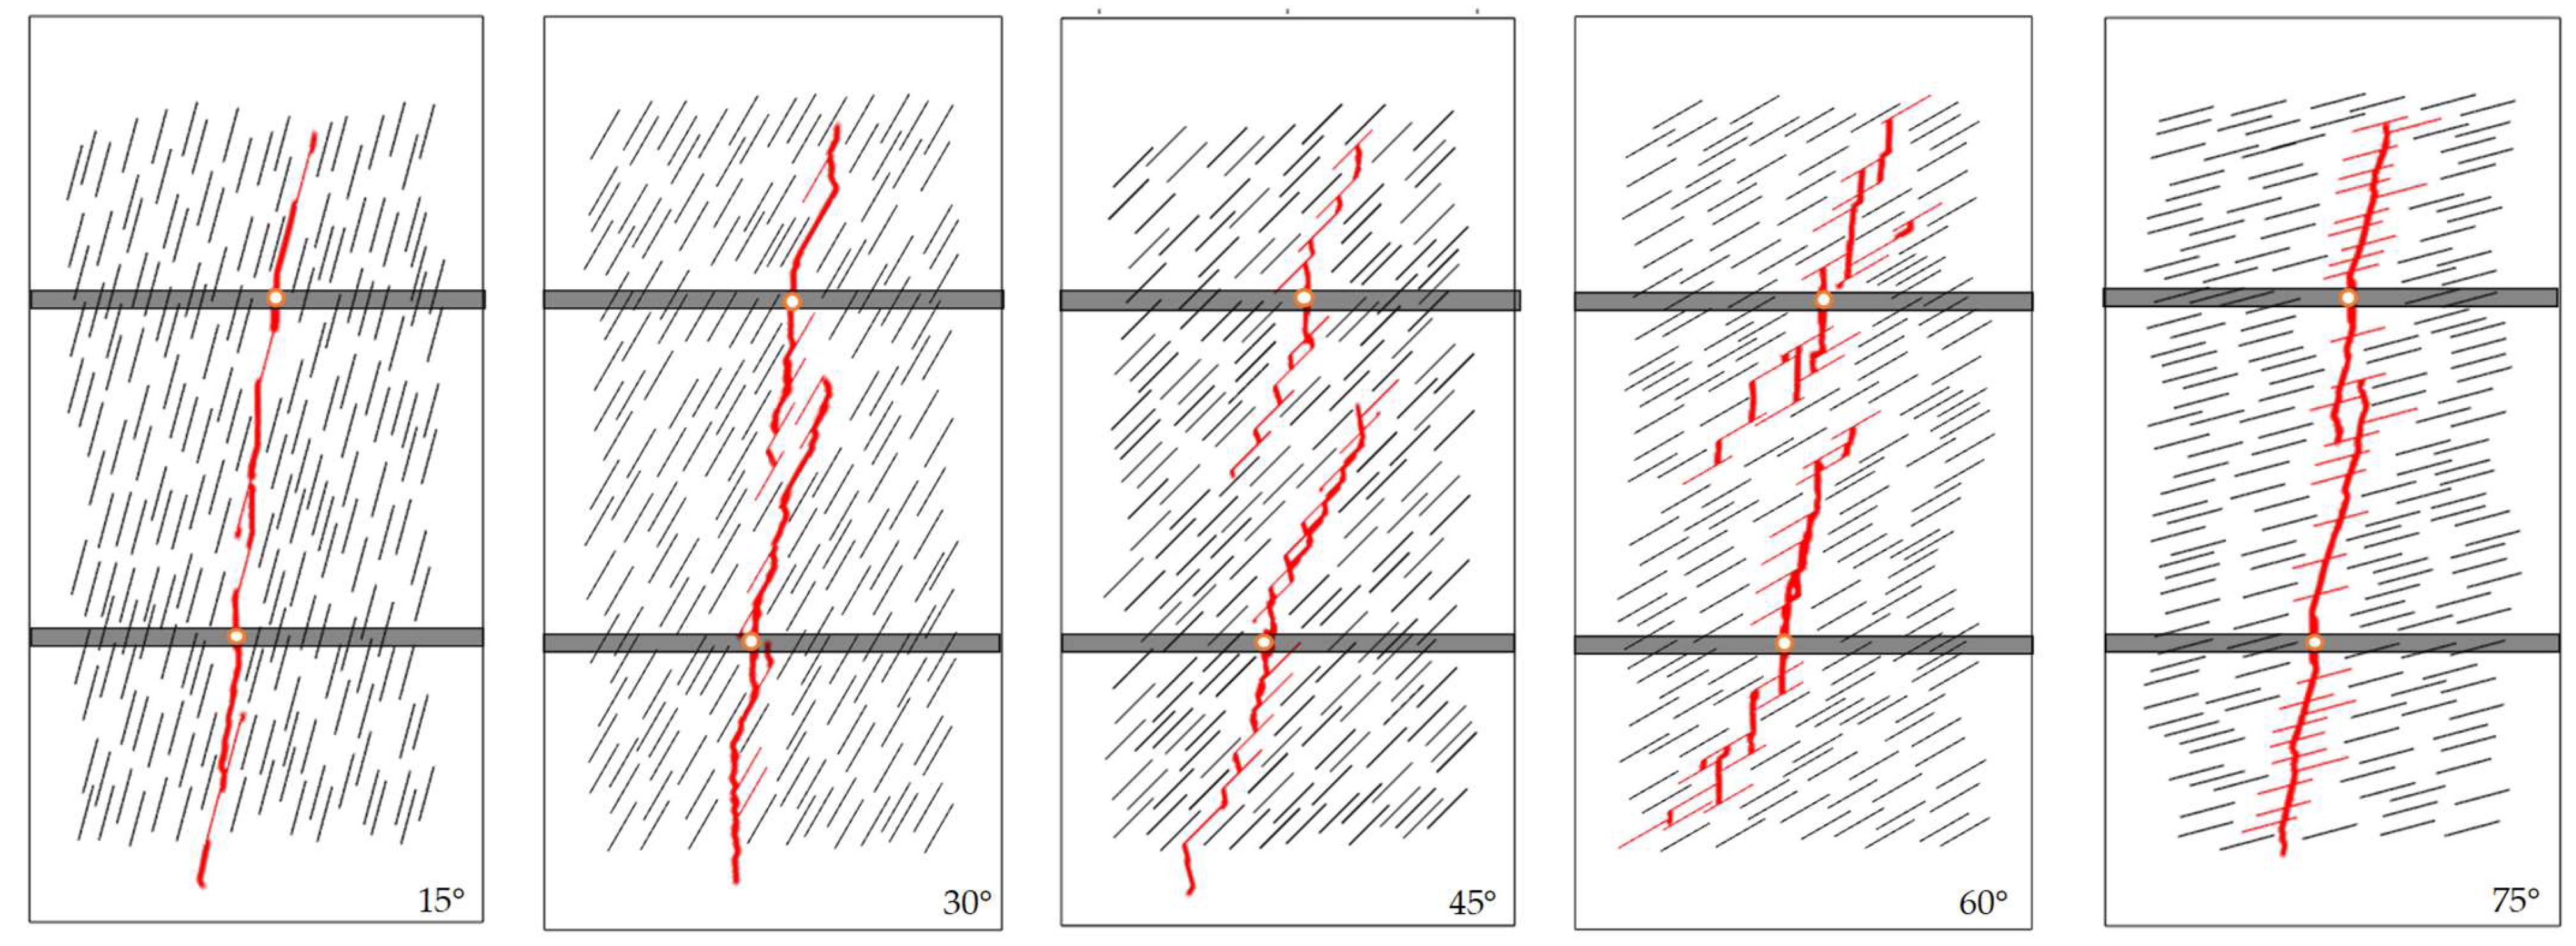
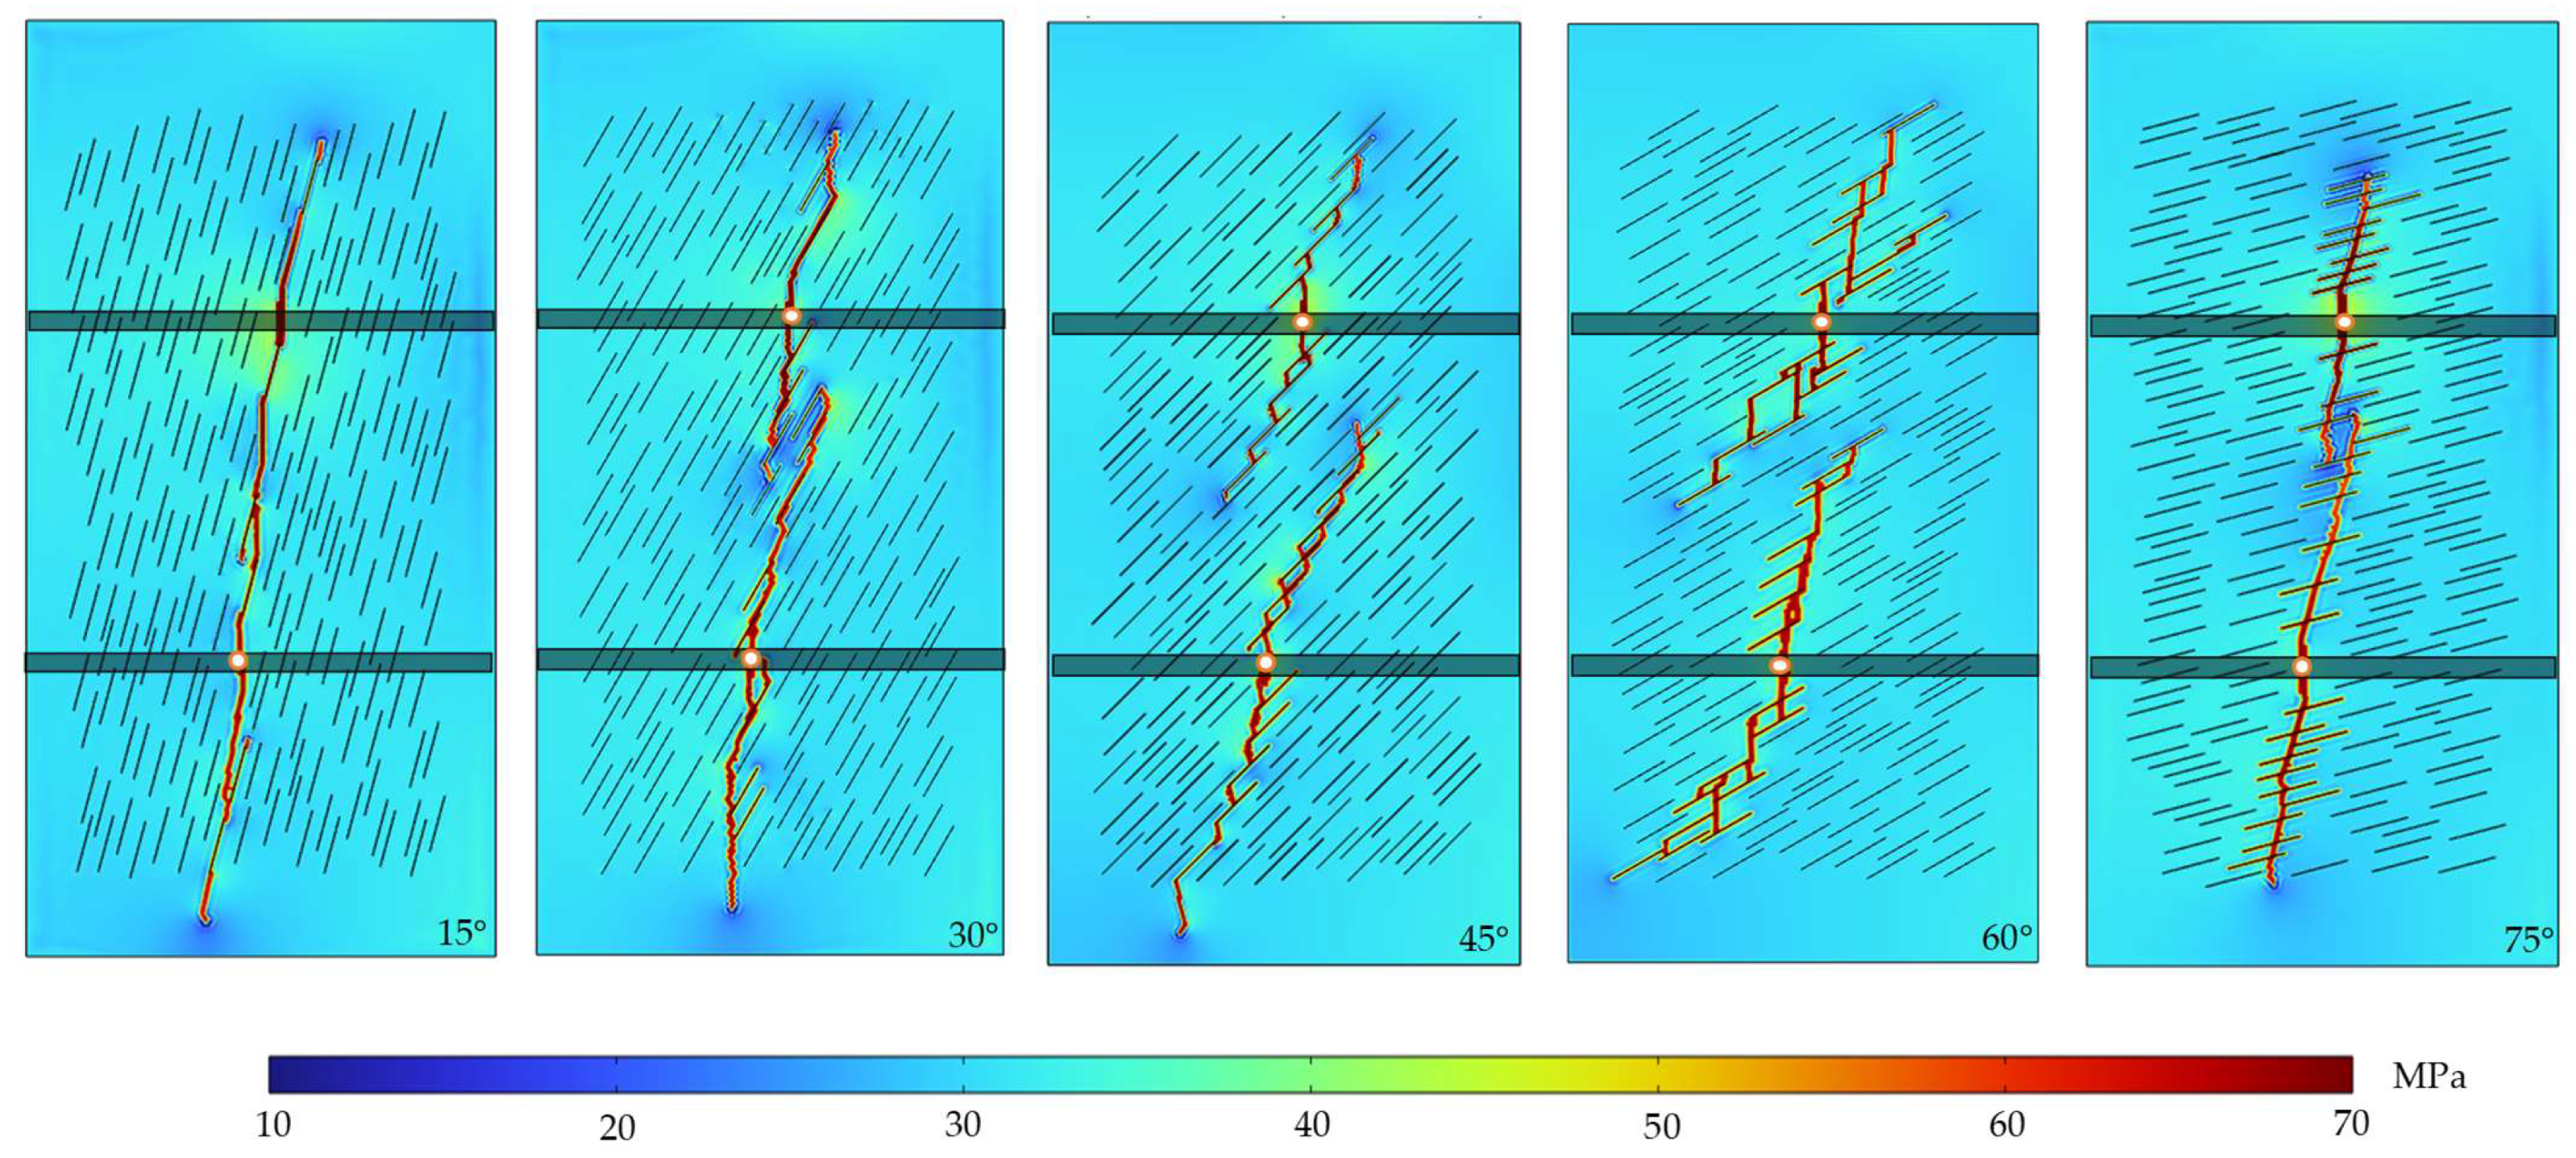
During hydraulic fracturing, the interaction between HFs and NFs—whether HFs cross or open the NFs—directly governs the propagation path of the HF. In addition to the horizontal principal stress difference, the approach angle is another critical factor influencing the behavior of HF–NF interactions. Lateral deviations induced by HF propagation along the NF path may help prevent interwell connectivity between the parent and child wells through NFs. To investigate the HF propagation paths and FDI behavior under different NF approach angles in a natural fracture network system, an idealized reconstruction of the NF system was carried out based on the baseline model. Simulations were performed with uniform NF approach angles of 15°, 30°, 45°, 60°, and 75°, respectively. All other NF characteristics were held constant: the number of fractures was 200, the length of each NF was 15 m, and the horizontal principal stress difference was fixed at 8 MPa. Figure 17 and Figure 18 illustrate the fracture network morphology and pore pressure distribution after the child well fracturing under five different NF approach angles.
When the approach angle is 15°, the HF interacts with the NF primarily by opening it, and continues propagating from the NF tip toward the direction approximately aligned with the maximum horizontal principal stress. The final trajectory of the main fracture deviates by approximately 12° from the maximum horizontal stress orientation. FDI between the child and parent wells occurs at 0.13 h of child well injection (Figure 19). At an approach angle of 30° or 45°, the HF-NF interaction remains dominated by the open mechanism. The resulting main HF trajectory deviates from the maximum horizontal stress direction by about 20° and 34°, respectively. The propagation paths of the main fractures induced by the child and parent wells are offset, and no well-to-well communication is observed. At an approach angle of 60°, the normal stress acting on the NF surfaces increases significantly as the HF approaches. Consequently, the HF exhibits a combined open-cross interaction mode: some segments of the HF cross the NF, while others open it. The primary HF branches dominated by the cross mechanism show a deviation of approximately 9°, whereas those governed by the open mechanism deviate by about 54°. In this case, no communication occurs between the child and parent wells. When the approach angle increases to 75°, the normal stress on the NF surfaces is further elevated, and the HF primarily crosses the NF. The resulting main fracture trajectory deviates by approximately 16° from the direction of maximum horizontal principal stress. Communication between the child and parent wells is established at 0.34 h following the initiation of fracturing in the child well.
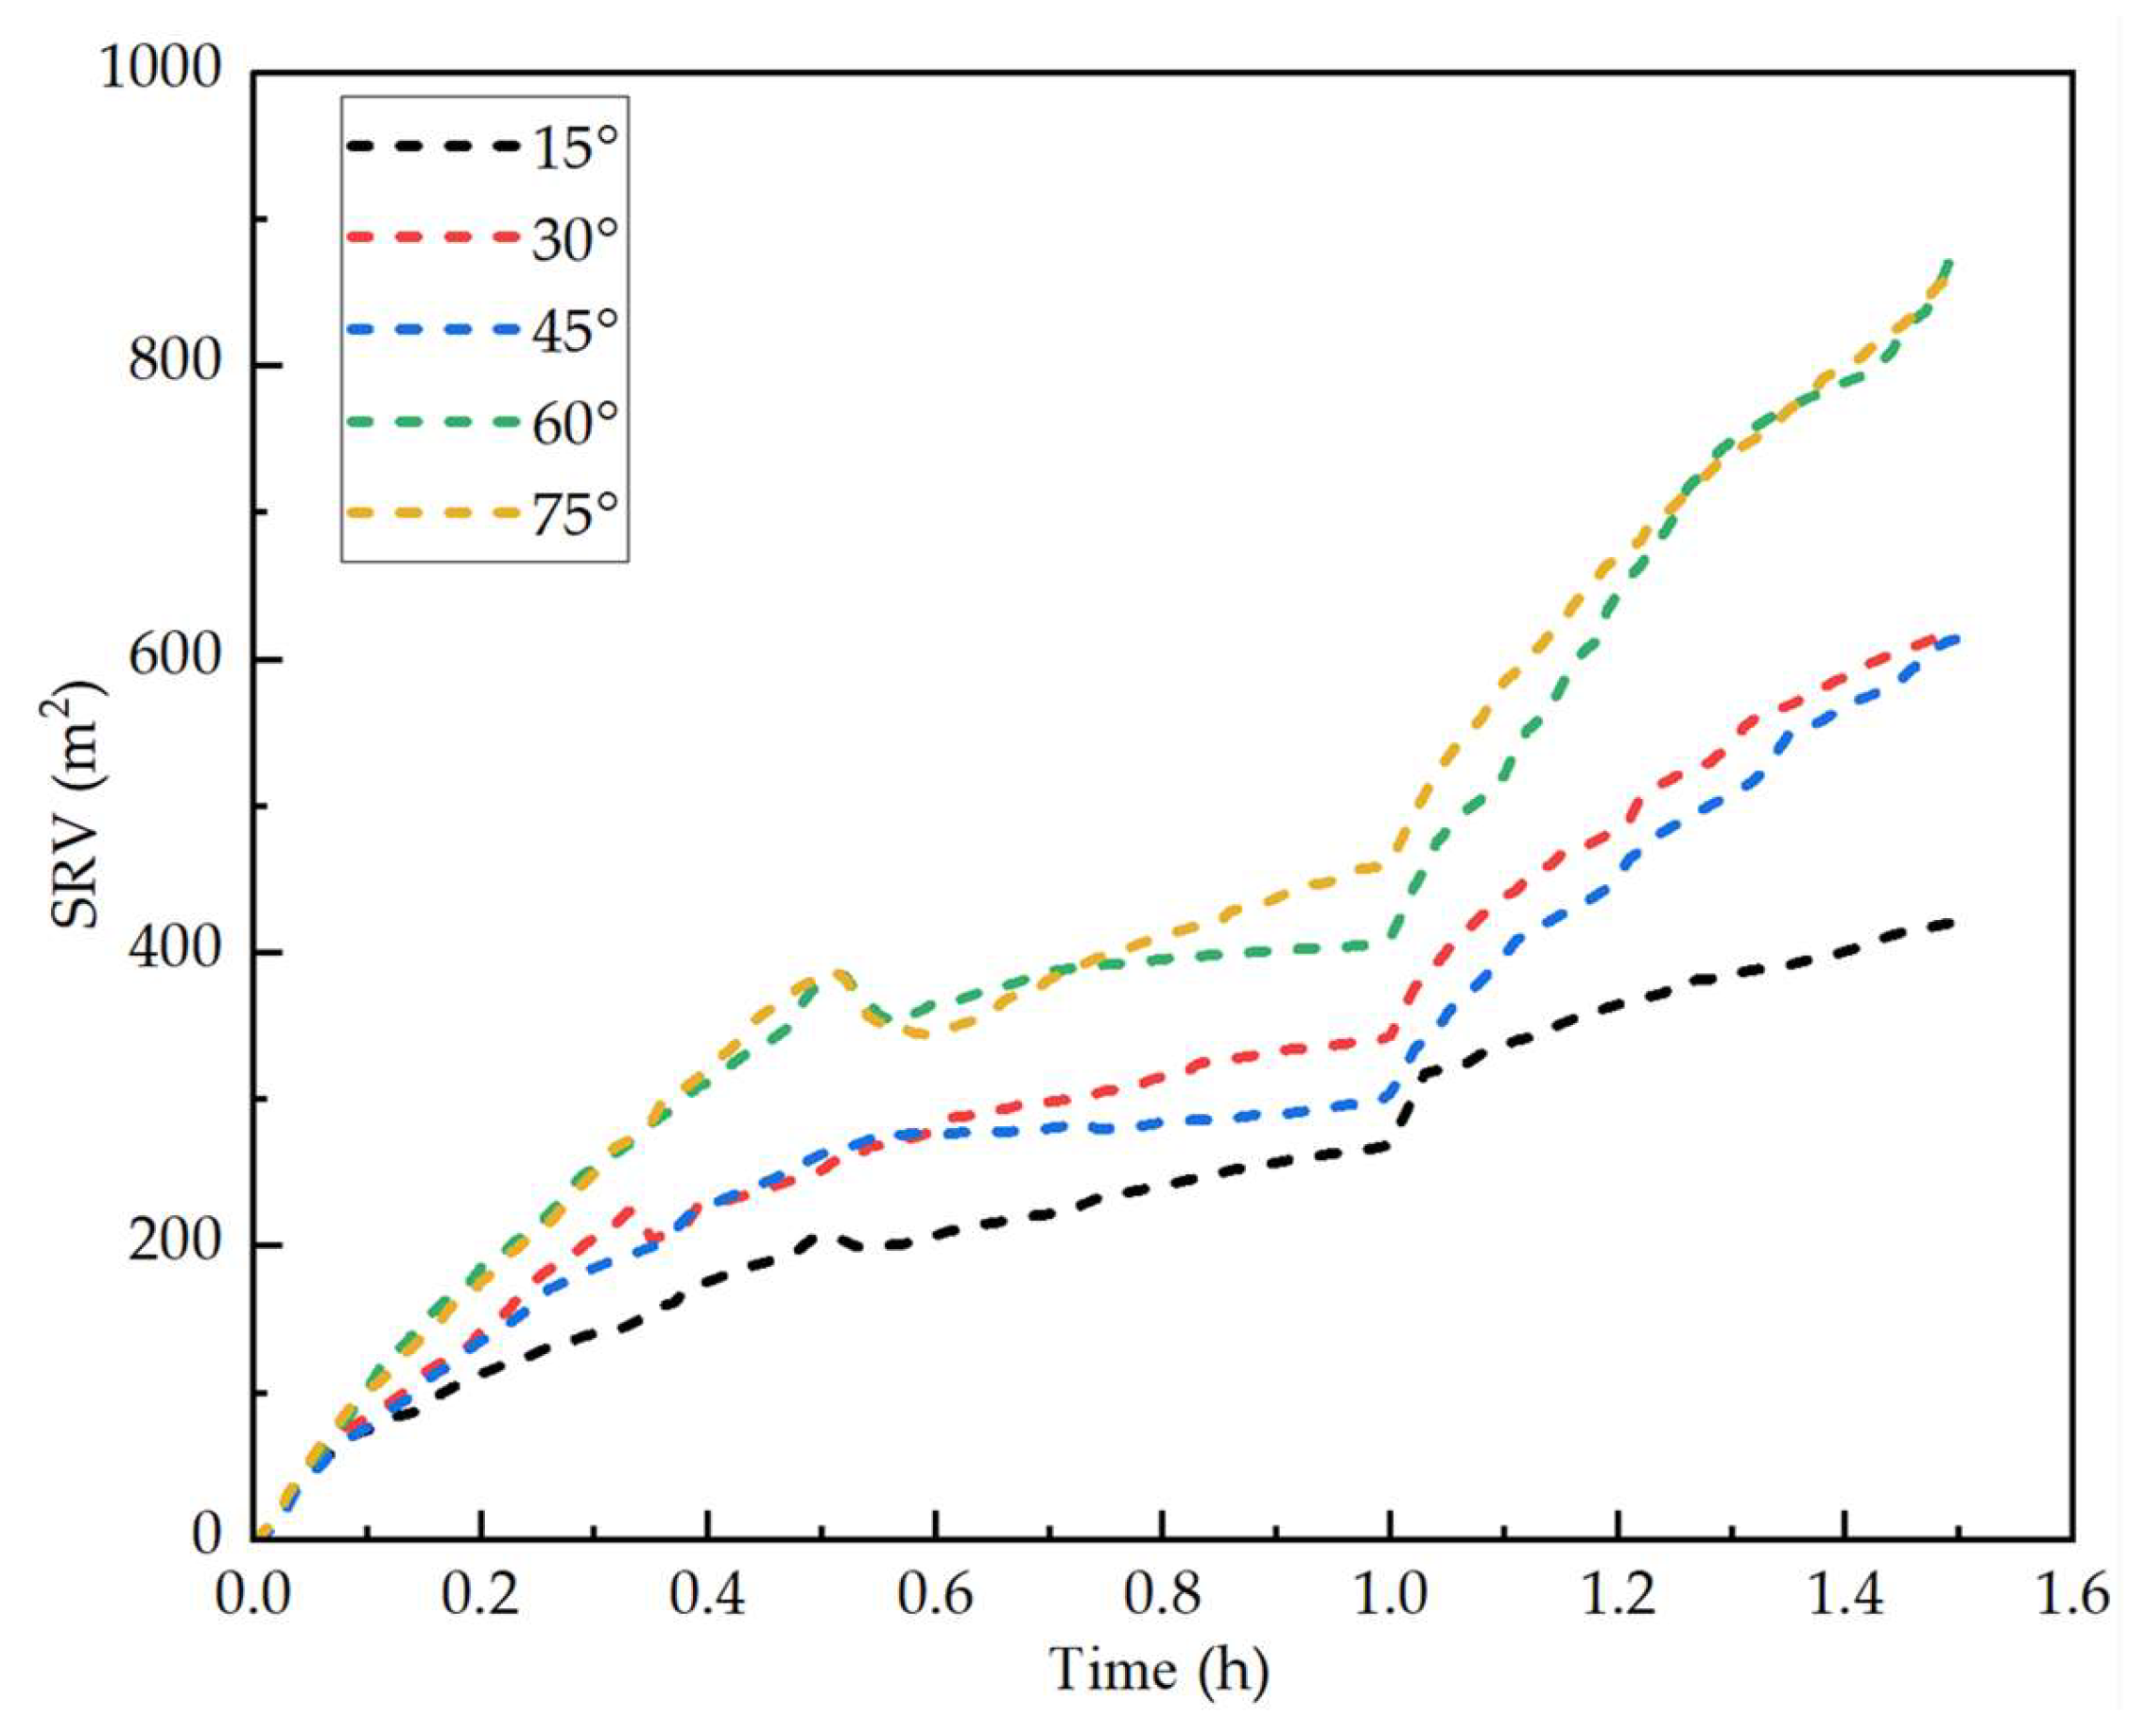
The approach angle primarily influences the HF–NF interaction behavior by altering the magnitude of the normal stress component acting on the NF surface, thereby affecting the post-interaction propagation trajectory of the HF. When the approach angle is 15°, interwell connectivity occurs at 0.13 h during child well fracturing. In this case, the fluid pressure effectively opens the NF and rapidly transmits through the high-permeability pathway, accelerating HF propagation and leading to early interference. However, only seven natural fractures are activated along the main fracture path, indicating limited fracture network development. The rapid interwell communication suppresses the effectiveness of child well fracturing, and the insufficient activation of NFs further contributes to a significantly reduced stimulated reservoir volume (Figure 20). At an approach angle of 30° or 45°, the main fractures initiated by the parent and child wells exhibit substantial angular deviation, resulting in spatial separation between their propagation paths and preventing hydraulic communication. The number of activated NFs in these two scenarios is 16 and 20, respectively. At an approach angle of 60°, the main fractures from the parent and child wells exhibit a potential risk of interwell connectivity due to their aligned propagation directions. However, the growth of branching fractures dissipates part of the system energy, preventing interference under the current operational conditions [58]. Moreover, the larger deviation angles of the main fractures, along with the contribution from branching fracture propagation, lead to the activation of 30 natural fractures, resulting in an adequately stimulated reservoir volume. In contrast, when the approach angle increases to 75°, communication between the wells occurs at 0.34 h after the start of child well fracturing. Most of the HFs cross the NFs directly. During this crossing process, a portion of the fracturing fluid enters the NF or even leaks into the matrix, causing energy loss and resistance to HF propagation [32]. As a result, compared with the 15° case, the propagation velocity of the main fracture is reduced, and the communication is delayed. Despite this, a total of 31 natural fractures are activated, and at the moment of interwell communication, 26 fractures have already been activated. The delayed communication weakens the inhibitory effect on the child well stimulation, thereby achieving a relatively larger stimulated reservoir volume compared to the 15° scenario.
Numerous studies have demonstrated that the approach angle of natural fractures, as one of the key geometric characteristics of fracture networks, is a critical geological parameter that governs the interaction behavior between HFs and NFs upon intersection. However, existing research on the influence of approach angle has primarily focused on physical and numerical experiments involving only a single or a limited number of NFs. There remains a lack of systematic investigation into this effect within large-scale discrete natural fracture networks (DFNs). Although the numerical analysis in this subsection adopts idealized assumptions regarding the fracture network geometry, it address a critical knowledge gap. In shale reservoirs containing DFNs, the approach angle of natural fractures plays a pivotal role in determining whether an HF will open or cross an encountered NF, thereby controlling the overall fracture propagation path and influencing network morphology. Consequently, the approach angle has a significant impact on both interwell fracture-driven interference and the effectiveness of reservoir stimulation. A better understanding of this mechanism can provide valuable guidance for field applications. For instance, real-time fracture monitoring can be leveraged to dynamically adjust fracturing parameters based on the distribution of NF approach angles. Additionally, diversion techniques such as temporary plugging can be employed to reduce the risk of fracture interference and enhance the SRV.

3.3. Well Spacing

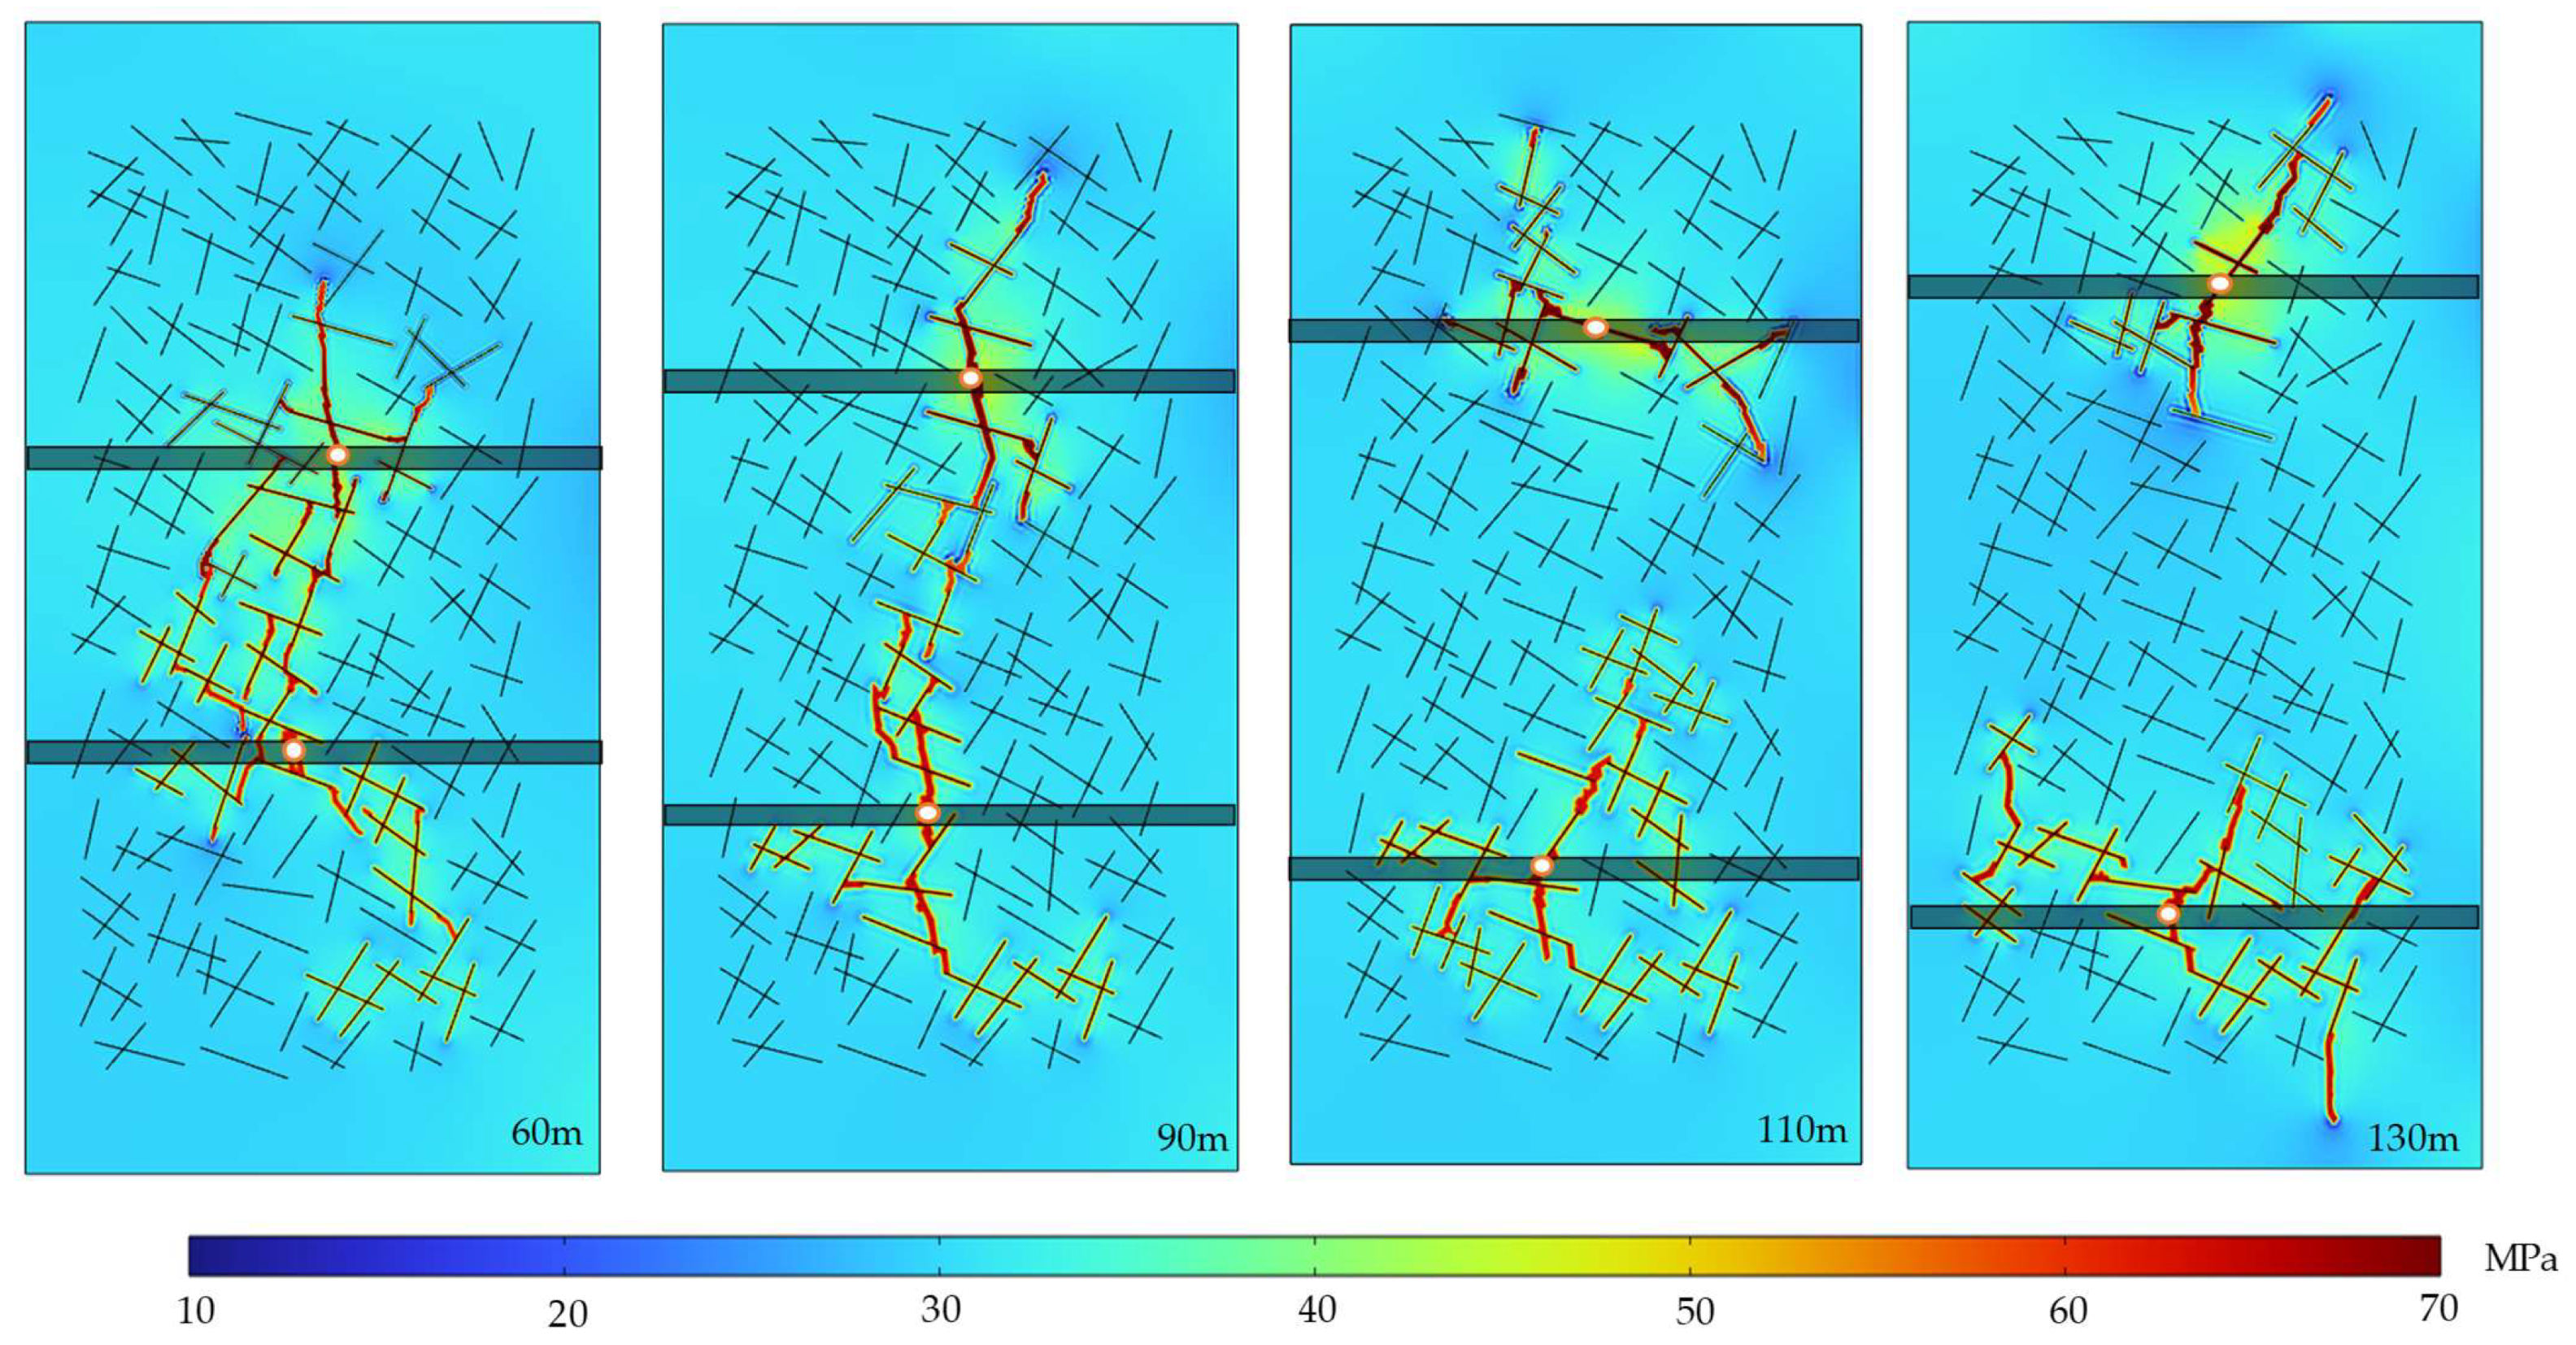
Well spacing is a critical parameter in zipper fracturing design, as it directly influences the intensity of interwell stress interference and the connectivity of the fracture network. Within a given reservoir, overly narrow well spacing exacerbates FDI risks, while excessive spacing creates “unstimulated zone” in inter-well reservoir regions, compromising SRV. To investigate the governing patterns of this influence, a series of simulations were conducted based on the base model, with all other parameters held constant. Four well spacing scenarios—60 m, 90 m, 110 m, and 130 m—were analyzed in terms of fracture network morphology and interwell communication behavior. Figure 21 and Figure 22 present the fracture geometries and pore pressure distributions at the end of the child well fracturing stage under these four well spacing conditions.
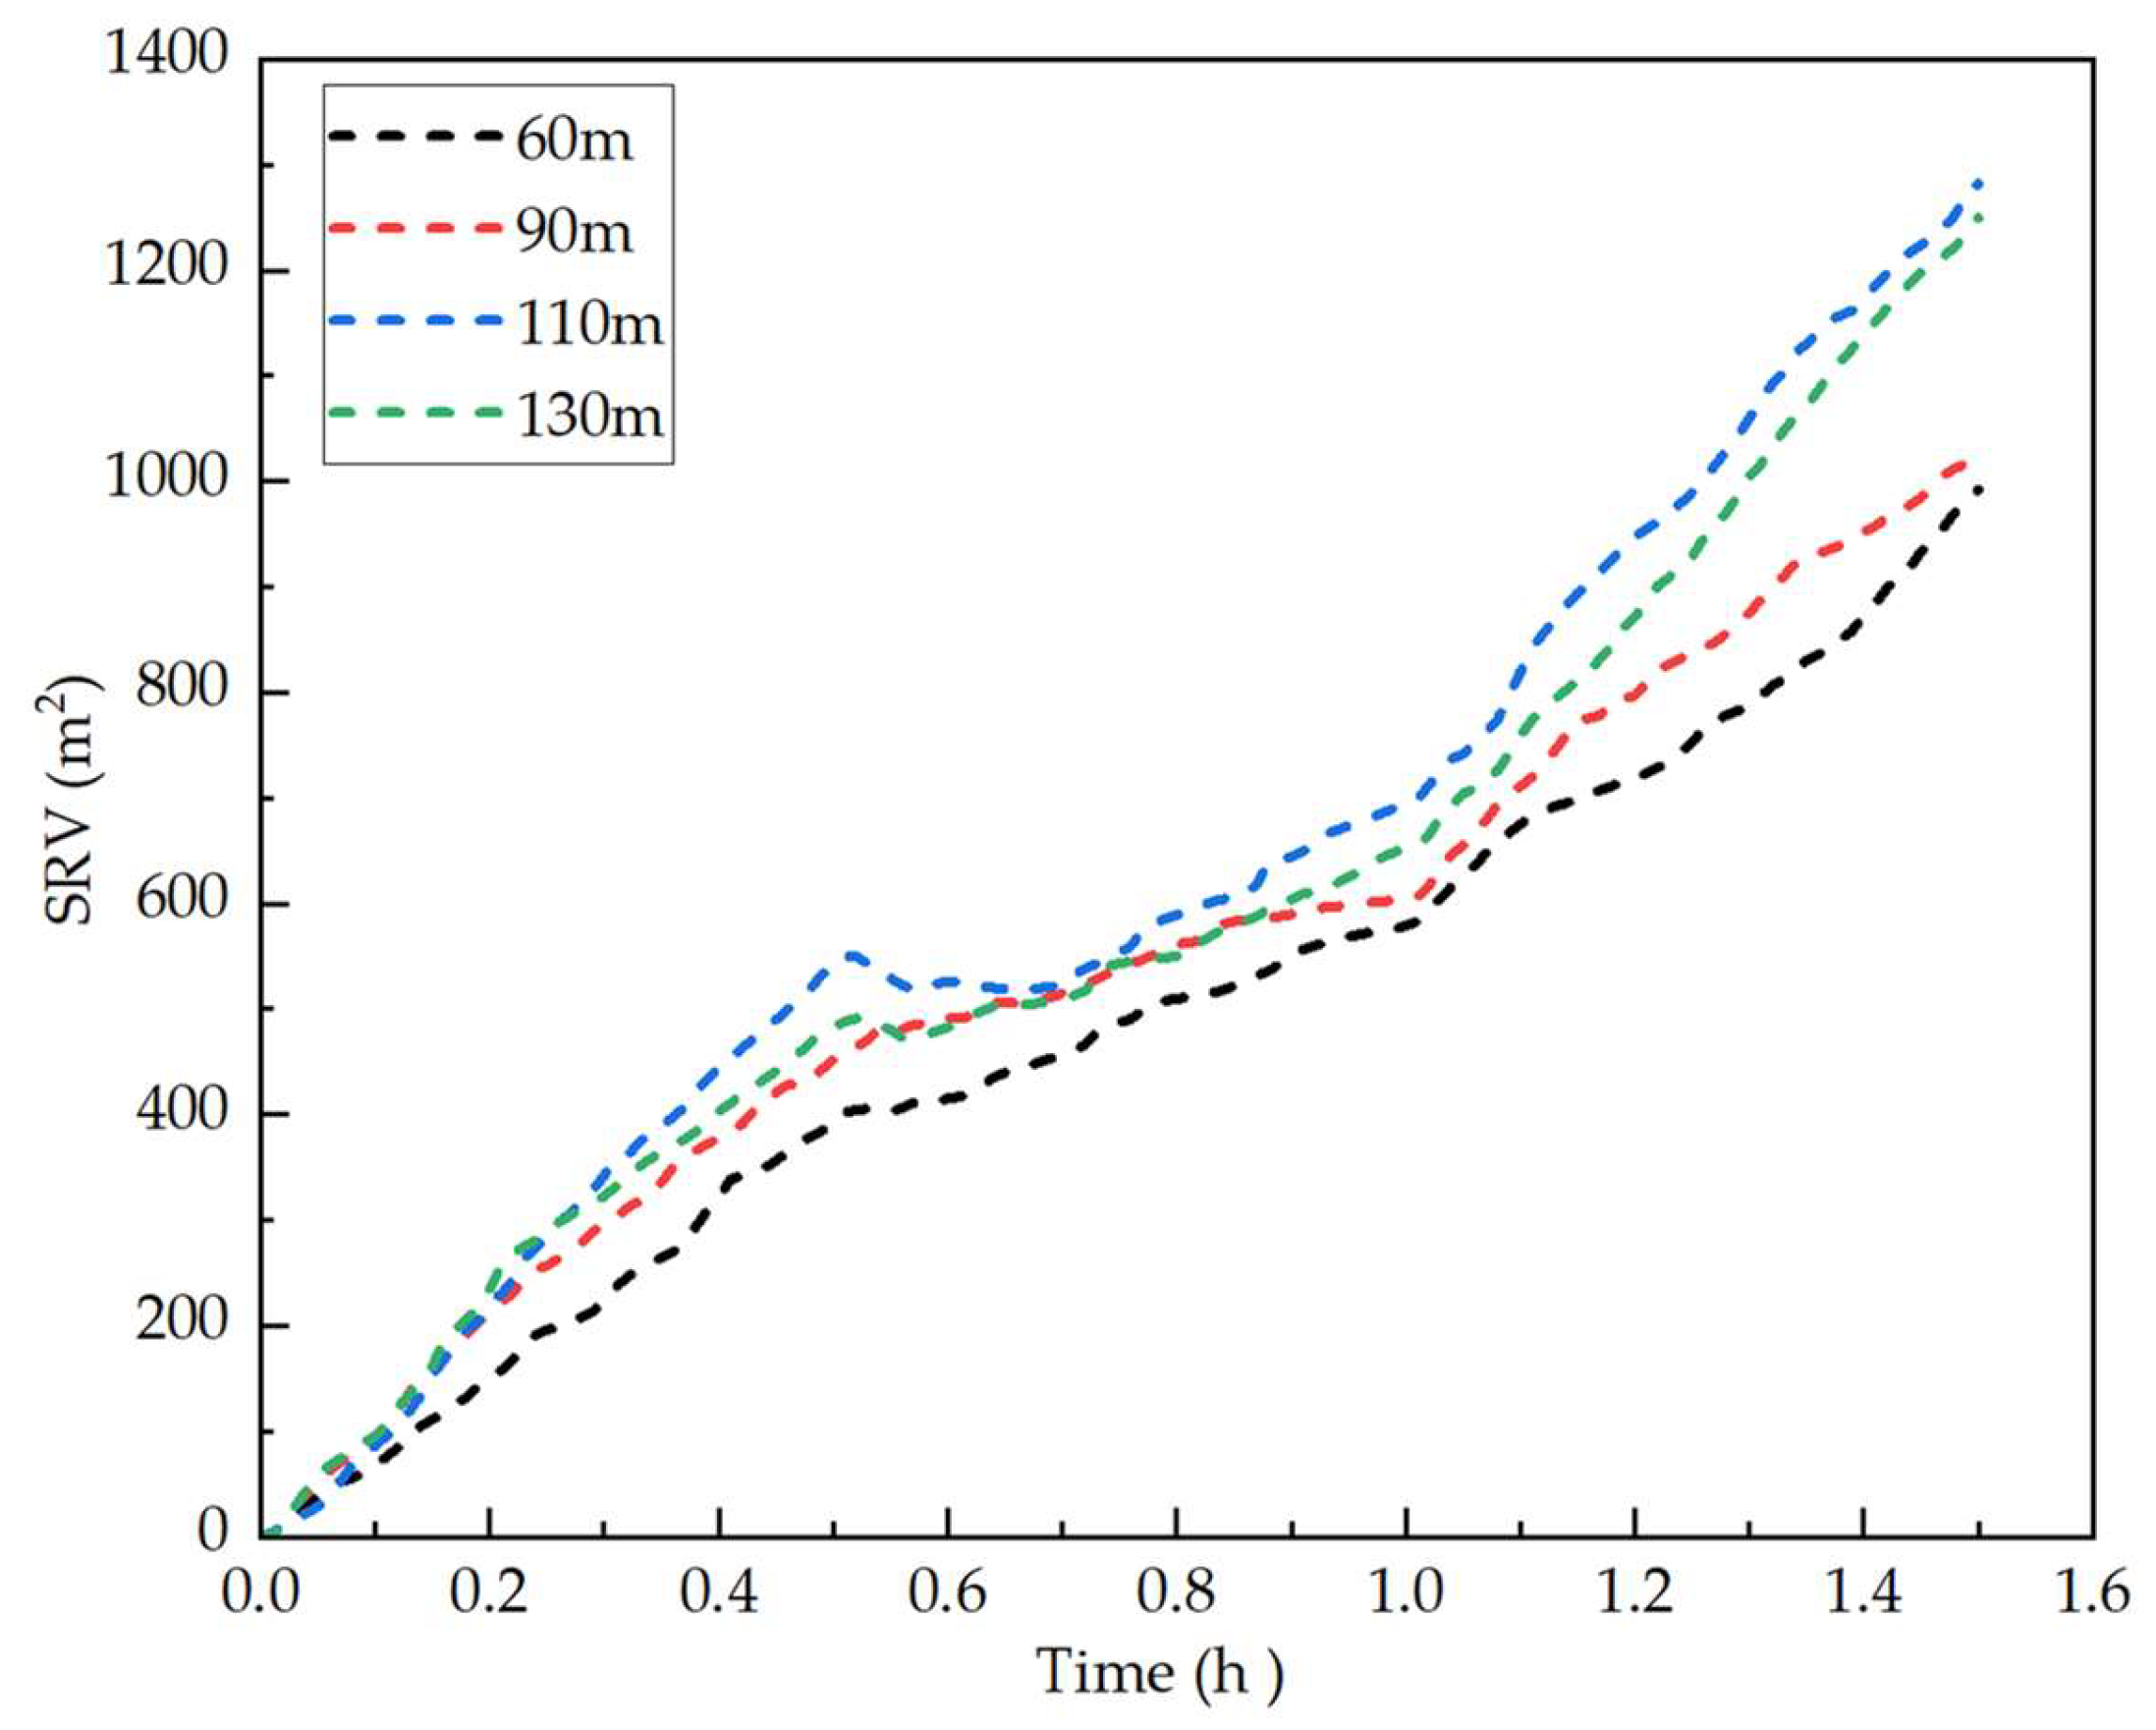
When the well spacing is 60 m, primary fractures from the child and parent wells become rapidly connected through activated NFs within 0.08 h of the child well fracturing, forming preferential flow pathways indicative of severe FDIs (Figure 23). Subsequently, part of the child well’s fracturing fluid flows toward the parent well via primary fracture, consuming fracturing energy and constraining further propagation of the child well’s hydraulic fractures. As a result, the final fracture network exhibits a concentrated distribution between the wells, with many NFs in the upper reservoir above the child well remaining unactivated, leading to a poor overall SRV (Figure 24). When the well spacing is 90 m, interwell communication occurs at 0.35 h during child well fracturing. Compared to the 60 m case, the delayed communication results in relatively weaker constraint of propagation of child well’s hydraulic fractures due to interwell interference. Consequently, the SRV is slightly larger than in the 60 m well spacing scenario. However, compromised overall stimulation efficiency persisted due to FDI impacts. At a spacing of 110 m, the stress interference between the parent and child wells is significantly reduced, and no interwell communication occurs. The fractures from each well propagate independently, forming a “dual-main-fracture with lateral branches” network pattern. The hydraulic fractures extend across the interwell region, activating a larger number of NFs in the central reservoir and resulting in the most favorable overall stimulation performance. When the well spacing is increased to 130 m, primary fractures of both wells are confined to the near-wellbore areas. While many NFs near the wellbore are activated, the NFs in the interwell region remain largely unactivated, resulting in a substantial “unstimulated zone” exhibiting inadequately stimulation coverage. Consequently, the SRV is less than that in the 110 m spacing case. Among the four spacing scenarios investigated in this subsection, a well spacing of 110 m achieves the optimal balance between minimizing fracture-driven communication and maximizing reservoir stimulation efficiency.
In summary, during the development of shale gas reservoirs, under identical fracturing sequences and injection parameters in the completion stage, the well spacing of zipper-fractured horizontal wells—defined during the drilling stage—serves as a key controllable engineering parameter for avoiding the risk of FDIs and optimizing reservoir stimulation performance. Well spacing directly influences the extent of fracture propagation and the magnitude of stress interference, which in turn affects interwell connectivity and overall stimulation effectiveness. When fracturing design parameters remain constant, excessively small well spacing leads to strong stress interference, and the reduced physical distance between the parent and child wells shortens the required propagation distance for interwell fracture connection. This significantly increases the risk of FDIs, which, in turn, severely limits the SRV. On the other hand, overly large well spacing, while mitigating the risk of FDIs, results in insufficient stimulation of the interwell reservoir. This leads to the formation of extensive “unstimulated zone”, ultimately lowering recovery efficiency and negatively impacting the economic viability of shale gas production.

3.4. Injection Rate

During hydraulic fracturing, the injection rate serves as a critical and controllable engineering parameter. By regulating the net pressure within fractures and the rate of fluid energy accumulation, it significantly influences the fracture propagation morphology, thereby affecting the risk of FDIs and the effectiveness of reservoir stimulation. In this subsection, based on the baseline model and under a horizontal principal stress difference of 4 MPa, simulations were conducted to investigate the fracture network morphology and FDI situation at injection rates of 3 × 10⁻⁴ m2/s, 5 × 10⁻⁴ m2/s, 7 × 10⁻⁴ m2/s, 9 × 10⁻⁴ m2/s. Figure 25 and Figure 26 illustrate the resulting fracture network configurations and pore pressure distributions following the child well fracturing under these four injection scenarios.
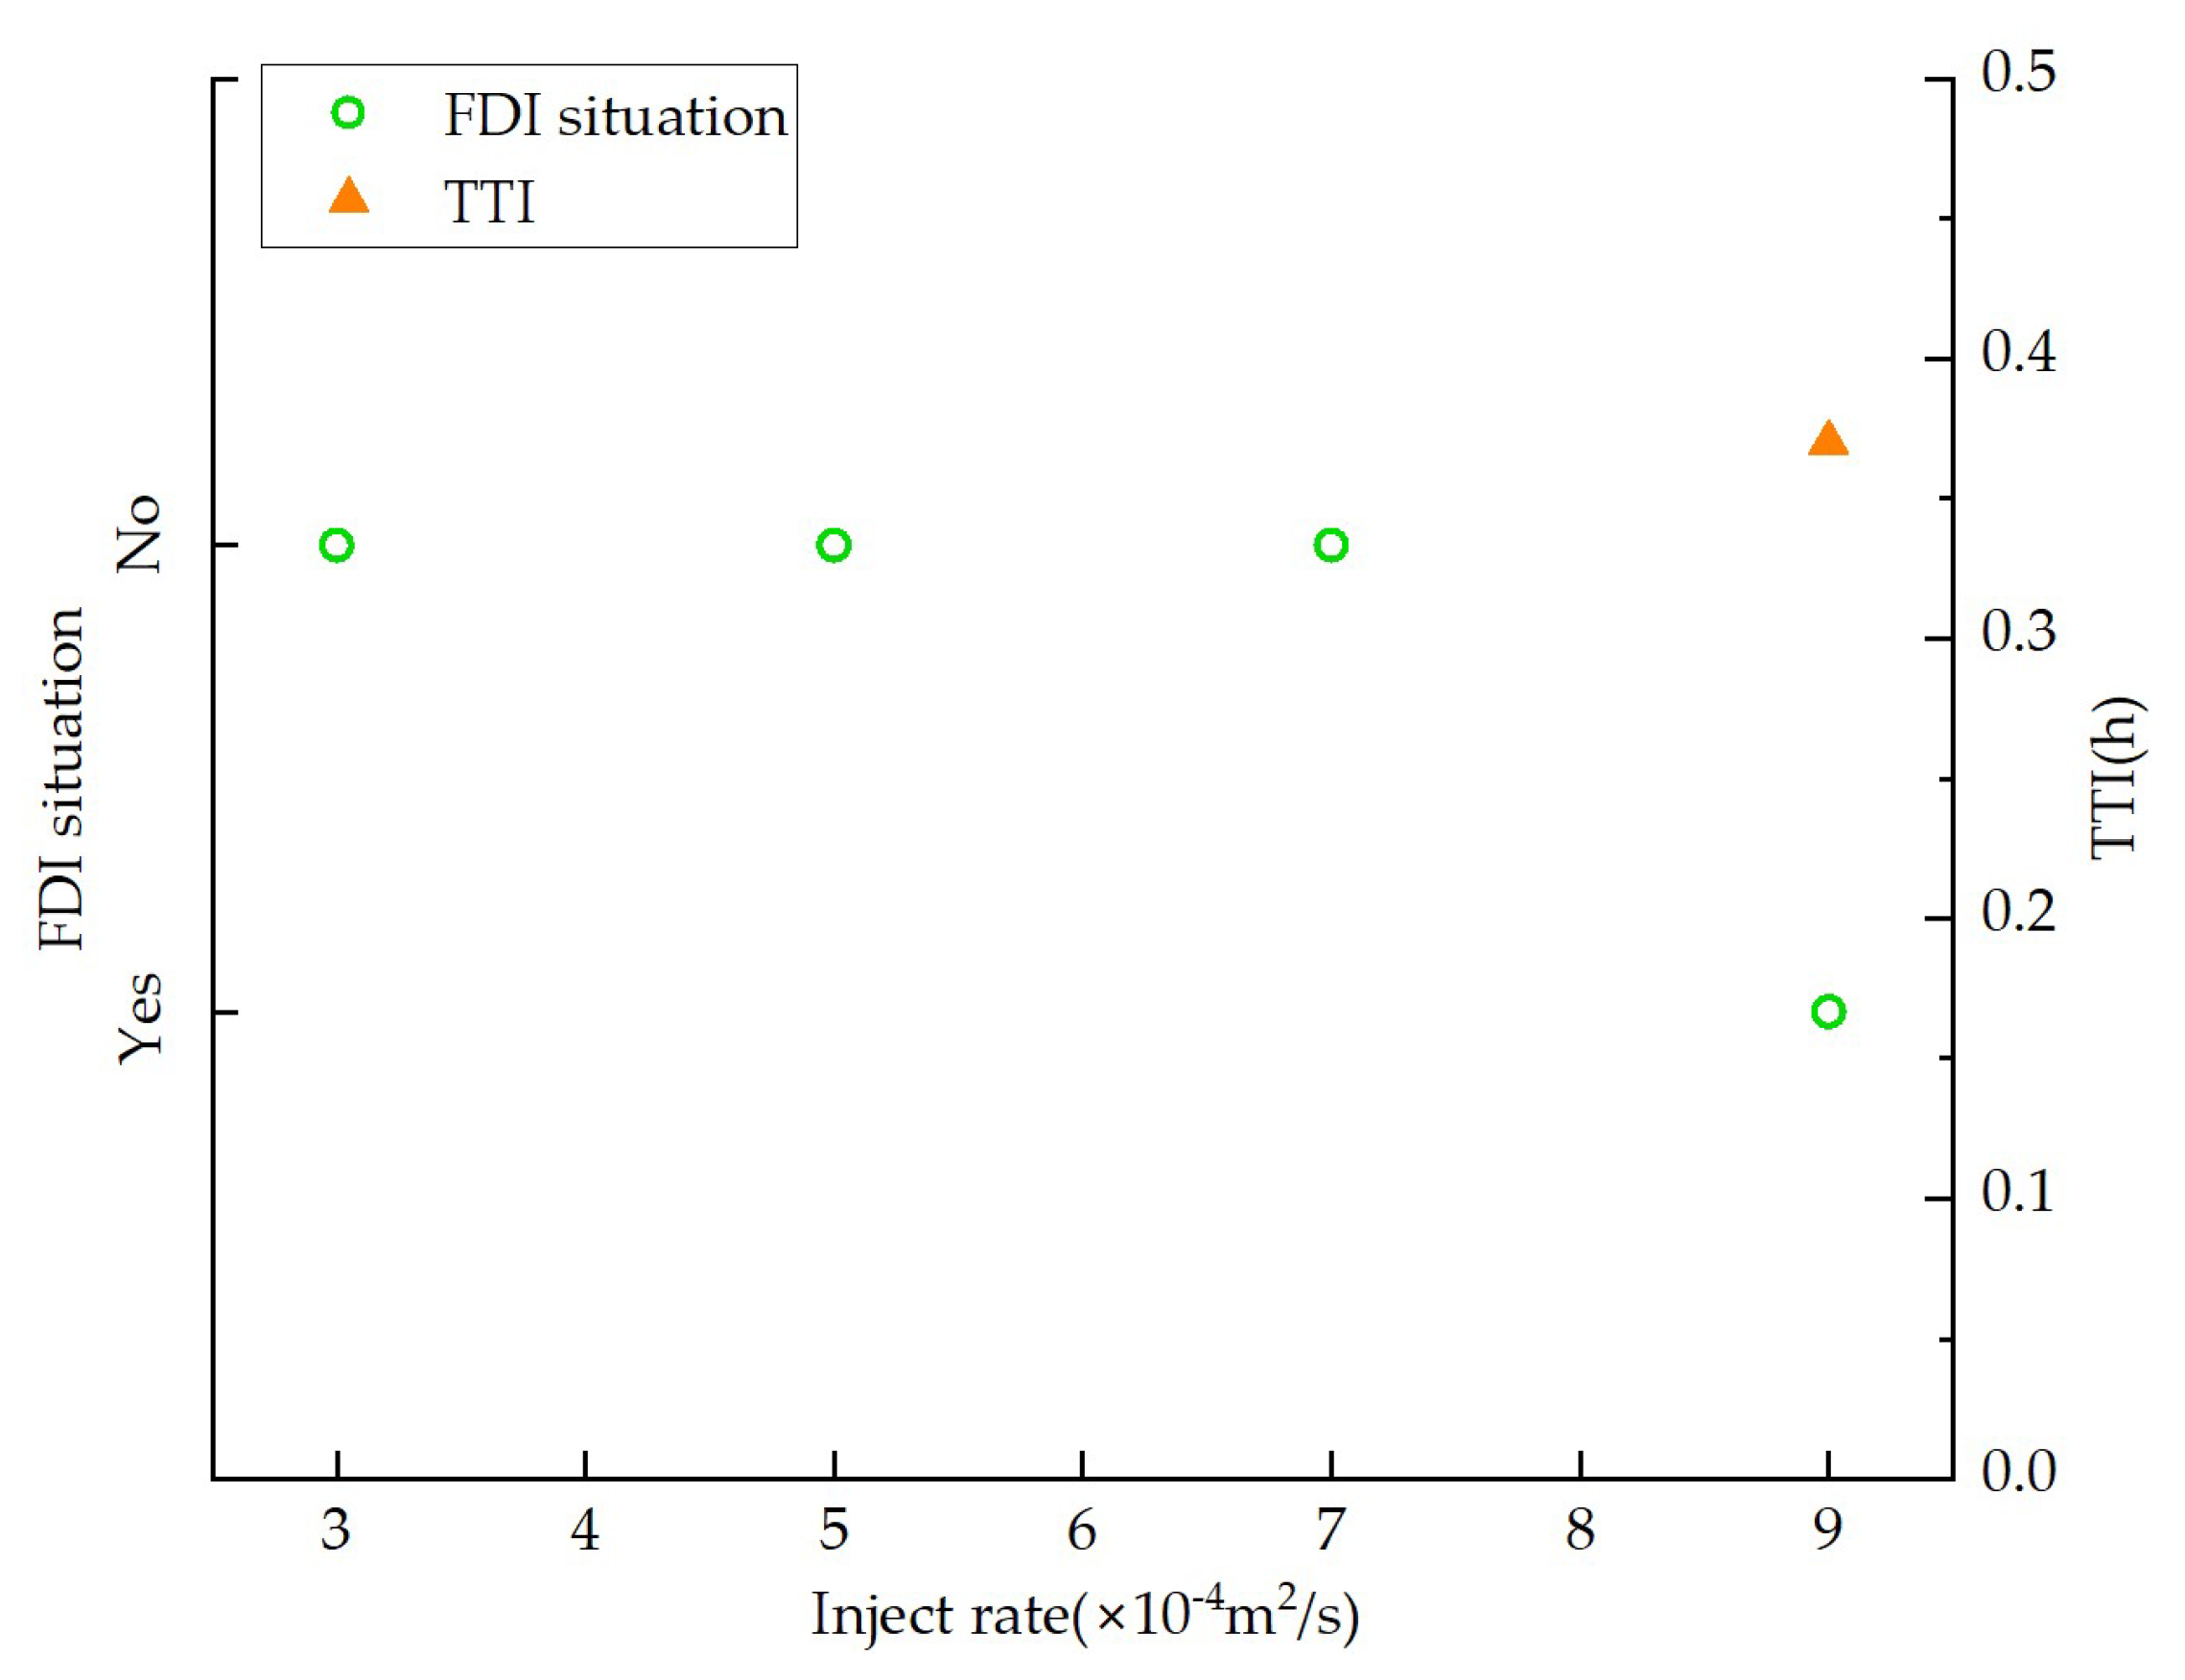
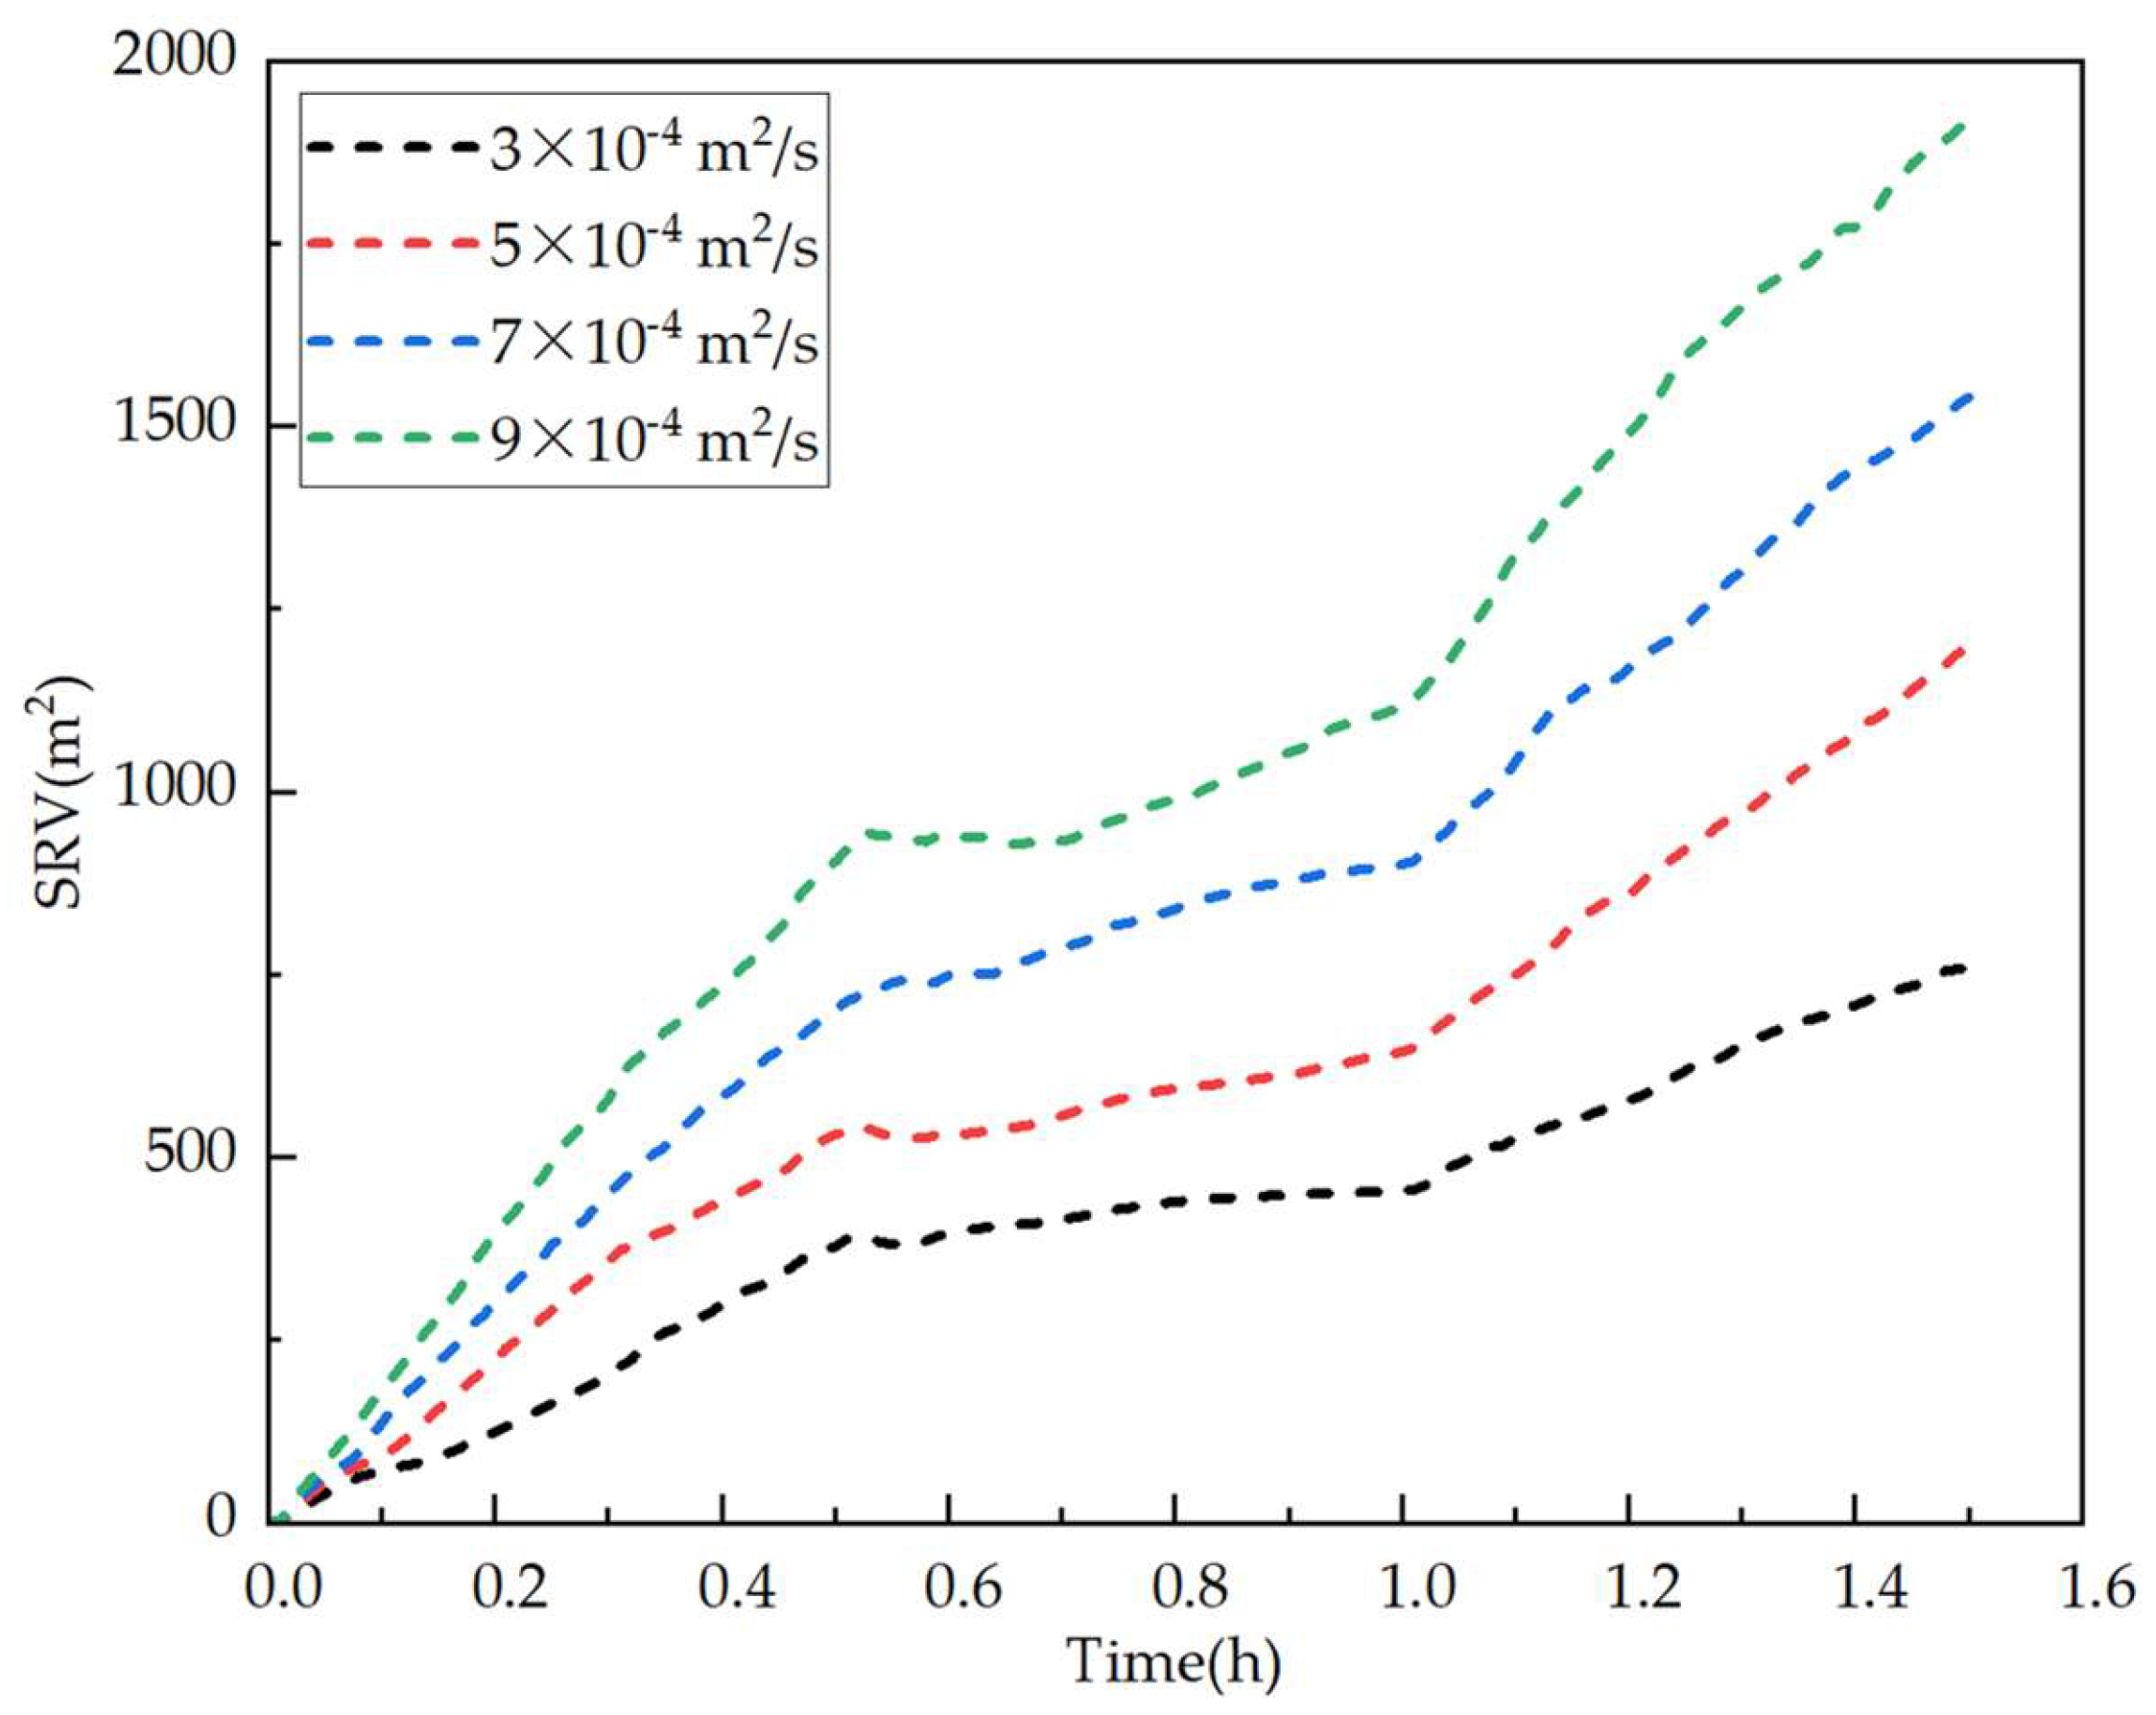
As shown in the figures, when the injection rate is 3   × 10 4 m2/s, the propagation of primary fractures from both the parent and child wells is limited. The number of activated NFs is relatively low and mainly concentrated near the wellbores. A large portion of NFs within the interwell reservoir remains unactivated, forming “unstimulated zone”, resulting in a minimal SRV. When the injection rates increase to 5   × 10 4 m2/s and 7   × 10 4 m2/s, the elevated net pressure within the fractures accelerates fracture propagation. Primary fractures propagate farther along the direction of the maximum horizontal stress, leading to an increase in multiscale branching and a greater number of activated NFs. As a result, the overall SRV significantly improves. At an injection rate of 9   × 10 4 m2/s, fracture propagation becomes even more rapid. At 0.38 h post-fracturing initiation of the child well, primary fractures of the parent and child wells connect via the activated NF network (Figure 27). Consequently, the stimulation effect in the upper reservoir zone of the child well is partially suppressed by interwell communication. However, this communication occurs during late-phase fracturing operations, a high number of NFs has been activated, resulting in a relatively large SRV (Figure 28).
In summary, increasing the injection rates extends primary fractures propagation and enhances activation density of NFs. However, it also elevates the risk of FDIs through the activated natural fracture network.

4. Conclusions

In response to the characteristics of shale reservoirs—namely the dense matrix, well-developed natural fracture systems, and the high risk of FDIs during hydraulic fracturing—this study developed a fully coupled numerical model based on HMD multi-physics coupling theory. The model was validated under several representative conditions, and a series of sensitivity analyses were conducted. The main findings are summarized as follows:
  • When the maximum horizontal stress difference increases to 8 MPa or higher, hydraulic fractures tend to propagate along the direction of the principal stress, forming a “narrow and long” primary fracture structure. At stress differences of 12 MPa and 16 MPa, interwell communication occurs at 0.27 h and 0.22 h after the start of fracturing in the child well, respectively, with a significant reduction in the reservoir stimulation volume.
  • Increasing the well spacing from 60 m to 110 m delays interwell communication from 0.08 h after fracturing in the child well to a condition where no interference occurs, resulting in a significant improvement in the SRV. However, when the spacing is further increased to 130 m, although interwell communication is avoided, a larger unstimulated zone forms between wells—resulting in a “unstimulated zone”.
  • At an approach angle of 15°, interwell communication occurs at 0.13 h during child well fracturing, with the main fracture path nearly overlapping that of the parent well. In contrast, when the approach angles are 30°, 45°, or 60°, fracture paths exhibit clear deflection and no interwell communication is observed. Moreover, the number of activated natural fractures increases significantly, reaching 16, 20, and 30 respectively.
  • At an injection rate of 9   × 10 4 m2/s, the fracture propagation rate increases markedly, and interwell communication occurs at 0.38 h of child well fracturing. In contrast, when the injection rate is 3   × 10 4 m2/s, fracture propagation is significantly constrained, resulting in a smaller SRV and insufficient activation of natural fractures between wells.
In summary, we have developed a fully coupled HMD model that captures the complex interactions between hydraulic and natural fractures, including fracture opening and closing. The model offers a more accurate representation of the hydraulic fracturing process, providing scientific guidance for shale gas production and actionable insights for optimizing well patterns, injection parameters, and fracture design, while addressing FDI issues and improving economic performance.
While this study advances the understanding of fracture interference mechanisms through a rigorously validated HMD-DFN model, several limitations should be noted. The 2D modeling framework, despite capturing essential physics of fracture interactions in naturally fractured shale reservoirs, inherently simplifies complex 3D field conditions. Extend this high-fidelity model to 3D would require overcoming significant computational challenges related to nonlinear coupling and fracture network complexity. Additionally, this study focuses on establishing a theoretical numerical model for shale reservoirs with DFN and conducting parametric sensitivity analysis of FDIs, but not the economic factors related with production data observed in real-world engineering applications. Future studies may be advised to (1) develop three-dimensional hydraulic fracturing models based on the numerical framework proposed in this study, (2) incorporate mineralogical heterogeneity and account for anisotropic effects on complex fracture propagation and FDIs following the established geomechanics theories [59,60,61], and (3) integrate field production data with numerical study to further investigate economic implications of fracture interference mitigation strategies.

Author Contributions

Conceptualization, F.L. and N.Z.; methodology, F.L., Y.M. and F.W.; software, Y.M.; validation, Y.M.; formal analysis, Y.M., F.W. and Z.Y.; resources, N.Z., Z.Y., X.Y. and R.X.; writing—original draft preparation, Y.M., F.W., Z.Y. and N.Z.; writing—review and editing, F.L., Y.M. and F.W.; visualization, Y.M.; supervision, F.L. and N.Z. All authors have read and agreed to the published version of the manuscript.

Funding

This work was funded by Open Foundation of Shaanxi Key Laboratory of Lacustrine Shale Gas Accumulation and Exploitation and the National Natural Science Foundation of China (No. 52179112).

Data Availability Statement

The original contributions presented in the study are included in the article, further inquiries can be directed to the corresponding author.

Acknowledgments

We sincerely thank the reviewers for their valuable suggestions, which have significantly improved the quality of this paper.

Conflicts of Interest

Author Zhiguang Yao was employed by the company Shale Gas Research Institute, PetroChina Southwest Oil & Gasfield Company. The remaining authors declare that the research was conducted in the absence of any commercial or financial relationships that could be construed as a potential conflict of interest.

Abbreviations

The following abbreviations are used in this manuscript:
FDIsFracture-driven interactions
SRVStimulated reservoir volume
HMDHydro–mechanical–damage
DFNDiscrete fracture network
HFHydraulic fracture
NFNatural fracture
TTITime to interface

References

  1. Mukherjee, M.; Vishal, V. Gas transport in shale: A critical review of experimental studies on shale permeability at a mesoscopic scale. Earth-Sci. Rev. 2023, 244, 104522. [Google Scholar] [CrossRef]
  2. Luo, Z.; Zhang, N.; Zhao, L.; Yuan, X.; Zhang, Y. A novel stimulation strategy for developing tight fractured gas reservoir. Petroleum 2018, 4, 215–222. [Google Scholar] [CrossRef]
  3. Rammay, M.H.; Awotunde, A.A. Stochastic optimization of hydraulic fracture and horizontal well parameters in shale gas reservoirs. J. Nat. Gas Sci. Eng. 2016, 36, 71–78. [Google Scholar] [CrossRef]
  4. Qian, B.; Zhang, J.; Zhu, J.; Fang, Z.; Kou, S.; Chen, R. Application of zipper fracturing of horizontal cluster wells in the Changning shale gas pilot zone, Sichuan Basin. Nat. Gas Ind. 2015, 35, 81–84. [Google Scholar] [CrossRef]
  5. Wu, F.; Yan, Y.; Yin, C. Real-time microseismic monitoring technology for hydraulic fracturing in shale gas reservoirs: A case study from the Southern Sichuan Basin. Nat. Gas Ind. B 2017, 4, 68–71. [Google Scholar] [CrossRef]
  6. Xiaolun, Y. Investigation on the Fracture-Driven Interactions Mechanism and Preventive Countermeasures in Mahu Area. Ph.D. Thesis, China University of Petroleum, Beijing, China, 2022. [Google Scholar]
  7. Rafiee, M.; Grover, T. (Eds.) Well spacing optimization in Eagle Ford shale: An operator’s experience. In Proceedings of the SPE/AAPG/SEG Unconventional Resources Technology Conference, Austin, TX, USA, 24 July 2017. [Google Scholar]
  8. Wu, J.; Zeng, B.; Wang, L.; Huang, H.; Pan, Y.; Song, Y.; Nunez, H.; Deng, Q.; Wang, L.; Zhao, H. (Eds.) 3D Integrated G&G Model-Driven Mitigation Workflow on Screenout, Frac Hits and Casing Deformation in Ultradeep Shale Hydraulic Fracturing. In Proceedings of the Society of Petroleum Engineers—SPE Argentina Exploration and Production of Unconventional Resources Symposium, Buenos Aires, Argentina, 20 March 2023; LAUR: Los Alamos, NM, USA, 2023. [Google Scholar]
  9. Daneshy, A.; Au-Yeung, J.; Thompson, T.; Tymko, D. (Eds.) Fracture shadowing: A direct method for determining of the reach and propagation pattern of hydraulic fractures in horizontal wells. In Proceedings of the Society of Petroleum Engineers—SPE Hydraulic Fracturing Technology Conference, The Woodlands, TX, USA, 20 February 2012. [Google Scholar]
  10. Schaeffer, B.; Mcgreaham, L.; Reshetnikov, A. Unconventional parent-child well completion evaluation via microseismic analysis: A Delaware Basin case study. In Seg Technical Program Expanded Abstracts; Society of Exploration Geophysicists: Houston, TX, USA, 2017. [Google Scholar]
  11. Awada, A.; Santo, M.; Lougheed, D.; Xu, D.; Virues, C. Is That Interference? A Work Flow for Identifying and Analyzing Communication Through Hydraulic Fractures in a Multiwell Pad. SPE J. 2016, 21, 1554–1566. [Google Scholar] [CrossRef]
  12. Cao, R.; Li, R.; Girardi, A.; Chowdhury, N.; Chen, C. Well Interference and Optimum Well Spacing for Wolfcamp Development at Permian Basin. In Proceedings of the Unconventional Resources Technology Conference, Austin, TX, USA, 24–26 July 2017; pp. 2756–2766. [Google Scholar]
  13. Cipolla, C.; Mack, M. (Eds.) Reducing Exploration and Appraisal Risk in Low-Permeability Reservoirs Using Microseismic Fracture Mapping. In Proceedings of the Canadian Unconventional Resources and International Petroleum Conference, Calgary, AB, Canada, 19 October 2010; p. SPE-137437-MS. [Google Scholar]
  14. Cipolla, C.; Mack, M.; Maxwell, S. (Eds.) Reducing Exploration and Appraisal Risk in Low Permeability Reservoirs Using Microseismic Fracture Mapping—Part 2. In Proceedings of the SPE Latin American and Caribbean Petroleum Engineering Conference, Lima, Peru, 1–3 December 2010; p. SPE-138103-MS. [Google Scholar]
  15. Manchanda, R.; Sharma, M.M.M.; Holzhauser, S. Time-Dependent Fracture-Interference Effects in Pad Wells. SPE Prod. Oper. 2014, 29, 274–287. [Google Scholar] [CrossRef]
  16. Fatahi, H.; Hossain, M.M.; Sarmadivaleh, M. Numerical and experimental investigation of the interaction of natural and propagated hydraulic fracture. J. Nat. Gas Sci. Eng. 2017, 37, 409–424. [Google Scholar] [CrossRef]
  17. Zhang, N.; Liu, F.; Jiang, L.; Mo, P.; Xiao, J.; Song, Q.; Luo, Y. Coupled THMC model-based prediction of hydraulic fracture geometry and size under self-propping phase-transition fracturing. Int. J. Coal Sci. Technol. 2024, 11, 78. [Google Scholar] [CrossRef]
  18. Weng, X.; Chuprakov, D.; Kresse, O.; Prioul, R.; Wang, H. Hydraulic fracture-height containment by permeable weak bedding interfaces. Geophysics 2018, 83, MR137–MR152. [Google Scholar] [CrossRef]
  19. Cai, Y.; Dahi Taleghani, A. (Eds.) Toward controllable infill completions using frac-driven interactions FDI data. In Proceedings of the SPE Annual Technical Conference and Exhibition, Dubai, United Arab Emirates, 15 September 2021; SPE: Houston, TX, USA, 2021. [Google Scholar]
  20. Sesetty, V.; Ghassemi, A. Effect of rock anisotropy on wellbore stresses and hydraulic fracture propagation. Int. J. Rock Mech. Min. Sci. 2018, 112, 369–384. [Google Scholar] [CrossRef]
  21. Zhang, N.; Luo, Z.; Chen, Z.; Liu, F.; Liu, P.; Chen, W.; Wu, L.; Zhao, L. Thermal–hydraulic–mechanical–chemical coupled processes and their numerical simulation: A comprehensive review. Acta Geotech. 2023, 18, 6253–6274. [Google Scholar] [CrossRef]
  22. Rezaei, A.; Rafiee, M.; Siddiqui, F.; Soliman, M.; Bornia, G. (Eds.) The role of pore pressure depletion in propagation of new hydraulic fractures during Refracturing of horizontal Wells. In Proceedings of the SPE Annual Technical Conference and Exhibition, San Antonio, TX, USA, 9–11 October 2017; SPE: Houston, TX, USA, 2017. [Google Scholar]
  23. Seth, P.; Manchanda, R.; Kumar, A.; Sharma, M.M. Analyzing pressure interference between horizontal wells during fracturing. J. Pet. Sci. Eng. 2021, 204, 108696. [Google Scholar] [CrossRef]
  24. Wang, W.; Yu, W.; Gao, P.; Zeng, B.; Su, Y.; Tang, D.; Huang, H.; Sun, H. Mechanisms and impact patterns of frac hits between shale gas wells. Nat. Gas Ind. 2024, 44, 128–138. [Google Scholar] [CrossRef]
  25. Wang, Q.; Wang, Y.; Hu, Y.; Zhao, J.; Song, Y.; Shen, C. The law of fracture propagation and intersection in zipper fracturing of deep shale gas wells. Pet. Explor. Dev. 2024, 51, 1316–1326. [Google Scholar] [CrossRef]
  26. Gupta, I.; Rai, C.; Devegowda, D.; Sondergeld, C.H. Fracture hits in unconventional reservoirs: A critical review. SPE J. 2021, 26, 412–434. [Google Scholar] [CrossRef]
  27. Liang, Y.; Yang, K.; Yang, Z.; Li, Q.; Chen, Q.; Sun, W. Hydro-mechanical-damage coupling effect of hydraulic fracturing in fractured dual-medium coal masses. Comput. Geotech. 2025, 178, 106909. [Google Scholar] [CrossRef]
  28. Zhao, Y.; Liu, Q.; Zhang, C.; Liao, J.; Lin, H.; Wang, Y. Coupled seepage-damage effect in fractured rock masses: Model development and a case study. Int. J. Rock Mech. Min. Sci. 2021, 144, 104822. [Google Scholar] [CrossRef]
  29. Jirásek, M.; Bauer, M. Numerical aspects of the crack band approach. Comput. Struct. 2012, 110, 60–78. [Google Scholar] [CrossRef]
  30. Zhu, W.C.; Tang, C. Micromechanical model for simulating the fracture process of rock. Rock Mech. Rock Eng. 2004, 37, 25–56. [Google Scholar] [CrossRef]
  31. Tang, C.; Liang, Z.; Zhang, Y.; Chang, X.; Tao, X.; Wang, D.; Zhang, J.; Liu, J.; Zhu, W.; Elsworth, D. Fracture spacing in layered materials: A new explanation based on two-dimensional failure process modeling. Am. J. Sci. 2008, 308, 49–72. [Google Scholar] [CrossRef]
  32. Zhang, B.; Guo, T.; Qu, Z.; Wang, J.; Chen, M.; Liu, X. Numerical simulation of fracture propagation and production performance in a fractured geothermal reservoir using a 2D FEM-based THMD coupling model. Energy 2023, 273, 127175. [Google Scholar] [CrossRef]
  33. Simo, J.C.; Hughes, T.J. Computational Inelasticity; Springer Science & Business Media: Berlin/Heidelberg, Germany, 2006; Volume 7. [Google Scholar]
  34. Wriggers, P.; Laursen, T.A. Computational Contact Mechanics; Springer: Berlin/Heidelberg, Germany, 2006; Volume 2. [Google Scholar]
  35. Needleman, A. A continuum model for void nucleation by inclusion debonding. J. Appl. Mech. 1987, 54, 525–531. [Google Scholar] [CrossRef]
  36. Rutqvist, J.; Wu, Y.-S.; Tsang, C.-F.; Bodvarsson, G. A modeling approach for analysis of coupled multiphase fluid flow, heat transfer, and deformation in fractured porous rock. Int. J. Rock Mech. Min. Sci. 2002, 39, 429–442. [Google Scholar] [CrossRef]
  37. Byerlee, J. Friction of rocks. Pure Appl. Geophys. 1978, 116, 615–626. [Google Scholar] [CrossRef]
  38. Min, K.-B.; Rutqvist, J.; Tsang, C.-F.; Jing, L. Stress-dependent permeability of fractured rock masses: A numerical study. Int. J. Rock Mech. Min. Sci. 2004, 41, 1191–1210. [Google Scholar] [CrossRef]
  39. Zhang, F.; Jiang, Z.; Chen, Z.; Yin, Z.; Tang, J. Hydraulic fracturing induced fault slip and casing shear in Sichuan Basin: A multi-scale numerical investigation. J. Pet. Sci. Eng. 2020, 195, 107797. [Google Scholar] [CrossRef]
  40. Wei, S.; Kao, J.; Jin, Y.; Shi, C.; Xia, Y.; Liu, S. A discontinuous discrete fracture model for coupled flow and geomechanics based on FEM. J. Pet. Sci. Eng. 2021, 204, 108677. [Google Scholar] [CrossRef]
  41. Zhao, C.; Zhang, Z.; Lei, Q. Role of hydro-mechanical coupling in excavation-induced damage propagation, fracture deformation and microseismicity evolution in naturally fractured rocks. Eng. Geol. 2021, 289, 106169. [Google Scholar] [CrossRef]
  42. Xia, Y.; Wei, S.; Deng, Y.; Jin, Y. A new enriched method for extended finite element modeling of fluid flow in fractured reservoirs. Comput. Geotech. 2022, 148, 104806. [Google Scholar] [CrossRef]
  43. Rutqvist, J.; Stephansson, O. The role of hydromechanical coupling in fractured rock engineering. Hydrogeol. J. 2003, 11, 7–40. [Google Scholar] [CrossRef]
  44. Witherspoon, P.A.; Wang, J.S.; Iwai, K.; Gale, J.E. Validity of cubic law for fluid flow in a deformable rock fracture. Water Resour. Res. 1980, 16, 1016–1024. [Google Scholar] [CrossRef]
  45. Rutqvist, J.; Noorishad, J.; Tsang, C.F.; Stephansson, O. Determination of fracture storativity in hard rocks using high-pressure injection testing. Water Resour. Res. 1998, 34, 2551–2560. [Google Scholar] [CrossRef]
  46. Zhu, W.; Wei, C. Numerical simulation on mining-induced water inrushes related to geologic structures using a damage-based hydromechanical model. Environ. Earth Sci. 2011, 62, 43–54. [Google Scholar] [CrossRef]
  47. Bažant, Z.P.; Oh, B.H. Crack band theory for fracture of concrete. Mater. Struct. 1983, 16, 155–177. [Google Scholar] [CrossRef]
  48. Jian, Z.; Lichuang, W. Research on pneumatic fracturing applicated to foundation treatment. J. Ground Improv. 2019, 1, 63–78. [Google Scholar]
  49. Jiao, Y.Y.; Zhang, H.Q.; Zhang, X.L.; Li, H.B.; Jiang, Q.H. A two-dimensional coupled hydromechanical discontinuum model for simulating rock hydraulic fracturing. Int. J. Numer. Anal. Methods Geomech. 2015, 39, 457–481. [Google Scholar] [CrossRef]
  50. Yang, Y.; Tang, X.; Zheng, H.; Liu, Q.; Liu, Z. Hydraulic fracturing modeling using the enriched numerical manifold method. Appl. Math. Model. 2018, 53, 462–486. [Google Scholar] [CrossRef]
  51. Lu, M.; Zhu, Z.; Zhou, L.; Ge, X. Numerical simulation of hydraulic fracture propagation in rock masses with pre-existing double fractures using the phase field method. Rock Soil Mech. 2025, 45, 7. [Google Scholar]
  52. Blanton, T.L. Propagation of hydraulically and dynamically induced fractures in naturally fractured reservoirs. In Proceedings of the SPE Unconventional Resources Conference/Gas Technology Symposium, Louisville, KY, USA, 18 May 1986; SPE: Houston, TX, USA, 1986. [Google Scholar]
  53. Gu, H.; Weng, X.; Lund, J.; Mack, M.; Ganguly, U.; Suarez-Rivera, R. Hydraulic fracture crossing natural fracture at nonorthogonal angles: A criterion and its validation. SPE Prod. Oper. 2012, 27, 20–26. [Google Scholar] [CrossRef]
  54. Warpinski, N.; Teufel, L. Influence of geologic discontinuities on hydraulic fracture propagation (includes associated papers 17011 and 17074). J. Pet. Technol. 1987, 39, 209–220. [Google Scholar] [CrossRef]
  55. Liu, F.; Sun, W.; Li, M.; Shang, X. A smoothed assumed enhanced strain method for frictional contact with constant strain elements. J. Rock Mech. Geotech. Eng. 2024, 16, 4369–4385. [Google Scholar] [CrossRef]
  56. Zhang, S.; Dong, D.; Liao, Q.; Sun, S.; Huang, S.; Guan, Q.; Zhang, C.; Guo, W.; Jiang, S.; Shi, P. Geological characteristics and resource prospect of deep marine shale gas in the southern Sichuan Basin. Nat. Gas Ind. 2021, 41, 35–45. [Google Scholar]
  57. Xu, R.-L.; Guo, T.-K.; Xue, X.-J.; Chen, W.-B.; Qu, Z.-Q.; Chen, M.; Hu, Z.-P. Numerical simulation of fracturing and imbibition in shale oil horizontal wells. Pet. Sci. 2023, 20, 2981–3001. [Google Scholar] [CrossRef]
  58. Lei, Q.; Doonechaly, N.G.; Tsang, C.-F. Modelling fluid injection-induced fracture activation, damage growth, seismicity occurrence and connectivity change in naturally fractured rocks. Int. J. Rock Mech. Min. Sci. 2021, 138, 104598. [Google Scholar] [CrossRef]
  59. Lin, C.; He, J.; Li, X.; Wan, X.; Zheng, B. An experimental investigation into the effects of the anisotropy of shale on hydraulic fracture propagation. Rock Mech. Rock Eng. 2017, 50, 543–554. [Google Scholar] [CrossRef]
  60. Yin, P.-F.; Yang, S.-Q.; Ranjith, P.G. Anisotropic mechanical behaviors of shale rock and their relation to hydraulic fracturing in a shale reservoir: A review. Energies 2024, 17, 1761. [Google Scholar] [CrossRef]
  61. Zhong-xuan, Y.; Luo-yi, Y.; Yang, Y.; Dong, L.; Chao-fa, Z. Overview of fabric anisotropy of soils and constitutive model developments. J. Ground Improv. 2022, 4, 279–288. [Google Scholar]
Figure 1. Constitutive relationships: (a) stress–strain relationship of the rock matrix; (b) normal stiffness–normal stress relationship of natural fractures; (c) damage parameter–strain relationship in the elastic-brittle damage model of the rock material; (d) shear stress–displacement relationship and dilation–shear displacement relationship of natural fractures.
Energies 18 04722 g001
Figure 2. Multiphysics coupling relationships in the fractured rock media model.
Energies 18 04722 g002
Figure 3. Solution workflow of the fully-coupled HMD model.
Energies 18 04722 g003
Figure 4. Comparison of the proposed model’s results with laboratory experiments [49], NMM-based method [50], and phase field method [51] results.
Energies 18 04722 g004
Figure 5. Verification of the proposed HMD model by comparison with the analytical solution.
Energies 18 04722 g005
Figure 6. Comparison of the proposed model’s results with FDEM [25] results.
Energies 18 04722 g006
Figure 7. Numerical results of HF–NF interaction compared with experimental observations [52,53,54].
Energies 18 04722 g007
Figure 8. Model geometry and boundary conditions.
Energies 18 04722 g008
Figure 9. Comparison of the proposed model’s results with smoothed AES results [55] in case 1.
Energies 18 04722 g009
Figure 10. Comparison of the proposed model’s results with smoothed AES results [55] in case 2.
Energies 18 04722 g010
Figure 11. Schematic diagram of the 2D zipper fracturing simulation model for fractured reservoir.
Energies 18 04722 g011
Figure 12. Schematic diagram of model mesh generation: (a) global mesh; (b) local mesh; (c) natural fractures represented by joint elements embedded between adjacent finite elements.
Energies 18 04722 g012
Figure 13. Fracture propagation under different horizontal stress contrasts: (a) after fracturing of the mother well (t = 0.5 h); (b) at the end of the shut-in stage (t = 1 h); (c) after fracturing of the child well (t = 1.5 h).
Energies 18 04722 g013
Figure 14. Fluid pressure evolution under different horizontal stress contrasts: (a) after fracturing of the mother well (t = 0.5 h); (b) at the end of the shut-in stage (t = 1 h); (c) after fracturing of the child well (t = 1.5 h).
Energies 18 04722 g014
Figure 15. Fracture-driven interactions (FDIs) and time to interface (TTI) under different horizontal stress contrasts.
Energies 18 04722 g015
Figure 16. SRV per unit thickness under different horizontal stress contrasts.
Energies 18 04722 g016
Figure 17. Fracture propagation under different fracture approach angles.
Energies 18 04722 g017
Figure 18. Fluid pressure evolution under different fracture approach angles.
Energies 18 04722 g018
Figure 19. FDI situation and time to interface (TTI) under different fracture approach angles.
Energies 18 04722 g019
Figure 20. SRV per unit thickness under different fracture approach angles.
Energies 18 04722 g020
Figure 21. Fracture propagation under different well spacings.
Energies 18 04722 g021
Figure 22. Fluid pressure evolution under different well spacings.
Energies 18 04722 g022
Figure 23. FDI situation and time to interface (TTI) under different well spacings.
Energies 18 04722 g023
Figure 24. SRV per unit thickness under different well spacings.
Energies 18 04722 g024
Figure 25. Fracture propagation under different injection rates.
Energies 18 04722 g025
Figure 26. Fluid pressure evolution under different injection rates.
Energies 18 04722 g026
Figure 27. FDI situation and time to interface (TTI) under different injection rates.
Energies 18 04722 g027
Figure 28. SRV per unit thickness under different injection rates.
Energies 18 04722 g028
Table 1. Model parameters.
Model PropertiesValueUnits
Rock Matrix
Density ρ m 2650 k g / m 3
Young’s modulus E40GPa
Poisson’s ratio υ 0.25-
Tensile strength f t 10MPa
Compressive strength f c 148MPa
Internal friction angle ϕ r 30deg
Residual strength ratio η 0.1-
Initial porosity φ 0 0.01-
Residual porosity φ r 0.001-
Initial permeability k 0 5 × 10 19 m 2
Biot’s coefficient α 0.8-
Fractures
Initial normal stiffness K n 0 50GPa/m
Shear stiffness K s 50GPa/m
Friction angle ϕ f 15deg
Dilation angle ϕ d 3deg
Residual shear displacement u r 5mm
Initial aperture b 0 0.1mm
Residual aperture b r 0.01Mm
Fracturing fluid
Density ρ w 1000 k g / m 3
Viscosity μ w 1 × 10 3 P a · s
Compressibility c w 4.4   × 10 10 P a 1
Disclaimer/Publisher’s Note: The statements, opinions and data contained in all publications are solely those of the individual author(s) and contributor(s) and not of MDPI and/or the editor(s). MDPI and/or the editor(s) disclaim responsibility for any injury to people or property resulting from any ideas, methods, instructions or products referred to in the content.