Article

Influence of Asymmetric Three-Phase Cable Cross-Sections on Conducted Emission Measurements

by
Ludovica Illiano
,
Xinglong Wu
,
Flavia Grassi
* and
Sergio Amedeo Pignari
Department of Electronics, Information and Bioengineering (DEIB), Politecnico di Milano, 20133 Milan, Italy
*
Author to whom correspondence should be addressed.
Energies 2025, 18(17), 4720; https://doi.org/10.3390/en18174720
Submission received: 29 July 2025 / Revised: 28 August 2025 / Accepted: 30 August 2025 / Published: 4 September 2025
(This article belongs to the Section F: Electrical Engineering)

Abstract

This work presents a frequency-domain and modal-domain model to analyze how the length of a three-phase power cable influences conducted emission (CE) voltages measured through a line impedance stabilization network (LISN). The measurement setup considered consists of an equipment under test (EUT) connected to the LISN via a power cable whose cross-section is defined in this study as quadrilateral, namely, four conductors arranged at the corners of a quadrilateral: typically the three phases and the protective earth or neutral conductor. The cable is modeled as a multiconductor transmission line (MTL). To evaluate the system performance both with and without the cable, the concept of voltage insertion ratio (IR) is introduced, defined as the reciprocal of the typical insertion loss. Closed-form expressions are derived for both common mode (CM) and differential mode (DM) emissions. The objective is twofold: to understand under which conditions the LISN measurements overestimate or underestimate the actual emissions at the EUT terminals, and to provide a predictive tool to assess the impact of electrically long cables on CE measurements. The model is validated through numerical simulations of quadrilateral cable configurations considering both a homogeneous and inhomogeneous cross-section, highlighting the need to account for cable length in system design and EMC test interpretation.

1. Introduction

Conducted emission (CE) testing is a standardized method for verifying a product electromagnetic compatibility (EMC) performance. In accordance with the relevant standards, the noise voltages, resolved into common-mode (CM) and differential-mode (DM) components, are measured at the output of a line impedance stabilization network (LISN), ensuring that the measurements are consistent and repeatable. The LISN fixes the source impedance presented to the equipment under test (EUT); ideally, this impedance is a purely resistive 50 Ω load. In recent years, several studies have been devoted to the analysis of CE produced by three-phase systems; in particular, the effects of pulse width modulation (PWM) ac drives have been studied in depth, since these devices have the potential to generate unwanted high frequency noise currents, due to their high output switching change in voltage with time. Foundational studies clarified the physical CE mechanisms in PWM ac drive [1], in induction motors [2], and in electric-vehicle (EV) powertrains [3]. In [4] a comprehensive survey of CM suppression techniques for inverter fed motors emphasizes that any successful mitigation strategy must treat the cable itself as part of the emission path, not merely as an external load. The role of feeder length had already surfaced in the drive modeling study in [5] from the functional point of view, and in [6,7] for what concerns the EMC performance. A high-frequency transmission-line models have explicitly incorporated the distributed parameters of long motor cables is provided in [8], whereas [9] focuses on optimizing the ordering of the signal conductors. Together, these studies underscore the growing interest in understanding how cable length, cross-section, and conductor arrangement affect CE performance in electrical systems. The impact of power cables has also been studied from the CE measurements standpoint, however the proposed analysis techniques and the related analytical or computer-based prediction tools assume electrically-short feeders [10], or are limited to three-conductor systems [11], despite experimental evidence of pronounced length-dependent resonance shifts in EV charging leads [12]. This work points out that voltages picked up at the end of the power cord, where the LISN is arranged, may deeply differ from the true EUT voltages, thus introducing not negligible errors in CE measurements. As a matter of fact, the power cord usually used in testing motors and power supplies results electrically-long in the bandwidth of interest for CE tests. Therefore, due to the propagation effect and mutual coupling between cable wires, CE measurements at the LISN outlet could be not effective in the assessment of the true EUT emissions. Studies primarily focused on the analysis of radiated emissions (RE) have also highlighted the impact of unbalanced LISNs on measurement accuracy [13]. In response, a new prototype of an asymmetric LISN has been proposed, designed to replicate the practical imbalanced terminations observed in real systems while accounting for various cable cross-section configurations [14]. Electromagnetic interference (EMI) filters themselves can induce common- and differential-mode conversion, potentially skewing the CE voltages measured at the LISN ports. For filter design, ref. [15] proposed a compact EMI-source model that predicts CM and DM noise directly at the LISN, whereas ref. [16] represents mode-conversion mechanisms inside the filter by introducing suitable controlled sources. In both studies, the power-line feeder is not modelled explicitly. A deep insight into propagation mechanism along the mains cable is required to develop a prediction model effective in foreseeing the impact of electrically-long feeders on CE measurements. Ref. [17] proposes a frequency-domain multiconductor-transmission-line model that explicitly accounts for insertion ratio when a cyclic symmetric four-conductor feeder becomes electrically long. The same cable topology is also employed in [18] for assessing effects of long feeder cable loading on inverter switching characteristic, and in [19] that puts in evidence the need for cables accurate modeling through transmission line theory in order to account for different cable features. More recently, the quadripolar perspective introduced in [20] showed that breaking the cyclic symmetry assumed in three-wire models is also an issue to be discussed in mitigation of high-frequency electromagnetic disturbances, again pointing to cable geometry as a critical variable. In cyclically symmetric cables, the three phase conductors are arranged with rotational symmetry, while the protective earth (PE) conductor is placed at an equal distance from each of them. This configuration prevents modal conversion: Ideally, CM signals do not transform into DM signals and vice versa, which leads to diagonal modal matrices, as reported in [17]. In contrast, quadrilateral cables place the four conductors at the corners of a quadrilateral, so that the mutual distances are not uniform. The loss of cyclic symmetry introduces coupling between CM and DM, and the transfer matrix becomes fully populated, with significant modal conversion effects. Such quadrilateral-geometry power cables are commonly used in industry, particularly for feeding machines without a neutral conductor. Quadrilateral cables are favored due to their simpler manufacturing process and higher mechanical robustness compared to the more fragile symmetric designs. It is crucial to analyze non-intrinsically balanced structures, because mode conversion strongly affects CE results. This has been discussed in [21], which shows that modifications in cable geometry, such as spacing or asymmetry, cause DM signals to convert into CM noise, demonstrating imbalance as a key factor in CE. Similarly, in [22], it is shown that variations in the length and geometry of main cables are among the main factors influencing inverter CEs. The influence of asymmetries on the accuracy of CE measurements has been thoroughly analyzed in [23], focusing on photovoltaic three-phase inverter system. The quadrilateral cable structure is also employed in [24] in the design study of filters for a three-phase ultra-high-speed motor drive GaN inverter stage.
This work contributes to this line of research by proposing an analytical model that evaluates the impact of electrically long power cables with quadrilateral symmetry on CE measurements. Specifically, the article aims to provide a quantitative description of propagation effects and modal coupling along the cable, expressed in terms of the insertion ratio (IR). The system under analysis consists of an EUT connected to a LISN through a four-conductor quadrilateral symmetric cable. In this context, the IR is defined as the ratio between the phase voltage measured at the LISN terminals, under modal excitation, with the cable present, and the same quantity measured without the cable. The cable is modeled referring to the multiconductor transmission line (MTL). The MTL model provides a balanced compromise, retaining analytical and predictive capabilities, with lower computational cost than full-wave simulations and reduced reliance on measurements compared to black-box approaches, making it well suited for both design and CE compliance analysis related to cable systems. Numerical results, obtained by applying the analytical formulations to cables with specific dimensions and properties, highlight that the presence of the cable can lead to significant deviations between the emissions measured at the LISN and those actually present at the EUT terminals. A comparison is also presented with the results obtained in [17] using a cyclically symmetric cable structure, which offers the benefit of eliminating mode conversion. The objectives are to improve the understanding of propagation mechanisms of conducted emissions, to provide a tool for correctly interpreting measurements in EMC testing, and to predict the range within which these measurements may vary, ensuring an accurate assessment of the cable length impact.
Paper organization is as follows. Section 2 is devoted to develop the CE prediction model, including the representation of the EMI source using a Thevenin equivalent circuit in Section 2.1, the modeling of the LISN as load impedance in Section 2.2, and the description of the quadrilateral cable as a multiconductor transmission line (MTL), with subsections dedicated to the p.u.l. parameters matrices derivation in the homogeneous configuration (2.3.1) and in the non-homogeneous one (2.3.2). Modal quantities involved in CE analysis are defined in Section 3. By introducing a non singular transformation matrix T, closed form expressions of the transfer functions linking phase voltages at the ends of the power cord to the modal quantities in input to the cable are deduced in Section 3.1 in case of homogeneous media, and in Section 3.2 for the inhomogeneous one. Section 4 introduces the concept of voltage insertion ratio, which is useful for quantifying the effect of the cable on emission measurements. Specifically Section 4.1 formally defines the insertion ratio for the quadrilateral structure, considering the presence or absence of the cable, Section 4.2 provides numerical results obtained for a realistic 20-m-long cable, Section 4.3 discusses the influence of cable geometry and surrounding medium on the accuracy of LISN measurements, and Section 4.4 compares the quadrilateral geometry with a cyclically symmetric one, highlighting the implications in terms of mode conversion. Section 5 draws concluding remarks.

2. Circuit Model of CE Setup

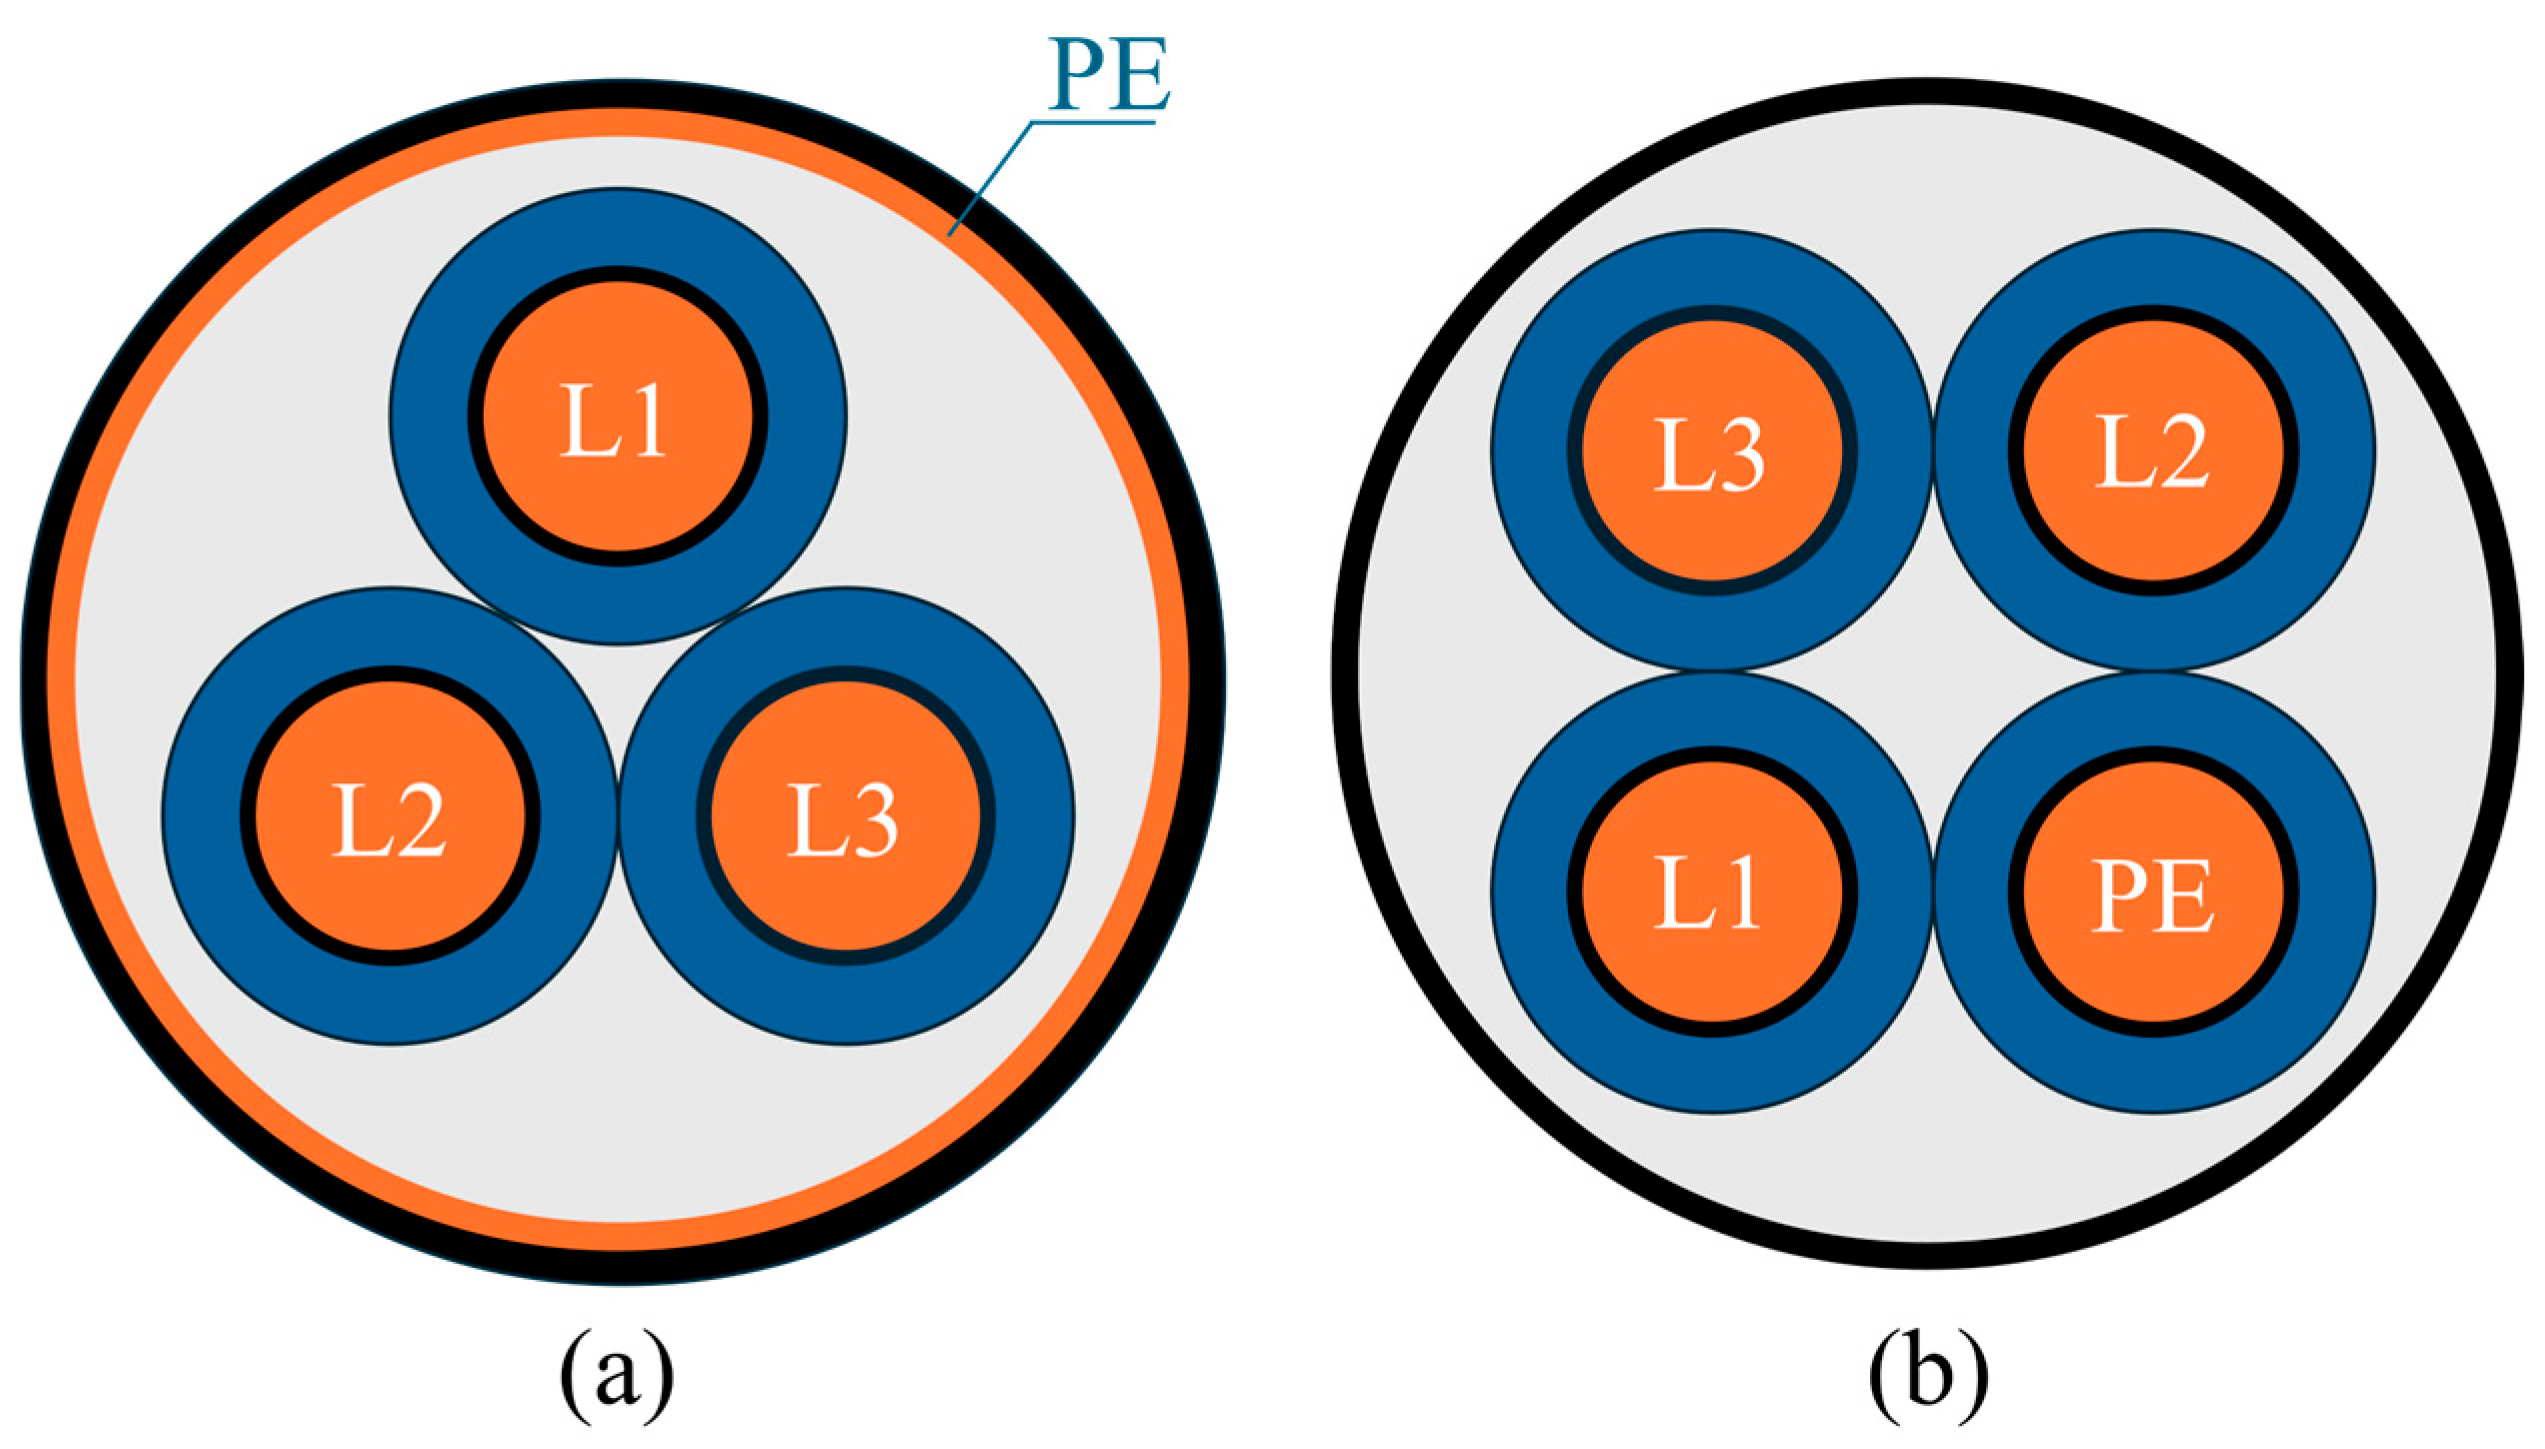
The CE test setup in Figure 1, consists of the EUT connected to the LISN, and hence to the AC net, via a four conductors power cable. In [17] the analysis is developed considering a cyclically symmetric cable structure, as illustrated in Figure 2a. This section provides a summary of the key considerations from [17] concerning the measurement setup and introduces the specific cable configuration analyzed in the present study. In this configuration, the four conductors, typically three phase conductors (L1, L2, L3) and one PE conductor, are arranged at the four corners of an ideal quadrilateral in the cable cross-section, as shown in Figure 2b.

2.1. EMI Source and Power Supply Filter

The EUT acts as a source of EMI and is accounted for by a Thevenin equivalent circuit, characterized by an open-end voltage vector vs. and an internal impedance matrix Zs, defined as
Z S = ( Z S + Z 0 ) Z 0 Z 0 Z 0 ( Z S + Z 0 ) Z 0 Z 0 Z 0 ( Z S + Z 0 ) ,
where Zs is the equivalent short-circuit impedance, assumed to be identical for all conductors, and Z0 is the earth wire impedance.

2.2. LISN and AC Net

The LISN provides standardized impedance terminations for CE measurement. In the analysis, it represents the MTL load and is modeled by a frequency-dependent diagonal matrix ZL, whose elements correspond to the load impedances connected between each phase and the PE wire:
Z L = Z L s 0 0 0 Z L s 0 0 0 Z L s .
The elements ZL(s) depend on the specific circuit layout of the LISN. When adopting the LISN ideal model, these elements are not frequency-dependent and are typically set equal to the input spectrum analyzer impedance R, i.e., 50 Ω.

2.3. Power Supply Cable and Matrix Transfer Fuction

The cable interconnecting the EUT to the LISN is modeled as a uniform, lossless four-conductor transmission line, characterized by the length l and the characteristic impedance matrix Z C . Propagation effects along the power cable are described via the chain parameter matrix Φ , which relates the voltage and current vectors at the LISN terminals V ( l ) , I ( l ) to the corresponding electrical quantities at the EUT mains ports V ( 0 ) , I ( 0 ) , i.e.,
V ( l ) I ( l ) = Φ 11 Φ 12 Φ 21 Φ 22 V ( 0 ) I ( 0 ) ,
where Φ 11 , Φ 12 , Φ 21 , Φ 22 are 3-by-3 sub-matrices of the overall chain parameters matrix Φ . The elements of the voltage vector V ( l ) represent the three phase voltages measured at the end of the MTL with respect to the ground; vector V ( l ) is hereafter denoted simply as V L . A closed-form expression for V L can be obtained by solving the circuit depicted in Figure 1 with respect to V S . By ensuring that the power cord transmission line Equation (3) satisfy the terminal conditions imposed by the LISN equations, V L = Z L I ( l ) , and the EMI source terminal equations, V ( 0 ) = V S Z S I ( 0 ) , vector V L can be expressed in terms of the open-circuit source voltages V S as
V L = H V S ,
where matrix H is given by
H = Z L   ( Φ 12 Φ 11   Z L ) 1 ,
when the internal impedance matrix Z S = 0 . However, when Zs assumes the structure defined in (1), the corresponding matrix H can be expressed as follows:
H = Φ 11 + Φ 12 Φ 11 Z S Φ 11 Z L Φ 21 Z S + Z L Φ 22 Φ 12 1 Φ 11 Z L Φ 21 .
The solution of (6) requires the knowledge of the MTL per-unit-length inductances and capacitances matrices, namely L and C . In free space, hence homogeneous medium, these matrices satisfy the relation
L C = C L = 1 c 0 2 1 3 ,
where c 0 is the speed of light in free space and 1 3 is the 3-by-3 identity matrix. Under this condition, the MTL characteristic impedance matrix simplifies to Z C = c 0 L and the propagation constants of the three lines are all equal to γ 0 = j ω / c 0 . Based on these definitions, the elements of the chain-parameters matrix Φ result to be:
Φ 11 = Φ 22 = cosh ( γ 0 l ) 1 3 ; Φ 12 = sinh ( γ 0 l ) Z C ; Φ 21 = sinh ( γ 0 l ) Z C 1 .
Equations (5) and (6) will be solved by explicitly expressing the power cord characteristic impedance matrix and the propagation constants in terms of cables p.u.l. parameters, in order to outline the dependence on cross-section geometrical properties. For clarity and to streamline the discussion, these derivations are provided in Appendix A. The p.u.l. parameters of the cable with quadrilateral structure, considering both homogeneous and inhomogeneous surrounding media, are presented in the following sections.

2.3.1. Lossless Homogeneous Medium: Quadrilateral Structure

Considering the cross-section of the four-core cable illustrated in Figure 2b, and adopting the wire numbering shown in the figure, the p.u.l. inductance matrix L takes the following form:
L = L α L γ L δ L γ L α L δ L δ L δ L β .
The knowledge of approximate expressions for the p.u.l. inductances parameters enables to obtain further relationships among L α , L β , L γ , and L δ . If d w defines the distance between the centres of two wires belonging to the same side of the square, while r w and r w 0 denote the radii of the phase conductors and the PE wire, respectively, the p.u.l. inductances in free space result to be:
L α = μ 0 2 π ln d w 2 r w r w 0 , L β = μ 0 2 π ln 2 d w 2 r w r w 0 L γ = μ 0 2 π ln d w 2 r w 0 L δ = μ 0 2 π ln 2 d w r w 0
By imposing r w = r w 0 in (10), the following relationships are found:
L β = 2 L δ ;   L γ = L α L δ .
While (10) holds under the assumption of wide separation between conductors ( d w / r w > 5 ), the relationships in (11) remain valid even when conductors are closely spaced, as they are derived from the geometric configuration of the cable cross-section. Ref. [25] provides formulas for p.u.l. self and mutual parameters even at short distances, and constitutes a solid basis for validating the formulation presented. Therefore, regardless of the relative distance among the wires, L takes the following form:
L = L α L α L δ L δ L α L δ L α L δ L δ L δ 2 L δ .
In the case of homogeneous media, it is not necessary to explicitly specify the p.u.l. capacitance matrix, which can be derived from (7). The propagation constants and characteristic impedances required for computing the elements of the chain parameters matrix used in the transfer function calculations are presented in the Appendix A.1.

2.3.2. Lossless Inhomogeneous Medium: Quadrilateral Structure

In inhomogeneous surrounding media, the evaluation of the MTL characteristics impedances matrix and the corresponding propagation constants requires the knowledge of both the p.u.l. inductances matrix, given by (12), and the p.u.l. capacitances matrix C
C = C α C γ C δ C γ C α C δ C δ C δ C α ,
where C γ = C α + 2 C δ . Therefore, the p.u.l. inductances and capacitances matrices for an inhomogeneous medium take the form:
L = L α L α L δ L δ L α L δ L α L δ L δ L δ 2 L δ ,   C = C α C α + 2 C δ C δ C α + 2 C δ C α C δ C δ C δ C α
The calculations of the propagation constants and characteristic impedances are provided in the Appendix A.2. In this case, two distinct propagation constants are obtained; and the characteristic impedance matrix is fully populated, as expected given the cable cross-section.

3. Definition of Modal Quantities

CE analysis will be carried out in modal domain, by decoupling the EUT emissions in their CM and DM components. This approach is motivated by the fact that international EMC standards specify CE limits in terms of modal quantities. The first step in decoupling the MTL equations involves the choice of a non-singular transformation matrix T , which allows to express the three phase currents (voltages) vector I = [ I 1 I 2 I 3 ] T ( V = [ V 1 V 2 V 3 ] T ) in terms of the corresponding modal currents (voltages) set I m = [ I C I D 1 I D 2 ] T ( V m = [ V C V D 1 V D 2 ] T ), by means of the similarity transformation I = T I m ( V = T V m ). Subscripts C and D in the modal vectors denote CM and DM components, respectively. The choice of T is not unique [26,27], but it must fulfill two requirements: T must be non singular, and the modal currents vector I m must satisfy Kirchoff’s nodal law at each section of the line. Given the previous requirements, the transformation matrix T is defined as follows:
T = 1 1 0 1 0 1 1 1 1 ,     T 1 = 1 3 1 1 1 2 1 1 1 2 1 .
The relationship between modal source voltages, V S m , and modal voltages V L m measured at the end of the MTL, can be expressed by applying the modal transformation to (6):
V L m = H m V S m ,       H m = T 1 H   T .
The effects of electrically-long feeders on CE measurements are quantified in the modal domain, provided that the elements of the matrix H m are known. This matrix, which relates CM and DM voltages measured at the MTL ends, is generally full (i.e., non-diagonal) and can be expressed as follows:
H m = h C h C , D 1 h C , D 2 h D 1 , C h D 1 h D 1 , D 2 h D 2 , C h D 2 , D 1 h D 2 .
The diagonal elements express the CM/DM voltages at the end of the MTL, excited by the corresponding CM/DM sources. In contrast, the out-diagonal elements represent modal conversion from CM to DM quantities and vice-versa. If the modal quantities propagate separately along the power-cord, the matrix H m becomes diagonal. This occurs either if the cable is electrically-short or when its cross-section satisfies suitable symmetry [17]. To evaluate the contribution of each modal source voltage to the phase voltages measured at the LISN ports, the matrix H S m is introduced as follows:
V L = H T V S m = H S m V S m ,   V L 1 V L 2 V L 3 = h C , 1 h D 1 , 1 h D 2 , 1 h C , 2 h D 1 , 2 h D 2 , 2 h C , 3 h D 1 , 3 h D 2 , 3 V S C V S D 1 V S D 2 .
As a result of adopting the source voltage decomposition defined by (15), the elements h D 1 , 2 and h D 2 , 1 result to be null if modal quantities propagate separately along the power cord (i.e., for electrically-short cables). Conversely, for electrically-long feeders that lack the aforementioned symmetric properties matrix, mode conversion takes place, and H S m becomes fully populated. In the following, the modal decomposition in (18) is applied to the cable, considering both homogeneous and inhomogeneous surrounding media, in order to derive the parameters of the transfer function matrix H S m .

3.1. Lossless Homogeneous Medium: Transfer Function Matrix

If the surrounding medium is homogeneous, i.e., free-space, CM and DM quantities propagate along the cable with the same propagation constant γ 0 = j ω / c 0 and the sub-matrices of the chain parameters matrix Φ can be expressed using the relations in (8). By neglecting the internal source impedance ( Z S = 0 ), the relationship between modal source voltages and phase voltages at the MTL-ends is obtained by exploiting (5) and (18). Under these assumptions, the elements of H S m take the following expressions:
h C , 1 = h C , 2 = R 4 R cosh γ 0 l + Z C , C 2 Z C , C D sinh γ 0 l D h C , 3 = R 4 R cosh γ 0 l + Z C , C + 10 Z C , C D sinh γ 0 l D h D 1 , 3 = h D 2 , 3 = 4 R R cosh γ 0 l + Z C , C + Z C , C D sinh γ 0 l D h D 1 , 1 ( D 2 , 2 ) = 4 R 4 R 2 cosh 2 γ 0 l + 5 Z C , C 4 Z C , C D R cosh γ 0 l sinh γ 0 l + Z C , C 2 Z C , C Z C , C D 2 Z C , C D 2 sinh 2 γ 0 l D 4 R cosh γ 0 l + Z C , C 2 Z C , C D sinh γ 0 l h D 1 , 2 = h D 2 , 1 = 12 R Z C , C D sinh γ 0 l 2 R cosh γ 0 l + Z C , C 2 Z C , C D sinh γ 0 l D 4 R cosh γ 0 l + Z C , C 2 Z C , C D sinh γ 0 l
where:
D = 4 R 2 cosh 2 γ 0 l + 5 Z C , C + 2 Z C , C D R cosh γ 0 l sinh γ 0 l + Z C , C + 4 Z C , C D Z C , C 2 Z C , C D sinh 2 γ 0 l
It is worth noting that elements h D 1 , 2 and h D 2 , 1 are multiplied by sinh γ 0 l , which is consistent with the fact that modes conversion does not take place along electrically-short feeders, where γ 0 l 0 . Previous results are still valid in homogeneous media characterized by relative permeability μ r and permittivity ε r provided that c 0 is replaced by the propagation velocity in the analyzed medium, v = c 0 / ε r μ r .

3.2. Lossless Inhomogeneous Medium: Transfer Function Matrix

Considering the propagation constants and the characteristic impedances derived in Appendix A.2 and neglecting the internal source impedance ( Z S = 0 ) the elements of the matrix transfer function H S m , defined in (18), are given by:
h C , 1 = h C , 2 = R 2 R cosh γ 1 l + cosh γ 2 l + Z 2 sinh γ 2 l D a h C , 3 = R 4 R cosh γ 1 l + 2 Z 1 sinh γ 1 l Z 2 sinh γ 2 l D a h D 1 , 3 = h D 2 , 3 = 2 R 2 R cosh γ 1 l + Z 1 sinh γ 1 l + Z 2 sinh γ 2 l D a h D 1 , 1 = h D 2 , 2 = 2 R 3 R cosh ( γ 2 l ) + Z 2 sinh ( γ 2 l ) 2 R 2 cosh 2 ( γ 2 l ) + Z 1 Z 2 sinh ( γ 1 l ) sinh ( γ 2 l ) + + 2 R Z 1 sinh ( γ 1 l ) cosh ( γ 2 l ) + Z 2 sinh ( γ 2 l ) cosh ( γ 1 l ) D a 4 R cosh ( γ 2 l ) + Z 2 sinh ( γ 2 l ) h D 1 , 2 = h D 1 , 2 = 2 R 3 R cosh ( γ 2 l ) + Z 2 sinh ( γ 2 l ) 2 R 2 cosh 2 ( γ 2 l ) Z 1 Z 2 sinh ( γ 1 l ) sinh ( γ 2 l ) + 2 R Z 1 sinh ( γ 1 l ) cosh ( γ 2 l ) + 2 Z 2 sinh ( γ 2 l ) cosh ( γ 1 l ) 8 R 2 cosh ( γ 1 l ) cosh ( γ 2 l ) D a 4 R cosh ( γ 2 l ) + Z 2 sinh ( γ 2 l )
where:
D a = 4 R 2 cosh γ 1 l cosh γ 2 l + R 2 Z 1 sinh γ 1 l cosh γ 2 l + 3 Z 2 sinh γ 2 l cosh γ 1 l + Z 1 Z 2 sinh γ 1 l sinh γ 2 l
It should be emphasized that at low frequencies, i.e., for l / λ < < 1 , h D 1 , 2 = h D 1 , 2 = 0 , consistent with the fact that there is no mode conversion. Finally, closed-form expressions for the elements of H S m , accounting for the internal source impedance ( Z S 0 ), have been derived in Section 4.1.

4. Cable Insertion Ratio

The impact of electrically-long feeders on CE levels is investigated by resorting to the concept of insertion ratio I R , a metric traditionally employed in network analysis for characterizing two-port networks. The insertion ratio is the reciprocal of the insertion loss (IL) and provides a measure of how the presence of a two-port network affects power transfer. IL parameters are defined in [28], and are employed to characterize both filters and passive components in general. Its practical application as an efficiency metric is illustrated in [29], where equations are derived for EMI filters in power electronic systems such as switched-mode power supplies. Another example is given in [30], which introduces an automated optimization procedure to enhance EMI filter design considering IL as the reference parameter. Generally, I R compares the power delivered to the load when the two-port network is present to the power delivered when the two-port network is removed. Accordingly, I R can be defined both in terms of the power delivered to the load and equivalently in terms of voltage across the load, as follows:
I R dBm   = 10   log 10 P l o a d W P l o a d W O ;   I R dB = 20   log 10 V l o a d W V l o a d W O ,
where subscripts W and WO refer to the case in which the two-port network is present and removed, respectively. I R proves to be an effective parameter in evaluating the effect of the cable electrical length on CE levels. Indeed by means of I R voltages picked up at the LISN outlets when the EUT is fed via an electrically long cable are compared against the same voltages measured when the power cord is electrically short. Throughout the reminder of this paper, the following definition of I R will be exploited:
I R M T L dB = 20   log 10 V L W V L W O ,
where V L W represents the voltage at the LISN in presence of (with) the power cord, whereas V L W O denotes the same quantity in absence of (without) the cable, i.e., for l / λ 0 .
I R M T L enables the assessment of how effective are measurements carried-out at the LISN outlets in quantifying the true EUT CE levels. If I R > 0 , the voltages measured at the LISN ports overestimate the true CE, while if I R < 0 the true EUT emissions appear reduced when observed at the LISN ports. In the following, closed-form expressions for I R M T L are derived for the quadrilateral cable cross-sections of Figure 2b.

4.1. Cable Insertion Ratio, IRMTL: Quadrilateral Structure

Along a quadrilateral cable, mode conversion occurs and the modal voltages measured at the end of the MTL are excited by both CM and DM voltage sources. According to the analysis developed in Section 3.1 and Section 3.2, the focus is on evaluating the impact of modal sources on the phase voltages at the cable termination. This is achieved by comparing the voltages measured across the LISN in the presence of the power cord with those obtained when the cable is removed. When the cable feeding the EUT results to be electrically- short, the matrix transfer function H S m , defined in (18), reduces to:
H S m W O = R Z S C + R R Z S D + R 0 R Z S C + R 0 R Z S D + R R Z S C + R R Z S D + R R Z S D + R .
In this case, a full matrix I R M T L is obtained by dividing each element of H S m , whose elements are evaluated with Z S 0 and with the power cord in place (W), by the corresponding element of H S m W O :
I R M T L = I R C , 1 M T L I R D 1 , 1 M T L I R D 2 , 1 M T L I R C , 2 M T L I R D 1 , 2 M T L I R D 2 , 2 M T L I R C , 3 M T L I R D 1 , 3 M T L I R D 2 , 3 M T L = h C , 1 Z S C + R R h D 1 , 1 Z S D + R R h C , 2 Z S C + R R h D 2 , 2 Z S D + R R h C , 3 Z S C + R R h D 1 , 3 Z S D + R R h D 2 , 3 Z S D + R R
Bounds for IR are determined by assigning limiting values, either zero or infinity, to the modal source impedances, Z S C and Z S D . By imposing Z S = 0 the I R matrix elements take the following form:
I R C , 1 M T L Z S = 0 = I R C , 2 M T L Z S = 0 = h C , 1 I R C , 3 M T L Z S = 0 = h C , 3
I R D 1 , 1 M T L Z S = 0 = I R D 2 , 2 M T L Z S = 0 = h D 1 , 1 I R D 1 , 3 M T L Z S = 0 = I R D 2 , 3 M T L Z S = 0 = h D 1 , 3
where h C , 1 , h C , 3 , h D 1 , 3 and h D 1 , 1 are evaluated by neglecting the internal source impedances, as described in (19) and (20). Conversely, when the internal source impedances are significantly larger than the characteristic impedances of the line, the entries of I R M T L are obtained as the limiting values of (24) for Z S X :
I R C , 1 M T L = I R C , 2 M T L = 2 R Z 2 sinh γ 1 l + Z 1 sinh γ 2 l + Z 1 Z 2 cosh γ 2 l D r I R C , 3 M T L = Z 2 4 R sinh γ 1 l + 2 Z 1 cosh γ 1 l Z 1 cosh γ 2 l D r I R D 1 , 3 M T L = I R D 2 , 3 M T L = Z 2 Z 1 cosh γ 2 l + 2 R sinh γ 1 l + Z 1 cosh γ 1 l 2 D r I R D 1 , 1 M T L = I R D 2 , 2 M T L = 2 R Z 2 Z 1 cosh γ 1 l sinh γ 2 l + cosh γ 2 l Z 2 sinh γ 1 l + 3 Z 1 sinh γ 2 l + Z 1 Z 2 2 cosh γ 2 l cosh γ 1 l + cosh γ 2 l + 8 R 2 sinh 2 γ 2 l 2 D r 4 R sinh γ 2 l + Z 2 cosh γ 2 l
with:
D r = 3 R sinh γ 1 l + Z 1 cosh γ 1 l 2 R sinh γ 2 l + Z 2 cosh γ 2 l 2 R 2 sinh γ 1 l sinh γ 2 l
For the homogeneous case, i.e., bare conductors in free-space, closed-form expressions of the entries of I R M T L are obtained by imposing γ 1 = γ 2 = γ 0 in (25).

4.2. Representative Numerical Results

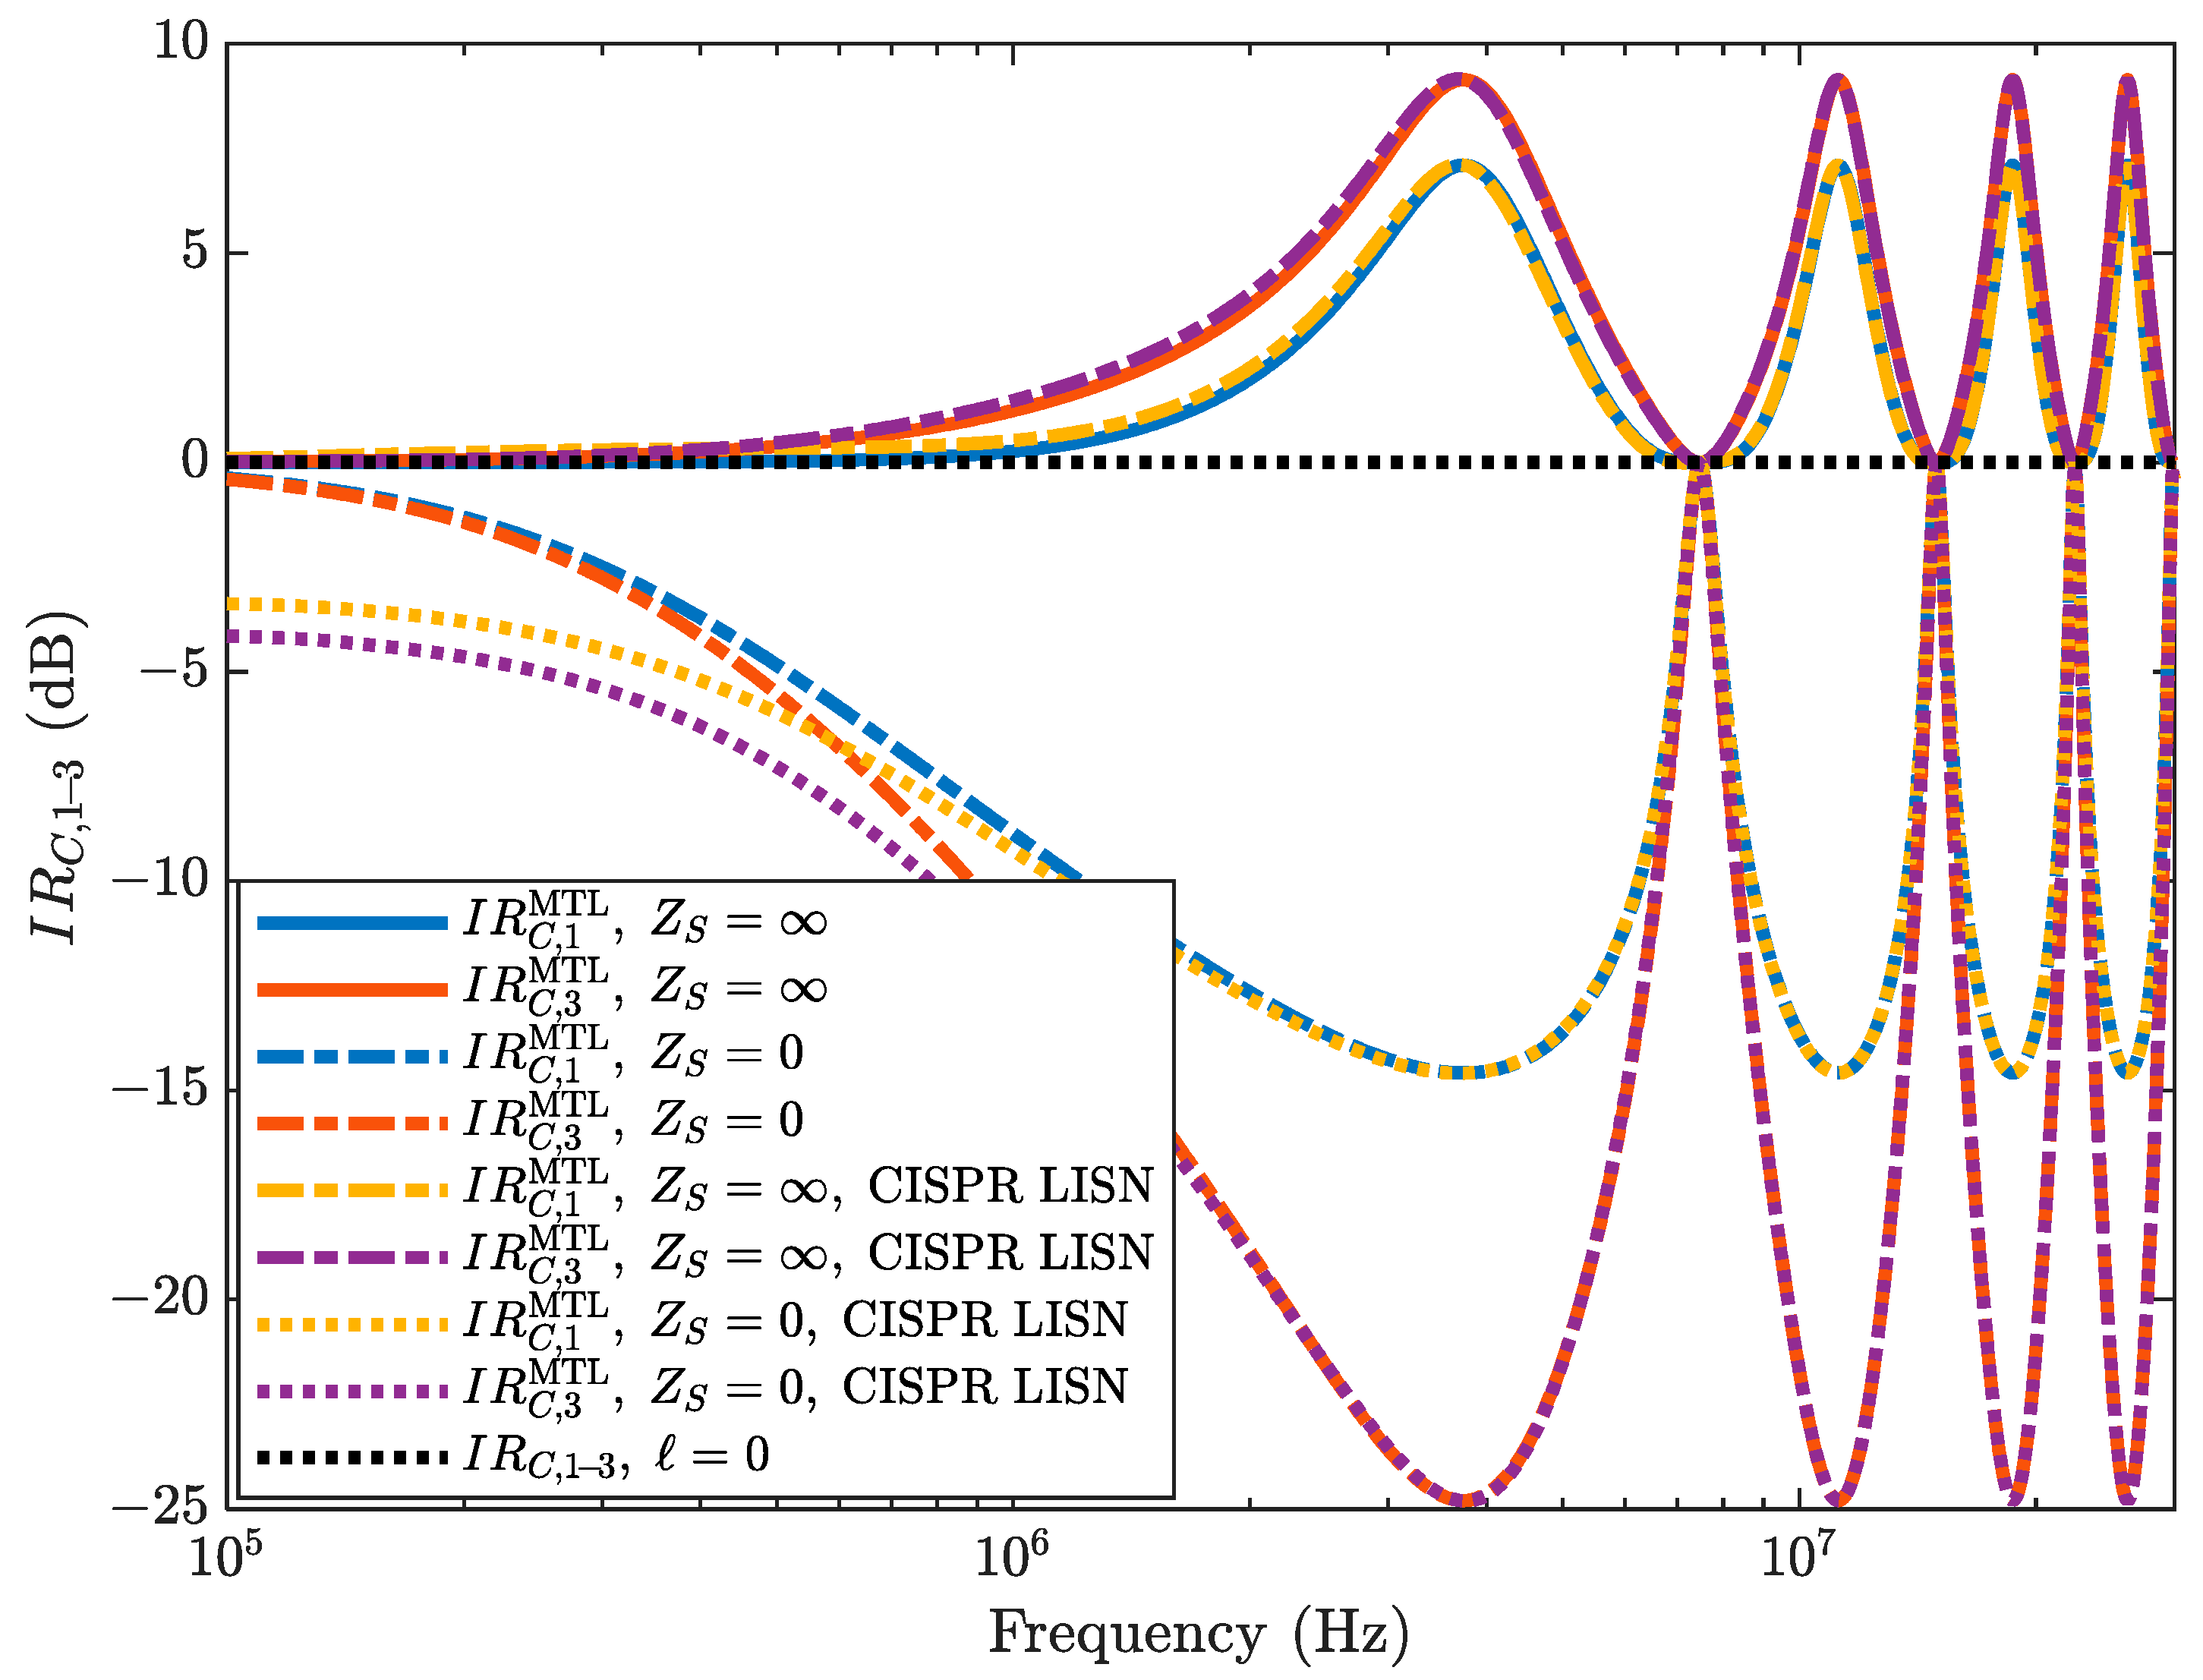
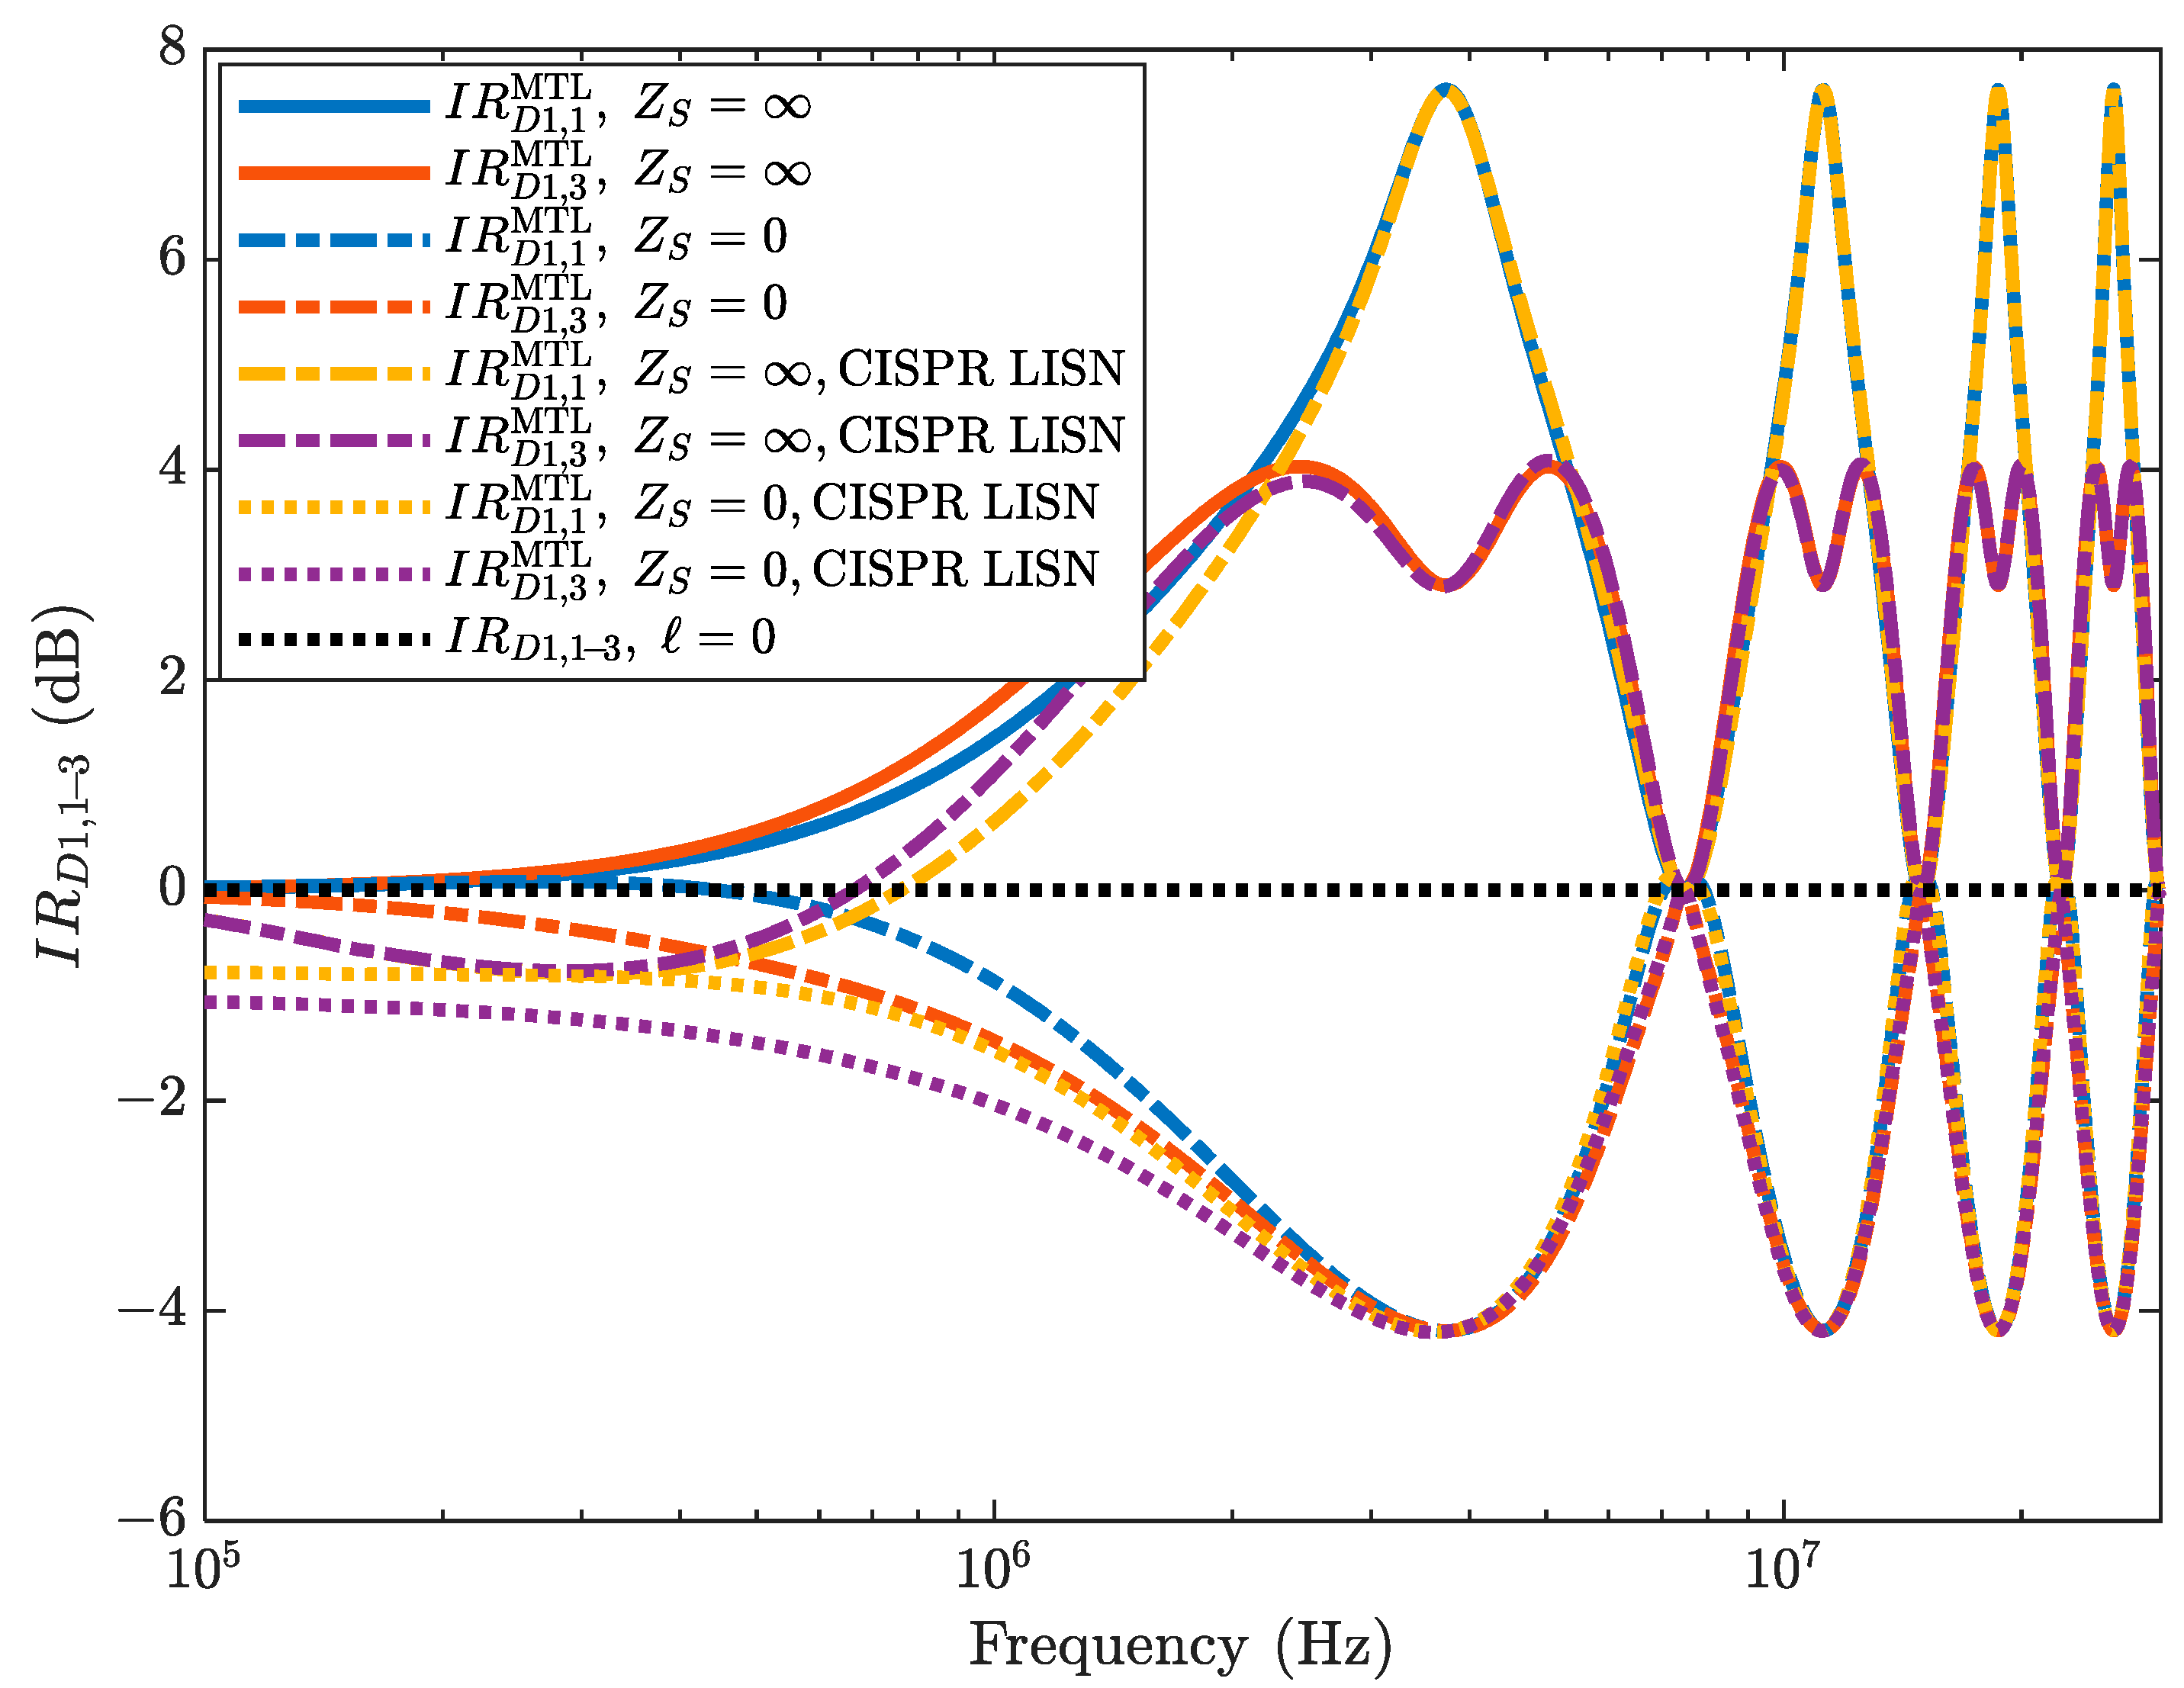
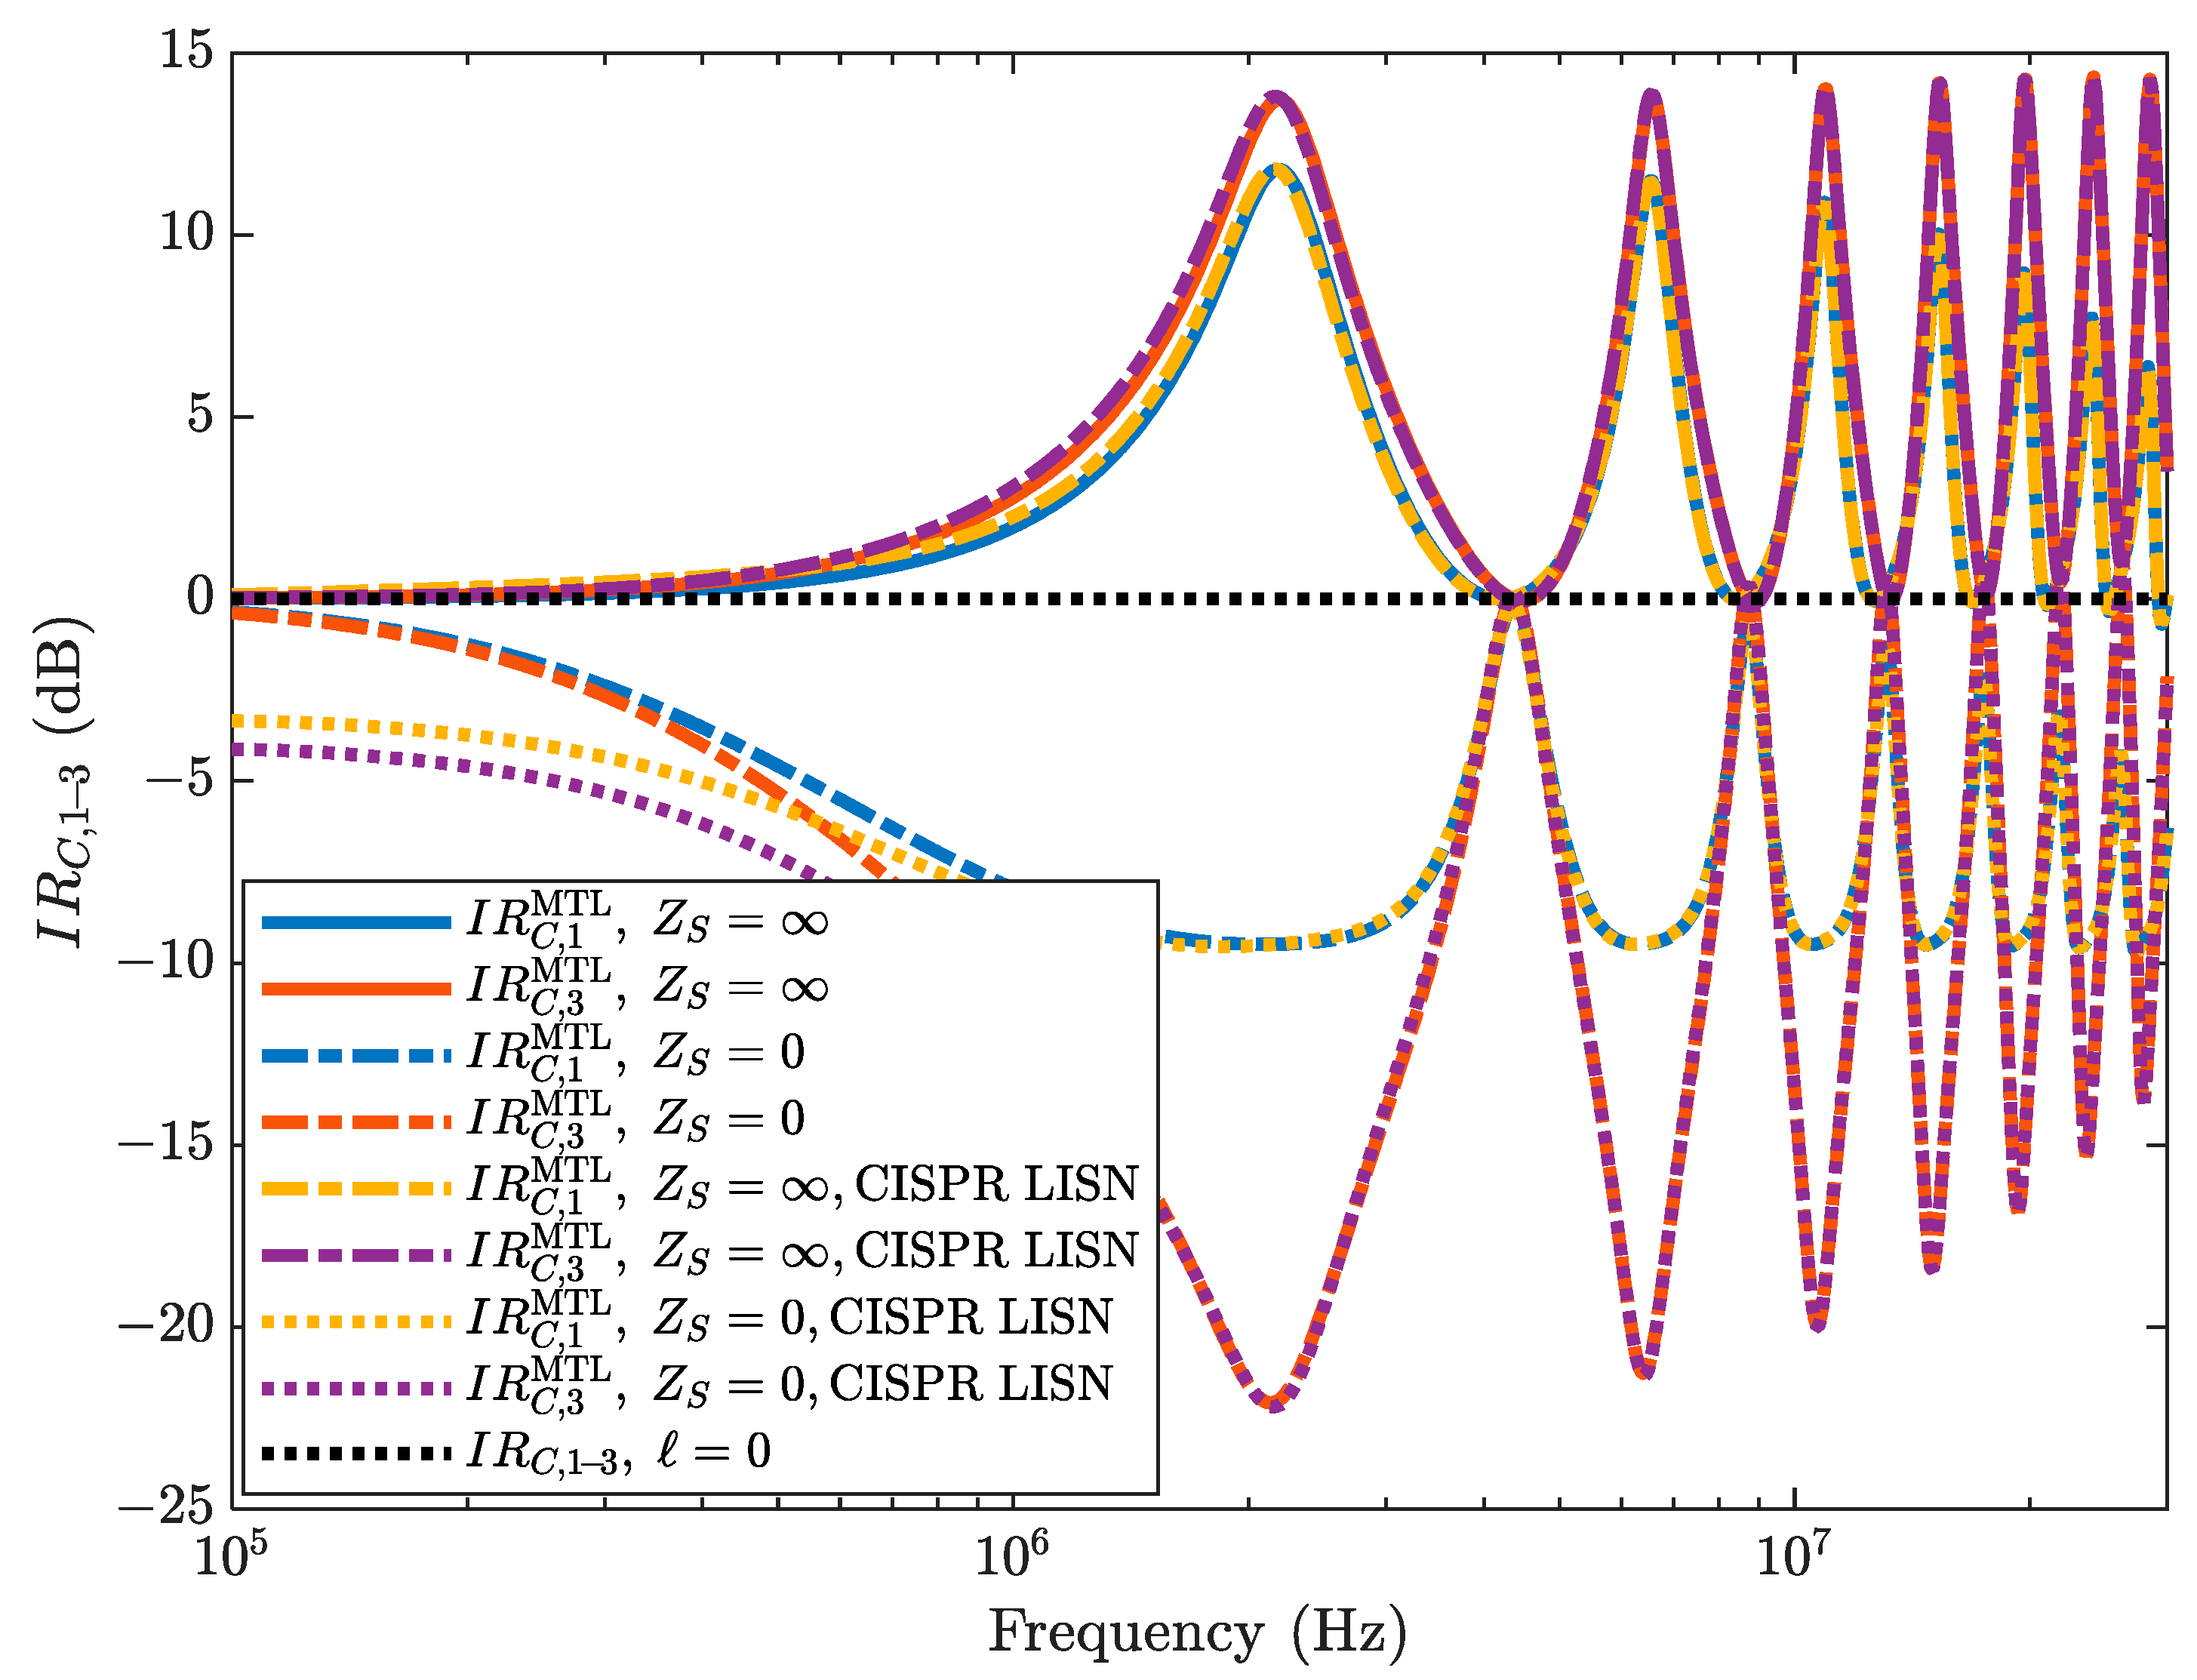
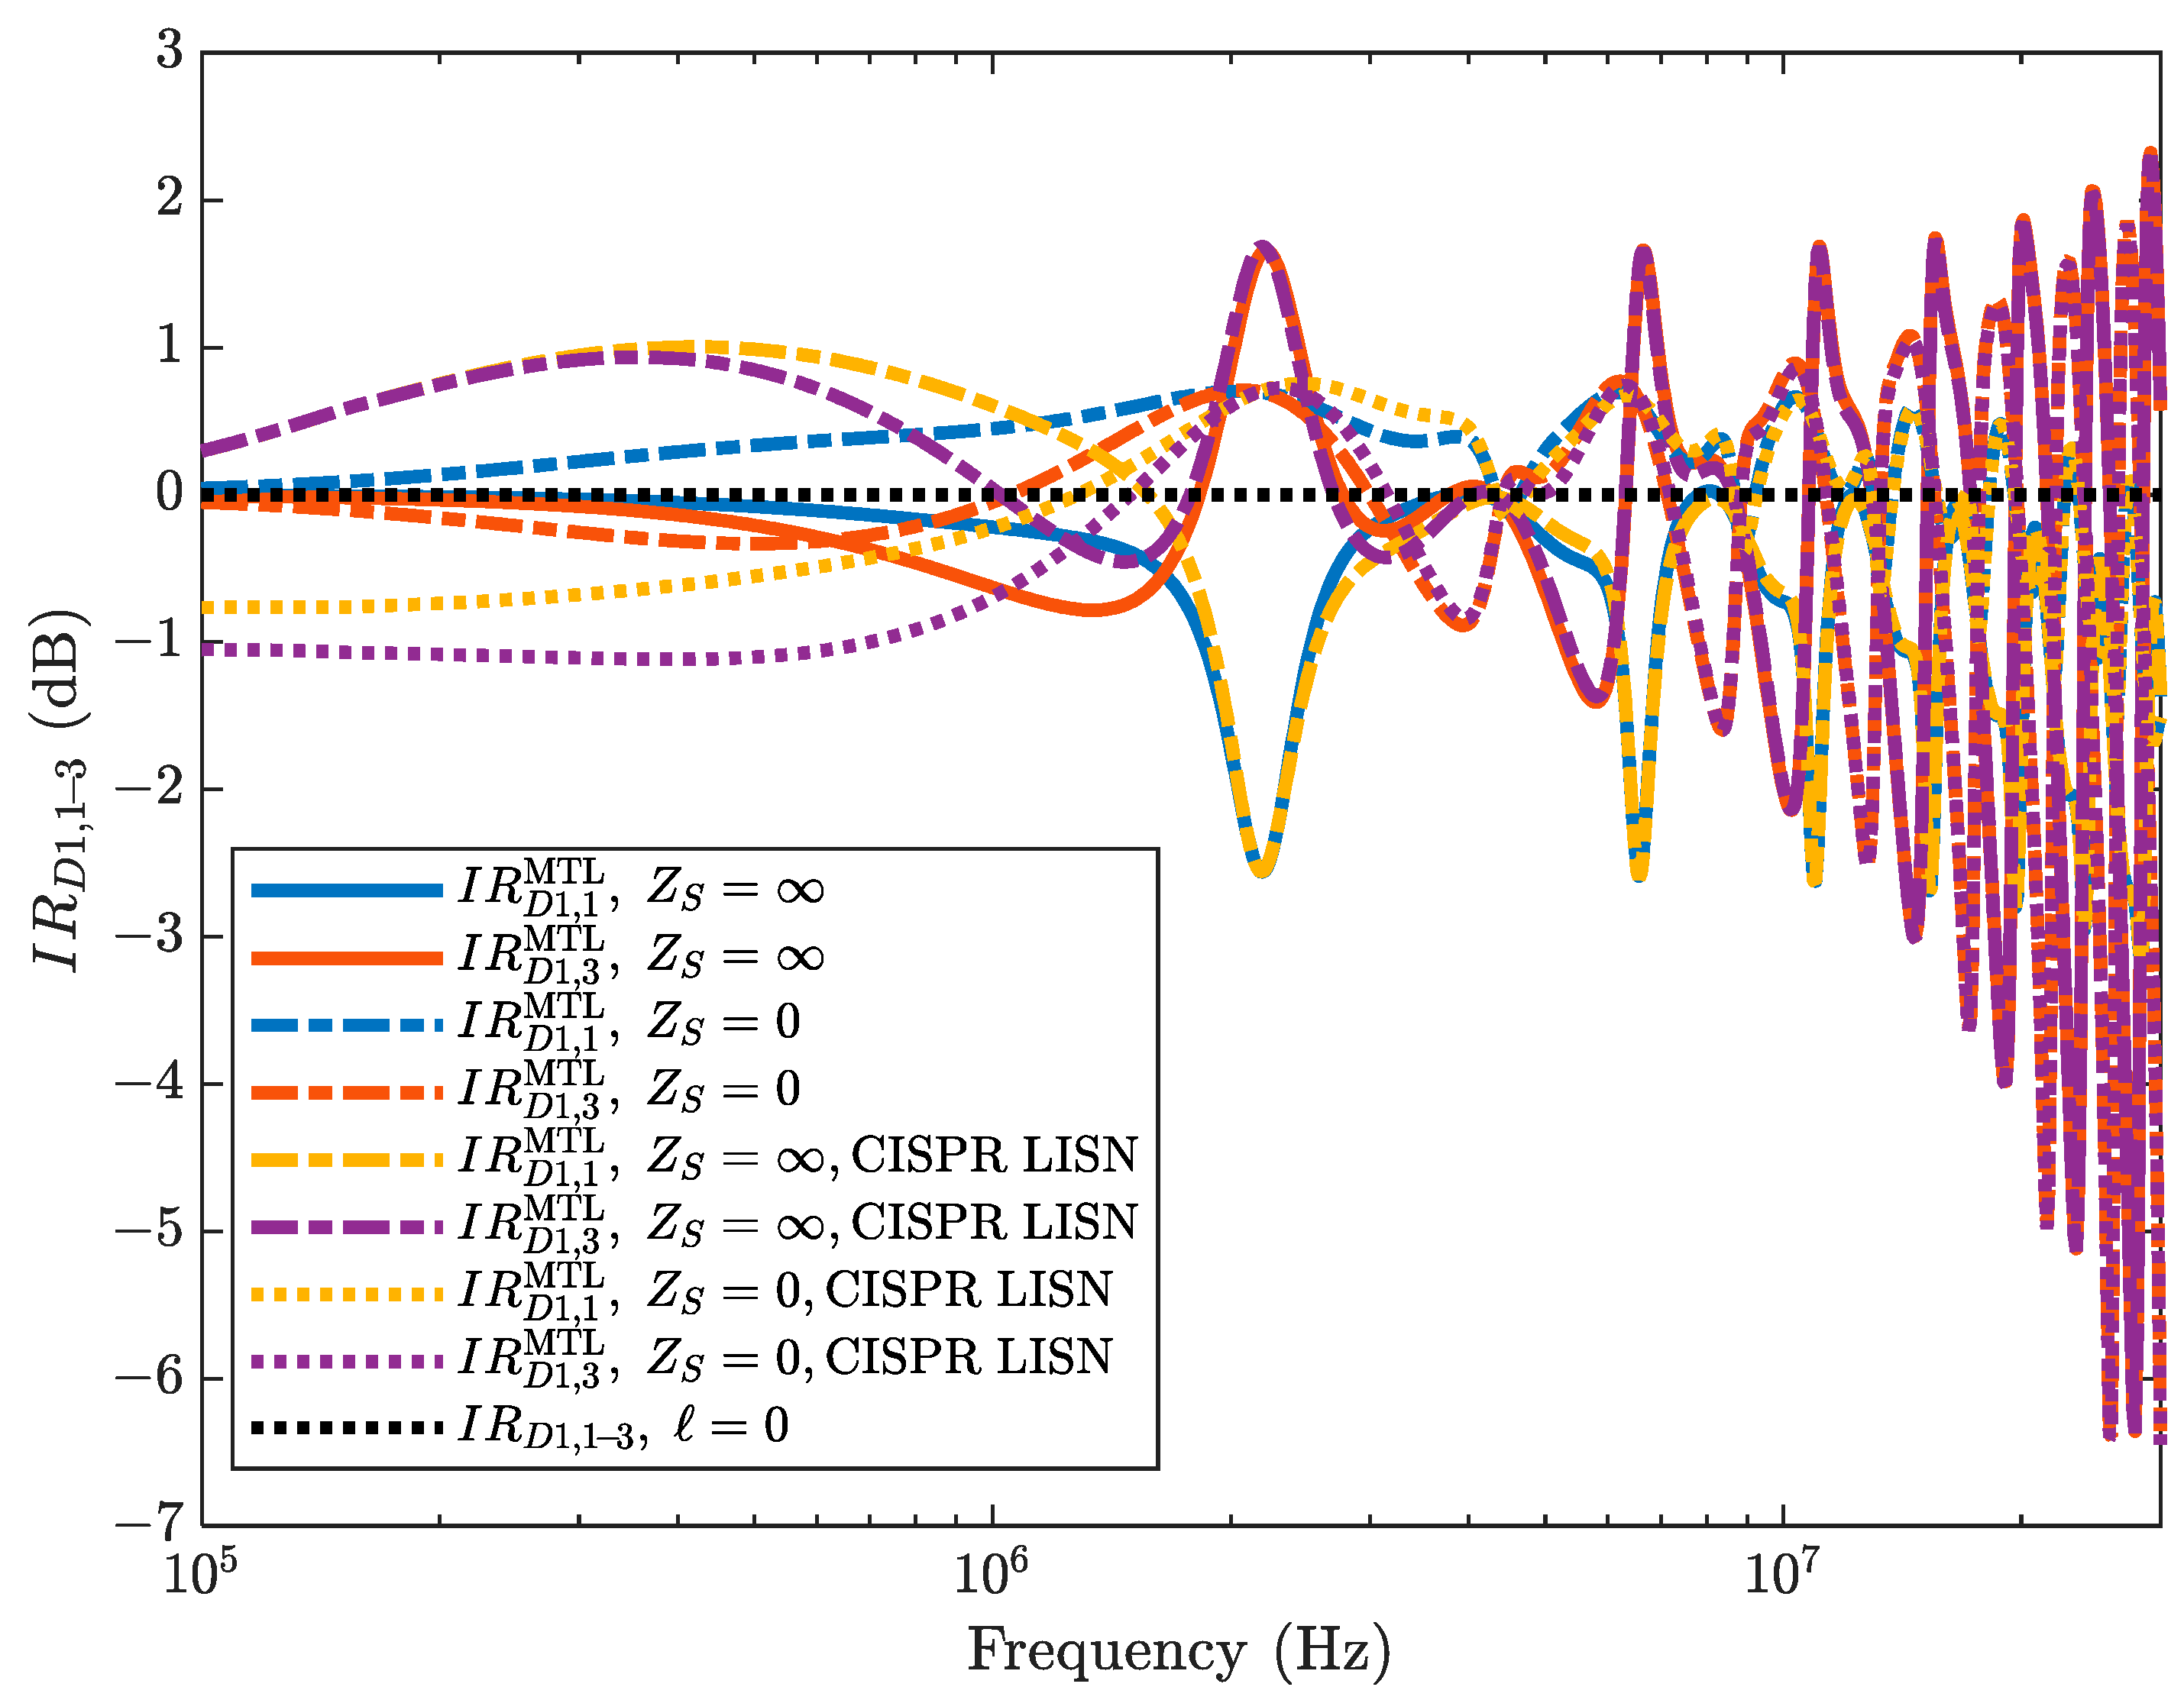
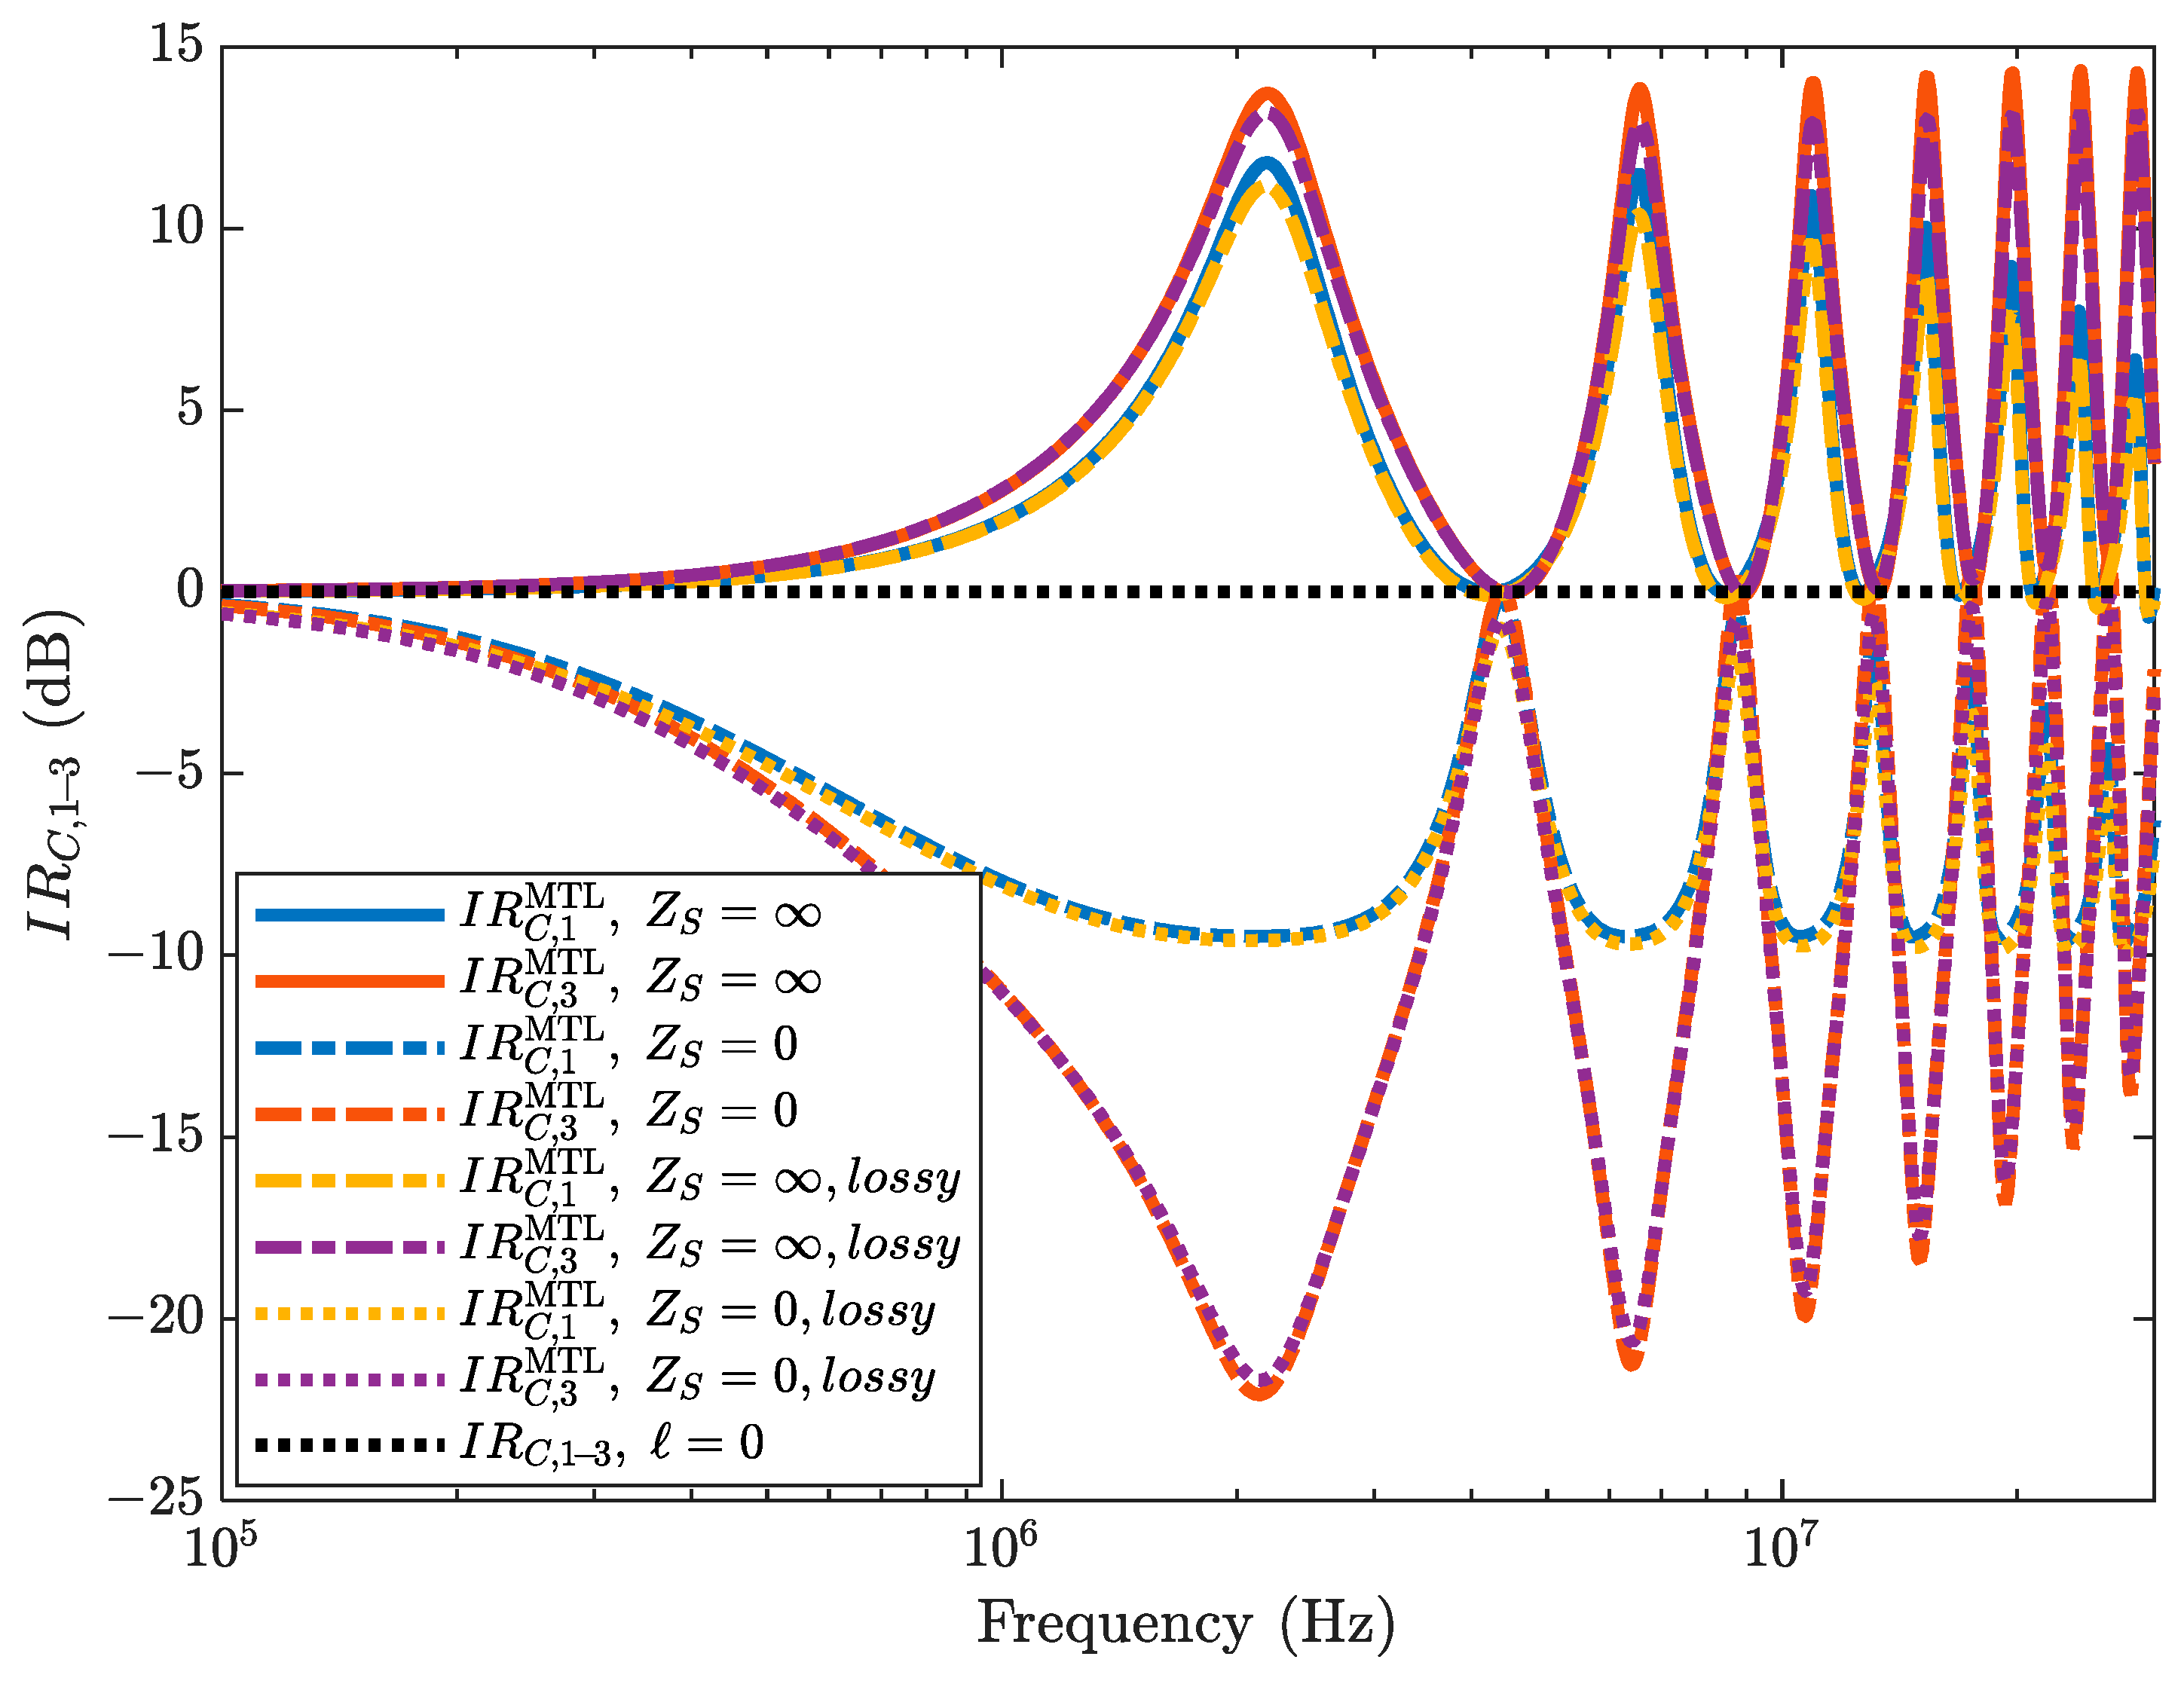
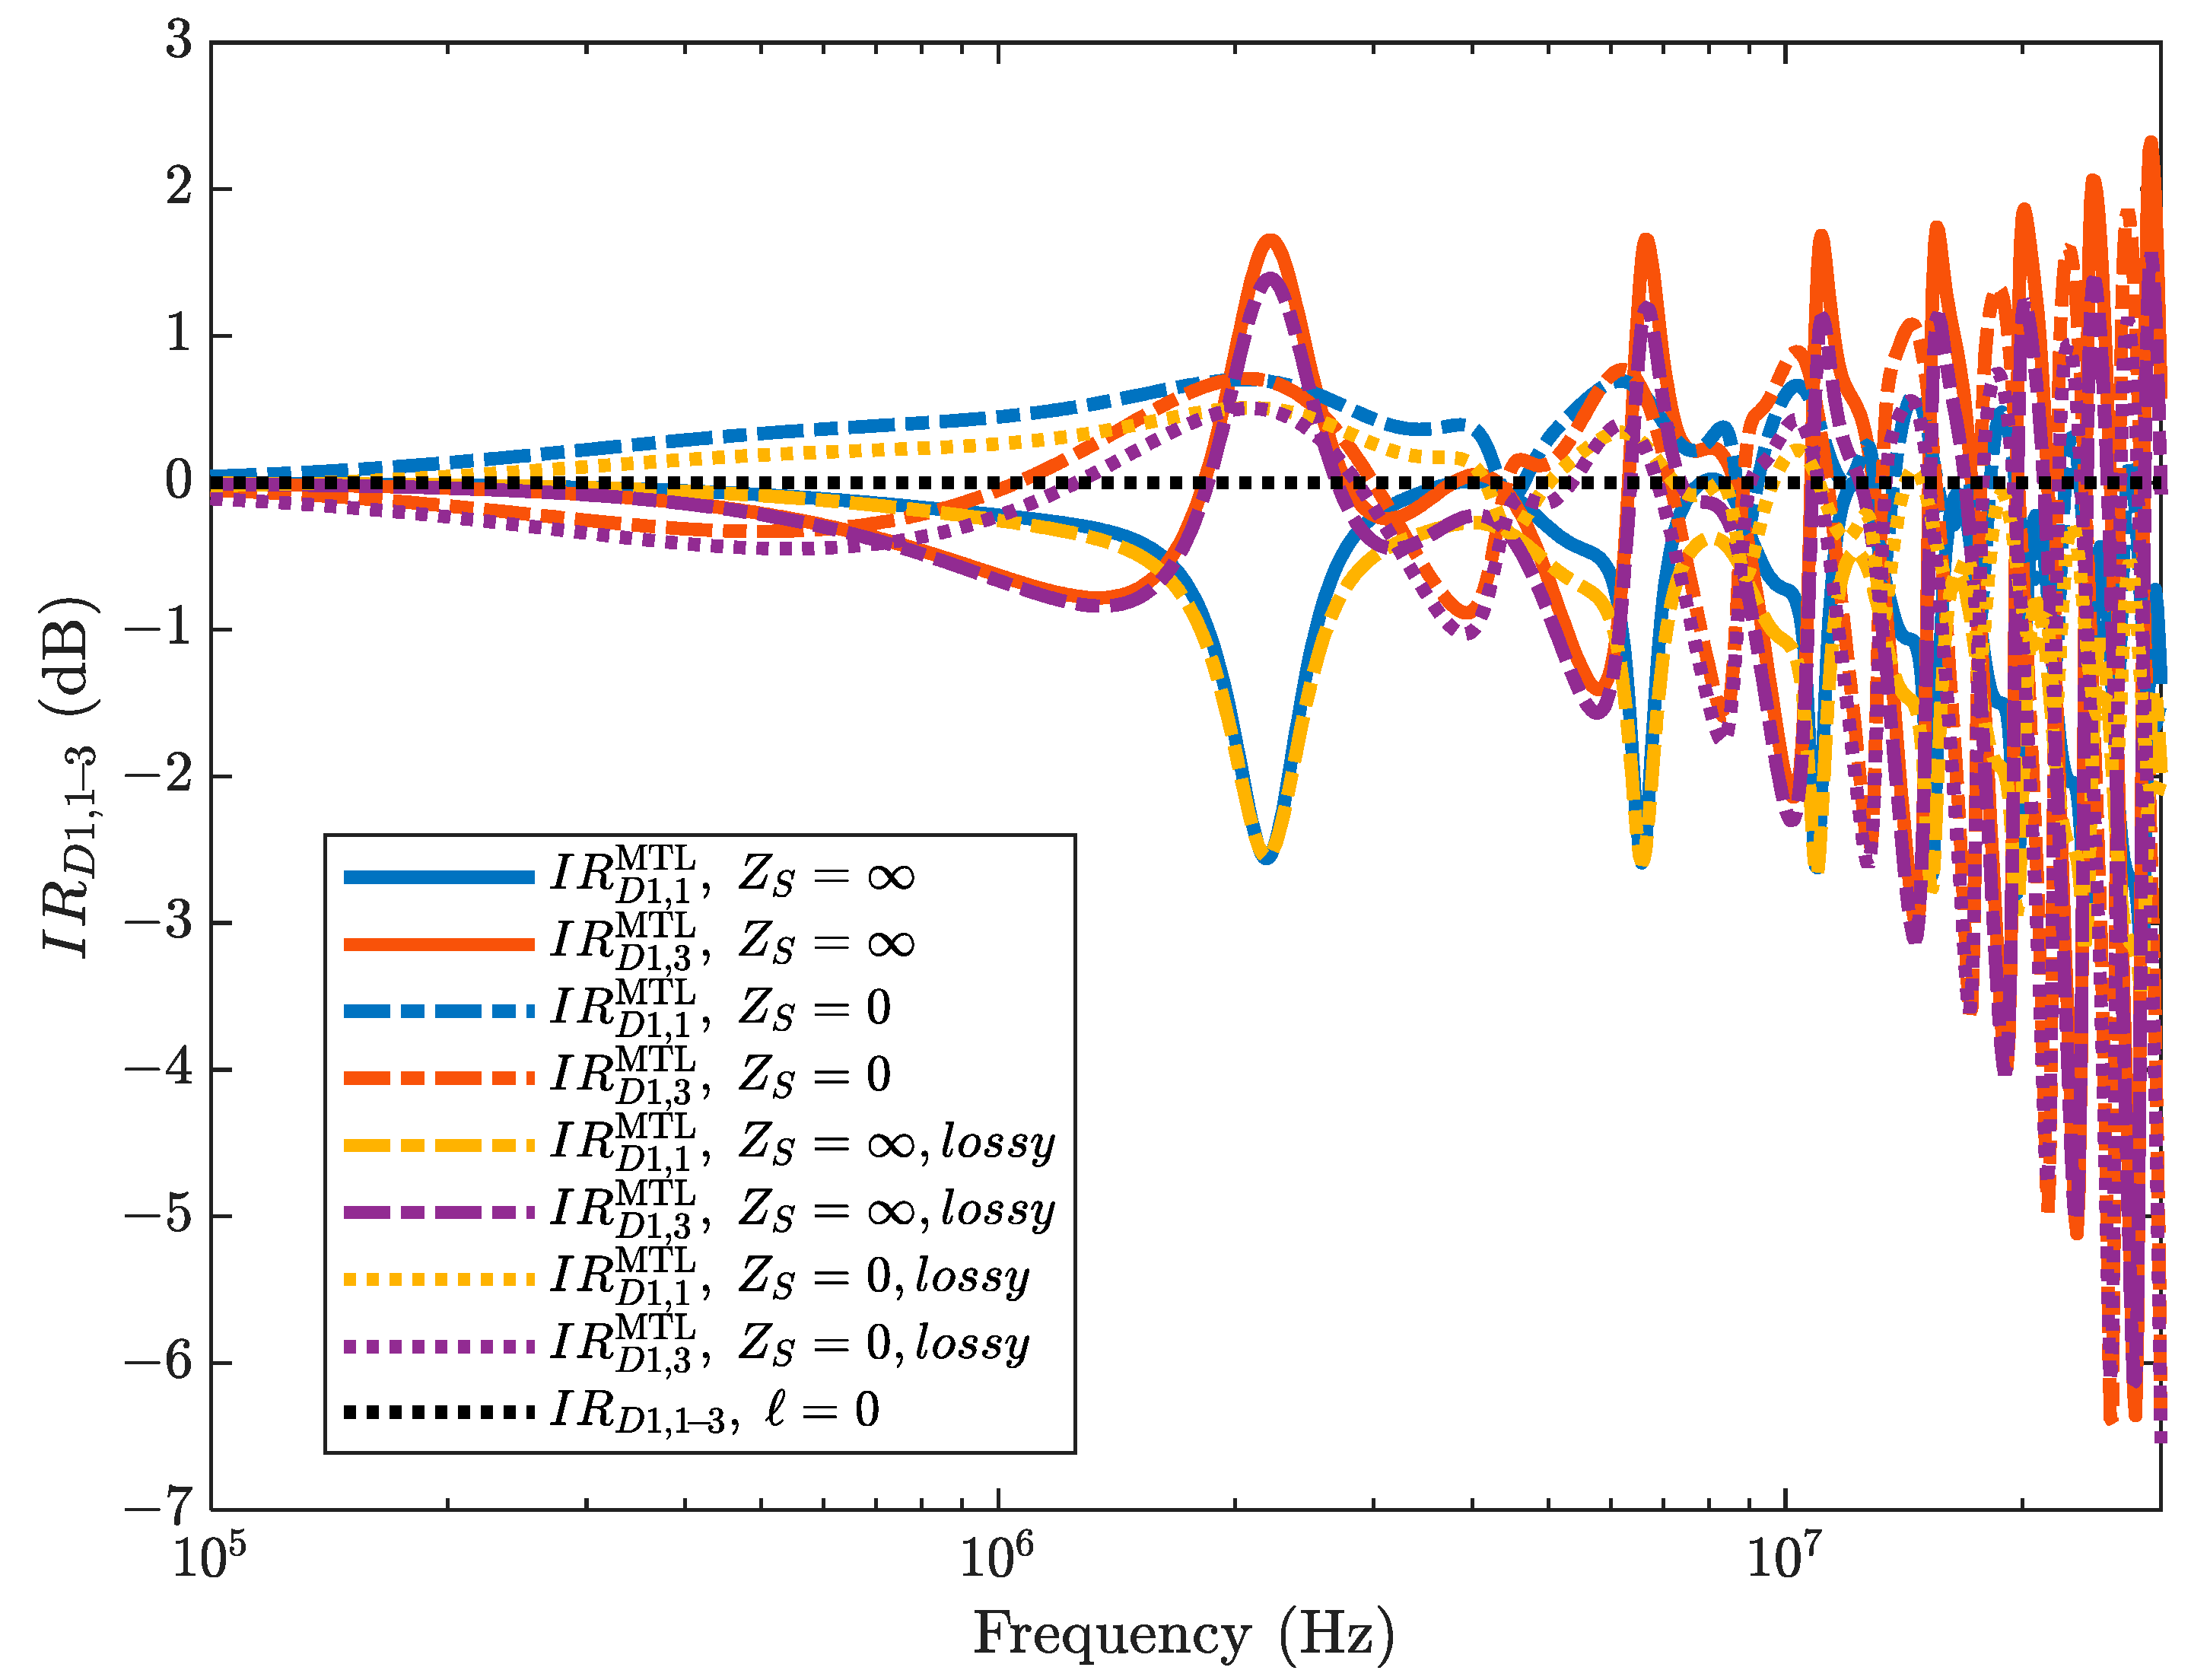
As a specific example, a 20 m long power cord is analyzed. It consists of four coated wires arranged as in Figure 2b, with internal and external radii, rw and rw,ext, of 1.8 mm and 4 mm, respectively. The dielectric jackets and the surrounding medium relative permittivity is ε r = 3.5 . Due to the presence of the air gap in the middle of the cable cross-section, the medium is inhomogeneous, and the p.u.l. parameters must be evaluated numerically. Referring to the quantities introduced in Section 2.3.2, inductive and capacitive parameters result to be: L α = 0.565 μ H , L δ = 0.342 μ H , C α = 86.9 pF , C δ = 40.2 pF . From these, the corresponding modal impedances and propagation constants are calculated by means of equations in Appendix A as: Z C , C = 211   Ω , Z C , D = 52.75   Ω , Z C , C D = 15.5   Ω , Z C , D 12 = 7.75   Ω , γ 1 = s 5.99 × 10 9 , and γ 2 = γ 3 = s 5.65 × 10 9 . Simulations results are also compared with those obtained by removing the dielectric media while maintaining the relative distance between the wires. In this case the three propagation constants are equal to γ 0 , and the modal impedances are Z C , C = 362.4   Ω , Z C , D = 90.6   Ω , Z C , C D = 23.6   Ω , Z C , D 12 = 11.8   Ω . For the homogeneous cable cross-section case, the entries of I R M T L are sketched in Figure 3 and Figure 4, whereas Figure 5 and Figure 6 present the corresponding plots for the inhomogeneous cable cross-section case. Specifically, Figure 3 and Figure 5 illustrate the behavior of the first column entries of the I R M T L matrix, indicating how CM sources contribute to the phase voltages measured at the LISN ports. Figure 4 and Figure 6, on the other hand, show the behavior of the second column entries, representing the insertion ratio resulting from DM excitation.

4.3. Results and Discussion

Results presented in Figure 3 and Figure 4 illustrate that CE levels measured at the LISN ports can significantly deviate from the actual emissions generated by the EUT, depending on cable geometry and the surrounding medium. For a homogeneous surrounding medium the quadrilateral cable behaves as a degenerate system, i.e., it is characterized by a single propagation constant, therefore standing-wave minima and maxima occur at the same set of frequencies for all modes. Under this condition, in the standing-wave region IR oscillations reach peaks values at frequencies f 0 , k = c 0 ( 2 k + 1 ) / ( 4 l ) , k = 0 ,   1 ,   2 ,   , with amplitude depending on the LISN termination Z L , and the modal impedances, Z C , C and Z C , C D . Conversely, at f 0 , k = c 0 k / ( 2 l ) all the entries of I R M T L are null, with the exception of I R D 1 , 2 M T L = I R D 2 , 1 M T L = . The IR remains bounded between the limits obtained for Z S = 0 and Z S = ; both over- and under-estimation of the CE voltage can be predicted without knowing the exact impedance network of the EUT. When the medium is inhomogeneous, two distinct propagation constants appear. This split introduces the modulation pattern seen in every element of I R M T L in Figure 5 and Figure 6. Additionally, Figure 6 shows that the same DM excitation may be perceived as either an under- or an over-estimate depending on frequency. The results shown in Figure 3, Figure 4, Figure 5 and Figure 6 are also obtained in the presence of a typical LISN defined by CISPR standard [31] (hereafter referred to as CISPR LISN). Unlike the ideal LISN, CISPR LISN have significant low impedance at low frequencies. Indeed, the Figure 3, Figure 4, Figure 5 and Figure 6 show the impact of the CISPR LISN is evident, particularly at low frequencies. Without loss of generality, the results presented can also be extended to cables of greater lengths.

4.4. Comparison with Cyclic-Symmetric Geometry

For the lossless cyclic symmetric structure cable cross-section of Figure 2a, considering inhomogeneous medium, deeply studied in [17], the inductive and capacitive p.u.l. matrices L and C take the following forms:
L = L a L b L b L b L a L b L b L b L a ,   C = C a C b C b C b C a C b C b C b C a .
The propagation constants are retrieved from the eigenvalues of the matrix product L C and are defined as
γ C = s L a + 2 L b C a + 2 C b , γ D 1 = γ D 2 = γ D = s L a L b C a C b ,
and the corresponding CM and DMs characteristics impedances take the following form:
Z C , C = ( L a + 2 L b ) ( C a + 2 C b ) ,   Z C , D 1 = Z C , D 2 = Z C , D = ( L a L b ) ( C a C b ) .
For a cyclic-symmetric cable, the modal I R M T L matrix is a diagonal matrix and its elements are expressed by:
I R X M T L dB = 20   log 10 cosh ( γ X l ) + 1 + α S X α L X α S X + α L X sinh ( γ X l ) ,   X = C ,   D .
where the coefficients
α S X = Z S X Z C , X ,   α L X = R Z C , X .
denote the ratios of the EMI source ( α S X ) and the LISN ( α L X ) modal impedances to the corresponding modal characteristic impedance of the line. In [17], bounds for the IR are derived by applying the limiting conditions α S X = 0 and α S X = ∞. Even in this case, overestimation and underestimation of the CE voltage can be predicted without requiring detailed knowledge of the EUT internal impedance network. The main advantage of adopting such a cable configuration lies in the absence of mode conversion, as the modal transfer function is diagonal. However, the quadrilateral structure remains highly relevant due to its practical implications. In general, it is important to note that real-world applications rarely involve ideal symmetric structures; instead, practical layouts typically exhibit asymmetries that give rise to significant mode conversion effects. These effects result in fully populated modal transformation matrices, as is the case in the present study. Moreover, the use of a cyclically symmetrical structure leads to a partial overestimation and underestimation of the LISN readings. A comparison is therefore made between the quantities reported in [17] (Figure 4 and Figure 5) and the diagonal elements I R C , 1 M T L and I R D 2 , 3 M T L = I R D 1 , 3 M T L shown in Figure 5 and Figure 6. The geometrical and physical parameters of the symmetric and quadrilateral cable structures are reported in Table 1. In particular, the overestimated and underestimated levels of I R C , 1 M T L evaluated in [17] (Figure 4 and Figure 5) are actually lower in absolute value than those obtained for a quadrilateral cross-section (Figure 5 and Figure 6). The transition is from symmetric limits of about 5 dB to asymmetric limits ranging between +11 dB and −9 dB. With regard to the comparison with I R D 1 , 3 M T L , the trend changes significantly due to the modulation introduced by the two propagation constants. Nevertheless, upper and lower bounds can still be identified (+2.5 dB and −6 dB), which at higher frequencies exceed the limiting values found in [17], i.e., approximately 2 dB. Therefore, in the presence of plausible asymmetries, a more accurate perception of the cable impact can be achieved.

4.5. Inclusion of Losses

For analytical tractability, the study considers a lossless line, providing closed-form formulations and a reference framework for interpreting the results. In practice, high-frequency phenomena, such as skin effect and dielectric losses, introduce attenuation and frequency dependent impedance. These non-idealities result in peak damping, frequency shifts, as reported in the literature on long cables and conducted emissions. Therefore, the lossless assumption, while essential for a first description of the involved phenomena, may not fit the characteristics of power cables used in specific practical applications. Nevertheless, the proposed prediction model can be extended to the case of power cables with lossy conductors. In particular, skin effect losses along the wires may be included by referring to the resistive frequency-dependent model ρ ( ω ) = ρ D C + k ω , where ρ D C denotes resistive DC losses. In this case, the p.u.l. impedances and admittances matrices of the power cord are given by Z ^ = R ( ω ) + j ω   L , Y ^ = j ω   C , where the resistances matrix R ( ω ) results to be cyclic-symmetric for both the cable topologies of Figure 2, and takes the following general form:
R ( ω ) = ρ w ( ω ) + ρ 0 ( ω ) ρ 0 ( ω ) ρ 0 ( ω ) ρ 0 ( ω ) ρ w ( ω ) + ρ 0 ( ω ) ρ 0 ( ω ) ρ 0 ( ω ) ρ 0 ( ω ) ρ w ( ω ) + ρ 0 ( ω ) ,
where ρ w ( ω ) and ρ 0 ( ω ) denote the series resistance of the phase wires and the reference conductor, respectively. In particular for the quadrilateral structure
R ( ω ) = ρ w ( ω ) 2 1 1 1 2 1 1 1 2 ,
due to the fact that the reference conductor radius is equal to the phase ones, i.e., ρ 0 ( ω ) = ρ w ( ω ) . The p.u.l. impedances and admittances matrices are given by:
Z ^ ( ω ) = R ( ω ) + j ω   L ; Y ^ ( ω ) = j ω   C ,
where matrices L and C have been defined in (14).
The product matrix Z ^ ( ω ) Y ^ ( ω ) = j ω R ( ω ) C ω 2 L C is still diagonalized by the similarity transformation matrix T V in (A5), leading to the following complex and frequency-dependent propagation constants:
γ ^ 1 = 4 C δ ω [ ω ( L δ L α ) + j ρ w ( ω ) ] ; γ 2 = γ 3 = 2 ( C α + C δ ) ω [ ω L δ + j ρ w ( ω ) ] .
By exploiting (34) in the evaluation of the propagation matrix Γ (A6), the line characteristics impedance matrix Z C takes the form in (A8), but the impedances z a and z b must be replaced by:
z ^ a ( ω ) = γ ^ 1 4 s C δ = j ω ( L δ L α ) + j ρ w ( ω ) 4 C δ ω , z ^ b ( ω ) = γ ^ 2 2 s ( C α + C δ ) = j ω L δ + j ρ w ( ω ) 2 ( C α + C δ ) ω .
Therefore, all the results obtained are still valid on condition that quantities γ 1 , γ 2 , z a and z b will be replaced by the above written expressions (34) and (35). The presence of losses implies damping of oscillations with increasing frequency (since the real part of γ ^ X increases with frequency), and global reduction of CE levels, due to the increase of the line characteristic impedance with frequency. As an example, Figure 7 and Figure 8 display the comparisons between the behaviors of lossless and lossy inhomogeneous cables. The frequency-dependent resistance behavior of the cable is obtained by using ANSYS Q2D (version 2023). Nevertheless, the lossless analysis may represent a worst-case scenario, offering an upper bound for oscillation amplitudes.

5. Conclusions

This study highlighted the crucial importance of the power cable in conducted emission testing for three-phase systems, showing that its behavior as a multi-conductor transmission line significantly affects the voltages measured at the LISN terminals. A quadrilateral cable configuration was analyzed, which is commonly used in industrial applications to supply balanced load machines that do not require neutral connection. Such cables are preferred for their simpler manufacturing process and greater mechanical robustness compared to more delicate symmetric structures. However, the loss of cyclic symmetry introduces coupling between CM and DM components, leading to a fully populated transfer matrix and mode conversion effects. It was demonstrated that the cable electrical length and cross-sectional geometry can cause substantial mismatches between the actual emissions generated by the EUT and those detected during measurements. A measurement setup was defined in which the EUT is connected to an ideal LISN via a quadrilateral-symmetry cable, with conductors positioned at the vertices of a quadrilateral. The cables were analyzed considering both homogeneous and inhomogeneous properties. By applying specific geometric assumptions, it was possible to derive rigorous analytical definitions of the cables and their associated modal transfer functions. The concept of IR was introduced to compare the phase voltages measured at the LISN ports in the presence of the cable with those measured in its absence. The IR proved to be an effective tool to quantify the deviations introduced by the cable relative to ideal measurements.
The range within which the insertion ratios may vary in the presence of the cable is illustrated in Figure 3, Figure 4, Figure 5 and Figure 6. The figures likewise include the trends corresponding to the case of a CISPR LISN [31]. Finally, general considerations are provided for the case of lossy cables.
The proposed approach enables the prediction of both overestimations and underestimations of emissions, even without detailed knowledge of the device internal impedance network ZS. The results suggest that adopting advanced models based on transmission line theory is essential to ensure accurate EMC evaluations and to support the design of more effective EMI filters. The main contribution of this work is therefore the development of a predictive method for CEs based on an analytical MTL model, to assess the impact of cable length and geometry on LISN measurements. Future developments may extend the model by incorporating a real LISN model and accounting for the potential impact of an EMI filter placed at the EUT output.

Author Contributions

Conceptualization, F.G. and S.A.P.; Formal analysis, L.I., X.W., F.G. and S.A.P.; Investigation, X.W.; Methodology, L.I., X.W., F.G. and S.A.P.; Software, L.I.; Supervision, F.G. and S.A.P.; Validation, L.I. and X.W.; Writing—original draft, L.I. and X.W.; Writing—review & editing, F.G. and S.A.P. All authors have read and agreed to the published version of the manuscript.

Funding

This research received no external funding.

Data Availability Statement

The original contributions presented in this study are included in the article. Further inquiries can be directed to the corresponding author.

Conflicts of Interest

The authors declare no conflict of interest.

Appendix A

Appendix A.1. Homogeneous Medium Characteristic Impedance Computation

This section outlines the derivation of propagation constants and the characteristic impedance matrix in a homogeneous medium, highlighting key relationships in the modal domain and their behavior for widely separated conductors. In homogenous media, in which (7) holds, there is a single propagation constant, equal to γ 0 = j ω / c 0 , and the characteristics impedance matrix can be derived as Z C = c 0 L , which is a full matrix. The propagation constant and the characteristic impedance thus defined are then used in (8) to obtain the chain parameter matrix Φ(ZC,γ0).
In this context, the formulations of modal characteristic impedance are also derived, which are later used in (19) and (24) for the calculation of the transfer function and the modal insertion losses. The modal characteristic impedance matrix, Z C m , is itself a full matrix, obtained by applying the transformation matrix T to the characteristic impedance matrix Z C , as follows:
Z C m = T 1 Z C T = Z C , C Z C , C D Z C , C D Z C , C D Z C , D Z C , D 12 Z C , C D Z C , D 12 Z C , D
The individual elements of the matrix Z C m are expressed below as a function of c0 and of the elements of the inductance matrix (12):
Z C , C = 4 c 0 3 L α + L δ ,   Z C , D = c 0 3 L α + L δ = Z C , C 4 , Z C , C D = 2 c 0 3 L α 2 L δ ,   Z C , D 12 = c 0 3 L α 2 L δ = Z C , C D 2 .
Particularly for widely-separated wires, i.e., dw/rw > 5 and implementing the definitions in (10), the elements of Z C m are given by:
Z C , C = 2 c 0 μ 0 π ln 2 1 6 d w r w ,   Z C , D = c 0 μ 0 2 π ln 2 1 6 d w r w = Z C , C 4 Z C , C D = c 0 μ 0 6 π ln 4 = 27.73   Ω Z C , D 12 = c 0 μ 0 6 π ln 2 = Z C , C D 2 = 13.86   Ω
where Z C , C and Z C , D are function of the ratio d w / r w , while Z C , C D and Z C , D 12 result to be constant. Negative signs reflect the relative phase coupling between modes and are a consequence of the mode transformation.

Appendix A.2. Inhomogeneous Medium Characteristic Impedance and Propagation Constant Computations

This section presents the analytical expressions for propagation constants and characteristic impedances in inhomogeneous media, derived through matrix diagonalization techniques. Considering an inhomogeneous medium, the MTL propagation constants are given by the eigenvalues of the matrix product L C :
L C = a b b b a b 0 0 a b
where a = L δ C α + 3 L δ C δ 2 L α C δ and b = L δ C α + L δ C δ 2 L α C δ .
A trivial similarity transformation matrix diagonalizing the matrix product L C is:
T V = 1 1 0 1 0 1 0 1 1 .
By exploiting (A5), the line propagation matrix Γ takes the following form:
Γ = T V L C T V - 1 = γ 1 0 0 0 γ 2 0 0 0 γ 2
and the line propagation constants result to be:
γ 1 = s ( a + b ) = s 4 C δ ( L δ L α ) . γ 2 = γ 3 = s ( a b ) = s 2 L δ ( C α + C δ )
The line characteristics impedance matrix, which is real and symmetric, can be written as:
Z C = 1 s T V Γ T V 1 C 1 = z a + z b z a z b z a z a + z b z b z b z b 2 z b
where z a and z b , depending only on γ 1 or γ 2 respectively, are given by:
z a = γ 1 4 s C δ = 1 2 L δ L α C δ ,   z b = γ 2 2 s C α + C δ = L δ 2 ( C α + C δ )
In order to evaluate the transfer functions and the insertion losses defined in (20) and (25), the modal characteristic impedance matrix must be derived. The latter, denoted as Z C m , is obtained considering the modal decomposition defined in (15), and takes the form:
Z C m = T 1 Z C T = 1 3 4 z a + 2 z b 2 z a z b 2 z a z b 2 z a z b z a + 2 z b z a z b 2 z a z b z a z b z a + 2 z b = Z C , C Z C , C D Z C , C D Z C , C D Z C , C 4 Z C , C D 2 Z C , C D Z C , C D 2 Z C , C 4
where Z C , C and Z C , C D are given by:
Z C , C = 2 3 L δ L α C δ + 2 2 L δ C α + C δ ,   Z C , C D = 1 3 L δ L α C δ 2 L δ C α + C δ
Since in this case the propagation constant values have been obtained through diagonalization, the values of the chain parameter matrix must also be adapted. The sub-matrices of the chain parameters matrix Φ are diagonalized through an additional application of the similarity transformation matrix TV defined in (A5), and take the form hereunder:
Φ 11 = T V d i a g cosh ( γ 1 l ) , cosh ( γ 2 l ) , cosh ( γ 2 l ) T V 1 = ϕ 11 , A ϕ 11 , B ϕ 11 , B ϕ 11 , B ϕ 11 , A ϕ 11 , B 0 0 ϕ 11 , A ϕ 11 , B
where ϕ 11 , A = 1 2 cosh γ 1 l + cosh γ 2 l and ϕ 11 , B = 1 2 cosh γ 1 l cosh γ 2 l .
Φ 12 = T V d i a g sinh ( γ 1 l ) , sinh ( γ 2 l ) , sinh ( γ 2 l ) T V 1 Z C = ϕ 12 , A + ϕ 12 , B ϕ 12 , A ϕ 12 , B ϕ 12 , A ϕ 12 , A + ϕ 12 , B ϕ 12 , B ϕ 12 , B ϕ 12 , B 2 ϕ 12 , B
where: ϕ 12 , A = 1 4 sinh γ 1 l Z 1 ; ϕ 12 , B = 1 4 sinh γ 2 l Z 2 .
Φ 22 = Φ 11 T
Φ 21 = Z C 1 T V d i a g sinh ( γ 1 l ) , sinh ( γ 2 l ) , sinh ( γ 2 l ) T V 1 = = ( ϕ 21 , A + ϕ 21 , B ) ( ϕ 21 , A ϕ 21 , B ) ϕ 21 , B ( ϕ 21 , A ϕ 21 , B ) ( ϕ 21 , A + ϕ 21 , B ) ϕ 21 , B ϕ 21 , B ϕ 21 , B ( ϕ 21 , A + ϕ 21 , B )
where: ϕ 21 , A = 2 sinh γ 2 l Z 2 and ϕ 21 , B = sinh γ 1 l Z 1 .
In (A13) and (A15), the auxiliary terms Z1 and Z2 are introduced. These quantities can be expressed either in terms of the inductance and capacitance matrices defined in (12) and (13), or, by exploiting the relations established in (A11), directly in terms of the elements of the modal characteristic impedance matrix:
Z 1 = Z C , C + 4 Z C , C D = γ 1 s C δ = 2 L δ L α C δ
Z 2 = Z C , C 2 Z C , C D = 2 γ 2 s C α + C δ = 2 2 L δ C α + C δ
The terms Z1 and Z2 thus represent compact formulations that are subsequently employed in the evaluation of the transfer function and the insertion loss.

References

  1. Skibinski, G.L.; Kerkman, R.J.; Schlegel, D. EMI Emissions of Modern PWM ac Drives. IEEE Ind. Appl. Mag. 1999, 5, 47–81. [Google Scholar] [CrossRef]
  2. Boglietti, A.; Carpaneto, E. Induction motor high frequency model. In Proceedings of the 1999 IEEE Industry Applications Conference, Phoenix, AZ, USA, 3–7 October 1999; Volume 3, pp. 1551–1558. [Google Scholar] [CrossRef]
  3. Widek, P.; Alaküla, M. Methods for the Investigation and Mitigation of Conducted Differential-Mode Electromagnetic Interference in Commercial Electrical Vehicles. Energies 2025, 18, 859. [Google Scholar] [CrossRef]
  4. Zhang, Z.; Hu, Y.; Chen, X.; Jewell, G.W.; Li, H. A Review on Conductive Common-Mode EMI Suppression Methods in Inverter Fed Motor Drives. IEEE Access 2021, 9, 18345–18360. [Google Scholar] [CrossRef]
  5. De Lima, A.C.S.; Dommel, H.W.; Stephan, R.M. Modeling adjustable-speed drives with long feeders. IEEE Trans. Ind. Electron. 2000, 47, 549–556. [Google Scholar] [CrossRef]
  6. Lee, K.; Zhang, Z. Conducted EMI Modeling and Analysis of Adjustable Speed Drive Systems with DC Chokes. In Proceedings of the 2024 IEEE Energy Conversion Congress and Exposition (ECCE), Chicago, IL, USA, 27–31 October 2024; pp. 7446–7452. [Google Scholar] [CrossRef]
  7. Zhai, L.; Lin, L.; Zhang, X.; Song, C. The Effect of Distributed Parameters on Conducted EMI from DC-Fed Motor Drive Systems in Electric Vehicles. Energies 2017, 10, 1. [Google Scholar] [CrossRef]
  8. Wang, L.; Zhang, Y.; Ali, M.S.; Chen, G.; Guerrero, J.M.; Vasquez, J.C. High-Frequency Modeling and Filter Design for PWM Drives with Long Cables. Energies 2021, 14, 1155. [Google Scholar] [CrossRef]
  9. Illiano, L.; Liu, X.; Wu, X.; Grassi, F.; Pignari, S.A. Signal Order Optimization of Interconnects Enabling High Electromagnetic Compatibility Performance in Modern Electrical Systems. Energies 2024, 17, 2786. [Google Scholar] [CrossRef]
  10. Orlandi, A.; Pignari, S. Modal Analysis of Conducted EMI in Three-Phase Power Drive Systems. In Proceedings of the 14th International Zurich Symposium and Technical Exposition on Electromagnetic Compatibility, Zurich, Switzerland, 20–22 February 2001; pp. 1–6. [Google Scholar] [CrossRef]
  11. Pignari, S.A.; Orlandi, A. Long-cable effects on conducted emissions levels. IEEE Trans. Electromagn. Compat. 2003, 45, 43–54. [Google Scholar] [CrossRef]
  12. Park, S.; Lee, E.; Noh, Y.-H.; Choi, D.-H.; Yook, J.-G. Accurate Modeling of CCS Combo Type 1 Cable and Its Communication Performance Analysis for High-Speed EV-EVSE Charging System. Energies 2023, 16, 5947. [Google Scholar] [CrossRef]
  13. Rezaei, H.; Sørensen, M.; Huang, W.; Beetner, D.G.; Pommerenke, D. Analyzing the Influence of Imbalanced Two- or Three-Wire VHF LISN on Radiated Emissions from AC Cables. IEEE Trans. Electromagn. Compat. 2022, 64, 327–337. [Google Scholar] [CrossRef]
  14. Rezaei, H.; Sørensen, M.; Jensen, K.; Pommerenke, D.; Beetner, D.G. Influence of Variations in Imbalanced LISN Termination Impedances on Radiated Emissions. IEEE Trans. Instrum. Meas. 2025, 74, 1001011. [Google Scholar] [CrossRef]
  15. Babu, P.; Tang, Z.; Peyghami, S.; Blaabjerg, F.; Christensen, N.; Davari, P. Systematic Approach for EMI Equivalent Model Derivation of Three Phase DC-Fed Motor Drives. In Proceedings of the 2024 International Conference on Electrical Machines (ICEM), Bari, Italy, 1–4 September 2024; pp. 1–7. [Google Scholar] [CrossRef]
  16. Jafari Roudposht, A.; Illiano, L.; Wu, X.; Grassi, F.; Pignari, S.A. Analysis and Circuit Modeling of Mode Conversion in Non-Ideal EMI Filters. In Proceedings of the EMC Europe 2025, Kraków, Poland, 1–5 September 2025. paper accepted for presentation. [Google Scholar]
  17. Grassi, F.; Pignari, S.A. Conducted Emissions Analysis in Four-Conductor Systems with Long Feeders. In Proceedings of the EMC Europe 2004, International Symposium on Electromagnetic Compatibility, Eindhoven, The Netherlands, 6–10 September 2004; pp. 1–6. [Google Scholar] [CrossRef]
  18. Xie, P.; Vakil, G.; Gerada, C. Electric drive systems with long feeder cables. IET Electr. Power Appl. 2020, 14, 16–30. [Google Scholar] [CrossRef]
  19. Wan, L.; Beshir, A.H.; Wu, X.; Liu, X.; Grassi, F.; Spadacini, G.; Pignari, S.A.; Zanoni, M.; Chiumeo, R.; Tenti, L. Cable Effects on Noise Propagation in Distribution Networks with Renewable Sources. In Proceedings of the 2022 20th International Conference on Harmonics & Quality of Power (ICHQP), Naples, Italy, 29 May–1 June 2022; pp. 1–6. [Google Scholar] [CrossRef]
  20. Krim, A.; Lakrim, A.; Tahri, D. Two VHDL-AMS-based models of multi-conductor power cables for EMI simulations. Electr. Eng. 2021, 103, 647–661. [Google Scholar] [CrossRef]
  21. Kwak, H.; Hubing, T.H. Investigation of the Imbalance Difference Model and its Application to Various Circuit Board and Cable Geometries. In Proceedings of the 2012 IEEE International Symposium on Electromagnetic Compatibility, Pittsburgh, PA, USA, 5–10 August 2012; pp. 273–278. [Google Scholar] [CrossRef]
  22. Genc, S.; Muneeswaran, V.; Thomas, D.; Greedy, S.; Gundogdu, B.; Sarma, N.; Ozgonenel, O. The Effect of Conducted Emissions of Grid-Tied Three-Phase Adjustable Drives. Eng. Sci. Technol. Int. J. 2023, 46, 101505. [Google Scholar] [CrossRef]
  23. Niklaus, P.S.; Antivachis, M.M.; Bortis, D.; Kolar, J.W. Analysis of the Influence of Measurement Circuit Asymmetries on Three-Phase CM/DM Conducted EMI Separation. IEEE Trans. Power Electron. 2021, 36, 4066–4080. [Google Scholar] [CrossRef]
  24. Antivachis, M.; Niklaus, P.S.; Bortis, D.; Kolar, J.W. Input/output EMI filter design for three-phase ultra-high speed motor drive GaN inverter stage. CPSS Trans. Power Electron. Appl. 2021, 6, 74–92. [Google Scholar] [CrossRef]
  25. Paul, C.R. Analysis of Multiconductor Transmission Lines, 2nd ed.; Wiley-IEEE Press: Hoboken, NJ, USA, 2008. [Google Scholar]
  26. Illiano, L.; Wu, X.; Grassi, F.; Spadacini, G.; Pignari, S.A. Review of Mode Conversion and Modal Analysis in Electromagnetic Compatibility. IEEE Access 2024, 12, 65513–65529. [Google Scholar] [CrossRef]
  27. Paul, C.R.; Scully, R.C.; Steffka, M.A. Introduction to Electromagnetic Compatibility, 3rd ed.; John Wiley & Sons: Hoboken, NJ, USA, 2022. [Google Scholar]
  28. CISPR 17:2011; Methods of Measurement of the Suppression Characteristics of Passive EMC Filtering Devices. IEC: Geneva, Switzerland, 2011.
  29. Tarateeraseth, V. Derivation of Insertion Loss Equations for EMI Filter Design. In Proceedings of the 2012 5th IASTED Asian Conference on Power and Energy Systems (AsiaPES 2012), Nakhon Nayok, Thailand, 2–4 April 2012. [Google Scholar]
  30. Luna, M.; La Tona, G.; Accetta, A.; Pucci, M.; Di Piazza, M.C. An Evolutionary EMI Filter Design Approach Based on In-Circuit Insertion Loss and Optimization of Power Density. Energies 2020, 13, 1957. [Google Scholar] [CrossRef]
  31. CISPR 16-1-2:2014/AMD 1:2017; Specification for Radio Disturbance and Immunity Measuring Apparatus and Methods—Part 1–2: Coupling Devices for Conducted Disturbance Measurements. IEC: Geneva, Switzerland, 2017; Amendment 1.
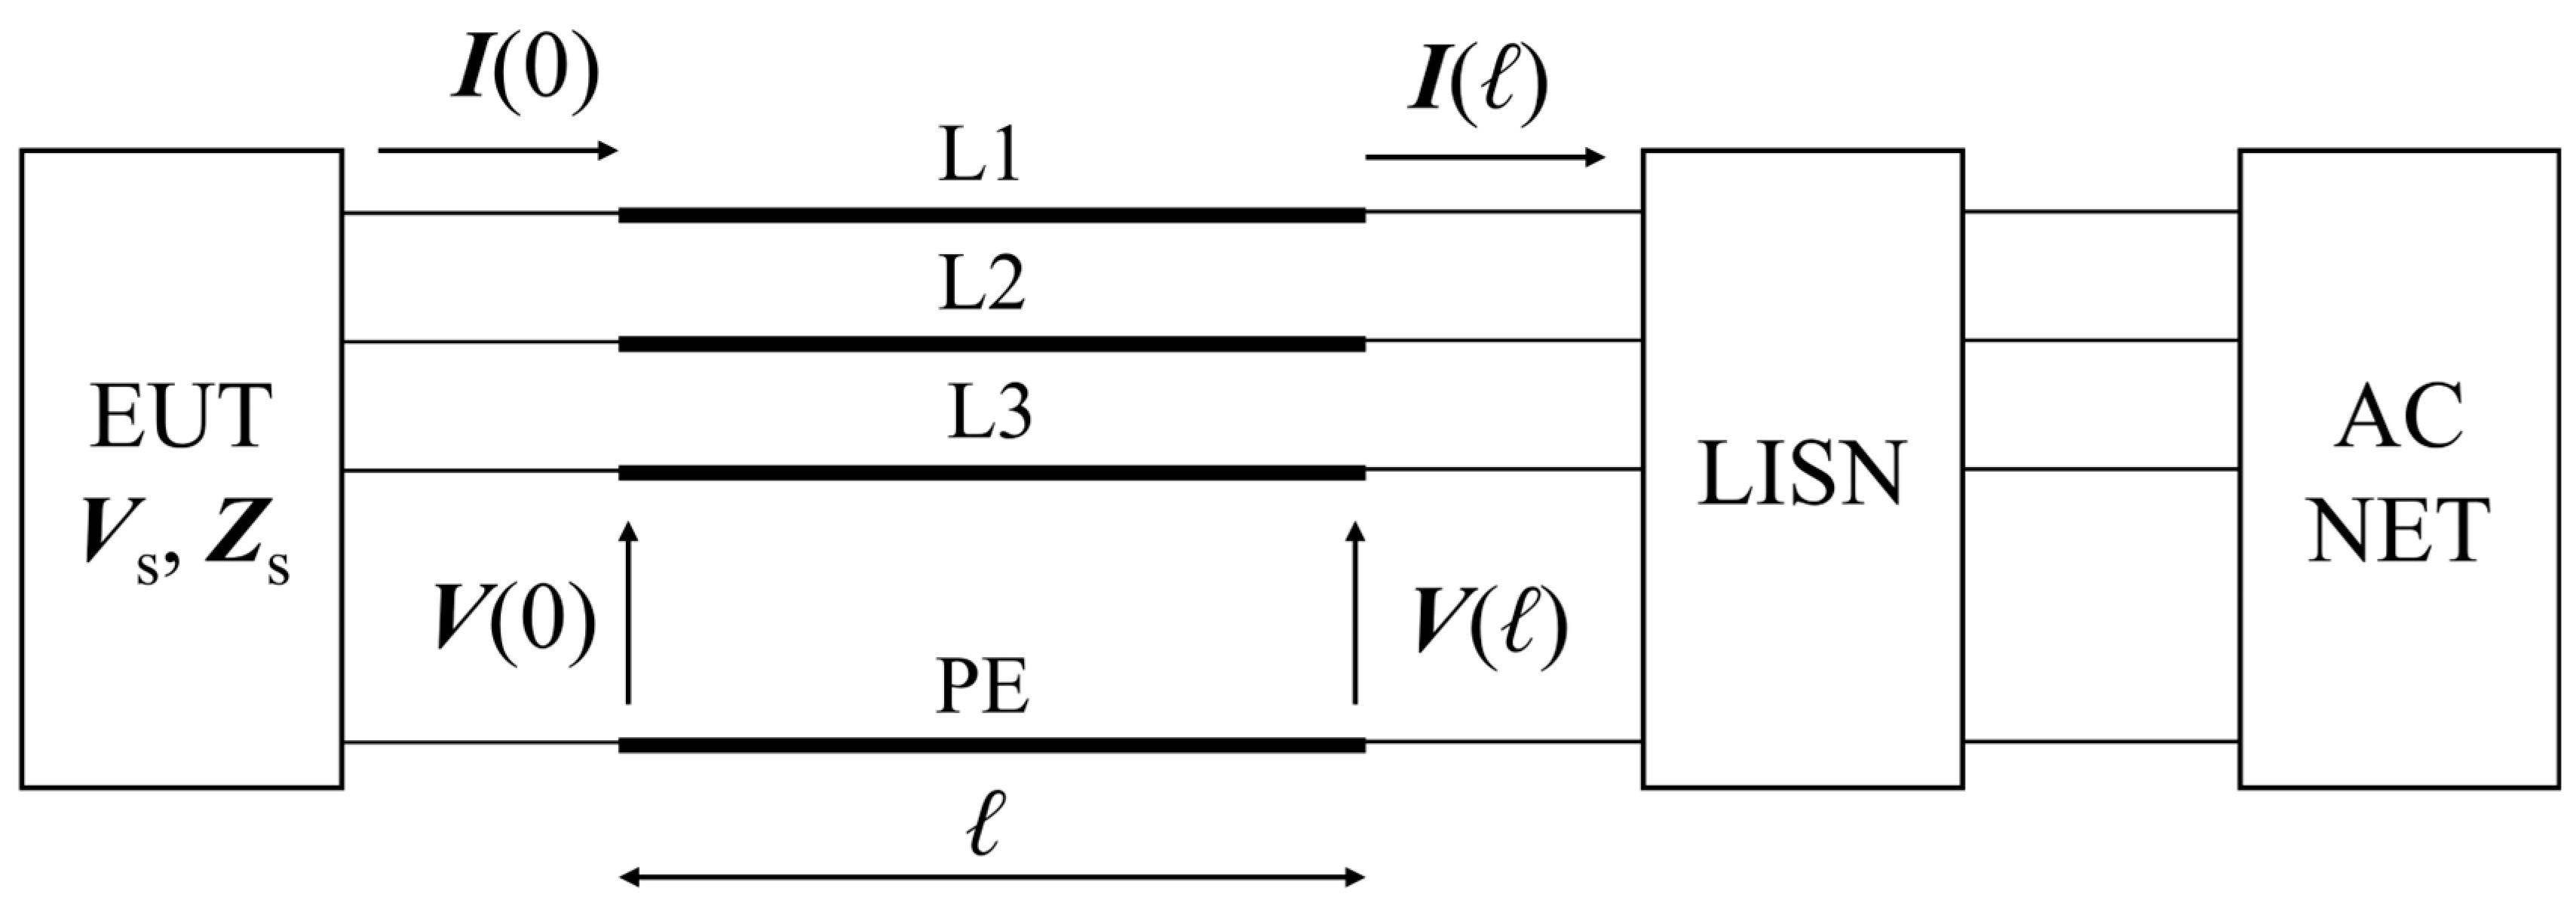
Figure 1. Schematic diagram of the CE measurements setup for a three-phase EUT fed by an electrically-long power cord.
Energies 18 04720 g001
Figure 2. Specific examples of four-core power cable cross-sections: the first one (a) satisfies cyclic-symmetric property, whereas the second (b) does not comply with it. It is defined hereafter quadrilateral structure.
Energies 18 04720 g002
Figure 3. First column entries of IRMTL matrix for the quadrilateral cross-section of Figure 2b: bare conductors in free-space.
Energies 18 04720 g003
Figure 4. Second column entries of IRMTL matrix for the quadrilateral cross-section of Figure 2b: bare conductors in free-space.
Energies 18 04720 g004
Figure 5. First column entries of IRMTL matrix for the quadrilateral cross-section of Figure 2b: coated wires.
Energies 18 04720 g005
Figure 6. Second column entries of IRMTL matrix for the quadrilateral cross-section of Figure 2b: coated wires.
Energies 18 04720 g006
Figure 7. Comparison between first column entries of IRMTL matrix for the quadrilateral cross-section of Figure 2b, coated wires, considering lossless and lossy cables.
Energies 18 04720 g007
Figure 8. Comparison between second column entries of IRMTL matrix for the quadrilateral cross-section of Figure 2b, coated wires, considering lossless and lossy cables.
Energies 18 04720 g008
Table 1. Geometrical and physical parameters of the symmetric and quadrilateral cable structures represented in Figure 2.
ParametersSymmetric StructureQuadrilateral Structure
Wires inner radius, rw1.8 mm1.8 mm
Wires external radius, rw,ext4 mm4 mm
Distance between wires dw8 mm8 mm
Shield radius, rPE12 mm/
Relative permittivity, εr3.53.5
Disclaimer/Publisher’s Note: The statements, opinions and data contained in all publications are solely those of the individual author(s) and contributor(s) and not of MDPI and/or the editor(s). MDPI and/or the editor(s) disclaim responsibility for any injury to people or property resulting from any ideas, methods, instructions or products referred to in the content.