Article

Optimization of Grid-Connected and Off-Grid Hybrid Energy Systems for a Greenhouse Facility

by
Nuri Caglayan
Department of Agricultural Machinery and Technology Engineering, Faculty of Agriculture, Akdeniz University, Antalya 07058, Türkiye
Energies 2025, 18(17), 4712; https://doi.org/10.3390/en18174712
Submission received: 8 August 2025 / Revised: 30 August 2025 / Accepted: 2 September 2025 / Published: 4 September 2025

Abstract

This study evaluates the technical, economic, and environmental feasibility of grid-connected and off-grid hybrid energy systems designed to meet the energy demands of a greenhouse facility. Various system configurations were developed based on combinations of solar, wind, diesel, and battery storage technologies. The analysis considers a daily electricity consumption of 369.52 kWh and a peak load of 52.59 kW for the greenhouse complex. Among the grid-connected systems, the grid/PV configuration was identified as the most optimal, offering the lowest Net Present Cost (NPC) of USD 282,492, the lowest Levelized Cost of Energy (LCOE) at USD 0.0401/kWh, and a reasonable emissions reduction of 54.94%. For off-grid scenarios, the generator/PV/battery configuration was the most cost-effective option, with a total cost of USD 1.19 million and an LCOE of USD 0.342/kWh. Environmentally, this system showed a strong performance, achieving a 64.58% reduction in CO2 emissions; in contrast, fully renewable systems such as PV/wind/battery and wind/battery configurations succeeded in reaching zero-emission targets but were economically unfeasible due to their very high investment costs and limited practical applicability. Sensitivity analyses revealed that economic factors such as inflation and energy prices have a critical effect on the payback time and the Internal Rate of Return (IRR).

1. Introduction

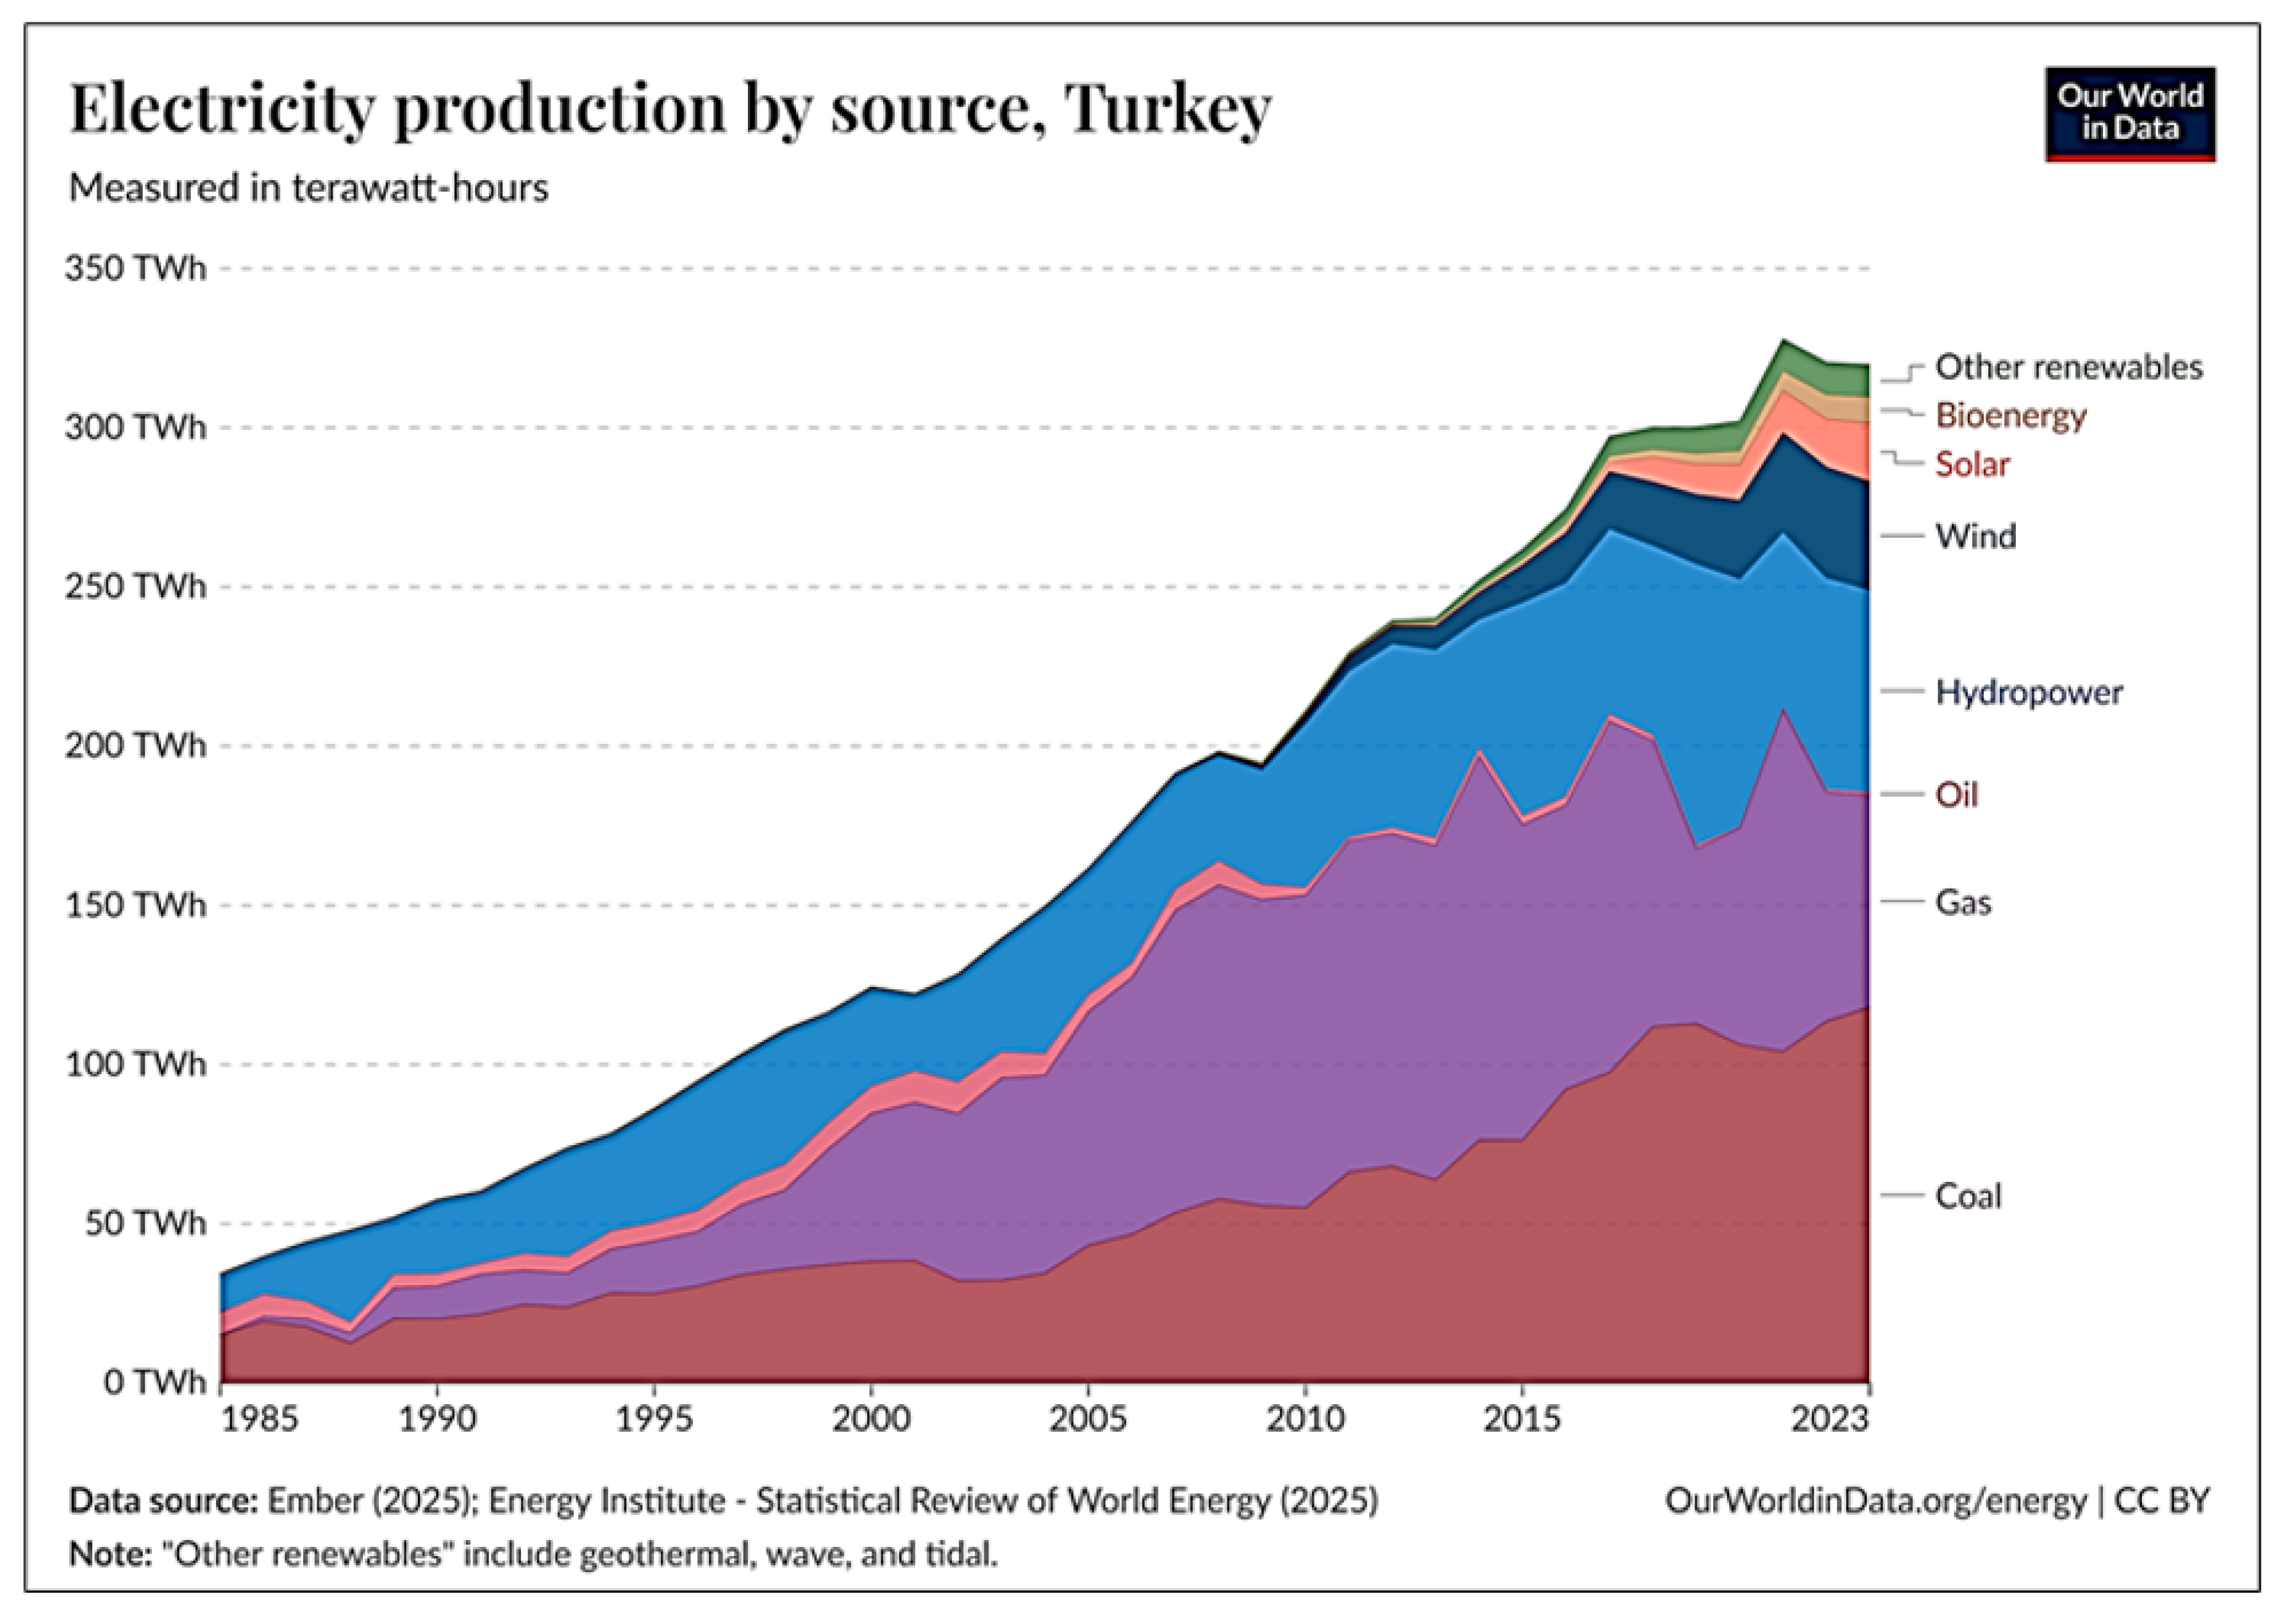
The depletion of fossil fuel reserves, along with environmental concerns such as climate change and the increase in global energy demand, has necessitated a shift toward renewable energy sources. Global electricity generation reached 29.5 TWh in 2023 (Figure 1), and approximately 30.3% of this came from REN sources [1]. This share is projected to exceed 45% by 2030 [2]. In particular, solar and wind energy systems have been increasingly adopted in energy generation due to declining costs and ongoing technological advancements.
In Türkiye, total electricity generation reached 349 TWh in 2024. Of this, 42% (137.2 TWh) came from REN sources and 44% from fossil fuels [3]. Meanwhile, electricity consumption in 2024 increased by 3.8% compared with the previous year, reaching 347.9 TWh. Projections indicate that electricity consumption will grow at an average annual rate of 4.8%, reaching approximately 450 TWh by 2030.
Türkiye has a high potential for renewable energy sources such as solar and wind energy. Türkiye has an average annual solar radiation of 1527.46 kWh/m2 per year (or 4.18 kWh/m2 per day), and a total annual sunshine duration of 2741 h (7.5 h per day) [4]. Moreover, Türkiye’s wind energy potential is estimated to be 47,850 MW, with particularly high potential in the western and southwestern regions, where average wind speeds exceed 7.5 m/s annually [5].
Despite its strong REN potential, Türkiye’s energy sector remains largely dependent on fossil fuels. Therefore, the Ministry of Energy and Natural Resources introduced a revised Renewable Energy Support Mechanism (YEKDEM) in 2021 to promote the use of REN and reduce fossil fuel consumption in electricity production [6]. This mechanism was revised again in May 2023 to better align with evolving needs [7]. Along with ongoing reforms in the electricity sector, improvements in REN technologies, falling costs, and government-backed financial incentives have increased interest in REN investments [8]. By the end of 2023, renewable sources accounted for 55% of Türkiye’s total installed capacity, which reached 106.7 GW [9]. Of the 2873 MW of new installed capacity added in 2023, 1890 MW (65.8%) came from solar energy, 414 MW (14.4%) from wind, and 393 MW (13.7%) from hydropower plants (Figure 2) [9,10]. As of March 2025, Türkiye’s installed power capacity had risen to 118.2 GW, with approximately 70 GW derived from renewable sources, raising the renewable share of electricity production capacity to 60% [11,12].
According to the National Energy Plan (UEP) [13,14], Türkiye’s total installed capacity is expected to reach 189.7 GW by 2035. The share of renewables is projected to increase to approximately 65% of total capacity and approximately 55% of electricity generation. By 2035, wind and solar energy are expected to account for 43.5% of the installed capacity and 34.2% of total electricity generation.

1.1. Renewables in Agriculture

In 2021, the share of REN in total final energy consumption was highest in the industrial sector, at 16.8%, while the agricultural sector accounted for 15.4%. These discrepancies stem not only from the structural characteristics of each sector but also from the lack of comprehensive and integrative policies aimed at increasing the share of renewables [15,16].
Moreover, policies related to energy use in agriculture often lack consistency, resulting in inconsistencies. For example, tax incentives provided for diesel fuel in agriculture have caused farmers to hesitate in making investments in REN technologies [17,18]. In this context, more decisive action is needed to increase the level of electrification across sectors and to facilitate the transition to REN.
Among the key benefits for farmers adopting REN and energy efficiency practices are improved access to energy and a higher level of reliability, reduced fuel costs, decreased food loss, and enhanced mechanization. Additional advantages include extended production seasons, access to new markets, and positive environmental and health-related impacts [19,20]. Farmers using REN-powered cooling technologies reported income increases of up to 40%. As of the end of 2023, four countries and the European Union had established REN targets specifically for the agricultural sector. For instance, as of 2022, of the total 1165 MW of off-grid solar-powered irrigation systems installed globally, 1083 MW were installed in India. India also announced its intention to replace diesel fuel use in agriculture with REN by 2030. South Korea, on the other hand, has set a target of reaching 10 GW of agrivoltaic system capacity by 2030 [21]. The European Union, through its Common Agricultural Policy (CAP) for 2023–2027, aims to reach 1.5 GW of REN capacity in agriculture by 2027. This policy supports investments in REN, including biogas production on farms, with plans to establish 1556 MW of new REN capacity [22]. CAP supports the participation of approximately 180,000 farms in REN initiatives and promotes energy efficiency and precision agriculture for improved resource management [22]. The European Commission also published an energy transition strategy for the EU’s fisheries and aquaculture sectors [23].
Recently, agrivoltaic applications, which allow for the simultaneous production of crops and energy while enabling more efficient use of agricultural land, have gained prominence. Germany, France, and Japan are leading countries in agrivoltaic practices, with others following suit through pilot projects [24]. Notable examples include the 7 MW Grosolar agrivoltaic facility in Maharashtra and the 3 MW Solar-Agri electricity model in Gujarat, both in India [25]. Studies in Portugal demonstrated that agrivoltaic systems are more efficient than either standalone agriculture or solar energy production. The electricity generated serves both for self-consumption and grid sales, creating a diversified income stream [26]. As of 2024, the USA installed 73 MW of agrivoltaic capacity on cultivated farmland and over 5 GW on grazing lands [27]. In 2023, Türkiye launched its first agrivoltaic project with a capacity of 122 kW [28].
Solar-powered mini-grid projects are improving energy access for agricultural operations such as water pumping for irrigation, food drying, milling, and cold storage [29]. Given that most rural agricultural energy demand occurs during daylight hours, installing mini-grids near farmland offers a practical solution to meet this demand [30]. In Nigeria, ongoing projects enable farmers to carry out production-related activities using electric vehicles and have provided power for rice and grain mills as well as cold storage facilities used in fish processing [31]. In Uganda, a 600 kW battery-supported hybrid solar mini-grid established on the Lolwe Islands replaced fossil fuel usage in applications such as ice production and fish drying [32].

1.2. Studies Focusing on Renewable Energy Optimization Strategies

The use of REN sources in rural areas is very important for sustainable development. Households in remote or isolated regions [33], along with agricultural businesses and industrial complexes, can obtain electricity from commercial microgrids [34]. Advanced modeling and simulation tools are employed in the planning and feasibility evaluation of such systems. HOMER Pro (Hybrid Optimization Model for Electric Renewables) is a powerful tool used to optimize microgrid architecture and ensure maximum operational efficiency [35]. In HOMER Pro, various combinations of components, including photovoltaic (PV) panels, wind turbines, battery storage, and fuel cells, can be efficiently optimized for both grid-connected and standalone systems [36]. Models developed using the HOMER Pro software can determine the most cost-effective energy system for a given geographical area. Optimal configurations can be derived using both optimization and sensitivity analyses.
In applications focusing on the optimization of grid-connected large-scale wind and PV systems [37,38,39], researchers found that wind energy systems may be more cost-effective than photovoltaic systems [40]. Some studies concluded that solar–diesel hybrid power systems are more sustainable for rural areas [41]. However, when generators are used instead of grid connections in hybrid systems combining wind and solar energy, the initial investment cost increases by 4–5 times, and the payback period extends by 5–8 times [42]. In a study conducted in southern Ghana, the technical and economic feasibility of a hybrid system incorporating solar, wind, and diesel generators was assessed [43,44,45], and optimal configurations were identified based on LCOE and NPC. These findings enabled policymakers and stakeholders in Ghana to shape strategic energy goals. Another study conducted in rural Malaysia revealed that standalone wind–solar hybrid systems were more stable and economical than single-source systems [46,47,48,49]. These results support the thought that independent hybrid REN systems are among the most reliable options for ensuring a continuous power supply in rural areas at lower LCOE values [50,51]. Despite the growing body of literature, most existing studies investigate only one or two configurations in isolation and therefore lack a systematic comparison of multiple hybrid architectures under consistent technical and economic assumptions.
Environmental impact assessment is another important aspect of hybrid energy systems. In optimization efforts, one of the goals, besides minimizing LCOE, is to reduce emissions of gases such as CO2, SO2, and NOx [52,53,54]. For example, the optimization of a hybrid energy system supported by batteries, featuring a combination of PV, wind turbines, and a diesel generator, demonstrated a significant reduction in carbon emissions. Specifically, the system achieved an approximate 62% decrease in emissions compared with a fossil fuel-only system while maintaining a low LCOE [55,56].
The main objectives of integrating various REN sources into Hybrid Renewable Energy Systems (HRESs), including PV/hydro/diesel, PV/diesel/wind, PV/hydro/wind, or PV/hydrogen/fuel cell/wind combinations, are to improve the efficiency, reliability, and availability of electricity generation in both rural and urban settings [57,58,59,60,61,62,63,64,65,66]. It is also recommended that standalone hybrid systems be paired with battery storage systems to improve reliability and performance [67]. Integrating solar and wind energy with battery or grid electricity can yield a more cost-effective HRES capable of delivering reliable power 24/7. Lithium batteries are particularly well-suited for energy storage in standalone hybrid systems [68,69,70,71,72,73,74,75,76]. Some studies have shown that adding a battery bank to PV–wind hybrid systems can reduce grid dependency from 45% to 24%, while increasing the energy supply reliability from 65% to 76% [77]. Design optimization of these hybrid systems to reduce energy production costs is a rapidly evolving research area. Addressing challenges associated with battery use, particularly those affecting cost, is an integral part of this research. One such issue is the continuous decline in battery storage capacity during charge–discharge cycles. Calculations of the energy cost in PV/wind/battery hybrid systems often omit the effects of battery degradation and the actual service life of the storage units. However, without an optimal combination of energy sources, such an HRES cannot provide effective solutions. Furthermore, managing HRESs that incorporate multiple REN sources is complex and requires robust optimization tools. Furthermore, sensitivity analysis is often limited or entirely omitted, even though uncertainties in input parameters—such as solar radiation, wind resources, or fuel price—can significantly alter the techno-economic feasibility of hybrid systems.
One of the most current applications of REN systems in agriculture is agrivoltaics. Agrivoltaic systems offer a significant opportunity to reconcile the competing land use demands of energy and agriculture. Among recent studies on agrivoltaics, the integration of photovoltaic systems into greenhouses stands out [78]. The shading effect and electricity generation potential of PV panels and semi-transparent PV films installed on greenhouse roofs vary depending on the type of greenhouse, roof design, and mounting configuration [79,80,81]. PV implementation on greenhouse roofs also influences crop selection due to the impact of shading [82].

1.3. Objectives of This Study

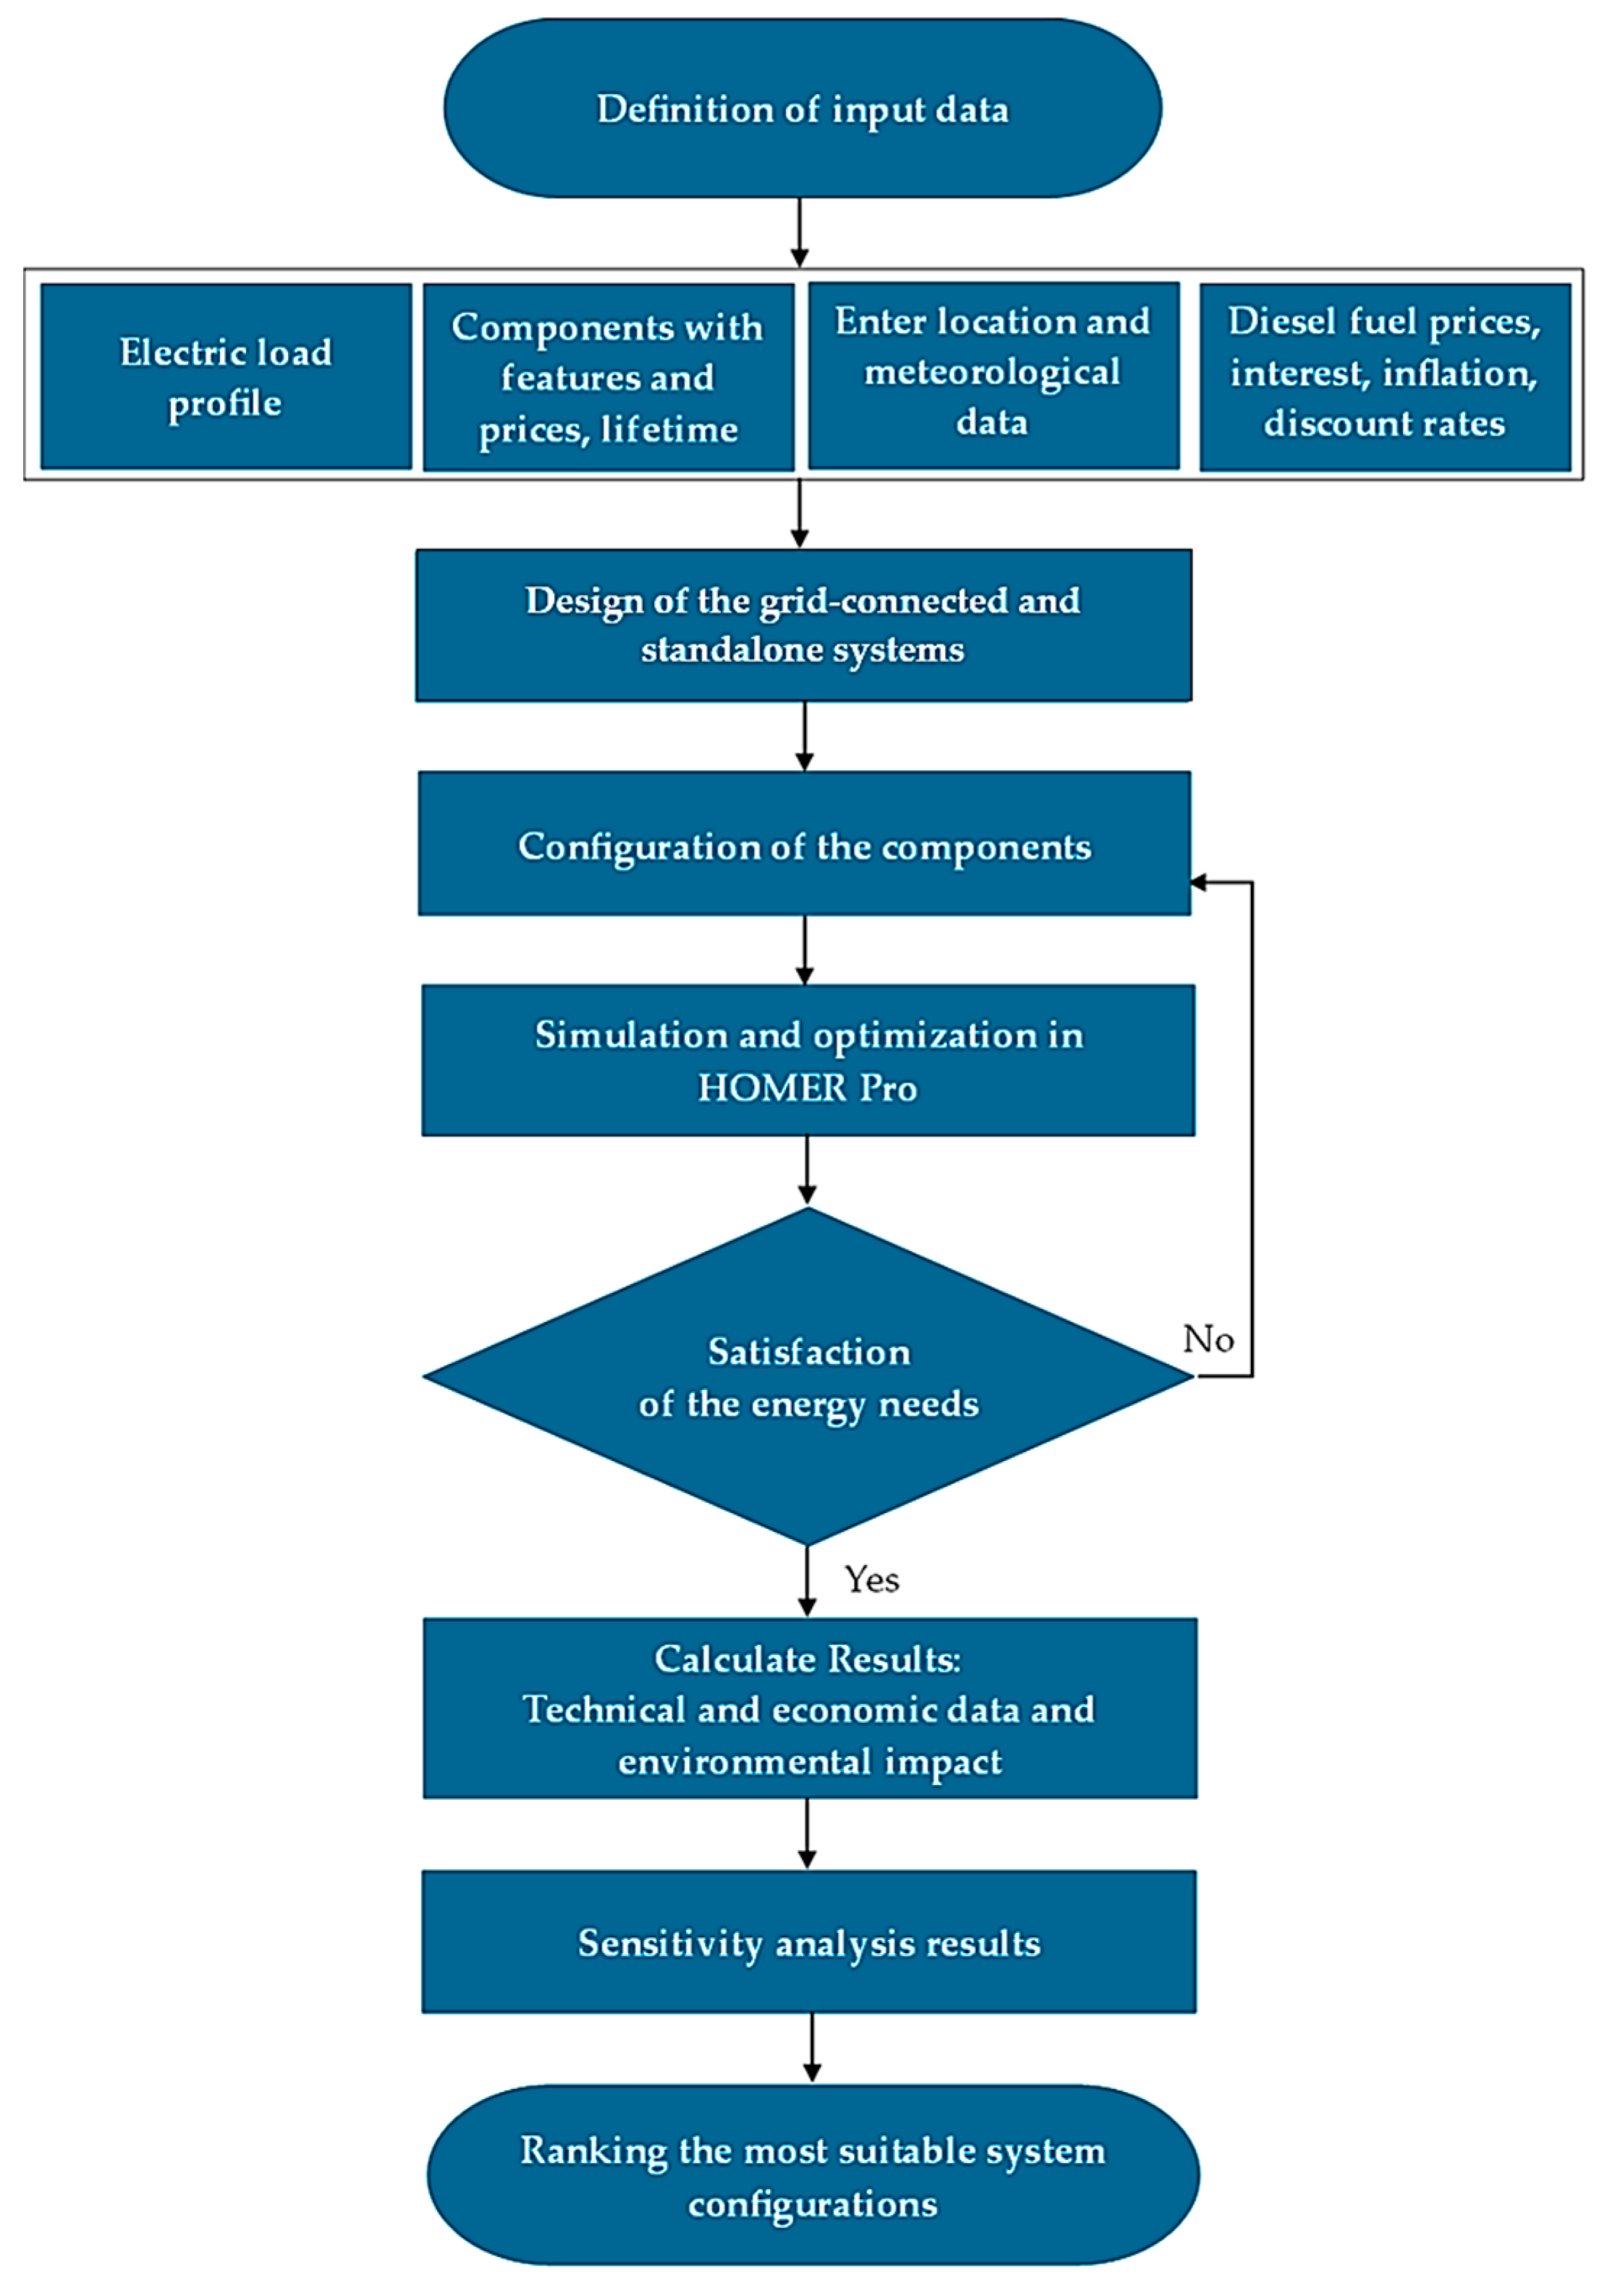
Through a series of optimization analyses, this study aims to establish the ideal hybrid system design—encompassing both grid-connected and off-grid scenarios—to power a greenhouse located in a rural area. This work systematically reviews previous research on the technical and economic feasibility of various hybrid power systems, identifying a critical gap in the lack of comprehensive comparative analyses of multiple configurations under consistent technical and economic assumptions. While prior studies have evaluated hybrid systems, such as diesel/PV, PV/wind, and standalone solar-wind systems, they frequently overlook factors such as battery degradation in cost calculations and typically provide limited sensitivity analysis regarding uncertainties in input parameters such as solar irradiation and fuel prices. This study directly addresses these deficiencies by presenting a systematic comparison of diverse hybrid configurations for a greenhouse facility, including both grid-connected and off-grid scenarios. A key contribution is the inclusion of a detailed sensitivity analysis that specifically considers the potential impact of high inflation and interest rates on system costs. In addition to optimization, this study also employs sensitivity analyses to evaluate the effects of changes or uncertainties in model inputs, such as average wind speed, solar irradiation, and future fuel prices [83]. The findings, therefore, not only identify the most cost-effective and environmentally friendly configurations but also provide a robust framework for evaluating the trade-off between financial constraints and environmental goals in regions with similar climatic and economic conditions. The results demonstrate that the integration of photovoltaic and wind energy significantly reduces emissions by balancing environmental impact with cost-effectiveness. This reveals that although fully renewable systems are less economically viable, they are ideal for achieving the goal of carbon neutrality. The results obtained are at a level that can provide insights for countries with similar climate and economic conditions. The flowchart illustrating the methodology used in this study is presented in Figure 3.

2. Materials and Methods

2.1. Site and System Design Parameters

The greenhouse complex analyzed in this study is located in Sandıklı, Afyonkarahisar, Türkiye (38.45° N; 30.25° E) (Figure 4). The complex consists of an administrative building, a heating center, and a total greenhouse area of 7200 m2. The greenhouse is covered with a plastic roof and polycarbonate (PC) panels on the sides. It is equipped with a thermal screen and utilizes geothermal energy for heating. The facility operates year-round, with uninterrupted production. It was proposed that the photovoltaic panels and wind turbines be installed on land situated to the north of the administrative building. The site was selected based on the absence of shading structures such as buildings, trees, or natural elevations, and the proximity to power transmission lines.
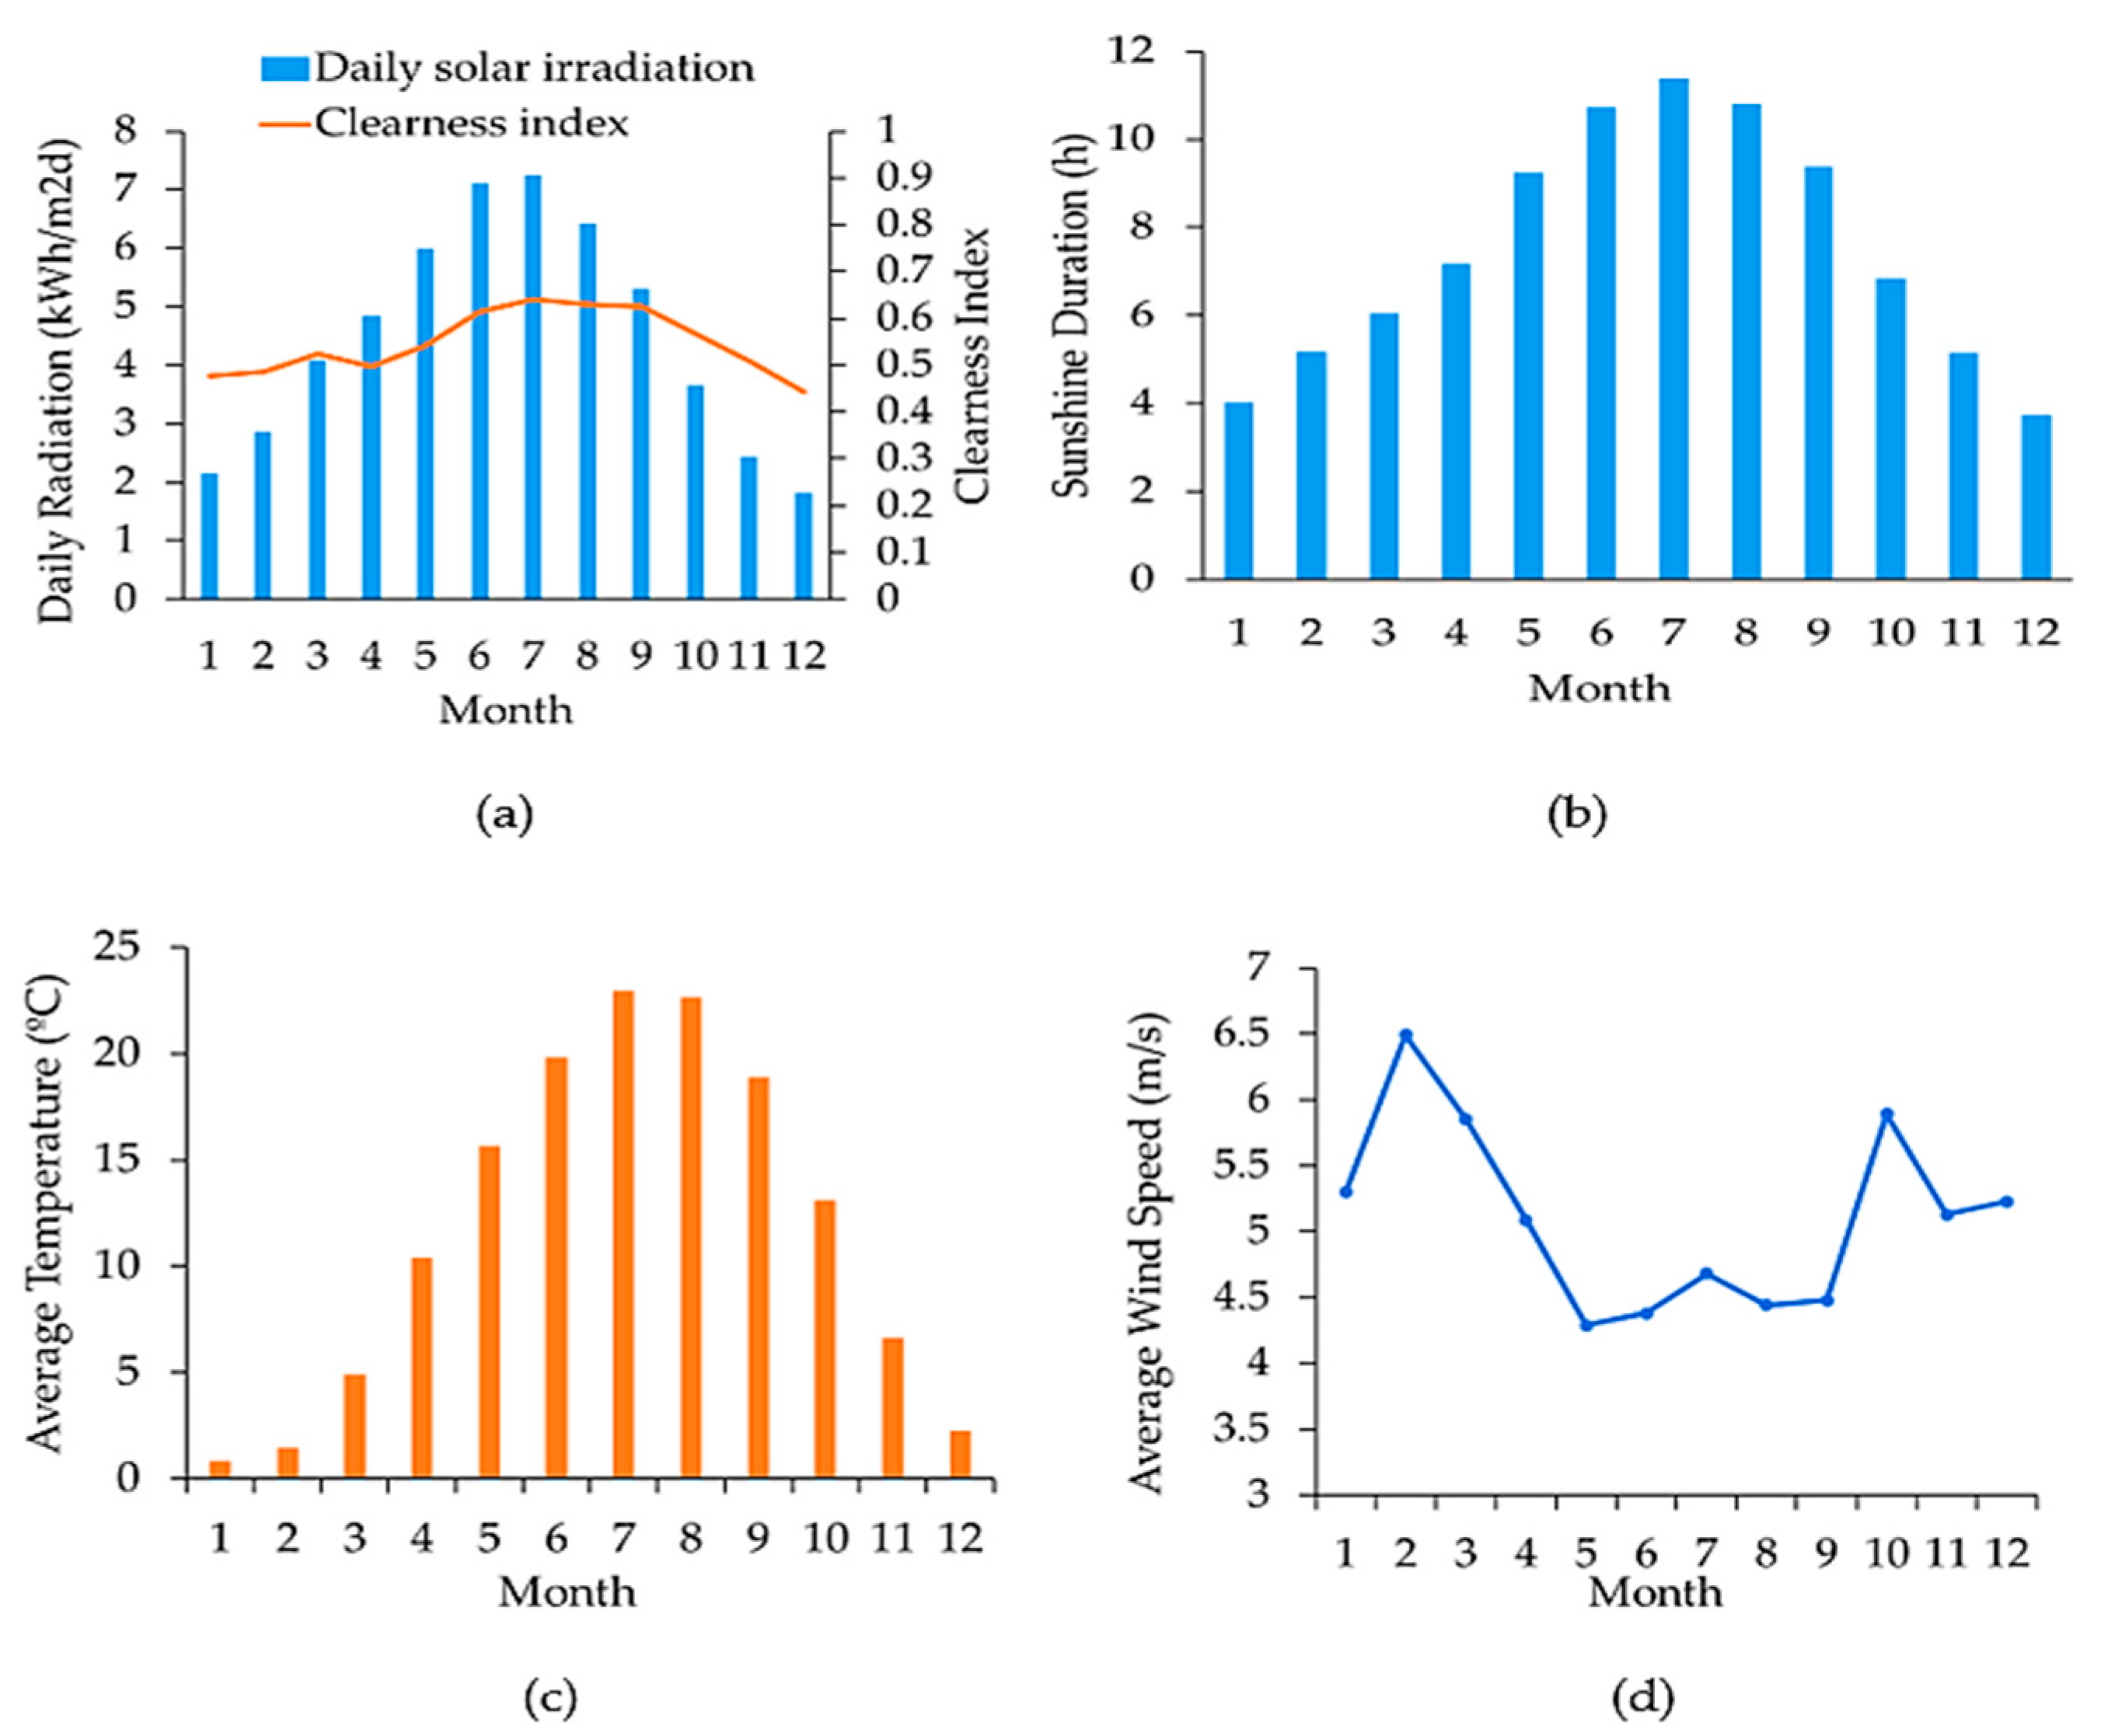
This study was initiated with an analysis of the facility’s daily electricity load profile and its annual variation to serve as the basis for energy system design. Regional data on daily solar irradiation, sunshine duration, temperature, and wind speed (Figure 5a–d) were obtained from the Surface Meteorology and Solar Energy database (NASA) [84] and were used to evaluate the REN potential of the area.
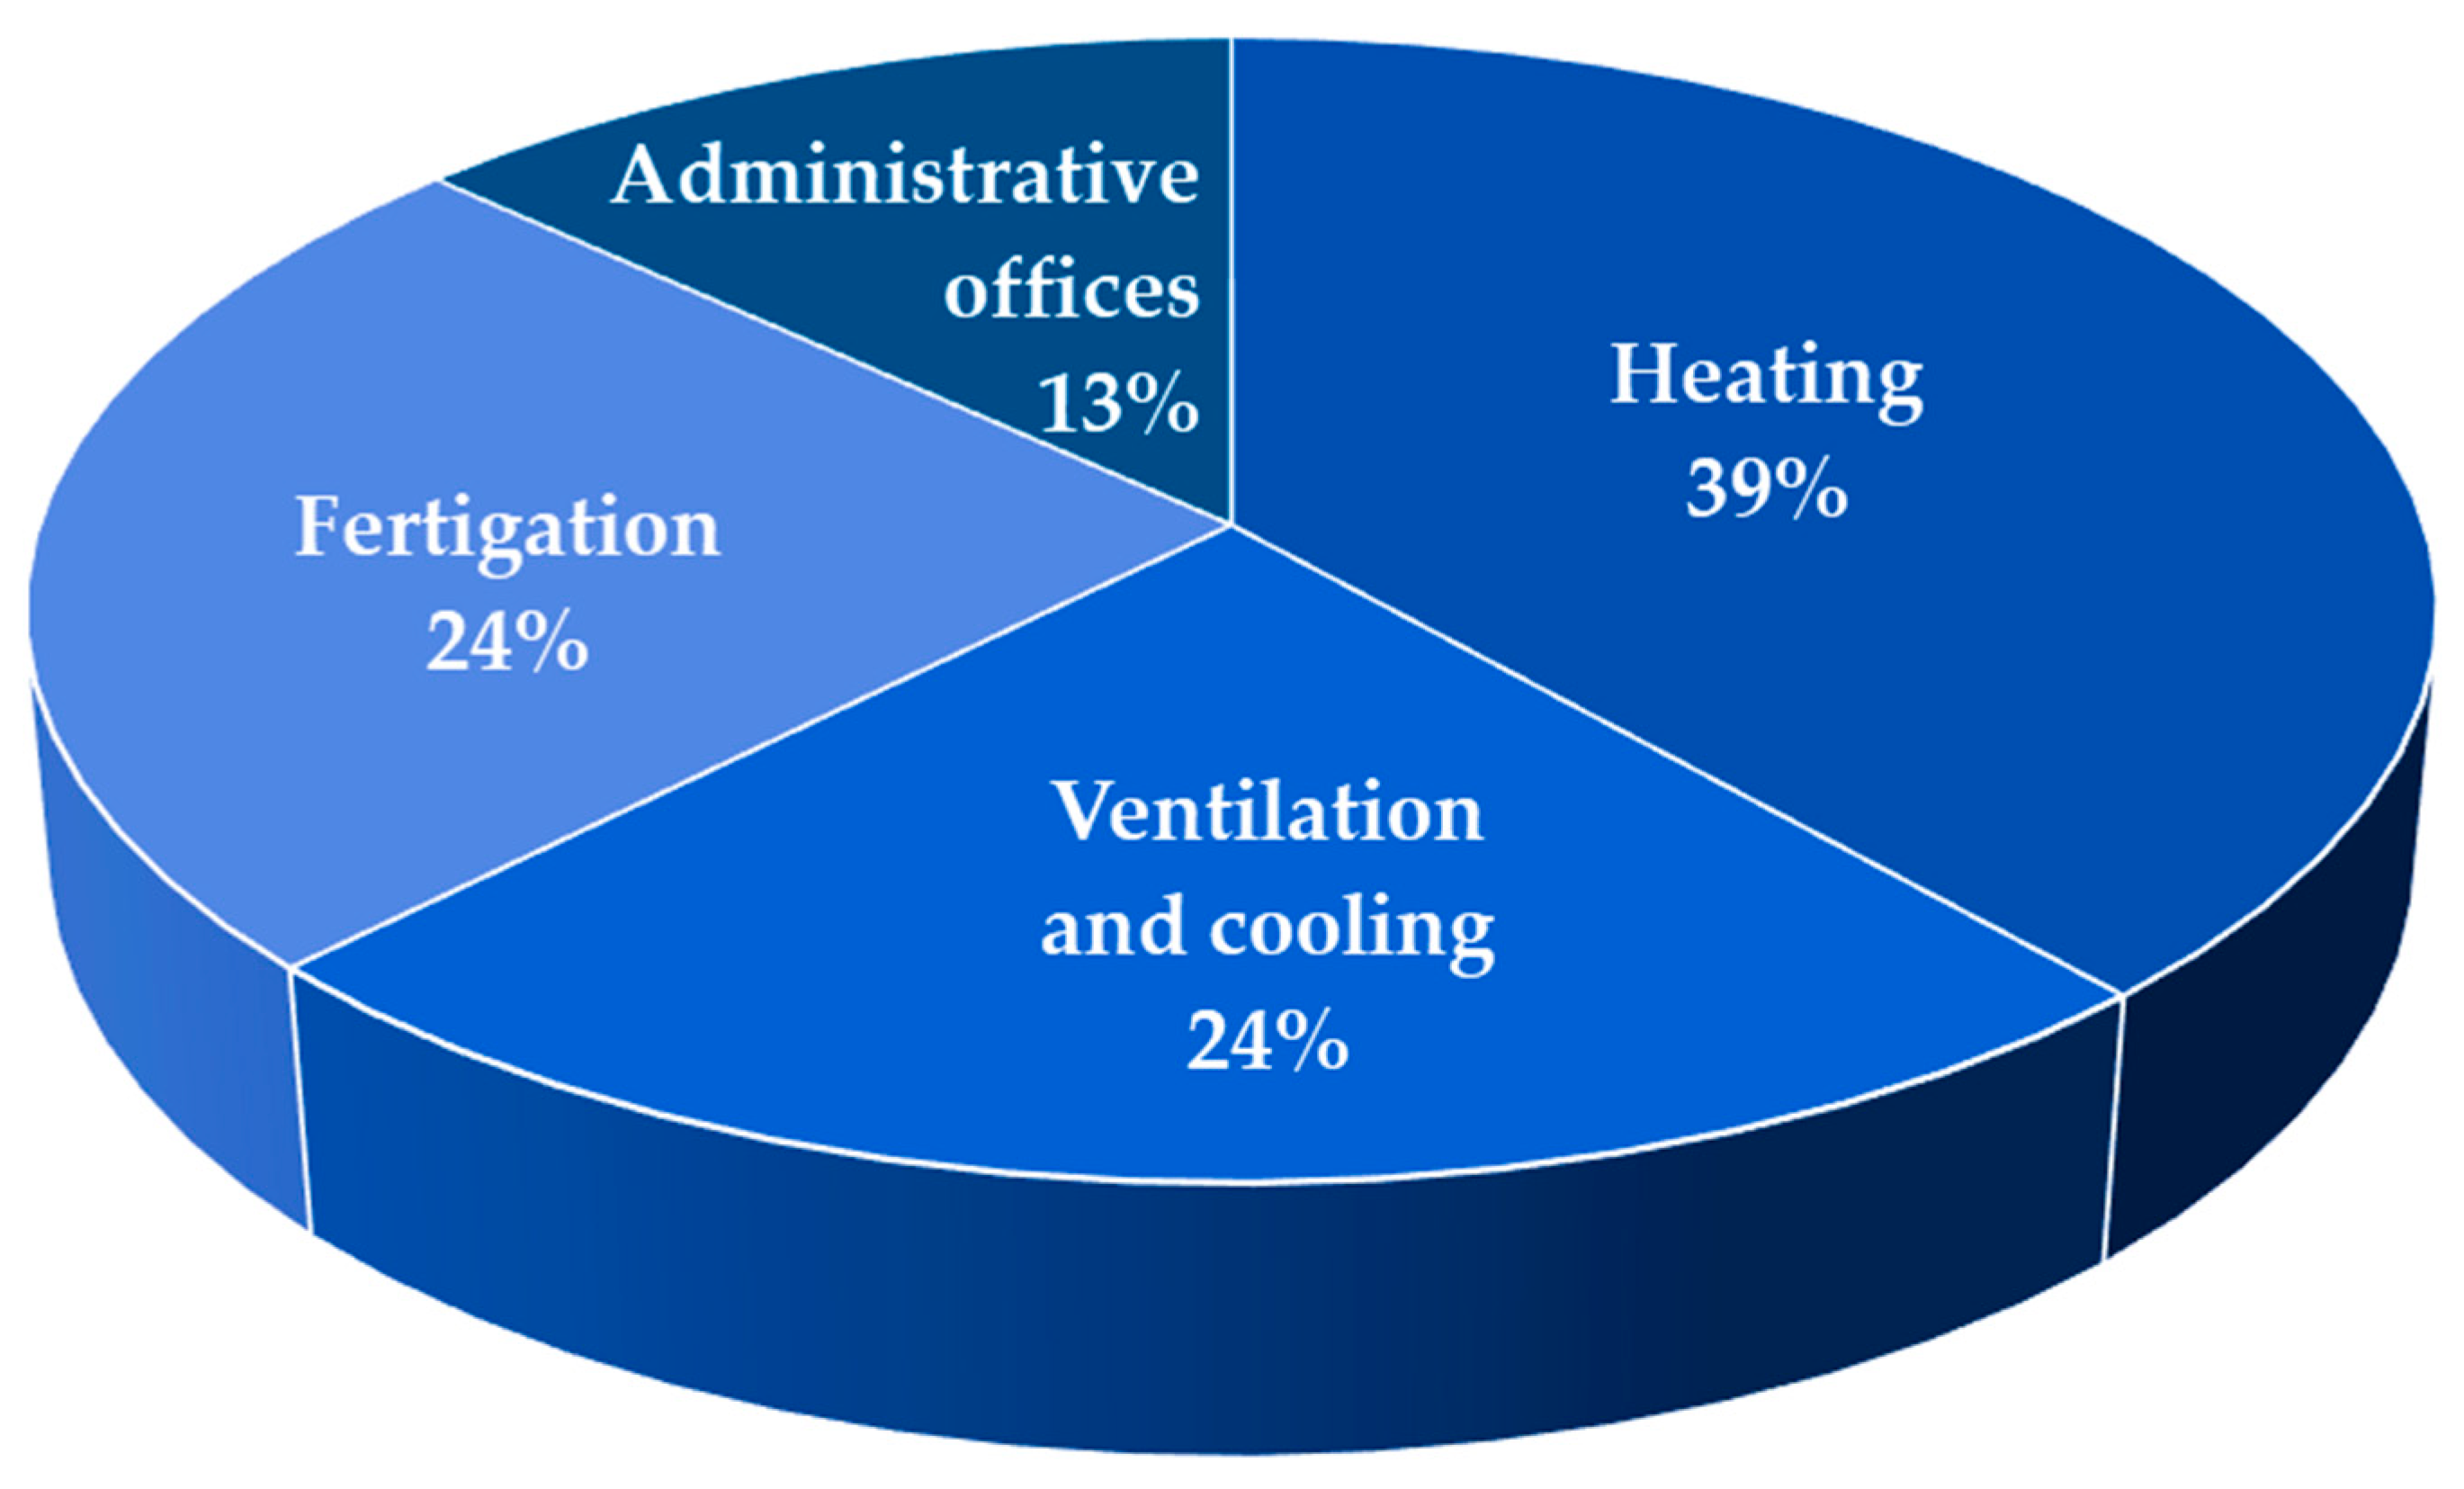
Simultaneously, the facility’s electrical load distribution was determined by calculating the electricity consumed by ventilation, cooling, irrigation–fertilization, and heating systems, as well as the energy demand of the administrative offices. In these calculations, the rated power and daily operating hours of electrical machines and devices were considered (Equation (1)) [85], and energy consumption profiles were developed by comparing them with monthly electricity bills.
L s = n = 1 N Q n P n H n
In this expression, LS corresponds to the total energy demand (kWh), Qn refers to the number of units, Pn specifies the rated capacity of each unit (kW), and Hn denotes the duration of operation (h).
The components utilized in the analysis of the proposed grid-connected and standalone systems (as detailed in Table 1) were carefully chosen based on the criteria of being both domestically produced and easily accessible. Using the optimization feature of the software, economic indicators such as the NPC and LCOE were obtained for the most suitable systems that could meet the facility’s load.

2.2. Mathematical Modeling of Energy Systems

2.2.1. HOMER Pro Software

The systems were technically and economically analyzed using HOMER Pro (ver.3.14.2). The software allows users to model and optimize a wide range of system configurations, including those that incorporate solar PV systems, wind turbines, batteries, diesel generators, and grid connections. The software also provides access to meteorological data for the simulation region. The operation of a hybrid microgrid can be simulated with time intervals ranging from one minute to one hour for an entire year [86].

2.2.2. Photovoltaic Systems

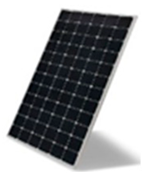
Photovoltaic modules function by converting incident solar radiation into direct current (DC) electricity via semiconductor materials. The conversion efficiency varies, with typical values ranging from 5% to 20% based on the specific cell configuration. Equation (2) can be used to calculate the power output of a PV array [86]:
P P V = Y P V f P V G T G T , S T C 1 + α P T c T c , S T C
In this context, YPV represents the total installed capacity of the PV array. The calculation also incorporates fPV, the degradation factor; GT, the solar irradiance on the PV surface [kW/m2]; and GT,STC, the irradiance under standard test conditions (1000 W/m2). Furthermore, the PV temperature coefficient, αp [%/°C], along with the PV cell temperature, Tc, and the cell temperature under standard test conditions, Tc,STC (25 °C), are also used.

2.2.3. Wind Turbine Systems

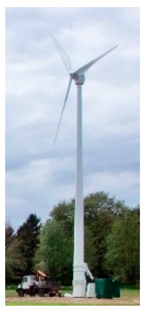
Wind turbines convert the kinetic energy of the wind into electrical energy using an alternator. The electricity generated is a function of multiple variables, such as the tower’s height, the turbine’s specific technical properties, the prevailing wind speed distribution, and the system’s inherent energy conversion efficiency [87,88]. Equations (3) and (4) can be used to calculate the power generated by a turbine [89]:
P wt t = 0 ,   v t v cut-in   o r   v t v cut-out P r v 3 t v cut-in 3 v r 3 v cut-in 3 ,   v r > v t > v cut-in P r ,   v cut-in v ( t ) v r
In this study, Pr, vr, vcut-in, and vcut-out are used to denote the turbine’s rated power, rated wind speed, and the lower and upper operational thresholds. Considering that wind velocity changes with altitude and measurement height, the turbine power output Pwt is derived from hub-height wind speed values [90].
v t = v r e f H W T H r e f α
where Href, the reference height, and HWT, the turbine hub height, are pivotal parameters in wind energy calculations. The wind shear coefficient, α, typically ranges from 0.1 to 0.4 [91].

2.2.4. Diesel Generator Systems

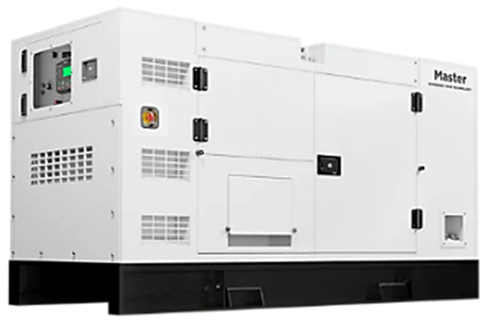
A generator is an electric machine that converts mechanical energy into electrical energy using fossil fuels. The generator’s efficiency increases logarithmically with output power. In diesel generators, the cost per kW is higher for lower-capacity units. Fuel consumption is calculated using Equation (5) [92]. In this study, the generator size was determined through optimization.
F u e l c . DG = ( a · T DG + b · P DG )
Here, Fuelc.DG denotes the diesel generator (DG) fuel consumption rate in liters per hour (L/h). The parameter a corresponds to the fuel intercept coefficient (L/kWh), taken as 0.0161 L/kWh at rated conditions. TDG represents the generator’s rated capacity in kilowatts (kW), while b represents the fuel slope (L/kWh), assigned a value of 0.2486 L/kWh of output. Finally, PDG refers to the actual power output of the generator (kW).

2.2.5. Battery Storage

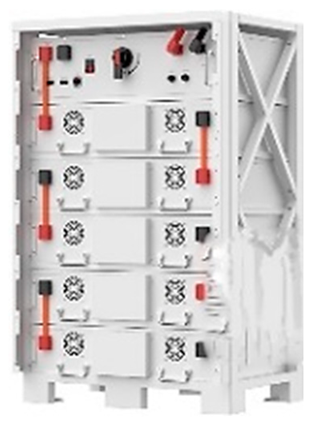
The battery bank, composed of series and parallel-connected batteries, functions as a backup system that maintains voltage stability throughout the load period. Equation (6) can be used to calculate battery capacity [92]:
C Batt = E L A D η i n v D O D η b a t
In this formulation, EL stands for the mean daily energy demand of the load (kWh/day), while AD indicates the number of days the system must operate independently without charging. The parameter ηinv represents the efficiency of the inverter, DOD specifies the allowable depth of discharge of the battery, and ηbat corresponds to the efficiency of the battery storage unit.

2.2.6. Inverter

The inverter converts direct current from photovoltaic modules and battery storage into alternating current. This AC power meets the operational demands of electric motors, compressors, and pumps in the greenhouse facility. Inverter power is calculated using Equation (7) [93,94]. In this study, the inverter capacity was optimized as part of the hybrid system design.
P i n v = P p e a k η i n v
where Ppeak corresponds to the aggregate peak power requirement of the system.

2.2.7. Grid (G)

The greenhouse operation holds a 150 kW electricity contract with a utility provider. Power is purchased based on an agricultural irrigation tariff. According to the Law on the Use of Renewable Energy Resources for Electricity Generation published by Türkiye’s Energy Market Regulatory Authority (EMRA) [95], surplus energy from renewable systems can be sold, generating revenue for the operation. The costs of imported and exported electricity are offset. These energy tariffs are updated quarterly. For modeling purposes, the buy and sell prices set by the Energy Exchange Istanbul (EPIAS) for April–June 2025 are USD 0.096/kWh and USD 0.076/kWh, respectively [96].

2.3. Economic Analysis

2.3.1. The Net Present Cost (NPC)

Referred to as the life-cycle cost, the Net Present Cost (NPC) captures the present value of all expenditures required for installing and operating a component throughout the project period, offset against the present value of revenues generated in the same interval. Equation (8) [97] can be used to calculate the NPC:
N P C = R t 1 + i t
In this equation, Rt represents the net cash inflow or outflow in a given period t. The term i is the discount rate, while t denotes the number of time periods. The real discount rate is used to convert between one-time costs and annualized costs. Equation (9) [98] can be used to calculate the actual discount rate:
i = i f 1 + f
where i′ is the nominal discount rate and f is the expected inflation rate. The discount rate of Türkiye was found to be 9.75 [99].

2.3.2. Levelized Cost of Energy (LCOE)

The Levelized Cost of Energy (LCOE) is a crucial metric for evaluating and comparing different energy generation technologies. It represents the average lifetime cost of electricity generation for a system, typically a hybrid one, expressed as a single value (e.g., USD/kWh).
This metric is calculated by dividing the total discounted lifetime costs of the system by its total discounted lifetime energy production. It provides a standardized method for comparing the cost-effectiveness of various energy systems over their entire operational lifespan, allowing for a more equitable assessment of different technologies (e.g., solar vs. wind vs. diesel) with varying lifespans, capital costs, and operational expenses [100]. LCOE was calculated by Homer using the following Equation (10).
L C O E = C a n n , t o t E s e r v e d
where Cann,tot is the total annualized cost of the system (USD/yr) and Eserved is the total annualized load served (kWh/yr).

3. Results

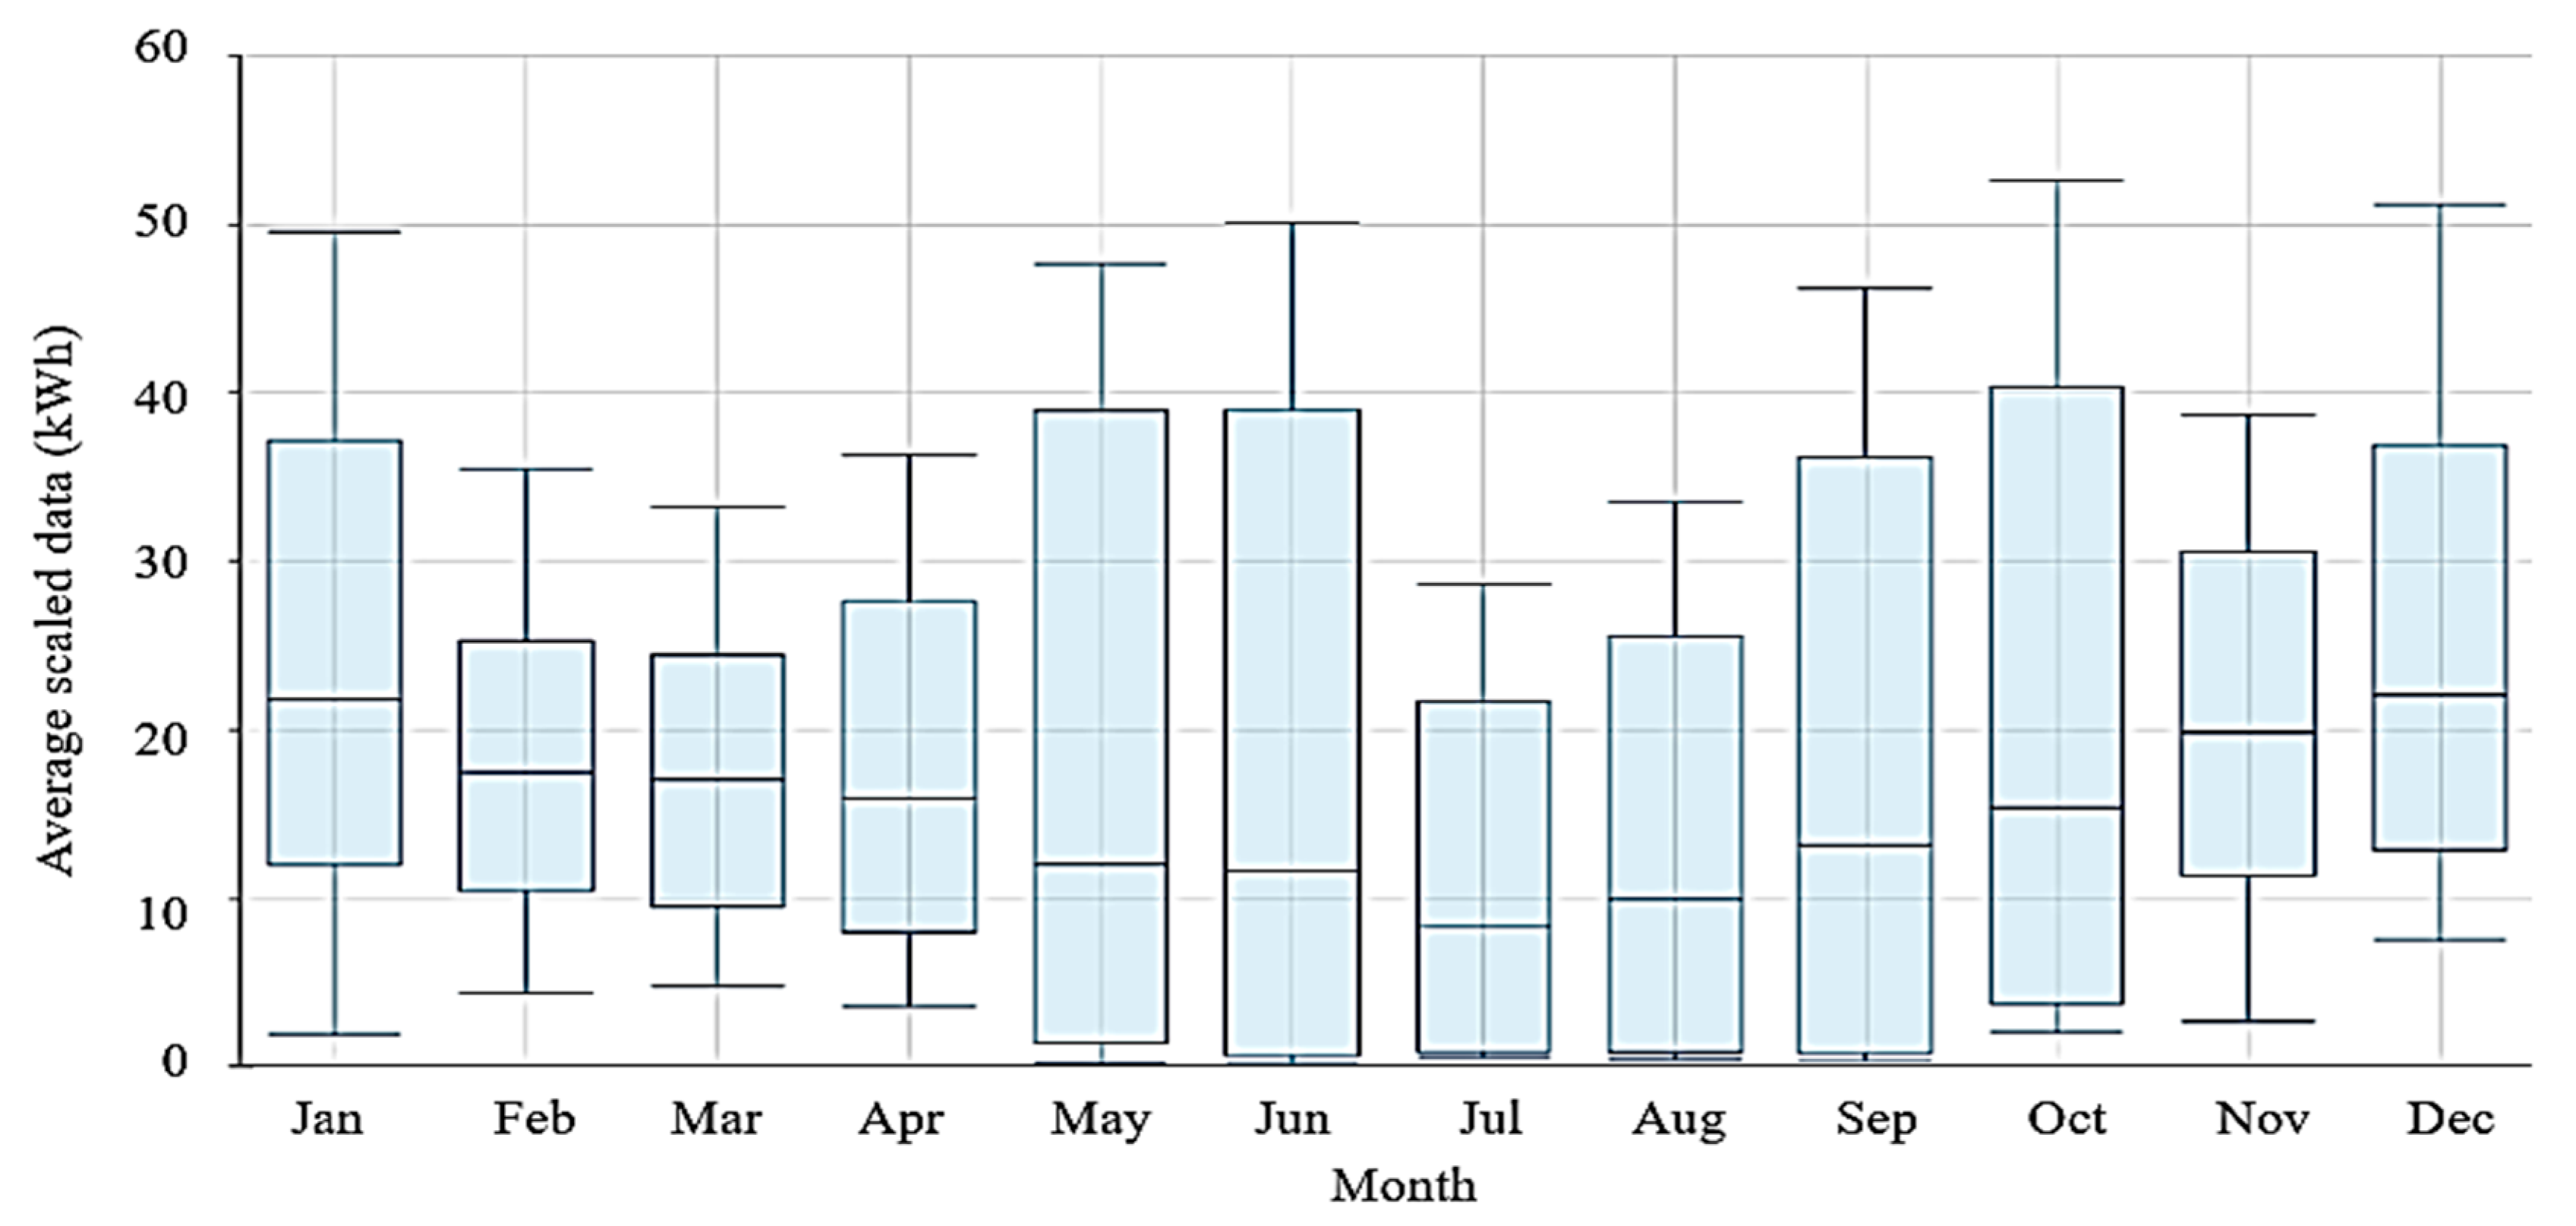
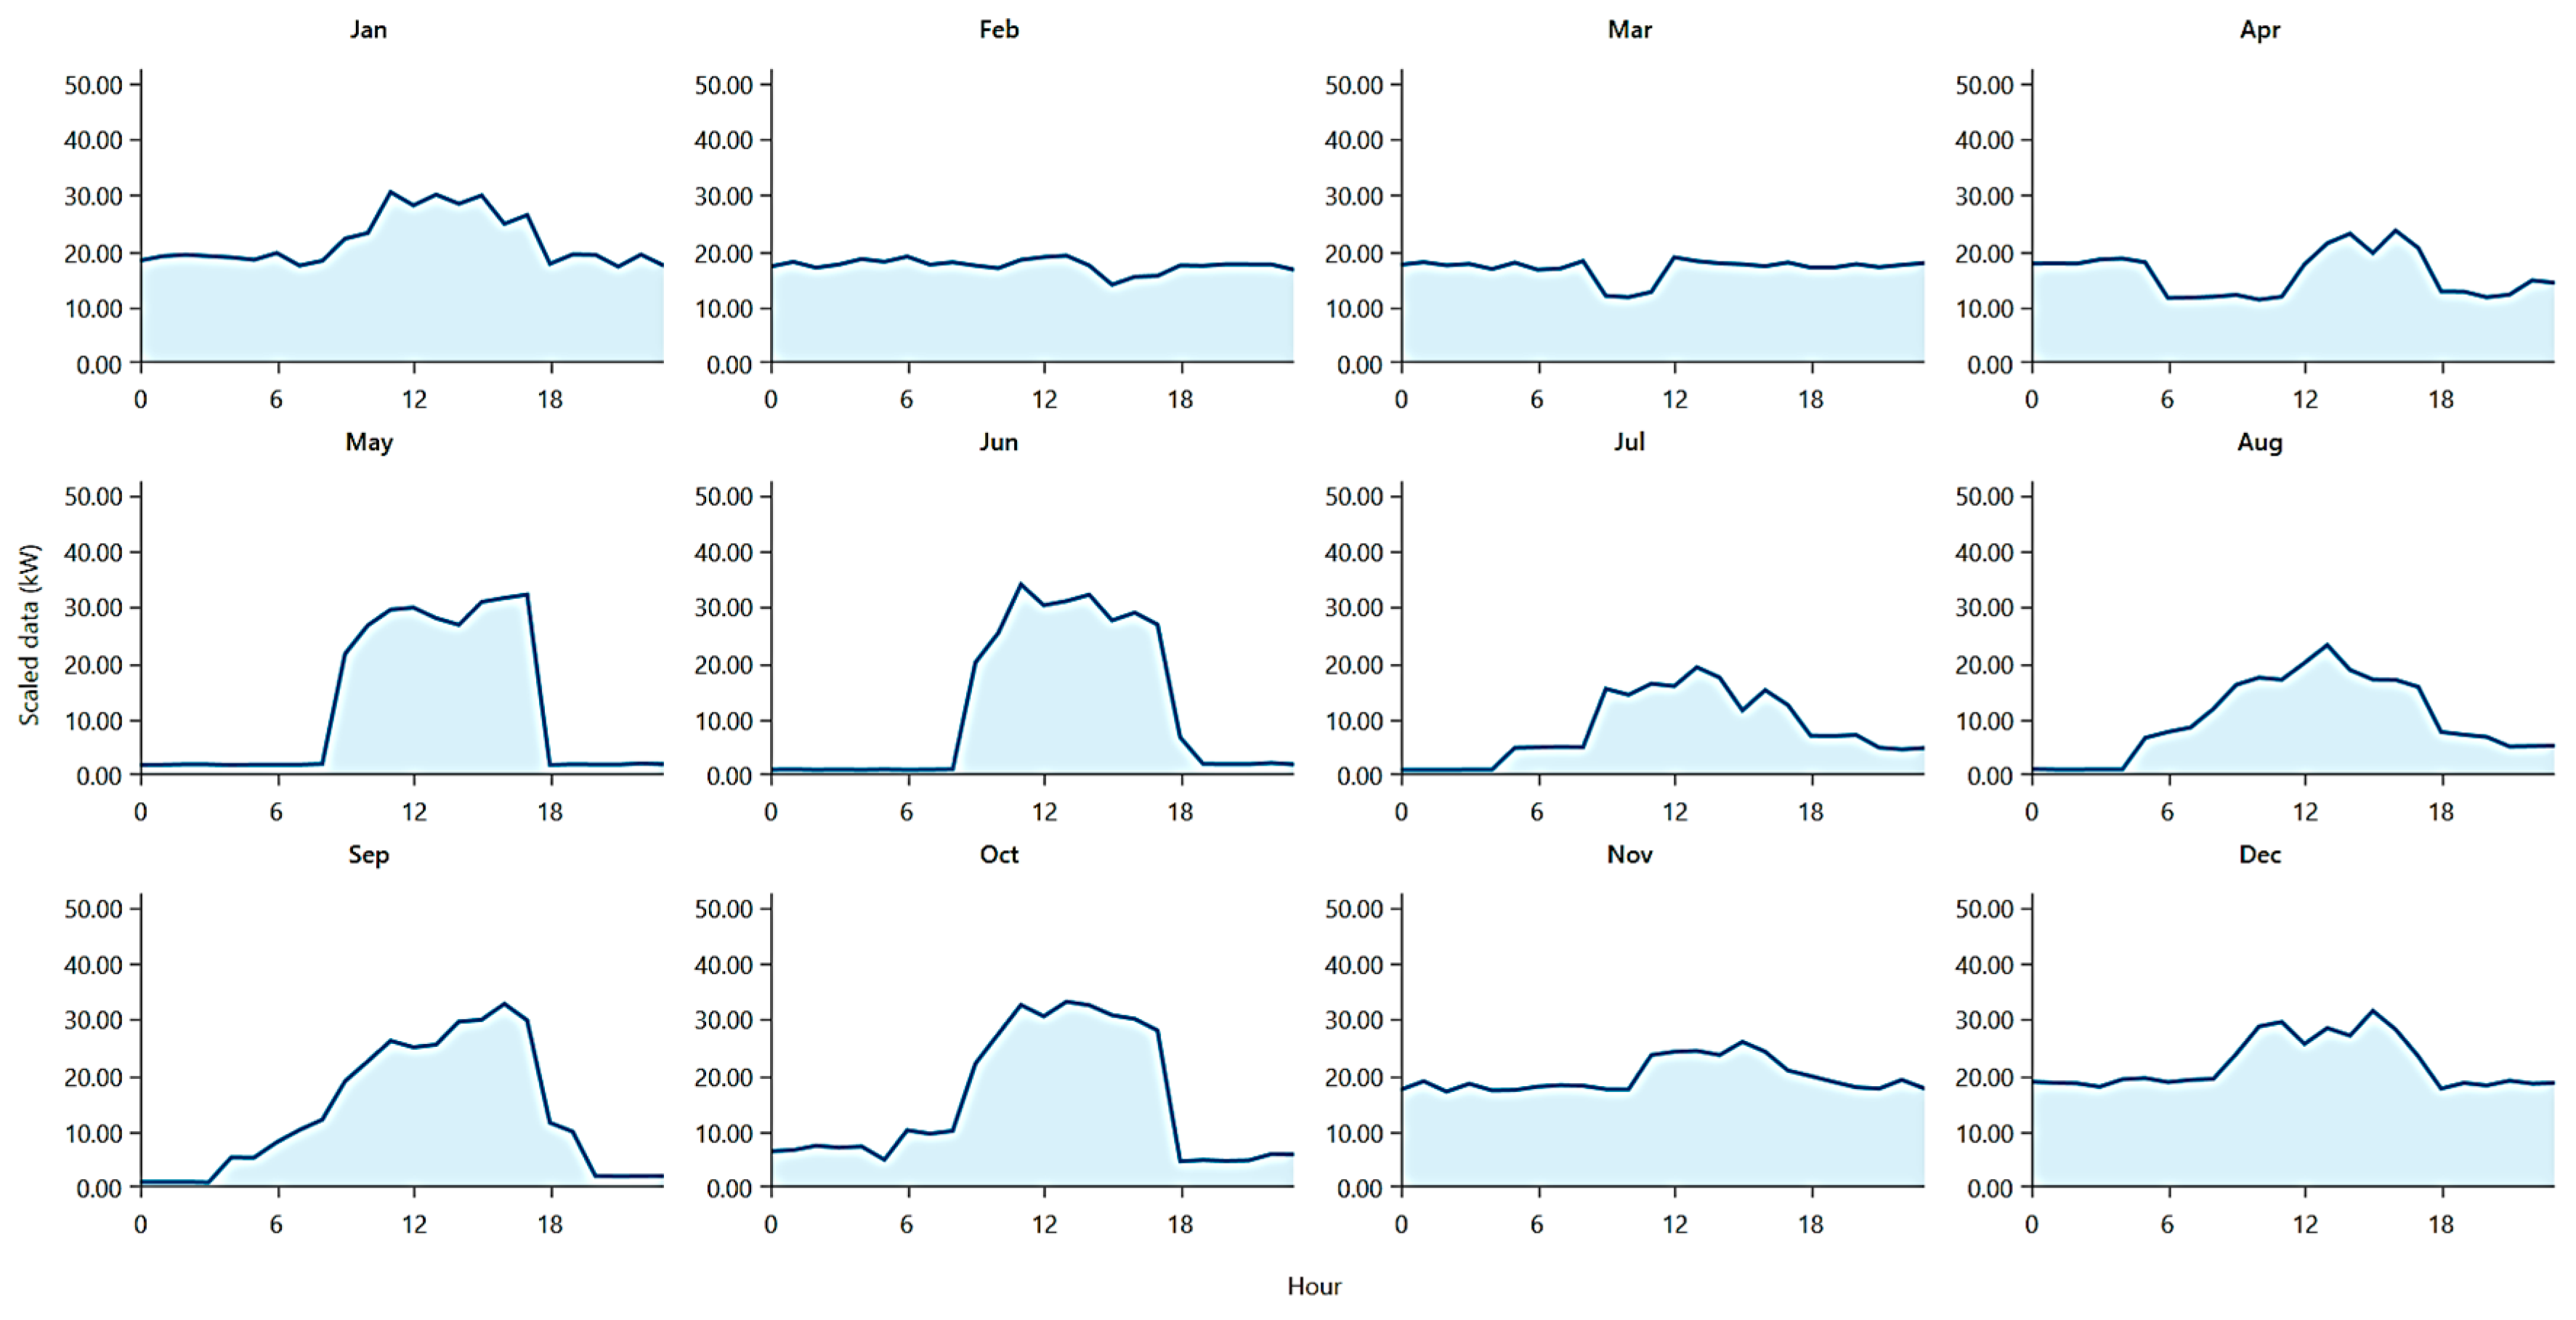
The electrical load distribution of the greenhouse is illustrated in Figure 6. The data show that the daily electricity consumption is 369.52 kWh, with a peak demand of 52.59 kW. The seasonal (Figure 7) and daily (Figure 8) load profiles of the greenhouse are presented below.
The load profile presents daily and seasonal consumption data, ensuring that the proposed hybrid system aligns with the greenhouse’s actual energy demand. This confirms the system’s technical feasibility and suitability for reliably meeting the facility’s operational energy needs.
During the optimization process, the objective was to maximize the Renewable Fraction (RF) and minimize LCOE, NPC, and emissions. The methodology offered a comprehensive framework that harmonized reliability, affordability, and environmental sustainability in energy access. To ensure adaptability to future uncertainties, sensitivity analyses were performed, considering varying inflation rates, fuel prices, solar radiation, and wind speeds under multiple scenarios. Additionally, the environmental impact (CO2 emissions) was evaluated to balance cost and sustainability.

3.1. Analysis of Grid-Connected Systems

Table 2 presents a thorough comparison of six hybrid energy system configurations, analyzing their performance across economic, operational, and environmental metrics.
i.
Economic Analysis: Among the examined configurations, [G/PV] was the most cost-effective design, with the lowest NPC (USD 282,492) and LCOE (USD 0.0401/kWh), and a moderate annual operating cost of USD 4601. However, systems such as [G/PV/WT/B], [G/PV/B], and [G/WT/B] incur higher NPCs (USD 624,729, USD 506,112, and USD 785,724, respectively) and higher LCOEs (USD 0.0845/kWh, USD 0.0718/kWh, and USD 0.2100/kWh) due to heavy reliance on photovoltaic generation and battery storage. The [G/PV] and [G/PV/WT] configurations, with integrated PV components and low maintenance needs, offer the lowest operating costs (USD 4601 and USD 5127 per year, respectively). By contrast, the wind turbine-based [G/WT/B] system includes two turbines, resulting in a much higher annual operating cost (USD 20,007) due to the intensive maintenance requirements.
ii.
Environmental Impact: [G/PV] was the most economically viable configuration, offering both low LCOE and substantial environmental benefits. Even though [G/PV/WT/B] requires higher investment, it achieves the highest CO2 emission reductions, making it ideal for environmentally focused regions. However, its high initial capital cost may limit broader applicability. [G/PV/WT], which shares similar PV and WT components but excludes batteries, offers a cost-effective alternative with comparable emissions; in contrast, wind-dominated systems such as [G/WT] and [G/WT/B] fail to significantly reduce carbon emissions, rendering them less suitable for modern energy demands.
In addition to offering CO2 emission reduction effects of 62.50% for the [G/PV/WT] configuration and 54.94% for the [G/PV] system, these hybrid systems provide versatile solutions for various energy demands by balancing both economic and environmental objectives. The [G/PV] and [G/PV/WT] configurations stand out as prominent hybrid alternatives due to their low NPC, competitive LCOE, and significant emission reductions. They are ideal for projects that aim to integrate cost-efficiency with environmental impact mitigation. On the other hand, while [G/PV/B] and [G/PV/WT/B] offer comparable emission reduction benefits (54.94% and 62.51%, respectively), their high NPC and LCOE values may limit their applicability in regions with limited budgets. Other alternative systems, such as [G/WT] and [G/WT/B], perform poorly across all evaluation criteria due to their high emissions and operating costs, which makes them unsuitable for future energy needs.
Ultimately, the [G/PV] configuration was determined to be the most optimal overall in terms of cost, reliability, and moderate emission reductions. Aside from this system, the [G/PV/WT] setup is also considered acceptable. Even though [G/PV/B] and [G/PV/WT/B] are ideal in terms of emissions, they require significantly higher investment. The [G/WT] and [G/WT/B] systems are the least favorable in terms of environmental benefits, with emission reductions of only 16.39% and 28.48%, respectively. Given their high costs, emissions, and inefficiency, the use of [G/WT] and [G/WT/B] systems is strongly discouraged.
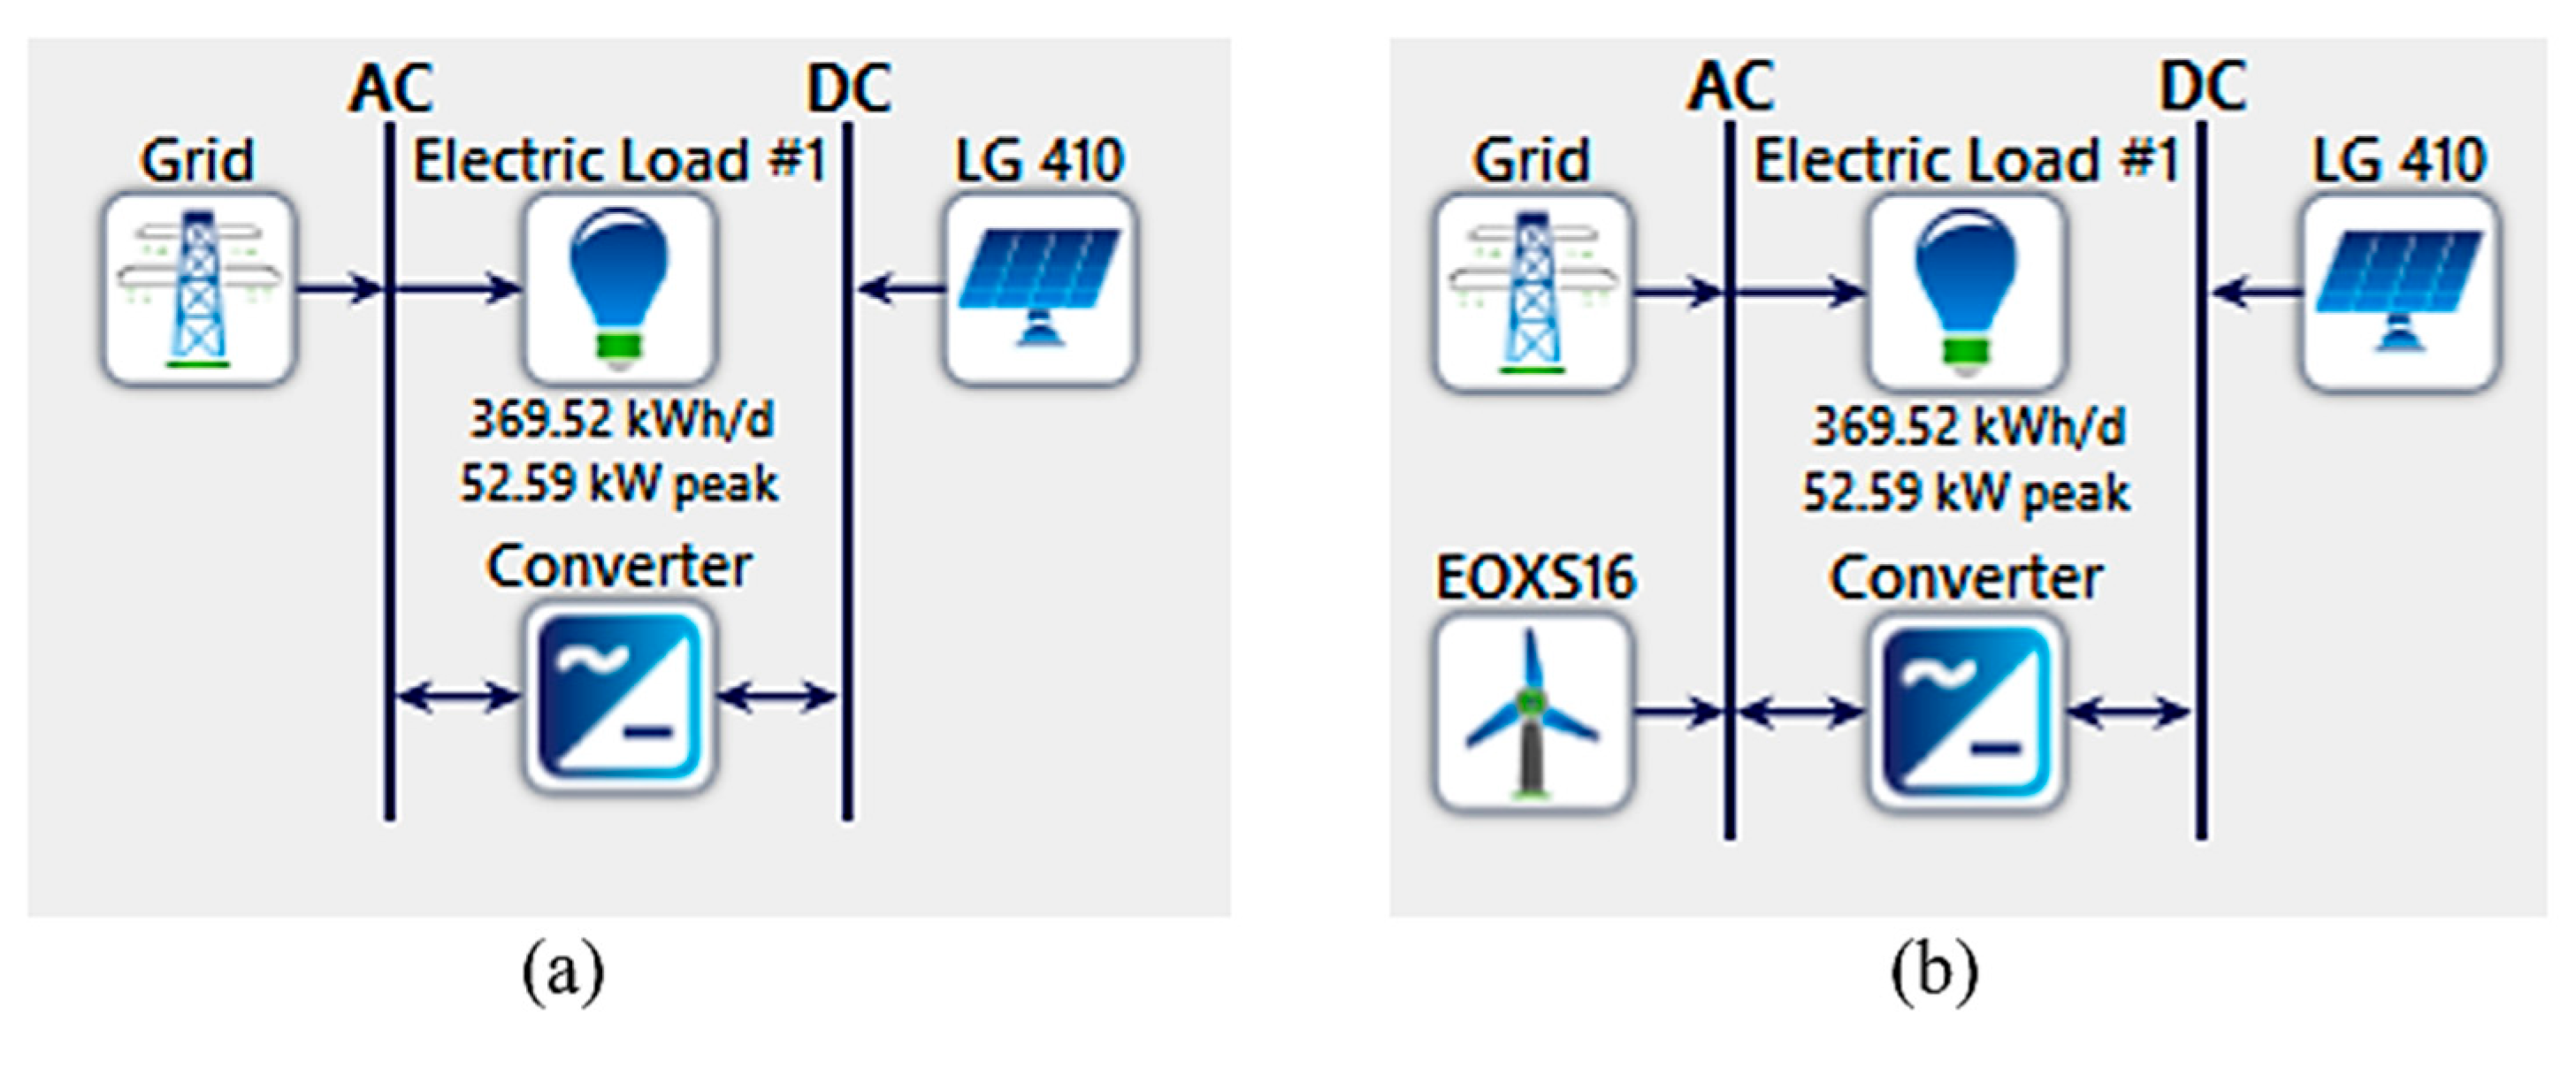
Figure 9 illustrates two grid-connected energy system configurations for greenhouses, labeled (a) and (b). These systems are designed to meet an energy demand of 369.52 kWh/d, with a 52.59 kW peak load.
  • [G/PV] system: The grid is the primary energy source, and PV panels supply additional energy and export any surplus solar generation back to the grid. Due to its low maintenance requirements, this system has the lowest operating costs. Its lifespan corresponds to that of the PV panels. One challenge, however, is that the system’s performance is dependent on daily solar irradiation and sunlight availability.
  • Environmental Impact: [G/PV] was the most economically viable configuration, offering both low LCOE and substantial environmental benefits. Even though [G/PV/WT/B] requires higher investment, it offers the highest CO2 emission reductions, making it ideal for environmentally focused regions. However, its high initial capital cost may limit broader applicability. [G/PV/WT], which shares similar PV and WT components but excludes batteries, presents a cost-effective alternative with comparable emissions. In contrast, wind-dominated systems such as [G/WT] and [G/WT/B] fail to significantly reduce carbon emissions, rendering them less suitable for modern energy demands.
Table 3 provides a detailed cost breakdown of the proposed hybrid energy system over its lifetime, including capital investment, component replacements, operation and maintenance (O&M), fuel, and salvage values.
Among the components, the PV panel system requires the highest initial investment at USD 153,414.63, with the total cost over its 25-year lifespan reaching USD 385,828.68. In contrast, the inverter is the most economical component, with an initial cost of USD 10,594.35. The total system costs USD 282,492.47, the majority of which arises from operation and maintenance expenses (USD 112,109.35). As the PV panels and the overall system have the same lifespan, their salvage value is excluded from the total; therefore, the system’s total salvage value of USD 3298.37 pertains solely to the inverter.
The annual energy demand of the greenhouse complex is 134,875 kWh, with a daily average consumption of 369.52 kWh. The proposed [G/PV] system can adequately meet this requirement and even generate surplus energy that can be sold back to the grid. The PV panels produce 224,311 kWh annually, of which 138,638 kWh is surplus energy sold to the grid (Table 4, Figure 10 and Figure 11a). Conversely, 60,771 kWh of electricity is purchased from the grid each year (Figure 11b). Consequently, 78.7% of the greenhouse’s annual energy demand is met by the PV system, while 21.3% is supplied by the grid. The total annual CO2 emissions amount to 38,408 kg.
An examination of Figure 11b reveals that minimal energy is drawn from the grid during the summer night hours. This is directly correlated with the high solar energy production during the day. As a pure [G/PV] system, the high solar irradiance during the summer months (Figure 5a) allows the system to generate a significant surplus of electricity. This surplus is transferred back to the grid, creating a revenue stream that offsets the cost of the energy consumed. This finding is further corroborated by the net energy figures in Table 4, which demonstrate that from April to October, the system consistently sells more energy than it purchases, resulting in a negative net cost for the greenhouse.
In essence, the system’s primary objective is to maximize the on-site utilization of free solar energy. During daylight hours, the high PV output not only meets the facility’s needs but also generates a substantial surplus. The net financial benefit derived from selling this surplus renders the active purchase of additional energy at night economically unnecessary. The model is optimized for cost-effectiveness, and during the summer months, this is achieved by harnessing the abundant solar resources rather than purchasing from the grid.

Sensitivity Analysis for Grid-Connected Systems

In the sensitivity analysis conducted for the proposed grid-connected [G/PV] system, three different scenarios (minimum, average, and maximum) were evaluated across five key parameters (Table 5). Given the lowest, average, and highest input values, the payback periods were calculated to be 12, 2.8, and 25 years, respectively (Figure 12). These findings indicate that the payback period for the proposed grid-connected system is minimized under average parameter conditions.
In Türkiye, the electricity purchase and sellback prices from and to the grid, as announced by EPIAS for the April–June 2025 period, are USD 0.096/kWh and USD 0.076/kWh, respectively. In addition to these base rates, four alternative scenarios were developed, and the corresponding cost and economic outcomes were analyzed. The results obtained are presented in Table 6. The region’s average solar irradiance and temperature data were used for the sensitivity analyses. Values for NPC, LCOE, IRR, and payback periods were determined based on variations in power price, sellback rate, and expected inflation. As seen in Table 6, under the assumptions of a power purchase price of USD 0.16/kWh, a sellback price of USD 1.18/kWh, and inflation rates of 5% and 10%, the shortest payback period was found to be 2.1 years. Moreover, the highest expected IRR value (47%) was achieved under these conditions. On the other hand, under the assumption of a 30% inflation rate, both the payback period and IRR performance became uncertain, indicating that the system would remain in debt throughout its operational lifespan. Elevated inflation adversely impacts the investment’s profitability. If the inflation rate remains at or below 5%, a significant improvement in profitability can be realized.

3.2. Standalone Systems

i.
Economic Analysis: The cost of the most economical configuration, [Gen/PV/B] (USD 1.19 million), is approximately three times lower than the most expensive system, [WT/B] (USD 4.52 million). The significantly higher cost of the [WT/B] system stems from its reliance on 12 wind turbines. Generator-based systems such as [Gen/PV] and [Gen/PV/WT] (USD 1.85 million and USD 1.92 million, respectively) fall into the mid-range cost category; however, their environmental benefits are notably limited.
From the perspective of energy production cost, the system with the lowest LCOE is [Gen/PV/B], with a value of 0.342 USD/kWh. In contrast, even though it is designed to achieve zero emissions, the [WT/B] system has the highest LCOE at 1.370 USD/kWh due to its high capital investment requirements. This underscores the inevitable trade-off between environmental sustainability and financial feasibility (Table 7).
On the other hand, PV-integrated configurations such as [Gen/PV/B] and [Gen/PV/WT/B] offer the lowest operational costs, attributed to their low fuel consumption (20,363 L/year and 17,574 L/year, respectively) and reduced maintenance needs (USD 39,321 and USD 37,155, respectively). On the other hand, the [WT/B] system has the highest operational cost (USD 100,917) due to the substantial maintenance requirements of its 12 wind turbines.
ii.
Environmental Impact: Configurations such as [Gen/PV/B] and [Gen/PV/WT/B], which provide both low LCOE and considerable environmental benefits, emerge as the most cost-effective alternatives. Despite their higher financial costs, the [PV/WT/B], [PV/B], and [WT/B] systems represent more suitable options for regions prioritizing environmental sustainability thanks to their zero-emission advantages. However, the substantial capital investments required by these systems may limit widespread adoption. However, generator-based systems such as [Gen], [Gen/PV], [Gen/WT], and [Gen/PV/WT] fail to yield meaningful reductions in carbon emissions, which makes them inadequate for meeting contemporary energy demands.
The [Gen/PV/B] system offers a balanced solution, achieving a 64.58% reduction in CO2 emissions. Similarly, [Gen/PV/WT/B] and [Gen/WT/B] provide slightly lower yet comparable environmental benefits, with reductions of 69.43% and 45.30%, respectively. These hybrid systems balance economic and environmental objectives, offering versatile solutions for different energy requirements. In particular, [Gen/PV/B] and [Gen/PV/WT/B] emerge as optimal hybrid configurations due to their low NPC, competitive LCOE, and significant emissions reductions, making them ideal for projects seeking both cost-effectiveness and environmental performance.
While [PV/WT/B], [PV/B], and [WT/B] systems offer the advantage of zero emissions, their high NPC and LCOE values may limit their feasibility in budget-constrained regions. Generator-based systems such as [Gen/PV], [Gen/PV/WT], [Gen], and [Gen/WT] perform poorly across all assessment criteria due to high emissions and operating costs, and are thus considered unsuitable for addressing future energy needs.
In conclusion, the [Gen/PV/B] configuration is recommended as the most viable option due to its low cost, reliability, and emissions reduction. The second and third preferred options are [Gen/PV/WT/B] and [Gen/WT/B], respectively. While [PV/WT/B], [PV/B], and [WT/B] are ideal for achieving carbon neutrality, they require substantially higher budgets. Due to their high costs, emissions, and inefficiency, the [Gen/PV], [Gen/PV/WT], [Gen], and [Gen/WT] systems should be avoided.
Figure 13 depicts three alternative configurations of the greenhouse energy system, identified as (a), (b), and (c), designed to cover a daily demand of 369.52 kWh and a peak load of 52.59 kW.
  • [Gen/PV/B] system: The system is primarily powered by the generator, with solar PV offering additional supply. Surplus solar energy is directed to the battery, and a inverter facilitates AC–DC conversion to decrease diesel usage. Despite these features, challenges persist, notably the dependence on diesel, relatively high operating costs, and constrained storage capacity.
  • [Gen/PV/WT/B] system: This hybrid system integrates wind generation to complement solar PV and reduce diesel dependency, particularly during nighttime or low-sunlight conditions. The generator ensures supply during peak load events. Key advantages include enhanced system reliability, reduced operational costs, and minimized environmental impact; however, it requires sophisticated control systems and is sensitive to local wind conditions.
  • [Gen/WT/B] system: As illustrated in Figure 13c, this configuration combines a diesel generator, wind turbine, inverter, and battery. The turbine decreases fuel consumption, while the generator compensates for reduced wind availability. Benefits include fuel economy and improved environmental performance, although challenges stem from intermittent wind resources and constrained battery storage.
The [Gen/PV/B] configuration emerges as the most cost-effective design, with the lowest NPC of USD 1.19 million and an LCOE of USD 0.342/kWh. It also maintains a reasonable annual operating cost of USD 39,321. In contrast, the [PV/WT/B], [PV/B], and [WT/B] systems incur significantly higher costs (USD 2.54 million, USD 2.80 million, and USD 4.52 million in NPC, and USD 0.759/kWh, USD 0.836/kWh, and USD 1.370/kWh in LCOE, respectively) primarily due to their heavy reliance on photovoltaic generation and battery storage. The [WT/B] system, in particular, has the highest operating expenses (USD 100,917/year), largely attributed to the maintenance demands of its 12 wind turbines, as well as high upfront costs.
Generator-based systems create considerably higher operational expenses due to elevated fuel consumption and frequent maintenance requirements. From an environmental perspective, the [PV/WT/B], [PV/B], and [WT/B] systems offer the best performance, producing zero CO2 emissions. Even though they demand high initial capital investment, they are viable options for projects prioritizing sustainability.
However, the generator-only system has the highest environmental impact, with annual CO2 emissions of 150,377 kg, making it the least eco-friendly option. The [Gen/PV/WT/B] and [Gen/PV/B] systems achieve CO2 emission reductions of 69.43% and 64.58%, respectively. These findings align with those reported by Woldegiyorgis et al. [101], Samatar et al. [102], and Eze et al. [103], indicating a balanced approach among cost-effectiveness, reliability, and environmental benefits.
Table 8 presents a detailed lifetime cost breakdown of the proposed hybrid energy system, including capital, replacement, operation and maintenance (O&M), fuel, and salvage values.
The generator (Gen) emerges as the most expensive system component, with a total cost of USD 686,854.60. This figure is predominantly driven by high fuel expenses (USD 629,308.62) and replacement costs (USD 47,430.39), partially offset by a USD 3976.55 salvage value. The photovoltaic (PV) system requires the highest initial investment at USD 97,697.78, resulting in a total lifecycle cost of USD 245,704.11 over a 25-year period. The lithium-ion battery system, despite zero fuel costs, has high initial (USD 60,000) and replacement (USD 37,121.02) expenses, along with a USD 5525.37 salvage value, totaling USD 246,119.59. The inverter, at USD 7902.16, is the most cost-efficient component.
The system’s total cost amounts to USD 1186,580.46, with the bulk attributed to generator fuel (USD 629,308.62) and O&M costs (USD 305,479.24). While diesel enhances system reliability, it increases operational expenditures. In contrast, solar power requires higher upfront capital but benefits from lower operating costs. The USD 10,968.59 salvage value reflects long-term financial offsets. For optimal cost-effectiveness, a balanced investment in REN technologies and conventional systems is essential.
The greenhouse complex has an annual energy demand of 134,875 kWh, translating to an average daily consumption of 369.52 kWh. The proposed hybrid systems easily meet this demand, with annual outputs of 201,092 kWh ([Gen/PV/B]), 187,092 kWh ([Gen/PV/WT/B]), and 139,723 kWh ([Gen/WT/B]).
The [Gen/PV/B] system generates 201,092 kWh annually, with 71.1% supplied by PV and the remaining 28.9% by the generator (Figure 14). Generator activity is most pronounced during winter months, when solar irradiance is minimal. Conversely, its operation is lowest from late May through mid-August, with projected fuel consumption ranging from 2 to 4 L/h and an average electrical output of 17.3 kW during this period (Figure 15a,b). The generator is expected to operate for 3355 h annually, consuming approximately 20,362 L of fuel.
Most systems generate excess electricity ranging from 2309 to 441,390 kWh while maintaining zero unmet load, ensuring robust storage capacity. Even the smallest energy surplus contributes to reliable energy buffering. However, three systems ([PV/WT/B], [PV/B], and [WT/B]) display minor annual unmet loads of 4922 kWh, 5007 kWh, and 6179 kWh, respectively. These deficiencies are not due to production limitations but rather temporary inefficiencies in storage or distribution. Overall, the proposed hybrid systems not only satisfy the greenhouse’s energy needs but also support reliable electrification and surplus generation.
Hybrid systems combining PV, wind turbines (WT), diesel generators, and battery storage offer economically and environmentally balanced solutions. With REN shares ranging from 32.4% to 63.1%, LCOE between USD 0.342 and USD 0.476/kWh, and NPC between USD 1.19 million and USD 1.22 million, they represent the most cost-efficient options. Although these systems require higher initial capital investments (USD 173,909 to USD 283,459) compared with diesel-only alternatives, they benefit from lower annual operational costs (USD 37,155 to USD 53,245) and significantly reduced CO2 emissions (45,966 to 82,256 kg/year). These advantages render hybrid systems not only economically viable but also environmentally sustainable, making them ideal solutions for off-grid applications. These findings are consistent with those reported by Woldegiyorgis et al. [101] and Kumar et al. [104].
In contrast, diesel-only systems require lower initial investments (USD 11,500 to USD 283,459), but pose long-term challenges, such as higher LCOE (USD 0.476 to USD 0.566/kWh), increased NPC (USD 1.85 million to USD 1.96 million), higher annual O&M costs (USD 53,245 to USD 74,252), and substantial CO2 emissions (136,556 to 150,377 kg/year). Even though fully renewable systems emit no CO2, their high capital costs (USD 883,702 to USD 1.93 million) and elevated NPC values (USD 2.80 million to USD 4.52 million) limit their feasibility. Despite their lower O&M costs (USD 74,327 to USD 100,917/year), their economic viability depends heavily on cost parameters. Factors such as component prices and discount rates significantly influence the feasibility of these systems. Lower financing costs could substantially enhance the applicability of both hybrid and renewable configurations.

Sensitivity Analysis for Standalone Systems

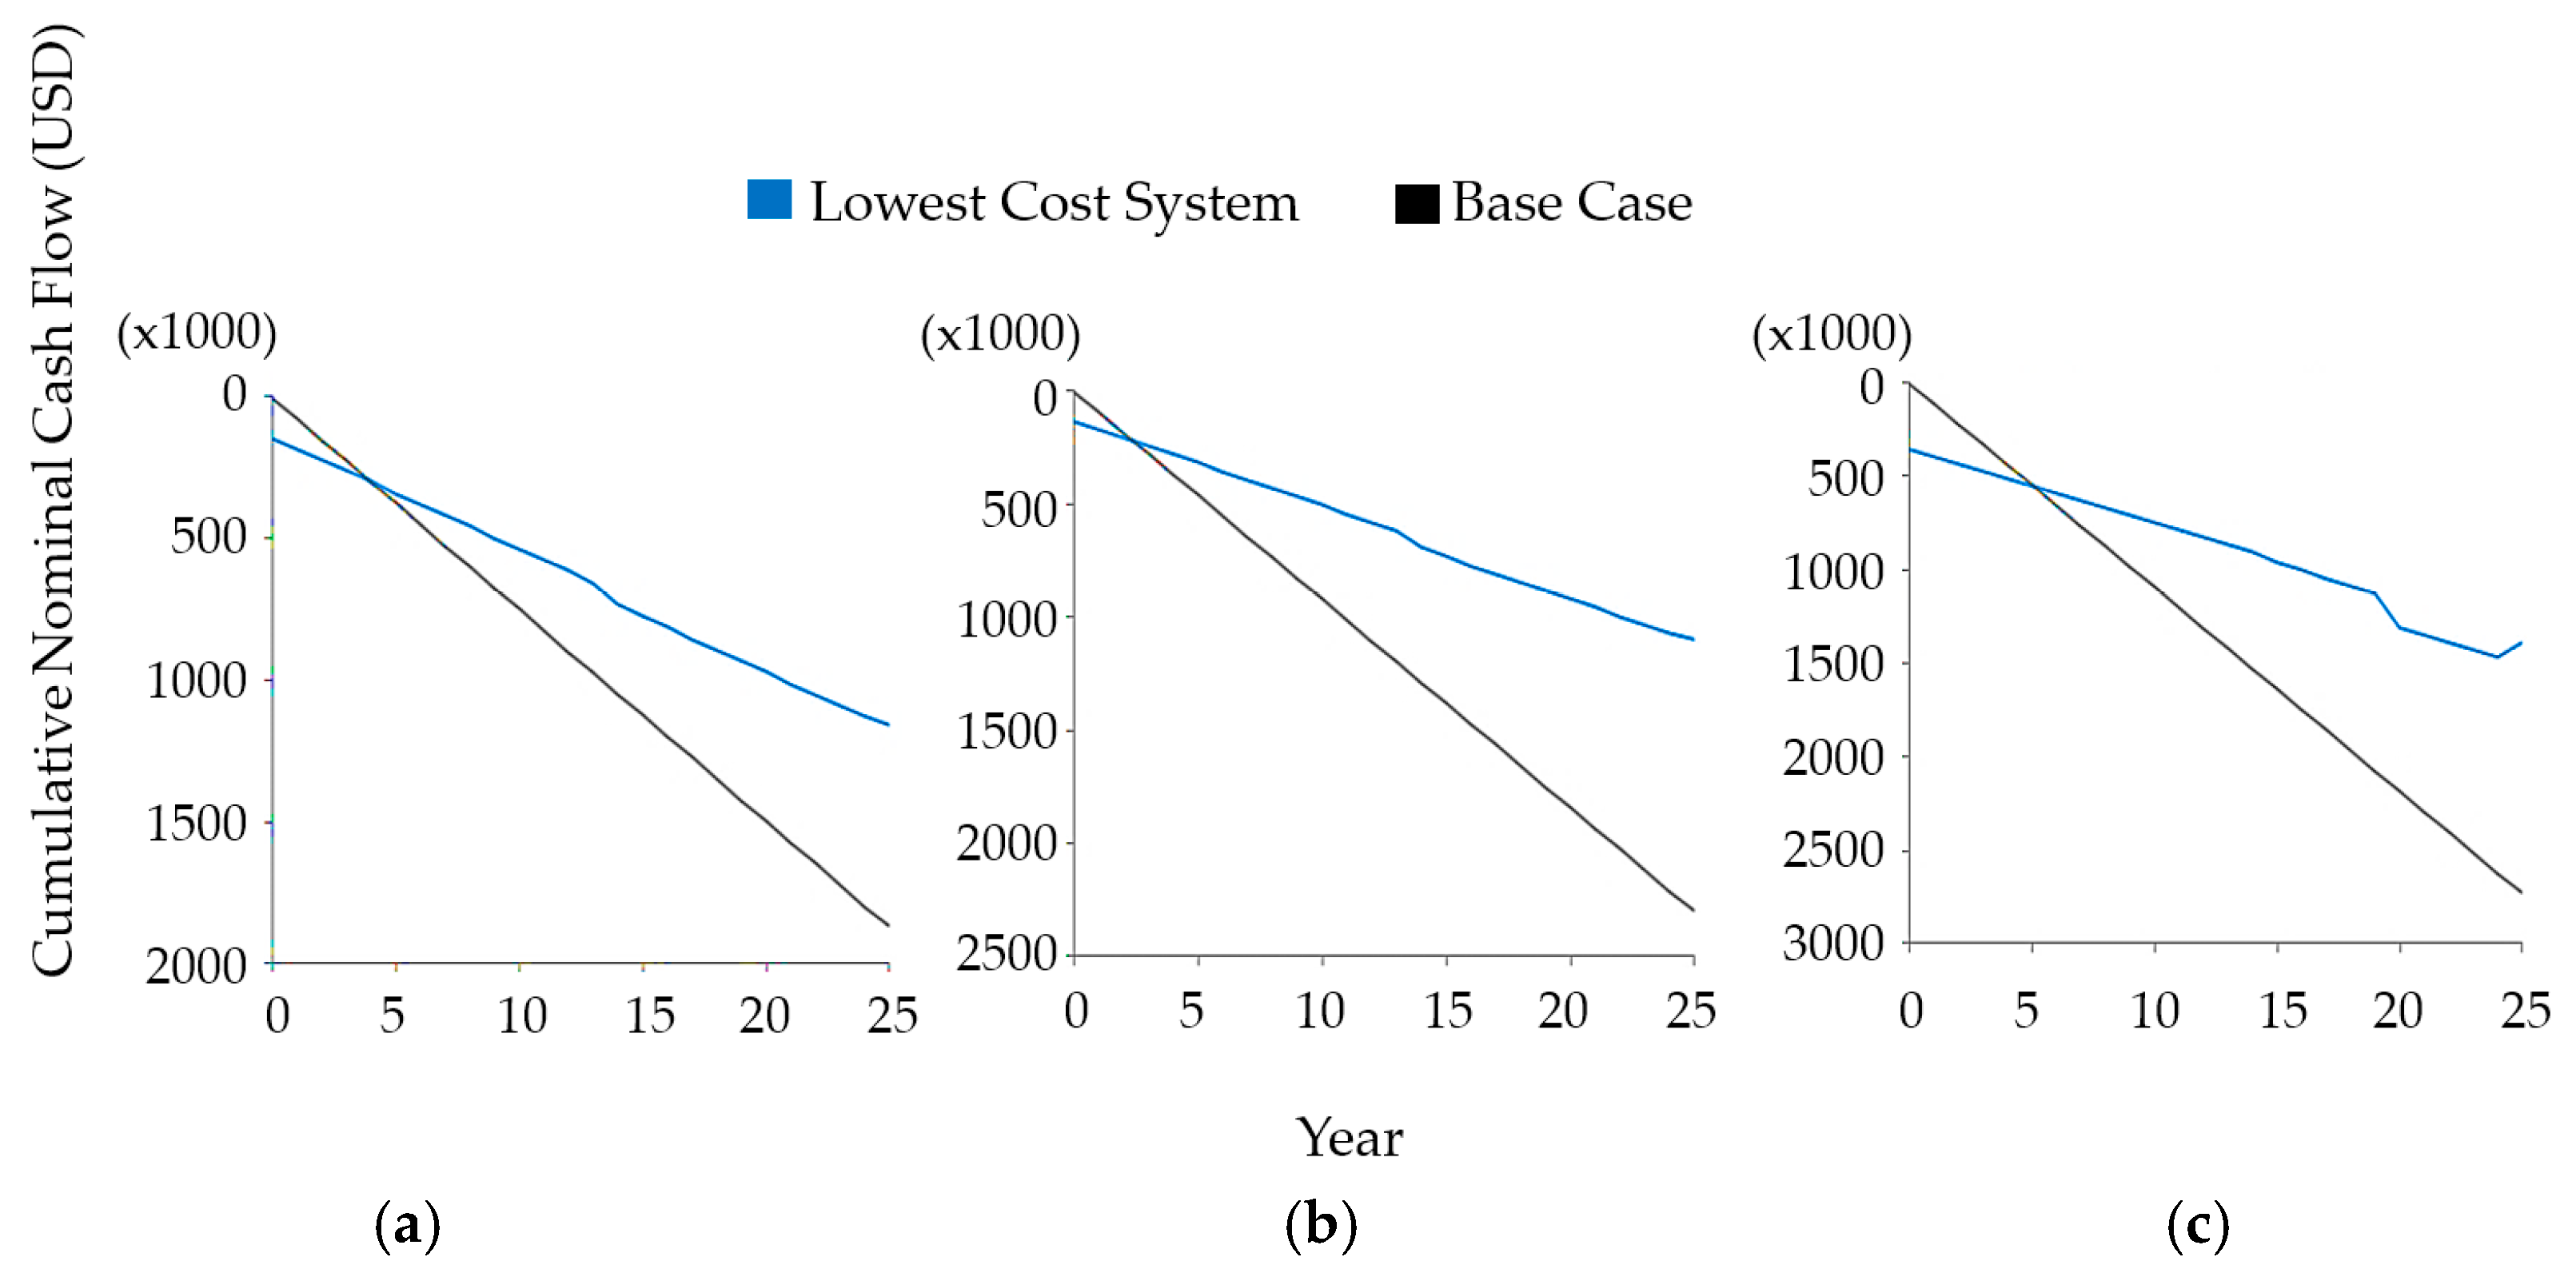
A sensitivity analysis of the proposed standalone [Gen/PV/B] system was conducted based on four parameters under three scenarios (minimum, average, and maximum values) (Table 9). The resulting payback periods were found to be 3.9, 2.4, and 5.1 years, respectively (Figure 16a–c). These outcomes indicate that the system achieves the shortest payback period under average parameter conditions.
In addition, Table 10 presents a comprehensive analysis of the NPC, LCOE, IRR, and payback period, considering the average climatic conditions (solar radiation, temperature, and wind speed) at the greenhouse site, alongside different economic parameters such as power price, sellback rate, and expected inflation rate. The sensitivity analysis was conducted using the average climate conditions of the greenhouse location, evaluating various energy purchase rates from the grid (USD 0.10, USD 0.12, USD 0.14, and USD 0.16/kWh) and energy sellback prices to the grid (USD 0.08, USD 0.10, USD 0.14, and USD 0.18/kWh), and examining the resulting costs and economic indicators.
As shown in Table 10, the shortest payback period (ranging from 1.7 to 2.0 years) was observed under conditions of the highest solar irradiance (7.0 kWh/m2/day) and the lowest inflation rates (5% and 10%). Notably, the highest expected IRR, ranging between 49% and 60%, was also achieved under these conditions. This rate is approximately 13% higher than that observed for the grid-connected system. Conversely, the longest payback period, ranging between 4 and 8 years, was found under high inflation conditions (30%). As expected, the poorest IRR performance, varying between 12% and 23%, also occurred under these high-inflation scenarios. Although high inflation adversely affects investment profitability, this negative impact appears to be more predictable compared with grid-connected systems. If inflation remains at or below 5%, the standalone system, like the grid-connected one, is projected to be financially viable.

4. Discussion

The study’s outcomes reveal the inherent tension between achieving economic feasibility and ensuring environmental sustainability in the configuration of hybrid energy systems for greenhouses. For grid-connected scenarios, the [G/PV] configuration emerged as the most economically attractive option, with the lowest NPC and LCOE (Table 2), while still delivering a 54.94% reduction in CO2 emissions. The system’s capacity to generate surplus electricity, illustrated in Figure 10 and Figure 11, highlights its dual role in meeting the greenhouse’s internal demand and generating additional revenue through grid sales. Similar conclusions have been reported in previous agricultural energy studies, where PV-dominant configurations were consistently favored for their cost-effectiveness and simplicity of integration [36,37,38,39]. Although the integration of wind turbines in the [G/PV/WT] and [G/PV/WT/B] systems enhanced emission reduction rates to 62.5% (Table 2), these configurations also required substantially higher capital investment, as illustrated in Figure 9. These findings resonate with earlier work in southern Ghana [42,43,44] and rural Malaysia [45,46,47,48], which similarly observed that while the inclusion of wind energy improves the renewable fraction of hybrid systems, the associated cost escalation often undermines economic competitiveness. Consequently, under current technology and price conditions, PV-dominated grid-connected systems remain more advantageous in regions such as Afyonkarahisar, where solar resources are relatively abundant (Figure 5a,b) and average wind speeds are modest (Figure 5d).
For off-grid configurations, the [Gen/PV/B] system offered the most balanced solution, combining a low NPC (USD 1.19M) and competitive LCOE (USD 0.342/kWh) with a 64.58% reduction in CO2 emissions (Table 7). Seasonal generation patterns (Figure 14 and Figure 15) demonstrate that PV supplies the bulk of energy in summer, while the diesel generator compensates for shortfalls in winter, thereby ensuring reliability. Comparable results were obtained by Woldegiyorgis et al. [100], Samatar et al. [101], and Eze et al. [102], who found that PV–diesel–battery hybrids provide the most practical compromise between cost and emissions in rural agricultural contexts. The cost breakdown (Table 8) further confirms that although the generator remains the dominant expense driver due to fuel consumption, PV integration substantially mitigates long-term operational costs. By contrast, fully renewable standalone systems ([PV/WT/B], [PV/B], [WT/B]) successfully achieved zero-emission targets but at prohibitive costs, with NPC values ranging between USD 2.54M and USD 4.52M (Table 7). This trade-off between environmental gains and financial feasibility is well documented in the literature. Ferreira et al. [26], Eze et al. [102], and Kumar et al. [103] similarly emphasized that while such systems are technologically feasible, their adoption hinges on significant reductions in battery and wind turbine costs. The present results reinforce this argument, indicating that zero-emission greenhouse operations are currently constrained more by economics than by technical feasibility.
The sensitivity analyses (Table 5 and Table 9; Figure 12 and Figure 16) underscore the vulnerability of hybrid energy investments to macroeconomic conditions. In grid-connected scenarios, payback periods ranged from 2.8 years under average assumptions to more than 25 years under high-inflation conditions (Figure 12). A similar sensitivity was observed in the off-grid [Gen/PV/B] system, where payback periods varied between 1.7 and 5.1 years depending on fuel price and solar irradiance (Table 10). Consistent with the conclusions of Kumar et al. [103] and the ESMAP report [32], the findings reaffirm that inflation and fuel price instability are pivotal factors affecting the financial performance of agricultural microgrids. Overall, this study confirms the conclusions of prior research that hybrid PV-based systems offer the most immediate benefits for agricultural applications, particularly when complemented by diesel backup in off-grid scenarios [100,101,102,103]. At the same time, it highlights the persisting gap between cost-optimal and environmentally optimal solutions: while PV–diesel–battery hybrids remain the most pragmatic choice today, the transition to fully renewable systems will depend on further cost reductions in storage and wind technologies. This aligns with global policy perspectives emphasizing that innovation in storage and cost-effective grid integration will be pivotal in enabling carbon-neutral agriculture [1,2,82].

5. Conclusions

In today’s economic environment, where cost-efficiency is increasingly prioritized, the persistent rise in energy prices is compelling agricultural enterprises, much like other sectors, to seek alternative solutions to meet their energy demands and reduce expenditures. Hybrid energy systems that integrate solar and wind power with diesel generators as backup sources offer technically and economically sustainable options for meeting greenhouse energy requirements. The energy expectations of agricultural enterprises increasingly center around utilizing REN sources such as solar and wind, and ideally, selling excess energy back to the grid. This approach not only enables the generation of potential green electricity for peak demand periods but also contributes to reducing environmental pollutants and creating additional economic benefits.
A key contribution of this study lies in its systematic comparison of various hybrid system configurations, both grid-connected and off-grid, for high-demand facilities such as greenhouses. The scientific originality of this work lies in the fact that, unlike previous studies, which typically analyzed isolated system configurations, this research provides a comprehensive evaluation under consistent technical and economic assumptions. This broadens the understanding of optimal hybrid energy configurations, especially in agricultural settings, where operational reliability and economic feasibility are critical.
In a hybrid system, renewable sources are combined with fossil fuels for electricity generation. The primary objective of hybrid systems is to minimize fossil fuel consumption while maximizing cost-effective benefits for end-users. This study comprehensively analyzed the technical, economic, and environmental performance of both grid-connected and off-grid REN systems for greenhouse facilities. The most optimal hybrid system configurations were identified based on these evaluations. Considering the balance between cost-effectiveness, environmental impact, and operational reliability, the [G/PV] configuration was found to be the most viable option for grid-connected systems due to its low cost, reasonable emissions reduction, and ability to meet the energy needs of greenhouse operations. In off-grid systems, the [Gen/PV/B] configuration demonstrated similarly balanced performance, making it a suitable solution in terms of both cost efficiency and emissions mitigation.
This study also emphasizes the significant trade-off between environmental objectives and financial constraints. While the integration of batteries and wind turbines is appealing for achieving carbon neutrality, the high costs associated with these technologies may limit their widespread adoption in economically constrained regions. On the other hand, generator-based systems, though cost-effective in some cases, are less desirable due to their high emissions and operational costs. This balance between economic feasibility and environmental impact is crucial in determining the viability of different configurations.
A major original aspect of this study is its inclusion of an extensive sensitivity analysis, exploring the impact of variables such as inflation, fuel price fluctuations, and changes in renewable energy resources on system performance. This is particularly relevant in today’s context of economic uncertainty, providing a framework for understanding how external factors can significantly affect the viability of hybrid energy systems. Future research should focus on reducing the costs associated with battery storage and wind energy technologies to facilitate broader adoption of these sustainable energy solutions. Additionally, utilizing localized, high-resolution datasets will improve the accuracy of techno-economic analyses, as the specific meteorological and economic parameters of a region can greatly influence system performance and feasibility.
Moreover, there is a need for further investigation into emerging technologies, including advanced energy storage solutions such as hydrogen, and the integration of concepts such as agrivoltaics. These systems could further optimize energy use in agricultural settings. Detailed assessments of evolving energy sector policies, including incentive mechanisms and regulatory frameworks, should also be conducted to understand their impact on the financial viability and widespread adoption of hybrid energy systems. Through these efforts, future research can contribute to the development of robust and fully renewable energy solutions for the agricultural sector.
In conclusion, while this study presents several cost-effective and environmentally beneficial hybrid system configurations, it underscores the importance of addressing both economic and environmental factors to facilitate the adoption of renewable energy systems in agriculture. The findings contribute to a deeper understanding of the practical limitations of renewable energy integration, offering insights that are applicable to regions with similar economic and climatic conditions.

Funding

This study was conducted without any external financial support.

Data Availability Statement

All the data presented are available within this article.

Conflicts of Interest

The author confirms that there are no conflicts of interest, including financial, personal, or professional relationships, that could have directly or indirectly influenced the research, authorship, or publication of this manuscript.

References

  1. REN21. Renewables 2024 Global Status Report Collection. Renewables 2024 Global Status Report. A Comprehensive Annual Overview of The State of Renewable Energy. 2024. Available online: https://www.ren21.net/gsr-2024/modules/energy_supply/01_global_trends/ (accessed on 4 May 2025).
  2. Anadolu Agency. Ekonomi. 2024. Available online: https://www.aa.com.tr/tr/ekonomi/dunya-elektrik-uretiminde-yenilenebilirin-payi-ilk-kez-yuzde-30u-asti-turkiyede-yuzde-42ye-ulasti/3213124 (accessed on 4 May 2025). (In Turkish).
  3. SHURA. Türkiye Enerji Dönüşümü Görünümü 2023. SHURA Enerji Dönüşümü Merkezi Raporu. 2024. Available online: https://shura.org.tr/wp-content/uploads/2024/04/SHURA-2024-04-Rapor-outlook-2023-2.pdf (accessed on 5 May 2025).
  4. GEPA. Solar Energy Potential Atlas. 2025. Available online: https://gepa.enerji.gov.tr/ (accessed on 5 May 2025).
  5. Republic of Türkiye Ministry of Energy and Natural Resources. Wind Energy Potential Map-REPA. 2025. Available online: https://enerji.gov.tr/bilgi-merkezi-enerji-ruzgar (accessed on 4 May 2025).
  6. Republic of Türkiye Ministry of Energy and Natural Resources. Elektrik Piyasas1 Yenilenebilir Enerji Kaynakları Destekleme Mekanizması (YEKDEM) Listesi. 2021. Available online: https://enerji.gov.tr/eigm-yenilebilir-enerji-uretim-faaliyetleri-lisansli-elektrik-uretimi (accessed on 5 May 2025).
  7. EPDK. Lisanslı Elektrik Üretimi. 2023. Available online: https://www.epdk.gov.tr/Detay/Icerik/3-0-0-122/yenilenebilir-enerji-kaynaklari-destekleme-mekanizmasi-yekdem (accessed on 5 May 2025).
  8. SHURA. Net Sıfır 2053: Enerji Sektörü için Politikalar. 2023. Available online: https://shura.org.tr/wp-content/uploads/2024/01/SHURA-2023-11-Rapor-Enerji-Sektoru-icin-Politikalar_Ocak2024.pdf (accessed on 5 May 2025).
  9. EPDK. Elektrik Piyasası Sektör Raporu Aralık 2023. 2024. Available online: https://www.epdk.gov.tr/Detay/Icerik/3-0-23/elektrikaylik-sektor-raporlar (accessed on 11 April 2025).
  10. EMBER. Electricity Production by Source, Turkey. Energy Institute—Statistical Review of World Energy. 2025. Available online: https://ember-energy.org/data/yearly-electricity-data/ (accessed on 4 May 2025).
  11. TEİAŞ. Power of Energy. Electricity Transmission in Türkiye. 2025. Available online: https://www.teias.gov.tr/en-US (accessed on 4 May 2025).
  12. Republic of Türkiye Ministry of Energy and Natural Resources. Bilgi Merkezi. Elektrik. 2025. Available online: https://enerji.gov.tr/bilgi-merkezi-enerji-elektrik (accessed on 4 May 2025).
  13. ETKB. Türkiye Ulusal Enerji Planı. 2022. Available online: https://enerji.gov.tr/Media/Dizin/EIGM/tr/Raporlar/TUEP/T%C3%BCrkiye_Ulusal_Enerji_Plan%C4%B1.pdf (accessed on 7 May 2025).
  14. SBB. OnN İkinci Kalkınma Planı (2024–2028). 2023. Available online: https://www.sbb.gov.tr/wp-content/uploads/2023/12/On-Ikinci-Kalkinma-Plani_2024-2028_11122023.pdf (accessed on 12 May 2025).
  15. REN21. Renewables in Energy Demand: Global Trends. Market Developments and Investment Trends. 2024. Available online: https://www.ren21.net/gsr-2024/modules/energy_demand (accessed on 12 May 2025).
  16. IEA. World Energy Balances. 2023. Available online: https://www.iea.org/data-and-statistics/data-product/world-energy-balances (accessed on 12 May 2025).
  17. IEA. SEK 380 Million: Temporary Tax Reduction on Agricultural Diesel—Policies. 2023. Available online: https://www.iea.org/policies/17497-sek-380-milliontemporary-tax-reduction-on-agricultural-diesel (accessed on 20 April 2023).
  18. IEA. 2023 Price Crisis Response Policies—Policies. 2023. Available online: https://www.iea.org/policies/17484-2023-price-crisis-response-policies (accessed on 11 May 2023).
  19. Puri, M.; Kojakovic, A.; Rincon, L.; Gallego, J.; Vaskalis, I.; Maltsoglou, I. The Small-Scale Fisheries and Energy Nexus: Opportunities for Renewable Energy Interventions; Food and Agriculture Organization of the United Nations: Rome, Italy, 2023. [Google Scholar] [CrossRef]
  20. Ambuko, J.; Owino, W. Toward Sustainable Transformation Through Postharvest Management: Lessons from Kenya’s Mango Value Chain, in International Food Policy Research Institute. In Food Systems Transformation in Kenya: Lessons Past and Policy Options for the Future; SAGE Publishing: Thousand Oaks, CA, USA, 2023; pp. 433–468. [Google Scholar] [CrossRef]
  21. Dawnbreaker and Department of Energy. Market Research Study—Agrivoltaics; Department of Energy: Washington, DC, USA, 2022. Available online: https://science.osti.gov/-/media/sbir/pdf/Market-Research/SETO---Agrivoltaics-August-2022-Public.pdf (accessed on 4 May 2025).
  22. European Commission. Agriculture and Rural Development. Common Agricultural Policy for 2023–2027—28 CAO Strategic Plans at a Glance. 2022. Available online: https://agriculture.ec.europa.eu/system/files/2022-12/csp-at-a-glance-eu-countries_en.pdf (accessed on 11 May 2025).
  23. European Economic and Social Committee. Decarbonisation of the Fishing Fleet. 2023. Available online: https://www.eesc.europa.eu/en/our-work/opinions-information-reports/opinions/decarbonisation-fishing-fleet (accessed on 14 May 2025).
  24. Schindele, S.; Trommsdorff, M.; Schlaak, A.; Obergfell, T.; Bopp, G.; Reise, C.; Braun, C.; Weselek, A.; Bauerle, A.; Högy, P.; et al. Implementation of agrophotovoltaics: Techno-economic analysis of the price-performance ratio and its policy implications. Appl. Energy 2020, 265, 114737. [Google Scholar] [CrossRef]
  25. Rahman, A.; Sharma, A.; Postel, F.; Goel, S.; Kumar, K.; Laan, T. Agrivoltaics in India: Challenges and Opportunities for Scale-up; International Institute for Sustainable Development (IISD): Winnipeg, MB, Canada, 2023; Available online: http://www.jstor.org/stable/resrep49783 (accessed on 14 May 2025).
  26. Ferreira, R.F.; Lameirinhas, R.A.M.; Bernardo, C.P.C.V.; Torres, J.P.N.; Santos, M. Agri-PV in Portugal: How to combine agriculture and photovoltaic production. Energy Sustain. Dev. 2024, 79, 101408. [Google Scholar] [CrossRef]
  27. NREL. Agrivoltaics. Solar Market Research and Analysis. 2023. Available online: https://www.nrel.gov/solar/market-research-analysis/agrivoltaics.html (accessed on 13 March 2024).
  28. Meza, E. Turkey Launches Agrivoltaics Research Project, pv magazine International, 27 December 2023. Available online: https://www.pv-magazine.com/2023/12/27/turkey-launches-agrivoltaics-research-project (accessed on 4 April 2025).
  29. ESMAP. Energy Sector Management Assistance Program. Energy Storage for Mini Grids: Status and Projections of Battery Deployment. 2023. Available online: https://www.esmap.org/Energy_Storage_for_Mini_Grids (accessed on 4 April 2025).
  30. ESMAP. Energy Sector Management Assistance Program. Accelerating the Productive Use of Electricity: Enabling Energy Access to Power Rural Economic Growth. 2023. Available online: http://documents.worldbank.org/curated/en/099092023192023389/P1751521d3f58f6f1307c1499619e141b8baef6de8dd (accessed on 6 April 2025).
  31. EAP. Energizing Agriculture Programme, Results. 2024. Available online: https://energizingagricultureprogramme.org/results (accessed on 1 February 2024).
  32. AEP. Africa Energy Portal, Renewable Energy. 2022. Available online: https://africa-energy-portal.org/news/uganda-engie-commissions-600-kwp-solar-mini-grid-lolwe-island (accessed on 6 April 2025).
  33. Ali, S.; Zheng, Z.; Aillerie, M.; Sawicki, J.-P.; Péra, M.-C.; Hissel, D. A Review of DC Microgrid Energy Management Systems Dedicated to Residential Applications. Energies 2021, 14, 4308. [Google Scholar] [CrossRef]
  34. Farkhani, J.S.; Zareein, M.; Najafi, A.; Melicio, R.; Rodrigues, E.M.G. The Power System and Microgrid Protection—A Review. Appl. Sci. 2020, 10, 8271. [Google Scholar] [CrossRef]
  35. HOMER Energy LLC. HOMER Pro 3.14 User Manual; HOMER Energy LLC: Boulder, CO, USA, 2020; Available online: https://homerenergy.com/products/pro/docs/index.html (accessed on 18 February 2025).
  36. Sambhi, S.; Sharma, H.; Kumar, P.; Fotis, G.; Vita, V.; Ekonomou, L. Techno-economic optimization of an off-grid hybrid power generation for SRM IST, Delhi-NCR campus. Energies 2022, 15, 7880. [Google Scholar] [CrossRef]
  37. Ali, M.F.; Hossain, M.A.; Julhash, M.M.; Ashikuzzaman, M.; Alam, M.S.; Sheikh, M.R.I. A Techno-Economic Analysis of a Hybrid Microgrid System in a Residential Area of Bangladesh: Optimizing Renewable Energy. Sustainability 2024, 16, 8051. [Google Scholar] [CrossRef]
  38. Kangaji, L.M.; Raji, A.; Orumwense, E. Optimizing Sustainability Offshore Hybrid Tidal-Wind Energy Storage Systems for an Off-Grid Coastal City in South Africa. Sustainability 2024, 16, 9139. [Google Scholar] [CrossRef]
  39. Seedahmed, M.M.A.; Ramli, M.A.M.; Bouchekara, H.R.E.H.; Milyani, A.H.; Rawa, M.; Budiman, F.N.; Muktiadji, R.F.; Hassan, S.M.U. Optimal Sizing of Grid-Connected Photovoltaic System for a Large Commercial Load in Saudi Arabia. Alex. Eng. J. 2022, 61, 6523–6540. [Google Scholar]
  40. Dalton, G.J.; Lockington, D.A.; Baldock, T.E. Feasibility analysis of stand-alone renewable energy supply options for a large hotel. Renew. Energy 2008, 33, 1475–1490. [Google Scholar] [CrossRef]
  41. Wahid, S.S.A.; Arief, Y.Z.; Mubarakah, N. Optimization of Hybrid Renewable Energy in Malaysia Remote Rural Area Using HOMER Software. In Proceedings of the International Conference on Electrical, Telecommunication and Computer Engineering (ELTICOM), Medan, Indonesia, 16–17 September 2019; pp. 111–115. [Google Scholar]
  42. Dinçsoy, M.E. Modelling and Optimization of Medium-Sized Hotel’s Electrical Energy with Hybrid Systems. Master’s Thesis, İstanbul Technical University, İstanbul, Türkiye, 2010. [Google Scholar]
  43. Himri, Y.; Stambouli, A.B.; Draoui, B.; Himri, S. Techno-economical study of hybrid power system for a remote village in Algeria. Energy 2008, 33, 1128–1136. [Google Scholar] [CrossRef]
  44. Özcan, H. Modeling and Analysıs of A Hybrid Energy System. Master’s Thesis, İstanbul Technical University, İstanbul, Türkiye, 2009. [Google Scholar]
  45. Adaramola, M.S. Viability of grid-connected solar PV energy system in Jos, Nigeria. Int. J. Electr. Power Energy Syst. 2014, 61, 64–69. [Google Scholar] [CrossRef]
  46. Ngan, M.S.; Tan, C.W. Assessment of economic viability for PV/wind/diesel hybrid enegry system in southern Peninsular Malaysia. Renew. Sustain. Energy Rev. 2012, 16, 634–647. [Google Scholar] [CrossRef]
  47. Suresh, V.; Muralidhar, M.; Kiranmayi, R. Modelling and optimization of an off-grid hybrid renewable energy system for electrification in a rural area. Energy Rep. 2020, 6, 594–604. [Google Scholar] [CrossRef]
  48. Olatomiwa, L.; Blanchard, R.; Mekhilef, S.; Akinyele, D. Hybrid renewable energy supply for rural healthcare facilities: An approach to quality healthcare delivery. Sustain. Energy Technol. Assess. 2018, 30, 121–138. [Google Scholar] [CrossRef]
  49. Tudorache, T.; Morega, A. Optimum Design of Wind/PV/Diesel/Batteries Hybrid Systems. In Proceedings of the International Conference on Modern Power Systems, Cluj-Napoca, Romania, 12–14 November 2008; pp. 261–264. [Google Scholar]
  50. Muh, E.; Tabet, F. Comparative Analysis of Hybrid Renewable Energy Systems for off-Grid Applications in Southern Cameroons. Renew. Energy 2019, 135, 41–54. [Google Scholar] [CrossRef]
  51. Ahmad, J.; Imran, M.; Khalid, A.; Iqbal, W.; Ashraf, S.R.; Adnan, M.; Ali, S.F.; Khokhar, K.S. Techno Economic Analysis of a Wind-Photovoltaic-Biomass Hybrid Renewable Energy System for Rural Electrification: A Case Study of Kallar Kahar. Energy 2018, 148, 208–234. [Google Scholar] [CrossRef]
  52. Byrne, J.; Glover, L.; Hegedus, S.; VanWicklen, G. The Potential of Solar Electric Applications for Delaware’s Poultry Farms; Final Report; Center for Energy and Environmental Policy, University of Delaware: Newark, DE, USA, 2005. [Google Scholar]
  53. Dağtekin, M. Tecno-ekonomic Feasibility Analysis of Solar Energy Use in Cooling of Broiler Poultry Houses. J. Agric. Fac. Ç.Ü. 2012, 27, 11–20. [Google Scholar]
  54. Erensoy, K.; Altan, A.; Bayraktar, Ö. Characteristics of Energy Usage and Energy Savings Opportunities in Environmentally Controlled Egg Production Houses. In Proceedings of the 9. National Animal Science Congress 2015, Konya, Türkiye, 2–5 September 2015. [Google Scholar]
  55. Mandal, S.; Das, B.K.; Hoque, N. Optimum Sizing of a Stand-Alone Hybrid Energy System for Rural Electrification in Bangladesh. J. Clean. Prod. 2018, 200, 12–27. [Google Scholar] [CrossRef]
  56. Das, B.K.; Hoque, N.; Mandal, S.; Pal, T.K.; Raihan, A. A Techno-Economic Feasibility of a Stand-Alone Hybrid Power Generation for Remote Area Application in Bangladesh. Energy 2017, 134, 775–788. [Google Scholar] [CrossRef]
  57. Ashok, S. Optimised model for community-based hybrid energy system. Renew. Energy 2007, 32, 1155–1164. [Google Scholar] [CrossRef]
  58. González, A.; Riba, J.-R.; Rius, A.; Puig, R. Optimal sizing of a hybrid grid-connected photovoltaic and wind power system. Appl. Energy 2015, 154, 752–762. [Google Scholar] [CrossRef]
  59. Kamel, S. The economics of hybrid power systems for sustainable desert agriculture in Egypt. Energy 2005, 30, 1271–1281. [Google Scholar] [CrossRef]
  60. Khare, V.; Nema, S.; Baredar, P. Solar–wind hybrid renewable energy system: A review. Renew. Sustain. Energy Rev. 2016, 58, 23–33. [Google Scholar] [CrossRef]
  61. Nandi, S.K.; Ghosh, H.R. A wind–PV-battery hybrid power system at Sitakunda in Bangladesh. Energy Policy 2009, 37, 3659–3664. [Google Scholar] [CrossRef]
  62. Rehman, S.; Al-Hadhrami, L.M. Study of a solar PV–diesel–battery hybrid power system for a remotely located population near Rafha, Saudi Arabia. Energy 2010, 35, 4986–4995. [Google Scholar] [CrossRef]
  63. Shaahid, S.M.; Elhadidy, M.A. Technical and economic assessment of grid-independent hybrid photovoltaic–diesel–battery power systems for commercial loads in desert environments. Renew. Sustain. Energy Rev. 2007, 11, 1794–1810. [Google Scholar] [CrossRef]
  64. Shezan, S.A.; Julai, S.; Kibria, M.A.; Ullah, K.R.; Saidur, R.; Chong, W.T.; Akikur, R.K. Performance analysis of an off-grid wind-PV (photovoltaic)-diesel-battery hybrid energy system feasible for remote areas. J. Clean. Prod. 2016, 125, 121–132. [Google Scholar] [CrossRef]
  65. Sediqi, M.M.; Furukako, F.; Lotfy, M.E.; Yona, A.; Senjyu, T. Optimal Economical Sizing of Grid-Connected Hybrid Renewable Energy System. Energy Power Eng. 2017, 11, 244–253. [Google Scholar]
  66. Olatomiwa, L.; Mekhilef, S.; Ismail, M.S.; Moghavvemi, M. Energy management strategies in hybrid renewable energy systems: A review. Renew. Sustain. Energy Rev. 2016, 62, 821–835. [Google Scholar] [CrossRef]
  67. Fragaki, A.; Markvart, T.; Laskos, G. All UK electricity supplied by wind and photovoltaics—The 30–30 rule. Energy 2019, 169, 228–237. [Google Scholar] [CrossRef]
  68. Tijani, H.O.; Tan, C.W.; Bashir, N. Techno-economic analysis of hybrid photovoltaic/diesel/battery off-grid system in northern Nigeria. J. Renew. Sustain. Energy 2014, 6, 033103. [Google Scholar] [CrossRef]
  69. Türkdoğan, S.; Dilber, S.; Çam, B. Economic and Technical Investigation of the Feasibility of Off-Grid Hybrid Energy Systems for a Farmhouse. Sinop Univ. J. Nat. Sci. 2018, 3, 52–65. [Google Scholar] [CrossRef]
  70. Oladigbolu Jamiu, O.; Ramli Makbul, A.M.; Al-Turki Yusuf, A. Feasibility Study and comparative analysis of hybrid renewable power system for off-grid rural electrification in a typical remote village located in Nigeria. IEEE Access 2020, 8, 171643–171663. [Google Scholar] [CrossRef]
  71. Rallo, H.; Casals, L.C.; De La Torre, D.; Reinhardt, R.; Marchante, C.; Amante, B. Lithium-ion battery 2nd life used as a stationary energy storage system: Ageing and economic analysis in two real cases. J. Clean. Prod. 2020, 272, 122584. [Google Scholar] [CrossRef]
  72. Arabi-Nowdeh, S.; Nasri, S.; Saftjani, P.B.; Naderipour, A.; Abdul-Malek, Z.; Kamyab, H.; Jafar-Nowdeh, A. Multi-criteria optimal design of hybrid clean energy system with battery storage considering off- and on-grid application. J. Clean. Prod. 2021, 290, 125808. [Google Scholar] [CrossRef]
  73. Li, C.; Zhou, D.; Wang, H.; Lu, Y.; Li, D. Techno-economic performance study of stand-alone wind/diesel/battery hybrid system with different battery Technologies in the cold region of China. Energy 2020, 192, 116702. [Google Scholar] [CrossRef]
  74. Al-Sharafi, A.; Sahin, A.Z.; Ayar, T.; Yilbas, B.S. Techno-economic analysis and optimization of solar and wind energy systems for power generation and hydrogen production in Saudi Arabia. Renew. Sustain. Energy Rev. 2017, 69, 33–49. [Google Scholar] [CrossRef]
  75. Haratian, M.; Tabibi, P.; Sadeghi, M.; Vaseghi, B.; Poustdouz, A. A Renewable Energy Solution for Stand-Alone Power Generation: A Case Study of KhshU Site-Iran. Renew. Energy 2018, 125, 926–935. [Google Scholar] [CrossRef]
  76. Ariyo, B.O.; Akorede, M.F.; Omeiza, I.O.A.; Amuda, S.A.Y.; Oladeji, S.A. Optimisation Analysis of a Stand-Alone Hybrid Energy System for the Senate Building, University of Ilorin, Nigeria. J. Build. Eng. 2018, 19, 285–294. [Google Scholar] [CrossRef]
  77. Ayhan, D. Building Mounted Solar-Wind Hybrid Electric Power System Analysis. Master’s Thesis, Marmara University Institute of Science and Technology, İstanbul, Türkiye, 2011; p. 28552482. [Google Scholar]
  78. Riahi, J.; Vergura, S.; Mezghani, D.; Mami, A. Intelligent control of the microclimate of an agricultural greenhouse powered by a supporting pv system. Appl. Sci. 2020, 10, 1350. [Google Scholar] [CrossRef]
  79. Cossu, M.; Yano, A.; Murgia, L.; Ledda, L.; Deligios, P.; Sirigu, A.; Chessa, F.; Pazzona, A. Effects of the photovoltaic roofs on the greenhouse microclimate. Acta Hortic. 2017, 1170, 461–468. [Google Scholar] [CrossRef]
  80. Adam, D.; Apaydin, G. Grid connected solar photovoltaic system as a tool for green house gas emission reduction in Turkey. Renew. Sustain. Energy Rev. 2016, 53, 1086–1091. [Google Scholar] [CrossRef]
  81. Li, C.; Wang, H.; Miao, H.; Ye, B. The economic and social performance of integrated photovoltaic and agricultural greenhouses systems: Case study in China. Appl. Energy 2017, 190, 204–212. [Google Scholar] [CrossRef]
  82. Hassanien, R.H.E.; Ming, L. Influences of greenhouse-integrated semi-transparent photovoltaics on microclimate and lettuce growth. Int. J. Agric. Biol. Eng. 2017, 10, 11–22. [Google Scholar] [CrossRef]
  83. Lalwani, M.; Kothari, D.P.; Singh, M. Investigation of solar photovoltaic simulation softwares. Int. J. Appl. Eng. Res. 2010, 1, 585–601. [Google Scholar]
  84. NASA POWER Data Access Viewer. Available online: https://power.larc.nasa.gov/data-access-viewer/ (accessed on 22 October 2023).
  85. Amole, A.O.; Oladipo, S.; Olabode, O.E.; Makinde, K.A.; Gbadega, P.A. Analysis of Grid/Solar Photovoltaic Power Generation for Improved Village Energy Supply: A Case of Ikose in Oyo State Nigeria. Renew. Energy Focus 2023, 44, 186–211. [Google Scholar] [CrossRef]
  86. HOMER Pro 2023. HOMER Pro Manual. Available online: https://support.ul-renewables.com/homer-manuals-pro/index.html (accessed on 20 October 2023).
  87. Mulumba, A.N.; Farzaneh, H. Techno-economic analysis and dynamic power simulation of a hybrid solar-wind-battery-flywheel system for off-grid power supply in remote areas in Kenya. Energy Convers. Manag. X 2023, 18, 100381. [Google Scholar] [CrossRef]
  88. Prum, M.; Goh, H.H.; Zhang, D.; Dai, W.; Kurniawan, T.A.; Goh, K.C. Optimizing hybrid energy systems for remote communities in Asia’s least developed countries. Heliyon 2024, 10, e29369. [Google Scholar] [CrossRef] [PubMed]
  89. Das, B.K.; Alotaibi, M.A.; Das, P.; Islam, M.; Das, S.K.; Hossain, A. Feasibility and techno-economic analysis of stand-alone and grid-connected PV/Wind/Diesel/Batt hybrid energy system: A case study. Energy Strategy Rev. 2021, 37, 100673. [Google Scholar] [CrossRef]
  90. Wang, Y.; He, X.; Liu, Q.; Razmjooy, S. Economic and technical analysis of an HRES (Hybrid Renewable Energy System) comprising wind, PV, and fuel cells using an improved subtraction-average-based optimizer. Heliyon 2024, 10, e32712. [Google Scholar] [CrossRef] [PubMed]
  91. Tajouo, G.F.; Kapen, P.T.; Koffi, F.L.D. Techno-economic investigation of an environmentally friendly small-scale solar tracker-based PV/wind/Battery hybrid system for off-grid rural electrification in the mount bamboutos, Cameroon. Energy Strategy Rev. 2023, 48, 101107. [Google Scholar] [CrossRef]
  92. Oladigbolu, J.O.; Ramli, M.A.M.; Al-Turki, Y.A. Techno-economic and sensitivity analyses for an optimal hybrid power system which is adaptable and effective for rural electrification: A case study of Nigeria. Sustainability 2019, 11, 4959. [Google Scholar] [CrossRef]
  93. Agajie, T.F.; Fopah-Lele, A.; Ali, A.; Amoussou, I.; Khan, B.; Elsisi, M.; Mahela, O.P.; Álvarez, R.M.; Tanyi, E. Optimal sizing and power system control of hybrid solar PV-biogas generator with energy storage system power plant. Sustainability 2023, 15, 5739. [Google Scholar] [CrossRef]
  94. Lata-García, J.; Zamora Cedeño, N.; Ampuño, G.; Jurado, F.; Swarupa, M.L.; Maliza, W. Optimization and evaluation of a stand-alone hybrid system consisting of solar panels, biomass, diesel generator, and battery bank for rural communities. Sustainability 2024, 16, 9012. [Google Scholar] [CrossRef]
  95. EPDK. Yenilenebilir Enerji Kaynaklarının Elektrik Enerjisi Üretimi Amaçlı Kullanımına İlişkin Kanun. 2024. Available online: https://www.epdk.gov.tr/Detay/Icerik/23-2-3/mevzuat (accessed on 12 May 2025).
  96. EPIAS. The Prices to be Applied for the Power Plants Commissioned Between 01.07.2021 and 31.12.2030 That Rely on Renewable Energy Sources with RES Certificate. Energy Exchange Company. 2025. Available online: https://www.epias.com.tr/en/announcements/the-prices-to-be-applied-for-the-power-plants-commissioned-between-01-07-2021-and-31-12-2030-that-rely-on-renewable-energy-sources-with-res-certificate-22/ (accessed on 8 June 2025).
  97. Sarıaslan, H. Yatırım Projelerinin Hazırlanması ve Değerlendirilmesi; Planlama-Analiz-Fizibilite: Turhan Kitapevi, Ankara, 1990; 240 s. (In Turkish) [Google Scholar]
  98. Yılmaz, U.; Demirören, A.; Zeynelgil, H.L. Investigation of the Potential for Electrical Energy Production with Renewable Energy Sources in Gökçeada. J. Polytech. 2010, 13, 215–223. [Google Scholar]
  99. CEIC. Turkey Central Bank Discount Rate. View Turkey’s Turkey Central Bank Discount Rate from 1970 to 2023 in the Chart. 2023. Available online: https://www.ceicdata.com/en/turkey/saving-discount-rate-and-interbank-rate/central-bank-discountrate#:~:text=Turkey%20Central%20Bank%20Discount%20Rate%20data%20was%20reported%20at%209.750 (accessed on 19 May 2025).
  100. Yokoyama, R.; Niimura, T.; Saito, N. Modeling and evaluation of supply reliability of microgrids including PV and wind power. In Proceedings of the 2008 IEEE Power and Energy Society General Meeting-Conversion and Delivery of Electrical Energy in the 21st Century, Pittsburgh, PA, USA, 20–24 July 2008; IEEE: Berkeley, CA, USA; pp. 1–5. [Google Scholar]
  101. Woldegiyorgis, T.A.; Asmare, E.; Benti, N.E.; Asefa, S.K.; Assamnew, A.D.; Desalegn, G.A.; Chekol, F.; Anose, F.A.; Mossie, S.Y. Techno-economic feasibility analysis of a hybrid wind-PV-diesel energy system for Kiltu village, Oromia, Ethiopia using HOMER pro. Environ. Res. Commun. 2025, 7, 055004. [Google Scholar] [CrossRef]
  102. Samatar, A.M.; Mekhilef, S.; Mokhlis, H.; Kermadi, M.; Alshammari, O. Performance analysis of hybrid off-grid renewable energy systems for sustainable rural electrification. Energy Convers. Manag. X 2024, 24, 100780. [Google Scholar] [CrossRef]
  103. Eze, V.H.U.; Mwenyi, J.S.; Ukagwu, K.J.; Eze, M.C.; Eze, C.E.; Okafor, W.O. Design analysis of a sustainable techno-economic hybrid renewable energy system: Application of solar and wind in Sigulu Island, Uganda. Sci. Afr. 2024, 26, e02454. [Google Scholar] [CrossRef]
  104. Kumar, P.H.; Alluraiah, N.C.; Gopi, P.; Bajaj, M.; Kumar, S.; Kalyan, C.N.S.; Blazek, V. Techno-economic optimization and sensitivity analysis of off-grid hybrid renewable energy systems: A case study for sustainable energy solutions in rural India. Results Eng. 2025, 25, 103674. [Google Scholar] [CrossRef]
Figure 1. Electricity generation by energy source, 2014–2023 (data source: EMBER, modified by author) [1].
Energies 18 04712 g001
Figure 2. Electricity production by source, Türkiye (data source: Ember (2025) Energy Institute—Statistical Review of World Energy (2025)—with major processing by Our World in Data) [10].
Energies 18 04712 g002
Figure 3. Flowchart.
Energies 18 04712 g003
Figure 4. Map of Sandıklı and view of the area where the greenhouse is located at Sandıklı (Map: https://commons.wikimedia.org/wiki/File:Location_Turkey.svg (accessed on 12 May 2025), as modified by author).
Energies 18 04712 g004
Figure 5. Daily solar irradiation and clearness index (a), sunshine duration (b), average temperature (c), and average wind speed (d).
Energies 18 04712 g005
Figure 6. Electrical load distribution in the greenhouse.
Energies 18 04712 g006
Figure 7. Scaled monthly average data.
Energies 18 04712 g007
Figure 8. Scaled daily profile data.
Energies 18 04712 g008
Figure 9. Design of grid-connected [G/PV] (a) and [G/PV/WT] (b) systems.
Energies 18 04712 g009
Figure 10. Comparison of energy sold to the grid by PV vs. energy purchased from the grid.
Energies 18 04712 g010
Figure 11. Energy sold to the grid (a) and energy purchased from the grid (b).
Energies 18 04712 g011
Figure 12. Cash flow and payback period of the [G/PV] system based on minimum (a), average (b), and maximum (c) sensitivity parameters.
Energies 18 04712 g012
Figure 13. Proposed off-grid systems: [Gen/PV/B] (a), [Gen/PV/WT/B] (b), [Gen/WT/B] (c).
Energies 18 04712 g013
Figure 14. Energy production by the PV and the generator.
Energies 18 04712 g014
Figure 15. Annual generator fuel consumption (a) and power output (b).
Energies 18 04712 g015
Figure 16. Cash flow and payback period for the [Gen/PV/B] system under minimum (a), average (b), and maximum (c) sensitivity variables.
Energies 18 04712 g016
Table 1. Technical specifications of the components.
ComponentTechnical Specifications
Panel
(PV)

Energies 18 04712 i001
Model: LG410N2W-V5
Rated capacity: 410 W
Panel type: monocrystalline-Si
Open circuit voltage (Voc): 49.5 V
Short circuit current (Isc): 10.55 A
Power tolerance: 0/3%
Module efficiency: 19.8%
Lifetime: 25 years
Energies 18 04712 i002
Wind Turbine
(WT)

Energies 18 04712 i003
Model: Eocycle EOX S-16
Rated capacity: 30 kW
Rotor diameter: 15.8 m
Cut-in/out wind speed: 2.75/20 m/s
Hub height: 23.8 m
Lifetime: 30 years
Average wind speed (m/s)Gross output (kWh/yr)
4.041,140
4.555,910
5.070,920
5.585,460
6.099,000
6.5111,200
77.0121,860
7.5130,870
InverterModel: TommaTech Hybrid
Rated capacity: 60 kW
Rated AC output current: 87 A
Grid connection form: 3-Phase
Max. efficiency: 97.60
MPPT efficiency: >99%
Lifetime: 15 years
Energies 18 04712 i004
Generator (Gen) Model: Generic Gen60
Fuel: Diesel
Rated capacity: 60 kW
Fuel curve intercept: 2.80 L/h
Fuel curve slope: 0.253 L/h kW
Minimum load ratio: 25%
CO emission: 17.79 g/L
Particulate matter: 0.0712 g/L
Lifetime: 15,000 h
Energies 18 04712 i005
Battery
(B)
Model: SAFT/Kinetic 28S24M
Chemistry: Li-ion
Nominal voltage: 720 V
Nominal capacity: 55 kWh
Maximum capacity: 76.4 Ah
Capacity Ratio: 0.927
Rate constant (1/h): 0.989
Roundtrip efficiency: 97%
Maximum charge current: 82 A
Maximum discharge current: 200 A
Maximum charge rate: 1 A/Ah
Initial state of charge: 100%
Minimum state of charge: 5%
Throughput: 240,000 kWh
Lifetime: 20 years
Energies 18 04712 i006
Table 2. Configuration of standalone systems with varying architectures.
ArchitectureCostSystemGrid
NPC
(USD)
LCOE
(USD/kWh)
Operating
Cost
(USD/yr)
Initial
Capital
(USD)
Renewable
Fraction
(%)
Reduction
of CO2
(%)
Energy
Purchased
(kWh)
Energy
Sold
(kWh)
G/PV282,4920.04014601164,00977.854.9460,771138,638
G/PV/WT401,0650.05425127269,01282.462.5050,559152,683
G/WT445,9100.126013,237105,00017.716.39112,7722152
G/PV/B506,1120.071810,954224,01377.854.9460,771138,642
G/PV/WT/B624,7290.084511,499328,58182.462.5150,581152,148
G/WT/B785,7240.210020,007270,45533.528.4896,46410,098
Table 3. Cost evaluation of grid-connected [G/PV] system components.
ComponentCapital
(USD)
Replacement
(USD)
O&M
(USD)
Salvage
(USD)
Total
(USD)
Grid (G) 0.000.00−121,107.180.00−121,107.18
Panel (PV)153,414.630.00232,414.040.00385,828.68
Inverter10,594.359672.50802.49−3298.3717,770.97
System164,008.989672.50112,109.35−3298.37282,492.47
Table 4. Grid demand and rate schedule.
MonthEnergy
Purchased
(kWh)
Energy
Sold
(kWh)
Net Energy
Purchased
(kWh)
Peak
Load
(kW)
Energy
Charge
(USD)
Demand
Charge
(USD)
January10,6123828678441727.780
February7469652894033220.850
March743011,538−410933−163.690
April584112,886−704530−418.620
May102215,568−14,54634−1085.080
June59018,753−18,16223−1368.510
July98822,821−21,83310−1639.570
August129919,022−17,72311−1320.930
September166512,860−11,19530−817.550
October35117095−358334−202.120
November91765191398532486.40
December11,1692548862138878.580
Annual60,771138,638−77,86641−4702.460
Table 5. Sensitivity inputs (for the winning system architecture, [G/PV]).
ParameterMinimumAverageMaximum
Solar scaled average (kWh/m.d)2.04.57.0
Temperature scaled average (°C)1.011.525.0
Expected inflation rate (%)51030
Grid power price (USD/kWh)0.120.140.16
Grid sellback rate (USD/kWh)0.100.140.18
Table 6. Cost and economic performance metrics under different scenarios (power price, sellback rate, expected inflation).
Power Price
(USD/kWh)
Sellback Rate
(USD/kWh)
Expected Inflation Rate
(%)
NPC
(USD)
LCOE
(USD/kWh)
IRR
(%)
Simple
Payback (yr)
0.100.85191,5250.0960185.5
10333,4620.0960185.5
305.65 M0.0960-25<
0.105191,5250.0960244.2
10333,4620.0960244.2
305.65 M0.0960-25<
0.145191,5250.0960343.0
10333,4620.0960343.0
305.65 M0.0960-25<
0.185191,5250.0960442.3
10333,4620.0960442.3
305.65 M0.0960-25<
0.120.85239,4070.120195.2
10416,8270.120195.2
307.06 M0.120-25<
0.105239,4070.120254.0
10416,8270.120254.0
307.06 M0.120-25<
0.145239,4070.120352.9
10416,8270.120352.9
307.06 M0.120-25<
0.185239,4070.120452.2
10416,8270.120452.2
307.06 M0.120-25<
0.140.85279,3080.140205
10486,2980.140205
308.24 M0.140-25<
0.105279,3080.140263.8
10486,2980.140263.8
308.24 M0.140-25<
0.145279,3080.140362.8
10486,2980.140362.8
308.24 M0.140-25<
0.185279,3080.140462.2
10486,2980.140462.2
308.24 M0.1400.03325
0.160.85319,2090.160214.8
10555,7690.160214.8
309.41 M0.160-25<
0.105319,2090.160273.7
10555,7690.160273.7
309.41 M0.160-25<
0.145319,2090.160372.7
10555,7690.160372.7
309.41 M0.160-25<
0.185319,2090.160472.1
10555,7690.160472.1
309.41 M0.1600.06925
Table 7. System configuration of the standalone energy system.
ArchitectureCostSystem
System TypeSystem
Configuration
NPC
(USD)
LCOE
(USD/kWh)
Operating
Cost (USD/yr)
Initial
Capital (USD)
Renewable
Fraction (%)
Total Fuel
(L/yr)
Reduction of CO2 (%)
StandaloneGen/PV/B1.19 M0.34239,321173,90956.820,36364.58
Gen/PV/WT/B1.22 M0.35037,155258,45363.117,57469.43
Gen/WT/B1.65 M0.47653,245283,45932.431,44945.30
Gen/PV1.85 M0.53169,87146,672052,2099.19
Gen/PV/WT1.92 M0.55369,032143,441049,88613.23
Gen1.92 M0.55474,25211,500057,4930
Gen/WT1.96 M0.56671,749116,500053,4027.12
PV/WT/B2.54 M0.75958,9501.02 M1000100
PV/B2.80 M0.83774,327883,7021000100
WT/B4.52 M1.370100,9171.93 M1000100
Table 8. Cost evaluation of the components of the standalone [Gen/PV/B] hybrid system.
ComponentCapital
(USD)
Replacement (USD)O&M
(USD)
Fuel
(USD)
Salvage (-) (USD)Total
(USD)
Generator (Gen) 11,500.0047,430.392592.14629,308.623976.55686,854.60
Panel (PV)97,697.780.00148,006.330.000.00245,704.11
Battery (B)60,000.0037,121.02154,523.930.005525.37246,119.59
Inverter4710.964301.04356.840.001466.687902.16
System173,908.7488,852.46305,479.24629,308.6210,968.591,186,580.46
Table 9. Sensitivity inputs (for the winning system architecture, [Gen/PV/B]).
ParameterMinimumAverageMaximum
Solar scaled average (kWh/m.d)2.04.57.0
Temperature scaled average (°C)1.011.525.0
Diesel fuel price (USD/L)1.21.51.8
Expected inflation rate (%)51030
Table 10. Economic indicators and costs under different scenarios.
Solar Energy
(kWh/m2·d)
Fuel Price
(USD/L)
Expected Inflation Rate (%)NPC
(USD)
LCOE (USD/kWh)IRR
(%)
Simple
Payback (yr)
2.01.251.11 M0.557244.0
101.92 M0.554214.7
3032.0 M0.545127.8
1.551.37 M0.685283.5
102.37 M0.682263.7
3039.6 M0.673166.1
1.851.62 M0.813333.0
102.81 M0.810323.1
3047.1 M0.800156.2
4.51.251.11 M0.557352.8
101.92 M0.554323.1
3032.0 M0.545185.4
1.551.37 M0.685422.3
102.37 M0.682412.4
3039.6 M0.673234.3
1.851.62 M0.813501.9
102.81 M0.810482.1
3047.1 M0.800175.8
7.01.251.11 M0.557402.5
101.92 M0.554382.6
3032.0 M0.545214.6
1.551.37 M0.685501.9
102.37 M0.682492.0
3039.6 M0.673204.9
1.851.62 M0.813601.7
102.81 M0.810551.8
3047.1 M0.800195.1
Disclaimer/Publisher’s Note: The statements, opinions and data contained in all publications are solely those of the individual author(s) and contributor(s) and not of MDPI and/or the editor(s). MDPI and/or the editor(s) disclaim responsibility for any injury to people or property resulting from any ideas, methods, instructions or products referred to in the content.