A Substation Image Inspection Method Based on Visual Communication and Combination of Normal and Abnormal Samples
Abstract
1. Introduction
2. Substation Image Inspection Process
- (1)
- Preprocessing Equipment Images
- (2)
- Detecting Abnormal Equipment Images
- (3)
- Reviewing Abnormal Images
3. Substation Image Inspection Model
3.1. Preprocessing Equipment Images
3.1.1. Collecting Substation Equipment Images
3.1.2. Analyzing the Quality of Substation Equipment Images
3.1.3. Denoising Substation Equipment Images
3.2. Detecting Abnormal Equipment Images
3.2.1. Aligning Substation Equipment Images
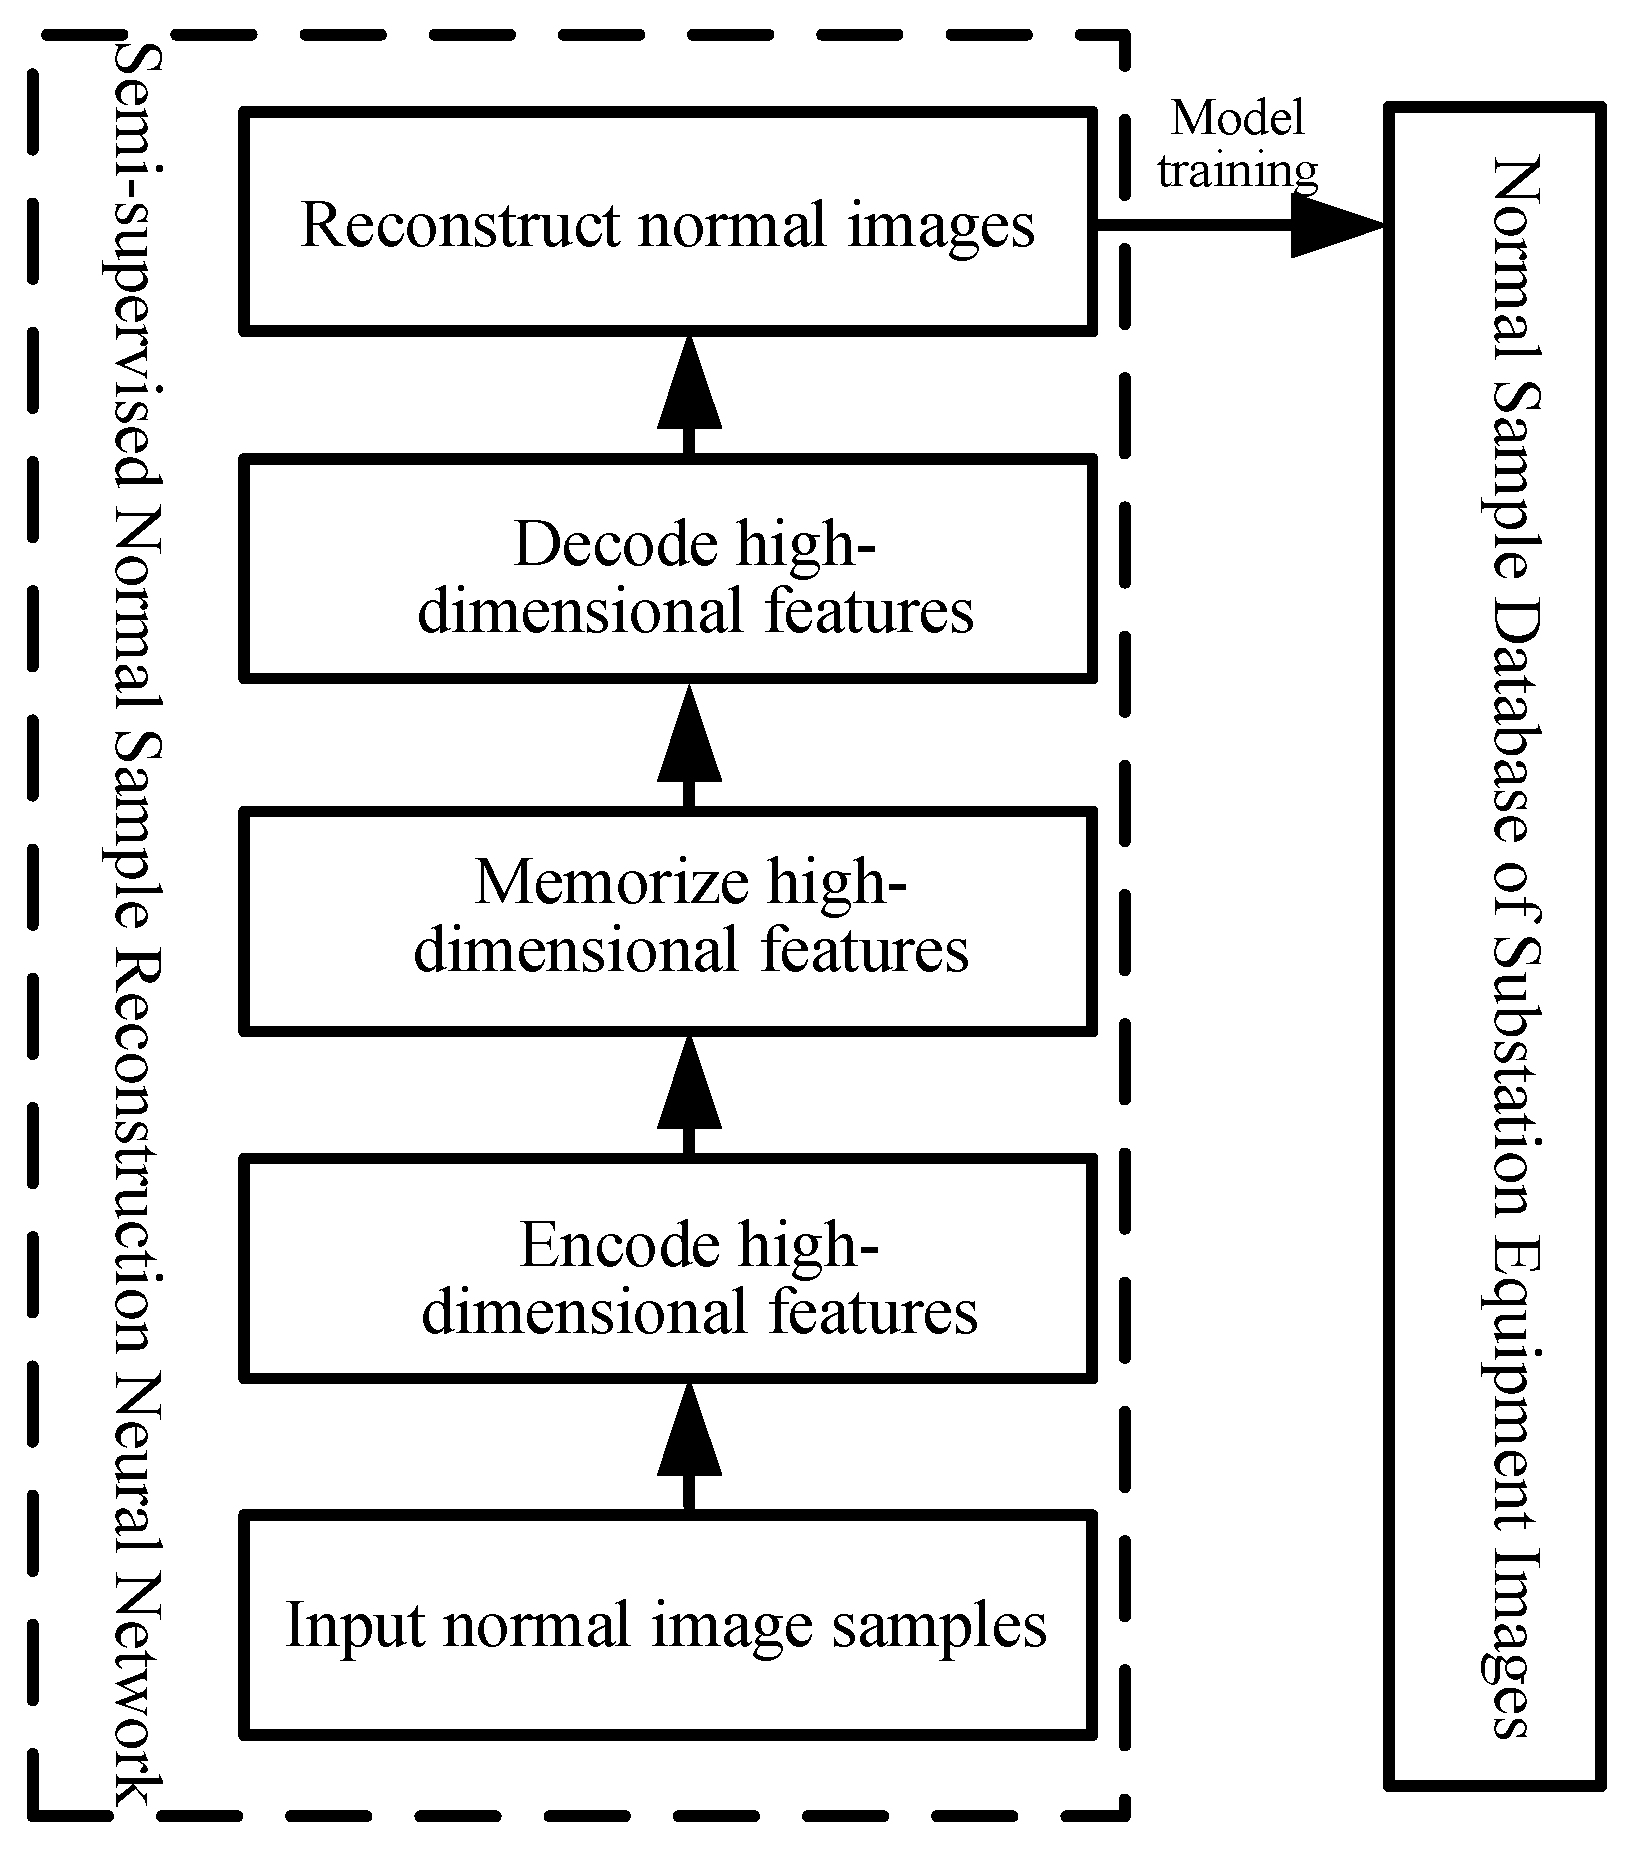
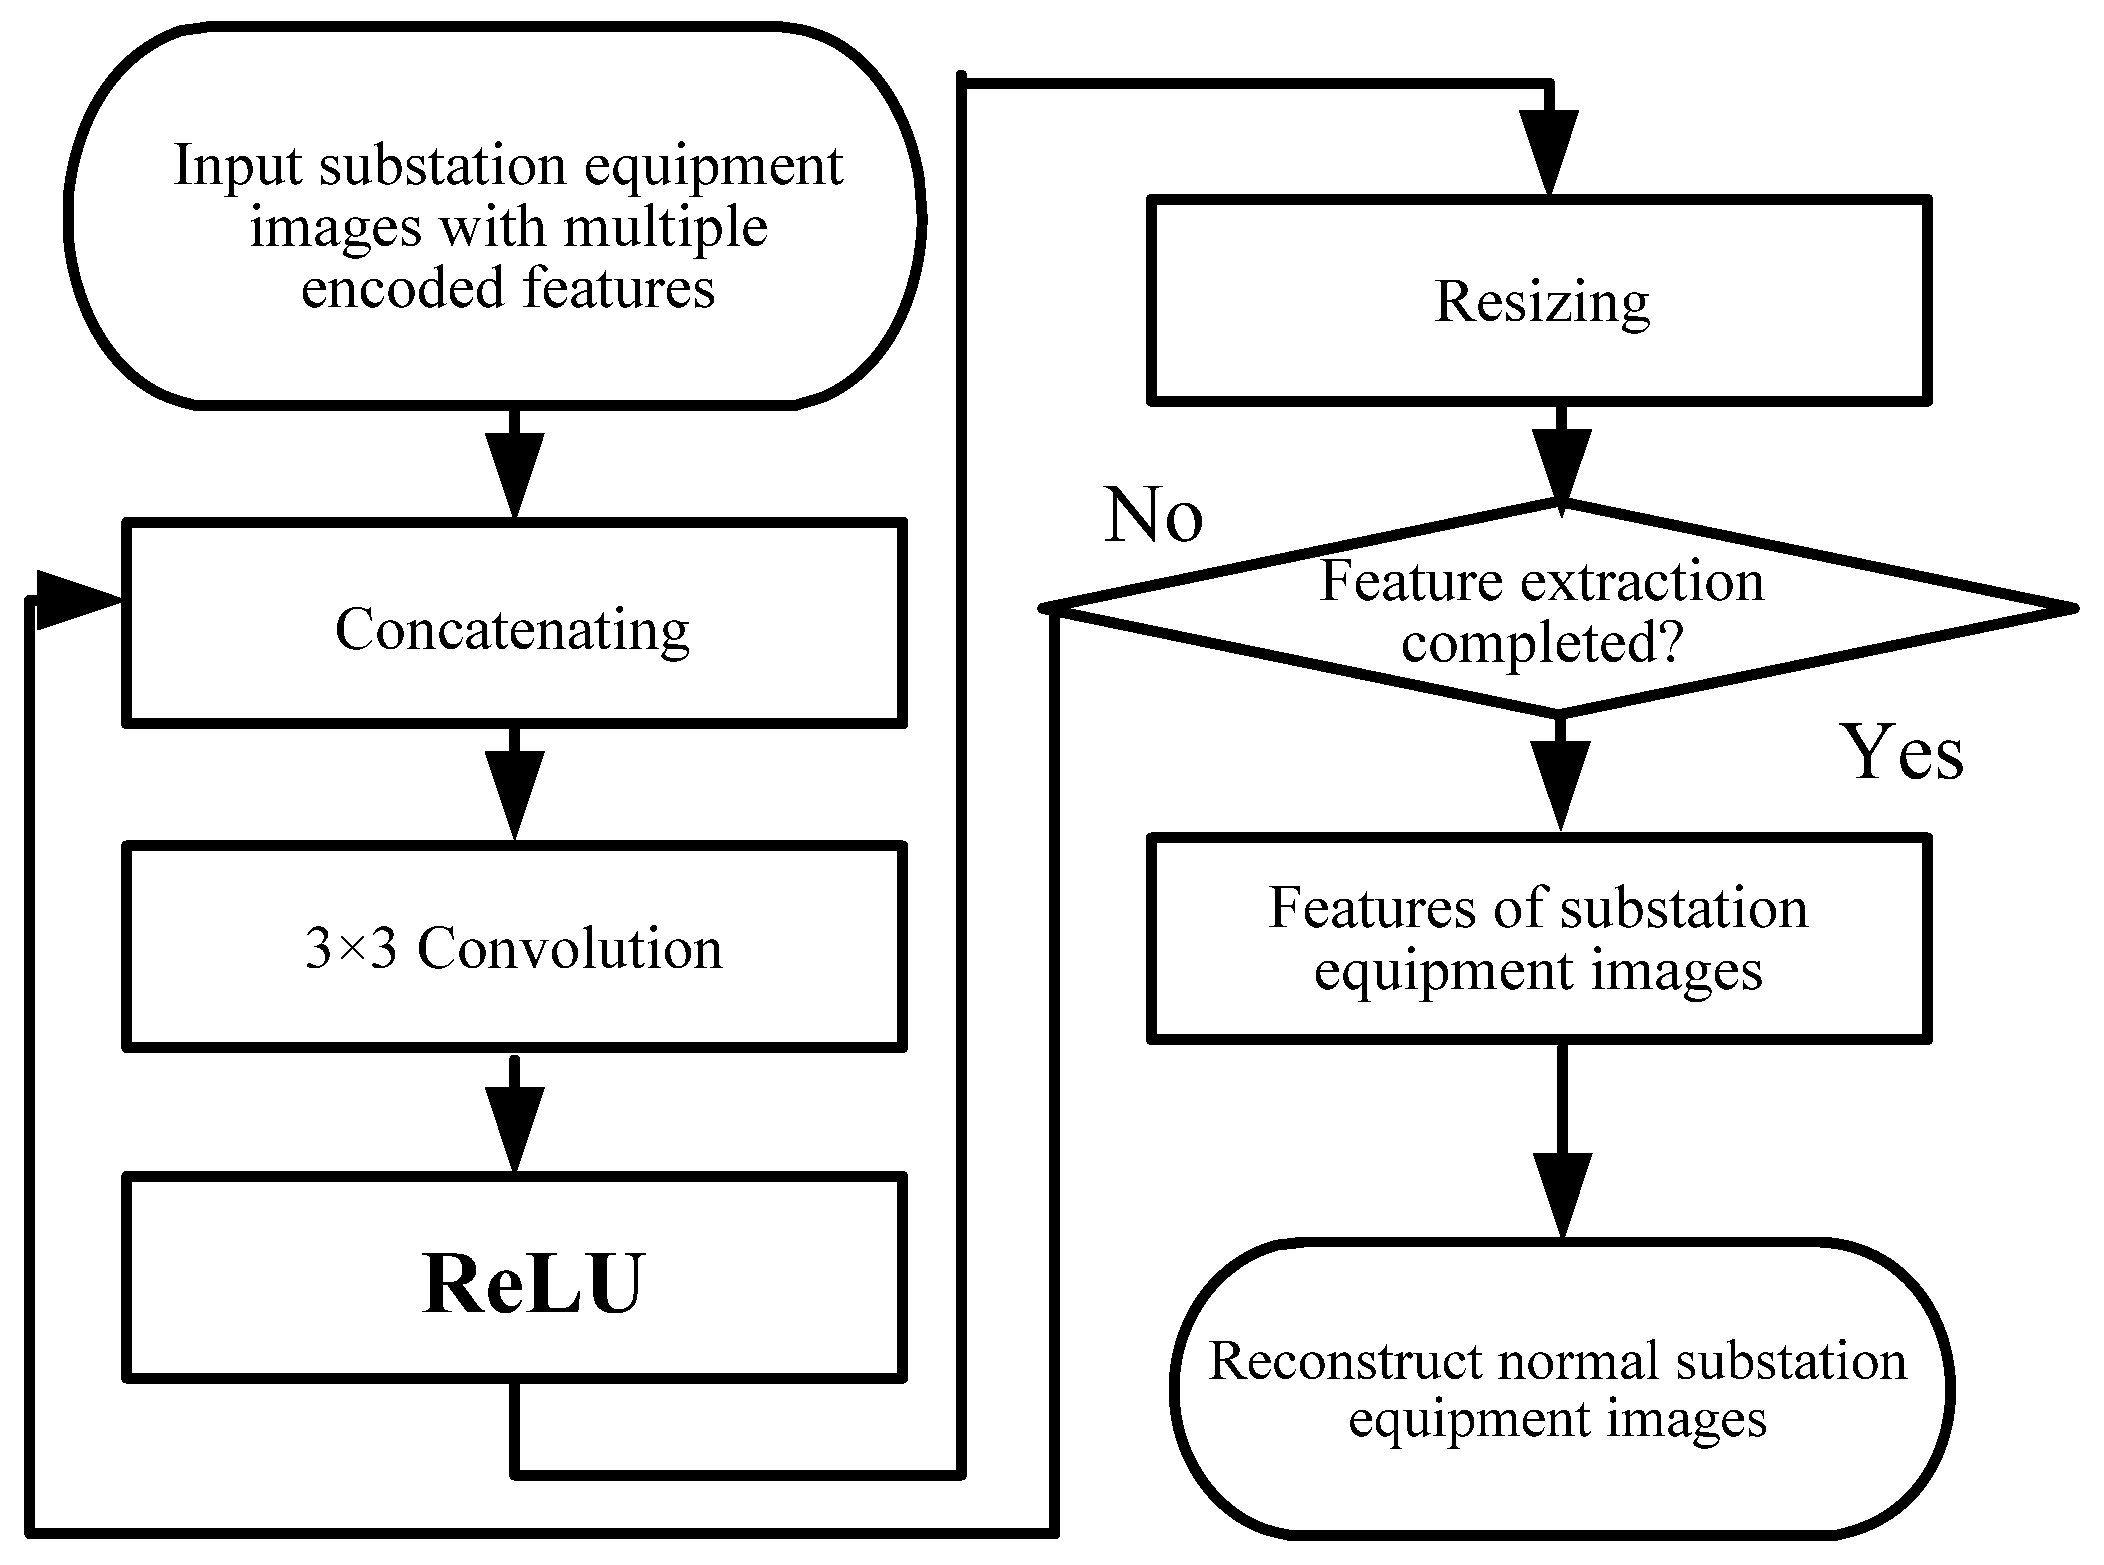
3.2.2. Utilizing Normal Substation Equipment Images for Model Training
3.2.3. Comparing Substation Equipment Images and Extracting Abnormal Regions
3.3. Reviewing Abnormal Images
4. Case Analysis
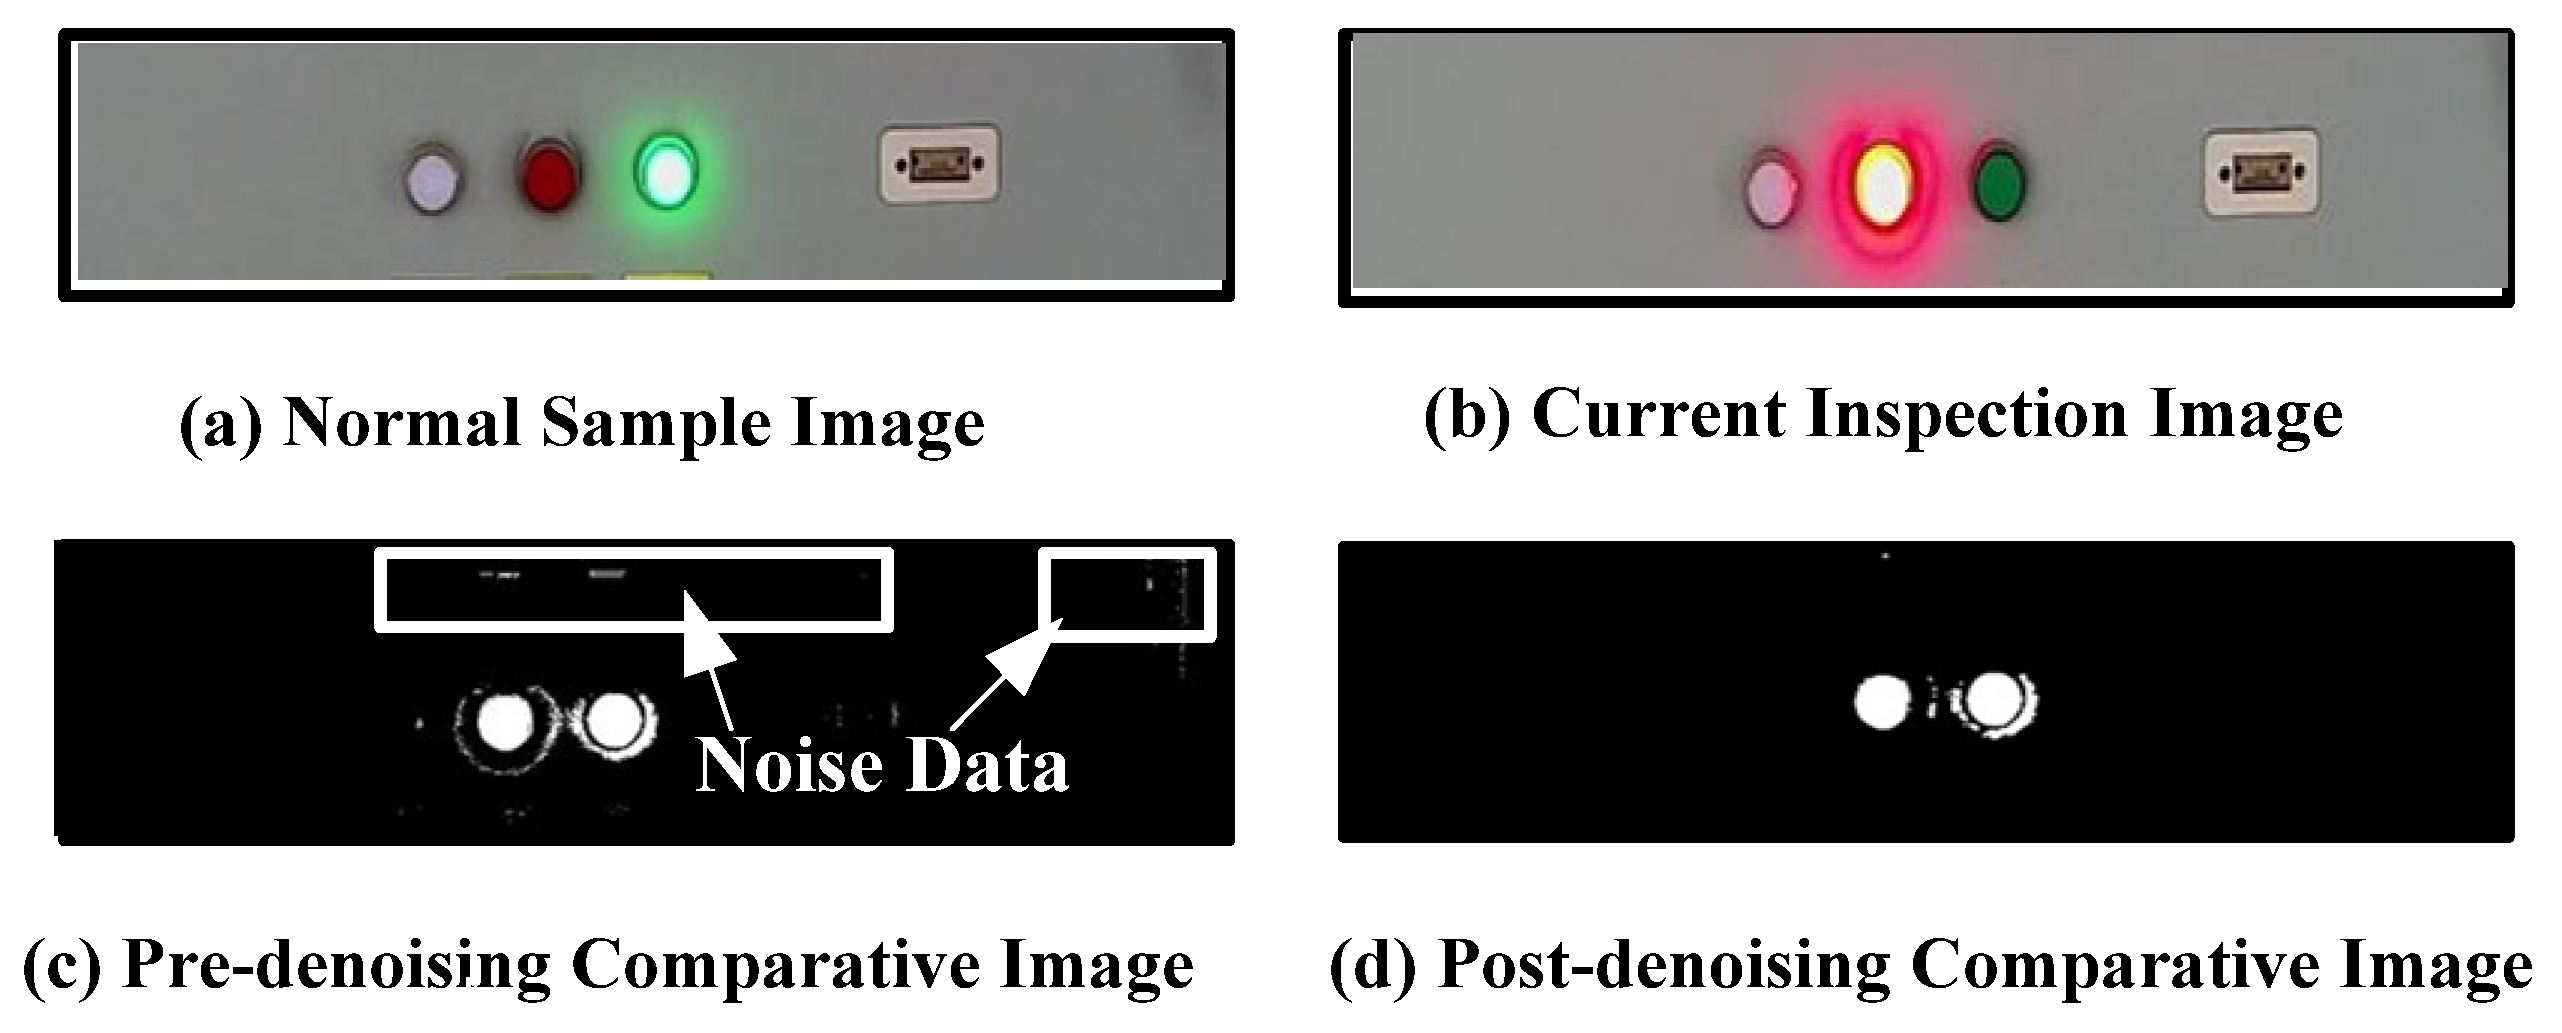
4.1. Analysis on Denoising of Substation Equipment Images
4.2. Analysis on Alignment of Substation Equipment Images
4.3. Analysis on Model Training Loss Function
4.4. Comparative Analysis of Abnormal Regions
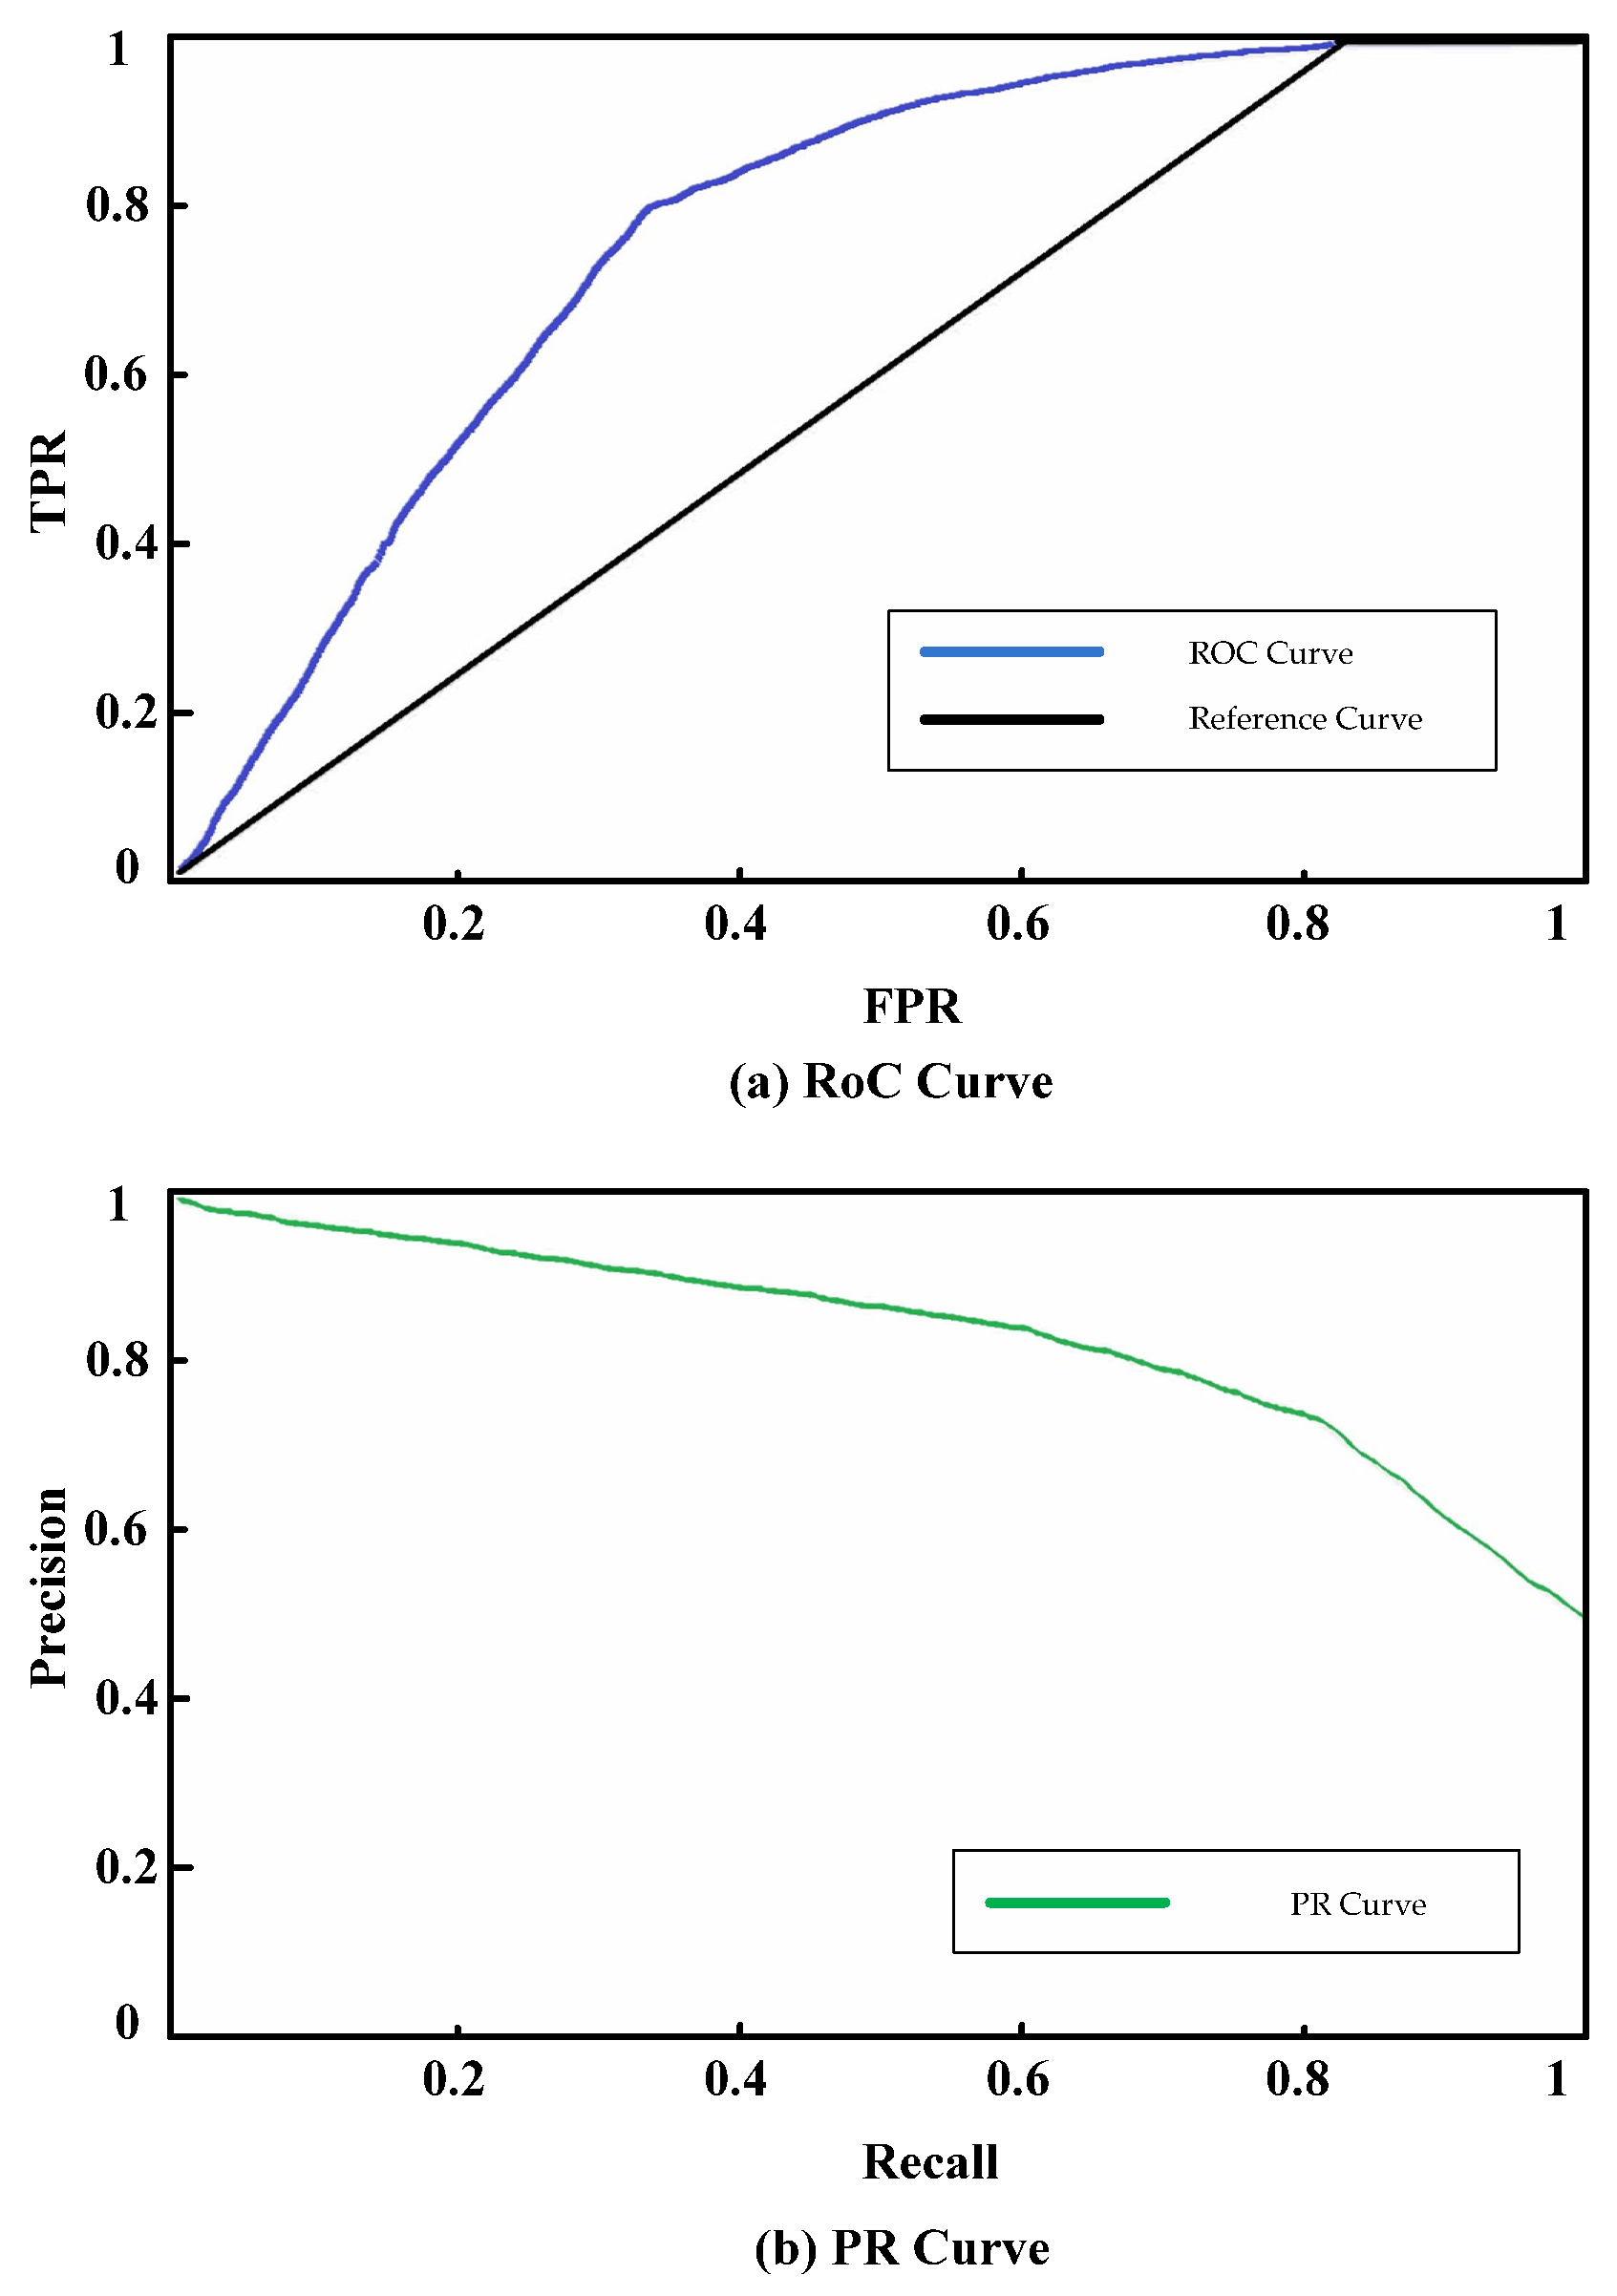
4.5. Evaluation Metrics for Normal Image Identification
4.6. Analysis on the Accuracy Rate in Anomaly Type Identification
4.7. Cross-Substation Threshold Stability Testing
4.8. Ablation Experiment Design and Results Analysis
4.9. Labeling Quality Assessment
5. Conclusions
Author Contributions
Funding
Data Availability Statement
Conflicts of Interest
References
- Dong, H.; Tian, Z.; Spencer, J.W.; Fletcher, D.; Hajiabady, S. Bilevel Optimization of Sizing and Control Strategy of Hybrid Energy Storage System in Urban Rail Transit Considering Substation Operation Stability. IEEE Trans. Transp. Electrif. 2024, 10, 10102–10114. [Google Scholar] [CrossRef]
- Ren, Z.; Jiang, Y.; Li, H.; Gu, Y.; Jiang, Z.; Lei, W. Probabilistic cost-benefit analysis-based spare transformer strategy incorporating condition monitoring information. IET Gener. Transm. Distrib. 2020, 14, 5816–5822. [Google Scholar] [CrossRef]
- Zhao, X.; Yao, C.; Zhou, Z.; Li, C.; Wang, X.; Zhu, T.; Abu-Siada, A. Experimental Evaluation of Transformer Internal Fault Detection Based on V-I Characteristics. IEEE Trans. Ind. Electron. 2020, 67, 4108–4119. [Google Scholar] [CrossRef]
- Zhou, Z.; Chen, Y.; Pan, C.; Zhao, X.; Zhang, L.; Wang, Z. Ultra-reliable and Low-latency Mobile Edge Computing Technology for Intelligent Power Inspection. High Volt. Eng. 2020, 46, 1895–1902. [Google Scholar]
- Tang, Z.; Xue, B.; Ma, H.; Rad, A. Implementation of PID controller and enhanced red deer algorithm in optimal path planning of substation inspection robots. J. Field Robot. 2024, 41, 1426–1437. [Google Scholar] [CrossRef]
- Hu, J.L.; Zhu, Z.F.; Lin, X.B.; Li, Y.Y.; Liu, J. Framework Design and Resource Scheduling Method for Edge Computing in Substation UAV Inspection. High Volt. Eng. 2021, 47, 425–433. [Google Scholar]
- Zhou, J.; Yu, J.; Tang, S.; Yang, H.; Zhu, B.; Ding, Y. Research on temperature early warning system for substation equipments based on the mobile infrared temperature measurement. J. Electr. Power Sci. Technol. 2020, 35, 163–168. [Google Scholar]
- Chen, X.; Han, Y.F.; Yan, Y.F.; Qi, D.L.; Shen, J.X. A Unified Algorithm for Object Tracking and Segmentation and its Application on Intelligent Video Surveillance for Transformer Substation. Proc. CSEE 2020, 40, 7578–7586. [Google Scholar]
- Wan, J.; Wang, H.; Guan, M.; Shen, J.; Wu, G.; Gao, A.; Yang, B. An Automatic Identification for Reading of Substation Pointer-type Meters Using Faster R-CNN and U-Net. Power Syst. Technol. 2020, 44, 3097–3105. [Google Scholar]
- Zheng, Y.; Jin, M.; Pan, S.; Li, Y.-F.; Peng, H.; Li, M.; Li, Z. Toward Graph Self-Supervised Learning with Contrastive Adjusted Zooming. IEEE Trans. Neural Netw. Learn. Syst. 2024, 35, 8882–8896. [Google Scholar] [CrossRef]
- Wan, X.; Cen, L.; Chen, X.; Xie, Y.; Gui, W. Multiview Shapelet Prototypical Network for Few-Shot Fault Incremental Learning. IEEE Trans. Ind. Inform. 2024, 20, 11751–11762. [Google Scholar] [CrossRef]
- Lee, K.H.; Yun, G.J. Microstructure reconstruction using diffusion-based generative models. Mech. Adv. Mater. Struct. 2024, 31, 4443–4461. [Google Scholar] [CrossRef]
- Jing, Y.; Zhong, J.-X.; Sheil, B.; Acikgoz, S. Anomaly detection of cracks in synthetic masonry arch bridge point clouds using fast point feature histograms and PatchCore. Autom. Constr. 2024, 168, 105766. [Google Scholar] [CrossRef]
- Yang, Y.X.; Angelini, F.; Naqvi, S.M. Pose-driven human activity anomaly detection in a CCTV-like environment. IET Image Process. 2022, 17, 674–686. [Google Scholar] [CrossRef]
- Wang, R.; Yin, B.; Yuan, L.; Wang, S.; Ding, C.; Lv, X. Partial Discharge Positioning Method in Air-Insulated Substation with Vehicle-Mounted UHF Sensor Array Based on RSSI and Regularization. IEEE Sens. J. 2024, 24, 18267–18278. [Google Scholar] [CrossRef]
- Qin, J.-H.; Ma, L.-Y.; Zeng, G.-F.; Xu, B.-L.; Zhou, H.-L.; Nie, J.-H. A Detection Method for the Edge of Cupping Spots based on Improved Canny Algorithm. J. Imaging Sci. Technol. 2024, 68, 168–176. [Google Scholar] [CrossRef]
- Jing, W.J. A unified homogenization approach for the Dirichlet problem in perforated domains. SIAM J. Math. Anal. 2020, 52, 1192–1220. [Google Scholar] [CrossRef]
- Doss, K.; Chen, J.C. Utilizing deep learning techniques to improve image quality and noise reduction in preclinical low-dose PET images in the sinogram domain. Med. Phys. 2024, 51, 209–223. [Google Scholar] [CrossRef]
- Sueyasu, S.; Kasamatsu, K.; Takayanagi, T.; Chen, Y.; Kuriyama, Y.; Ishi, Y.; Uesugi, T.; Rohringer, W.; Unlu, M.B.; Kudo, N.; et al. Technical note: Application of an optical hydrophone to ionoacoustic range detection in a tissue-mimicking agar phantom. Med. Phys. 2024, 51, 5130–5141. [Google Scholar] [CrossRef]
- Prabhu, R.; Parvathavrthini, B.; Raja, R.A.A. Slum Extraction from High Resolution Satellite Data using Mathematical Morphology based approach. Int. J. Remote Sens. 2021, 42, 172–190. [Google Scholar] [CrossRef]
- Li, C.; Hu, C.; Zhu, H.; Tang, F.; Zhao, L.; Zhou, Y.; Zhang, S. Establishment and extension of a compact and robust binary feature descriptor for UAV image matching. Meas. Sci. Technol. 2025, 36, 025403. [Google Scholar] [CrossRef]
- Li, S.; Le, Y.; Li, X.; Zhao, X. Bolt loosening angle detection through arrangement shape-independent perspective transformation and corner point extraction based on semantic segmentation results. Struct. Health Monit. 2025, 24, 761–777. [Google Scholar] [CrossRef]
- Zhang, Z.; Fang, W.; Du, L.L.; Qiao, Y.; Zhang, D.; Ding, G. Semantic Segmentation of Remote Sensing Image Based on Encoder-Decoder Convolutional Neural Network. Acta Opt. Sin. 2020, 40, 40–49. [Google Scholar] [CrossRef]
- Tao, X.; Hou, W.; Xu, D. A Survey of Surface Defect Detection Methods Based on Deep Learning. Acta Autom. Sin. 2021, 47, 1017–1034. [Google Scholar]
- Chen, X.; Yuan, G.; Nie, F.; Ming, Z. Semi-Supervised Feature Selection via Sparse Rescaled Linear Square Regression. IEEE Trans. Knowl. Data Eng. 2020, 32, 165–176. [Google Scholar] [CrossRef]
- Zhang, D.; Zhang, X.; Sun, H.; He, J.H. Fault Diagnosis for AC/DC Transmission System Based on Convolutional Neural Network. Autom. Electr. Power Syst. 2022, 46, 132–140. [Google Scholar]
- Shan, C.; Li, A.; Chen, X. Deep delay rectified neural networks. J. Supercomput. 2023, 79, 880–896. [Google Scholar] [CrossRef]
- Wu, K.; Zhang, J.A.; Huang, X.; Guo, Y.J.; Heath, R.W. Waveform Design and Accurate Channel Estimation for Frequency-Hopping MIMO Radar-Based Communications. IEEE Trans. Commun. 2021, 69, 1244–1258. [Google Scholar] [CrossRef]
- Zhang, H.R.; Zhao, J.H.; Xiaoguang, Z. High-resolution Image Building Extraction Using U-net Neural Network. Remote Sens. Inf. 2020, 35, 143–150. [Google Scholar]
- Yang, S.G. Perceptually enhanced super- resolution reconstruction model based on deep back projection. J. Appl. Opt. 2021, 42, 691–697,716. [Google Scholar] [CrossRef]
- Ming, Y.F.; Li, Y.X. How Does Fine-Tuning Impact Out-of-Distribution Detection for Vision-Language Models. Int. J. Comput. Vis. 2024, 132, 596–609. [Google Scholar] [CrossRef]
- Wen, Y.H.; Wang, L. Yolo-sd: Simulated feature fusion for few-shot industrial defect detection based on YOLOv8 and stable diffusion. Int. J. Mach. Learn. Cybern. 2024, 15, 4589–4601. [Google Scholar] [CrossRef]


| Research Direction | Key Findings | Limitations | Novel Contributions of This Paper |
|---|---|---|---|
| Defective Sample-Based Identification Method | The approach proposes to locate and classify defects through object detection algorithms, such as Faster R-CNN, and construct a preliminary defect identification model. | The reliance on a substantial volume of defective samples, coupled with limited coverage of the sample database, leads to low identification accuracy. | The method proposed in this paper detects anomalies without relying on defective samples by leveraging a wealth of normal samples, thereby solving the problem of sample scarcity. |
| Algorithm Optimization and Transfer Learning | Several techniques, including the introduction of an attention mechanism, PatchCore, DRAEM, and transfer learning, were employed to enhance model performance in few-shot scenarios. | The approach still relies on defective samples without overcoming the limitations of a small sample size, offering limited improvements in generalization capability. | The method proposed in this paper directly filters out normal images through comparison with normal samples, thus reducing the calculation load of anomaly identification and the cost for manual intervention. |
| Unsupervised Learning and Data Augmentation | The approach proposes to expand samples using diffusion-based reconstruction methods, employ self-supervised contrastive learning to reduce the need for labeling samples, and enhance the diversity of defective samples through data augmentation. | Data augmentation may introduce noise, and self-supervised contrastive learning exhibits weak adaptability to complex scenarios. | The method proposed in this paper combines semi-supervised learning for classifying and reviewing abnormal images, balancing the advantages of automation and manual verification. |
| Category | Name | Category | Name |
|---|---|---|---|
| Main transformer | Transformer assembly | Switchgear | Circuit breaker compartment |
| Radiator | Switchgear assembly | ||
| Bushing | Intelligent electronic device (IED) for switchgear | ||
| Bushing oil level | Protection and control unit for switchgear | ||
| Oil conservator | Merging unit for differential and low-voltage backup protection | ||
| Lightning arrester | Capacitor bank | Capacitor bank | |
| Buchholz relay | Station service grounding transformer and arc suppression coil | Station service grounding transformer and arc suppression coil | |
| Control power supply box | Station DC power system | Uninterruptible power supply (UPS) panel | |
| On-load tap changer (OLTC) | AC incoming panel | ||
| Gas insulated switchgear | Gas insulated switchgear assembly | AC distribution panel | |
| Pressure gauge for SF6 gas insulated switchgear | Rectifier | ||
| Leakage current meter for lightning arrester | Battery bank | ||
| Switch | Cable interlayer | Primary cables | |
| Disconnector | Secondary cables | ||
| Grounding disconnector |
| Category | Symbol | Full Name of the Metric | Category | Symbol | Full Name of the Metric |
|---|---|---|---|---|---|
| Parameter | Δf1 | Gradient threshold, which is used to determine whether an image is out of focus. | Variable | ui−1 | Output from the previous layer of CNN neurons |
| Δf2 | Peak signal-to-noise ratio (PSNR) threshold, which is used to determine whether an image is underexposed. | Mbi | Feature vector of the input image | ||
| Δf3 | Similarity threshold, which is used to determine whether an image contains abnormal regions. | Mai | Feature vectors of images in the normal sample database | ||
| Δf4 | Anomaly matching threshold, which is used for anomaly type identification. | Ekj | Pixel values of the original image | ||
| np | Number of images in the normal sample database | Hkj | Pixel values of the reconstructed image | ||
| na | Pixel values along the horizontal axis of the image | wi | Trainable weights of each layer in LPIPS | ||
| oa | Pixel values along the vertical axis of the image | vi | Feature mapping functions of each layer in LPIPS | ||
| ne | Size of CNN’s convolution kernel | wl | The sum of the LPIPS channel weights of the same dimension | ||
| ng | Number of CNN neural layers | yaj,ybj | Normalized features of the current image and the normal sample image | ||
| nh | Number of normal samples in the normal sample database | fc | Similarity score of the current image | ||
| nh | Number of training samples | fcavg | Average similarity among images in the normal sample database | ||
| nb | Number of layers in the LPIPS network | fcmax | Maximum similarity in the normal sample database | ||
| nl | Channel count in the first layer of the spatial attention module | fcmin | Minimum similarity in the normal sample database | ||
| no | Channel count in the second layer of the spatial attention module | dmax1i | Maximum dissimilarity value among the first-layer channel defective samples | ||
| Variable | s(Ex,Ey) | The input substation equipment image | dmax2i | Maximum dissimilarity value among the second-layer channel defective samples | |
| fa | Gradient of the current image | zah3 | Sampling value of the first-layer saliency map | ||
| fbi | Gradient value of the i-th image in the normal sample database | zah2 | Sampling value of the second-layer saliency map | ||
| fbmax | Maximum gradient value in the normal sample database | Function | ∇2s | Laplace operator, which is used to calculate the second-order derivative of an image | |
| fbmin | Minimum gradient value in the normal sample database | G(xc,yc,δ) | Gaussian function, which is used for constructing scale space | ||
| Hij | Noisy substation equipment image | γ(⋅) | Sigmoid Activation Function: γ(x) = 1/(1 + e − x) | ||
| Eij | Original noise-free substation equipment image | ReLU | Rectified Linear Unit (ReLU): ReLU(x) = max(0, x) | ||
| Amax | Maximum pixel value of an image (255 for 8-bit images) | Operator | ⊖ | The erosion operator, which is a fundamental operation in morphological processing | |
| lz | Structural elements for image morphological processing | ⊕ | The dilation operator, which is a fundamental operation in morphological processing | ||
| qc | The positional parameter of the erosion kernel; | ∗ | The convolution operator, which is used for feature extraction | ||
| Ea | Input images to be denoised | ‖ ‖2 | The L2 norm, which is used to calculate the Euclidean distance of a vector | ||
| xc,yc | Horizontal and vertical coordinates of an image | log10 | The base-10 logarithmic function, which is used for calculating PSNR | ||
| δ | Standard deviation of the Gaussian function | Acronyms | PSNR | Peak Signal to Noise Ratio | |
| eb | The scale-space factor | SIFT | Scale Invariant Feature Transform | ||
| Exy | Input images to be processed | PT | Perspective Transformation | ||
| xb,yb,zb | Three-dimensional coordinates before perspective transformation | SSL | Semi-Supervised Learning | ||
| b11~b33 | Elements of a 3 × 3 perspective transformation matrix | CNN | Convolutional Neural Networks | ||
| oei | Brightness values of local image regions | MSE | Mean Squared Error | ||
| wei | The weighted value of CNN convolutional kernels | LPIPS | Learned Perceptual Image Patch Similarity | ||
| β | The bias term of CNN | VC | Visual Communication | ||
| wgj | Weights between CNN neuron layers | RMSE | Root Mean Square Error |
| Category | VC-CNAS Method | CLIP-Based Zero-Shot Detection | YOLOv8 with Few-Shot Fine-Tuning | ||||||
|---|---|---|---|---|---|---|---|---|---|
| Precision (%) | Recall (%) | F1-Score (%) | Precision (%) | Recall (%) | F1-Score (%) | Precision (%) | Recall (%) | F1-Score (%) | |
| Meter damage | 96.2 | 94.7 | 95.4 | 83.5 | 74.5 | 81.2 | 88 | 86.5 | 90.2 |
| Oil leakage | 95.8 | 93.5 | 94.6 | 79.2 | 73.2 | 79.9 | 89.3 | 89 | 86.3 |
| Insulator damage | 94.5 | 92.1 | 93.3 | 82.9 | 72.2 | 79.3 | 88.3 | 86.6 | 86.3 |
| Abnormal substation breathers | 97.1 | 95.3 | 96.2 | 82.1 | 79.7 | 80.6 | 91.6 | 86.4 | 87 |
| Abnormal cabinet door closure | 93.8 | 91.7 | 92.7 | 81.6 | 79.2 | 81.9 | 91.9 | 89.2 | 87.4 |
| Cover plate damage | 95.5 | 93.2 | 94.3 | 84.5 | 74.6 | 78.4 | 89.3 | 89 | 89.2 |
| Foreign matter | 94.9 | 92.8 | 93.8 | 79.7 | 79.3 | 78.9 | 87 | 86.6 | 87.1 |
| Abnormal oil level | 96.5 | 94.1 | 95.3 | 79.8 | 73.3 | 79.3 | 91.2 | 88.6 | 90.5 |
| Average | 95.3 | 93.4 | 94.3 | 81.7 | 75.8 | 79.9 | 89.6 | 87.7 | 88 |
| Average | 95.3 | 93.4 | 94.3 | 81.7 | 75.8 | 79.9 | 89.6 | 87.7 | 88 |
| Metric | Δf1 | Δf2 | ||
|---|---|---|---|---|
| Original Method | Optimized | Original Method | Optimized | |
| Average TPR | 91.3% | 94.2% | 90.7% | 93.5% |
| Average FPR | 6.8% | 4.9% | 7.2% | 5.1% |
| Resampling efficiency improvement | - | 8.3% | - | 7.9% |
| Experimental Configuration | Accuracy Rate in Reporting Abnormal Images (%) | Accuracy Rate in Anomaly Type Identification (%) | Time Required for Each Inspection (s) |
|---|---|---|---|
| Full Method (Baseline) | 100 | 92.4 | 11.23 |
| Without morphological denoising | 94.7 | 85.6 | 9.87 |
| Without image alignment | 91.3 | 82.1 | 10.52 |
| Without both | 86.5 | 76.3 | 9.21 |
| Model Architecture | Accuracy Rate in Reporting Abnormal Images (%) | Accuracy Rate in Anomaly Type Identification (%) | Number of Training Iterations to Convergence |
|---|---|---|---|
| CNN (Baseline) | 100 | 92.4 | 400 |
| Vision Transformer | 99.2 | 93.1 | 650 |
| Metric | Accuracy Rate in Reporting Abnormal Images (%) | Minor Anomaly Identification Rate (%) |
|---|---|---|
| LPIPS (Baseline) | 100 | 100 |
| SSIM | 92.6 | 67.3 |
| PSNR | 90.1 | 58.5 |
| Metric | Numerical Value | Description |
|---|---|---|
| Pseudo-labeling accuracy | 97.30% | Average result of 5 rounds of sampling verification, with the mislabeling rate < 3% |
| Feature consistency | 0.92 | Higher than the 0.85 threshold, indicating consistent distribution |
| Loss fluctuation magnitude | 0.012 | Lower than the 0.02 threshold, demonstrating training stability |
Disclaimer/Publisher’s Note: The statements, opinions and data contained in all publications are solely those of the individual author(s) and contributor(s) and not of MDPI and/or the editor(s). MDPI and/or the editor(s) disclaim responsibility for any injury to people or property resulting from any ideas, methods, instructions or products referred to in the content. |
© 2025 by the authors. Licensee MDPI, Basel, Switzerland. This article is an open access article distributed under the terms and conditions of the Creative Commons Attribution (CC BY) license (https://creativecommons.org/licenses/by/4.0/).
Share and Cite
Tang, D.; Fan, Z.; Liu, Y.; Wan, X. A Substation Image Inspection Method Based on Visual Communication and Combination of Normal and Abnormal Samples. Energies 2025, 18, 4700. https://doi.org/10.3390/en18174700
Tang D, Fan Z, Liu Y, Wan X. A Substation Image Inspection Method Based on Visual Communication and Combination of Normal and Abnormal Samples. Energies. 2025; 18(17):4700. https://doi.org/10.3390/en18174700
Chicago/Turabian StyleTang, Donglai, Zhongyuan Fan, Youbo Liu, and Xiang Wan. 2025. "A Substation Image Inspection Method Based on Visual Communication and Combination of Normal and Abnormal Samples" Energies 18, no. 17: 4700. https://doi.org/10.3390/en18174700
APA StyleTang, D., Fan, Z., Liu, Y., & Wan, X. (2025). A Substation Image Inspection Method Based on Visual Communication and Combination of Normal and Abnormal Samples. Energies, 18(17), 4700. https://doi.org/10.3390/en18174700


