Abstract
As a type of electrochemical energy storage, the vanadium redox flow battery system (VRFB) is currently one of the most promising large-scale energy storage methods. Nevertheless, the ability to accurately estimate the state of charge (SOC) is one of the critical factors restricting the commercialization of VRFBs. This review summarizes the estimation methods for the SOCs of VRFBs used by scholars in the past 10 years, comprehensively discusses the main factors affecting the accuracy of SOC estimation, and discusses the direct measurement methods, combined with modeling filter estimation methods and data-driven SOC estimation approaches currently investigated by mainstream scholars. Although several recent literature reviews describe the current modeling and estimation methods for VRFBs, there has been relatively little attention paid to the more common equivalent circuit modeling methods and parameter identification approaches. This review mainly focuses on common equivalent circuit model (ECM) modeling methods and filter estimation algorithms using modeling, and it summarizes their advantages and disadvantages. Finally, a description of potential research directions for VRFB modeling and SOC estimation in the future is presented.
1. Introduction
At present, renewable energy generation accounts for an increasing proportion of the overall power supply structure. Hence, the transition from fossil fuels to renewable sources has become an irreversible trend. However, challenges associated with their intermittency and instability are becoming increasingly prominent [1,2,3,4,5,6,7]. The application of large-scale, long-duration energy storage can effectively smooth grid fluctuations and improve overall grid stability. Hence, high-reliability and intrinsically safe, long-duration storage systems have emerged as essential devices in the advancement of renewable energy generation systems [8,9,10]. Among various energy storage technologies, pumped hydro storage is currently one of the most widely implemented and mature energy storage techniques. Nevertheless, its deployment is significantly constrained by the geographical location and environmental conditions [11,12]. Pumped hydro storage alone is insufficient to meet the diverse energy storage demands. Electrochemical energy storage technologies, represented by lithium-ion batteries and redox flow batteries (RFBs), offer high operational flexibility and have emerged as effective complements to large-scale pumped hydro storage. The benefits of electrochemical energy storage technologies have demonstrated broad application prospects and rapid growth in recent years. Within this category, RFBs have become one of the most promising options for large-scale energy storage systems owing to their long cycle lives and high safety [13,14,15].
An RFB stores electrical energy in the form of chemical energy within flowing redox electrolyte solutions. The catholyte and anolyte are stored separately in two external tanks, isolated from the cell itself, and are pumped into two half-cells where the redox reactions take place. The two half-cells are separated by an ion exchange membrane or porous separator to prevent the direct mixing of the electrolytes [16]. During charging and discharging, the corresponding redox reactions take place in each half-cell. Thereby, RFBs can store energy in the electrolyte or release energy from the electrolyte. Owing to its inherent design, the capacity and power of an RFB can be independently configured: the electrolyte concentration and volume determine the maximum energy storage capacity of the system, whereas the sizes of individual cells and the number of cells in the stack determine the overall system power [17]. The separation design of power and capacity can ensure the flexibility required by large-scale energy storage systems. Moreover, RFBs have a fast response time and easy electrolyte recovery, are simple and safe to operate, and reduce operation and maintenance costs. Moreover, RFBs are environmentally friendly and suitable for application in energy storage systems [18,19].
At present, among various RFBs classified by electrolyte type, the all-vanadium redox flow battery (VRFB) remains the most promising for large-scale commercialization [12,14,20,21,22]. The VRFB was first developed in the early 1980s by Professor Maria Skyllas-Kazacos and her research group at the University of New South Wales, Australia [23]. Thanks to the selection of all-vanadium electrolytes, the primary redox couples in both the catholyte and anolyte consist solely of vanadium ions. This significantly reduces electrolyte cross-contamination caused by the inability of the membrane to completely block the interpenetration of cations. Hence, VRFBs can minimize the loss of effective capacity [24], and such capacity loss can be partially recovered by periodically mixing the electrolytes [25,26]. This results in a cycle life of 10,000 to 20,000 cycles for VRFBs. Regarding other types of RFBs, although iron–chromium RFBs exhibit a similar cycle life, they require additional measures to suppress side reactions. Despite the relatively mature applications for zinc-based RFBs, they still suffer from a significantly reduced lifespan due to the solid-state transformation of zinc during reactions. Organic RFBs, while offering a higher energy density, have a low cycle life and most remain at the laboratory research stage. Considering these factors comprehensively, VRFBs are currently the most widely used and investigated types of RFBs. Moreover, large-scale VRFB systems have already been deployed worldwide [27,28]. The promising application prospects of VRFBs have driven extensive research efforts toward their commercialization. Researchers expect to enable VRFBs to compete with the currently mature lithium-ion battery technology in the future. The current research and investigations primarily focus on optimizing key components, such as polymeric membranes and carbon fiber electrodes, to effectively suppress side reactions and alleviate battery degradation. The aim of such research is to improve the energy conversion efficiency and lower the manufacturing costs.
Meanwhile, research on the accurate state estimation of RFBs has also become a popular topic. This task is typically performed by the battery management system (BMS). The BMS serves as a core component, responsible for monitoring and controlling the proper and efficient operation of the RFB system [29]. A BMS tailored to the intrinsic characteristics of the RFB is primarily adopted to ensure system safety and mitigate capacity degradation over the lifespan of the RFB. The estimation of the state of charge (SOC) is a crucial function of the BMS. The SOC represents the remaining usable capacity of the RFB, and its accurate prediction is vital for the effective control and management of RFBs. Precise SOC estimation helps to prevent overcharging and overdischarging, thereby reducing capacity loss and enhancing the safety and stability of RFBs [29,30].
This review focuses on the key issues in SOC estimation for VRFBs and summarizes the current advances in VRFB modeling and SOC estimation. Specifically, Section 2 discusses the fundamental operating principles of VRFB systems and the factors affecting the accuracy of the SOC estimation. Section 3 introduces estimation models suitable for the determination of the SOC for VRFB systems, and Section 4 presents detection and estimation methods for the SOC. Finally, Section 5 summarizes the current opportunities and challenges in the field and provides guidance for future research.
2. Introduction to VRFB System and SOC Estimation
2.1. Working Principle of VRFB
The VRFB employs two vanadium redox couples, V2+/V3+ and VO2+/VO22+, as the electroactive species and redox couples. The VRFB system mainly consists of the battery stack, circulation pumps, electrolyte storage tanks, and piping, as illustrated in Figure 1.
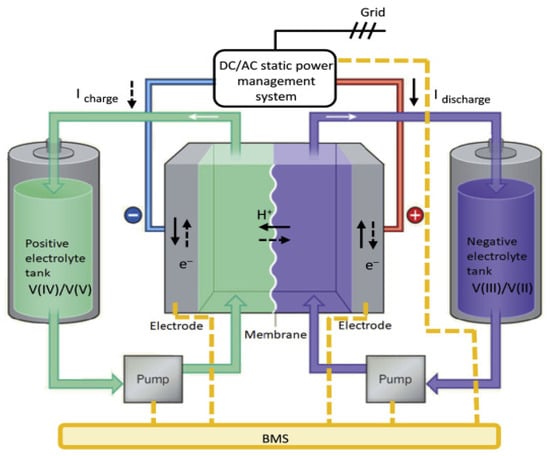
Figure 1.
Schematic diagram of VRFB and main components (reproduced with permission from [31]).
The size of the VRFB stack determines the power output of the system, while the concentrations and volumes of the electrolytes determine the energy storage capacity of the system [32]. The catholyte and anolyte consist of sulfuric acid solutions, and they contain dissolved VO2+/VO22+ or V2+/V3+ redox couples, respectively. Electrical energy is stored and released through the reversible conversion of vanadium species between different oxidation states, with the electrolytes stored separately in the positive and negative electrolyte tanks. The VRFB stack is assembled by connecting multiple single cells in series, and each single cell comprises end plates, current collectors, bipolar plates, electrodes, and a proton exchange membrane, as illustrated in Figure 2. The end plates are located at both ends of the VRFB stack and are fastened by bolts to ensure the secure sealing of the battery assembly. The current collectors connect to the external circuit and serve to collect the current generated by the electrochemical reactions or to supply current from an external source. The proton exchange membrane separates the electrolytes of the two half-cells to prevent direct mixing and undesired reactions. The electrodes are typically composed of carbon-based materials such as carbon felt or carbon cloth [33]. To achieve high VRFB efficiency, electrodes generally possess a large specific surface area and good electrical conductivity. Bipolar plates are usually composed of graphite, because high electrical conductivity is essential to improve overall system efficiency. Moreover, graphite is preferred over metal materials for bipolar plates due to its resistance to corrosion caused by redox reactions. The circulation pumps transport the electrolyte from the electrolyte tanks through piping to the VRFB stack. After the electrochemical reaction takes place within the stack, the electrolyte returns to the tanks via the piping system, enabling continuous charge and discharge cycles. The external circuit of the VRFB stack connects to the load or power source.
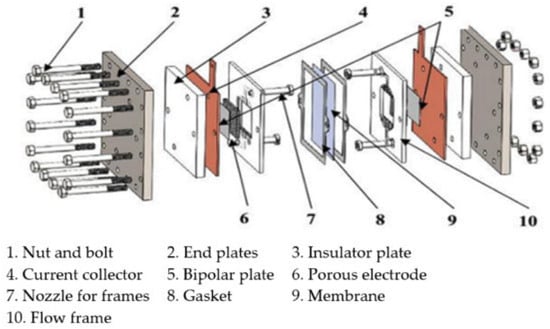
Figure 2.
The single-cell components for a VRFB (reproduced with permission from [34]).
During discharge, VO2+ ions at the cathode gain electrons to form VO22+, while V2+ ions at the anode lose electrons to form V3+. Electrons flow from the negative current collector through the external circuit to the positive current collector. Simultaneously, H+ ions migrate from the negative side to the positive side through the proton exchange membrane, completing the circuit and maintaining the overall electrical neutrality of the electrolyte. The charging process is the reverse of the discharging process.
The VRFB accomplishes the conversion between chemical energy and electrical energy through the following chemical reactions [35].
Positive electrode:
Negative electrode:
The overall electrochemical reaction equation is as follows:
To ensure charge balance during charging and discharging processes, maintain equal reaction efficiency, and maximize the utilization of the initial capacity, the concentrations and volumes of the corresponding vanadium ions in the anolyte and catholyte should be consistent. Specifically, the concentrations and volumes of V3+ and VO2+, as well as V2+ and VO2+, should be matched. Theoretically, in the absence of vanadium ion crossover through the membrane, after a full charge, the VO2+ in the catholyte will be completely converted to VO2+, and the V3+ in the anolyte will be fully converted to V2+, corresponding to an SOC value of 100%. Conversely, after a full discharge, the VO2+ in the catholyte will be fully converted back to VO2+, and the V2+ in the anolyte will be completely converted to V3+, representing an SOC value of 0. When all chemical species participate in the reaction, the VRFB capacity is referred to as the theoretical capacity. The theoretical capacity of the VRFB can be expressed by the following formula, with the unit of A·h:
Here, under theoretical conditions, QN represents the theoretical capacity of the VRFB; n is the number of electrons transferred per mole of reactant—in the case of the VRFB, n = 1; c denotes the concentration of the reactant in the half-cell; Vtank is the volume of the reactant in the electrolyte storage tanks; and F is the Faraday constant. If the initial concentrations of the two half-cells differ, the theoretical capacity of the VRFB is limited by the side with the smaller total amount of reactants.
Based on the above equation, the SOC of the VRFB can be calculated using the Coulomb counting method by integrating the current measured by the installed current sensors in the system during charging or discharging. The SOC can be obtained by comparing the accumulated charge with the theoretical capacity. The calculation formula is as follows:
where Qcell is the accumulated charge over the time interval of t1–t2; Qhistory is the charge of the VRFB at the end of the previous operation; t represents the time in seconds (s); and i denotes the charge or discharge current in amperes (A).
Under the above theoretical conditions, the SOC of the VRFB can be expressed by the following equations.
Positive electrode:
Negative electrode:
When the positive and negative electrodes of VRFBs employ electrolytes with the same capacity and concentration, it can be approximated that the reaction kinetics of the positive and negative electrodes of the battery are in equilibrium. At this point,
This definition references the total amount of vanadium ions in both the catholyte and anolyte. By monitoring the proportion of pentavalent or divalent vanadium ions, the SOC of the VRFB can be determined. This provides a theoretical basis for direct measurement methods such as the spectrophotometric analysis of vanadium ions at different oxidation states or the direct titration of vanadium ion concentrations. The SOC of the VRFB during operation can thus be represented by the variation in the concentration of the main vanadium ions in either the catholyte or anolyte.
From the above, it is evident that the SOC of a VRFB is actually determined by the concentrations of vanadium ions at different oxidation states. Based on these concentrations, the corresponding open-circuit voltage (OCV) of the VRFB system can be calculated using the Nernst equation. The expression for the OCV of the VRFB is given as follows:
where E0 is the equilibrium potential under standard conditions, measured in volts (V); EOCV is the OCV of the VRFB, also in volts (V); c denotes the concentration of the corresponding species in the electrolyte, in moles per liter (mol/L); γ represents the ionic activity of the species in the electrolyte; z is the number of electrons transferred; T is the temperature in Kelvins (K); F is the Faraday constant, typically F = 96485 C/mol; and R is the universal gas constant, generally R = 8.314 J/(K·mol).
By combining Equations (7)–(10), and under the ideal conditions mentioned above, since ionic activity is difficult to measure in practice and the electrolyte in the VRFB is continuously circulated, the Nernst equation can be employed to establish the relationship between the OCV and the SOC, as shown in the following equation:
The OCV of the VRFB can be directly obtained by measuring individual cells within the VRFB system. By referencing the measured voltage against a lookup table, the current SOC of the VRFB can be determined. This provides a practical method of obtaining the SOC of the VRFB system.
In fact, since the OCV-SOC is usually only related to the ion concentration, temperature, etc., and does not undergo drastic changes with battery aging, they are usually used in model-based SOC estimation methods. However, due to the different working environments and electrolyte compositions during use, in most cases, insufficient consideration of these factors will result in the theoretical calculation of the OCV-SOC curve not matching the actual situation. Thus, usually, when the model is used, a real OCV-SOC curve will be established through actual experiments.
The specific operation steps are to first fully charge the battery to 1.6 V through CC-CV and then discharge the battery through multiple small-current constant intermittent pulses. After each discharge, the solution is allowed to stand for a period of time to eliminate the interference of hysteresis effects caused by battery polarization on OCV measurement. The voltage after multiple discharges until settling is the cutoff voltage of 0.8 V. The current SOC of the battery is estimated by the pulse current and charging time, thus establishing a nonlinear relationship between the OCV and SOC of the VRFB. After discharging for a period of time, the battery is charged to 100% using the same steps. The relationship between the OCV and SOC during the charging process is then established. Usually, these two curves are averaged to minimize errors as much as possible. Expressing this nonlinear function through a polynomial can be used to measure the OCV and estimate the SOC by looking up a table.
2.2. Factors Affecting the State of Charge (SOC)
Ideally, the proton exchange membrane (PEM) allows only H+ ions to pass through. However, during the actual operation of the VRFB, electrolytes flow on both sides of the membrane and participate in redox reactions to complete the charging–discharging process. Under the influence of the potential and concentration gradients, the PEM also permits the crossover of some vanadium ions and water molecules, resulting in crossover phenomena [36]. This causes a small number of vanadium ions to transfer from one side of the membrane to the other, leading to self-discharge reactions that reduce the Coulombic efficiency of the VRFB. The reaction equations are illustrated below.
Positive electrode:
Negative electrode:
Moreover, due to the differing permeabilities of the PEM to various vanadium ions, the imbalance in crossover rates gradually increases over time as molecular crossover accumulates, which leads to the capacity degradation of the VRFB [37,38]. At this point, the SOC values calculated for the positive and negative electrodes based on Equation (9) will differ and deviate from the actual SOC. If charging and discharging continue based on the original standards, it may result in overcharge and overdischarge, causing irreversible damage to the VRFB system. The main reason for inaccurate SOC estimation caused by vanadium ion permeation is due to the influence of QN in the Coulomb formula, which is also the main reason for the influence of the Coulombic efficiency.
Meanwhile, ions typically cross the PEM in the form of hydrated ions, causing water molecules to transfer across the PEM as well. Over time, this leads to an imbalance in water between the catholyte and anolyte, resulting in changes in the ion concentrations on both sides and indirectly affecting the estimation of the SOC [37,38,39,40].
The electrolyte in the VRFB consists of vanadium ions dissolved in sulfuric acid, making it an aqueous electrolyte and eliminating the risk of combustion or explosion. However, the standard electrode potential of the V2+/V3+ redox couple in the anolyte is approximately −0.26 V, which is slightly lower than the hydrogen evolution potential. This necessitates strict control of the charging cutoff voltage during VRFB operation, typically kept below 1.6 V, to avoid hydrogen evolution. However, the area of the VRFB stack used in practice is usually large, and the electrolyte flow rate between the electrodes can be uneven. There may be low-speed areas of the electrolyte, which increases the internal resistance. When the potential is greater than the hydrogen evolution potential, protons will seize the electrons required for the oxidation reaction of vanadium ions, generating hydrogen gas and causing hydrogen evolution [41,42,43].
During normal charging, theoretically, all VO2+ at the positive electrode will be converted into VO2+, and the electrons provided will be transferred to the negative electrode along the external circuit. However, hydrogen evolution will cause the positive electrode of the VRFB to consume more electrons. When the total number of transferred electrons remains unchanged, V3+ cannot be fully converted into V2+, and H2 cannot directly participate in the discharge reaction of the VRFB, resulting in the actual capacity of the cathode in the VRFB being less than the theoretical capacity, reducing the available capacity of the entire system.
In contrast, the oxygen evolution reaction at the positive anode affects the overall capacity of the VRFB. Its working mechanism is similar to that of the hydrogen evolution reaction. However, since the potential of oxygen evolution is much greater than the voltage at which VO2+ is oxidized, the frequency of oxygen evolution is much lower than that of the hydrogen evolution reaction. Hence, in this review, we will not discuss the oxygen evolution reaction in detail [26,44,45,46].
The oxidation of the negative electrolyte is another major side reaction, and it takes place when the negative electrolyte is exposed to air. Under room temperature and an air atmosphere, the V2+ ions after charging may be spontaneously oxidized by oxygen to V3+ ions. To prevent overdischarge, when all V2+ ions are converted into V3+ ions, the VRFB reaction ends. However, at this time, there is still VO2+ in the positive electrolyte that has not been converted into VO2+, which leads to a decrease in the overall energy storage capacity. To prevent this reaction from occurring, it is necessary to strictly ensure that the negative electrolyte is isolated from oxygen. At room temperature, the reaction equation of V2+ and oxygen in the negative electrolyte is as follows:
The hydrogen evolution reaction, oxygen evolution reaction, and electrolyte oxidation essentially reduce the amounts of reactants to decrease QN, thereby affecting SOC estimation.
The temperature is one of the factors that affects the normal operation of VRFBs. Under low temperatures (below 10 °C), divalent vanadium, trivalent vanadium, and tetravalent vanadium may form sulfate precipitation [47,48]. Under high temperatures (above 40 °C), VO2+ easily forms V2O5 precipitation. These phenomena will greatly affect the capacity of the VRFB and may cause pipe blockages and system damage simultaneously. The current methods used to improve the electrolyte when working under extreme conditions mainly include improving the supporting electrolyte and adding additives [48,49]. However, this is still in the experimental stage. In actual engineering applications, good thermal management which maintaining the temperature range within 10–40 °C is still the most effective approach to ensure the effective operation of the VRFB system. The temperature can have an impact on the SOC. In addition to causing reactant precipitation and reducing QN due to excessively high or low temperatures, the temperature can also affect the Nernst equation, causing the OCV-SOC curve to become inaccurate. This will have a significant impact on the commonly used model-based filter algorithms for SOC estimation, which will be introduced in the following section. This is because, when using these algorithms to estimate the SOC, usually, only one set of curves is measured at a constant temperature as a reference. The change in temperature inevitably leads to errors.
3. VRFB Simulation Model
Due to the influence of many factors on the estimation of VRFBs, accurate modeling is necessary. Modeling is not only useful for SOC estimation; it can also describe the overall changes in VRFBs. Accurate models can be used to explain complex experimental phenomena, replacing expensive experimental operations and saving costs. The following section will present the models primarily used for SOC estimation.
3.1. Electrochemical Model (EM)
The EM is mainly employed for the design and modeling simulation of VRFB systems to fully understand the influence of working condition variations [50]. There are many parameters involved, and many studies have systematically introduced this issue [51,52].
This review mainly focuses on the SOC estimation of VRFB systems. When predicting the actual SOC, the EM needs to be simplified according to the main aspects of concern. When the EM is applied to SOC estimation, the parameters are mostly calculated using meta-heuristic algorithms or neural networks, which are computationally intensive. Most of them can only be estimated offline, resulting in only short-term SOC estimation accuracy. However, as the duration is extended, the model parameters will vary, and, in most cases, the model needs to be recalibrated. Usually, the EM is only suitable for the design or theoretical verification of VRFB systems. However, due to the existence of relevant theoretical support, the use of EMs may introduce flow rate, temperature, and vanadium ion diffusion models to improve the accuracy of SOC estimation.
At present, for a determined VRFB system, the electrochemical model design related to state estimation mainly focuses on adjustable influencing factors such as the flow rate, temperature, and vanadium permeation, given the determination of bipolar plates, electrodes, membranes, and other components. Electrochemical modeling often relies on a mass conservation formula, charge conservation formula, and thermal equilibrium formula. Currently, only a few lumped parameter models have been applied to SOC estimation. This review will briefly mention the designed flow rate, temperature, and vanadium ion equilibrium formulas.
Hydraulic model: Generally speaking, in order to ensure that the battery operates at its optimal state, the flow rate of the pump needs to meet the reaction requirements. A sufficient flow rate can reduce the occurrence of polarization reactions and improve the SOC utilization rate during constant-current charging and discharging. This has led to previous models primarily under-estimate the flow rate, which is unreasonable because a high flow rate can also increase pump losses, which should also be taken into account in the system losses. Thus, hydraulic models are mostly used to calculate the loss of the system caused by the flow velocity [53]. The overall loss consists of three parts, namely the loss in the stack, the loss in the pipe, and the loss caused by fluid friction, which are Pstack, Ppipe, and Pk. The formulas are as follows:
where f is the friction coefficient, lpipe is the circuit length, lf is the flow frame length, v is the electrolyte velocity, d is the hydraulic diameter, μ is the fluid viscosity, and Kck is the Kozeny–Carman constant.
The total pump overcomes power loss as follows:
where q is the electrolyte flow rate.
Thermal model: Temperature changes have a significant impact on VRFBs. As mentioned earlier, the temperature can affect electrolytes and SOC measurements. Without further description, only the relevant thermodynamic formulas are listed here [54].
For the stack:
For the pipe:
For the tank:
Here, ΔTs, ΔTp, and ΔTt represent the temperature rises of the stack, pipe, and tank, respectively. H represents the natural convective heat transfer coefficient, Ppump represents the pump loss caused by viscosity during the cycling process, Pch represents the entropy heat absorbed or released during the charge discharge process, PR represents the internal ohmic loss of the battery, Q represents the flow rate, Cp represents the specific heat capacity, and ρ represents the electrolyte density.
Vanadium ion crossover model: Vanadium ion crossover is one of the most important factors affecting the working states of all vanadium flow batteries. Due to the cross-permeation of vanadium ions, there is an imbalance in vanadium ions in the two half-cells. This type of EM was primarily developed by the Skyllas-Kazacos team [7]. Its principles are as follows.
For V2+:
For V3+:
For VO2+:
For VO2+:
Here, ci represents the concentrations of different types of vanadium ions, v represents the volumes of the storage tank and half-cell, q represents the flow rate, S represents the proton exchange membrane area, F is the Faraday constant, and kox is the V2+ oxidation coefficient. Moreover, c represents the half-cell, t represents the tank, p represents the positive electrode, and n represents the negative electrode.
3.2. Equivalent Circuit Model (ECM)
The ECM is composed of basic electrical components and simulates the state variations caused by the internal chemical reactions of the VRFB according to the electrical characteristics between the electrical components. It performs well in predicting the electrical dynamic responses of VRFBs [55].
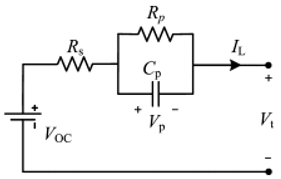
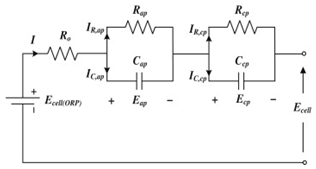
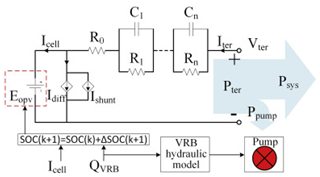
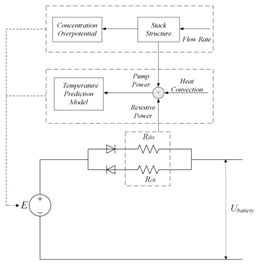
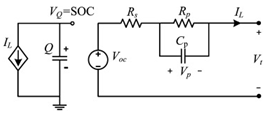
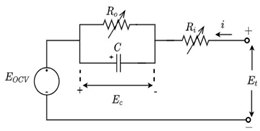
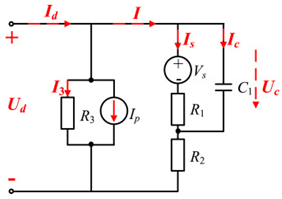
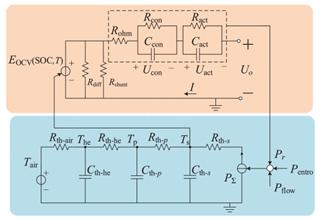
Although the ECM may not be as effective as the EM in explaining the internal state of the VRFB in terms of mechanisms, the simple and accurate model equation has a smaller calculation burden, and the estimation accuracy is within the allowable range, making it more appropriate for applications in practical engineering. The most commonly adopted ECM components include resistors, capacitors, ideal current sources, etc. It is easy to establish the state space equation of the VRFB model through the relationships between the components, so as to carry out modeling and simulation. The most commonly used ECMs include the Thevenin model and second-order RC model. A simplified ECM can often only predict VRFBs under fixed conditions. Considering some working characteristics of VRFBs, such as the pump loss, flow, temperature, and various other losses, scholars have proposed the AC impedance model, equivalent loss model, electrothermal coupling model, capacity fading model, etc. [56]. On the basis of simplifying the calculations, the practicality of the model can be further improved. Table 1 shows schematic diagrams of various ECMs and lists their respective advantages and disadvantages.

Table 1.
Different ECMs for VRFBs.
In fact, most of the early inspiration for ECM-based VRFB SOC estimation came from the SOC estimation of lithium batteries, which are also used for electrochemical energy storage [63]. However, compared to lithium batteries, the challenges faced in SOC estimation for VRFBs may not be the same. Although the electrolytes of most lithium batteries are liquid, the electrolyte of the VRFB is driven by a pump and flows, which results in significant changes in the overall properties of VRFBs compared to lithium batteries. The most intuitive demonstration is that, when identifying offline parameters through HPPC operating conditions, it is not necessary to have the same 1 h static state as in lithium batteries to achieve overall stability inside VRFBs.
Moreover, prolonged standing may result in a decrease in the actual voltage due to the self-discharge phenomenon of the battery. However, the increase in flow rate also makes it easier for electrolyte of VRFB to pass through the membrane due to the impact of the pump in battery operation engineering, resulting in electrolyte permeation and capacity decay. Nonetheless, it should be noted that this capacity attenuation can be restored through mutual mixing. This results in the need for more frequent updates of the Q value in the SOC estimation of VRFBs. Although the flow rate is rarely considered in the laboratory, in reality, pump losses should also be calculated in the system, so flow rate regulation should also be taken seriously in modeling.
At the same time, VRFBs are more likely to be used for large-scale energy storage, while lithium batteries are commonly used in automobiles, and the actual working conditions are also different. VRFBs are mostly charged and discharged with a constant current, and the temperature rise is relatively slow, which makes the overall temperature control of the battery traceable. As can be seen from the previous section on the impact of the temperature on batteries, although VRFBs are different from lithium batteries, there is no risk of thermal runaway. However, it is still necessary to maintain a suitable temperature. If there is no temperature control device to maintain a constant temperature, the model should add a thermal component to improve the accuracy of SOC estimation.
4. Methods for Estimation of SOC for VRFBs
The acquisition of the internal state is one of the key issues facing VRFB research at present [52]. Accurate internal state acquisition can help the BMS system to correctly change the control strategy to ensure that the VRFB system operates in the best operating state, while reducing the occurrence of side reactions and slowing down the degradation process in VRFBs. Meanwhile, the lifespan of the VRFB can be determined based on the current battery status, and the VRFB system can be maintained in time to reduce losses. The SOC is one of the most important indicators in state estimation, because it is directly related to the charging and discharging processes of the VRFB. It is an important parameter when measuring the available power of the VRFB. Moreover, the SOC provides an important basis in controlling whether the VRFB continues to charge and discharge. Because the VRFB undergoes polarization during the charging and discharging process, the terminal voltage of the VRFB corresponding to the SOC does not match the actual terminal voltage [64]. To suppress hydrogen evolution and VRFB overdischarge, the charging voltage of a single cell in a VRFB is generally limited to 1.6 V, and the discharging voltage is limited to 0.8 V. If the charging and discharging is stopped when the voltage at the measuring end reaches the set voltage, the full VRFB capacity cannot be utilized. Reasonable and correct SOC estimation can improve the energy storage performance of VRFBs, which is beneficial in reducing the occurrence of overcharging and overdischarging. Moreover, it avoids great damage to the battery and enables the effective utilization of the VRFB system.
4.1. Direct Measurement Methods
At present, the SOC monitoring of VRFBs mainly adopts sensors or experimental reagents to obtain the actual operating data of the VRFB system. The SOC of the current battery can be obtained through a direct measurement method by looking up a table or directly calculating the value. The model-based state estimation method mainly adopts a battery model to estimate the state through a specific algorithm. The main direct measurement methods include the ampere-hour integration method, the OCV method, and the direct measurement of the VRFB concentration. Although the experimental process in this type of approach is simple, it is not suitable for engineering applications. Among them, the ampere-hour integration method calculates the SOC by measuring the accumulated power of the VRFB during charging or discharging [65]. This method has the simplest experimental process, but it is also limited by the accuracy of the current sensor and can be easily affected by noise. Hence, the error gradually accumulates due to the integration. The accuracy can be quite low after long-term operation, and each measurement requires knowledge of the most recent SOC value in history for initialization.
Due to the inherent electrochemical properties of the VRFB, under ideal conditions, a nonlinear relationship between the OCV and the SOC can be established using the Nernst equation. By experimentally obtaining accurate OCV data, the current SOC of the VRFB can be precisely calculated through the relationship expressed in Equation (10).
In practice, the OCV-SOC relationship of each VRFB differs from that in theoretical derivation due to variations in experimental conditions across different models. Factors such as temperature changes also affect the OCV-SOC relationship. Therefore, it is necessary to experimentally measure the OCV-SOC curve and perform polynomial fitting to obtain the specific relationship between the OCV and SOC for the VRFB. This relationship is then used during subsequent parameter identification processes to determine the required model parameters. It has been verified by Wei et al. that, within the SOC range of 10% to 95%, the OCV-SOC curve shows minimal variation over 30 cycles, with a maximum error of 1.562 mV, indicating low sensitivity to battery aging [57].
Although the OCV approach is relatively simple, it requires the VRFB to be in a non-operational state and sufficiently rested to eliminate internal polarization effects. Additionally, measuring the overall OCV cannot account for electrolyte imbalances. This limitation can be improved by installing reference electrodes in both the positive and negative half-cells.
Within a reasonable operating temperature range, temperature variations have a minimal impact on the voltage, as reported in [65]. SOC estimation based on the OCV method is thus insensitive to temperature changes, with errors of less than 2.1% over a temperature range of 12 °C to 32 °C. Therefore, when high precision is not required, the OCV method can be adopted to measure the SOC. However, reference electrodes tend to experience potential drift over time and require frequent calibration [66]. Moreover, high-precision reference electrodes are costly, making the OCV approach more suitable as a theoretical basis for model-based SOC estimation techniques. A schematic diagram of the OCV method is shown in Figure 3.
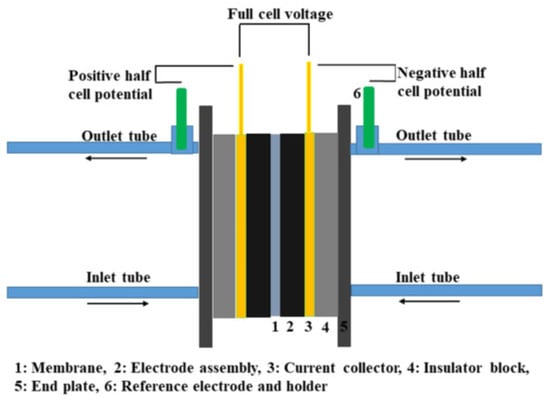
Figure 3.
Schematic diagram for half-cell potential measurement (reproduced with permission from [34]).
The normal operation of the VRFB is mainly accompanied by the mutual conversion of four vanadium ions with different oxidation states. According to Formulas (7) and (8), the SOC of the VRFB system actually reflects the concentrations of various vanadium ions in the VRFB. In the laboratory, the concentrations of the VRFB can be directly measured to collect data or conduct experimental verification. Representative methods include potentiometric titration, the conductivity method, the optical analysis method, the acoustic analysis method, the physical analysis method, and the amperometric method.
- Potentiometric titration estimates the SOC by measuring the concentrations of different vanadium ions in the electrolyte. As a quantitative analysis method, it provides an accurate method for determining the electrolyte composition. However, when applied for online monitoring, this method requires sampling of the stack and the analysis of stack samples during operation, which can easily lead to electrolyte oxidation and capacity loss in the stack. The complex steps and long measurement times make this method less practical for real-time applications [67]. It is often used as a reference to verify the accuracy of other SOC estimation methods.
- Conductivity method: The conductivity method can independently monitor the SOC of each half-cell in a VRFB system. As the charge–discharge cycles proceed and chemical reactions occur, the electrolyte concentration changes accordingly. Using a conductivity meter, the conductivities of the four vanadium ions at different oxidation states are measured under varying concentrations, temperatures, and total vanadium concentrations. Based on the correlation between the electrolyte conductivity and SOC, a qualitative assessment of the SOC can be achieved. However, the accuracy of quantitative SOC estimation using this method is relatively low [68].
- Optical analysis method: Vanadium ions exhibit different colors at various oxidation states in an acidic environment. In detail, V2+ appears purple, V3+ green, VO2+ blue, and VO2+ yellow. During the operation of a VRFB, the electrolyte undergoes noticeable color changes, which in turn affect the absorbance of the solution. This change in absorbance is used as the basis for analysis [67,69,70,71,72]. The SOC is detected by correlating the absorbance of the electrolyte with the SOC using spectrophotometry. Jana Heiß et al. adopted the entire ultraviolet–visible (UV-Vis) absorption spectrum for the SOC estimation of VRFBs, and it was found that the SOC measurement of the negative electrolyte showed a dependence on the absorption spectrum [73]. However, due to complexation effects in the positive electrolyte, the SOC does not exhibit a clear linear relationship with the absorption spectrum, making it unsuitable for separate half-cell measurements. Liu et al. proposed a method to link the positive electrolyte with the SOC based on the electrolyte refraction spectrum [72]. Through the real-time monitoring of the electrolyte refraction spectrum at a specific wavelength and its comparison with the previously stored database spectrum, they achieved good estimation accuracy in short-term SOC estimation. However, this method requires additional equipment to obtain the required spectrum, and the spectrometer is more expensive, which increases the cost of use and calculation [74]. Wi et al. took advantage of digital imaging and directly extracted RGB values from images and correlated them with the vanadium ion concentrations. The results were similar to those obtained by potentiometric titration [75].
- Acoustic analysis: The ultrasonic velocity in VRFBs can be well fitted by empirical models based on the temperature and the concentration of the positive electrolyte. Within an SOC range of 10% to 90%, data measured by ultrasonic sensors, after processing, show good agreement with experimental charge–discharge data, enabling accurate SOC estimation. However, due to the high sensitivity to the temperature, high-precision temperature sensors may be required for practical measurements [76]. Zang et al. estimated the SOC by measuring the acoustic attenuation coefficient of the VRFB electrolyte, with a maximum error of 4.8% [77].
- Amperometric method based on novel sensors: Based on electrochemical principles, when the electrode potential for the oxidation reaction is sufficiently high (or the reduction reaction potential is sufficiently low), the charge transfer reaction rate becomes extremely fast. At this point, the reactants arriving at the electrode surface are rapidly consumed, resulting in zero concentrations of reactants at the electrode surface, while the concentrations of reactants in the bulk solution remain unchanged. Under these conditions, the reaction rate is entirely controlled by the mass transfer rate of the reactants from the bulk solution to the electrode surface, and the current reaches a limiting value, no longer increasing with further enhancements in potential (manifested as a “plateau region” in the voltammetric curve). The mass transfer rate is proportional to the reactant concentration in the bulk solution. When the diffusion layer thickness and the diffusion coefficient are constant, a functional relationship between the SOC and limiting mass transfer current can be established for SOC estimation. Typically, a rotating disk electrode (RDE) is adopted to establish a stable diffusion layer. Nevertheless, due to its high cost, researchers have developed microelectrodes or electrodes with gas diffusion layers, which reduce the instrumentation expenses while maintaining the estimation accuracy [29,78,79].
- Electrolyte property-based estimation methods: These methods establish a relationship with the SOC of the VRFB system by measuring the physical properties of the electrolyte, such as the electrolyte density and electrolyte viscosity [80,81]. The advantage of measuring the viscosity is that the measurement sensor is relatively inexpensive and easy to integrate, but the measurement is highly temperature-dependent [65]. Since the measurement is susceptible to temperature influences, precise temperature correction is required. In contrast, electrolyte density-based measurement performs better, but the measurement module is expensive.
Since the internal state of the battery varies randomly during VRFB operation, the parameters of the battery model are subject to variations over time. Furthermore, due to the practical application of VRFB systems required for BMS systems, economic efficiency is also a factor that has to be considered. To accurately determine the SOC of a VRFB system in real time, more advanced and comprehensive technologies and approaches are needed. Currently, the mainstream methods for online SOC estimation include model-based approaches, such as filtering algorithms and machine learning. These methods continuously adjust the battery model parameters to estimate and update the SOC in real time, thus improving the accuracy of SOC estimation.
4.2. Parameter Identification in SOC Estimation Models
Before employing models for SOC estimation, it is often necessary to perform parameter identification based on the VRFB model. Currently, parameter identification methods are generally categorized into two types: offline identification and online identification. Offline parameter identification adopts measured experimental data to calculate parameters. It requires less computation but can only reflect the actual system operating conditions under specific circumstances and within a short period of time. Fundamental offline parameter identification methods include least squares estimation algorithms, particle swarm optimization algorithms, neural network algorithms, and genetic algorithms. Online parameter identification methods can perform parameter identification in real time during VRFB operation, modifying the model parameters and achieving higher estimation accuracy. However, this type of method is computationally intensive and expensive. Critical online parameter identification algorithms include recursive least squares algorithms, etc.
The most commonly used offline estimation algorithm is the offline parameter identification method based on the HPPC operating conditions or pulse current. It is commonly adopted for parameter identification in first-order or second-order RC models. The mechanism of action is to determine the hysteresis effect of the VRFB within a range of pulse current applications and obtain the function expression using the following Equations (32) and (33) through a function fitting tool, followed by calculating the model parameters [82]:
where we refer to Figure 4 to obtain the Id, UR, Up, and Up′ parameters. Figure 4 represents a complete pulse discharge cycle.
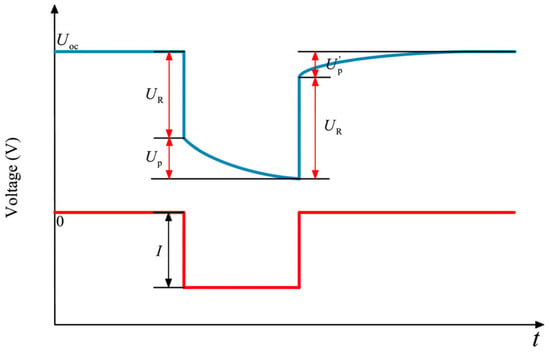
Figure 4.
Schematic diagram of offline parameter identification through HPPC operating conditions (reproduced with permission from [82]).
Metaheuristic algorithms are inspired by natural laws and seek optimal solutions within a specified range in a spontaneous, flexible, and efficient manner within a given time frame [83]. They have been widely applied in parameter identification for energy storage systems. Currently, methods such as particle swarm optimization (PSO) and genetic algorithms (GA) have been employed for parameter identification in VRFB systems. PSO is an evolutionary computation technique characterized by high computational efficiency, fast convergence speeds, and ease of implementation. It has been widely employed to optimize various mathematical problems [62,84]. Xiong et al. exploited the PSO algorithm for the parameter identification of VRFB EMs [85]. By adjusting particle positions based on feedback from position updates, the PSO algorithm is conducive to improving the optimization accuracy. The working mechanism of the GA is to generate multiple potential solutions, evaluating the feasibility of each and allowing crossover and mixing between solutions. The feasibility of the next generation of solutions is then assessed in a cyclic process until an optimal solution is found. Hence, this approach simulates natural evolution to seek the optimal solution [60,86,87]. Although the GA demands higher computational resources and shows slightly inferior performance in terms of computation time and voltage prediction accuracy compared to PSO, GA has the advantage of searching for the global optimum and avoiding falling into a local optimum [88]. The GA algorithm flowchart is shown in Figure 5 below.
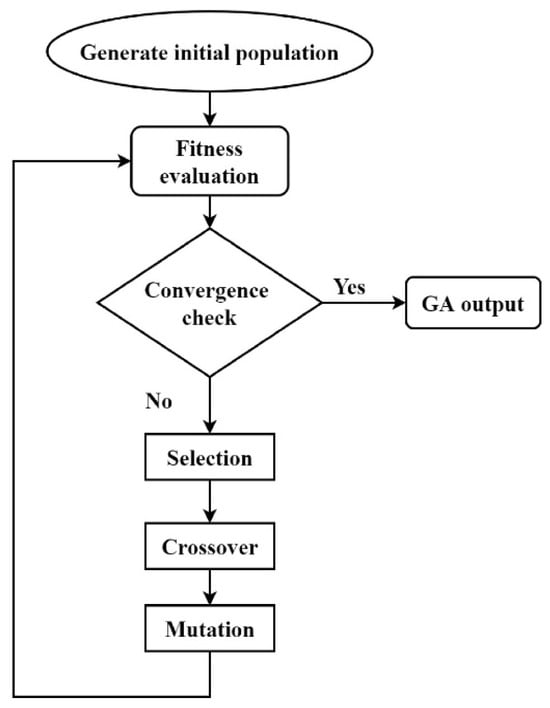
Figure 5.
GA flowchart (reproduced with permission from [60]).
Physics-constrained deep neural network (PCDNN) learning is a parameter identification algorithm that leverages strong physical constraint models to establish a connection between inputs and outputs [89,90]. It can be applied to electrochemical models that require multi-parameter identification. Due to the actual physical constraints, unlike conventional machine learning approaches, which only establish an unknown model to connect input and output data, it requires a large amount of diverse experimental data. The DNN enables the PCDNN to estimate parameters that are difficult to measure directly through some easily measurable data based on physical laws, significantly reducing the data requirements. It can be employed for EM parameter identification and in investigating the variation laws of VRFBs.
In actual VRFB operation, the model parameters are not always constant, and changes in the VRFB state result in variations in the parameter values of the models. To improve the accuracy of SOC estimation for VRFB systems, the model parameters need to be identified and corrected online. However, when using a Kalman filter for parameter identification, it is necessary to expand the dimensions of the system state [58]. The increase in dimensionality leads to more complex matrix calculations and a significantly higher computational load. In addition, due to the increase in dimensions, the system is prone to divergence during the identification process. Therefore, recursive least squares (RLS) and its improved algorithms are commonly applied for parameter identification in VRFBs. The RLS algorithm has a simple structure and clear principles, with fast convergence speeds. It corrects the current estimation outcomes based on previous estimates to minimize the output error. The flowchart of the RLS algorithm is shown in Figure 6.
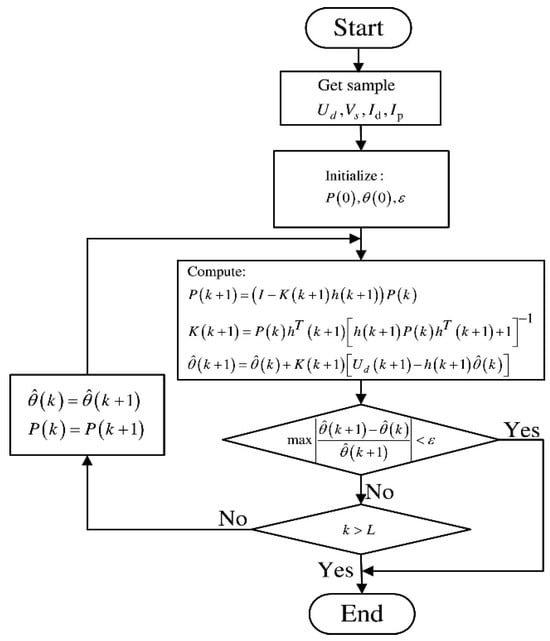
Figure 6.
RLS flowchart (reproduced with permission from [61]).
To some extent, it can resist external noise interference and ensure the estimation accuracy, exhibiting a certain degree of robustness [91]. Zheng et al. utilized the RLS algorithm for parameter identification in ECMs of VRFB systems [92], and Wei et al. further performed parameter identification with a first-order RC model using the RLS algorithm [57].
It has been reported that an algorithm containing improved forgetting factor recursive least squares (FFRLS) can be used to identify the parameters of the first-order RC ECM, and it was verified that its online parameter estimation had higher identification accuracy and better tracking performance for the entire simulation model [87,93,94].
4.3. SOC Estimation Algorithms
The Kalman filter algorithm is an estimation method that combines the predicted state from the previous time step with the current observation to estimate the current state, which can provide high-precision estimation results [95].
However, the standard Kalman filter is only suitable for linear systems. Since the VRFB is a typical nonlinear system, the Kalman filter cannot be directly applied for SOC estimation. This limitation has led researchers to propose the extended Kalman filter (EKF) algorithm to address the SOC estimation issues in VRFBs [96]. The EKF expands the state and observation equations by employing Taylor series and introduces the Jacobian matrix to transform nonlinear issues into linear ones. This method adopts the charge and discharge currents of the VRFB as the system inputs, the SOC as the internal system state, and the battery terminal voltage as the observed value [59]. The EKF continuously corrects the error between the estimated voltage and the actual observed value to achieve accurate SOC estimation. The process is shown in Figure 7.
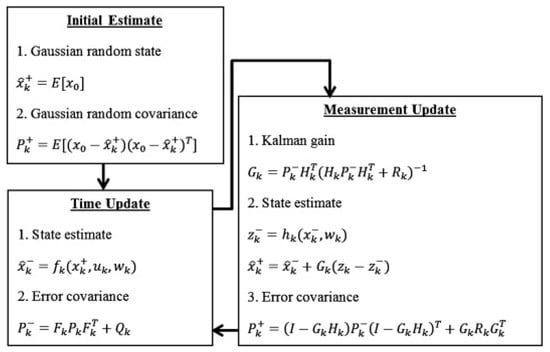
Figure 7.
Operation of EKF in estimating the optimal or quasi-optimal values of VRFB parameters (reproduced with permission from [58]).
While the EKF linearizes the Taylor series, there are also some problems:
- This method only takes the first-order terms of the Taylor series expansion and ignores the higher-order terms, which inevitably results in errors;
- The adopted noise vector and its covariance matrix remain unchanged, but the actual working noise does not necessarily follow a Gaussian distribution and will vary with the actual situation, so it cannot be fully adapted;
- The Jacobian matrix increases with the order of the estimated state, and the amount of calculation increases significantly, which results in significant demands for computing time and capabilities;
- If the initial SOC value is inaccurate and the state parameters differ greatly from the actual values, the EKF may fail to converge.
To address the aforementioned issues, researchers have further proposed novel improved Kalman filter algorithms. Specifically, to overcome errors caused by neglecting higher-order terms in the Taylor series expansion and the high computational cost of calculating higher-order Jacobian matrices, the unscented Kalman filter (UKF) algorithm has been introduced for the SOC estimation of VRFBs. The UKF is a specialized state estimation method designed for nonlinear systems within the Kalman filter framework [92]. This method avoids Taylor series expansion by using an unscented transform (UT) that approximates the posterior probability density of the state with a set of carefully chosen sample points. Sigma points and their weights are generated around the operating point, which are then propagated through the nonlinear function to obtain a transformed set of sigma points. These transformed points are used to predict the mean and covariance of the model, and this approach is well-suited for handling nonlinear system problems. Zhao et al. improved the UKF by introducing a forgetting factor, which links SOC estimation with historical data to enhance the estimation accuracy [91]. The RMSE can reach as low as 0.0002.
To address the issue whereby noise vectors may not accurately reflect real-world applications, the adaptive extended Kalman filter (AEKF) can adaptively update both the process noise covariance and the measurement noise covariance, thereby improving the estimation accuracy of the EKF. Zhao et al. used historical statistical data to create a sliding window to achieve the automatic updating of process noise covariance and measurement noise covariance [97]. Luo et al. combined the EKF with the Sage–Husa adaptive method, which is called the SA-EKF algorithm and can also be employed for SOC estimation [82].
To solve the problem of EKF divergence caused by excessive initial state errors or initial value errors, Qiu et al. proposed an improved extended Kalman filter (IEKF) [61]. By observing the error between the measured value and the estimated value, it is proposed to increase the weight value to adjust the trust level between the model measurement data and the current measurement data, so as to better reach the convergence value without exceeding the estimation boundary.
The particle filter (PF) is a filter based on Monte Carlo simulation that is suitable for nonlinear systems. Its main working mode is to discretize the system and generate a set of weighted random particles with corresponding weights to represent the posterior distribution of the system state [98]. In addition, it is common to combine multiple estimation methods to improve the overall performance of the algorithm and achieve complementary advantages. Zhao et al. proposed a data fusion (DF) method, with the process flow shown in Figure 8 [97]. By combining the SOC estimation results from the EKF and AEKF, the method obtains a final SOC. Compared to using either algorithm alone, this approach reduces the RMSE by 33% and 20%, respectively, improving the estimation accuracy but increasing the computational complexity.

Figure 8.
DF method for the estimation of the SOC for a VRFB (reproduced with permission from [97]).
While the improvement of the KF estimation accuracy cannot be achieved without noise covariance, in practical work, noise may not necessarily be normally distributed. Many estimation methods employing KFs do not consider the impact of noise caused by sensor drift on the accuracy of the estimation algorithm, which is not in line with reality. After running the algorithm for a period of time, comprehensive, highly nonlinear noise can be added to describe environmental noise, or small bias currents can be added to simulate sensor drift [63,99].
4.4. Data-Driven SOC Estimation Method
With the development of emerging technologies such as artificial intelligence and the advancements in computing power, some researchers have proposed data-driven SOC estimation methods. These methods generally do not require an in-depth understanding of the underlying mechanisms of VRFB systems. As long as there are sufficient and accurate experimental data, the algorithms can map inputs to outputs within their applicable ranges.
A neural network (NN) is a typical data-driven algorithm that has gained widespread popularity within data-driven methods. Inspired by the working mechanisms of the human brain, NNs consist of neurons organized into input layers, hidden layers, and output layers. They possess an underlying structure capable of adapting to training data. Through extensive training, NNs learn to map inputs to predicted outputs without relying on an explicit model, achieving strong prediction performance. Niu et al. proposed a backpropagation neural network (BPNN) to estimate the SOCs of VRFBs based on the nonlinear characteristics of the SOC [100]. The method optimizes the BPNN by using a Bayesian regulation algorithm. Experimental results demonstrate that the improved NN can enhance the real-time prediction accuracy for the SOC. Adopting a convolutional neural network (CNN), SOC estimation for VRFBs was performed by Li et al., considering the impact of variable flow rates [101]. Zheng et al. proposed a machine learning method using a recursive equalization network [99]. They adopted nonlinear direct parameterization technology, which greatly simplified the amount of NN training. The estimation accuracy and robustness were better than those of the BPNN and LSTM.
4.5. Other SOC Estimation Methods
In addition to filters, the most commonly used estimation method for more complex models is observer estimation. In general, the observer does not need to consider the disturbances in the system and allows uncertainty in the system parameters. It can be used to estimate the SOCs of VRFBs in real time online while considering the impact of capacity decay on the SOC. Xiong et al. developed an adaptive sliding mode observer (SMO) method for dynamic SOC estimation by incorporating a capacity fade factor into the adaptive SMO method [56]. The SMO has good robustness in battery state estimation and can handle the nonlinear relationship between the SOC and OCV well. Alejandro Clemente et al. adopted the SMO to estimate the SOCs of nonlinear electrochemical systems and minimize the impacts of noise and system errors [23,102]. Sliding mode controllers are well suited for nonlinear systems, exhibiting insensitivity to disturbances and model uncertainties and offering fast convergence. However, due to their implementation via discontinuous switching control to realize the sliding mode, they may cause high-frequency, small-amplitude oscillations around the sliding surface in practical systems during state estimation.
The high-gain observer (HGO) is an observer that estimates system parameters by designing high-gain parameters [7]. It is suitable for systems with position disturbances, nonlinearity, or model uncertainty. By amplifying the feedback gain of the output error, it suppresses the influence of disturbances on the estimation, achieving fast system tracking and rapid convergence. However, it is sensitive to noise, and excessive noise may cause system oscillations. When the initial error of the system is large or there is a sudden disturbance, a “peak phenomenon” may arise, which may potentially exceed the system’s safety threshold and compromise the stability of the system.
Compared with the Kalman filter, the H-infinity (Hꝏ) observer algorithm does not rely on a noise statistical matrix and is suitable for environments with unknown noise statistical characteristics [103,104]. It can allow uncertainty in model parameters and can minimize the impact of the worst-case disturbance on the estimate under system uncertainty, providing strong robustness as well. However, as the estimation is too conservative, its accuracy may be lower than that of the Kalman filter algorithm, and the computational complexity will increase. Extensive experience is needed to determine the performance index parameters to improve the accuracy of model and prevent system divergence.
The introduction to and summary of different SOC estimation methods for VRFBs are presented in Table 2, Table 3 and Table 4. As the advantages and disadvantages of different algorithms have already been provided in Table 2 and Table 3, the model-based state estimation method section in Table 4 serves as a supplement to Table 3. This section focuses on comparing the results of employing different estimation algorithms in the same literature by adopting common evaluation metrics such as the RMSE. It should be noted that each estimation method has its advantages and limitations, and no single method can perfectly meet all SOC estimation requirements. Model-based SOC estimation methods rely on equivalent models and parameter identification of the VRFB system, employing filtering algorithms or observers to estimate the SOC and achieving high accuracy and strong robustness. However, each method still has its own limitations. Data-driven SOC estimation methods, represented by NNs, do not require detailed analysis of the physical characteristics in the VRFB system and can obtain results through machine learning and data analysis. Nevertheless, this approach requires large amounts of accurate data for training and high computational power. Moreover, the estimation accuracy depends mainly on model precision, and, to simplify computation under different VRFB operating conditions, the focuses of the models may vary, making it difficult to comprehensively cover all VRFB operating scenarios. To overcome the existing issues and limitations, different algorithms can be rationally integrated to achieve more accurate SOC estimation for VRFBs. This could be one of the future directions for algorithm development.

Table 2.
Features and evaluations of different algorithms and observers for VRFB applications.

Table 3.
Summary of performance indicators and advantages/disadvantages of direct SOC estimation methods for VRFBs.

Table 4.
Summary of performance indicators of model-based SOC estimation methods for VRFBs.
5. Conclusions
This review systematically introduces the SOC estimation and modeling construction of VRFB systems. Benefiting from its long cycle life, intrinsic safety, flexibility, and scalability, the VRFB is one of the most promising energy storage systems for large-scale power storage applications. The accurate SOC estimation of VRFBs is a crucial support in ensuring their safe operation and long service life. This review describes the working principles and influencing factors of VRFBs and summarizes the EMs and ECMs adopted for SOC estimation. The ECM balances practicality and electrochemical reaction mechanisms, addressing VRFB-specific operational characteristics such as the pump losses, flow rate, temperature, and various other losses. Multiple ECMs are compared and summarized in this review.
Regarding SOC detection, this paper reviews the current sensor-based direct measurement methods, with a focus on model-based online SOC estimation. The accurate parameter identification of ECMs is a prerequisite for precise SOC estimation in VRFBs. Currently, the RLS and its enhanced version with a forgetting factor (FFRLS) are commonly used for online parameter identification, achieving good tracking performance. Data-driven SOC estimation methods are simpler but require large amounts of experimental data for model training, making them challenging for practical engineering applications at this stage.
Based on the current summary and discussion of the SOC estimation approaches for VRFBs, here, we briefly propose some possible research directions for the future:
- Based on the current research results of scholars, few have considered the robustness testing of the proposed algorithm in model-based SOC estimation. This is a significant gap, because model-based SOC estimation was originally developed for practical engineering applications, and robustness testing should not be ignored.
- Although the capacity of VRFBs remains relatively stable compared to other RFBs, it should still be considered as a major factor in SOC estimation in actual cycles. In fact, even if the initial electrolyte ratio is in an ideal state of equilibrium, as the battery operates, the electrolyte will gradually become imbalanced, which has a significant impact on SOC estimation. Although there are currently many electrochemical models for capacity degradation, most of them are still used in battery mechanism verification, and few have been applied to online SOC estimation. Accurate capacity estimation after multiple cycles should be a key focus of SOC precise estimation.
- The temperature is a key factor affecting the SOC estimation of VRFBs and should be considered to a greater extent in the model or estimation process. Currently, most studies focus on isothermal conditions, which are feasible when heat dissipation and generation are in equilibrium. However, in practical engineering applications, changes in temperature will affect the accuracy of SOC estimation. When identifying model parameters, the influence of the temperature should be considered, especially in offline identification, which is affected by the temperature to a greater degree. In engineering, if a temperature control system is used to maintain the system in its optimal working state, the losses of the temperature control system should also be included in the system losses.
- The flow rate is also a point that is easily overlooked. Usually, the flow rate is described as large enough, but pump losses should also be a part of the system. Previous articles have shown that a reasonable flow rate can improve system efficiency. However, considering the flow rate as a loss in the system will inevitably affect SOC estimation. The flow rate should also be taken into consideration in future work.
- There is a lack of unified standards to measure the quality of SOC estimation and a lack of direct comparison between different types of algorithms, and only a few articles mention accuracy evaluation based on the direct sensor measurement of the SOC. A summary article may be needed to apply different algorithms to the same dataset in order to intuitively present the advantages and disadvantages of the algorithms.
- Economy is also an important consideration for the commercialization of estimation methods for BMS systems, and future investigations should be carried out to provide a concise description of the costs.
Author Contributions
Conceptualization, R.F. and C.S.; methodology, R.F. and X.M.; software, R.F. and Z.G.; resources, X.M. and C.S.; writing—original draft preparation, R.F. and Z.G.; writing—review and editing, R.F., X.M. and C.S.; supervision, X.M. and C.S.; project administration, X.M. and C.S.; funding acquisition, C.S. All authors have read and agreed to the published version of the manuscript.
Funding
This research was funded by the National Natural Science Foundation of China (Grant No. 52407239).
Acknowledgments
The authors acknowledge the 2023 Youth Talent Introduction Scientific Research Startup Fee (Grant No. AUGA2160100623) and the 2023 Support Funds for Talent Introduction in Heilongjiang Province (Grant No. AUGA2160501723), provided by the Harbin Institute of Technology.
Conflicts of Interest
The authors declare no conflicts of interest.
Abbreviations
The following abbreviations are used in this manuscript:
| VRFB | All-vanadium redox flow battery |
| SOC | State of charge |
| ECM | Equivalent circuit model |
| RFB | Redox flow battery |
| BMS | Battery management system |
| OCV | Open-circuit voltage |
| PEM | Proton exchange membrane |
| EM | Electrochemical model |
| UV-Vis | Ultraviolet–visible |
| RDE | Rotating disk electrode |
| PSO | Particle swarm optimization |
| GA | Genetic algorithm |
| PCDNN | Physics-constrained deep neural network |
| RLS | Recursive least squares |
| FFRLS | Forgetting factor recursive least squares |
| EKF | Extended Kalman filter |
| UKF | Unscented Kalman filter |
| UT | Unscented transform |
| AEKF | Adaptive extended Kalman filter |
| IEKF | Improved extended Kalman filter |
| PF | Particle filter |
| DF | Data fusion |
| NN | Neural network |
| BPNN | Backpropagation neural network |
| CNN | Convolutional neural network |
| SMO | Sliding mode observer |
| HGO | High-gain observer |
| Hꝏ | H-infinity |
References
- Sun, C.; Negro, E.; Vezzù, K.; Pagot, G.; Cavinato, G.; Nale, A.; Herve Bang, Y.; Di Noto, V. Hybrid inorganic-organic proton-conducting membranes based on SPEEK doped with WO3 nanoparticles for application in vanadium redox flow batteries. Electrochim. Acta 2019, 309, 311–325. [Google Scholar] [CrossRef]
- Viswanathan, V.V.; Crawford, A.J.; Thomsen, E.C.; Shamim, N.; Li, G.; Huang, Q.; Reed, D.M. An Overview of the Design and Optimized Operation of Vanadium Redox Flow Batteries for Durations in the Range of 4–24 Hours. Batteries 2023, 9, 221. [Google Scholar] [CrossRef]
- Carrasco Ortega, P.; Durán Gómez, P.; Mérida Sánchez, J.C.; Echevarría Camarero, F.; Pardiñas, Á.Á. Battery Energy Storage Systems for the New Electricity Market Landscape: Modeling, State Diagnostics, Management, and Viability—A Review. Energies 2023, 16, 6334. [Google Scholar] [CrossRef]
- Zhang, H.; Ma, Y.; Yuan, K.; Khayatnezhad, M.; Ghadimi, N. Efficient design of energy microgrid management system: A promoted Remora optimization algorithm-based approach. Heliyon 2024, 10, e23394. [Google Scholar] [CrossRef] [PubMed]
- Eseye, A.T.; Zhang, J.; Zheng, D. Short-term photovoltaic solar power forecasting using a hybrid Wavelet-PSO-SVM model based on SCADA and Meteorological information. Renew. Energy 2018, 118, 357–367. [Google Scholar] [CrossRef]
- Shair, J.; Li, H.; Hu, J.; Xie, X. Power system stability issues, classifications and research prospects in the context of high-penetration of renewables and power electronics. Renew. Sustain. Energy Rev. 2021, 145, 111111. [Google Scholar] [CrossRef]
- Puleston, T.; Cecilia, A.; Costa-Castelló, R.; Serra, M. Vanadium redox flow batteries real-time State of Charge and State of Health estimation under electrolyte imbalance condition. J. Energy Storage 2023, 68, 107666. [Google Scholar] [CrossRef]
- Aščerić, A.; Čepin, M. Improving power distribution system reliability via optimized Microgrid integration and storage management. Reliab. Eng. Syst. Saf. 2025, 264, 111386. [Google Scholar] [CrossRef]
- Choudhury, S. Review of energy storage system technologies integration to microgrid: Types, control strategies, issues, and future prospects. J. Energy Storage 2022, 48, 103966. [Google Scholar] [CrossRef]
- Sun, C.; Negro, E.; Nale, A.; Pagot, G.; Vezzù, K.; Zawodzinski, T.A.; Meda, L.; Gambaro, C.; Di Noto, V. An efficient barrier toward vanadium crossover in redox flow batteries: The bilayer [Nafion/(WO3)x] hybrid inorganic-organic membrane. Electrochim. Acta 2021, 378, 138133. [Google Scholar] [CrossRef]
- Sabihuddin, S.; Kiprakis, A.E.; Mueller, M. A Numerical and Graphical Review of Energy Storage Technologies. Energies 2015, 8, 172–216. [Google Scholar] [CrossRef]
- Zhang, Z.; Ding, T.; Zhou, Q.; Sun, Y.; Qu, M.; Zeng, Z.; Ju, Y.; Li, L.; Wang, K.; Chi, F. A review of technologies and applications on versatile energy storage systems. Renew. Sustain. Energy Rev. 2021, 148, 111263. [Google Scholar] [CrossRef]
- Lucas, A.; Chondrogiannis, S. Smart grid energy storage controller for frequency regulation and peak shaving, using a vanadium redox flow battery. Int. J. Electr. Power Energy Syst. 2016, 80, 26–36. [Google Scholar] [CrossRef]
- Huang, Z.; Liu, Y.; Xie, X.; Huang, Q.; Huang, C. Experimental study on efficiency improvement methods of vanadium redox flow battery for large-scale energy storage. Electrochim. Acta 2023, 466, 143025. [Google Scholar] [CrossRef]
- Zhang, H.; Sun, C.; Ge, M. Review of the Research Status of Cost-Effective Zinc–Iron Redox Flow Batteries. Batteries 2022, 8, 202. [Google Scholar] [CrossRef]
- Huan, Z.; Sun, C.; Ge, M. Progress in Profitable Fe-Based Flow Batteries for Broad-Scale Energy Storage. Available online: https://wires.onlinelibrary.wiley.com/doi/abs/10.1002/wene.541 (accessed on 20 February 2025).
- Souentie, S.; Amr, I.; Alsuhaibani, A.; Almazroei, E.; Hammad, A.D. Temperature, charging current and state of charge effects on iron-vanadium flow batteries operation. Appl. Energy 2017, 206, 568–576. [Google Scholar] [CrossRef]
- da Silva Lima, L.; Quartier, M.; Buchmayr, A.; Sanjuan-Delmás, D.; Laget, H.; Corbisier, D.; Mertens, J.; Dewulf, J. Life cycle assessment of lithium-ion batteries and vanadium redox flow batteries-based renewable energy storage systems. Sustain. Energy Technol. Assess. 2021, 46, 101286. [Google Scholar] [CrossRef]
- Kebede, A.A.; Kalogiannis, T.; Van Mierlo, J.; Berecibar, M. A comprehensive review of stationary energy storage devices for large scale renewable energy sources grid integration. Renew. Sustain. Energy Rev. 2022, 159, 112213. [Google Scholar] [CrossRef]
- Skyllas-Kazacos, M.; Cao, L.; Kazacos, M.; Kausar, N.; Mousa, A. Vanadium Electrolyte Studies for the Vanadium Redox Battery—A Review. ChemSusChem 2016, 9, 1521–1543. [Google Scholar] [CrossRef]
- Wang, H.; Pourmousavi, S.A.; Soong, W.L.; Zhang, X.; Nikoloski, A.N.; Ertugrul, N. A comprehensive and practical framework for advanced battery management system of vanadium redox flow batteries. J. Energy Storage 2025, 123, 116560. [Google Scholar] [CrossRef]
- Kleinsteinberg, B.; Klick, S.; Sauer, D.U. Empirical approach to determine open-circuit voltage of a vanadium-redox-flow battery for models, based on published data for anion-exchange and cation-exchange membranes and temperature dependency. J. Energy Storage 2020, 28, 101109. [Google Scholar] [CrossRef]
- Clemente, A.; Montiel, M.; Barreras, F.; Lozano, A.; Costa-Castelló, R. Vanadium Redox Flow Battery State of Charge Estimation Using a Concentration Model and a Sliding Mode Observer. IEEE Access 2021, 9, 72368–72376. [Google Scholar] [CrossRef]
- Sun, C.-Y.; Zhang, H. Investigation of Nafion series membranes on the performance of iron-chromium redox flow battery. Int. J. Energy Res. 2019, 43, 8739–8752. [Google Scholar] [CrossRef]
- Zhang, Y.; Liu, L.; Xi, J.; Wu, Z.; Qiu, X. The benefits and limitations of electrolyte mixing in vanadium flow batteries. Appl. Energy 2017, 204, 373–381. [Google Scholar] [CrossRef]
- Rodby, K.E.; Carney, T.J.; Ashraf Gandomi, Y.; Barton, J.L.; Darling, R.M.; Brushett, F.R. Assessing the levelized cost of vanadium redox flow batteries with capacity fade and rebalancing. J. Power Sources 2020, 460, 227958. [Google Scholar] [CrossRef]
- Huang, Z.; Mu, A. Research and analysis of performance improvement of vanadium redox flow battery in microgrid: A technology review. Int. J. Energy Res. 2021, 45, 14170–14193. [Google Scholar] [CrossRef]
- Turker, B.; Arroyo Klein, S.; Hammer, E.-M.; Lenz, B.; Komsiyska, L. Modeling a vanadium redox flow battery system for large scale applications. Energy Convers. Manag. 2013, 66, 26–32. [Google Scholar] [CrossRef]
- Stolze, C.; Meurer, J.P.; Hager, M.D.; Schubert, U.S. An Amperometric, Temperature-Independent, and Calibration-Free Method for the Real-Time State-of-Charge Monitoring of Redox Flow Battery Electrolytes. Chem. Mater. 2019, 31, 5363–5369. [Google Scholar] [CrossRef]
- Lei, J.; Gong, Q. Operating strategy and optimal allocation of large-scale VRB energy storage system in active distribution networks for solar/wind power applications. IET Gener. Transm. Distrib. 2017, 11, 2403–2411. [Google Scholar] [CrossRef]
- Trovò, A. Battery management system for industrial-scale vanadium redox flow batteries: Features and operation. J. Power Sources 2020, 465, 228229. [Google Scholar] [CrossRef]
- Cunha, Á.; Martins, J.; Rodrigues, N.; Brito, F.P. Vanadium redox flow batteries: A technology review. Int. J. Energy Res. 2015, 39, 889–918. [Google Scholar] [CrossRef]
- Chen, S.; Sun, C.; Zhang, H.; Yu, H.; Wang, W. Electrochemical Deposition of Bismuth on Graphite Felt Electrodes: Influence on Negative Half-Cell Reactions in Vanadium Redox Flow Batteries. Appl. Sci. 2024, 14, 3316. [Google Scholar] [CrossRef]
- Ghimire, P.C.; Bhattarai, A.; Lim, T.M.; Wai, N.; Skyllas-Kazacos, M.; Yan, Q. In-Situ Tools Used in Vanadium Redox Flow Battery Research—Review. Batteries 2021, 7, 53. [Google Scholar] [CrossRef]
- Sun, C.; Vezzù, K.; Pagot, G.; Nale, A.; Bang, Y.H.; Pace, G.; Negro, E.; Gambaro, C.; Meda, L.; Zawodzinski, T.A.; et al. Elucidation of the interplay between vanadium species and charge-discharge processes in VRFBs by Raman spectroscopy. Electrochim. Acta 2019, 318, 913–921. [Google Scholar] [CrossRef]
- Oh, K.; Won, S.; Ju, H. A comparative study of species migration and diffusion mechanisms in all-vanadium redox flow batteries. Electrochim. Acta 2015, 181, 238–247. [Google Scholar] [CrossRef]
- Choi, C.; Kim, S.; Kim, R.; Choi, Y.; Kim, S.; Jung, H.-y.; Yang, J.H.; Kim, H.-T. A review of vanadium electrolytes for vanadium redox flow batteries. Renew. Sustain. Energy Rev. 2017, 69, 263–274. [Google Scholar] [CrossRef]
- Sun, C.; Chen, J.; Zhang, H.; Han, X.; Luo, Q. Investigations on transfer of water and vanadium ions across Nafion membrane in an operating vanadium redox flow battery. J. Power Sources 2010, 195, 890–897. [Google Scholar] [CrossRef]
- Oh, K.; Moazzam, M.; Gwak, G.; Ju, H. Water crossover phenomena in all-vanadium redox flow batteries. Electrochim. Acta 2019, 297, 101–111. [Google Scholar] [CrossRef]
- Luo, Q.; Zhang, H.; Chen, J.; Qian, P.; Zhai, Y. Modification of Nafion membrane using interfacial polymerization for vanadium redox flow battery applications. J. Membr. Sci. 2008, 311, 98–103. [Google Scholar] [CrossRef]
- Pichugov, R.; Loktionov, P.; Verakso, D.; Pustovalova, A.; Chikin, D.; Antipov, A. Sensitivity of Capacity Fade in Vanadium Redox Flow Battery to Electrolyte Impurity Content. ChemPlusChem 2024, 89, e202400372. [Google Scholar] [CrossRef]
- Loktionov, P.; Pustovalova, A.; Pichugov, R.; Konev, D.; Antipov, A. Quantifying effect of faradaic imbalance and crossover on capacity fade of vanadium redox flow battery. Electrochim. Acta 2024, 485, 144047. [Google Scholar] [CrossRef]
- Qian, X.; Jung, H.-Y.; Jung, S. A comprehensive study of parasitic gas evolution reactions in a vanadium redox flow battery. J. Clean. Prod. 2023, 428, 139468. [Google Scholar] [CrossRef]
- Oreiro, S.N.; Jacquemond, R.R.; Boz, E.B.; Forner-Cuenca, A.; Bentien, A. Investigation of the positive electrode and bipolar plate degradation in vanadium redox flow batteries. J. Energy Storage 2025, 132, 117689. [Google Scholar] [CrossRef]
- Liu, H.; Xu, Q.; Yan, C. On-line mass spectrometry study of electrochemical corrosion of the graphite electrode for vanadium redox flow battery. Electrochem. Commun. 2013, 28, 58–62. [Google Scholar] [CrossRef]
- Al-Fetlawi, H.; Shah, A.A.; Walsh, F.C. Modelling the effects of oxygen evolution in the all-vanadium redox flow battery. Electrochim. Acta 2010, 55, 3192–3205. [Google Scholar] [CrossRef]
- Li, L.; Kim, S.; Wang, W.; Vijayakumar, M.; Nie, Z.; Chen, B.; Zhang, J.; Xia, G.; Hu, J.; Graff, G.; et al. A Stable Vanadium Redox-Flow Battery with High Energy Density for Large-Scale Energy Storage. Adv. Energy Mater. 2011, 1, 394–400. [Google Scholar] [CrossRef]
- Du, J.; Lin, H.; Zhang, L.; Liu, S.; Wang, L. Novel electrolyte design for high-efficiency vanadium redox flow batteries with enhanced 3.0 M V3+ stability at low temperatures. Chem. Eng. J. 2025, 516, 164293. [Google Scholar] [CrossRef]
- Hu, C.; Dong, Y.; Zhang, W.; Zhang, H.; Zhou, P.; Xu, H. Effect of sodium phosphate on stability and electrochemical performance of the positive electrolyte for a vanadium redox flow battery at 50 °C. Electrochim. Acta 2023, 462, 142762. [Google Scholar] [CrossRef]
- Kim, D.K.; Yoon, S.J.; Lee, J.; Kim, S. Parametric study and flow rate optimization of all-vanadium redox flow batteries. Appl. Energy 2018, 228, 891–901. [Google Scholar] [CrossRef]
- Briot, L.; Petit, M.; Cacciuttolo, Q.; Pera, M.-C. Aging phenomena and their modelling in aqueous organic redox flow batteries: A review. J. Power Sources 2022, 536, 231427. [Google Scholar] [CrossRef]
- Puleston, T.; Clemente, A.; Costa-Castelló, R.; Serra, M. Modelling and Estimation of Vanadium Redox Flow Batteries: A Review. Batteries 2022, 8, 121. [Google Scholar] [CrossRef]
- Clemente, A.; Montiel, M.; Barreras, F.; Lozano, A.; Costa-Castelló, R. Experimental validation of a vanadium redox flow battery model for state of charge and state of health estimation. Electrochim. Acta 2023, 449, 142117. [Google Scholar] [CrossRef]
- Xiong, B.; Zhao, J.; Wei, Z.; Skyllas-Kazacos, M. Extended Kalman filter method for state of charge estimation of vanadium redox flow battery using thermal-dependent electrical model. J. Power Sources 2014, 262, 50–61. [Google Scholar] [CrossRef]
- Zhang, Y.; Zhao, J.; Wang, P.; Skyllas-Kazacos, M.; Xiong, B.; Badrinarayanan, R. A comprehensive equivalent circuit model of all-vanadium redox flow battery for power system analysis. J. Power Sources 2015, 290, 14–24. [Google Scholar] [CrossRef]
- Xiong, B.; Zhao, J.; Su, Y.; Wei, Z.; Skyllas-Kazacos, M. State of Charge Estimation of Vanadium Redox Flow Battery Based on Sliding Mode Observer and Dynamic Model Including Capacity Fading Factor. IEEE Trans. Sustain. Energy 2017, 8, 1658–1667. [Google Scholar] [CrossRef]
- Wei, Z.; Lim, T.M.; Skyllas-Kazacos, M.; Wai, N.; Tseng, K.J. Online state of charge and model parameter co-estimation based on a novel multi-timescale estimator for vanadium redox flow battery. Appl. Energy 2016, 172, 169–179. [Google Scholar] [CrossRef]
- Mohamed, M.R.; Ahmad, H.; Seman, M.N.A.; Razali, S.; Najib, M.S. Electrical circuit model of a vanadium redox flow battery using extended Kalman filter. J. Power Sources 2013, 239, 284–293. [Google Scholar] [CrossRef]
- Wei, Z.; Bhattarai, A.; Zou, C.; Meng, S.; Lim, T.M.; Skyllas-Kazacos, M. Real-time monitoring of capacity loss for vanadium redox flow battery. J. Power Sources 2018, 390, 261–269. [Google Scholar] [CrossRef]
- Das, J.; Nath, K.; Dasgupta, R. Design and validation of a nonlinear electrical equivalent circuit model of vanadium redox flow battery considering variable flow rate. J. Energy Storage 2025, 116, 116006. [Google Scholar] [CrossRef]
- Qiu, Y.; Li, X.; Chen, W.; Duan, Z.-m.; Yu, L. State of charge estimation of vanadium redox battery based on improved extended Kalman filter. ISA Trans. 2019, 94, 326–337. [Google Scholar] [CrossRef]
- Xiong, B.; Yang, Y.; Tang, J.; Li, Y.; Wei, Z.; Su, Y.; Zhang, Q. An Enhanced Equivalent Circuit Model of Vanadium Redox Flow Battery Energy Storage Systems Considering Thermal Effects. IEEE Access 2019, 7, 162297–162308. [Google Scholar] [CrossRef]
- Saeed, M.; Khalatbarisoltani, A.; Deng, Z.; Liu, W.; Altaf, F.; Lu, S.; Hu, X. Comparative Analysis of Control Observer-Based Methods for State Estimation of Lithium-Ion Batteries in Practical Scenarios. IEEE/ASME Trans. Mechatron. 2024, 1–13. [Google Scholar] [CrossRef]
- Gonzalez, G.; Peljo, P. Experimental Set-Up for Measurement of Half-Cell- and Over-Potentials of Flow Batteries During Operation. Batter. Supercaps 2025, 8, e202400394. [Google Scholar] [CrossRef]
- Janshen, N.; Ressel, S.; Chica, A.; Struckmann, T. A correlated multi-observable assessment for vanadium redox flow battery state of charge estimation—Empirical correlations and temperature dependencies. Electrochim. Acta 2024, 490, 144239. [Google Scholar] [CrossRef]
- Puleston, T.; Cecilia, A.; Costa-Castelló, R.; Serra, M. Nonlinear observer for online concentration estimation in vanadium flow batteries based on half-cell voltage measurements. Comput. Chem. Eng. 2024, 185, 108664. [Google Scholar] [CrossRef]
- Liu, L.; Xi, J.; Wu, Z.; Zhang, W.; Zhou, H.; Li, W.; He, Y. Online Spectroscopic Study on the Positive and the Negative Electrolytes in Vanadium Redox Flow Batteries. J. Spectrosc. 2013, 2013, 453980. [Google Scholar] [CrossRef]
- Skyllas-Kazacos, M.; Kazacos, M. State of charge monitoring methods for vanadium redox flow battery control. J. Power Sources 2011, 196, 8822–8827. [Google Scholar] [CrossRef]
- Shin, K.-H.; Jin, C.-S.; So, J.-Y.; Park, S.-K.; Kim, D.-H.; Yeon, S.-H. Real-time monitoring of the state of charge (SOC) in vanadium redox-flow batteries using UV–Vis spectroscopy in operando mode. J. Energy Storage 2020, 27, 101066. [Google Scholar] [CrossRef]
- Nolte, O.; Geitner, R.; Hager, M.D.; Schubert, U.S. IR Spectroscopy as a Method for Online Electrolyte State Assessment in RFBs. Adv. Energy Mater. 2021, 11, 2100931. [Google Scholar] [CrossRef]
- Rudolph, S.; Schröder, U.; Bayanov, I.M.; Blenke, K.; Hage, D. High resolution state of charge monitoring of vanadium electrolytes with IR optical sensor. J. Electroanal. Chem. 2013, 694, 17–22. [Google Scholar] [CrossRef]
- Liu, L.; Li, Z.; Xi, J.; Zhou, H.; Wu, Z.; Qiu, X. Rapid detection of the positive side reactions in vanadium flow batteries. Appl. Energy 2017, 185, 452–462. [Google Scholar] [CrossRef]
- Heiß, J.; Kohns, M. Open circuit voltage of an all-vanadium redox flow battery as a function of the state of charge obtained from UV-Vis spectroscopy. Energy Adv. 2024, 3, 2597–2603. [Google Scholar] [CrossRef]
- Schofield, K.; Musilek, P. State of Charge and Capacity Tracking in Vanadium Redox Flow Battery Systems. Clean Technologies 2022, 4, 607–618. [Google Scholar] [CrossRef]
- Wi, J.; Jon, S.; Pae, G.; Kim, Y.; Jon, S. Analysis of vanadium species(V(IV)/V(III)) in the electrolyte manufacturing process for vanadium redox flow battery using digital image. J. Electroanal. Chem. 2023, 949, 117766. [Google Scholar] [CrossRef]
- Chou, Y.-S.; Hsu, N.-Y.; Jeng, K.-T.; Chen, K.-H.; Yen, S.-C. A novel ultrasonic velocity sensing approach to monitoring state of charge of vanadium redox flow battery. Appl. Energy 2016, 182, 253–259. [Google Scholar] [CrossRef]
- Zang, X.; Yan, L.; Yang, Y.; Pan, H.; Nie, Z.; Jung, K.W.; Deng, Z.D.; Wang, W. Monitoring the State-of-Charge of a Vanadium Redox Flow Battery with the Acoustic Attenuation Coefficient: An In Operando Noninvasive Method. Small Methods 2019, 3, 1900494. [Google Scholar] [CrossRef]
- Kroner, I.; Becker, M.; Turek, T. Monitoring the State of Charge of the Positive Electrolyte in a Vanadium Redox-Flow Battery with a Novel Amperometric Sensor. Batteries 2019, 5, 5. [Google Scholar] [CrossRef]
- Stolze, C.; Rohland, P.; Zub, K.; Nolte, O.; Hager, M.D.; Schubert, U.S. A low-cost amperometric sensor for the combined state-of-charge, capacity, and state-of-health monitoring of redox flow battery electrolytes. Energy Convers. Manag. X 2022, 14, 100188. [Google Scholar] [CrossRef]
- Ressel, S.; Bill, F.; Holtz, L.; Janshen, N.; Chica, A.; Flower, T.; Weidlich, C.; Struckmann, T. State of charge monitoring of vanadium redox flow batteries using half cell potentials and electrolyte density. J. Power Sources 2018, 378, 776–783. [Google Scholar] [CrossRef]
- Li, X.; Xiong, J.; Tang, A.; Qin, Y.; Liu, J.; Yan, C. Investigation of the use of electrolyte viscosity for online state-of-charge monitoring design in vanadium redox flow battery. Appl. Energy 2018, 211, 1050–1059. [Google Scholar] [CrossRef]
- Zixuan, L.; Dawei, Q.; Luyan, F.; Shuo, Y. State of charge estimation for the vanadium redox flow battery based on the Sage–Husa adaptive extended Kalman filter. Int. J. Circuit Theory Appl. 2024, 52, 380–395. [Google Scholar] [CrossRef]
- Khaki, B.; Das, P. Parameter identification of thermal model of vanadium redox batteries by metaheuristic algorithms. Electrochim. Acta 2021, 394, 139131. [Google Scholar] [CrossRef]
- Clemente, A.; Cecilia, A.; Costa-Castelló, R. Online state of charge estimation for a vanadium redox flow battery with unequal flow rates. J. Energy Storage 2023, 60, 106503. [Google Scholar] [CrossRef]
- Xiong, B.; Wang, Z.; Li, Y.; Qin, K.; Chen, J.; Mu, J. An Optimal Operational Strategy for Vanadium Redox Flow Battery Based on Particle Swarm Optimization. In Proceedings of the 2019 IEEE Innovative Smart Grid Technologies—Asia (ISGT Asia), Chengdu, China, 21–24 May 2019; pp. 2639–2643. [Google Scholar]
- Jia, W.; Yang, Y.; Liu, Z.; Chang, Y.; Li, J. Electrical Modeling of Vanadium Redox Flow Battery Based on Genetic Algorithm. In Proceedings of the 2020 Asia Energy and Electrical Engineering Symposium (AEEES), Chengdu, China, 29–31 May 2020; pp. 727–731. [Google Scholar]
- Wei, Z.; Xiong, R.; Lim, T.M.; Meng, S.; Skyllas-Kazacos, M. Online monitoring of state of charge and capacity loss for vanadium redox flow battery based on autoregressive exogenous modeling. J. Power Sources 2018, 402, 252–262. [Google Scholar] [CrossRef]
- Khaki, B.; Kulkarni, C.; Das, P. Parameter identification of electrochemical model of vanadium redox battery by metaheuristic algorithms. Energy Storage 2023, 5, e409. [Google Scholar] [CrossRef]
- He, Q.; Stinis, P.; Tartakovsky, A.M. Physics-constrained deep neural network method for estimating parameters in a redox flow battery. J. Power Sources 2022, 528, 231147. [Google Scholar] [CrossRef]
- Bao, J.; Murugesan, V.; Kamp, C.J.; Shao, Y.; Yan, L.; Wang, W. Machine Learning Coupled Multi-Scale Modeling for Redox Flow Batteries. Adv. Theory Simul. 2020, 3, 1900167. [Google Scholar] [CrossRef]
- Zhao, X.; Nam, J.; Jung, H.-Y.; Jung, S. Real-time state of charge and capacity estimations of vanadium redox flow battery based on unscented Kalman filter with a forgetting factor. J. Energy Storage 2023, 74, 109146. [Google Scholar] [CrossRef]
- Zheng, C.; Tian, X.; Nie, G.; Yu, Y.; Li, Y.; Dong, S.; Tang, J.; Xiong, B. State of Power and State of Charge Estimation of Vanadium Redox Flow Battery Based on An Online Equivalent Circuit Model. In Proceedings of the 2020 IEEE 18th International Conference on Industrial Informatics (INDIN), Warwick, UK, 20–23 July 2020; pp. 633–638. [Google Scholar]
- Fornaro, P.; Puleston, T.; Puleston, P.; Serra-Prat, M.; Costa-Castelló, R.; Battaiotto, P. Redox flow battery time-varying parameter estimation based on high-order sliding mode differentiators. Int. J. Energy Res. 2022, 46, 16576–16592. [Google Scholar] [CrossRef]
- Dong, S.; Feng, J.; Zhang, Y.; Tong, S.; Tang, J.; Xiong, B. State of Charge Estimation of Vanadium Redox Flow Battery Based on Online Equivalent Circuit Model. In Proceedings of the 2021 31st Australasian Universities Power Engineering Conference (AUPEC), Perth, Australia, 26–30 September 2021; pp. 1–6. [Google Scholar]
- Vudata, S.P.; Bhattacharyya, D. Transient Modeling of a Vanadium Redox Flow Battery and Real-Time Monitoring of Its Capacity and State of Charge. Ind. Eng. Chem. Res. 2022, 61, 17557–17571. [Google Scholar] [CrossRef]
- Wei, Z.; Tseng, K.J.; Wai, N.; Lim, T.M.; Skyllas-Kazacos, M. Adaptive estimation of state of charge and capacity with online identified battery model for vanadium redox flow battery. J. Power Sources 2016, 332, 389–398. [Google Scholar] [CrossRef]
- Zhao, X.; Kim, K.; Jung, S. State-of-charge estimation using data fusion for vanadium redox flow battery. J. Energy Storage 2022, 52, 104852. [Google Scholar] [CrossRef]
- Khaki, B.; Das, P. An equivalent circuit model for Vanadium Redox Batteries via hybrid extended Kalman filter and Particle filter methods. J. Energy Storage 2021, 39, 102587. [Google Scholar] [CrossRef]
- Zheng, C.; Feng, W.; Wei, Z.; Li, Y.; Iu, H.H.C.; Fernando, T.; Zhang, X. A robust machine learning-based SOC estimation approach for vanadium redox flow battery. J. Power Sources 2025, 645, 237087. [Google Scholar] [CrossRef]
- Niu, H.; Huang, J.; Wang, C.; Zhao, X.; Zhang, Z.; Wang, W. State of Charge Prediction Study of Vanadium Redox-Flow Battery with BP Neural Network. In Proceedings of the 2020 IEEE International Conference on Artificial Intelligence and Computer Applications (ICAICA), Dalian, China, 27–29 June 2020; pp. 1289–1293. [Google Scholar]
- Li, R.; Xiong, B.; Zhang, S.; Zhang, X.; Li, Y.; Iu, H.; Fernando, T. A novel one dimensional convolutional neural network based data-driven vanadium redox flow battery modelling algorithm. J. Energy Storage 2023, 61, 106767. [Google Scholar] [CrossRef]
- Clemente, A.; Montiel, M.; Barreras, F.; Lozano, A.; Escachx, B.; Costa-Castelló, R. Online estimation of the state of charge and state of health of a vanadium redox flow battery. J. Power Sources 2024, 598, 234181. [Google Scholar] [CrossRef]
- Cecilia, A.; Serra, M.; Costa-Castelló, R. Nonlinear adaptive observation of the liquid water saturation in polymer electrolyte membrane fuel cells. J. Power Sources 2021, 492, 229641. [Google Scholar] [CrossRef]
- Meng, S.; Xiong, B.; Lim, T.M. Model-Based Condition Monitoring of a Vanadium Redox Flow Battery. Energies 2019, 12, 3005. [Google Scholar] [CrossRef]
Disclaimer/Publisher’s Note: The statements, opinions and data contained in all publications are solely those of the individual author(s) and contributor(s) and not of MDPI and/or the editor(s). MDPI and/or the editor(s) disclaim responsibility for any injury to people or property resulting from any ideas, methods, instructions or products referred to in the content. |
© 2025 by the authors. Licensee MDPI, Basel, Switzerland. This article is an open access article distributed under the terms and conditions of the Creative Commons Attribution (CC BY) license (https://creativecommons.org/licenses/by/4.0/).
