Article

Numerical Study of Self-Heating Maintenance Performance of an Integrated Regenerative Catalytic Reactor

by
Fangdong Zhu
,
Mingming Mao
*,
Youtang Wang
and
Qiang Chen
School of Transportation and Vehicle Engineering, Shandong University of Technology, Zibo 255000, China
*
Author to whom correspondence should be addressed.
Energies 2025, 18(17), 4654; https://doi.org/10.3390/en18174654
Submission received: 29 July 2025 / Revised: 29 August 2025 / Accepted: 30 August 2025 / Published: 2 September 2025

Abstract

Efficient utilization of low-calorific-value gases reduces emissions but remains challenging. Self-heat-maintained combustion uses fuel’s exothermic heat to sustain stability without external heat, yet the feed gas typically requires preheating (typically 573–673 K). This study innovatively proposes a compact regenerative catalytic reactor featuring an integrated helical heat-recovery structure and replaces empirical preheating with a user-defined function (UDF) programmed heat transfer efficiency model. This dual innovation enables self-sustained combustion at 0.16 vol.% methane, the lowest reported concentration for autonomous operation. Numerical results confirm stable operation under ultra-lean conditions, with significantly reduced preheating energy demand and accelerated thermal response. Transient analysis shows lower space velocities enable self-maintained combustion across a broader range of methane concentrations. However, higher methane concentrations require higher inlet temperatures for self-heat maintenance. This study provides significant insights for recovering energy from low-calorific-value gases and alleviating global energy pressures.

1. Introduction

Energy and environmental protection have become global focal points. With the rapid development of modern society, energy challenges have emerged as a critical concern. The world is rich in low-calorific-value gas energy resources, yet most remain underutilized, resulting in significant energy waste. Coal mine ventilation air methane (VAM), a clean energy source and potent greenhouse gas, typically contains methane at volume concentrations of 0.1–1.0% [1,2,3]. Notably, methane emissions from coal mining processes account for 8% of total global anthropogenic methane emissions, representing both environmental harm and energy inefficiency [4,5,6]. However, conventional combustion technologies require high temperatures for methane oxidation, making them unsuitable for low-concentration applications, while also generating toxic nitrogen oxides (NOx) [7,8,9].
Catalytic combustion technology enables low-concentration methane oxidation at reduced temperatures while minimizing pollutant formation [10,11,12,13,14,15,16]. Compared with traditional catalysts, monolithic catalysts offer advantages including low pressure drop, high tolerance for space velocity, thin catalytic layers on porous substrates, and superior thermal conductivity [17,18,19,20,21,22,23]. Shen et al. [17] developed a nickel-based SiC catalyst via freeze gelation and wet impregnation techniques for steam methane reforming (SMR). The structured catalyst exhibited enhanced thermal and mass transfer properties due to the high thermal conductivity and chemical inertness of SiC, effectively suppressing coke formation during reactions. Under industrially relevant conditions, the catalyst demonstrated superior stability and activity, advancing the practical application of SMR technology for hydrogen production. Pandit et al. [18] employed a multi-scale reduced order model accounting for pore diffusion to optimize monolith reactor design for autothermal oxidative dehydrogenation of ethane over MoVTeNbOX catalyst. Results indicated that metallic monoliths with intermediate length, high conductivity, and a small hydraulic radius approach the homogeneous lumped thermal reactor (LTR) limit, enhancing performance. Zhang et al. [19] numerically investigated CO2 methanation in fixed-bed reactors using porous pellet and monolith catalysts, revealing the monolith’s superior carbon conversion per unit pressure drop despite lower absolute conversion. An improved “CHESS” monolith structure was proposed, balancing high conversion (62.6%) with enhanced heat transfer and a peak temperature reduced by 11.09%. Sarkar et al. [20] used a phase-averaged multi-mode, multi-scale model to study ignition and extinction dynamics in monolith reactors for catalytic lean hydrogen combustion. Bifurcation analysis classified the behavior types and revealed the impacts of channel geometry, catalyst properties, heat loss, and reactor design parameters, guiding optimal reactor configuration. Sandu et al. [21] assessed CO2 capture efficiency in packed-bed and 3D-printed monolith reactors for SEWGS using CFD modeling and experimental validation. The monolith reactor showed significantly enhanced mass transfer rates and lower pressure drops, demonstrating its potential to improve carbon capture technology.
Heat-recirculation reactors enable efficient heat recovery to achieve superadiabatic combustion. By integrating catalytic combustion technology with heat-recirculation reactors, complete combustion can be achieved at lower preheating temperatures for gas mixtures [24,25,26,27,28]. Chen et al. [24] numerically studied the effect of heat recirculation on methane–air combustion stability in catalytic micro-combustors. They found that heat recirculation significantly enhanced blowout stability (especially with highly insulating walls) but minimally affected extinction. Cai et al. [25] designed and optimized four methanol steam reforming reactors for marine engine waste heat recovery. Using field synergy analysis, they determined the R(S, 1) reactor exhibited superior thermal synergy, evaporation performance, and steam uniformity. At 75% load, optimal performance occurred at S/C ratios of 1.2–1.3. He et al. [26] investigated methane reforming kinetics with CO2/H2O in flue gas at 1073–1673 K. Experiments and DFT calculations showed >90% methane conversion above 1473 K. A 16% methane increase boosted H2 production by 12%, while a 7% CO2 increase raised CO yield by 10%. Carbon black acted as a catalyst. Miranda et al. [27] analyzed the open-loop dynamics of a heat-integrated catalytic VOC oxidation reactor with feed–effluent heat exchange (FEHE). They identified multiple steady states and sustained oscillations near extinction points. Stability depended critically on the FEHE bypass fraction and furnace duty, with oscillations risking catalyst damage. Xu et al. [28] reviewed advances in ammonia cracking and waste heat reforming. Studies showed Ru-based catalysts achieved near-complete NH3 conversion at 723–773 K using engine exhaust heat (124.6 kJ/min). Integration with gas turbines or internal combustion engines enhanced system efficiency and reduced NOx emissions.
Despite significant advances in heat-recirculating reactors for catalytic methane combustion, three interconnected limitations critically hinder their practical deployment. Firstly, the persistent reliance on external electric preheating (>573 K) imposes prohibitive energy costs (4.5–5.3 kWh/Nm3), as evidenced by industrial-scale systems requiring >70 kW heaters for moderate flow rates [27]. Secondly, a fundamental concentration barrier prevents autonomous operation below 0.5 vol.% CH4, excluding the ultra-lean streams typical of ventilation air methane (VAM) emissions [3,6]. Thirdly, inherent dynamic inefficiencies in fixed-bed designs cause slow thermal response (30 min to steady state), crippling adaptability to real-world flow fluctuations [20,24].
To simultaneously address these gaps, we develop an integrated regenerative reactor featuring helical heat-recovery channels that amplify radial heat transfer, enabling self-sustained combustion at 0.16 vol.% CH4—the lowest concentration reported to date. Coupled with this, a UDF-driven thermal optimization model replaces empirical preheating by dynamically minimizing energy input through real-time heat transfer efficiency control. This dual innovation directly targets the core limitations. The helical structure slashes preheating dependence, while the UDF model cuts thermal equilibrium time versus conventional designs [24], establishing a new paradigm for low-energy, ultra-lean methane abatement. Thus, this work delivers the first demonstration of 0.16 vol.% CH4 self-sustained combustion via integrated heat recovery. In addition, a predictive control framework (UDF + efficiency equations) eliminates complex preheater hardware.
In this study, a combined preheater–reactor system utilizes flue gas heat to preheat fresh gas mixtures. Self-heat maintenance characteristics are investigated through numerical simulations that omit complex preheater geometries. A relationship between the reactor inlet and exhaust outlet temperatures is established using UDF (user-defined function) programming and fitted heat transfer efficiency equations. Comparative analysis reveals the reaction performance differences between preheated catalytic reactors and integrated regenerative catalytic reactors. Transient self-heat maintenance behavior in integrated reactors is systematically characterized, and methane concentration effects on self-sustaining operation are quantified. The results demonstrate that optimized integration significantly enhances energy recovery potential for low-grade methane combustion.

2. Mathematical Modeling and Experimental Data Processing

2.1. Geometric Model

Based on the reactor design described in [29], the core advantages stem from efficient waste heat utilization and intensified heat transfer. By integrating regenerative heat-exchange channels, the reactor achieves high thermal recovery efficiency, drastically reducing external energy input. This design eliminates the need for secondary flow structures while maintaining stable combustion at ultra-low methane concentrations, directly enabling energy-efficient, low-emission operation.
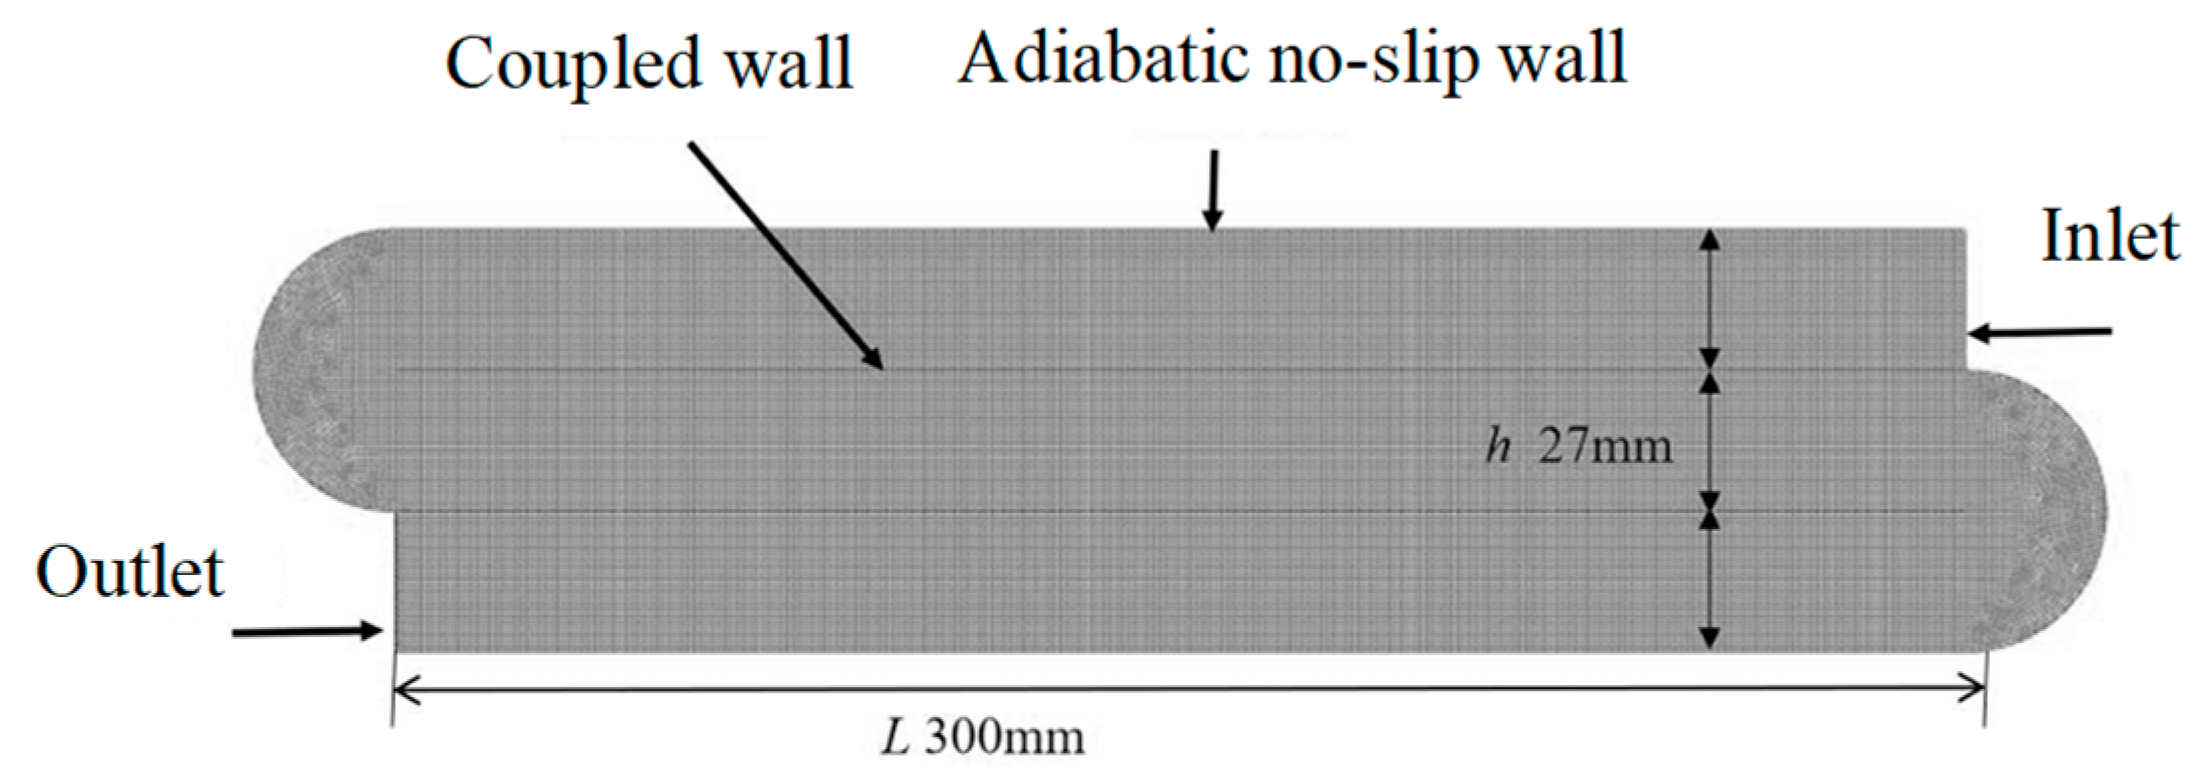
The computational domain is a two-dimensional symmetric model comprising three parallel rectangular channels (length L = 300 mm, height h = 27 mm) separated by 310S stainless steel diaphragms (thickness δ = 2 mm), as illustrated in Figure 1. Porous honeycomb ceramic media fill all three channels, with a palladium (Pd)-based catalyst coated on the ceramic surfaces in the reaction channel. The physical parameters of the porous media include porosity of 0.6, solid thermal conductivity of 3 W/(m·K), solid density of 3800 kg/m3, and solid specific heat capacity of 1050 J/(kg·K). For the 310S stainless steel, the thermal conductivity is 14.2 W/(m·K), density is 7980 kg/m3, and specific heat capacity is 500 J/(kg·K).
The thermal conductivity, density, and specific heat capacity of the solid components (e.g., ceramic media and steel diaphragms) are treated as constant values in the simulations, justified by the limited operational temperature range (300–750 K). Within this range, these properties exhibit minimal variation (<5% deviation for ceramics and metals), as the atomic vibrational modes saturate, leading to plateaued thermal behavior. This simplification aligns with engineering tolerances for reactor-scale simulations.
As shown in Figure 1, the right boundary is designated as the inlet, where Dirichlet conditions are imposed. The left boundary is defined as the outlet, with Neumann conditions. The detailed parameters of the Dirichlet conditions and the Neumann conditions are shown in Section 2.2. The top and bottom boundaries are treated as adiabatic no-slip walls. Internal interfaces between channels (diaphragms) are modeled as thin conductive walls with thermal conductivity of 14.2 W/(m·K). The porous media regions (all channels) are characterized by homogeneous properties.
Figure 1 illustrates the schematic of the external preheater structure. Flue gas from the reactor passes through the preheater to warm the fresh gas mixture, which then enters the reactor inlet and undergoes further reaction. In this study, the external preheater and reactor are simulated together numerically. However, the complex preheater geometry is excluded from the simulation. Instead, the relationship between reactor inlet and exhaust outlet temperatures is established using a fitted heat transfer efficiency equation and a UDF (user-defined function) program.

2.2. Numerical Model

In modeling combustion in porous media, the coupled processes of fluid flow, heat transfer, and chemical reactions are inherently complex, making full combustion simulations highly challenging. External heat loss to the ambient is neglected due to dominant internal heat recirculation and low surface-to-ambient temperature gradients (<50 K). This aligns with insulated industrial reactor models where ambient losses contribute <2% to the energy balance. To simplify the model, the following assumptions are adopted:
(1)
The methane–air mixture and its combustion products are modeled as an incompressible ideal gas.
(2)
The porosity of the porous medium remains constant.
(3)
Catalyst coatings are uniformly distributed, with homogeneous surface reactions.
(4)
Gas dispersion effects within the porous medium are neglected.
(5)
Radiative heat transfer within the porous medium is disregarded.
(6)
Gravitational effects on the gas phase are neglected.
Although methane combustion in the reactor involves intricate chemistry, the system remains governed by the conservation of energy, momentum, and mass. The governing equations are expressed as follows.
Continuity equation:
ε ρ g t + ( ε ρ g   u ) = 0
where ρg is the gas density, u is the gas velocity, and ε is the porosity of porous media.
Momentum equation:
ε ρ g u j t + ( ε ρ g u j u ) = ( μ u j ) + μ C 1 u j + ρ g C 2 u j 2 P
where µ is the dynamic viscosity; uj (j = 1, 2) represents the velocity components in the x (j = 1) and y (j = 2) directions; C1 and C2 represent the permeability and the inertial resistance coefficient, and they are experimentally determined as 7.6 × 10⁶ and 86.65, respectively [30].
Energy equation:
ρ c e f f T t + u ρ g c g T = λ e f f T + ε i = 1 n w i W i h i
where (ρc)eff is the effective volumetric heat capacity, T is temperature, cg is the specific heat capacity at constant pressure of the gas, λeff is the effective thermal conductivity, and λeff = ελg + (1 − ε) λs (applies specifically to ordered parallel structures), where λg and λs are thermal conductivities for gas and solid. wi, Wi, hi are the reaction rate, molecular weight, and molar enthalpy of species i, respectively.
Species transport equation:
ε ρ g Y i t + ( ε ρ g u Y i ) = ( ε ρ g D i Y i ) + ε w i W i
where Yi is the mass fraction of component i, and Di is the diffusion coefficient of component i.
A multi-step surface reaction mechanism is employed to model methane catalytic combustion. In this study, a 21-step palladium-based surface reaction mechanism developed by Moallemi et al. [31] is adopted, comprising 8 adsorption reactions, 8 surface reactions, and 5 desorption reactions. The mechanism file in Chemkin format is imported into ANSYS Fluent 2020.
Ideal gas state equation:
ρ g = P R T
where P is pressure.
For the inlet, the boundary conditions are given by
T = T i n , u 1 = u 0 , u 2 = 0 , X C H 4 = X C H 4 ,   i n , X O 2 = X O 2 , i n
where u1 is the velocity in the x direction, u2 is the velocity in the y direction, XCH4 is the volume fraction of methane, and XO2 is volume fraction of oxygen.
For the outlet, it can be written as
T x = Y i x = 0
For the outer wall of the reactor, no-slip, impenetrability, and adiabatic conditions are defined as
u 1 y = u 2 y = T y = Y i y = 0
To validate the numerical simulations, experimental temperature data from the reaction zone of a dual-chamber preheated catalytic reactor are compared with simulated reaction zone temperatures of a single-channel reactor [32].
Numerical calculations are performed using ANSYS Fluent software. Gambit is used to establish the geometric model and grid generation. A UDF program is developed to link the unsteady changes in the inlet and outlet temperatures of the reactor. The SIMPLE (Semi-Implicit Method for Pressure-Linked Equations) algorithm is adopted for the coupled velocity–pressure solution. Second-order upwind schemes are applied to the energy, momentum, continuity, and species transport equations. The convergence criterion for all equations is set to residuals below 1 × 10⁻⁶.
The gas composition in the numerical simulation is shown in Table 1, where the proportions of oxygen, nitrogen, and carbon dioxide remain constant, and the volume ratio of methane ranges from 0.16% to 1%.

2.3. Grid Independence Validation

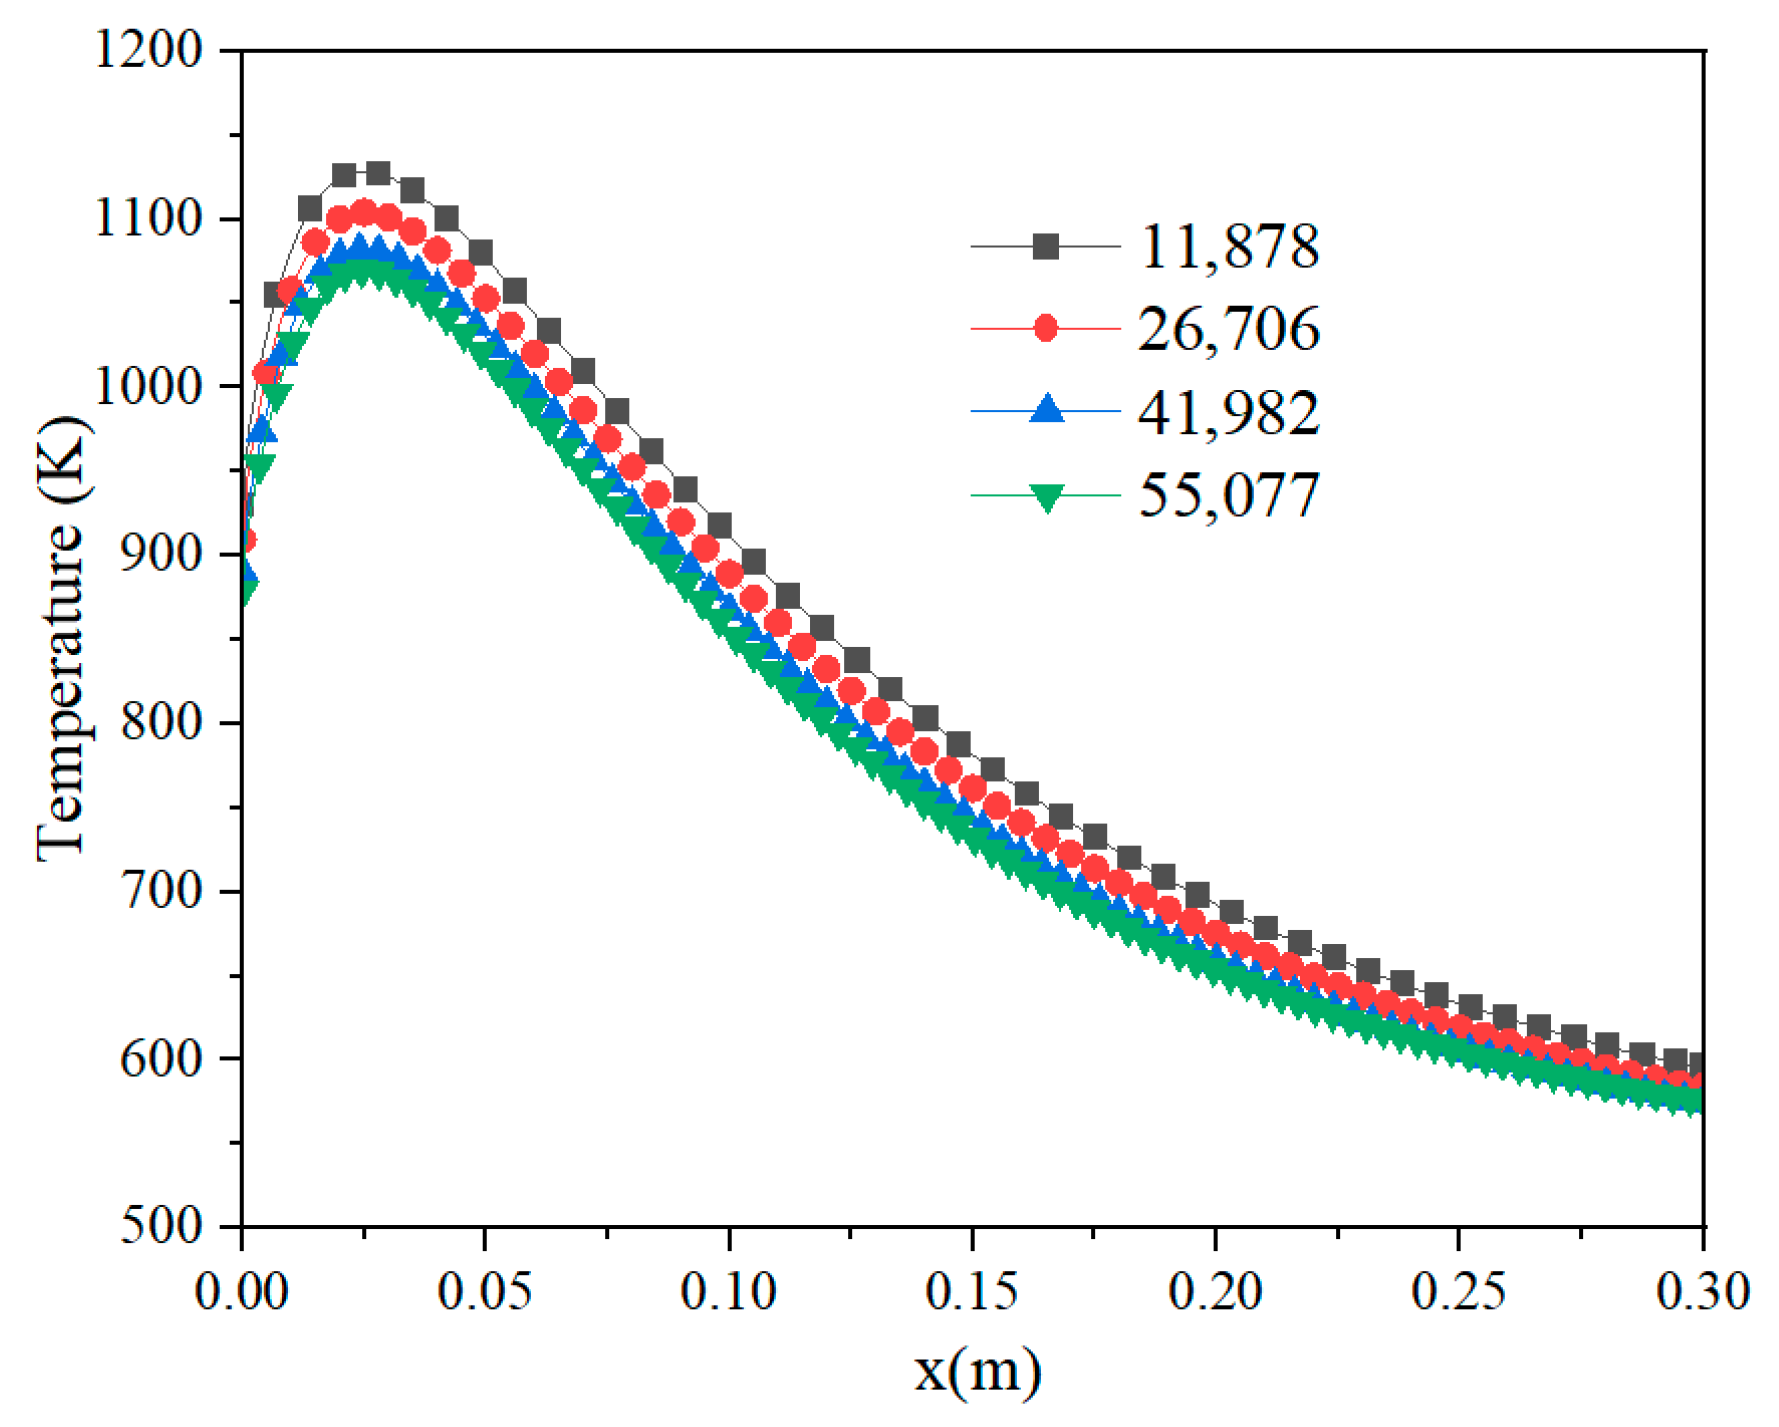
The computational domain employs structured quadrangular grids with four distinct resolution levels: coarse (11,878 cells; 1.4 mm), medium (26,706 cells; 1.0 mm), refined (41,982 cells; 0.8 mm), and ultra-fine (55,077 cells; 0.7 mm). The grid map of the reactor with a grid number of 41,982 is shown in Figure 2. As quantitatively demonstrated in Figure 3, while the coarse grid (black squares) exhibits a notably higher peak temperature (about 1100 K at x = 0.00 m) compared with the others, the temperature profiles for the medium (red circles), refined (blue triangles), and ultra-fine (green inverted triangles) grids are virtually indistinguishable across the entire reactor length. The maximum temperature difference between these three finer grids is less than 15 K at any point, and their curves align closely, with nearly identical values. This remarkable overlap confirms that grid convergence is achieved beyond 26,706 cells, with further refinement to 55,077 cells yielding negligible improvement in accuracy. The refined grid of 41,982 cells was therefore selected as the optimal compromise, providing excellent spatial resolution. This configuration successfully captures the same thermal behavior as the ultra-fine grid, while maintaining high computational efficiency for the extensive parametric studies conducted in this work.

2.4. The Preheated Catalytic Oxidation Reactor Experiment Platform

2.4.1. Structure and Measurement

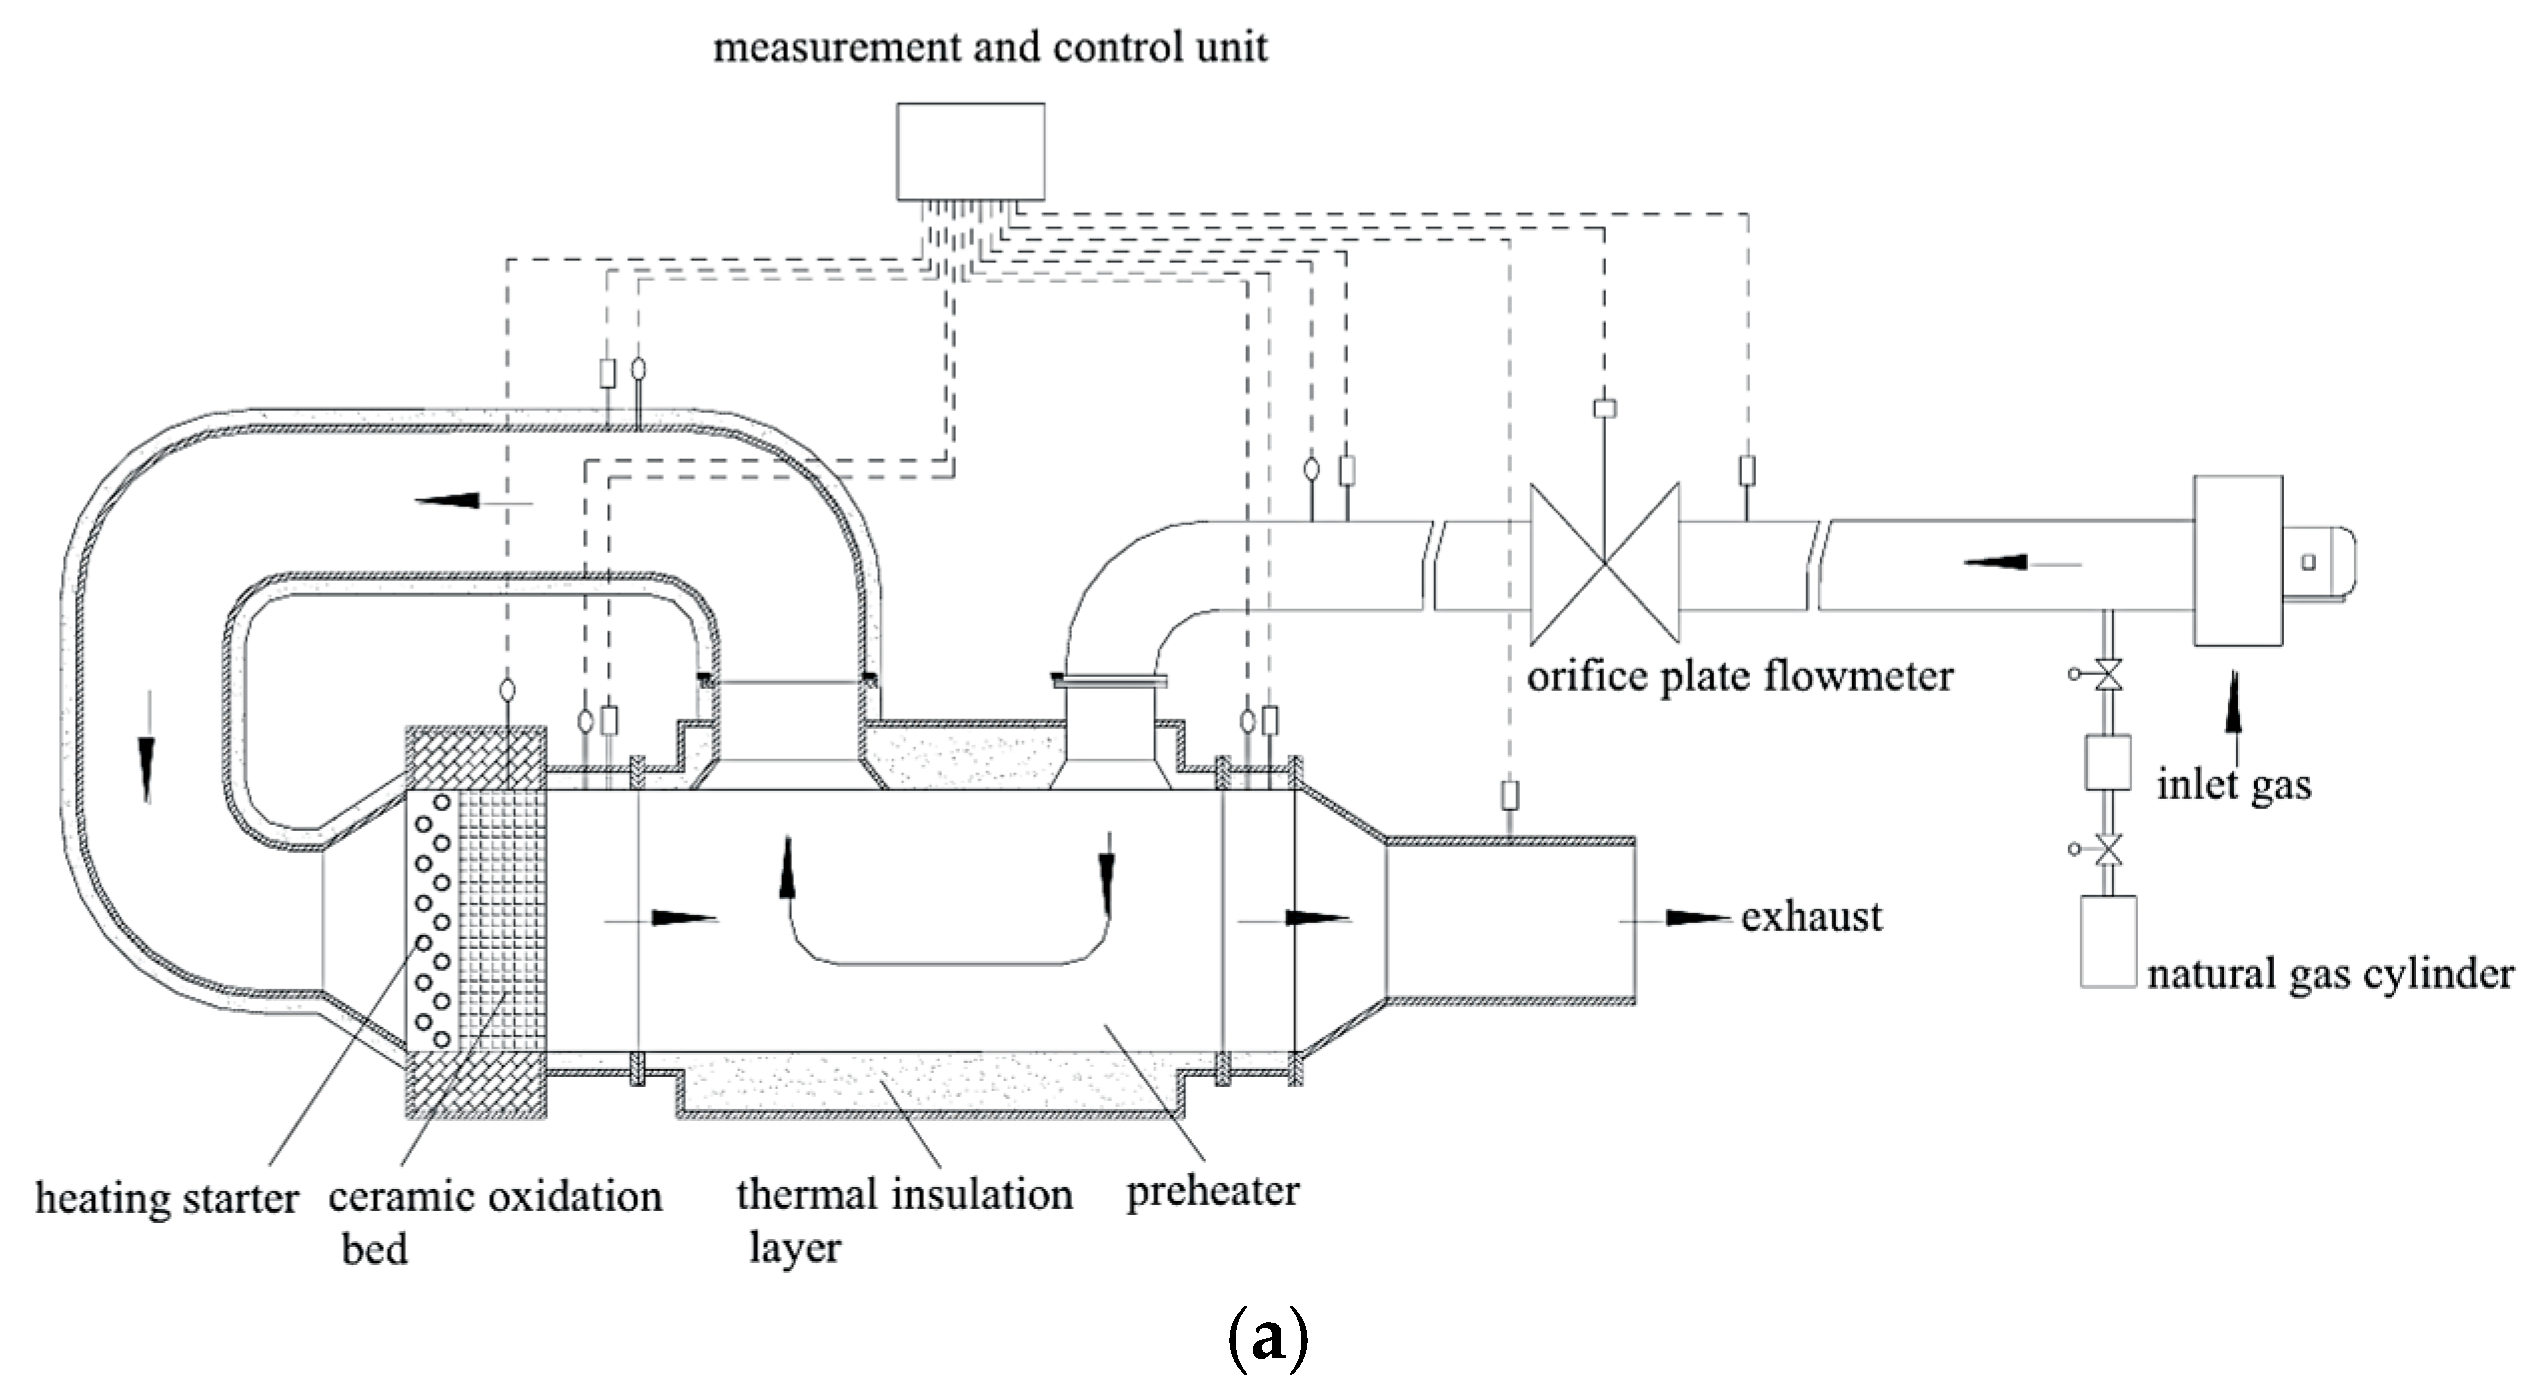
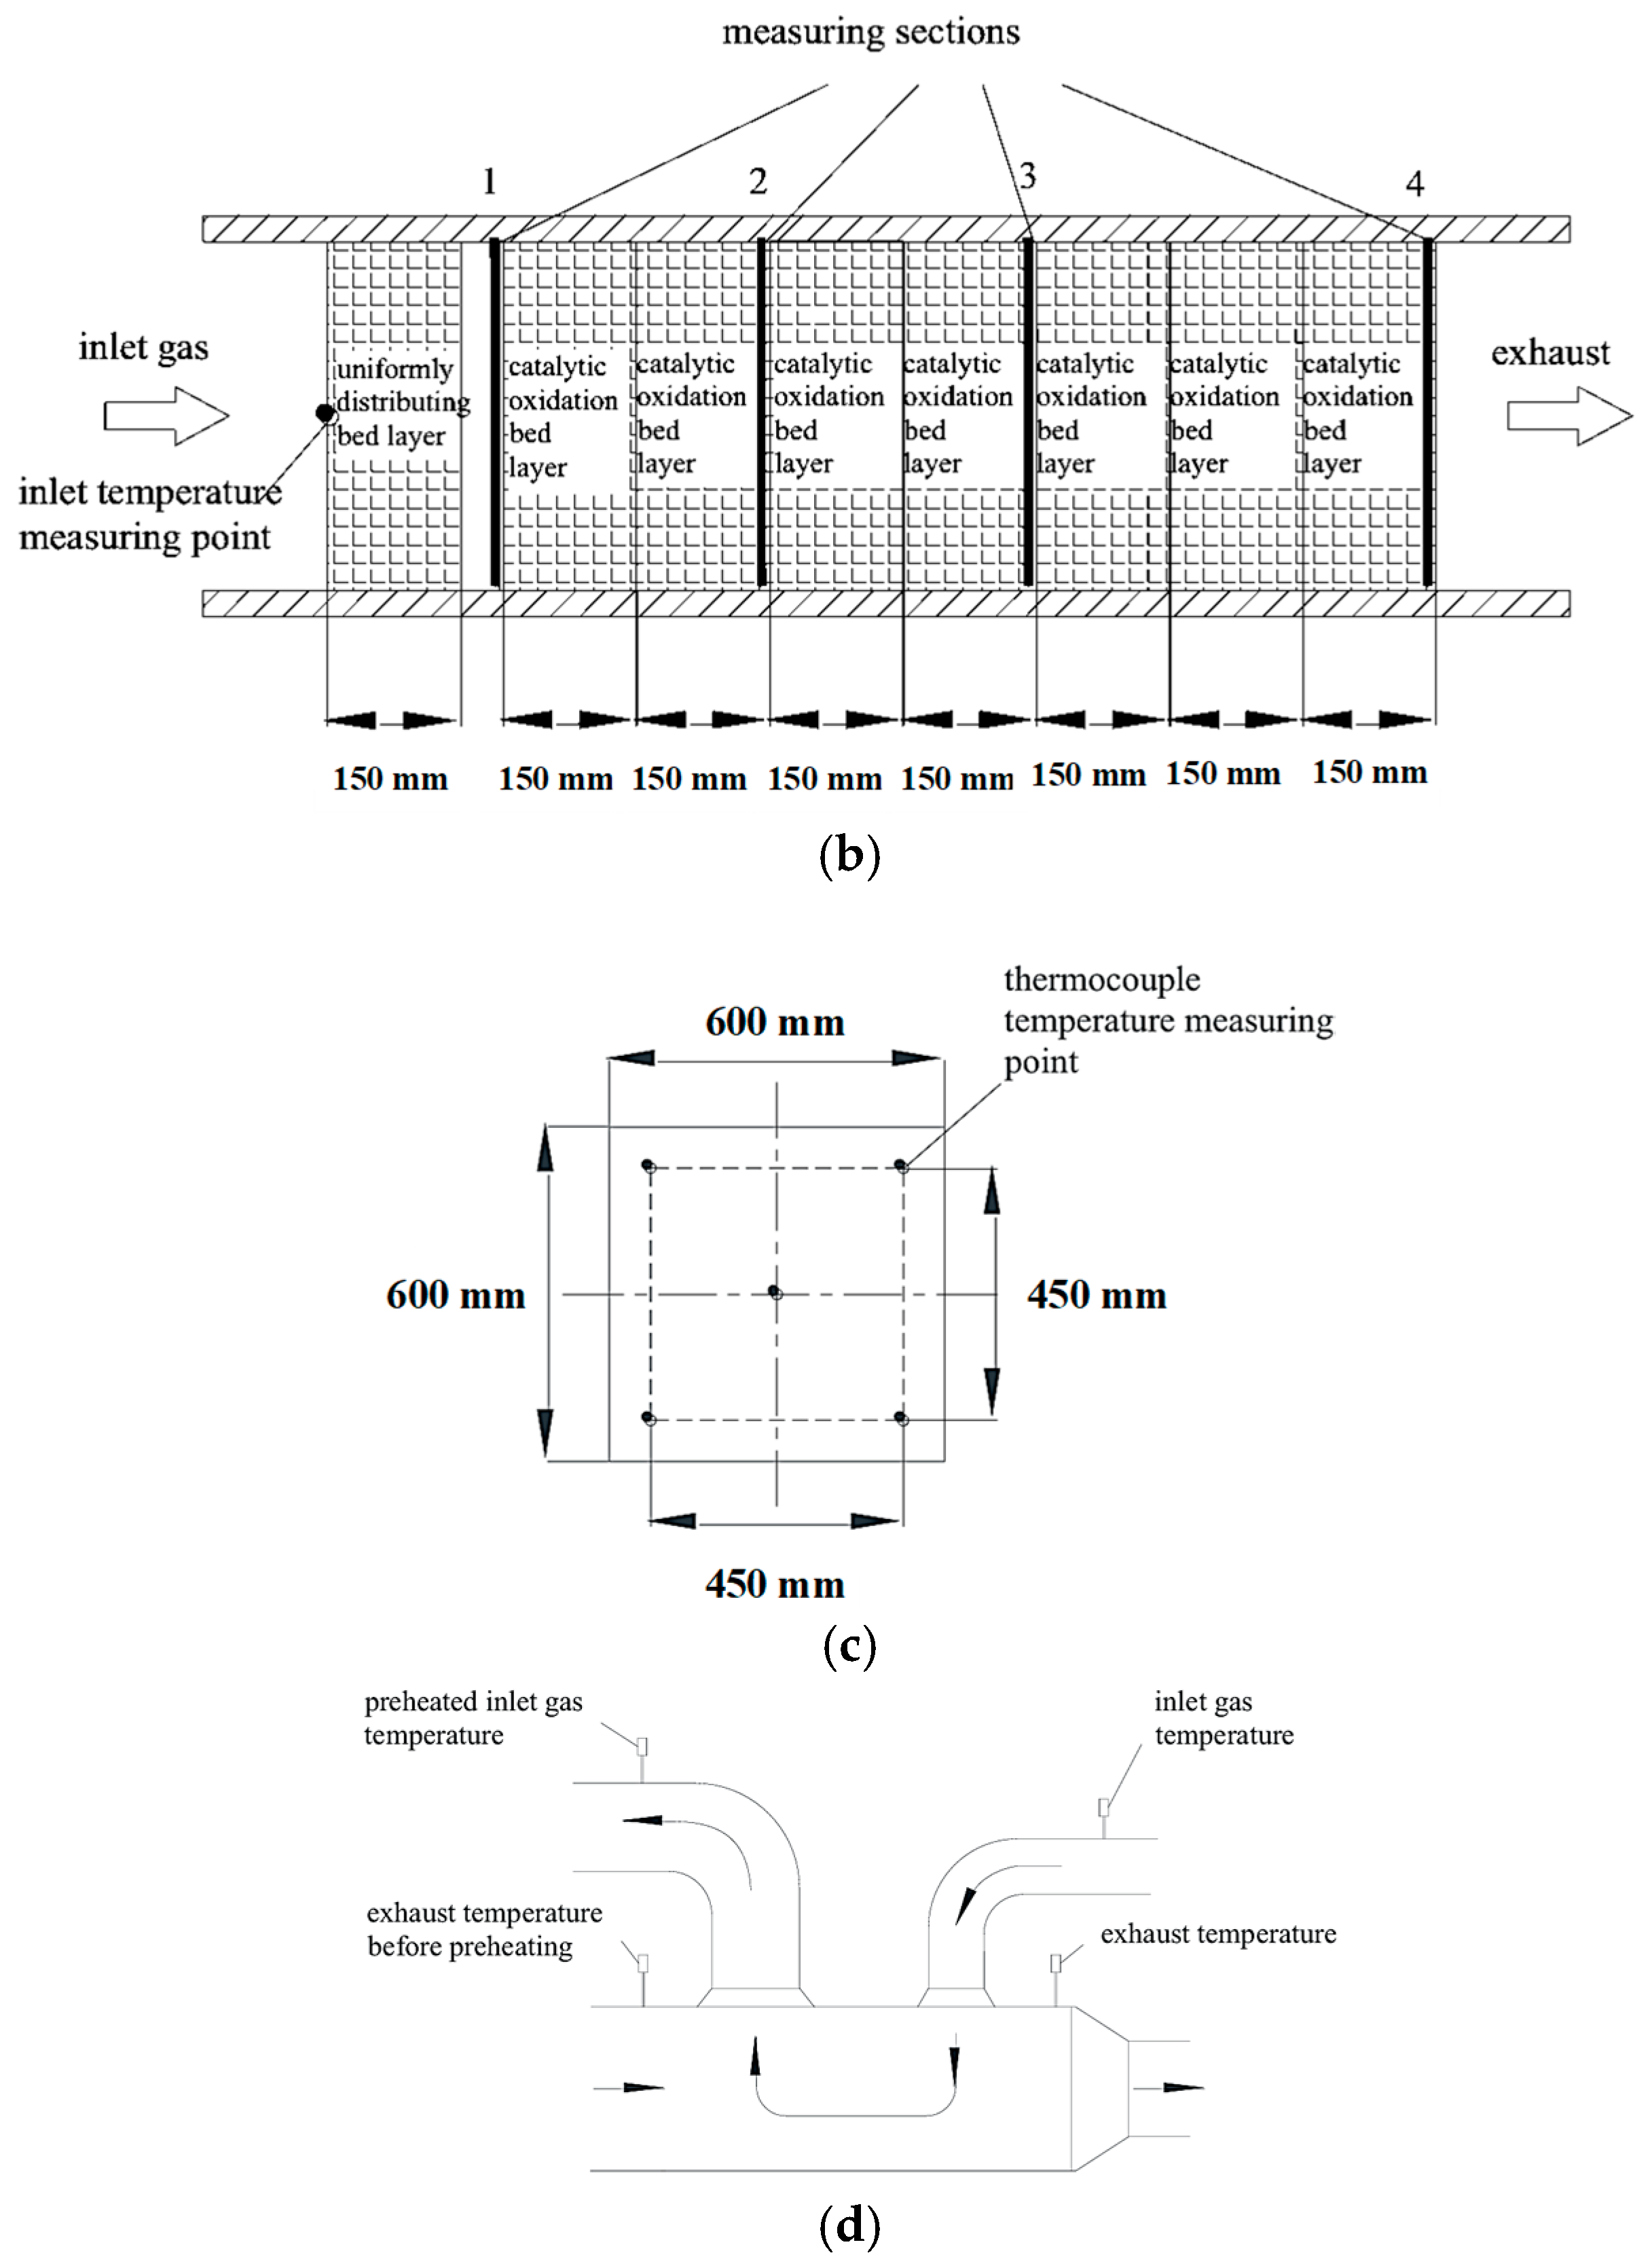
The experiments are conducted on a preheated catalytic oxidation reactor experimental platform. As shown in Figure 4a, the experimental system comprises six integrated components: a gas supply system, parameter acquisition system, startup system, gas composition analysis system, heat exchanger, and catalytic oxidation bed. The core reaction chamber houses a catalytic oxidation bed (600 mm × 600 mm × 1050 mm) packed with cordierite honeycomb ceramic blocks (150 mm × 150 mm × 150 mm, 17.3 PPI hole density), coated with Pd catalyst. The bed includes a non-catalytic ceramic layer for flow/temperature uniformity and seven catalytic layers. A recuperative heat exchanger with internal corrugated plates preheats incoming ventilation air methane (VAM) using exhaust heat. The startup system employs electric heaters (10–20 kW) to initiate combustion. The gas supply mixes compressed air and high-purity methane (99.9%) via regulators, while the measurement system tracks temperature, flow, pressure, and composition.
The distribution of temperature measurement points is shown in Figure 4b–d. Temperature mapping uses K-type thermocouples with 20 measurement points: 4 cross-sections in the oxidation bed (5 points each) and dedicated sensors at the heat exchanger’s cold/hot sides. Methane concentration is monitored in real-time using a Chinese GJG10H(C) infrared sensor (0–1% range, ±0.07% error) and a German J2KN flue gas analyzer (1 ppm accuracy) for validation. Flow rates are measured via an orifice plate flowmeter (0–1500 Nm3/h, ±1% accuracy).
During startup, the experimental system is powered on, and the air compressor and methane cylinder are activated to supply a mixture of ventilation air methane (VAM) with concentrations adjusted between 0.1% and 1.2% using pressure regulators. The startup flow coefficient (ε = 0.3–0.5) is set via a fan inverter, and electric heaters (10–20 kW) preheat the catalytic oxidation bed to 620 K, monitored by K-type thermocouples to ensure it reaches the methane ignition temperature before methane is introduced. Once stable, the system transitions to steady-state operation, with space velocity (2600–11,500 h−1), methane concentration, and oxidation bed inlet temperature (723–873 K) systematically adjusted. After allowing ≥20 min for thermal equilibrium, real-time data acquisition commences, capturing axial and radial temperature distributions across multiple bed sections (e.g., four cross-sections with five thermocouples each), methane concentrations at inlet/outlet using infrared sensors and flue gas analyzers (e.g., GJG10H(C) and J2KN devices for ±0.07% error), and flow rates via an orifice plate flowmeter (±1% accuracy).

2.4.2. Processing of Preheater Experimental Data

The heat transfer efficiency of the preheater is defined as η = (T_c,out − T_c,in)/(T_h,in − T_c,in). The uncertainty in the calculation is primarily governed by the propagation of temperature measurement errors from the K-type thermocouples used to measure the inlet and outlet streams. The measurement uncertainty of u_T = ±0.4% for each of the three temperature measurements (T_h,in, T_c,in, T_c,out); the combined standard uncertainty in η is derived by applying the law of propagation of uncertainty to the efficiency equation, which results in a complex partial derivative equation where the uncertainty is inversely proportional to the square of the inlet temperature difference (T_h,in − T_c,in), meaning the uncertainty in η increases significantly as the temperature difference between the hot and cold inlet streams narrows. Applying the law of propagation of uncertainty to this formula shows that the combined relative uncertainty in the calculated efficiency is approximately ±(0.56% to 0.8%) under typical operating conditions. This range accounts for the amplification of sensor error through the mathematical division of temperature differences. The primary factor influencing the exact value is the temperature approach; the uncertainty increases as the difference between the hot inlet (T_h,in) and cold inlet (T_c,in) temperatures decreases, meaning the calculated efficiency is less reliable when the two inlet streams are close in temperature. Therefore, for a reported efficiency value, the uncertainty interval would be η ± (0.0056η to 0.0080η).
During numerical simulations, the preheater section is omitted from the computational model due to its structural complexity. Experimental data are processed and analyzed to derive a heat transfer efficiency equation for the preheater, expressed as a function of inlet gas flow rate and the temperature difference between the non-preheated fresh gas mixture and the flue gas. This equation substitutes for the physical preheater in the simulations.
The fitted relationship between heat transfer efficiency and the temperature difference (flue gas temperature minus fresh gas mixture temperature) is formulated as follows:
η = 0.0235 t + 0.21 × q + 0.0148 t + 0.676
where η is the heat transfer efficiency, t is the dimensionless temperature difference, and q is the dimensionless flow rate. t and q are expressed as follows:
t = t 4 t 0 t
q = q r q 0
where t4 is the temperature at which the flue gas enters the preheater, t0 is the initial temperature of the unpreheated fresh mixture, t′ is the ambient temperature of 293K, qr is the inlet gas flow rate, and q0 is the standard operating condition flow rate of 1000 m3/h.
The space velocity is defined as follows:
Space   velocity = q r V r
where Vr is the volume of the reaction zone.

2.4.3. Fitting of Preheater Formulas for Different Space Velocities

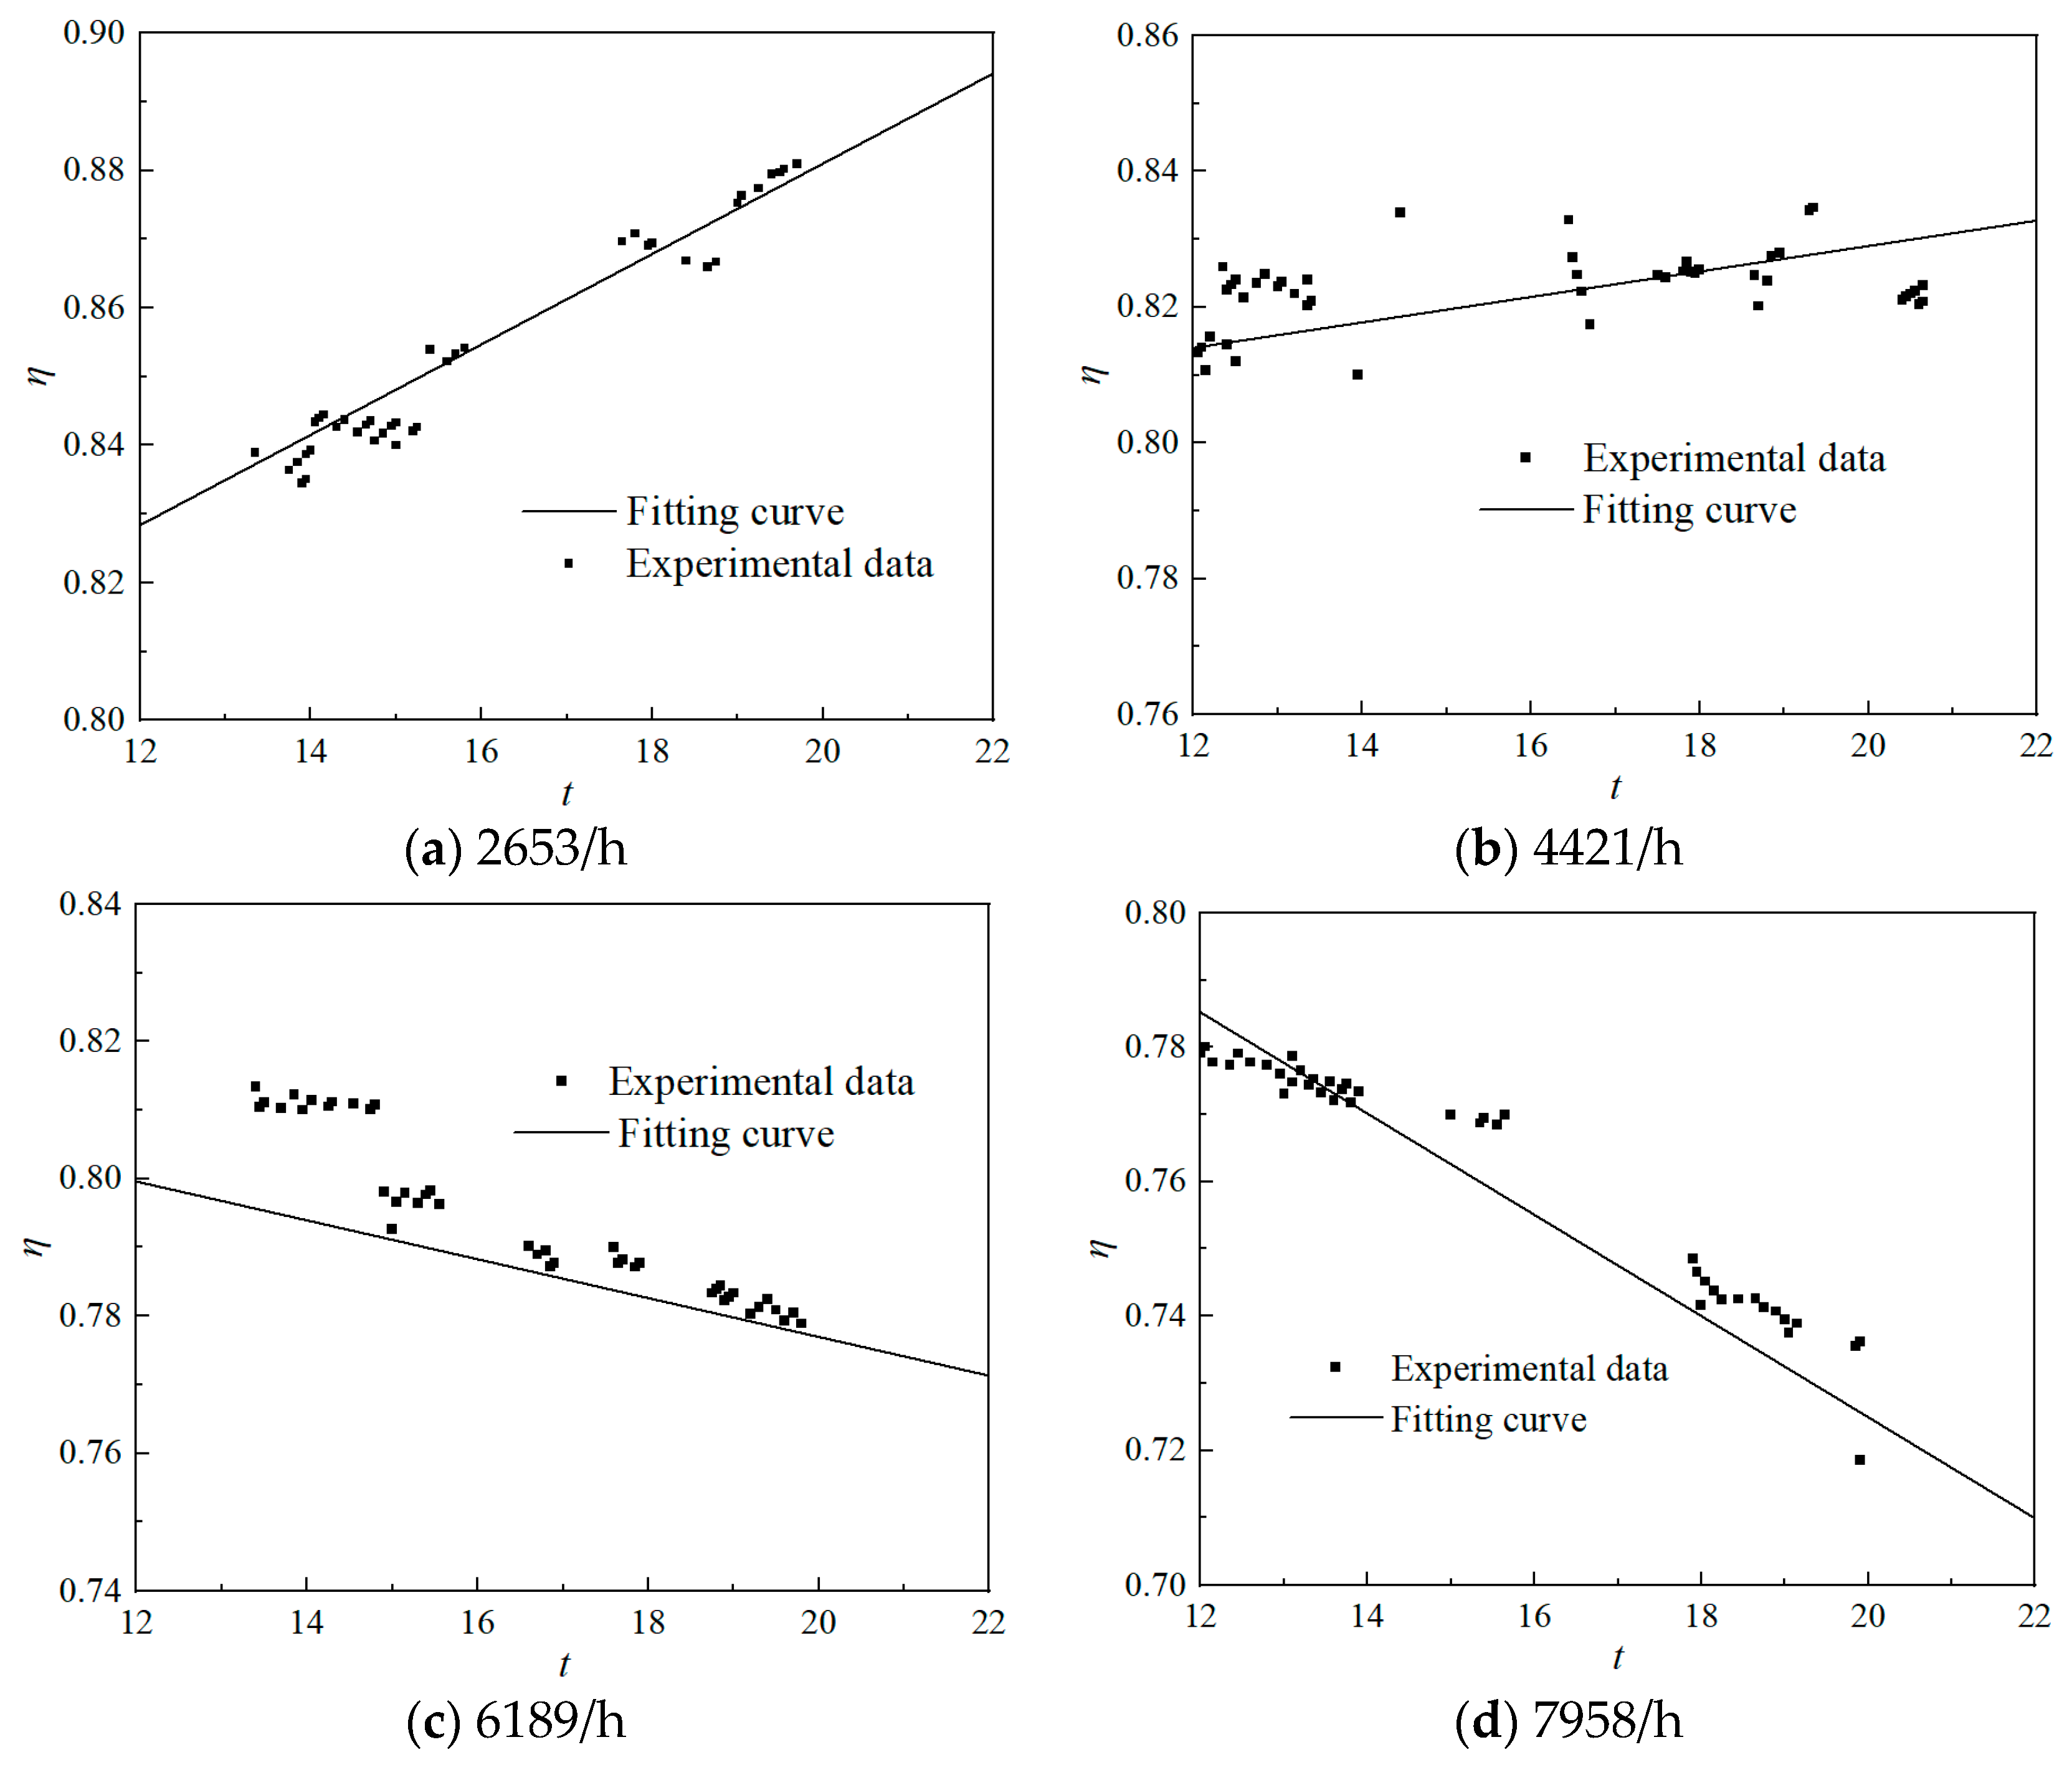
The fitted curves illustrating the relationship between the preheater heat transfer efficiency and the dimensionless temperature t at four space velocities (2653/h, 4421/h, 6189/h, and 7958/h) are plotted in Figure 5.
When the space velocity is 2653/h, intake methane concentration is 0.6 vol.%, and initial inlet temperature is 620 K, the heat transfer efficiency is expressed as
η = 0 . 0235 × t + 0.21 × 0.35 + 0.0148 × t + 0.676
When the space velocity is 4421/h, intake methane concentration is 0.7 vol%, and initial inlet temperature is 620 K, the heat transfer efficiency is expressed as
η = 0 . 0235 × t + 0.21 × 0.55 + 0.0148 × t + 0.676
When the space velocity is 6189/h, intake methane concentration is 0.9 vol%, and initial inlet temperature is 610 K, the heat transfer efficiency is expressed as
η = 0 . 0235 × t + 0.21 × 0.75 + 0.0148 × t + 0.676
When the space velocity is 7958/h, intake methane concentration is 1.0 vol%, and initial inlet temperature is 620 K, the heat transfer efficiency is expressed as
η = 0 . 0235 × t + 0.21 × 0.95 + 0.0148 × t + 0.676
Figure 5 demonstrates that the trend of the experimental data is basically consistent with the fitted curve, and the points of the experimental data are distributed on both sides of the fitted curve. It can be considered reasonable for the fitted curve to replace the preheater. When the space velocity is below 4421/h, the heat transfer efficiency slowly increases with the increase in the temperature difference between the flue gas temperature and the fresh mixture. And when the space velocity exceeds 6189/h, the heat transfer efficiency decreases with the increase in the temperature difference between the flue gas temperature and the fresh mixture. The main reason is that due to the increase in space velocity, the flow rate of flue gas processed in the heat exchanger per unit time increases, and the residence time of the flue gas in the preheater becomes shorter, resulting in insufficient heat exchange between the flue gas and the fresh mixture. Therefore, the heat exchange efficiency decreases. In addition, when the flue gas temperature is higher, the heat carried away by the flue gas is greater and the heat loss is more severe.

2.4.4. Self-Heating Maintenance Iterative Calculation Method

In the process of numerical simulation, Formulas (13) to (16) for heat transfer efficiency are obtained by fitting experimental data to replace the complex preheaters. The specific method is to calculate the inlet temperature of the reactor from the exhaust temperature at the outlet of the reactor through heat exchange efficiency, and then, update the inlet temperature in the boundary conditions. Then, the next iteration calculation is performed to obtain the exhaust temperature of the reactor again, and a new inlet temperature is obtained through heat transfer efficiency calculation. This process is repeated and implemented through Fluent’s UDF program. If the exhaust temperature reaches a stable value and does not continue to rise, it is considered to have reached a state of self-heating equilibrium.

3. Results and Discussion

3.1. Comparison of the Performance of the Integrated Regenerative Catalytic Reactor

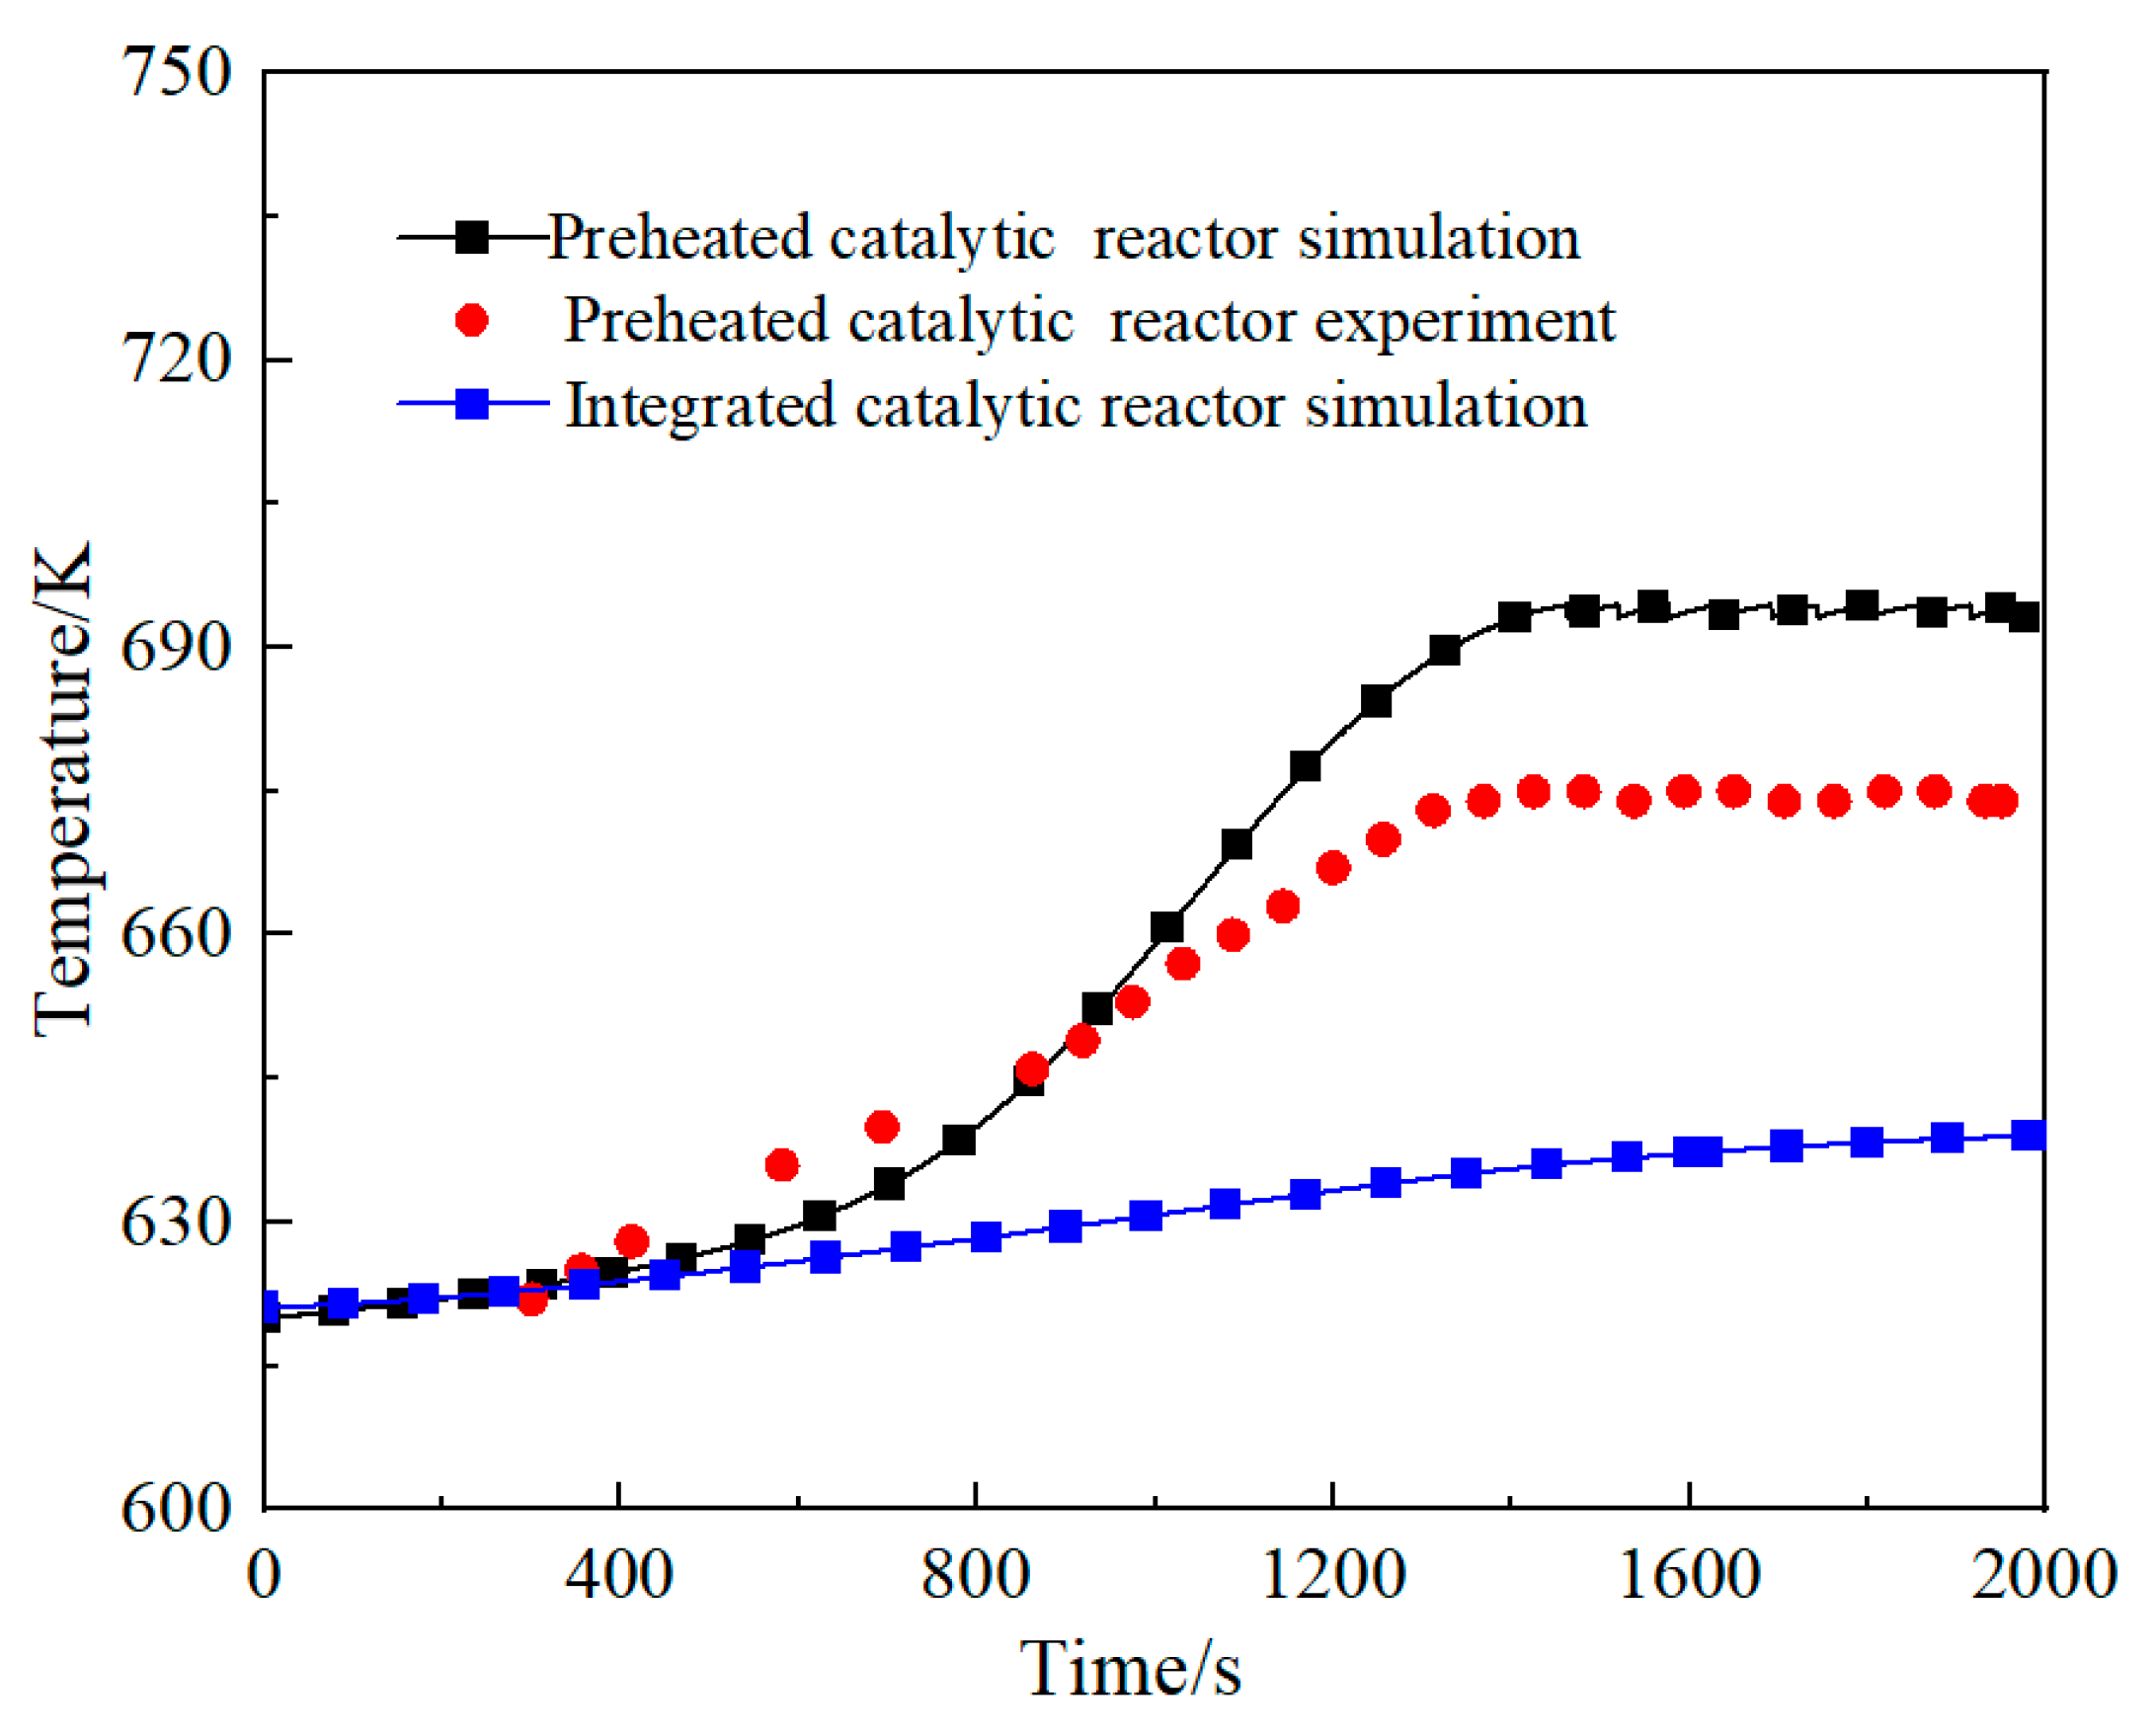
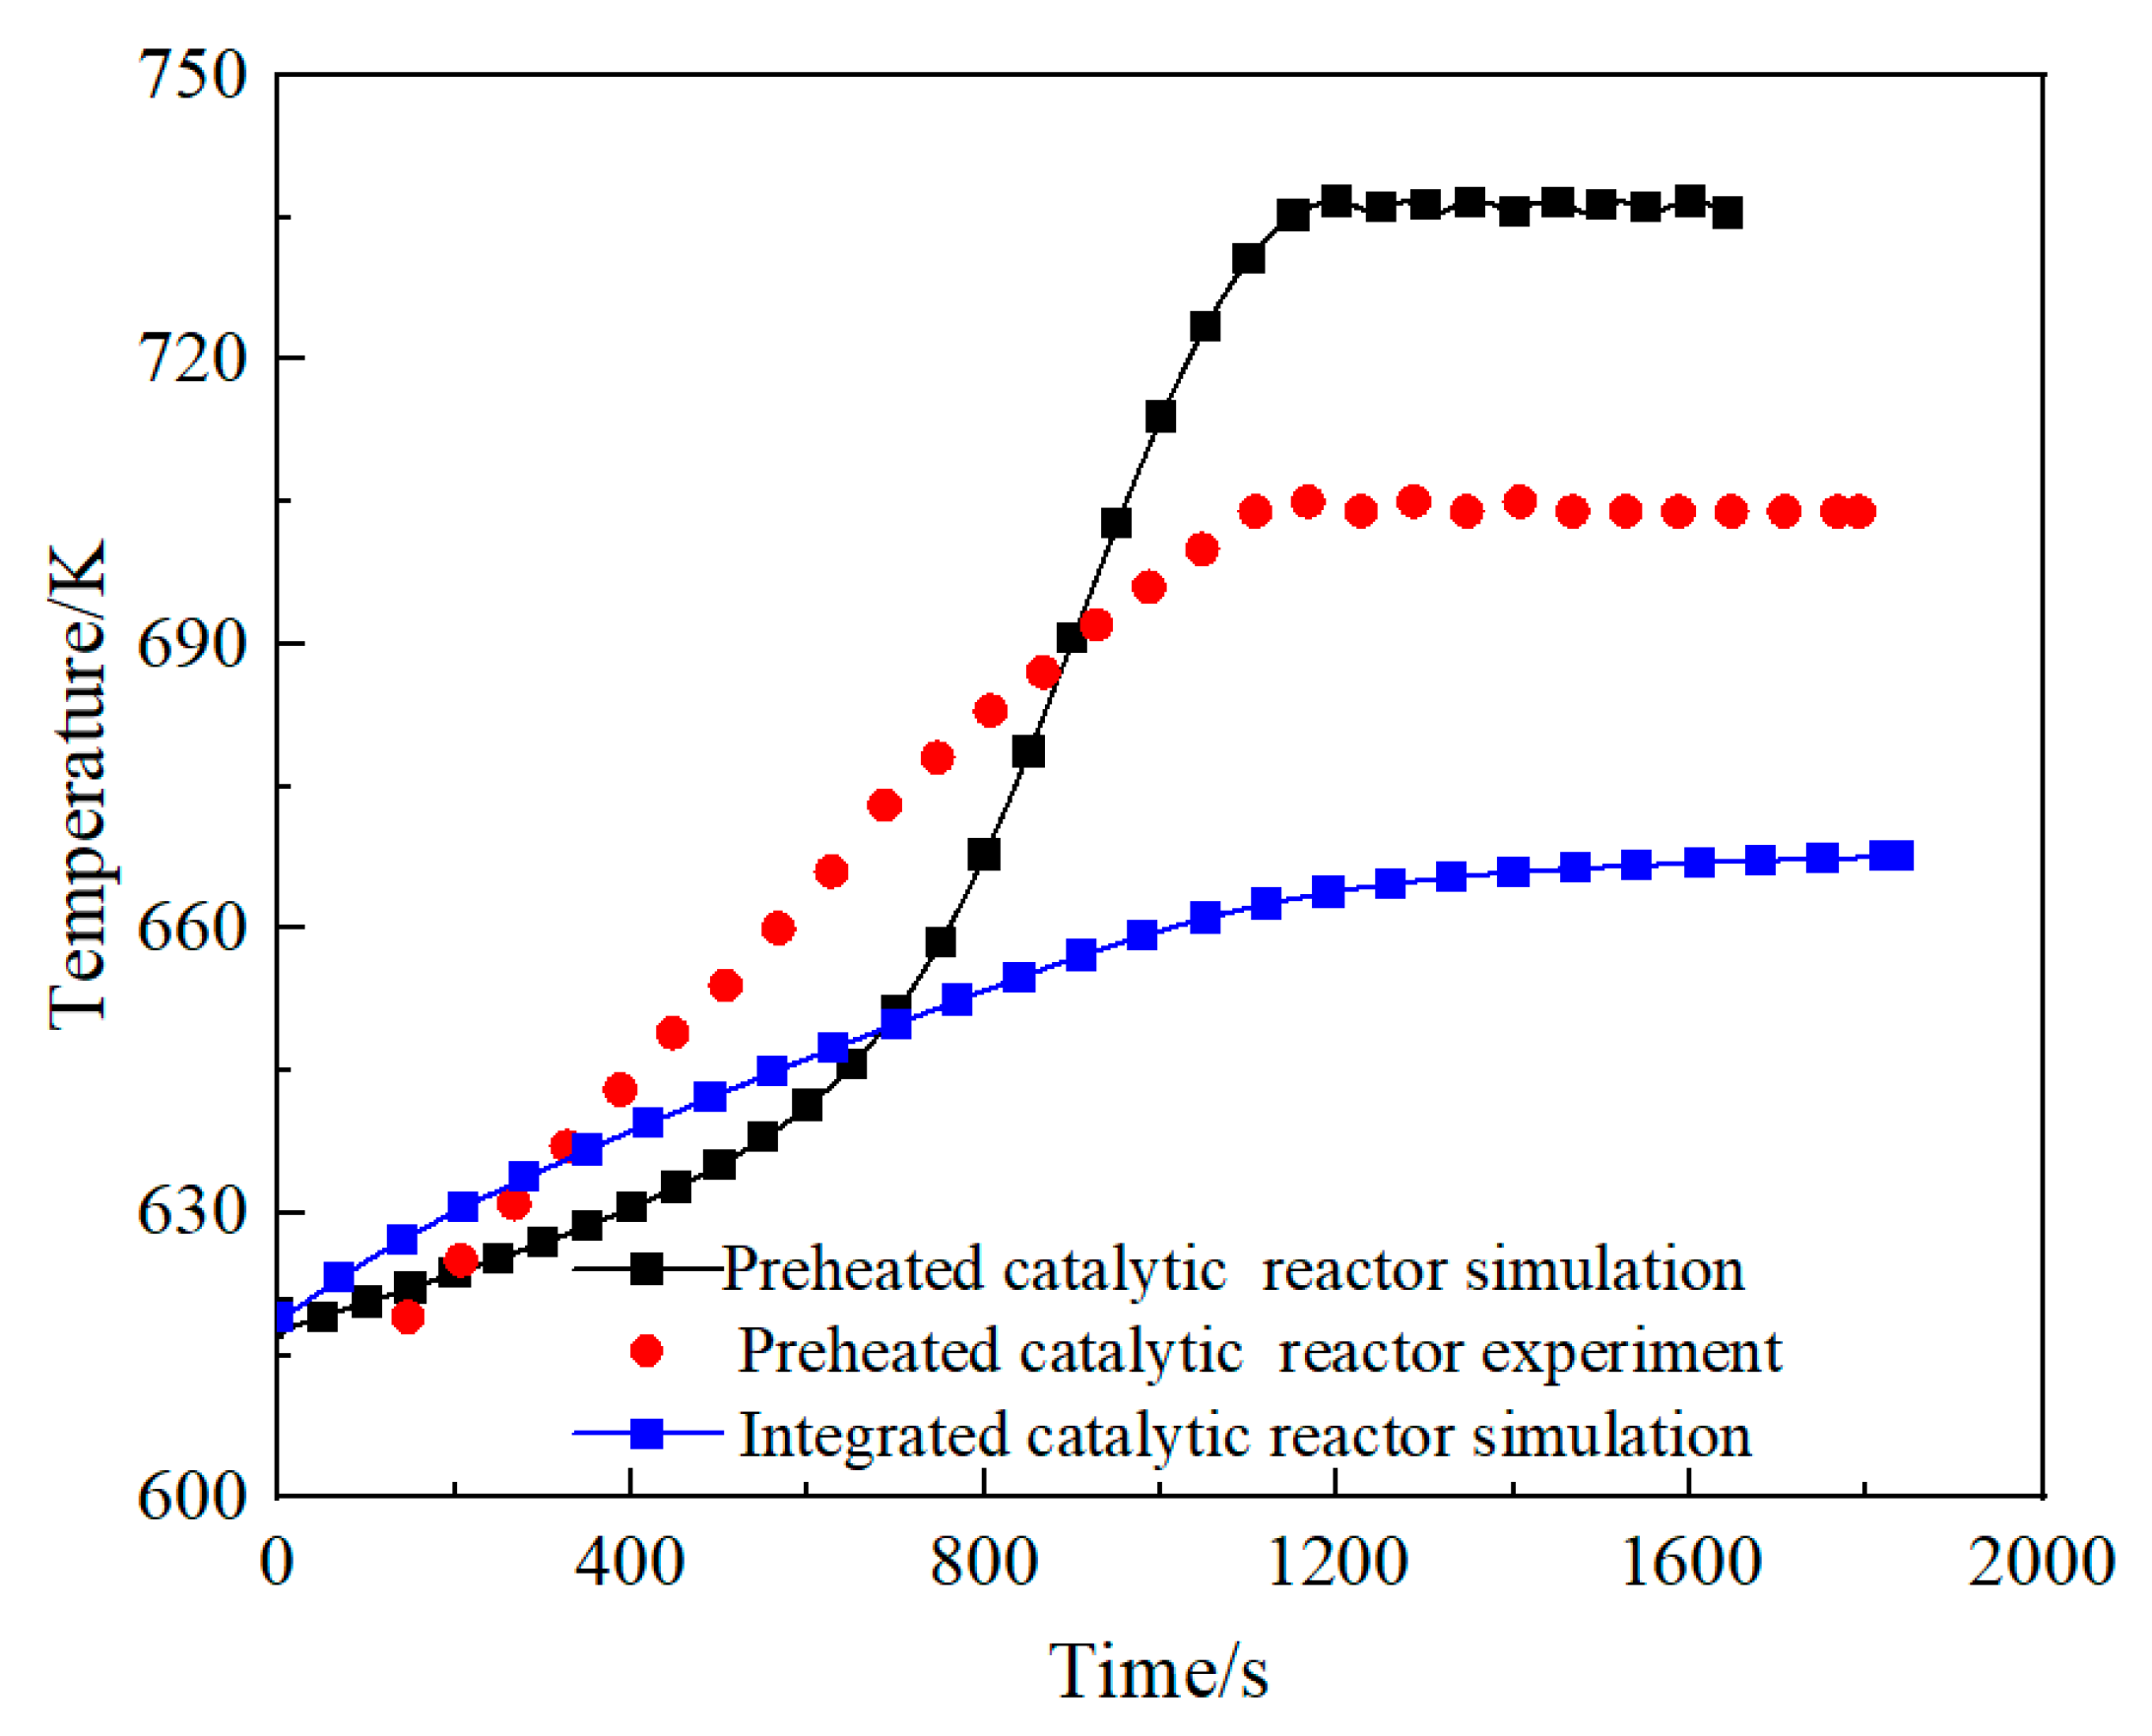
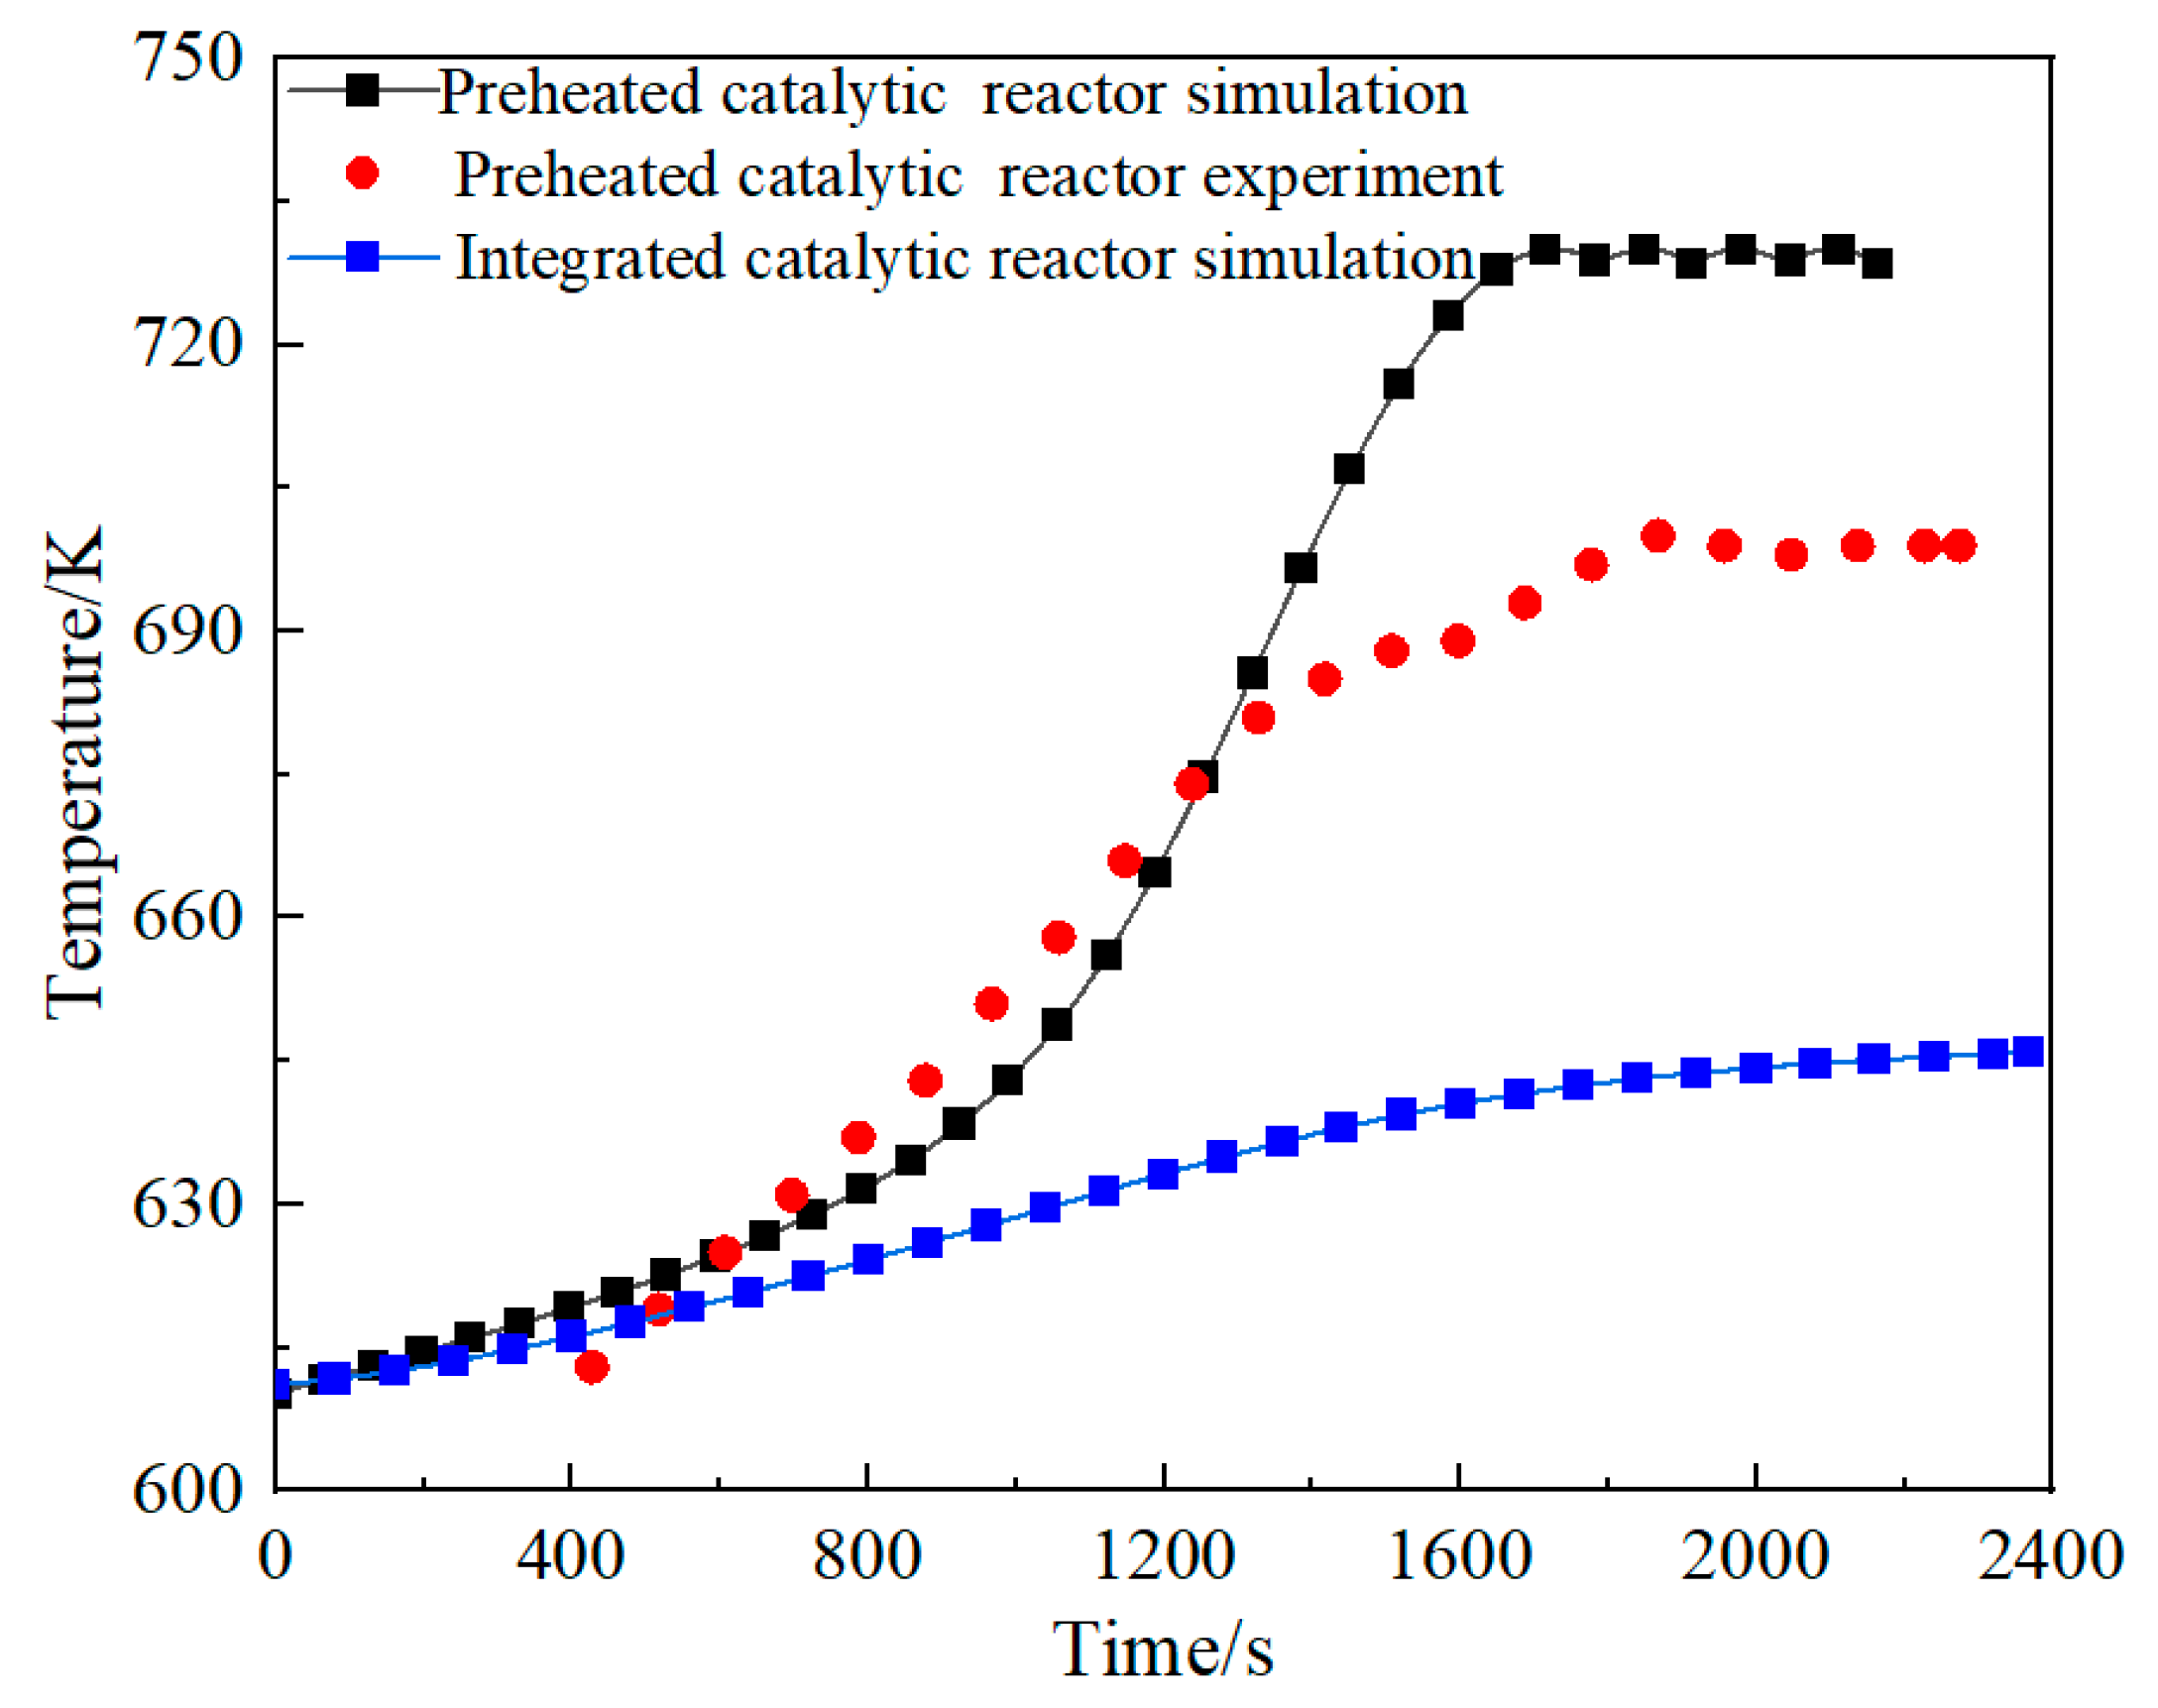
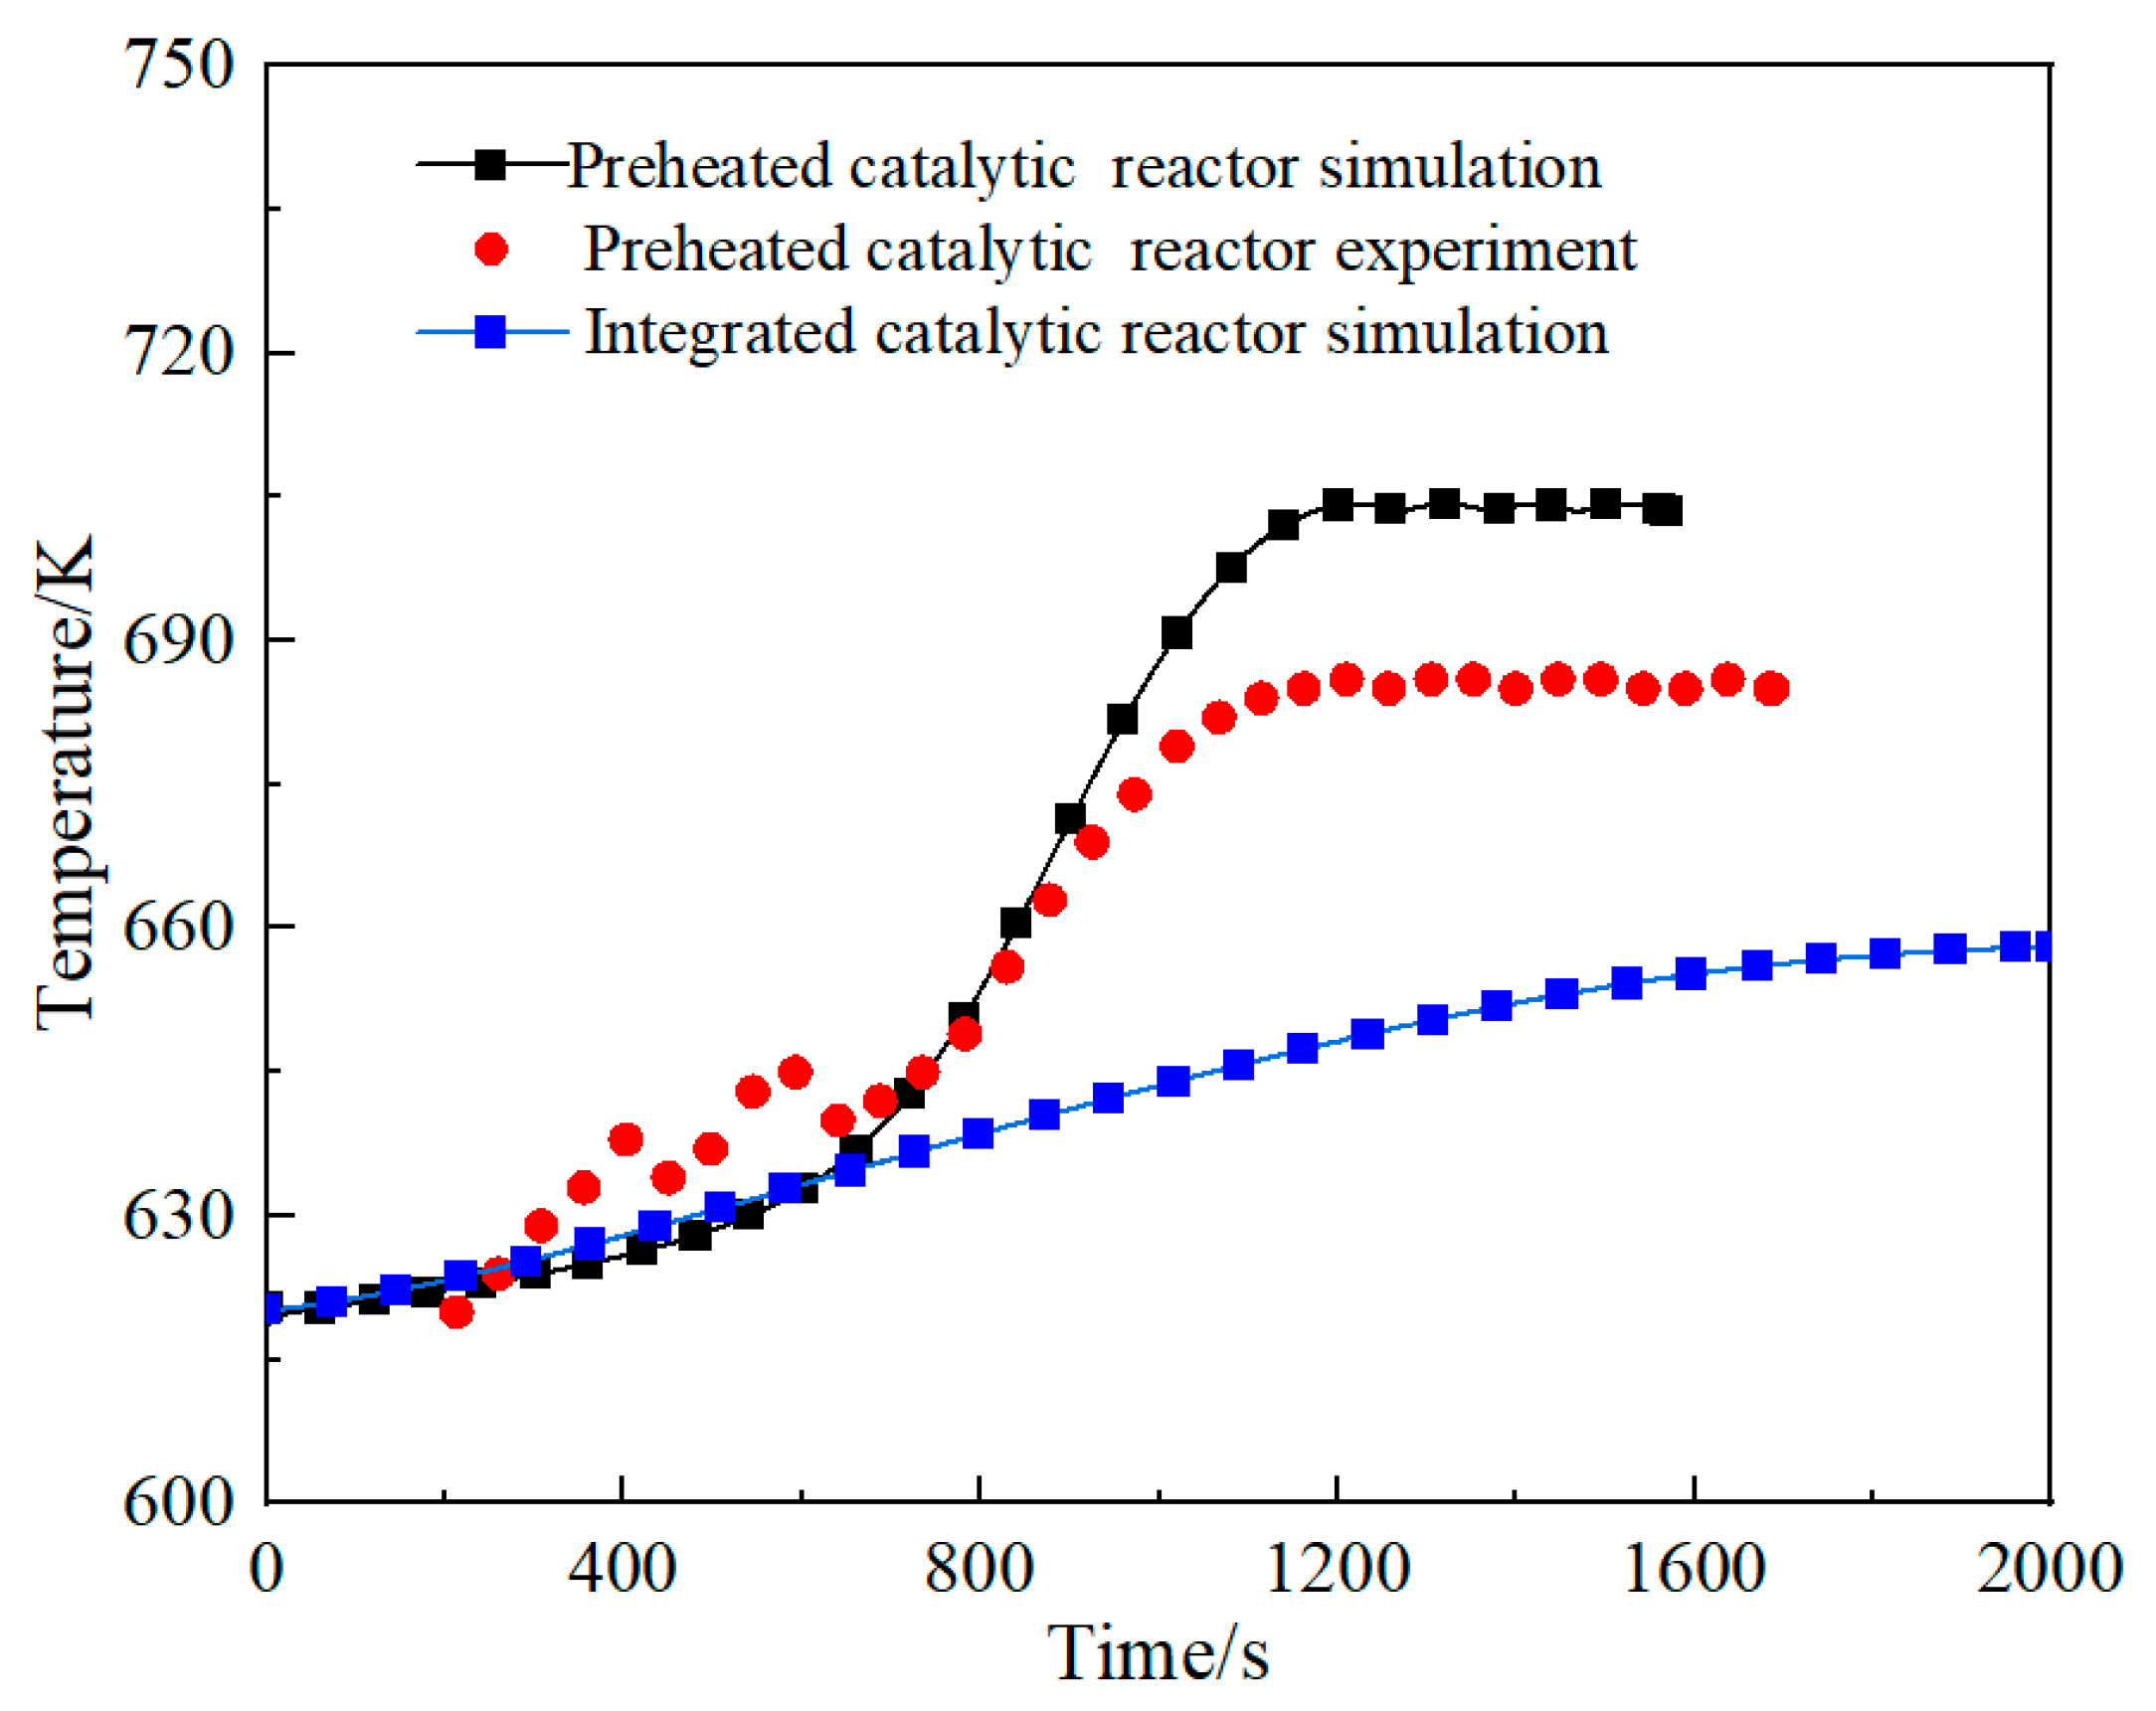
Figure 6, Figure 7, Figure 8 and Figure 9 collectively illustrate the temperature evolution in catalytic oxidation reactors under simulated and experimental conditions, with a focus on comparing the preheated catalytic reactor system and the integrated regenerative catalytic reactor design. In all cases, the preheated catalytic reactor simulation demonstrates the most rapid temperature rise, reaching equilibrium temperatures between 690 K and 730 K within 1200–1600 s across different space velocities. This contrasts with experimental measurements, which follow similar trends but consistently show lower peak temperatures (680–700 K) due to real-world heat dissipation effects. The maximum temperature discrepancy between simulation and experiment remains within 50 K (7%), confirming the model’s validity despite idealized assumptions. Meanwhile, the integrated regenerative catalytic reactor simulation (blue line with square markers) exhibits a significantly slower heating rate, achieving 40–84 K lower equilibrium temperatures (640–660 K) than the preheated system depending on space velocity, as particularly evident in Figure 4, where temperatures plateau at 660 K compared with 700 K in the preheated simulation.
This performance divergence stems from fundamental design differences. The integrated reactor’s built-in heat regeneration structure enables internal thermal recovery, where the inlet gas mixture absorbs reaction heat through channel walls rather than relying solely on external preheating. As shown in Figure 1, this internal heat exchange reduces the flue gas temperature exiting the reaction zone, thereby decreasing the thermal energy available for preheating incoming reactants. The gradual temperature ascent observed in the integrated reactor simulations (taking 2000 s to stabilize versus 1200–1600 s for preheated systems) reflects this energy redistribution process. Comparative analysis across space velocities (2653–7958 h−1) in Figure 6, Figure 7, Figure 8 and Figure 9 reveals that elevated flow rates intensify the temperature reduction effect in the integrated design. Equilibrium temperatures decline by 54 K to 84 K versus preheated systems, primarily due to shortened reactant residence time constraining thermal energy recovery.
The consistent agreement between simulation and experimental trends validates the models while highlighting practical considerations. Although the preheated system achieves faster ignition through dedicated heating, its reliance on external energy input makes it less thermally autonomous than the integrated design. The 7% maximum deviation between simulated and measured temperatures underscores the unavoidable real-world energy losses but remains within acceptable engineering margins. These findings collectively demonstrate that while both configurations effectively maintain self-sustaining reactions, the integrated reactor’s inherent heat recuperation provides inherent thermal efficiency advantages at the cost of slower startup—a critical trade-off for reactor optimization in continuous industrial applications versus batch processes requiring rapid cycling.
At a space velocity of 2653 h−1 (Figure 6), the integrated reactor requires 2000 s to reach thermal equilibrium (630 K), while the preheated reactor achieves stability in 1400 s (690 K)—a 43% longer startup time. This trend intensifies at higher flow rates: at 7958 h−1 (Figure 9), the integrated design takes 2000 s versus 1200 s for the preheated system, a 67% delay. The extended startup directly translates to 12–18% higher initial energy input for preheating. For a full-scale reactor processing 10,000 Nm3/h of ventilation air methane (VAM), this delay incurs an additional 70–110 kWh energy consumption per startup cycle, based on the electric heater power (20 kW) and preheating duration. Crucially, this startup penalty is offset by the integrated reactor’s long-term energy savings: 50–90 K lower equilibrium temperatures (Figure 6, Figure 7, Figure 8 and Figure 9) reduce steady-state heat loss by 15–20%. The elimination of external preheating cuts continuous power demand by ≥85%. For continuous industrial operations (e.g., >8000 h/year), the energy saved during sustained operation exceeds startup costs by 3–5 times, justifying the design for permanent installations despite slower ignition.
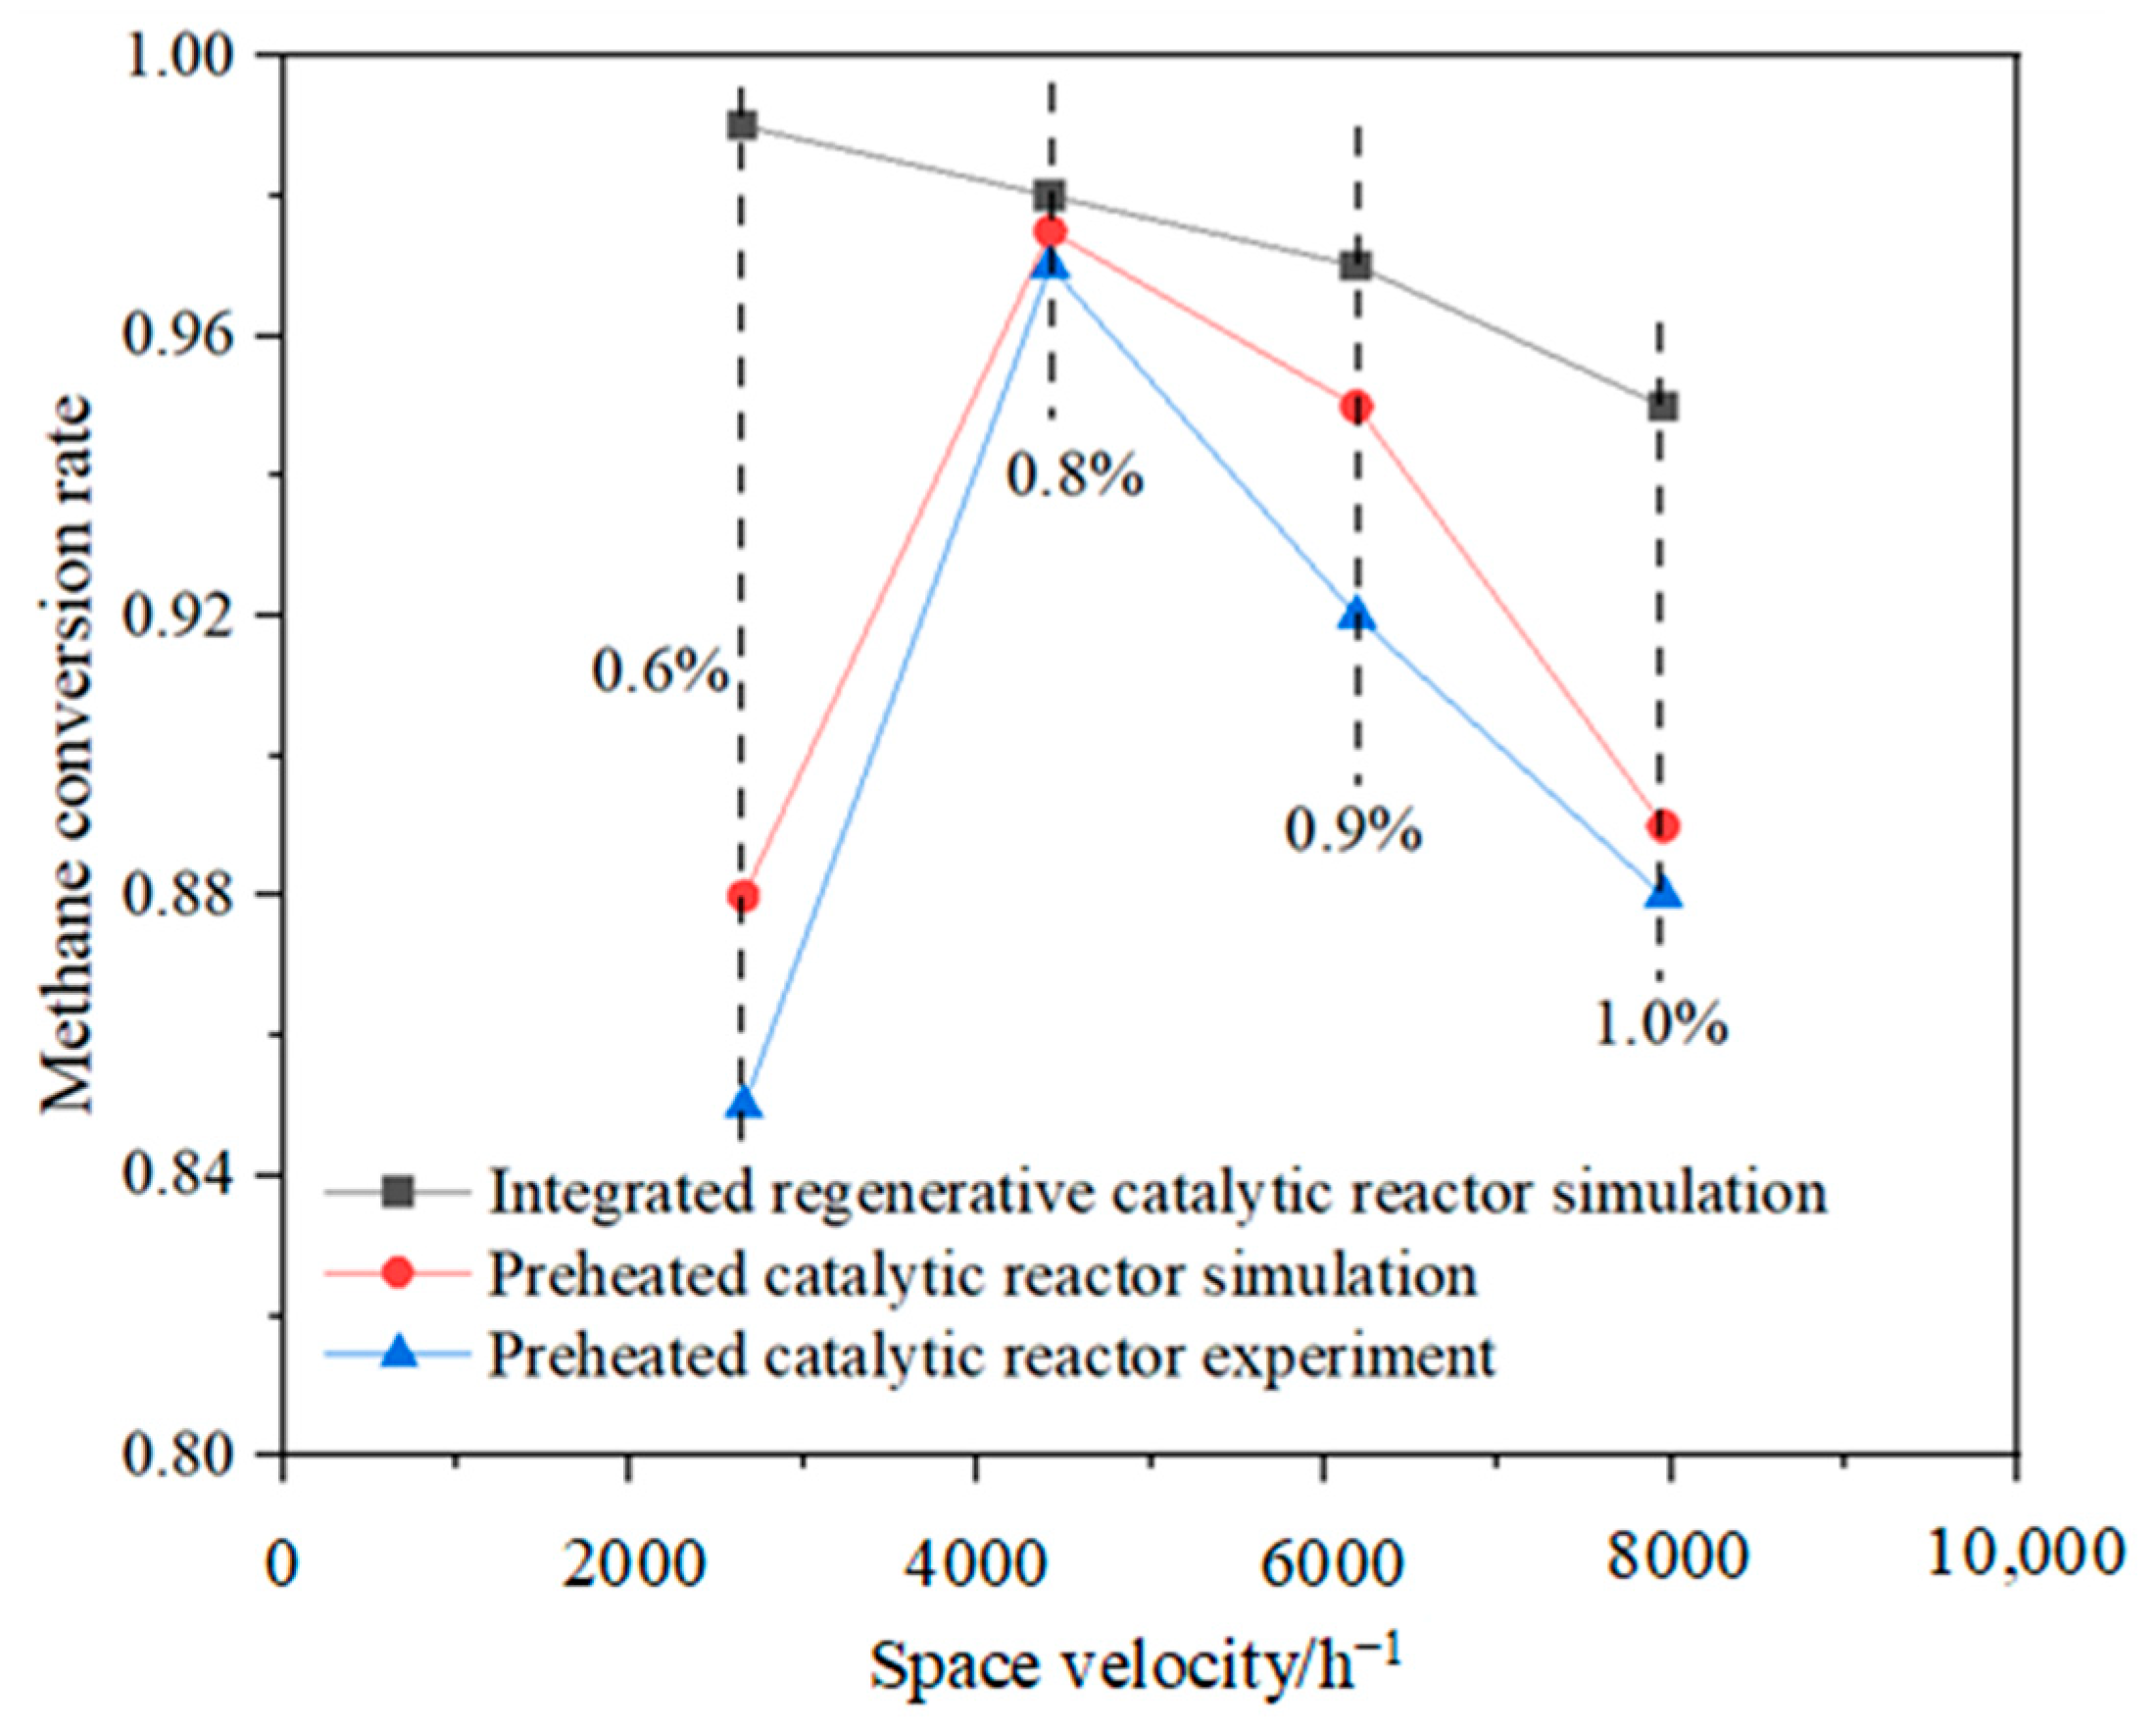
Figure 10 shows the methane conversion rate for two reactors with different intake methane concentrations and space velocities. The methane conversion efficiency is calculated as (1 − [CH4]out/[CH4]in) × 100%. The data indicate the integrated regenerative catalytic reactor demonstrates superior methane conversion rates across all space velocities compared with the preheated catalytic reactor. This performance advantage stems from its efficient internal heat recirculation, which minimizes thermal losses and maintains higher reaction zone temperatures, thereby enhancing combustion efficiency. For the preheated reactor, while the simulation and experimental data follow identical trends with peaking around 4000 h−1, the experimental values are consistently lower. This deviation arises because the simulation assumes ideal adiabatic conditions, whereas practical experiments incur unavoidable heat losses to the environment.

3.2. Transient Characteristics of the Self-Heating Maintenance State

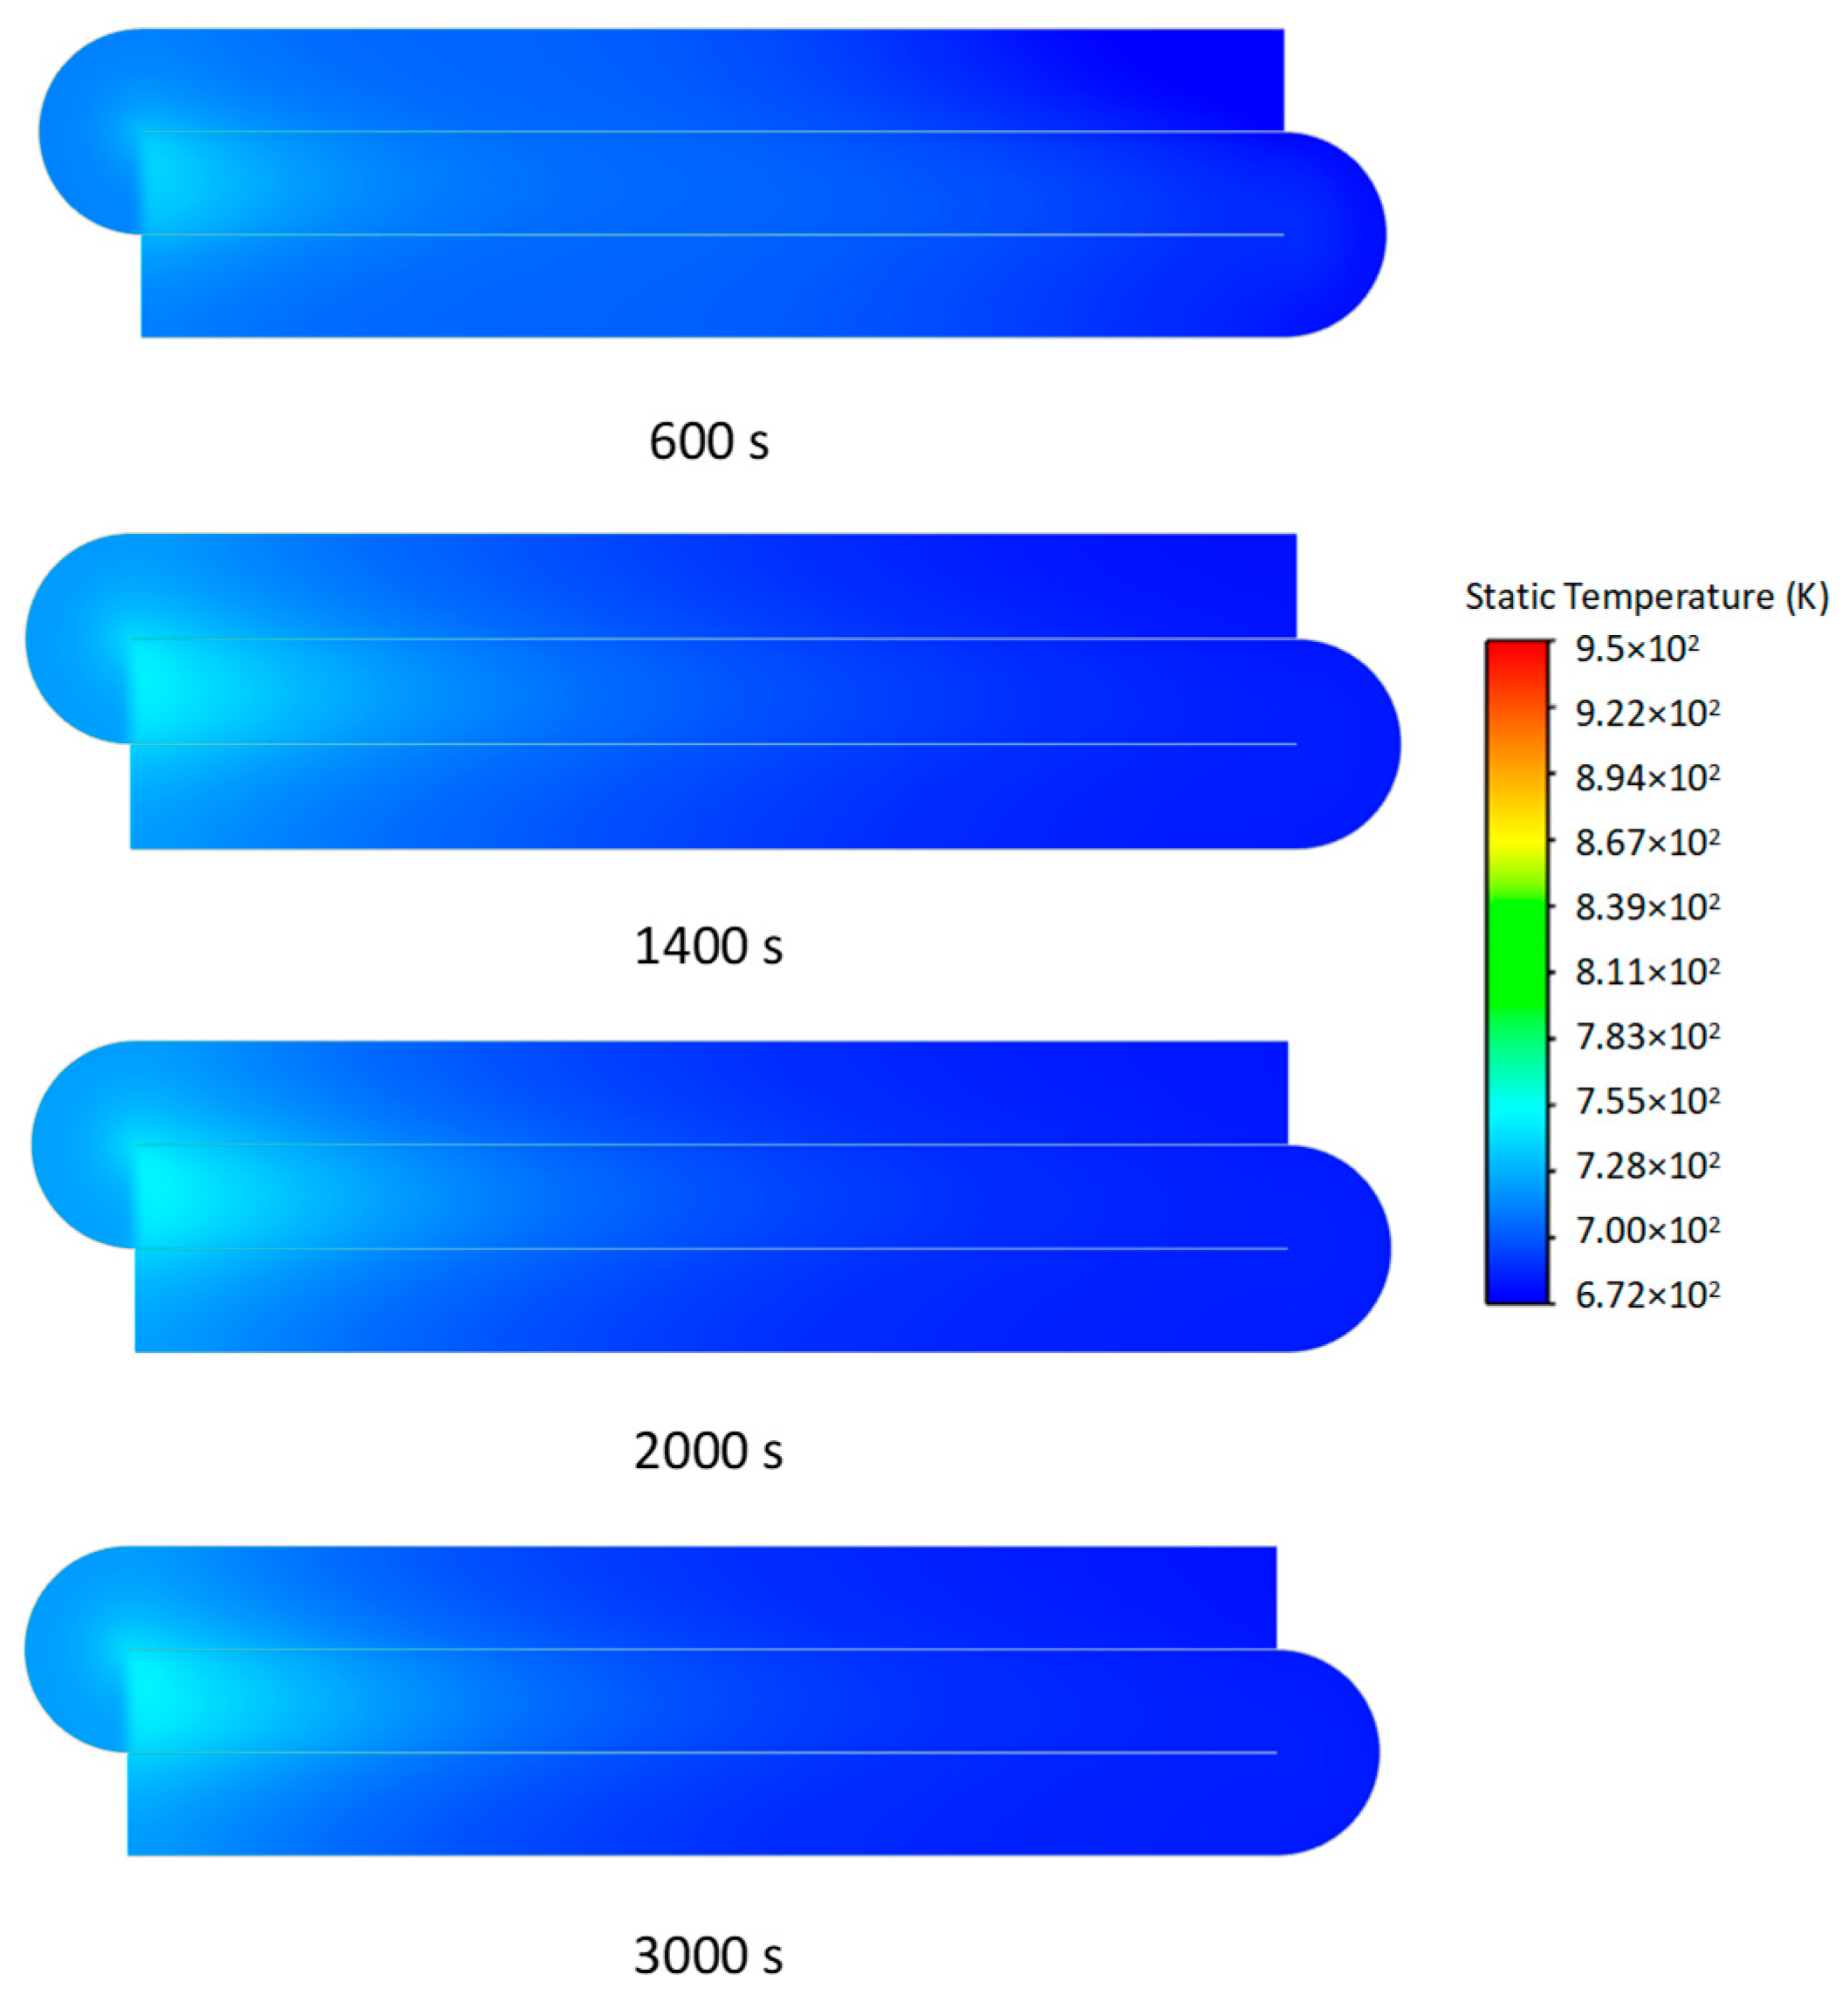
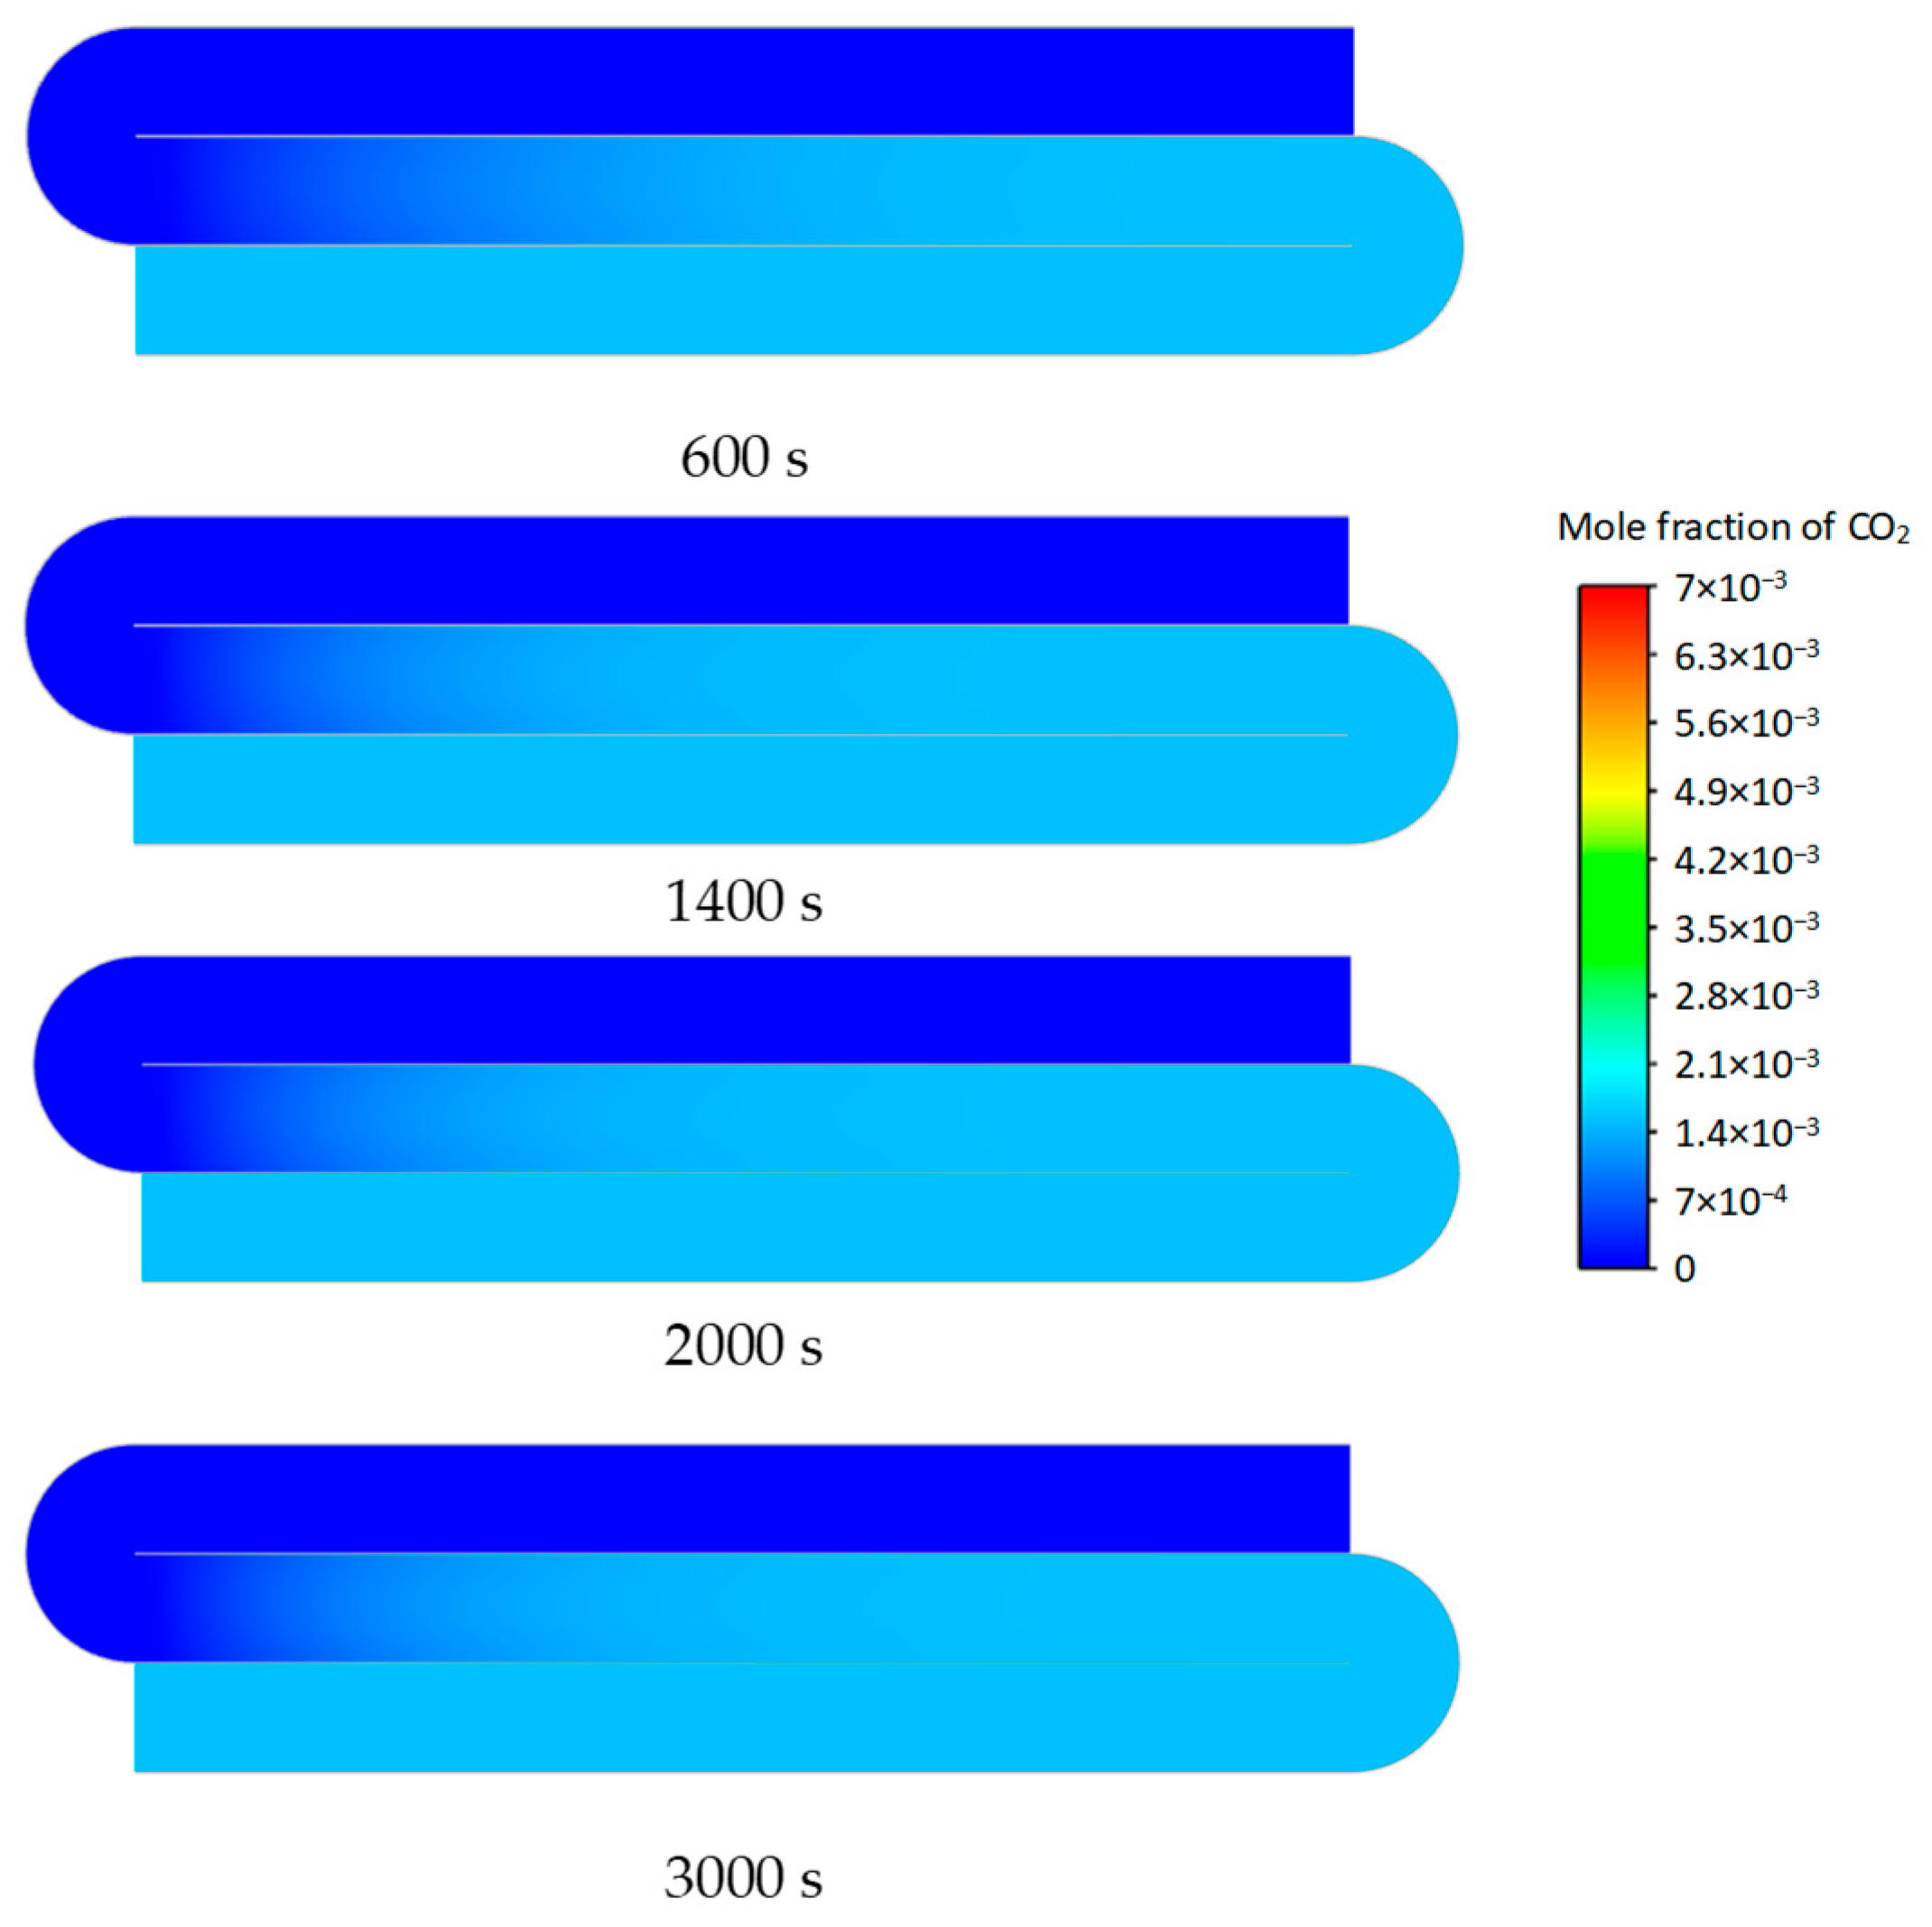
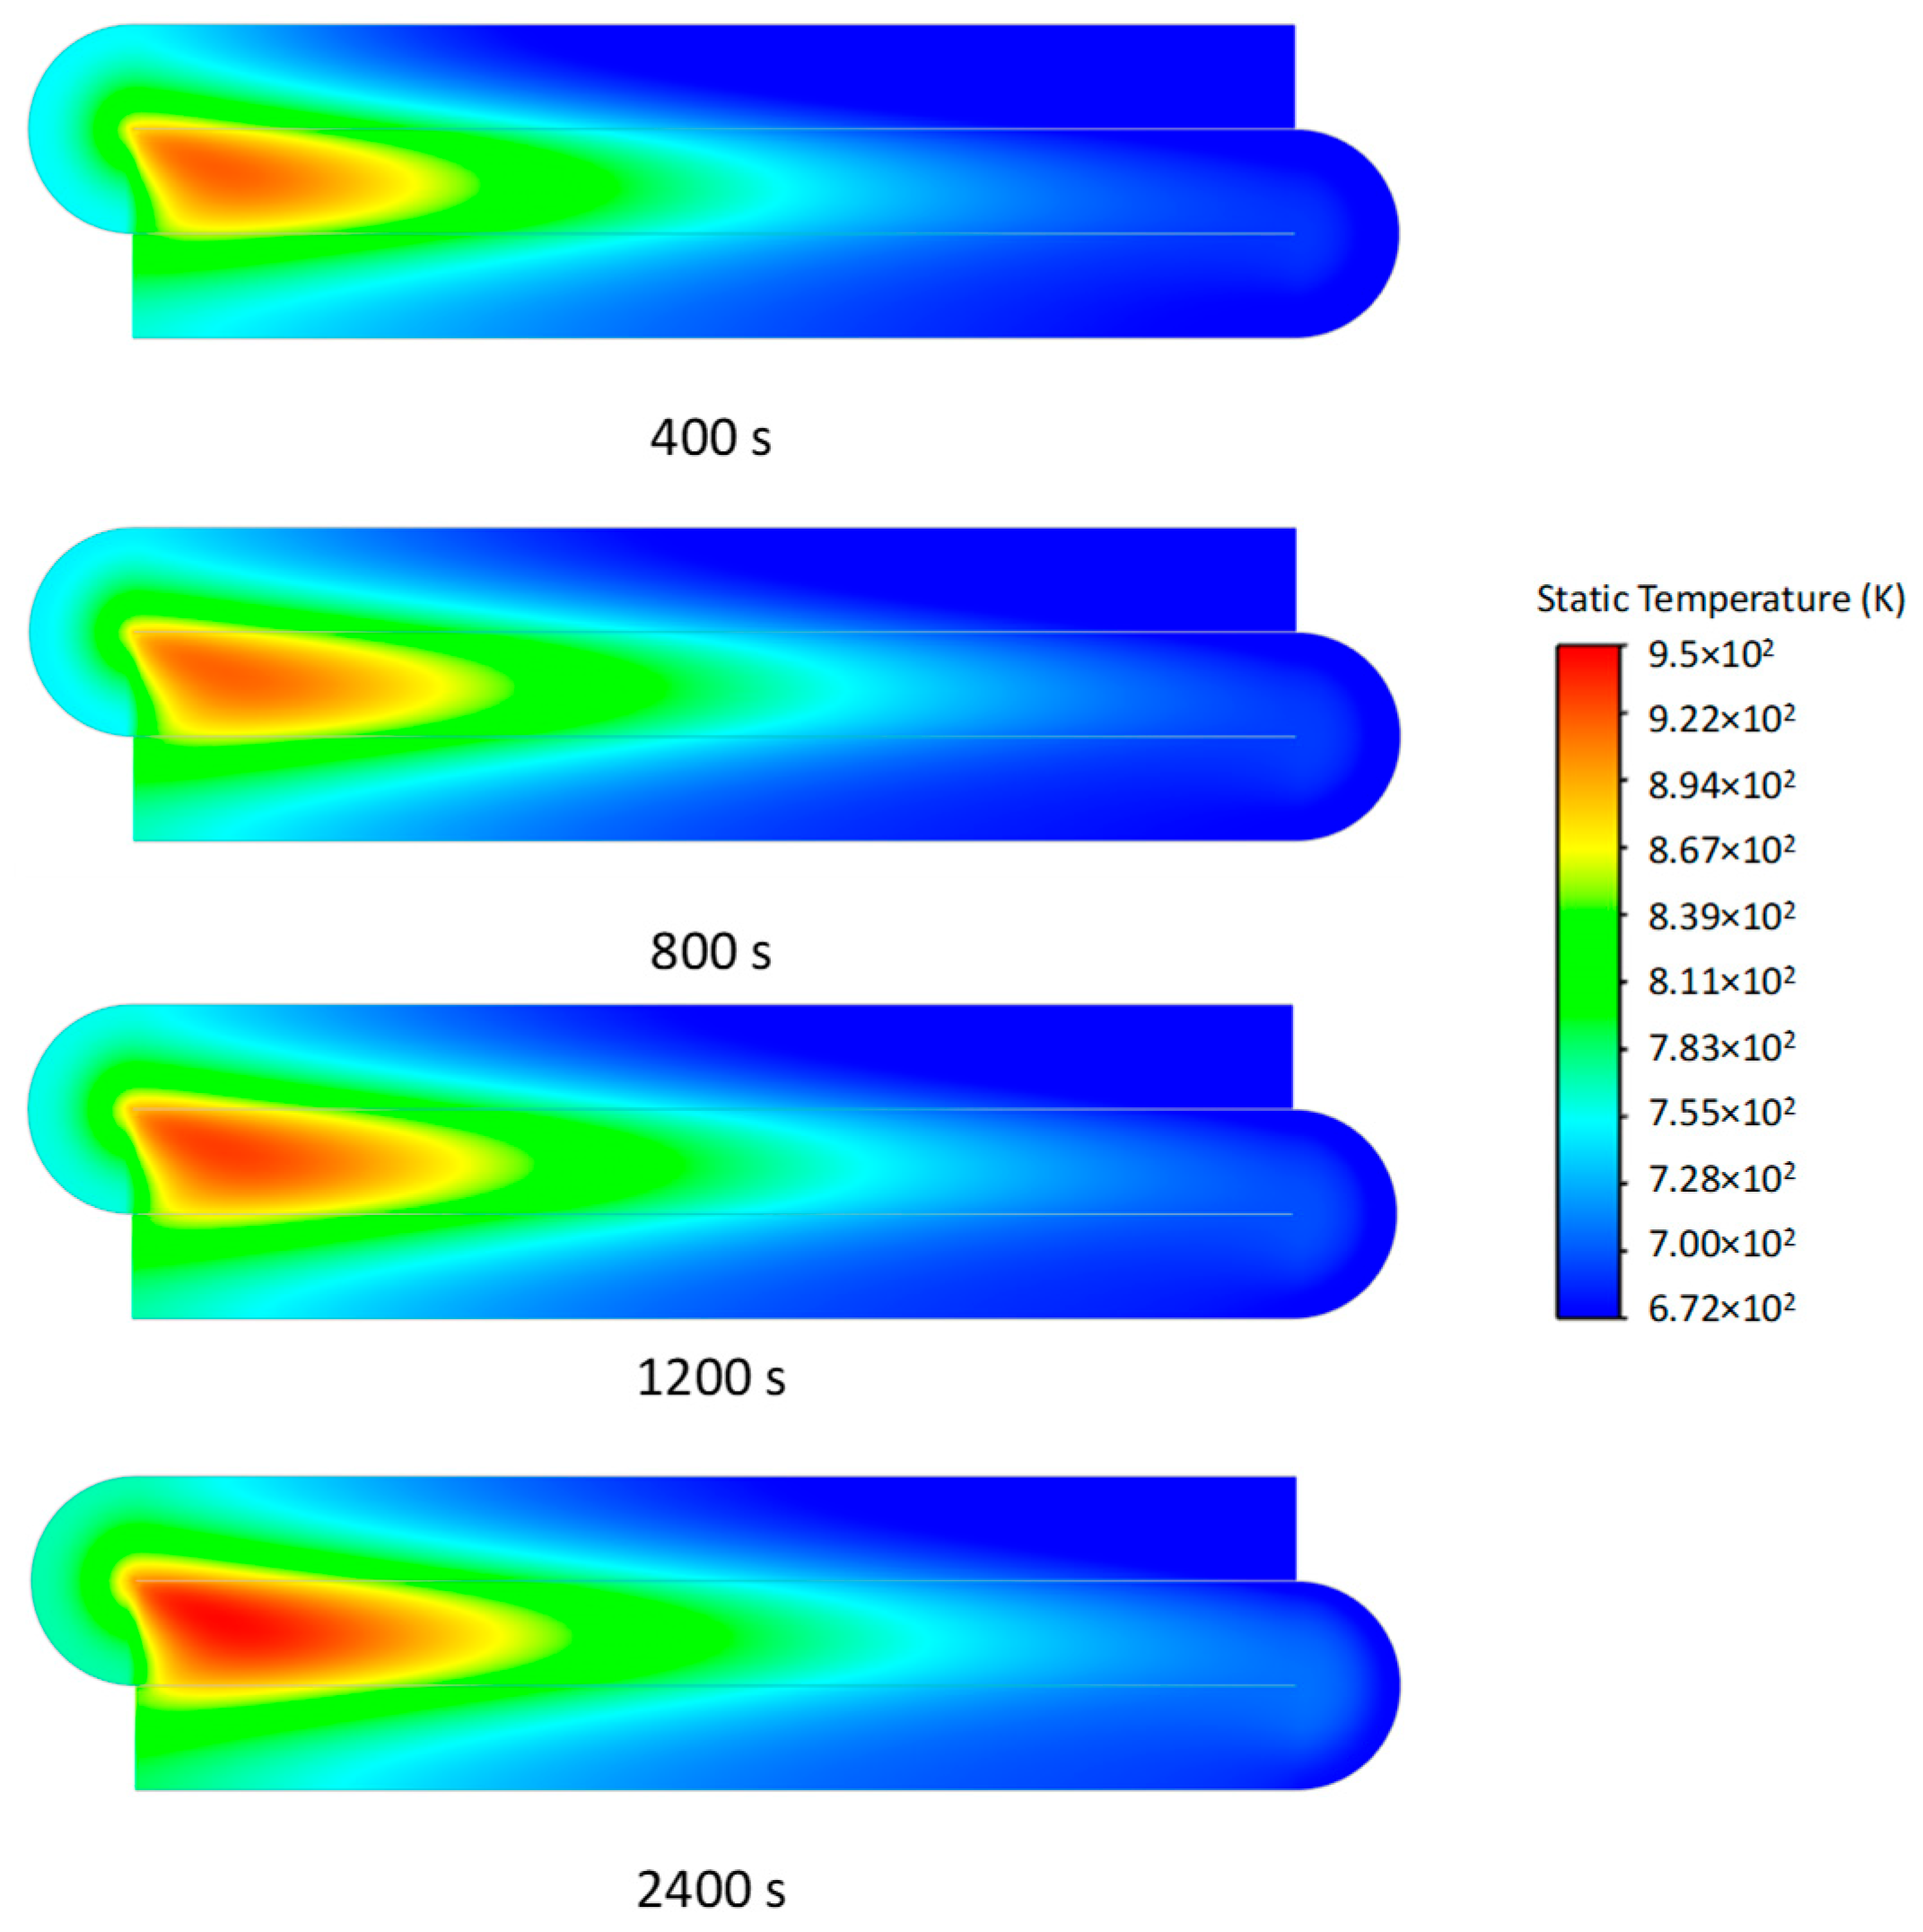
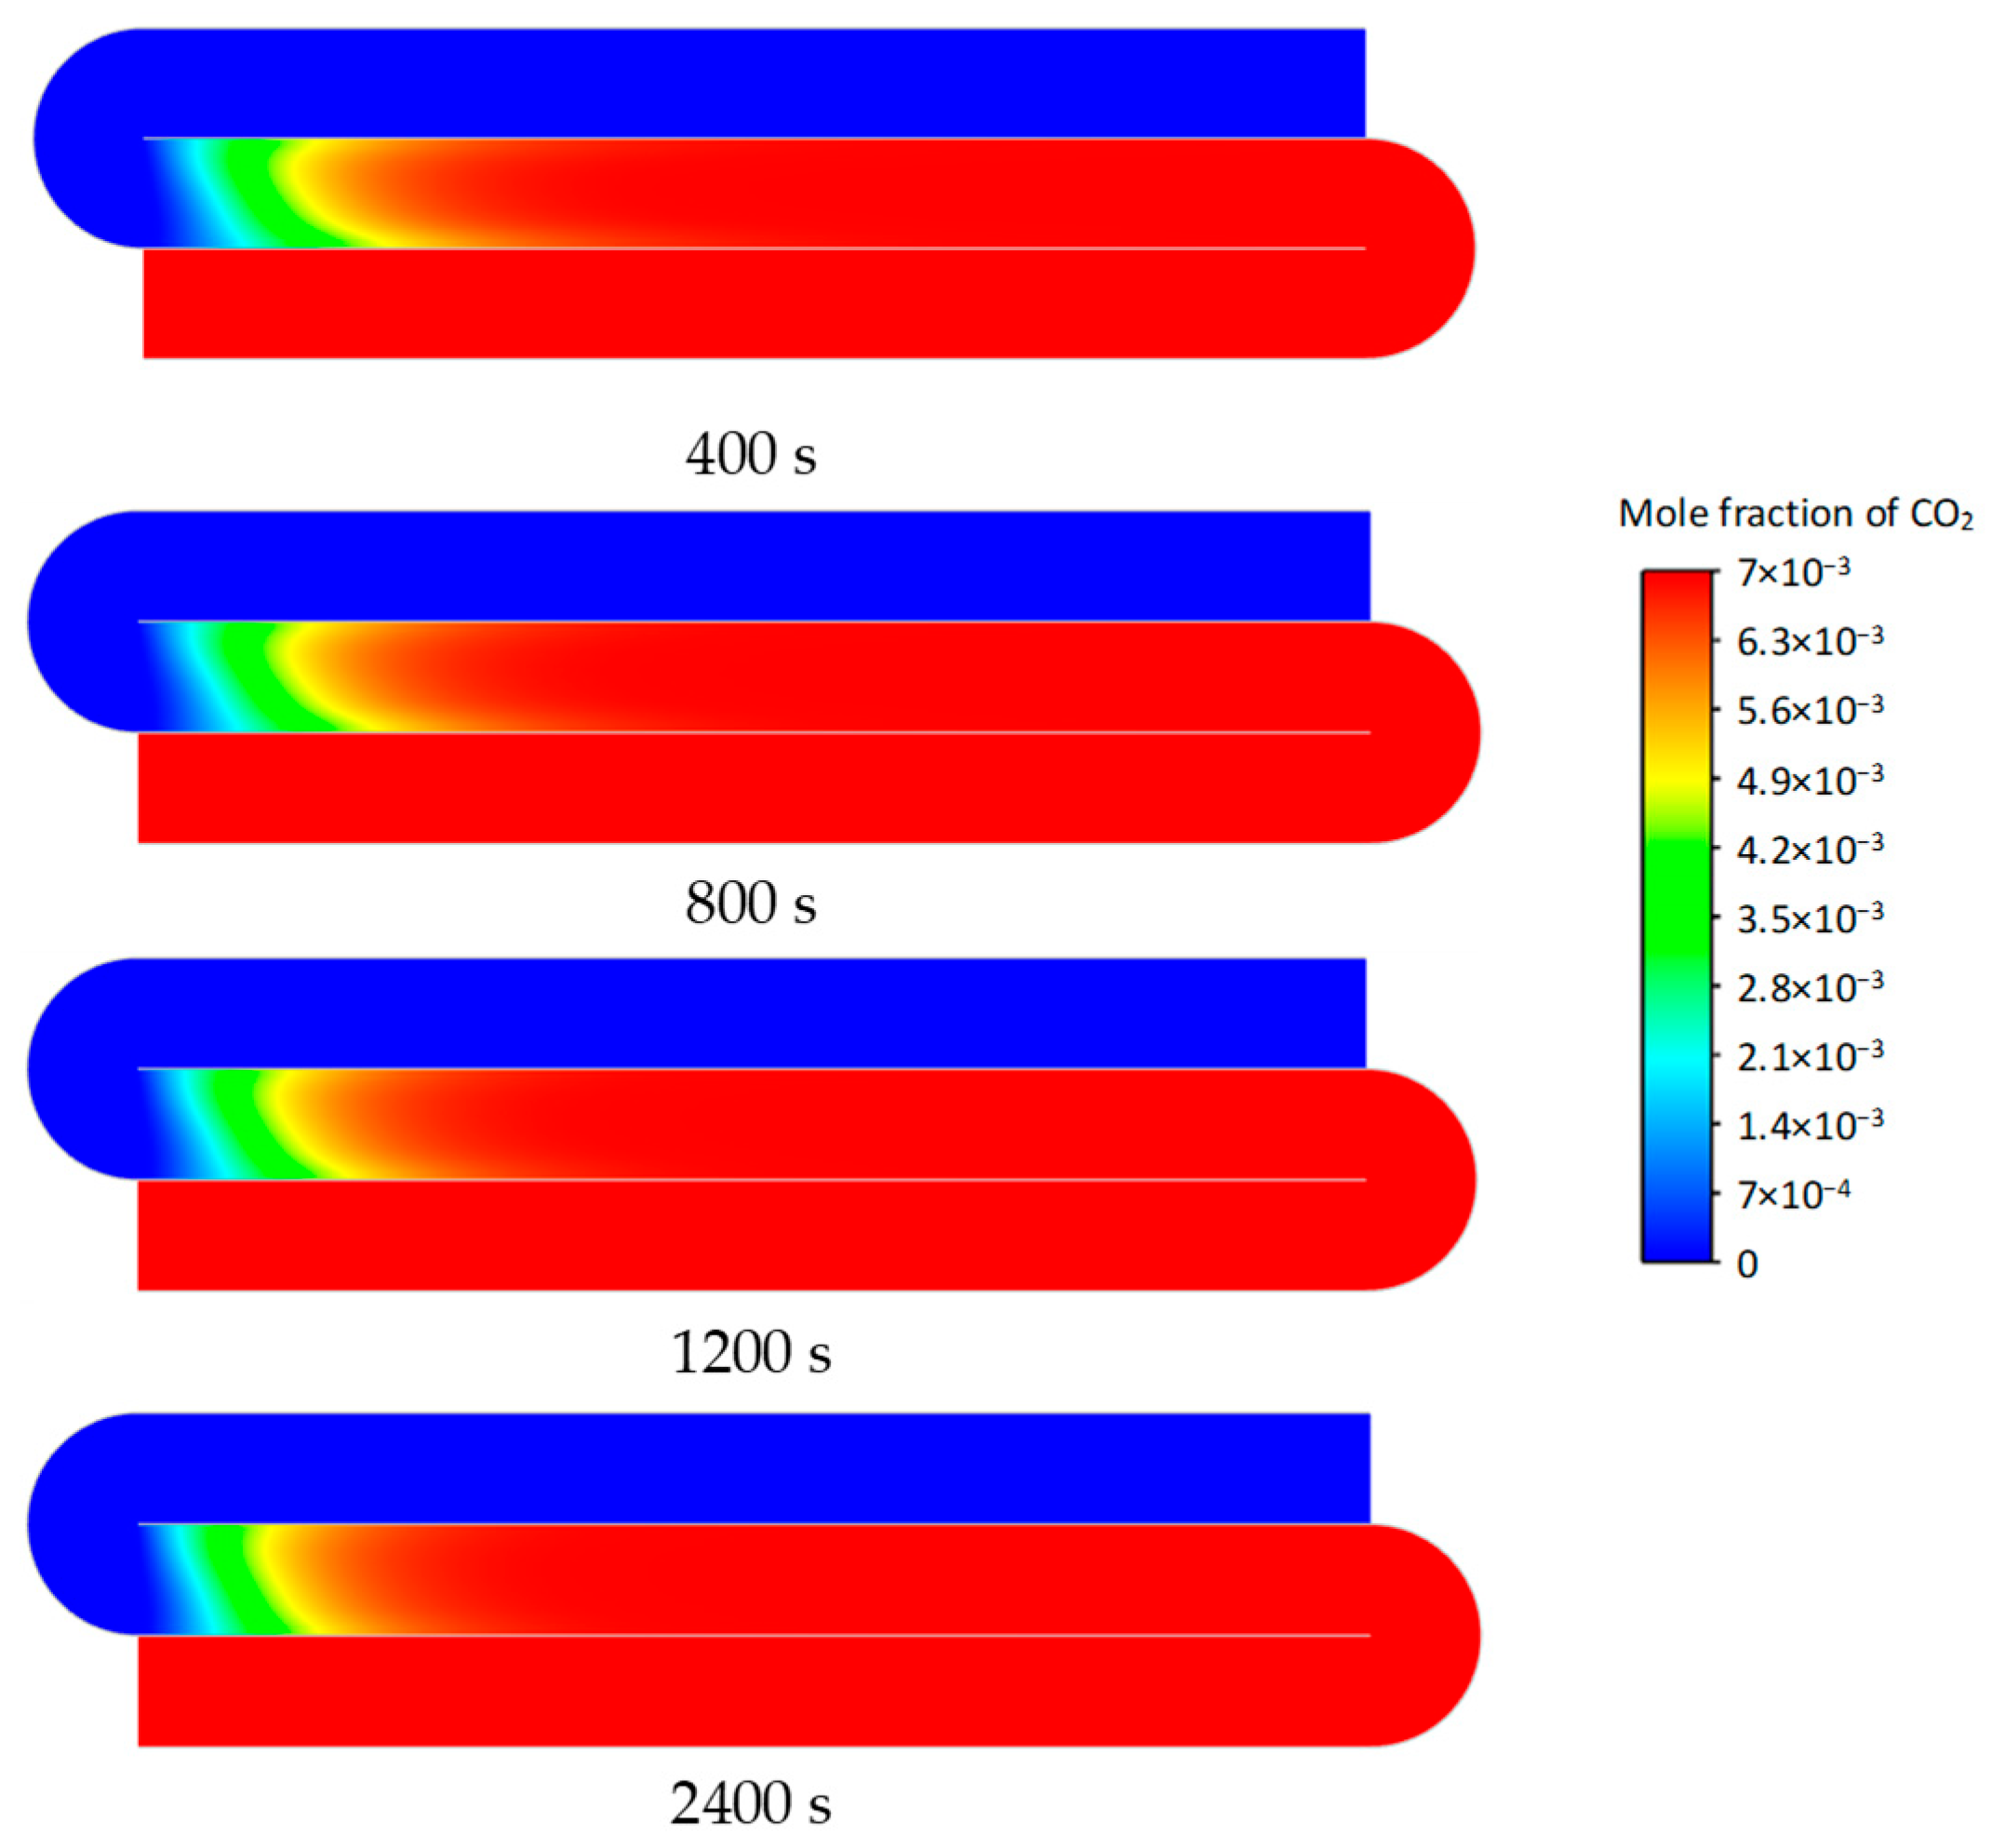
The temperature fields and CO2 distribution patterns across Figure 10, Figure 11, Figure 12, Figure 13, Figure 14, Figure 15, Figure 16 and Figure 17 demonstrate the spatiotemporal evolution of catalytic oxidation in an integrated reactor under varying space velocities and methane concentrations. The range of space velocity variation is 2653–7958 h−1, and the range of methane concentration is 0.16–0.7 vol.%. During the numerical simulation, the relationship between the reactor intake temperature and exhaust temperature is established from Equations (13)–(16). All operating conditions can ultimately reach a self-heating maintenance state.
Figure 11 shows the temperature contour of the integrated regenerative catalytic reactor at different times when the inlet air velocity is 2653 h−1 and the methane concentration is 0.16 vol.%. In the numerical simulation, the heat transfer efficiency of the preheater is calculated by Equation (13), and the initial mixture is preheated to 656 K. The time step for transient simulation is 0.1 s. Figure 11 shows the temperature contours of the reactor at times 600 s, 1400 s, 2000 s, and 3000 s. With the increase in time, the inlet temperature of the reactor gradually increases, and the overall temperature of the reactor gradually increases. Finally, the inlet temperature of the reactor no longer increases, and the temperature field of the reactor reaches a stable equilibrium state. At the equilibrium state, the inlet temperature of the reactor is 682 K and the outlet temperature is 729 K.
Figure 12 shows the carbon dioxide concentration contours of the integrated regenerative catalytic reactor under the same conditions at different times. The data indicate the proportion of methane converted to carbon dioxide in the reaction channel of the reactor gradually increases, and the concentration of carbon dioxide in the reaction channel increases with time, until methane is completely converted to carbon dioxide in the reaction channel. At the beginning, the length required for methane to convert to carbon dioxide is very long, but as the time increases from 600 s to 3000 s, the reaction area required for methane to convert to carbon dioxide becomes significantly shorter, and finally, the reaction length no longer changes.
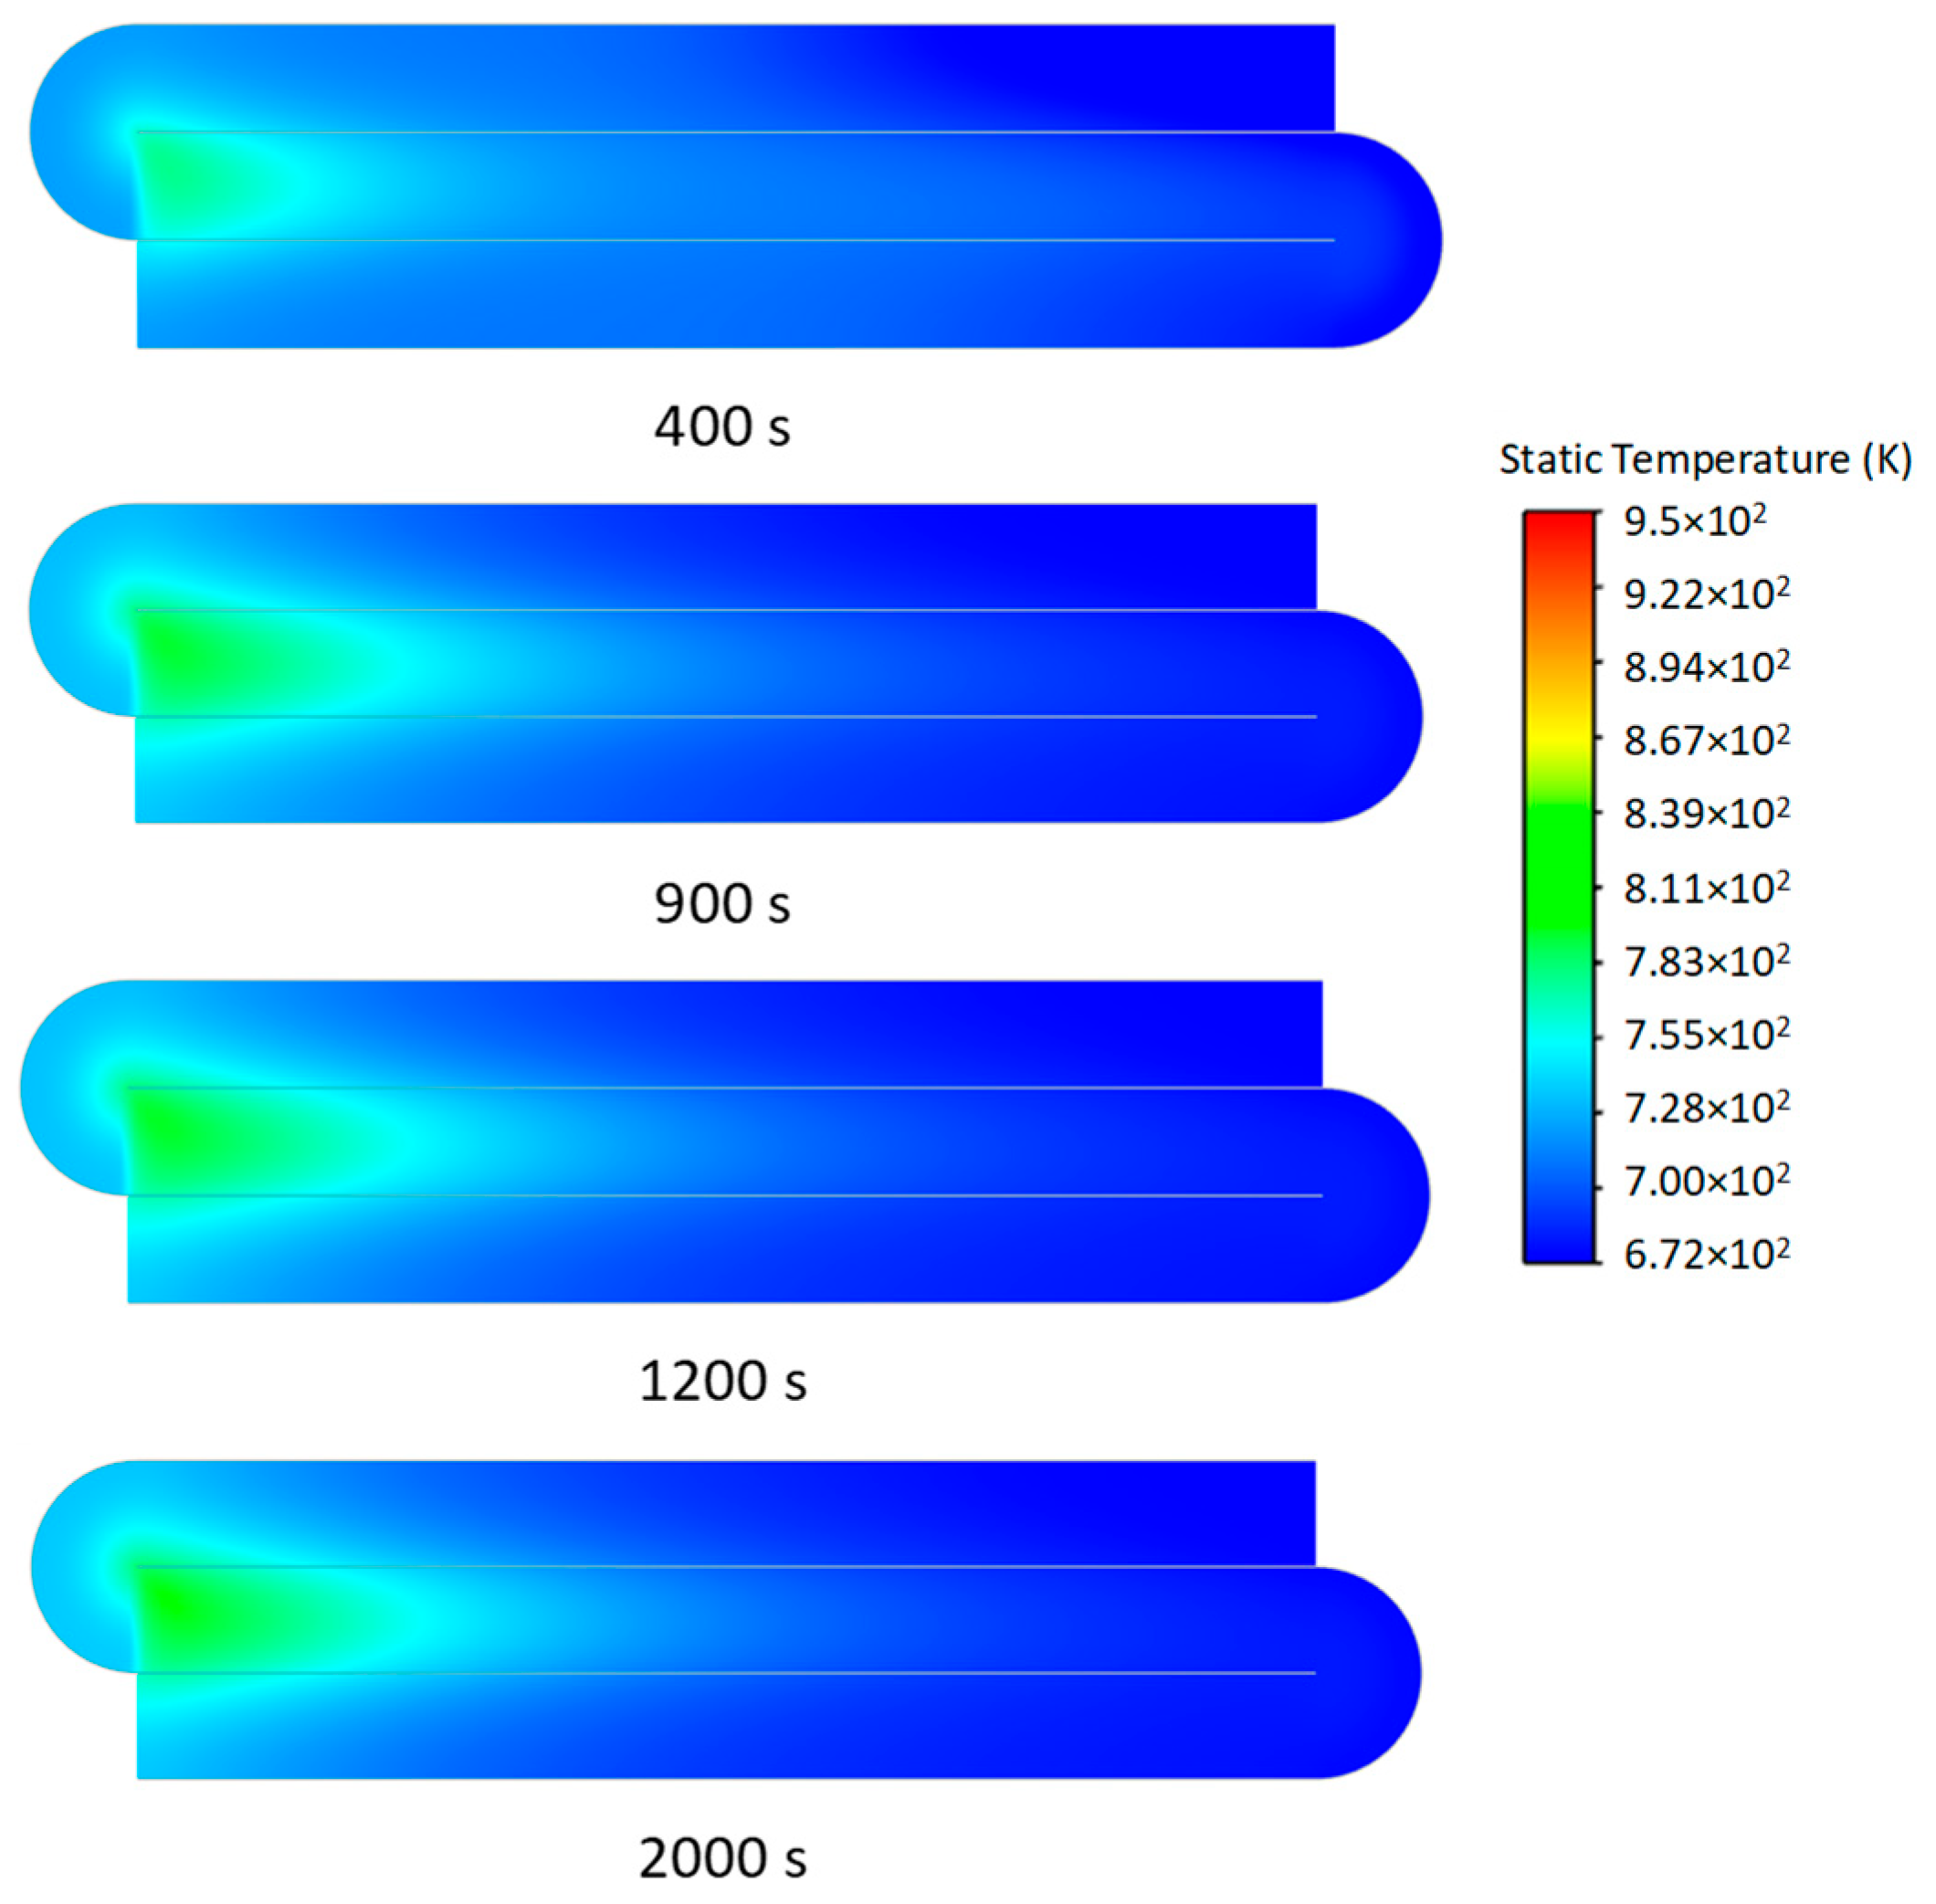
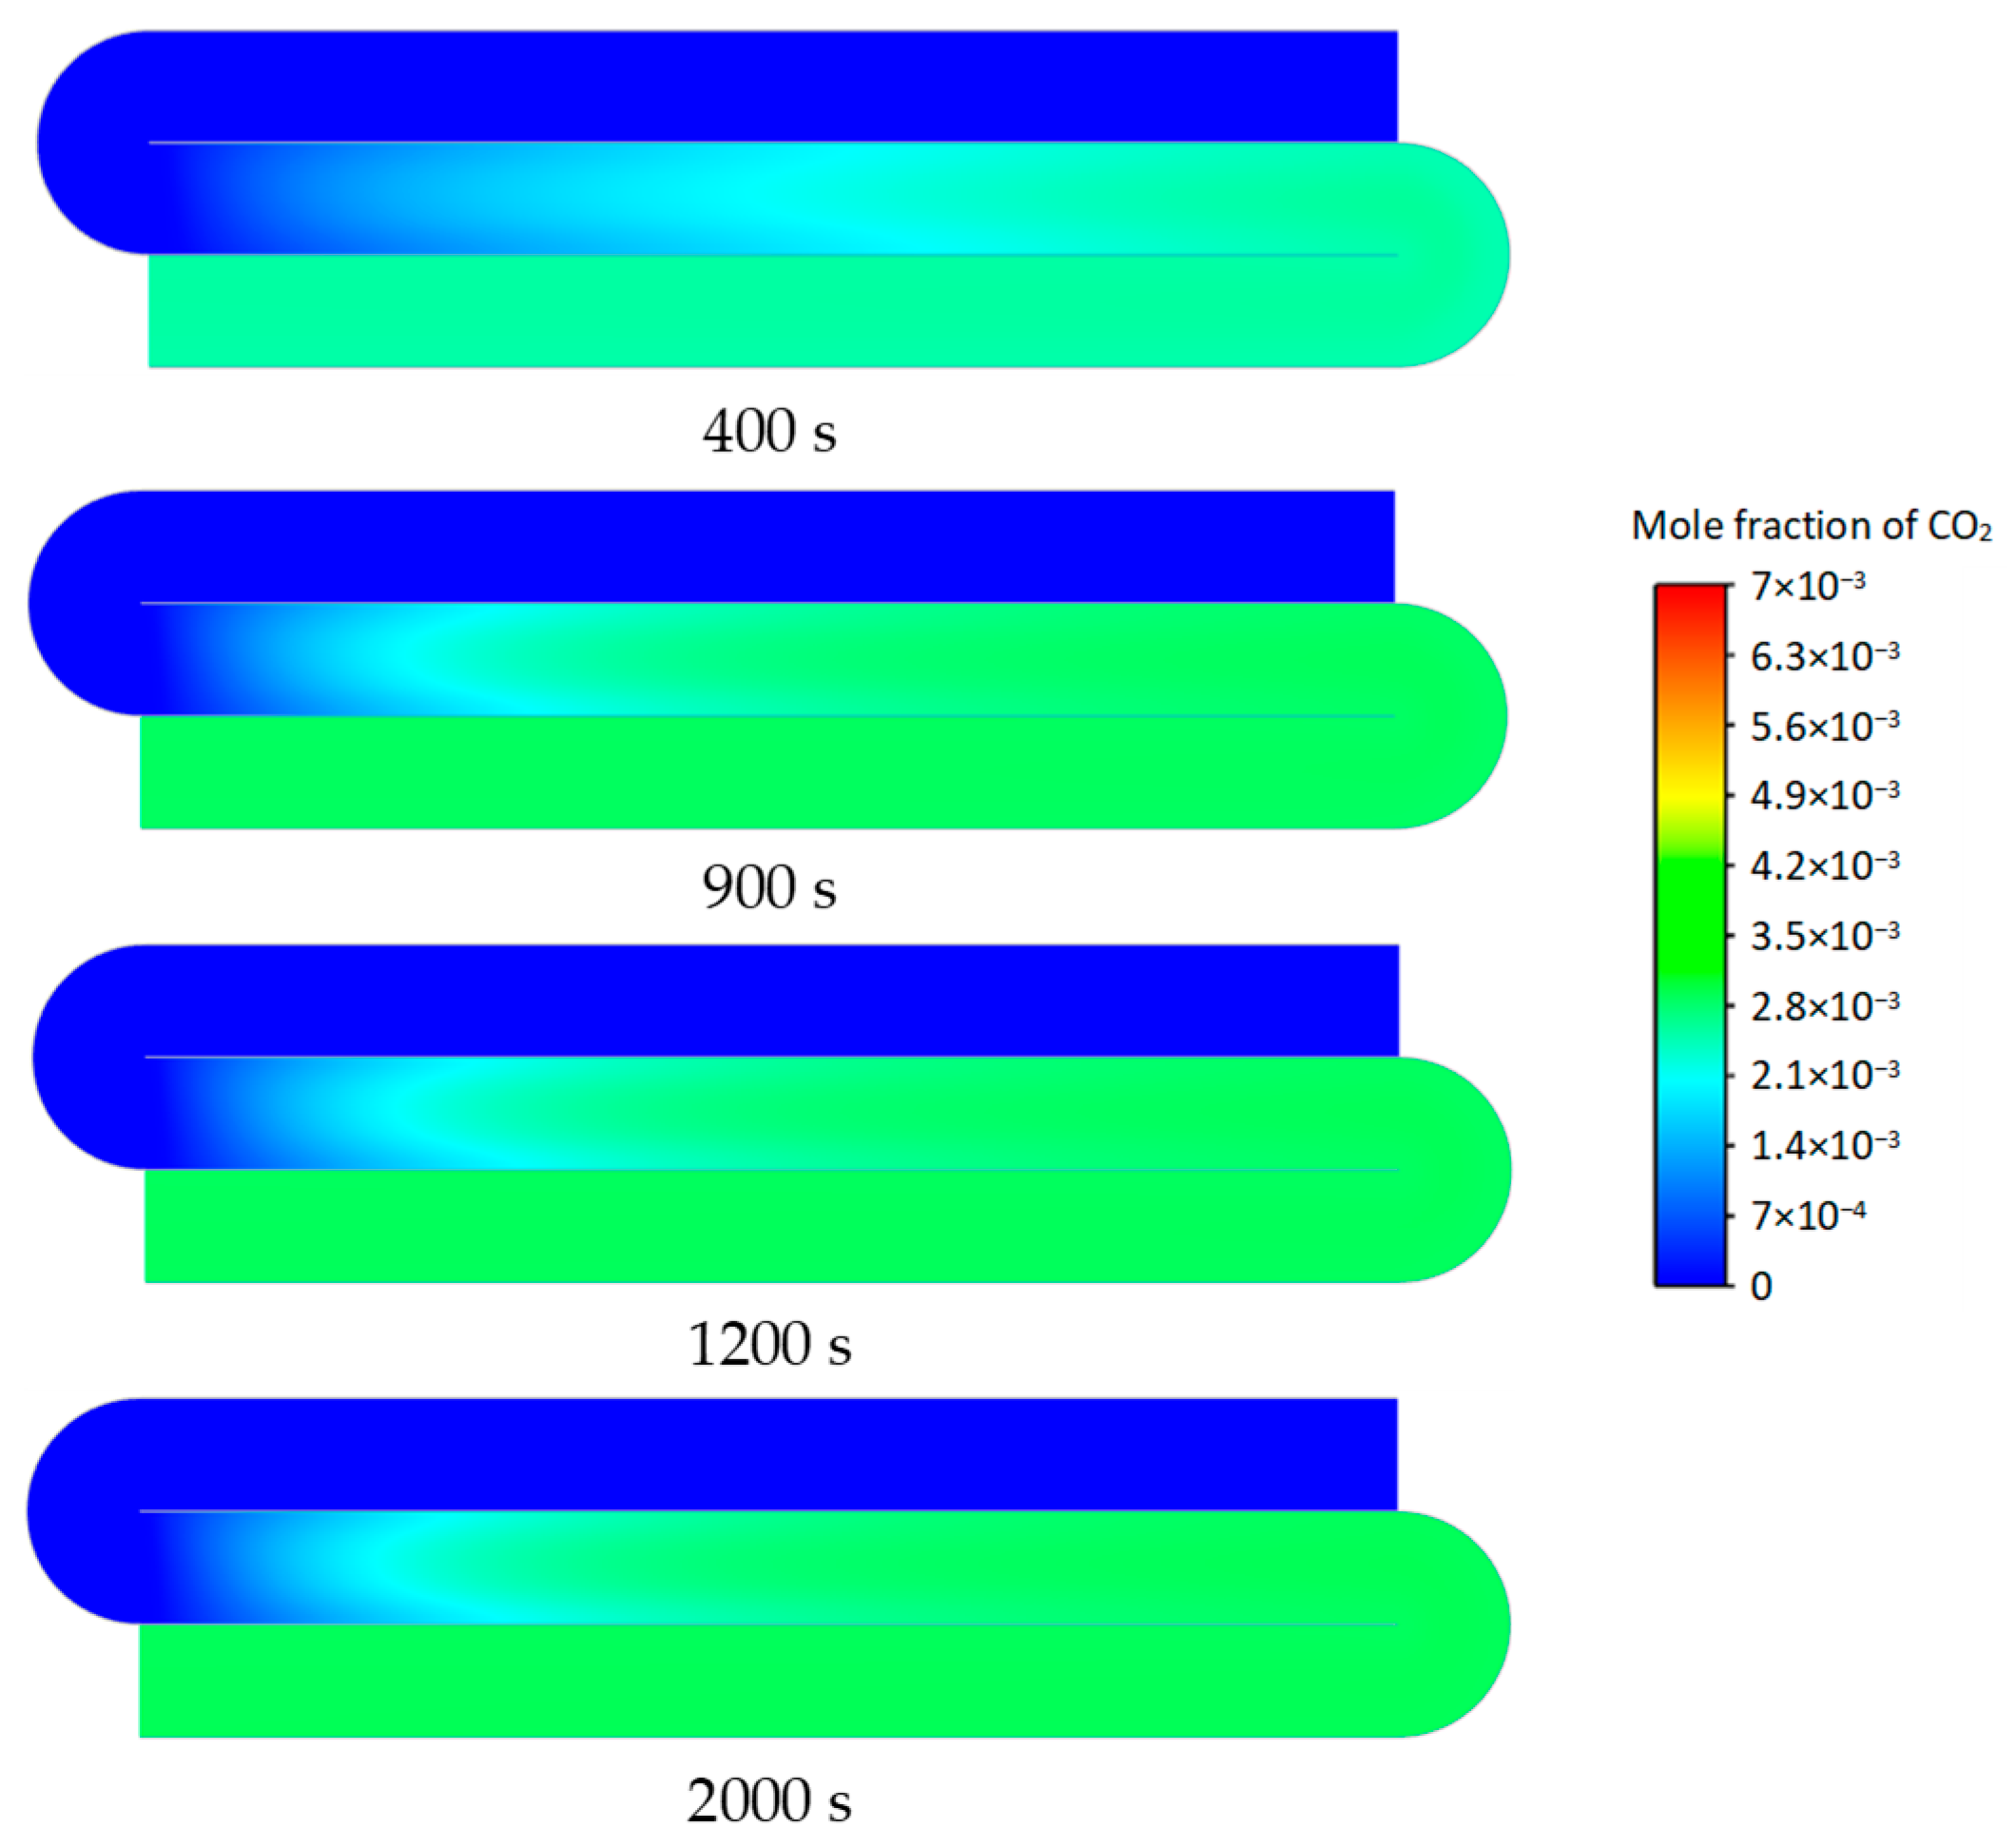
Figure 13 shows the temperature contours of the integrated regenerative catalytic reactor at different times when the space velocity is 4421 h−1 and the methane concentration is 0.3 vol.%. In the numerical simulation process, the heat transfer efficiency of the preheater is calculated by Equation (14), with an initial inlet temperature of 638 K and a transient simulation time step of 0.1 s. From Figure 13, the data indicate that at the 3000 s thermal equilibrium state, the inlet temperature of the reactor is 674 K and the exhaust temperature is 749 K. Figure 14 shows the carbon dioxide concentration contours of the integrated regenerative catalytic reactor at different times under the same conditions. The proportion of methane converted to carbon dioxide in the reactor reaction channel gradually increases with time, and the concentration of carbon dioxide in the reaction channel increases with time until methane is completely converted to carbon dioxide in the reaction channel.
Figure 15 shows the temperature contours of the integrated regenerative catalytic reactor at different times when the space velocity is 6198 h−1 and the methane concentration is 0.45 vol.%. In the numerical simulation process, the heat transfer efficiency of the preheater is calculated by Equation (15), with an initial intake temperature of 623 K and a transient simulation time step of 0.1 s. As can be seen from the figure, the high-temperature zone in the front section of the reaction channel becomes non-axisymmetric at higher space velocity, and the high-temperature center shifts downward. At 1200 s, the reactor reaches a basic equilibrium state with an inlet temperature of 659 K and an outlet temperature of 771 K. Figure 16 shows the carbon dioxide concentration contour of the integrated regenerative catalytic reactor under the same conditions at different times. The proportion of methane converted to carbon dioxide in the reaction channel is very low at 400 s. As time increases, the proportion of methane converted to carbon dioxide gradually increases until methane is completely converted to carbon dioxide in the reaction channel at 1200 s. In addition, the reaction front of the reaction channel also becomes significantly asymmetric at this higher velocity, and the reaction rate near the wall is noticeably slower than at the center, especially near the lower wall. Asymmetry arises from inlet-induced flow maldistribution, reducing reaction efficiency near the lower wall.
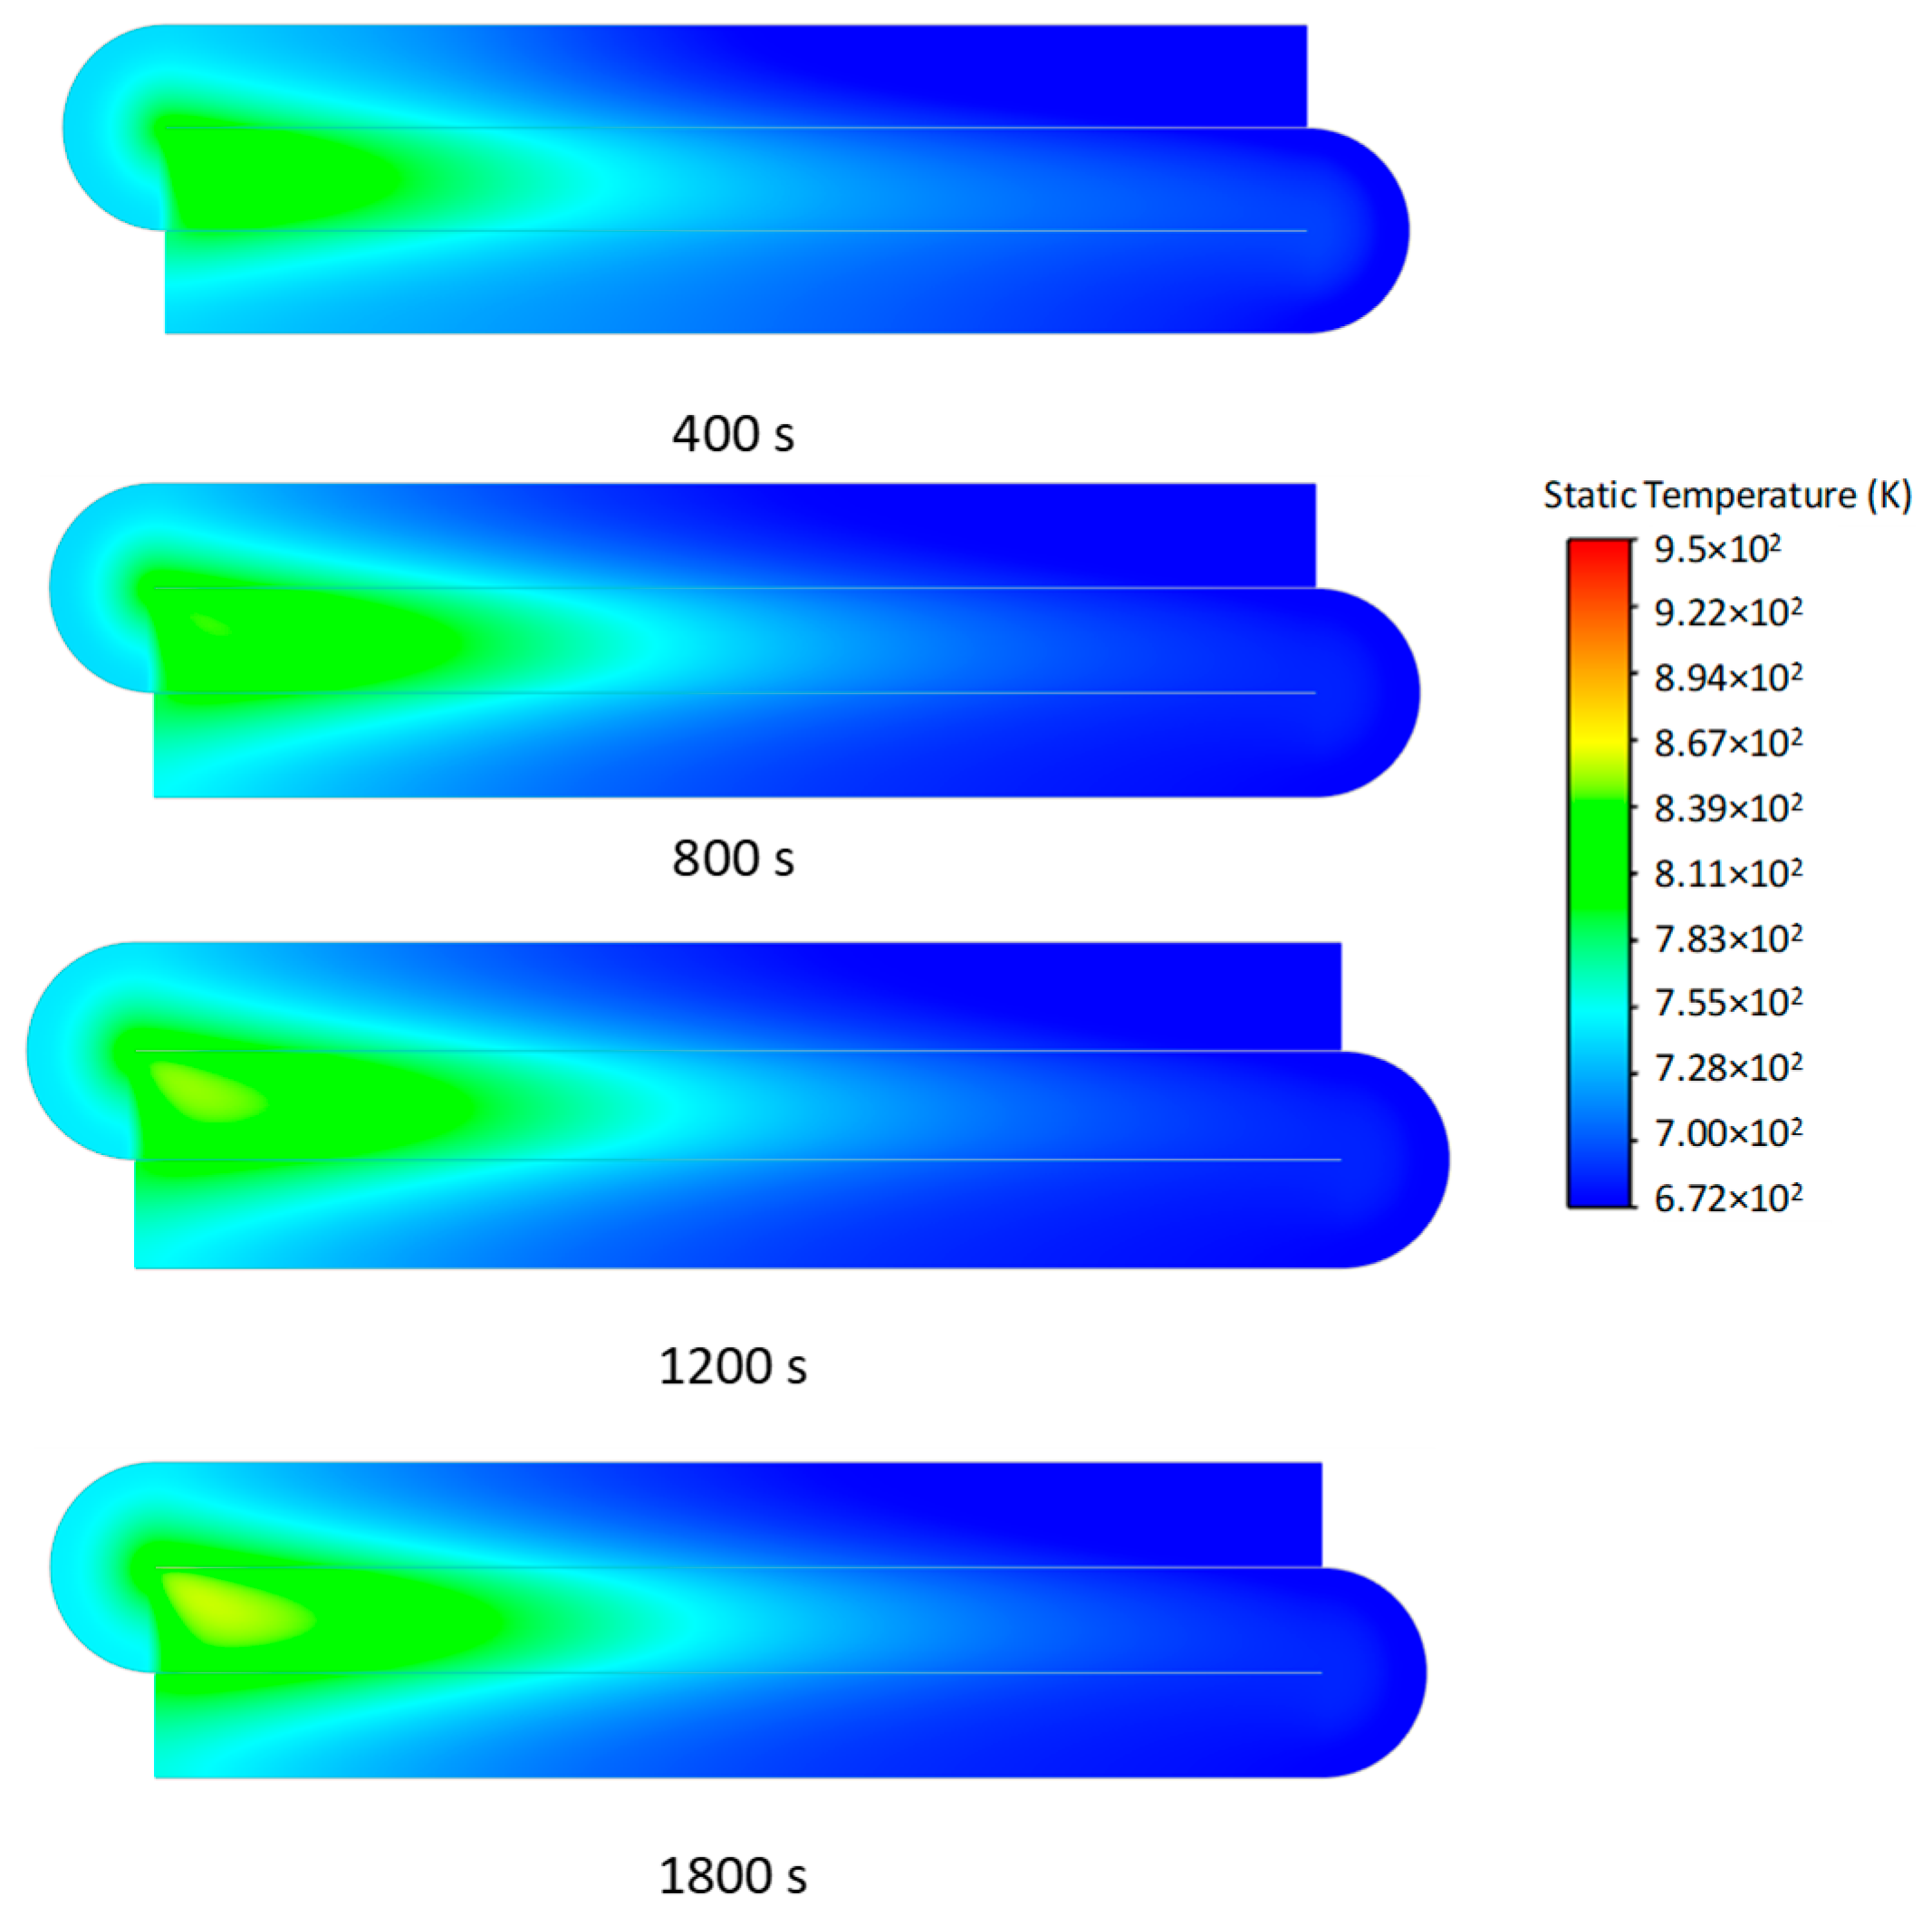
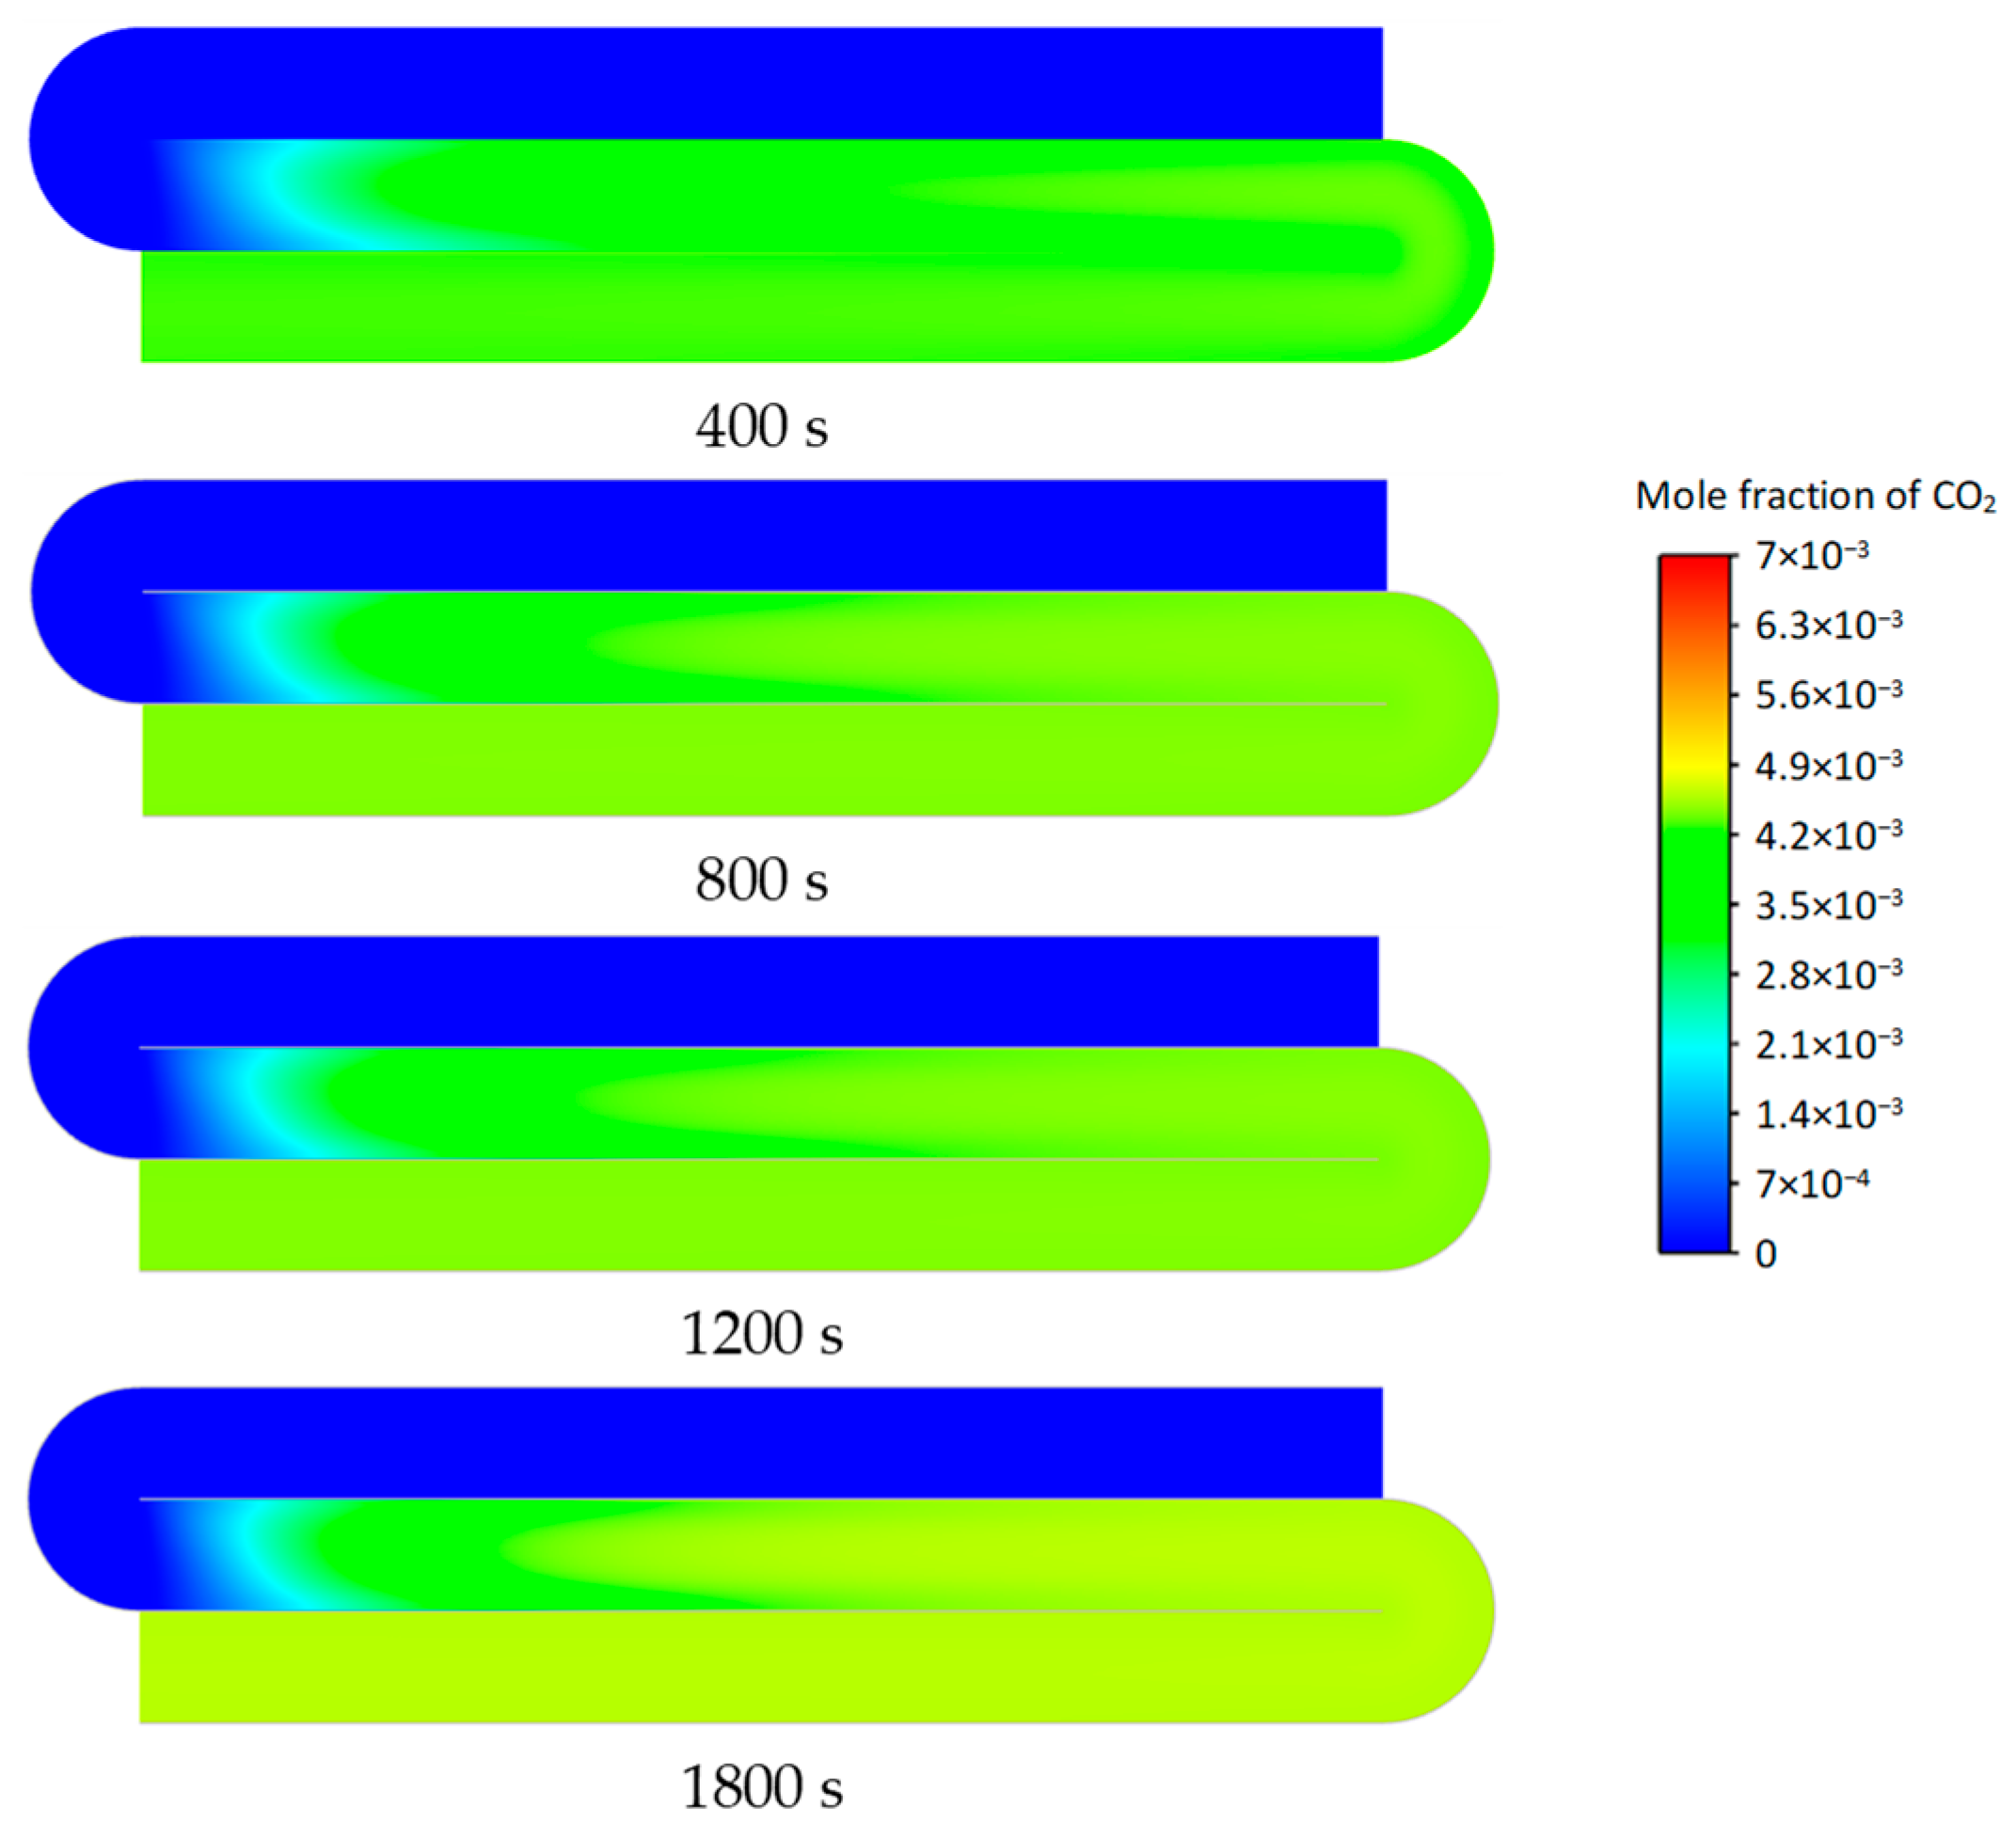
Figure 17 shows the temperature contours of the self-heating maintenance simulation of the integrated regenerative catalytic reactor at different times when the space velocity is 7958 h−1 and the methane concentration is 0.7 vol.%. In the numerical simulation process, the heat transfer efficiency of the preheater is calculated by Equation (16), with an initial inlet temperature of 600 K and a transient simulation time step of 0.1 s. As shown in the figure, the reactor basically reaches thermal equilibrium at 800 s, with an inlet temperature of 640 K and an exhaust temperature of 800 K. At this space velocity, the high-temperature zone at the front end of the reaction channel is further elongated axially and is not axisymmetric. Figure 18 shows the contours of carbon dioxide concentration at different times under the same conditions in a reheating catalytic integrated reactor. Methane is completely converted into carbon dioxide in the reaction channel at 800 s, and the conversion rate is greatly accelerated.
The methane concentration enabling self-sustained combustion in the integrated regenerative catalytic reactor decreases from 0.7 vol.% to 0.16 vol.% as space velocity reduces from 7958 h−1 to 2653 h−1 (Figure 11, Figure 12, Figure 13, Figure 14, Figure 15, Figure 16, Figure 17 and Figure 18). At low space velocities (≤4421 h−1), stable operation requires ≤0.3 vol.% CH4, while high space velocities (≥6189 h−1) demand ≥0.5 vol.% CH4. To achieve thermal equilibrium, low-concentration regimes (0.16–0.3 vol.%) require higher preheating temperatures (620–650 K) to initiate reactions; high-concentration regimes (0.5–0.7 vol.%) permit lower preheating (580–600 K), reducing energy input by 12–18%. Temperature contours reveal delayed inter-channel heat transfer: initial uniformity (Δt < 10 K) develops into >80 K axial gradients after 120 s (Figure 11). Concurrently, methane reaction length in the catalytic channel shortens from 1.2 m to 0.8 m within 180 s, stabilizing at 0.6 m (Figure 12), correlating with CO2 concentration saturation.

3.3. Effect of Methane Concentration on Self-Heating Maintenance Characteristics

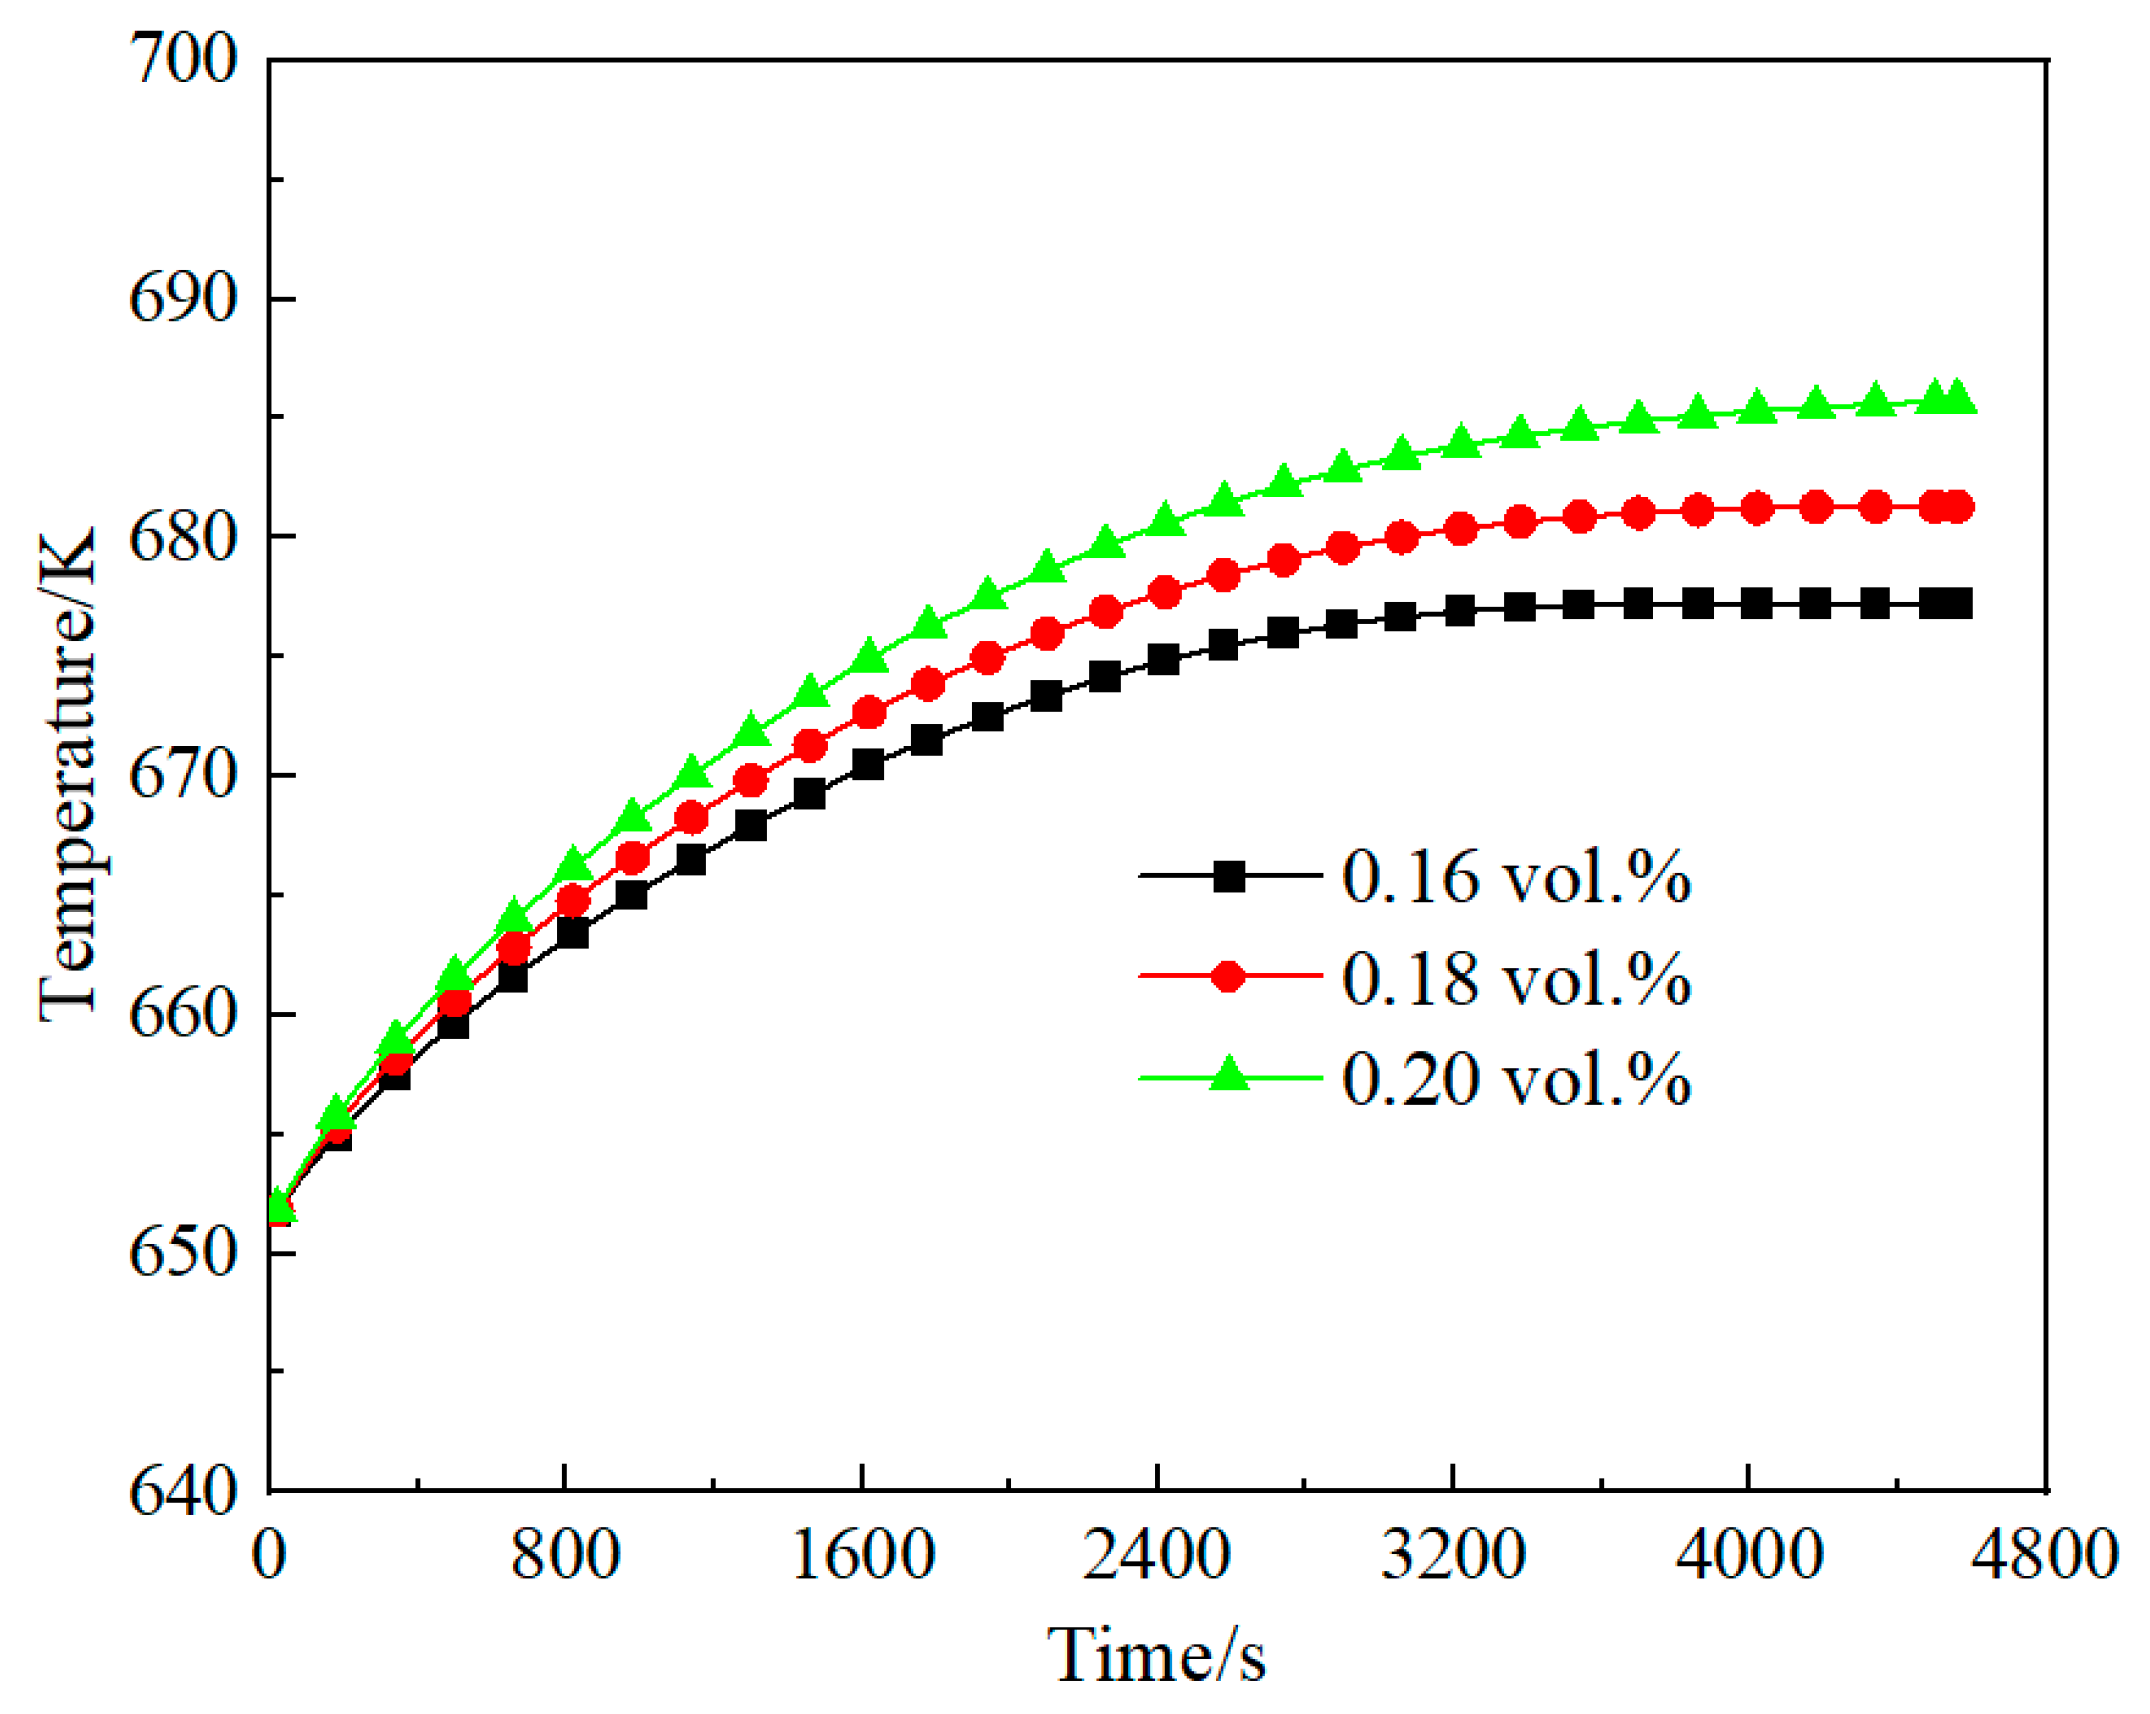
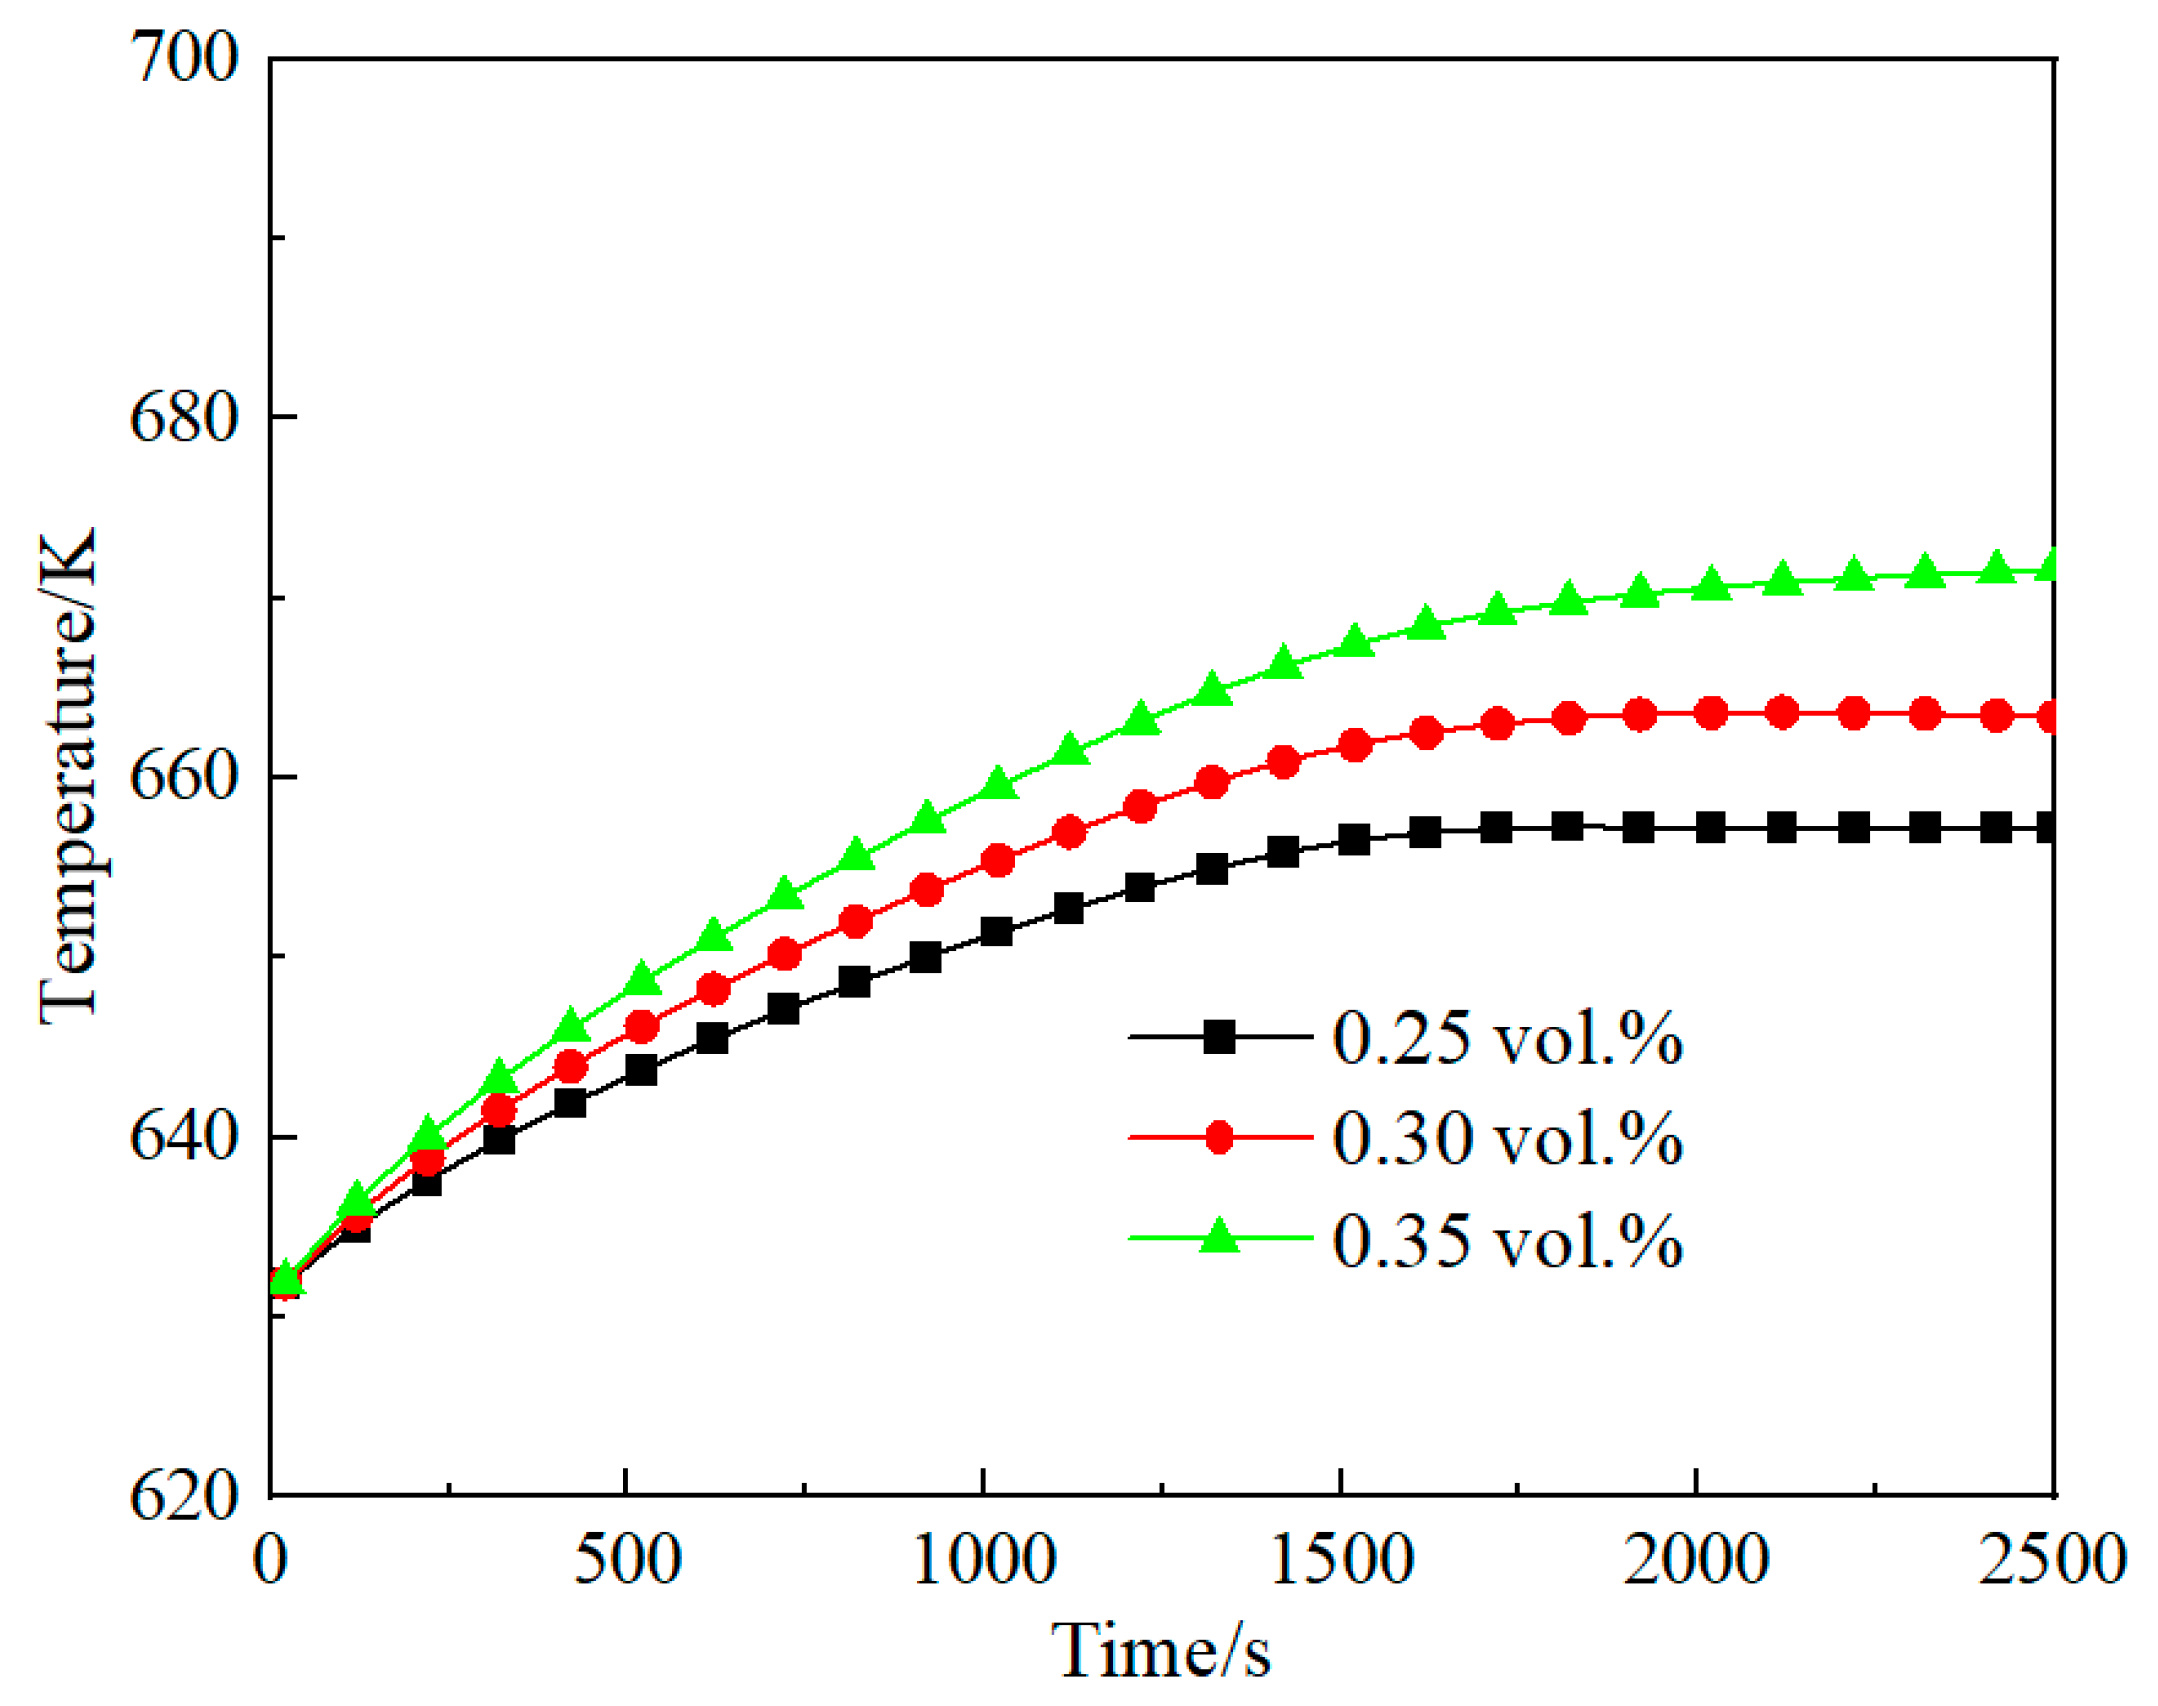
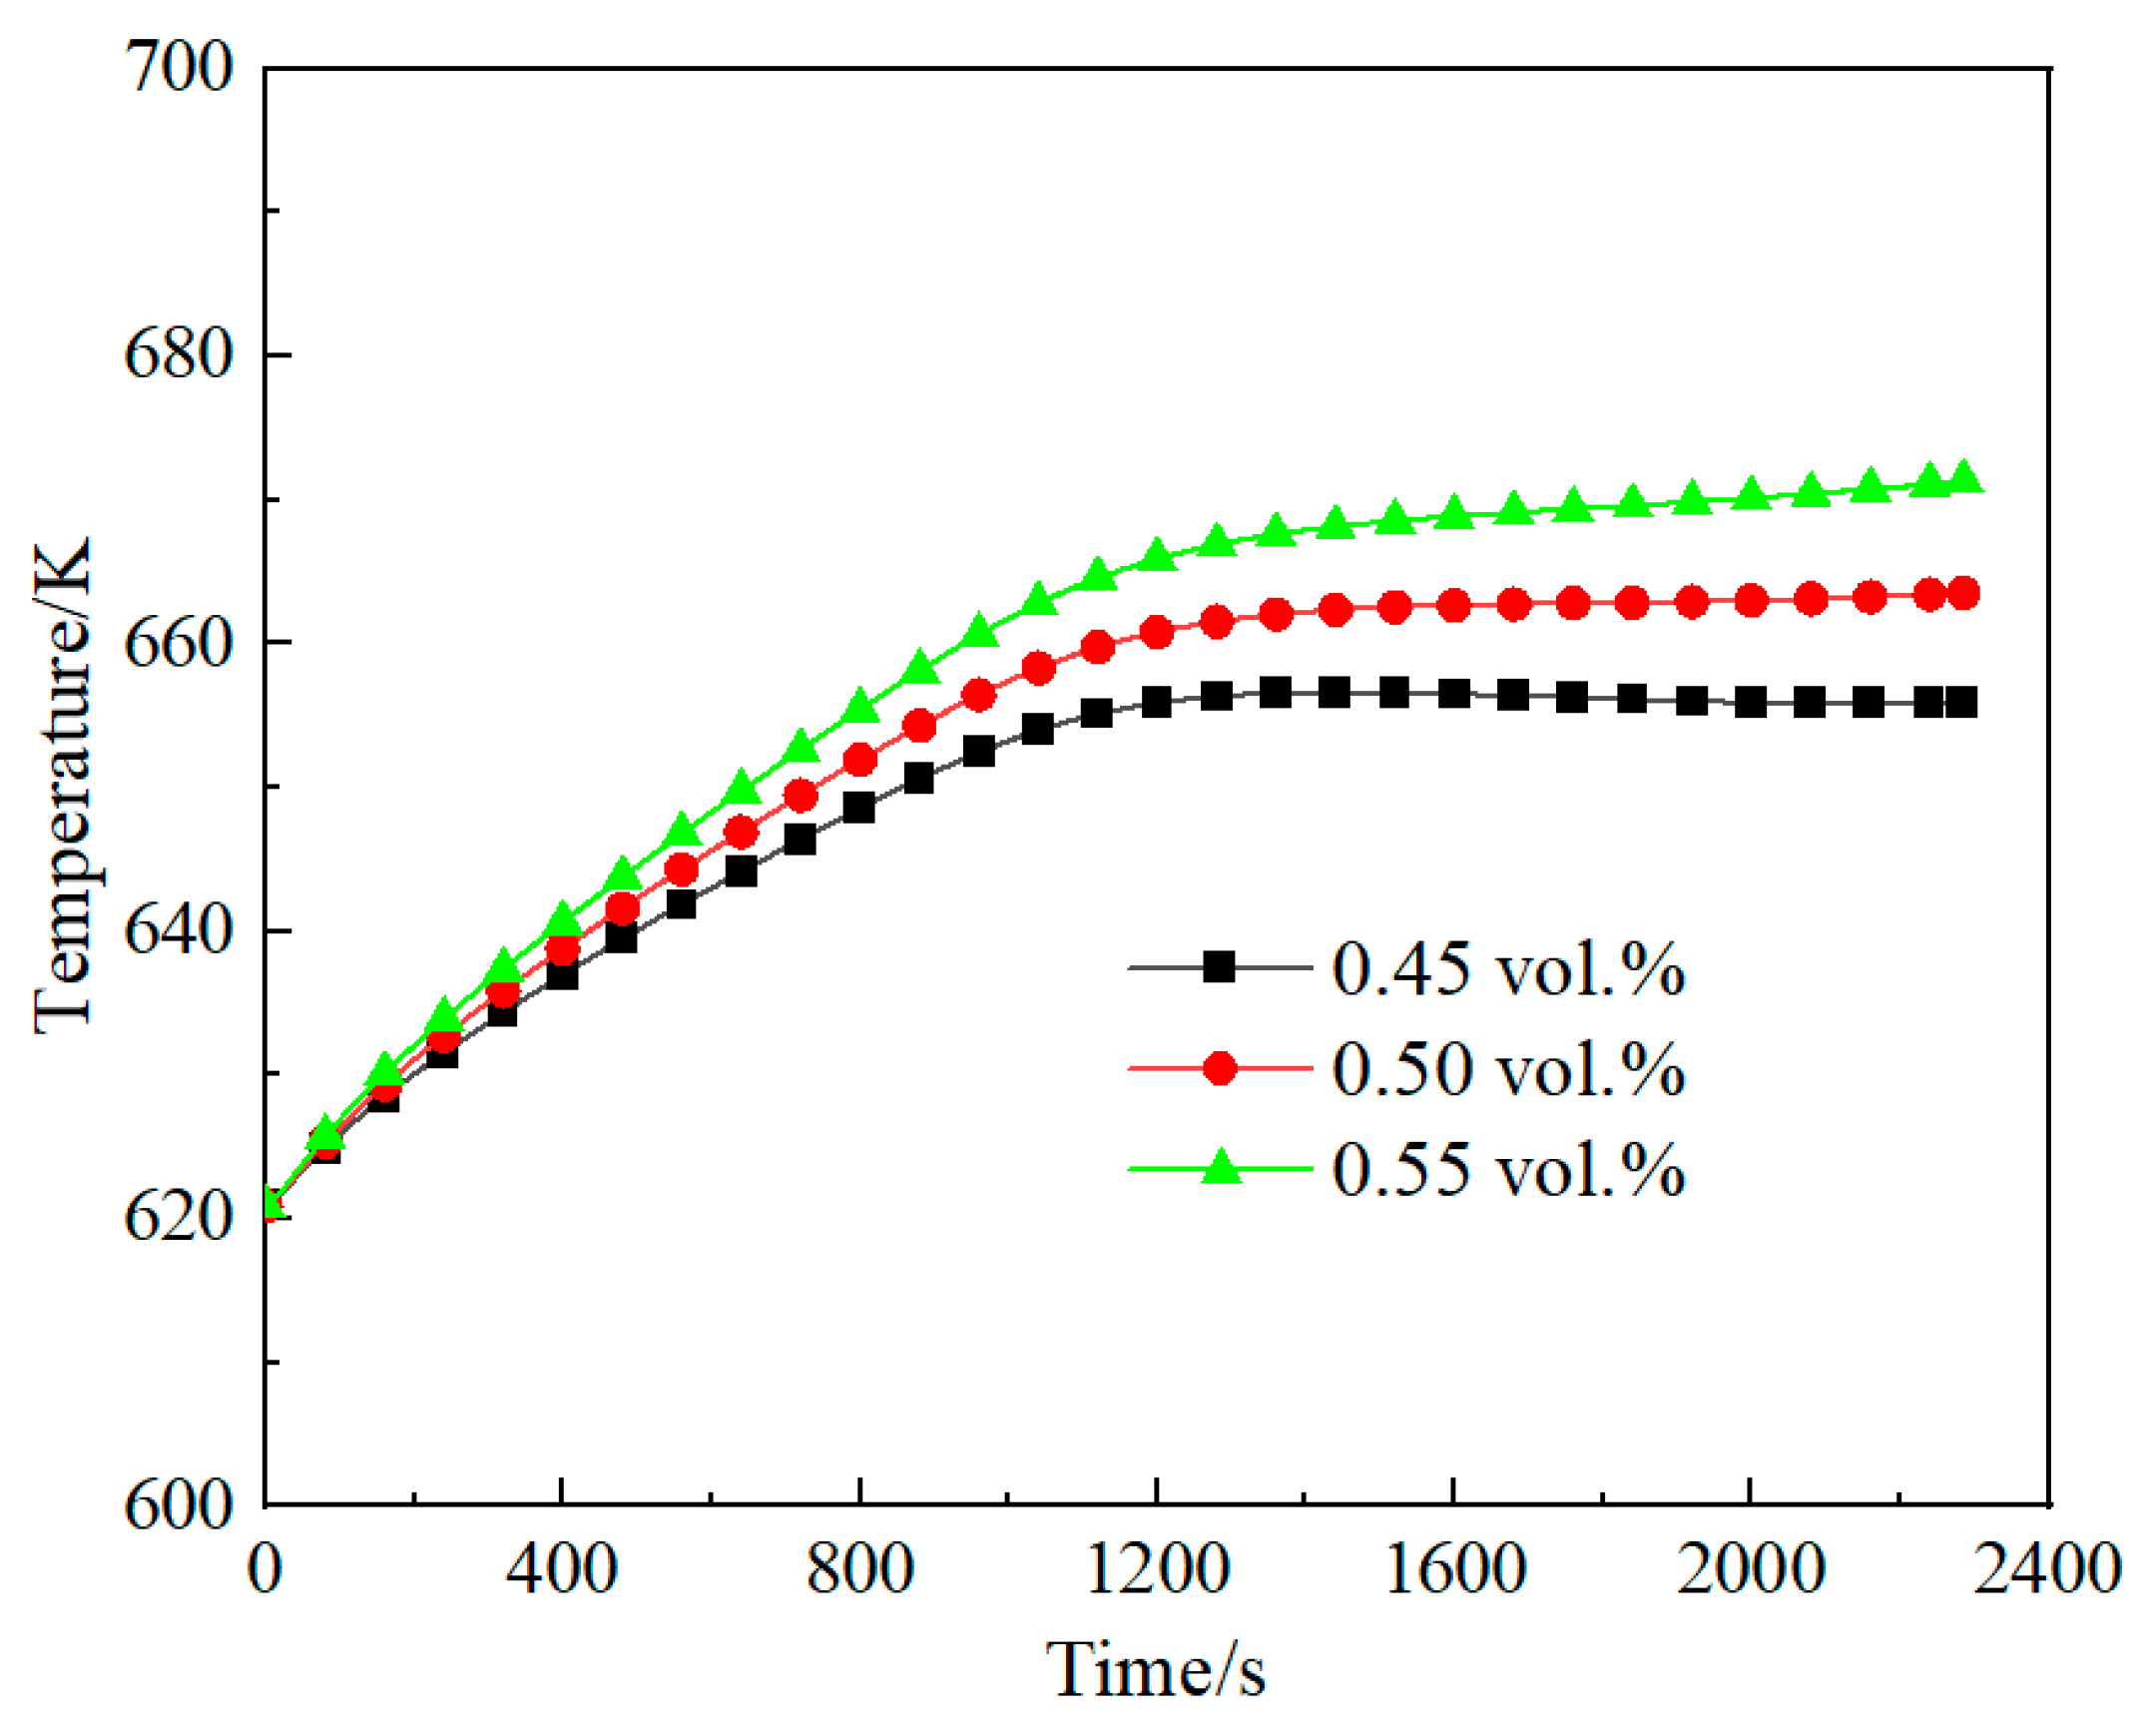
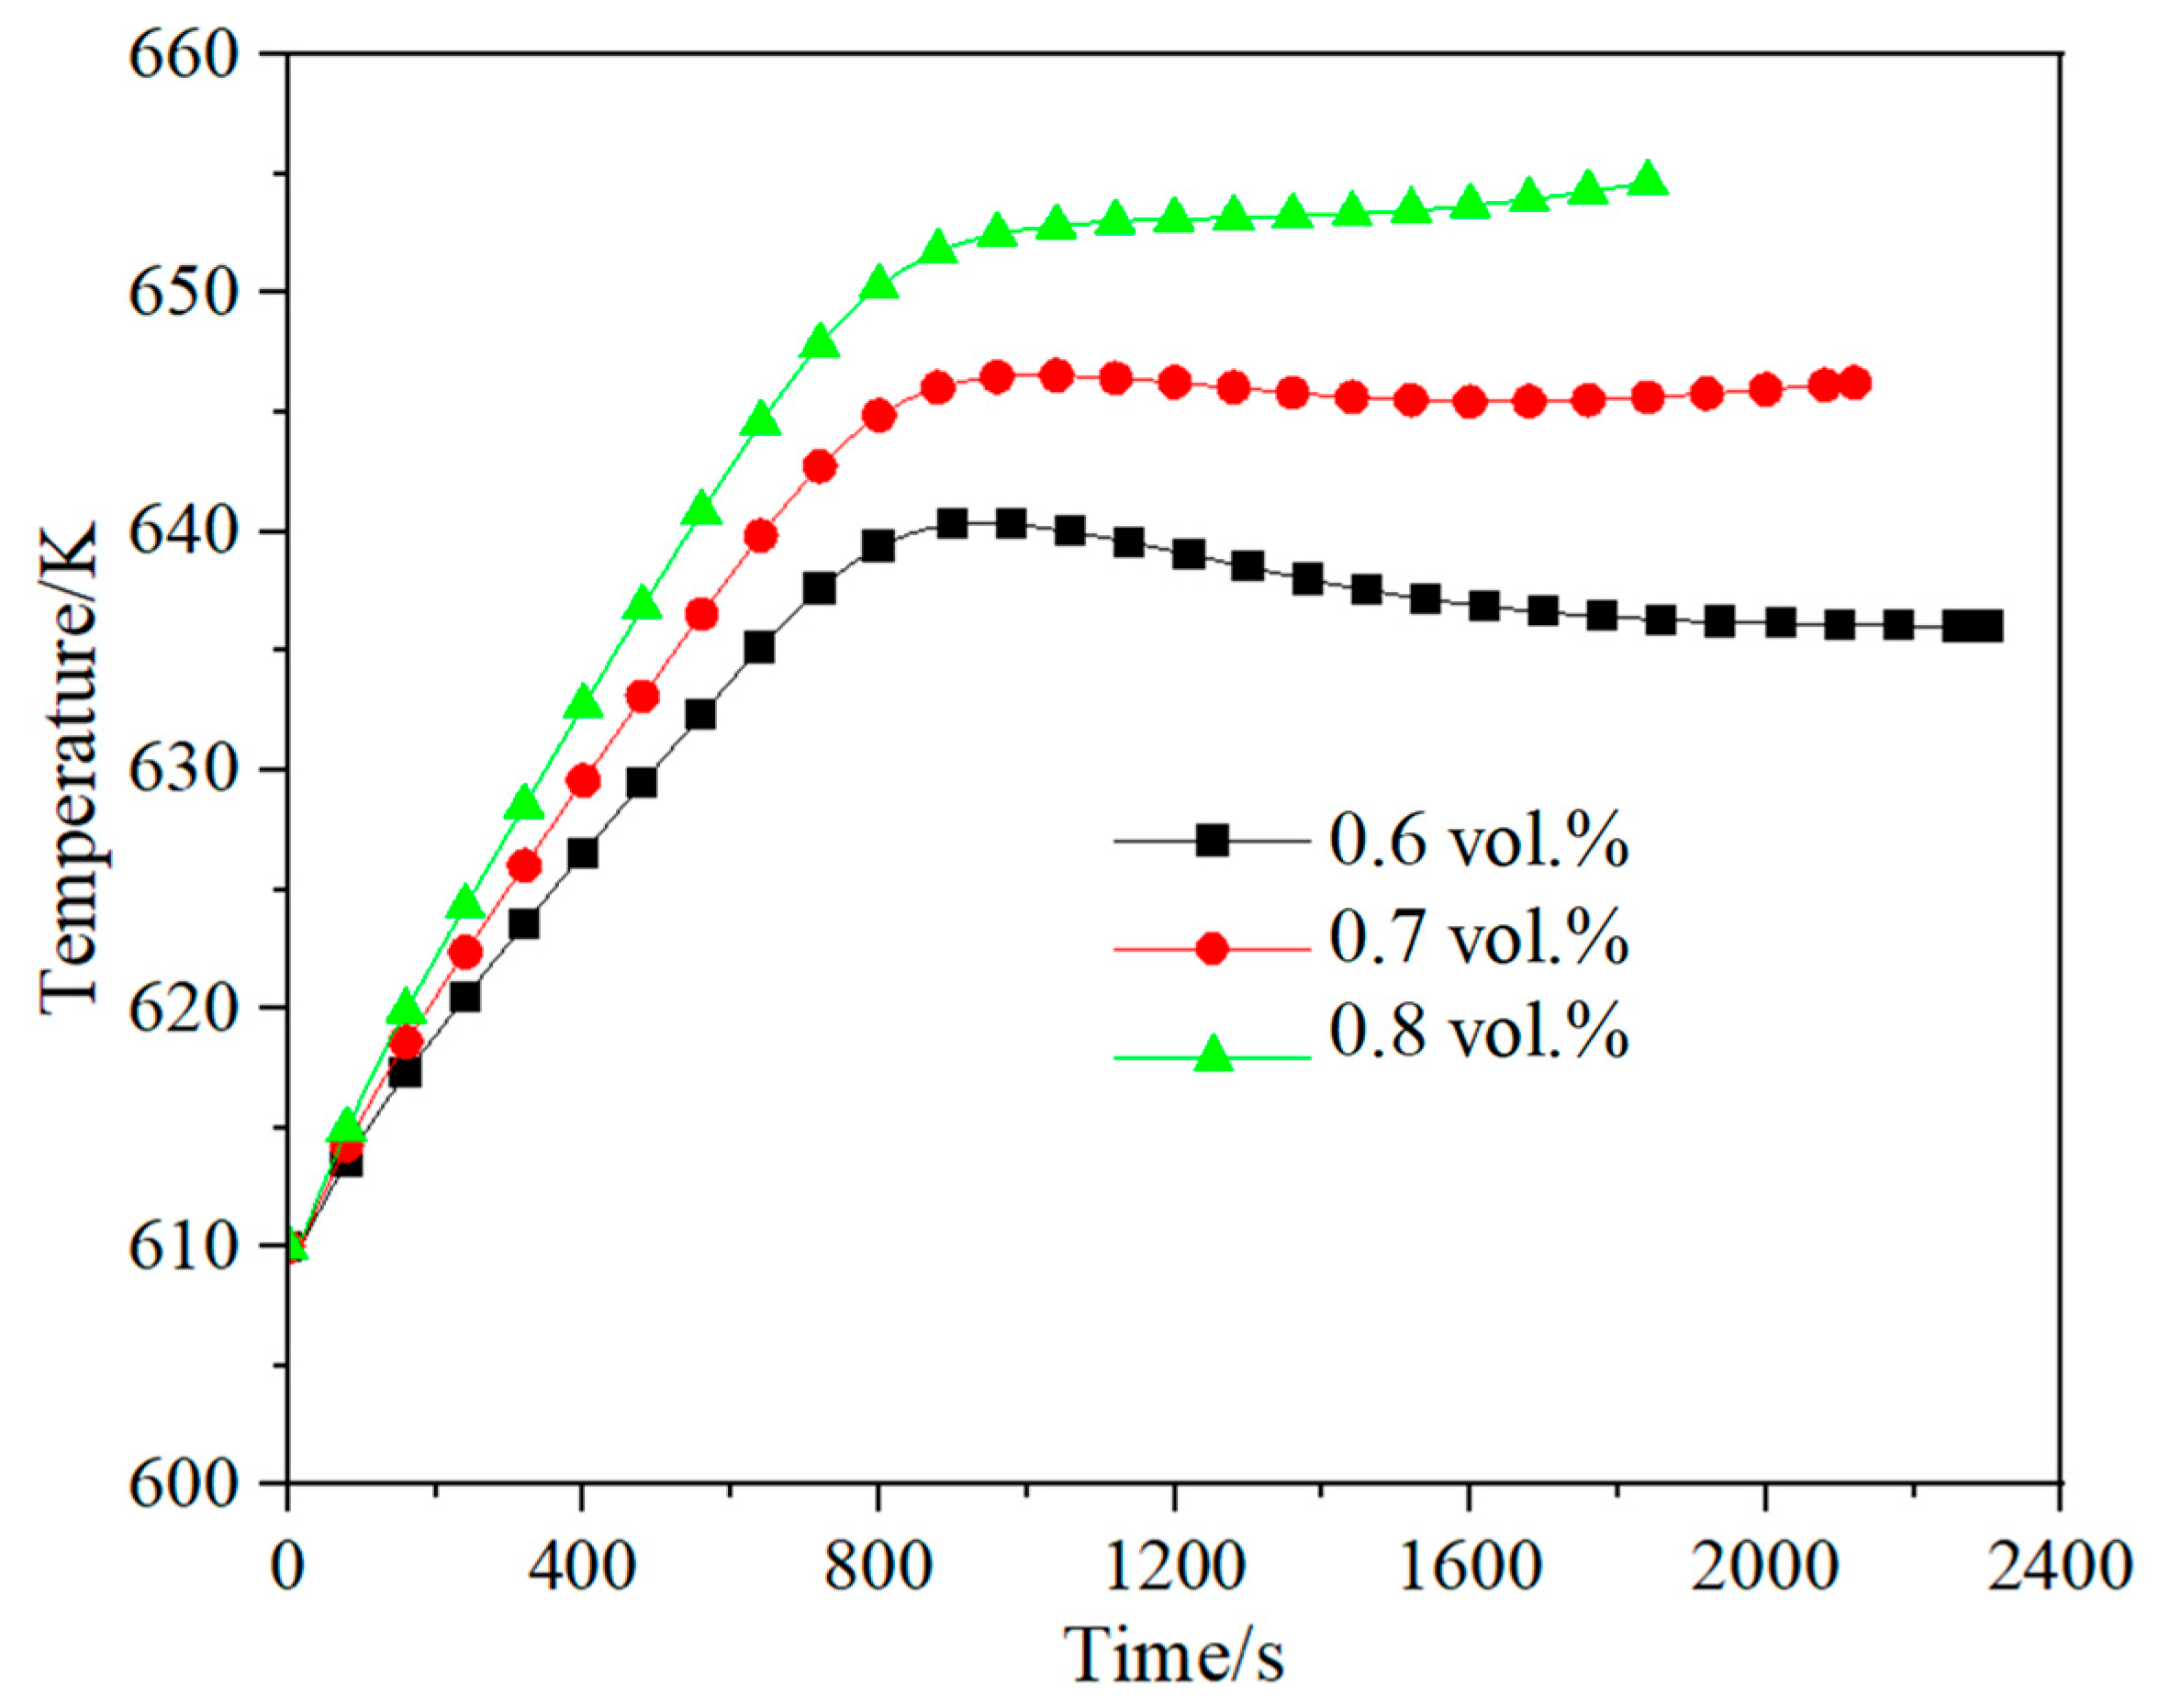
Figure 19, Figure 20, Figure 21 and Figure 22 show the evolution characteristics of the outlet temperature of the integrated regenerative catalytic reactor during the process of reaching a self-heating maintenance state under varying space velocity and concentration inlet conditions. It can be seen from this that the methane concentration requirement changes with increasing space velocity while maintaining thermal stability through coordinated inlet temperature regulation.
Figure 19 shows the variation in outlet temperature at a space velocity of 2653 h−1, with methane concentration ranging from 0.16–0.20 vol.%, where the initial inlet temperature of 650 K is related to exhaust conditions through Equation (13). The following figures show the adjustment of operating parameters as space velocity increases. When the space velocity corresponding to Figure 20 is 4421 h−1, the methane concentration range increases to 0.25–0.35 vol.%, the initial temperature decreases to 630 K, and the inlet temperature is controlled by Equation (14). The space velocity in Figure 21 is 6189 h−1, and the methane concentration range further increases to 0.25–0.55 vol.%. The initial inlet temperature decreases to 620 K, and the inlet temperature follows Equation (15). The final space velocity reaches 7958 h−1, as shown in Figure 22, and the inlet temperature follows Equation (16). The initial inlet temperature is 610 K, and the methane concentration range is 0.6–0.8 vol.%.
At different space velocities, as the space velocity increases, the methane concentration required to maintain the reactor self-heating equilibrium becomes higher. The minimum methane concentration required for the reactor to achieve self-heating maintenance at a space velocity of 2653 h−1 is 0.16 vol.%, and the minimum methane concentration increases to 0.6 vol.% at a space velocity of 7958 h−1. Lower space velocities enable broader methane concentration ranges for self-sustained operation. As the space velocity increases, the concentration range within which the reactor can achieve self-heating maintenance decreases. It can also be seen that when the space velocity is small and the methane concentration is low, the inlet gas needs to be preheated to a higher temperature for a self-heating maintenance reaction. With the increase in space velocity and methane concentration, the inlet gas temperature required for the reactor to perform self-heating maintenance reaction decreases. At a space velocity of 2653 h−1, the methane concentration is 0.16 vol.%, and the reactor inlet temperature is preheated to 650K.
This is because at the same space velocity, the higher the methane concentration, the more heat is released during the methane reaction process. As the exhaust temperature of the reactor increases, the flue gas provides more heat to the fresh mixture through an external preheater, preheating the fresh mixture gas to a higher temperature and improving the reaction efficiency. At the same methane concentration, the lower the space velocity, the higher the heat transfer efficiency of the heat exchanger, the more complete the heat exchange process, and the lower the heat loss of the flue gas in the preheater, which can utilize most of the heat from the flue gas to preheat the fresh mixture. Therefore, at low space velocities, it can reach a state of self-heating maintenance reaction at lower methane concentrations. At high altitudes, due to the increase in space velocity, the time for flue gas to stay in the preheater becomes shorter, resulting in insufficient heat exchange with the fresh mixed gas. As a result, the heat exchange efficiency decreases, and more heat is carried away by the flue gas, leading to more severe heat loss. Therefore, at higher space velocity, a higher concentration of methane is required to release heat in the reactor to achieve the self-heating maintenance reaction. In summary, catalytic combustion in our reactor remains effective for methane concentrations spanning 0.16–1.0 vol.%, substantially below the stoichiometric range (∼5–15 vol.% CH4) required for stable flame combustion. This enables energy recovery from sources previously deemed non-combustible.

4. Conclusions

The self-heating maintenance characteristics of an integrated regenerative catalytic reactor are studied through transient numerical simulation. This numerical model simplifies the preheater by combining an integrated regenerative catalytic reactor with preheating elements. Based on the fitted heat transfer efficiency equation, the relationship between the reactor inlet and exhaust parameters is established through a user-defined function (UDF) program. By simulating and analyzing the transient self-heating maintenance characteristics under various operating conditions, three main findings are obtained, as follows.
(1)
Comparative analysis shows that under the same inlet conditions, the self-heating maintenance performance of integrated regenerative catalytic reactors is superior to traditional preheated catalytic reactors. Numerical simulations show that the integrated regenerative catalytic reactor achieves self-heating maintenance operation at significantly lower inlet temperatures. Compared with the preheated catalytic reactor, the integrated regenerative catalytic reactor showed a decrease in self-heating-maintained inlet temperatures of 54 K, 70 K, 84 K, and 40 K at space velocities of 2653 h−1, 4421 h−1, 6189 h−1, and 7958 h−1, respectively.
(2)
Transient temperature and CO2 concentration fields in the integrated regenerative catalytic reactor are analyzed. Temperature contours reveal gradual thermal gradient formation between channels, with initial asymmetric high-temperature zones (e.g., downward-shifted hotspots at higher velocities). CO2 distribution evolves from partial to complete methane conversion, showing progressive shortening of reaction zones until stabilization. At 7958 h−1, CO2 generation accelerates, achieving full conversion by 800 s. Spatial analysis highlights wall-proximity reaction delays, particularly near the lower walls.
(3)
Space velocity significantly impacts methane concentration requirements for self-heat maintenance. At lower space velocity (2653 h−1), the minimum methane concentration for self-sustaining operation is 0.16 vol.%, while higher velocity (7958 h−1) requires 0.6 vol.% methane concentration. For any given space velocity, increased methane concentration necessitates higher reactor inlet temperatures to achieve thermal equilibrium. Increased space velocity narrows operable methane ranges and demands higher concentrations for thermal equilibrium due to reduced preheater heat exchange efficiency from shorter flue gas residence times.
(4)
Based on its capability to achieve self-sustained combustion at ultra-low methane concentrations (0.16 vol.%) with high heat recovery efficiency and 99% methane conversion, the integrated regenerative catalytic reactor significantly reduces preheating energy consumption (>50%) and enables annual CO2e mitigation of 1200 tons per unit (1000 Nm3/h scale). This design supports global methane abatement goals under the “Dual Carbon” strategy by converting dilute emissions into CO2/H2O without auxiliary fuel.

Author Contributions

All of the authors contributed to publishing this paper. M.M. designed the reactor and put forward the modification suggestion to this paper. F.Z. performed the simulation and wrote the paper. Y.W. processed the simulation data. Q.C. put forward the modification suggestion to this paper. All authors have read and agreed to the published version of the manuscript.

Funding

This research was funded by the National Natural Science Foundation of China (grant number 52106170) and the Shandong Province Program for Enhancing Innovation Capability of Technology-Based SMEs of China [grant number 2024TSGC0299].

Data Availability Statement

The raw data supporting the conclusions of this article will be made available by the authors on request.

Conflicts of Interest

The authors declare no conflicts of interest.

References

  1. Zhang, H.; Nie, B.; Li, G.; Liu, X.; Yin, F.; Wang, Z.; He, H.; Bao, S.; Fu, H.; Huang, J. Experimental study and correlation analysis on thermal storage oxidation of ventilation air methane mixed with pulverized coal. Case Stud. Therm. Eng. 2025, 68, 105885. [Google Scholar] [CrossRef]
  2. Gosiewski, K.; Pawlaczyk, A. Catalytic or thermal reversed flow combustion of coal mine ventilation air methane: What is better choice and when? Chem. Eng. J. 2014, 238, 78–85. [Google Scholar] [CrossRef]
  3. Tang, A.; Yang, J.; Shao, S.; Cai, T.; Zhang, Z.; Xiao, L. Experimental investigations on the thermal destabilization and performance enhancement of ventilation air methane in a reversed flow oxidation reactor. Chem. Eng. Process. 2024, 204, 109958. [Google Scholar] [CrossRef]
  4. He, X.; Lei, L. Optimizing methane recovery: Techno-economic feasibility analysis of N2-selective membranes for the enrichment of ventilation air methane. Sep. Purif. Technol. 2021, 259, 118180. [Google Scholar] [CrossRef]
  5. Zhang, G.; Li, Q.; Liu, X.; Lin, B.; Li, D. Investigations on the mitigation of ventilation air methane and energy recovery in site trial thermal flow-reversal reactor. Chem. Eng. Process. 2022, 170, 108703. [Google Scholar] [CrossRef]
  6. Ajrash AL-Zuraiji, M.J.; Zanganeh, J.; Moghtaderi, B. Application of flame arrester in mitigation of explosion and flame deflagration of ventilation air methane. Fuel 2019, 257, 115985. [Google Scholar] [CrossRef]
  7. Ursueguía, D.; Marín, P.; Díaz, E.; Ordóñez, S. A new strategy for upgrading ventilation air methane emissions combining adsorption and combustion in a lean-gas turbine. J. Nat. Gas Sci. Eng. 2021, 88, 103808. [Google Scholar] [CrossRef]
  8. Zhang, X.; Zhu, T.; Liu, S.; Nie, B.; Yuan, B.; Han, Y. Insight into ventilation air methane combustion of ultralow sub-nanometer palladium catalyst within the MFI zeolite. J. Environ. Sci. 2025, 155, 1–12. [Google Scholar] [CrossRef]
  9. Lyu, X.; Qiao, Y.; Yuan, D.; Zhang, Z.; Zuo, W.; Hua, J.; Wang, Y.; Zhang, L. Investigation and CFD simulation of coal dust explosion accident in confined space: A case study of Gaohe Coal Mine Ventilation Air Methane oxidation power plant. Fire Saf. J. 2024, 149, 104237. [Google Scholar] [CrossRef]
  10. Moncada Quintero, C.W.; Ercolino, G.; Specchia, S. Combined silicon carbide and zirconia open cell foams for the process intensification of catalytic methane combustion in lean conditions: Impact on heat and mass transfer. Chem. Eng. J. 2022, 429, 132448. [Google Scholar] [CrossRef]
  11. Akbari, E.; Alavi, S.M.; Rezaei, M.; Larimi, A. CeO2-promoted BaO-MnOx catalyst for lean methane catalytic combustion at low temperatures: Improved catalytic efficiency and light-off temperature. Int. J. Hydrogen Energy 2022, 47, 13004–13021. [Google Scholar] [CrossRef]
  12. Huang, Q.; Yin, C.; Lei, Y.; Fang, Y.; Wang, H.; Wu, H.; Luo, H.; Xu, Y.; Wang, Y.; Miao, Y.; et al. Potassium-promoted high-entropy Mg-Al spinel with active lattice oxygen and improved hydrothermal stability for catalytic combustion of lean methane. Sep. Purif. Technol. 2025, 359, 130672. [Google Scholar] [CrossRef]
  13. Ramos, H.S.F.; Mmbaga, J.P.; Hayes, R.E. Catalyst optimization in a catalytic flow reversal reactor for lean methane combustion. Catal. Today 2023, 407, 182–193. [Google Scholar] [CrossRef]
  14. Zhang, P.; Liu, J.; Zhou, C.; Xue, Z.; Zheng, Y.; Tang, H.; Liu, Z. Catalytic combustion of lean methane over different Co3O4 nanoparticle catalysts. Heliyon 2023, 9, e21994. [Google Scholar] [CrossRef]
  15. Varbar, M.; Alavi, S.M.; Rezaei, M.; Akbari, E. Lean methane catalytic combustion over the mesoporous MnOx-Ni/MgAl2O4 catalysts: Effects of Mn loading. Int. J. Hydrogen Energy 2022, 47, 39829–39840. [Google Scholar] [CrossRef]
  16. Tang, S.; Li, W.; Jin, J.; Zhang, X.; Shen, Z.; Gui, Y. Lean methane catalytic combustion using Pd/ZSM-5 catalysts prepared by ammonia evaporation method. Mol. Catal. 2025, 579, 115092. [Google Scholar] [CrossRef]
  17. Shen, Z.; Nabavi, S.A.; Clough, P.T. Design and performance testing of a monolithic nickel-based SiC catalyst for steam methane reforming. Appl. Catal. A Gen. 2024, 670, 119529. [Google Scholar] [CrossRef]
  18. Pandit, D.M.; Bollini, P.; Balakotaiah, V. Optimization of monolith reactor design for autothermal oxidative dehydrogenation of ethane over a MoVTeNbOx catalyst. Chem. Eng. J. 2025, 509, 16266. [Google Scholar] [CrossRef]
  19. Zhang, W.; Lin, Y.; Zhang, Y.; Li, T.; Li, J.; Chen, Z.; Norinaga, K. Regulation of temperature distribution in fixed bed reactor for CO2 methanation through “CHESS” monolith structure catalyst. Appl. Therm. Eng. 2024, 236, 121826. [Google Scholar] [CrossRef]
  20. Sarkar, B.; Ratnakar, R.R.; Balakotaiah, V. Bifurcation analysis of catalytically assisted hydrogen combustion in monolith reactors. Chem. Eng. J. 2021, 425, 130318. [Google Scholar] [CrossRef]
  21. Sandu, V.C.; Cormos, A.M.; Dumbrava, I.D.; Imre-Lucaci, A.; Cormos, C.C.; de Boer, R.; Boon, J.; Sluijter, S. Assessment of CO2 capture efffciency in packed bed versus 3D-printed monolith reactors for SEWGS using CFD modeling. Int. J. Greenh. Gas Control 2021, 111, 103447. [Google Scholar] [CrossRef]
  22. Liu, X.; Zeng, Y.; Chen, J.; Zhong, Z.; Xing, W. Research progress on the monolithic catalyst for hydrogenation of CO2 to methane. Chin. J. Chem. Eng. 2025, 80, 184–197. [Google Scholar] [CrossRef]
  23. Zhou, C.; Zhang, H.; Yang, L.; Wu, D.; He, S.; Yang, H.; Xiong, H. Methane-selective oxidation to methanol and ammonia selective catalytic reduction of NOx over monolithic Cu/SSZ-13 catalysts: Are hydrothermal stability and active sites same? Fuel 2022, 309, 122178. [Google Scholar] [CrossRef]
  24. Chen, J.; Yan, L.; Song, W.; Xu, D. Effect of heat recirculation on the combustion stability of methane-air mixtures in catalytic micro-combustors. Appl. Therm. Eng. 2017, 115, 702–714. [Google Scholar] [CrossRef]
  25. Cai, W.; Zhang, Z.; Wang, B.; Wang, Z.; Yin, Z.; Zhang, Z. Optimization design and performance analysis of methanol reforming reactor for exhaust waste heat recovery of marine engine. Int. J. Hydrogen Energy 2024, 49, 1593–1604. [Google Scholar] [CrossRef]
  26. He, G.; Zhang, H.; Zhou, W.; Zeng, H.; Shen, Z.; Liu, H. Reaction kinetic and application of methane reforming with CO2/H2O in flue gas for heat recovery and carbon conversion. Chem. Eng. J. 2025, 513, 162996. [Google Scholar] [CrossRef]
  27. Miranda, A.F.; Rodríguez, M.L.; Borio, D.O. Open-loop dynamic analysis of the catalytic oxidation of VOCs with heat recovery. Chem. Eng. Res. Des. 2023, 193, 432–446. [Google Scholar] [CrossRef]
  28. Xu, Q.; Chen, Y.; Yao, N.; Zhang, J.; Huang, Y.; Han, D.; Pan, W. Recent advancements in ammonia catalytic cracking and waste heat reforming technologies: A review. Energy Convers. Manag. 2025, 326, 119530. [Google Scholar] [CrossRef]
  29. Chen, Q.; Mao, M.; Gao, M.; Liu, Y.; Shi, J.; Li, J. Design and Performance Investigation of a Compact Catalytic Reactor Integrated with Heat Recuperator. Energies 2022, 15, 447. [Google Scholar] [CrossRef]
  30. Mao, M.; Liu, Y.; Liu, R.; Zheng, B.; Meng, J. Experimental Investigations of Cold Flow Mass Distribution and Pressure Drop Characteristics in a Structured Honeycomb Monolith Bed. Open Mech. Eng. J. 2015, 9, 302–311. [Google Scholar]
  31. Moallemi, F.; Batley, G.; Dupont, V.; Foster, T.J.; Pourkashanian, M.; Williams, A. Chemical modelling and measurements of the catalytic combustion of CH4/air mixtures on platinum and palladium catalysts. Catal. Today 1999, 47, 235–244. [Google Scholar] [CrossRef]
  32. Zheng, B.; Liu, Y.; Liu, R.; Meng, J. Catalytic oxidation of coal mine ventilation air methane in a preheat catalytic reaction reactor. Int. J. Hydrogen Energy 2015, 40, 3381–3387. [Google Scholar] [CrossRef]
Figure 1. Physical model of the integrated regenerative catalytic reactor.
Energies 18 04654 g001
Figure 2. Grid map of the reactor with a grid number of 41,982.
Energies 18 04654 g002
Figure 3. The temperature distributions along the midline of the reaction channel with four grid numbers.
Energies 18 04654 g003
Figure 4. The experimental platform structure and distribution of measuring points. (a) Schematic diagram of the experimental platform. (b) Measuring sections inside the oxidation bed. (c) Measuring points on one section. (d) Measuring points of the preheater.
Energies 18 04654 g004aEnergies 18 04654 g004b
Figure 5. Heat transfer efficiency of the external preheater with different space velocities.
Energies 18 04654 g005
Figure 6. Variation in reactor inlet temperature with time for two reactors with the methane concentration of 0.6 vol.% and the space velocity of 2653 h−1.
Energies 18 04654 g006
Figure 7. Variation in reactor inlet temperature with time for two reactors with the methane concentration of 0.8 vol.% and the space velocity of 4421 h−1.
Energies 18 04654 g007
Figure 8. Variation in reactor inlet temperature with time for two reactors with the methane concentration of 0.9 vol.% and the space velocity of 6189 h−1.
Energies 18 04654 g008
Figure 9. Variation in reactor inlet temperature with time for two reactors with the methane concentration of 1.0 vol.% and the space velocity of 7958 h−1.
Energies 18 04654 g009
Figure 10. Methane conversion rate for two reactors with different intake methane concentrations and space velocities.
Energies 18 04654 g010
Figure 11. Temperature contours for different times of the reactor self-heating maintenance simulation at the space velocity of 2653 h−1 and the methane concentration of 0.16 vol.%.
Energies 18 04654 g011
Figure 12. Contours of CO2 concentration at different times of the reactor self-heating maintenance simulation at the space velocity of 2653 h−1 and the methane concentration of 0.16 vol.%.
Energies 18 04654 g012
Figure 13. Temperature contours for different times of the reactor self-heating maintenance simulation at the space velocity of 4421 h−1 and the methane concentration of 0.3 vol.%.
Energies 18 04654 g013
Figure 14. Contours of CO2 concentration at different times of the reactor self-heating maintenance simulation at the space velocity of 4421 h−1 and the methane concentration of 0.3 vol.%.
Energies 18 04654 g014
Figure 15. Temperature contours for different times of the reactor self-heating maintenance simulation at the space velocity of 6189 h−1 and the methane concentration of 0.45 vol.%.
Energies 18 04654 g015
Figure 16. Contours of CO2 concentration at different times of the reactor self-heating maintenance simulation at the space velocity of 6189 h−1 and the methane concentration of 0.45 vol.%.
Energies 18 04654 g016
Figure 17. Temperature contours for different times of the reactor self-heating maintenance simulation at the space velocity of 7958 h−1 and the methane concentration of 0.7 vol.%.
Energies 18 04654 g017
Figure 18. Contours of CO2 concentration at different times of the reactor self-heating maintenance simulation at the space velocity of 7958 h−1 and the methane concentration of 0.7 vol.%.
Energies 18 04654 g018
Figure 19. Inlet temperature variation during self-heating maintenance of the integrated regenerative catalytic reactor at the space velocity of 2653 h−1.
Energies 18 04654 g019
Figure 20. Inlet temperature variation during self-heating maintenance of the integrated regenerative catalytic reactor at the space velocity of 4421 h−1.
Energies 18 04654 g020
Figure 21. Inlet temperature variation during self-heating maintenance of the integrated regenerative catalytic reactor at the space velocity of 6189 h−1.
Energies 18 04654 g021
Figure 22. Inlet temperature variation during self-heating maintenance of the integrated regenerative catalytic reactor at the space velocity of 7958 h−1.
Energies 18 04654 g022
Table 1. Composition of the gas mixture.
CH4O2N2CO2
0.16–1%20.8%78.3%0.3%
Disclaimer/Publisher’s Note: The statements, opinions and data contained in all publications are solely those of the individual author(s) and contributor(s) and not of MDPI and/or the editor(s). MDPI and/or the editor(s) disclaim responsibility for any injury to people or property resulting from any ideas, methods, instructions or products referred to in the content.