Article

A Robust Collaborative Optimization of Multi-Microgrids and Shared Energy Storage in a Fraudulent Environment

School of Electric Power Engineering, Nanjing Institute of Technology, Nanjing 211167, China
*
Author to whom correspondence should be addressed.
Energies 2025, 18(17), 4635; https://doi.org/10.3390/en18174635 (registering DOI)
Submission received: 16 July 2025 / Revised: 27 August 2025 / Accepted: 29 August 2025 / Published: 31 August 2025

Abstract

In the context of the coordinated operation of microgrids and community energy storage systems, achieving optimal resource allocation under complex and uncertain conditions has emerged as a prominent research focus. This study proposes a robust collaborative optimization model for microgrids and community energy storage systems under a game-theoretic environment where potential fraudulent behavior is considered. A multi-energy collaborative system model is first constructed, integrating multiple uncertainties in source-load pricing, and a max-min robust optimization strategy is employed to improve scheduling resilience. Secondly, a game-theoretic model is introduced to identify and suppress manipulative behaviors by dishonest microgrids in energy transactions, based on a Nash bargaining mechanism. Finally, a distributed collaborative solution framework is developed using the Alternating Direction Method of Multipliers and Column-and-Constraint Generation to enable efficient parallel computation. Simulation results indicate that the framework reduces the alliance’s total cost from CNY 66,319.37 to CNY 57,924.89, saving CNY 8394.48. Specifically, the operational costs of MG1, MG2, and MG3 were reduced by CNY 742.60, CNY 1069.92, and CNY 1451.40, respectively, while CES achieved an additional revenue of CNY 5130.56 through peak shaving and valley filling operations. Furthermore, this distributed algorithm converges within 6–15 iterations and demonstrates high computational efficiency and robustness across various uncertain scenarios.

1. Introduction

With the gradual advancement of the “dual carbon” goals and the evolution of energy systems toward low-carbon and intelligent paradigms [1,2], microgrids (MGs) have emerged as key enablers of distributed energy utilization and are playing an increasingly vital role in modern power systems. By integrating distributed photovoltaic(PV), wind turbine(WT), and energy storage systems, MGs are capable of autonomous operation and flexible grid interconnection, thereby enhancing renewable energy accommodation and increasing supply reliability [3,4,5,6]. However, individual MGs still face limitations in scale, resource adequacy, and resilience to uncertainty. Therefore, establishing a collaborative operational framework for multi-microgrids has been regarded as an effective strategy to address the challenges of multi-energy system optimization [7,8].
In multi-microgrid systems, coordinated electricity usage and shared energy storage resources are essential for enhancing overall system synergy. community energy storage (CES) systems, which allocate shared storage resources among multiple MGs, significantly improve storage utilization and enhance system flexibility. Accordingly, CES has been recognized as a key enabler for the large-scale integration and flexible dispatch of distributed energy resources [9,10,11]. In recent years, extensive research has been conducted by domestic and international scholars on modeling, scheduling, and pricing mechanisms related to shared energy storage in multi-MG systems. For instance, Reference [12] proposes a two-stage robust optimization scheduling model aimed at improving system resilience. Reference [13] introduces a Stackelberg game-based mechanism to address fairness in resource allocation for shared energy storage. Reference [14] investigates operational modes and economic incentive schemes for CES within the ancillary services market. Interconnection planning involving bidirectional converters (BdC) is critical for enhancing the reliability and robustness of hybrid AC/DC microgrid clusters with high renewable energy penetration. However, challenges, such as the non-convexity of BdC efficiency and the uncertainty of renewable energy sources, complicate the planning process. To address these issues, Reference [15] proposes a three-level planning framework based on BdC, which combines dynamic BdC efficiency and a data-correlated uncertainty set (DcUS) derived from historical data patterns. The framework employs a least-squares approximation method to linearize BdC efficiency and constructs DcUS to balance computational efficiency and solution robustness.
Although previous studies have systematically examined the operational optimization of multi-microgrids and shared energy storage, significant challenges still persist in real-world implementation. On the one hand, MGs are independent operational entities with self-interested objectives, which may result in non-cooperative or even adversarial behaviors when sharing common resources such as CES. On the other hand, uncertainty in renewable energy output and load demand has a significant impact on the stability of multi-microgrid operations. Traditional centralized dispatch strategies are often inadequate in addressing these challenges when applied to distributed and autonomous systems [16,17,18].
In response to the aforementioned challenges, robust optimization techniques have been increasingly adopted for scheduling in multi-microgrid systems. Robust optimization eliminates the need for specific probabilistic assumptions about uncertainty; instead, it constructs uncertainty sets to optimize scheduling strategies under worst-case conditions [19,20,21]. Representative studies include [22], which proposes a min–max robust optimization model to address renewable output fluctuations, and [23] which incorporates economic dispatch and low-carbon constraints into a robust optimization framework, employing the Column-and-Constraint Generation (C&CG) algorithm for efficient solving. Additionally, studies such as [24,25,26] employ the Alternating Direction Method of Multipliers (ADMM) to achieve distributed collaborative scheduling across multi-microgrids, thereby improving computational efficiency and preserving participant privacy. Reference [27] designs a robust optimal framework to mitigate oscillatory dynamics in doubly fed induction generators (DFIGs) under network disturbances and input variations. To address the issue of uncertain dynamics, this paper develops a new transformation formula for WT energy conversion systems. An unscented Kalman filter is employed to estimate the unmeasured internal state of the WT energy conversion system through terminal measurements.
In terms of energy trading strategies, the Nash Bargaining model has been widely applied to establish fair trading mechanisms among MGs. Reference [28] applies Nash game theory to analyze the pricing process of peer-to-peer (P2P) energy transactions among multiple MGs, thus improving the system’s Pareto efficiency. Reference [29] extends the Nash model to a multi-party collaborative setting, analyzing equilibrium strategies for negotiation and resource allocation among multiple participants. To mitigate non-cooperative behavior and potential fraud risks, penalty mechanisms and incentive-based game strategies have been introduced into Nash bargaining models. For example, Reference [30] proposes a multi-microgrid (MMG) energy sharing model that considers multiple uncertainties and deceptive behaviors, and applies robust optimization to handle uncertainties related to grid prices and renewable energy output. Reference [31] establishes a cooperative operation model for multi-energy microgrids (MEMGs) that takes into account distributed power capacity planning, the uncertainty of renewable energy generation, carbon emission restrictions, and peer-to-peer (P2P) power transactions between MEMGs. An asymmetric Nash bargaining method is used to ensure the fair distribution of benefits and maintain the willingness of each MEMG to participate in the cooperation.
Although previous work has provided theoretical foundations and algorithmic tools for collaborative optimization of multi-microgrid shared energy storage systems, three critical issues remain insufficiently addressed: (1) the systematic impact of triple uncertainties—source output, load demand, and electricity prices—on scheduling robustness remains underexplored; (2) existing trading mechanisms largely assume perfect rationality and fail to model potential fraudulent or speculative behaviors among MGs; and (3) dispatch optimization and game strategies are frequently modeled in isolation, hindering the integrated resolution of multi-level decision problems.
Therefore, this paper aims to construct a multi-microgrid shared energy storage collaborative optimization model for fraudulent behavior and uncertain disturbances, balancing system robustness, economic efficiency, and transaction fairness. The main contributions include:
We construct a two-stage robust optimization model incorporating three uncertainties, source capacity, load demand, and electricity price fluctuations, using boxed uncertainty sets to enhance the robustness of system scheduling.
Existing research on energy trading games either assumes that participants are completely honest or simplifies deception into static biases, failing to capture the dynamic strategic interactions between self-interested microgrids. What equilibrium structures emerge when microgrids dynamically adjust their deception strategies based on others’ behavior? How iterative deception converges to a stable state has not been modeled. To address this gap, this study proposes a novel deception equilibrium structure by extending the traditional Nash equilibrium through mutual constraints on deception factors. In this equilibrium, no microgrid can unilaterally increase deception factors to gain additional benefits without harming others, thereby ensuring the Pareto optimality of the alliance while tolerating limited deception behavior. Second, we propose a dynamic, mutually dependent deception iteration modeling method, where each microgrid’s deception factor is updated based on aggregated information from all participants. This model captures the symbiotic evolution of strategic behavior, differing from the static deception assumptions in existing literature, and ensures convergence to the deception equilibrium state through a data-centric negotiation mechanism.
Finally, a two-layer distributed algorithm is proposed, integrating the ADMM and C&CG, to unify robust scheduling and Nash bargaining, thereby enhancing computational efficiency and parallelization capability.

2. Multiple MG-CES Operating Modes and Operating Models for Each Entity

The MG-CES system operation framework and cooperation model are shown in Figure 1 and Figure 2. The system comprises a CES plant and MGs. Each MG is connected to the external distribution grid and the natural gas network, enabling it to purchase electricity and gas when necessary. Crucially, each MG is also linked to the shared CES plant via dedicated power lines, forming the core of the energy sharing mechanism. When a particular MG has excess renewable generation that surpasses its own load demand, it can sell the surplus electricity to the CES plant. Conversely, when another MG suffers from a generation shortage, it can purchase the required electricity from the CES plant. This interaction allows for the efficient utilization of renewable energy across the alliance.
As shown in Figure 1, each MG is a comprehensive integrated energy system that includes renewable generation units, energy conversion equipment, local energy storage devices, and multi-energy loads. The CES acts as a central energy hub, facilitating energy arbitrage and providing flexibility services to the entire MG coalition. This architecture supports both physical energy exchange and the information communication required for the subsequent collaborative optimization and game-theoretic strategies.
As shown in Figure 2, assuming all MG and energy storage operators are willing to participate in this sharing mechanism, it can be considered that each MG and operator form a cooperative game alliance. During the dispatch phase, disregarding payments within the alliance (i.e., between MGs and energy storage), all alliance participants aim to minimize their own total energy consumption costs and execute dispatch strategies using a distributed approach. Following dispatch, Nash bargaining is applied to allocate the alliance’s total revenue. This paper accounts for fraudulent behavior arising from information asymmetry during negotiations. MGs simultaneously and independently report their payment willingness (maximum payment offered/minimum charge received) to the operator. This willingness is calculated based on either actual or underreported shared benefits. The operator then determines and announces its own charging willingness based on the reported data, prompting MGs to adjust their strategies. This cycle continues until both MGs and the operator cease to alter their strategies.

3. Consideration of Uncertainty in Multi-Microgrid—Shared Energy Storage System Coordinated Optimization Operation Model

3.1. Integrated Energy System Model

3.1.1. Gas Turbine Model

The core device of the cogeneration of heat and power (CHP) unit is a micro gas turbine, which generates electricity by burning natural gas. The waste heat from the flue gas is then utilized in a bromine cooling machine (absorption chiller) to provide thermal energy, thereby improving the overall energy utilization efficiency. The relationship between the thermal and electrical power output and the natural gas consumption is expressed as:
P i , s , t CHP , e = η e CHP Q g a s P i , s , t CHP , gas P i , s , t CHP , h = η h CHP Q g a s P i , s , t CHP , gas 0 P i , s , t CHP , e P max CHP , e 0 P i , s , t CHP , h P max CHP , h
where P i , s , t CHP , e and P i , s , t CHP , h represent the electrical power and thermal power generated by the gas turbine. η e CHP and η h CHP are the efficiency of electricity and heat production by the gas turbine. Q g a s is the calorific value of natural gas, which is defined as 9.7 kWh/m3. P i , s , t CHP , gas indicates the input gas flow rate of the CHP unit. P max CHP , e and P max CHP , h are the upper limits of the electrical power and thermal power output of the gas turbine, respectively.

3.1.2. Gas Boiler (GB) Model

In addition to the CHP unit, the heat generation device studied in this paper includes a gas boiler. The thermal power generated by the gas boiler and the natural gas consumption follow:
P i , s , t GB , h = η GB Q g a s P i , s , t GB , gas 0 P i , s , t GB , h P max GB , h
where P i , s , t GB , h represents the thermal power output of the gas boiler; P i , t GB , gas is the input gas flow rate of the gas boiler; η GB indicates the efficiency of the gas boiler; P max GB , h is the upper limit of the thermal power output generated by the gas boiler.

3.2. Electric Energy Storage Model

Electric energy storage achieves efficient utilization of energy resources. The state of charge and charging/discharging power constraints for electric energy storage are:
S i , s , 1 e = S i , s , 0 e + η ch e P i , s , 1 ech P i , s , 1 edis / η dis e S i , s , 2 : 24 e = S i , s , 1 : 23 e + η ch e P i , s , 2 : 24 ech P i , s , 2 : 24 edis / η dis e S i , s , 24 e = S i , s , 0 e S min e S i , s , t e S max e 0 P i , s , t ech μ i , s ch P max ech 0 P i , s , t edis μ i , s dis P max edis μ i , s ch + μ i , s dis 1
where S i , s , t e represents the real-time storage capacity of the electric energy storage; η ch e and η dis e denote the charging efficiency and discharging efficiency of the electric energy storage, respectively; P i , s , t ech and P i , s , t edis represent the charging power and discharging power of the electric energy storage; μ i , s ch and μ i , s dis indicate the state positions for charging and discharging of the electric energy storage; S max e and S min e are the upper and lower limits of the real-time storage capacity of the electric energy storage; P max ech and P max edis are the upper limits of the charging power and discharging power of the electric energy storage.

3.3. Interaction Model with Other Integrated Energy Systems

The integrated energy system establishes a box-type fuzzy set constraint for electricity price prediction values with other systems:
V = v = p ^ t buy T p ^ t buy = p t buy , pre + D + , t buy Δ p t buy D , t buy Δ p t buy
The uncertain budget is given by
D + , t buy + D , t buy 1 ; t = 1 T D + , t buy + D , t buy Γ buy
where p ^ t b u y represents the predicted electricity purchase price at time t ; p t buy , pre denotes the electricity prediction price at time t ; Δ p t buy indicates the deviation of the electricity price prediction during period t ; D + , t buy and D , t buy are the indicators for the optimal and worst-case scenarios of the electricity price at time t ; Γ buy is the parameter about the uncertainty of the electricity price at time t .

3.4. Power Balance Constraints3.5. Objective Function

P i , t CHP , e + P i , t WT + P i , t PV + P i , t edis + P i , t buy = P i , t ech + P i , t sell + P i , t el
P i , t CHP , h + P i , t GB , h = P i , t hl

3.5. Objective Function

When scheduling the integrated energy system, both economic benefits and environmental benefits are optimized simultaneously. The objective function is set to minimize the system cost, which can be expressed as:
C i grid = t = 1 T p i , t buy P i , t buy p i , t sell P i , t sell C i o m = t = 1 T p g P i , t g , CHP + P i , t g , GB + t = 1 T p e s s P i , t e , cha + P i , t e , dis C i sum = C i grid + C i o p
where C i grid , C i o m , and C i sum represent the electricity purchase cost, operation and maintenance cost, and total cost, respectively; p g and p e s s denote the natural gas price and energy storage price.

3.6. Shared Energy Storage Model

Constraints of Shared Energy Storage
S s , i , 1 e = S s , i , 0 e + η c h e P s , i , 1 e c h P s , i , 1 e d i s / η d i s e S s , i , 2 : 24 e = S s , i , 1 : 23 e + η c h e P s , i , 2 : 24 e c h a P s , i , 2 : 24 e d i s / η d i s e S s , i , 24 e = S s , i , 0 e S min e S s , i , t e S max e 0 P s , i , t e c h I s , i c h P max ech 0 P s , i , t edis I s , i d i s P max edis 0 P s , i , t edis I s , i d i s P max edis I s , i e d h + I s , i d i s 1
where S s , i , t e represents the real-time storage capacity of the electric energy storage; η ch e and η dis e denote the charging and discharging efficiency of the electric energy storage; P s , i , t ech and P s , i , t edis are the charging and discharging power of the electric energy storage, respectively; I s , i ch and I s , i dis indicate the state positions for charging and discharging of the electric energy storage; S max e and S min e are the upper and lower limits of the real-time storage capacity of the electric energy storage; P max ech and P max edis are the upper limits of the charging and discharging power of the electric energy storage, respectively.

3.7. Objective Function of Shared Energy Storage

C s , ES op = t = 1 T p e s s P s , t e , cha + P s , t e , dis C s , ES s = i = 1 N t = 1 T p i , s , t ess , b P i , s , t ess , b p i , s , t ess , s P i , s , t ess , s C s , E S = C s , ES op + C s , ES s
where C s , ES op , C s , ES s , and C s , E S are the charging and discharging cost, interaction cost with MG, and total cost under the s t h scenario, respectively; p e s s , p i , s , t ess , b , and p i , s , t ess , s denote the unit operation cost of energy storage, purchase price from MG, and sale price to MG, respectively; P s , t e , cha , P s , t e , dis , P i , s , t ess , b , and P i , s , t ess , s represent the charging and discharging power of energy storage and the interaction power between energy storage and the i t h MG.

3.8. Source-Load Output Uncertainty Model

A box-type uncertainty set is adopted for modeling the uncertainty of source-load output as
U = u = P t WT , P t PV , P t e , P t h T ( M × T ) × 4 P t WT P t WT , pre D , t WT Δ P t WT , P t WT , pre + D + , t WT Δ P t WT P t PV P t PV , pre D , t PV Δ P t PV , P t PV , pre + D + , t PV Δ P t PV P t e P t e , pre D , t e Δ P t e , P t e , pre + D + , t e Δ P t e P t h P t h , pre D , t h Δ P t h , P t h , pre + D + , t h Δ P t h
The uncertainty budget follows
D + , t WT + D , t WT 1 ; t = 1 T D + , t WT + D , t WT Γ WT D + , t PV + D , t PV 1 ; t = 1 T D + , t PV + D , t PV Γ PV D + , t e + D , t e 1 ; t = 1 T D + , t e + D , t e Γ e D + , t h + D , t h 1 ; t = 1 T D + , t h + D , t h Γ h
In the equation: P t WT , P t PV , P t e , and P t h represent the actual power output of WT, PV power, and the actual demand power for electrical and thermal loads at time t ; P t WT , pre , P t PV , pre , P t e , pre , and P t h , pre denote the predicted power output of WT power, PV power, and the predicted demand power for electrical and thermal loads at time t ; Δ P t WT , Δ P t PV , Δ P t e , and Δ P t h are the prediction deviations of WT power, PV power output, and the demand power for electrical and thermal loads during period t ; D + , t WT , D + , t PV , D + , t e , and D + , t h indicate the optimal indicators for WT power, PV power output, and the demand power for electrical and thermal loads at time t ; D , t WT , D , t PV , D , t e , and D , t h are the worst-case indicators for WT power, PV power output, and the demand power for electrical and thermal loads at time t ; Γ WT , Γ PV , Γ e , and Γ h are the adjustment parameters for the uncertainty of WT power, PV power output, and the demand power for electrical and thermal loads at time t .

3.9. Multi-Stage Robust Scheduling Model for MG Considering Multiple UncertaintMG

Compact Form of the Model

For simplicity, the multi-stage scheduling model for MG is re-expressed in a compact matrix form.
min x X , w W A T x + max v V   min y Y i I σ i v T y + max u U   min z Z i I σ i B T z   s . t .   a T x C b T x + c T v + d T y D e T x + f T v + i T y + j T u + k T z E
where x represents the decision variables of the first stage, indicating all scheduling operation plan state variables. The second and third layers utilize robust optimization methods to minimize the daily operational costs of MG under different typical daily scenarios. Considering the impact of multiple uncertainties in source-load-price within the MG, a multi-uncertainty set for source-load-price is constructed. Furthermore, the robust optimization method employs a “max-min” structure to handle the hourly fluctuations of source-load-price. Specifically, “max” obtains the worst-case scenario from the source-load-price uncertainty set, leading to the highest daily operational cost of MG, while “min” obtains the scheduling operation plan of MG under the worst-case scenario. v denotes the uncertain variable of electricity prices; u represents the uncertain variable of source-load; z indicates the gas purchase and equipment scheduling operation plan. A, B, C, D, E, a, b, c, d, e, f, i, j, k are coefficient matrices.
Among these, A T x represents the objective function of the first stage, corresponding to the electricity transaction costs between each microgrid and shared energy storage as described in the text; v T y in the objective function represents the objective function of the second stage, indicating the electricity purchase and sale costs of the microgrid under the most adverse electricity price scenarios, as shown by C i g r i d in Equation (8); The objective function B T z represents the objective function for the third stage, indicating the operational costs of the microgrid under the most adverse source-load scenario, as shown by C i o m in Equation (8); the objective function σ i represents the probability of scenario i.
The first row of constraints in Equation (13) represents the upper and lower limits of the power exchange between the microgrid and shared energy storage; the second row of constraints represents the upper and lower limits of the power exchange between the microgrid and the external grid; the third row of constraints represents the operational constraints of devices within the microgrid under the most adverse source-load scenario, as shown in Equations (1)–(3) and (6)–(7).

3.10. Parallelizable AOP-Looped C&CG Algorithm

The proposed MG model is nondeterministic polynomial (NP)-hard and cannot be directly solved. This paper designs and implements a parallelizable AOP-Looped C&CG algorithm. The algorithm includes two parallel computing solution loops. One is the parallel computation of Outer-Loop C&CG, which means parallel computation across different scenarios; The other is the parallel computation of Inner-Loop C&CG, which means parallel computation of daily operational costs within different scenarios.

3.11. Parallelizable Outer-Loop C&CG

(1)
Main Problem (MP)
To solve the multi-scenario three-stage robust scheduling model problem, the outer loop must use a “main problem—sub-problem” iterative approach to approximate the optimal solution. The core function of the main problem is to fix the worst-case scenario parameters fed back from the sub-problem, generate a feasible scheduling plan for the current iteration, and establish a connection with the sub-problem by introducing auxiliary variables. The mathematical expression is as follows:
min x X , w W A T x + η   s . t .   a T x C b T x + c T v l + d T y l D e T x + f T v l + i T y l + j T u l + k T z l E η max v V   min y Y i I σ i v l T y + max u U   min z Z i I σ i B T z l
where η is an auxiliary variable introduced to link the main and sub-problems; v l , u l represent the worst-case probabilities of seasonal scenarios and typical daily scenarios, as well as the worst-case scenarios for electricity prices and source-load, respectively, obtained from the SP in the l-th iteration. By solving the main problem, x is obtained, which is then substituted into the SP.
(2)
Sub-Problem (SP)
After the main problem generates a feasible scheduling plan, the sub-problem needs to reverse-verify the “worst-case” cost of the plan under uncertainty scenarios—that is, screen out the scenario with the highest daily operating cost of the microgrid from the source-load-price uncertainty set. Its original expression is as follows:
max v V   min y Y i I σ i v T y + max u U   min z Z i I σ i B T z   s . t .   b T x + c T v + d T y D e T x + f T v + i T y + j T u + k T z E
where the scenario probability σ i does not affect the worst-case scenarios v and u , as well as the scheduling operation plans y and z , in the second and third layers of “max-min” decision-making. Therefore, it can be transformed into:
i I σ i max v V   min y Y v T y + max u U   min z Z B T z
Define the second and third layer problems as Feasibility-Focused Optimization (FFO) problems:
FFO : max v V   min y Y v T y + max u U   min z Z B T z
Define ( FFO ) , l as the daily operational cost of MG under different scenarios i obtained by the l-th iteration of parallel computation inner-loop C&CG.
  • Parallelizable Inner-Loop C&CG
(1) Sub-Problem Main(SPM)
The inner loop focuses on solving source-load uncertainty in a single typical daily scenario. Its main problem is logically consistent with the outer loop’s main problem: by introducing auxiliary variables to link the inner sub-problems, the worst-case scenario of source-load feedback from the sub-problems is fixed, and the price uncertainty variables and equipment scheduling plans in the current iteration are optimized to ensure the feasibility of the plan in that scenario. The specific form is as follows:
max v V   min y Y i I σ i v T y + φ   s . t .   b T x + c T v + d T y D e T x + f T v + i T y + j T u , τ + k T z τ E , τ n φ max u U   min z Z i I σ i B T z τ , τ n
where φ is an auxiliary variable introduced to link SPM and SPS; u , τ represents the worst-case scenario for source-load obtained from SPS in the τ-th iteration. By solving SPM, v and y are obtained, which are then substituted into SPS.
(2) Sub-Problem Sub(SPS)
The inner-layer sub-problem acts as a “worst-case scenario filter” for the inner-layer loop: based on the scheduling scheme output by the inner-layer main problem, it filters out the scenario with the highest microgrid operating cost from the source-load uncertainty set and feeds this scenario back to the inner-layer main problem for iterative optimization of the scheme, ultimately achieving robustness assurance under a single typical daily scenario. The expression is as follows:
max u U   min z Z i I σ i B T z τ s . t . e T x + f T v + i T y + j T u + k T z E
2.
Pseudocode and Flowchart for Parallelizable Alternating Optimization Procedure(AOP)-Looped C&CG Algorithm
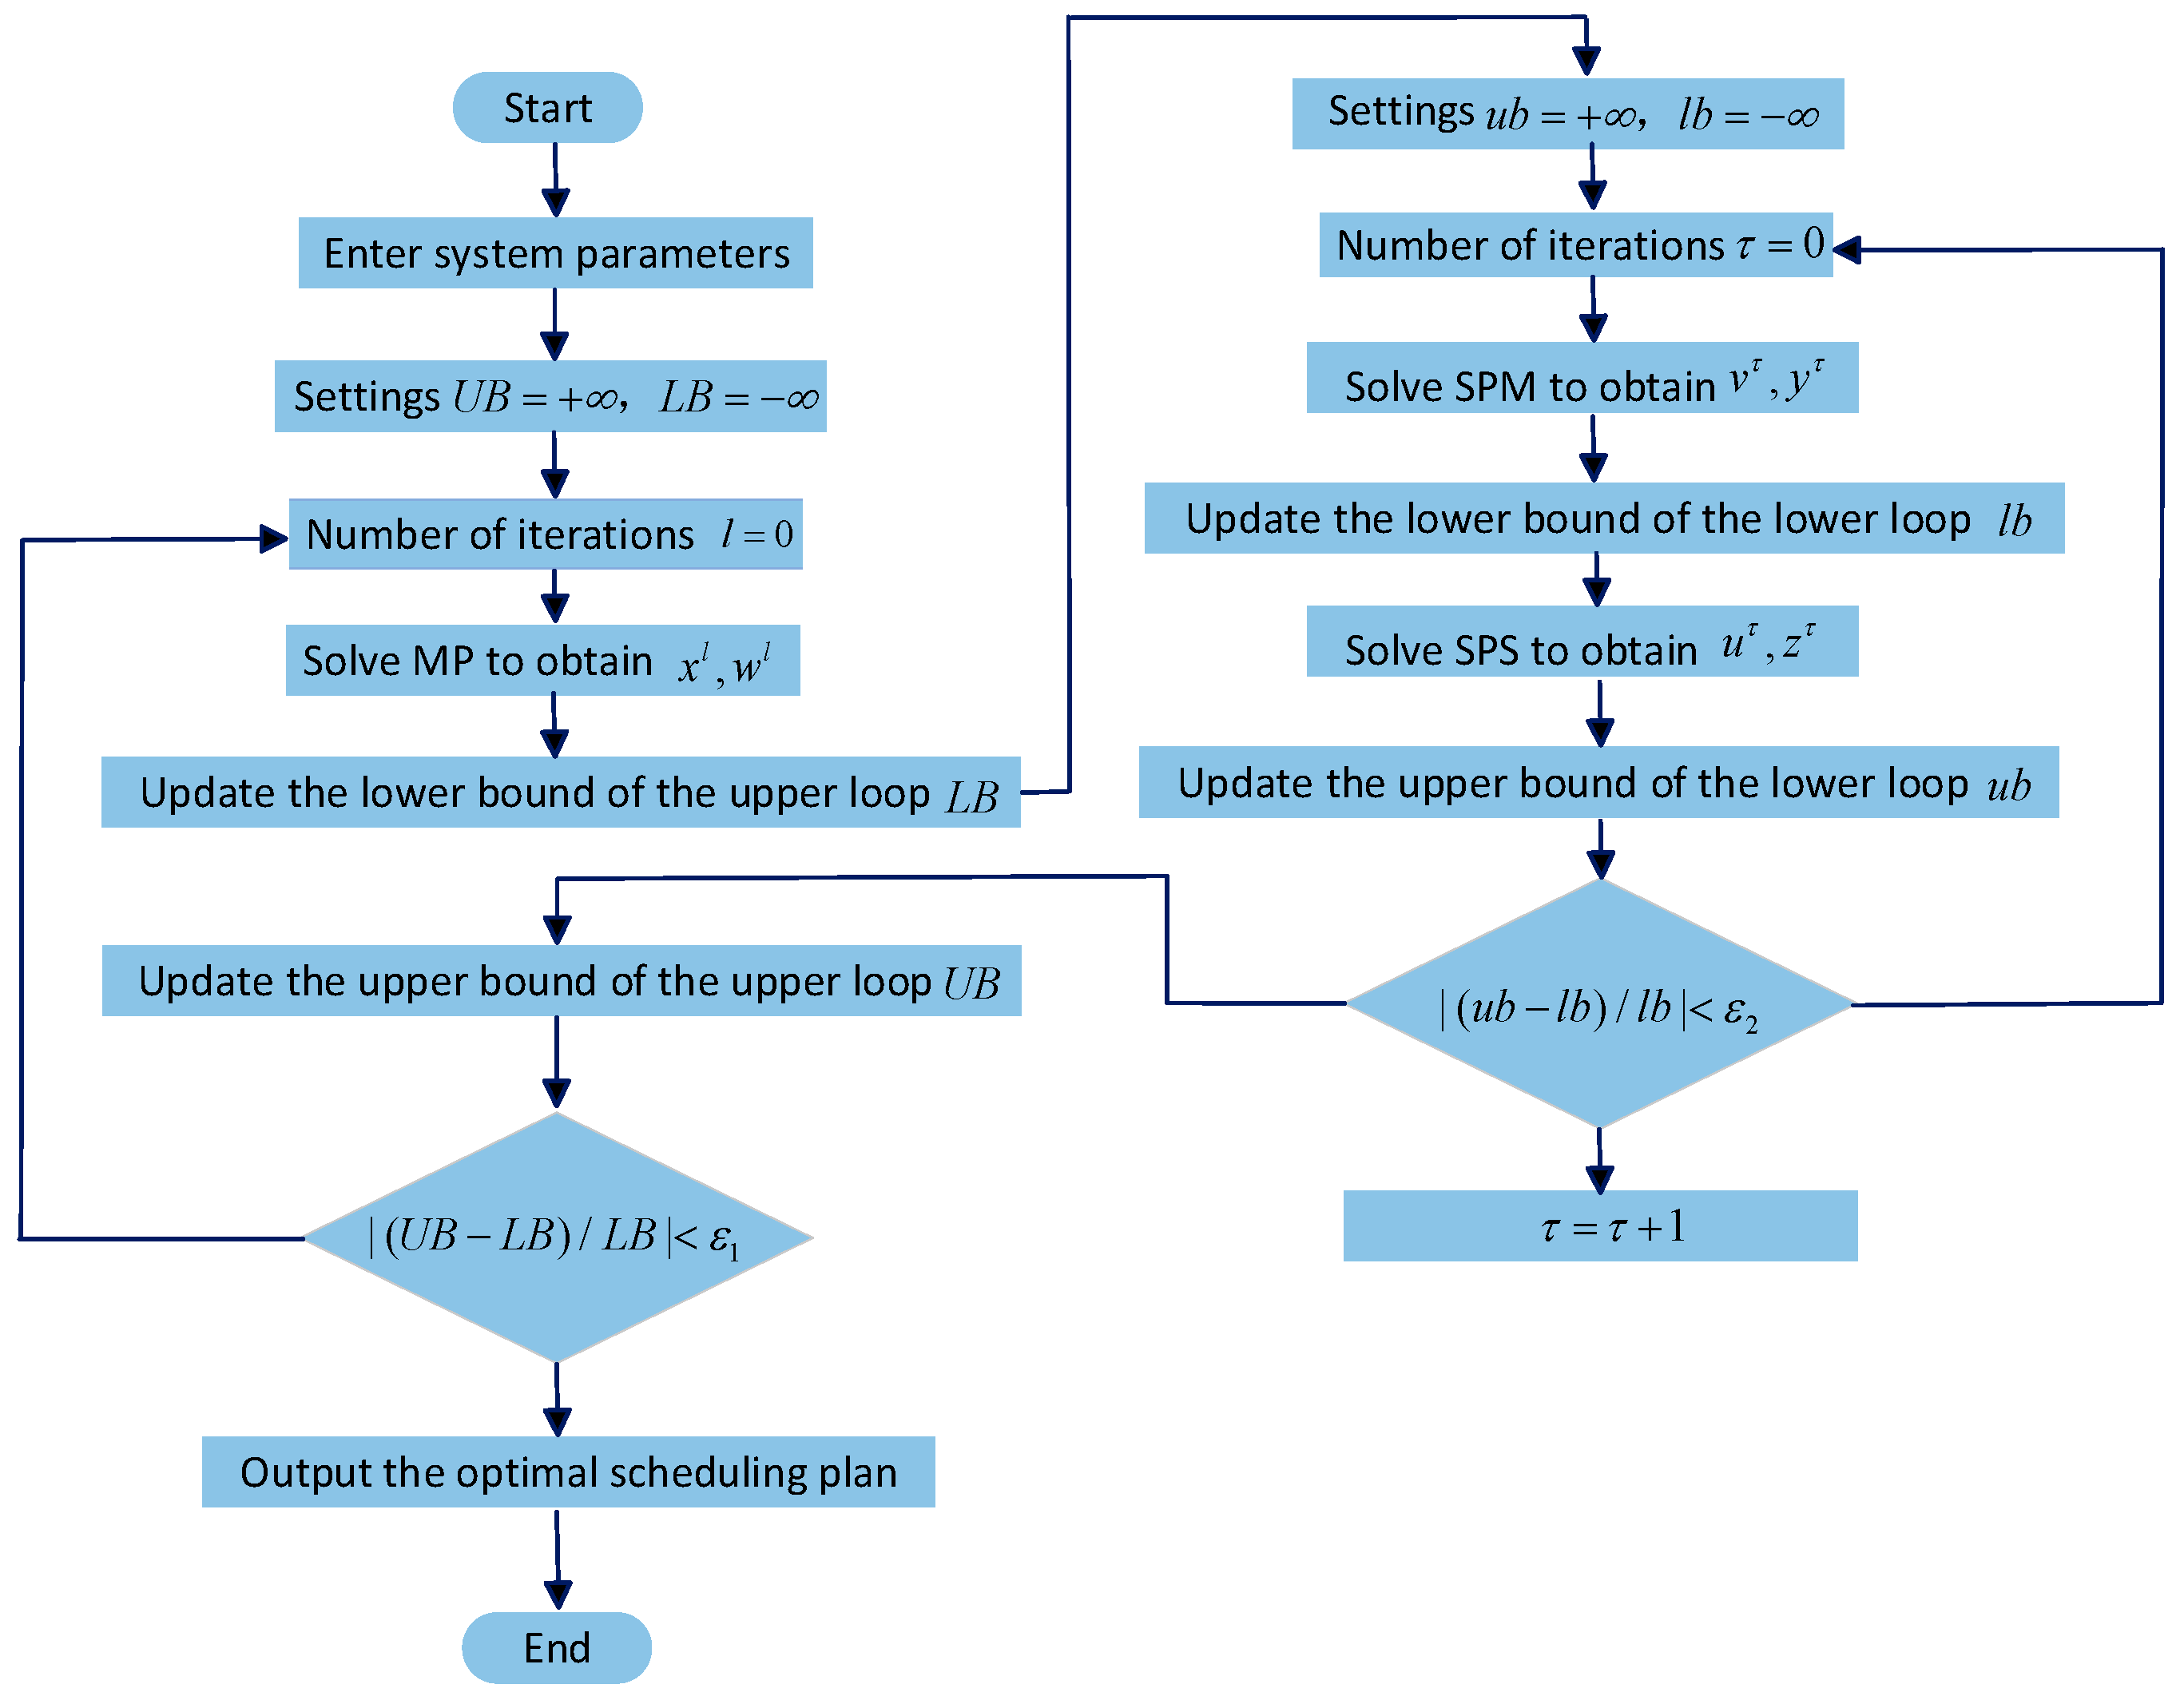
The pseudocode for the parallelizable AOP-Looped C&CG algorithm is shown in Algorithm 1 and Figure 3.
Algorithm 1: Parallelizable Computation AOP-Looped C&CG Algorithm
1: Parallelizable Computation Outer -Loop C&CG: Set the lower bound L B = , the upper bound U B = + , the number of iterations l = 0 , the convergence threshold ε 1 , the seasonal scenario probability σ , 0 , the typical day scenario probability ρ , 0 , the power purchase and sale price v , 0 , and the wind-solar and electric-heat load u , 0 .
2: repeat
3:   Substitute ( σ , l , ρ , l , v , l , u , l ) into MP, optimize to get ( x l , w l ) and the objective function value o b j M P l , and update L B = o b j M P l .
4:   Parallelizable Computation Inner -Loop C&CG: Set the lower bound l b = , the upper bound u b = + , the number of iterations τ = 0 , and the convergence threshold ε 2 .
5:   repeat
6:      FFO i j
7:      repeat
8:         Substitute ( x l , w l ) into SPM, optimize to get ( v τ , y τ ) and the objective function value o b j S P M τ , and update l b = o b j S P M τ .
9:           Substitute ( x l , w l , v τ , y τ ) into SPS, optimize to get ( u τ , z τ ) and the objective function value o b j S P S τ , and update u b = ( v τ ) T y τ + o b j S P S τ .
10:        τ = τ + 1 .
11:     until  | ( u b l b ) / l b | < ε 2 , and return ( v τ , u τ ) as ( v , l , u , l ) to MP.
12:   until F F O i j
13:   Substitute o b j S P M τ into S P 1 , optimize to get ρ τ and the objective function value o b j S P 1 τ , and return ρ τ as ρ , l to MP.
14:   Substitute o b j S P 1 τ into S P 2 , optimize to get σ τ and the objective function value o b j S P 2 τ , and return σ τ as σ , l to MP.
15:   Update U B ˜ = A T w l + o b j S P 2 τ .
16:    l = l + 1 .
17: unti  | ( U B L B ) / L B | < ε 1 , and output the optimization result.
The PH algorithm can be used to solve MP. The process is shown in Algorithm 2 below:
Algorithm 2: Progressive Hedging Distributed Algorithm (PH Algorithm)
1. Initialize iteration count τ = 0 . Set the penalty factor for the algorithm P and Convergence threshold ε
2 .   for   s = 1   to   N s   d o
x s τ a r g m a x x C T x + B T y s : x , y s Q s
x ¯ τ s N s π s x s τ
η s ( τ ) : = P x s ( τ ) x ¯ ( τ )
6. end
7. Adjust the discrete values of transaction prices based on the results of the initialization phase in each scenario.
8. repeat
τ = τ + 1
for   s = 1   to   N s   do
x s ( τ ) : = a r g m a x x C T x + B T y s η s ( τ 1 ) x P 2 x x ¯ ( τ 1 ) 2 :
x , y s Q s
i f   τ τ 1   t h e n
Adjusting penalty factors, such as making P = P 1
e n d   i f
x ¯ ( τ ) : = s N s π s x s ( τ )
η s ( τ ) : = η s ( τ 1 ) + P x s ( τ ) x ¯ ( τ )
e n d
u n t i l   s N s π s x s ( τ ) x ¯ ( τ ) < ε

4. Multi-MG Energy Interaction Optimization Model Considering Electricity Price Uncertainty and Deceptive Behavior

4.1. Multi-MG Energy Interaction Game Strategy Considering Electricity Price Uncertainty and Deceptive Behavior

This paper assumes that each MG belongs to different holders and shares the rights of energy trading and pricing with other MGs. Each MG, as an independent rational entity, aims to maximize its benefits through cooperation. This paper adopts the Nash bargaining model to ensure that all participating MGs in the multi-MG system achieve Pareto optimal gains. By applying the Nash bargaining game theory, the model is formulated as follows:
max i = 1 N C i g a p + τ i s . t .   C i g a p + τ i 0 , i N C i g a p = C i 0 C i 1 , i N ρ i j = ρ j i P e i j = P e j i i = 1 N τ i = 0 ρ i j > λ s
where N represents the number of MGs participating in Nash bargaining; C i 0 is the negotiation breakdown point, referring to the cost of each MG before cooperation; C i 1 is the cost of each MG after participating in energy sharing; ρ i j is the electricity trading price from microgrid i to microgrid j ; τ i is the electricity payment item; P e i j is The electrical power exchanged between microgrid i and microgrid j ; λ s is Internet access prices.
The Nash bargaining cooperative game model is essentially a non-convex nonlinear optimization problem, which is difficult to solve directly. Therefore, it is converted into two easily solvable sub-problems: the multi-MG coalition benefit maximization sub-problem and the electricity trading revenue maximization sub-problem.
Sub-problem 1: Multi-MG Coalition Benefit Maximization Problem
min i = 1 N C i 1 s . t .   equations   ( 1 ) ( 8 ) , ( 11 ) ( 19 )
Sub-problem 2: Electricity Trading Revenue Maximization Sub-problem
min i = 1 N ln C i g a p * + τ i   s . t .   equation   ( 20 )
where ( C i g a p ) * is the optimal solution obtained from Sub-problem 1.
In this section, we consider the deceptive behavior of dishonest MGs pursuing their own interest maximization during energy sharing among multiple MG systems within the Nash bargaining framework. By solving the Nash bargaining cooperative game model, we obtain the optimal solution for electricity trading payment τ i * .
τ i * = j N \ { i } C j g a p ( N 1 ) C i g a p / N
Under conditions where the true information of other MGs is unknown and it is uncertain whether other MGs are deceptive. Each MG has a motivation to deceive, aiming to quote a smaller C i g a p in the electricity trading phase to obtain more revenue τ i * .
After considering deceptive behavior, the quotation C i , R g a p for each MG is expressed as:
C i , R g a p = C i g a p γ i C i g a p
where γ i is deception factor. In an honest MG, the deception factor is set to 0. Considering that participation in energy sharing by MGs leads to optimal benefits for the multi-MG coalition and ensures that all participants achieve Pareto-optimal gains. Each MG will avoid cooperation failure. Therefore, after considering deceptive behavior, the following inequality constraint should be satisfied:
i = 1 N C i , R g a p > 0
To satisfy inequality (25), an upper limit exists for the deception factor:
γ i limit   = C i gap   + j N \ { i } C j , R gap / C i gap
The upper limit of the deception factors for each MG dynamically changes with the deceptive behavior of other MGs. The optimal revenue τ i * obtained from electricity trading payments in the negotiation phase is influenced by both its own and other MGs’ deceptive behaviors. Therefore, each MG should carefully consider its own deceptive behavior. The solution to dynamic deceptive behavior can be viewed as a deceptive equilibrium i = 1 N C i , R g a p ( γ i * ) = σ , where σ is a very small positive number close to 0, at which point there exists an optimal deception factor γ i * . In such a deceptive equilibrium, no MG can unilaterally find a larger deception factor without affecting the interests of other MGs to increase its own revenue. That is, in the deceptive equilibrium, all MGs believe that their chosen deceptive behavior is the best option and will not change.
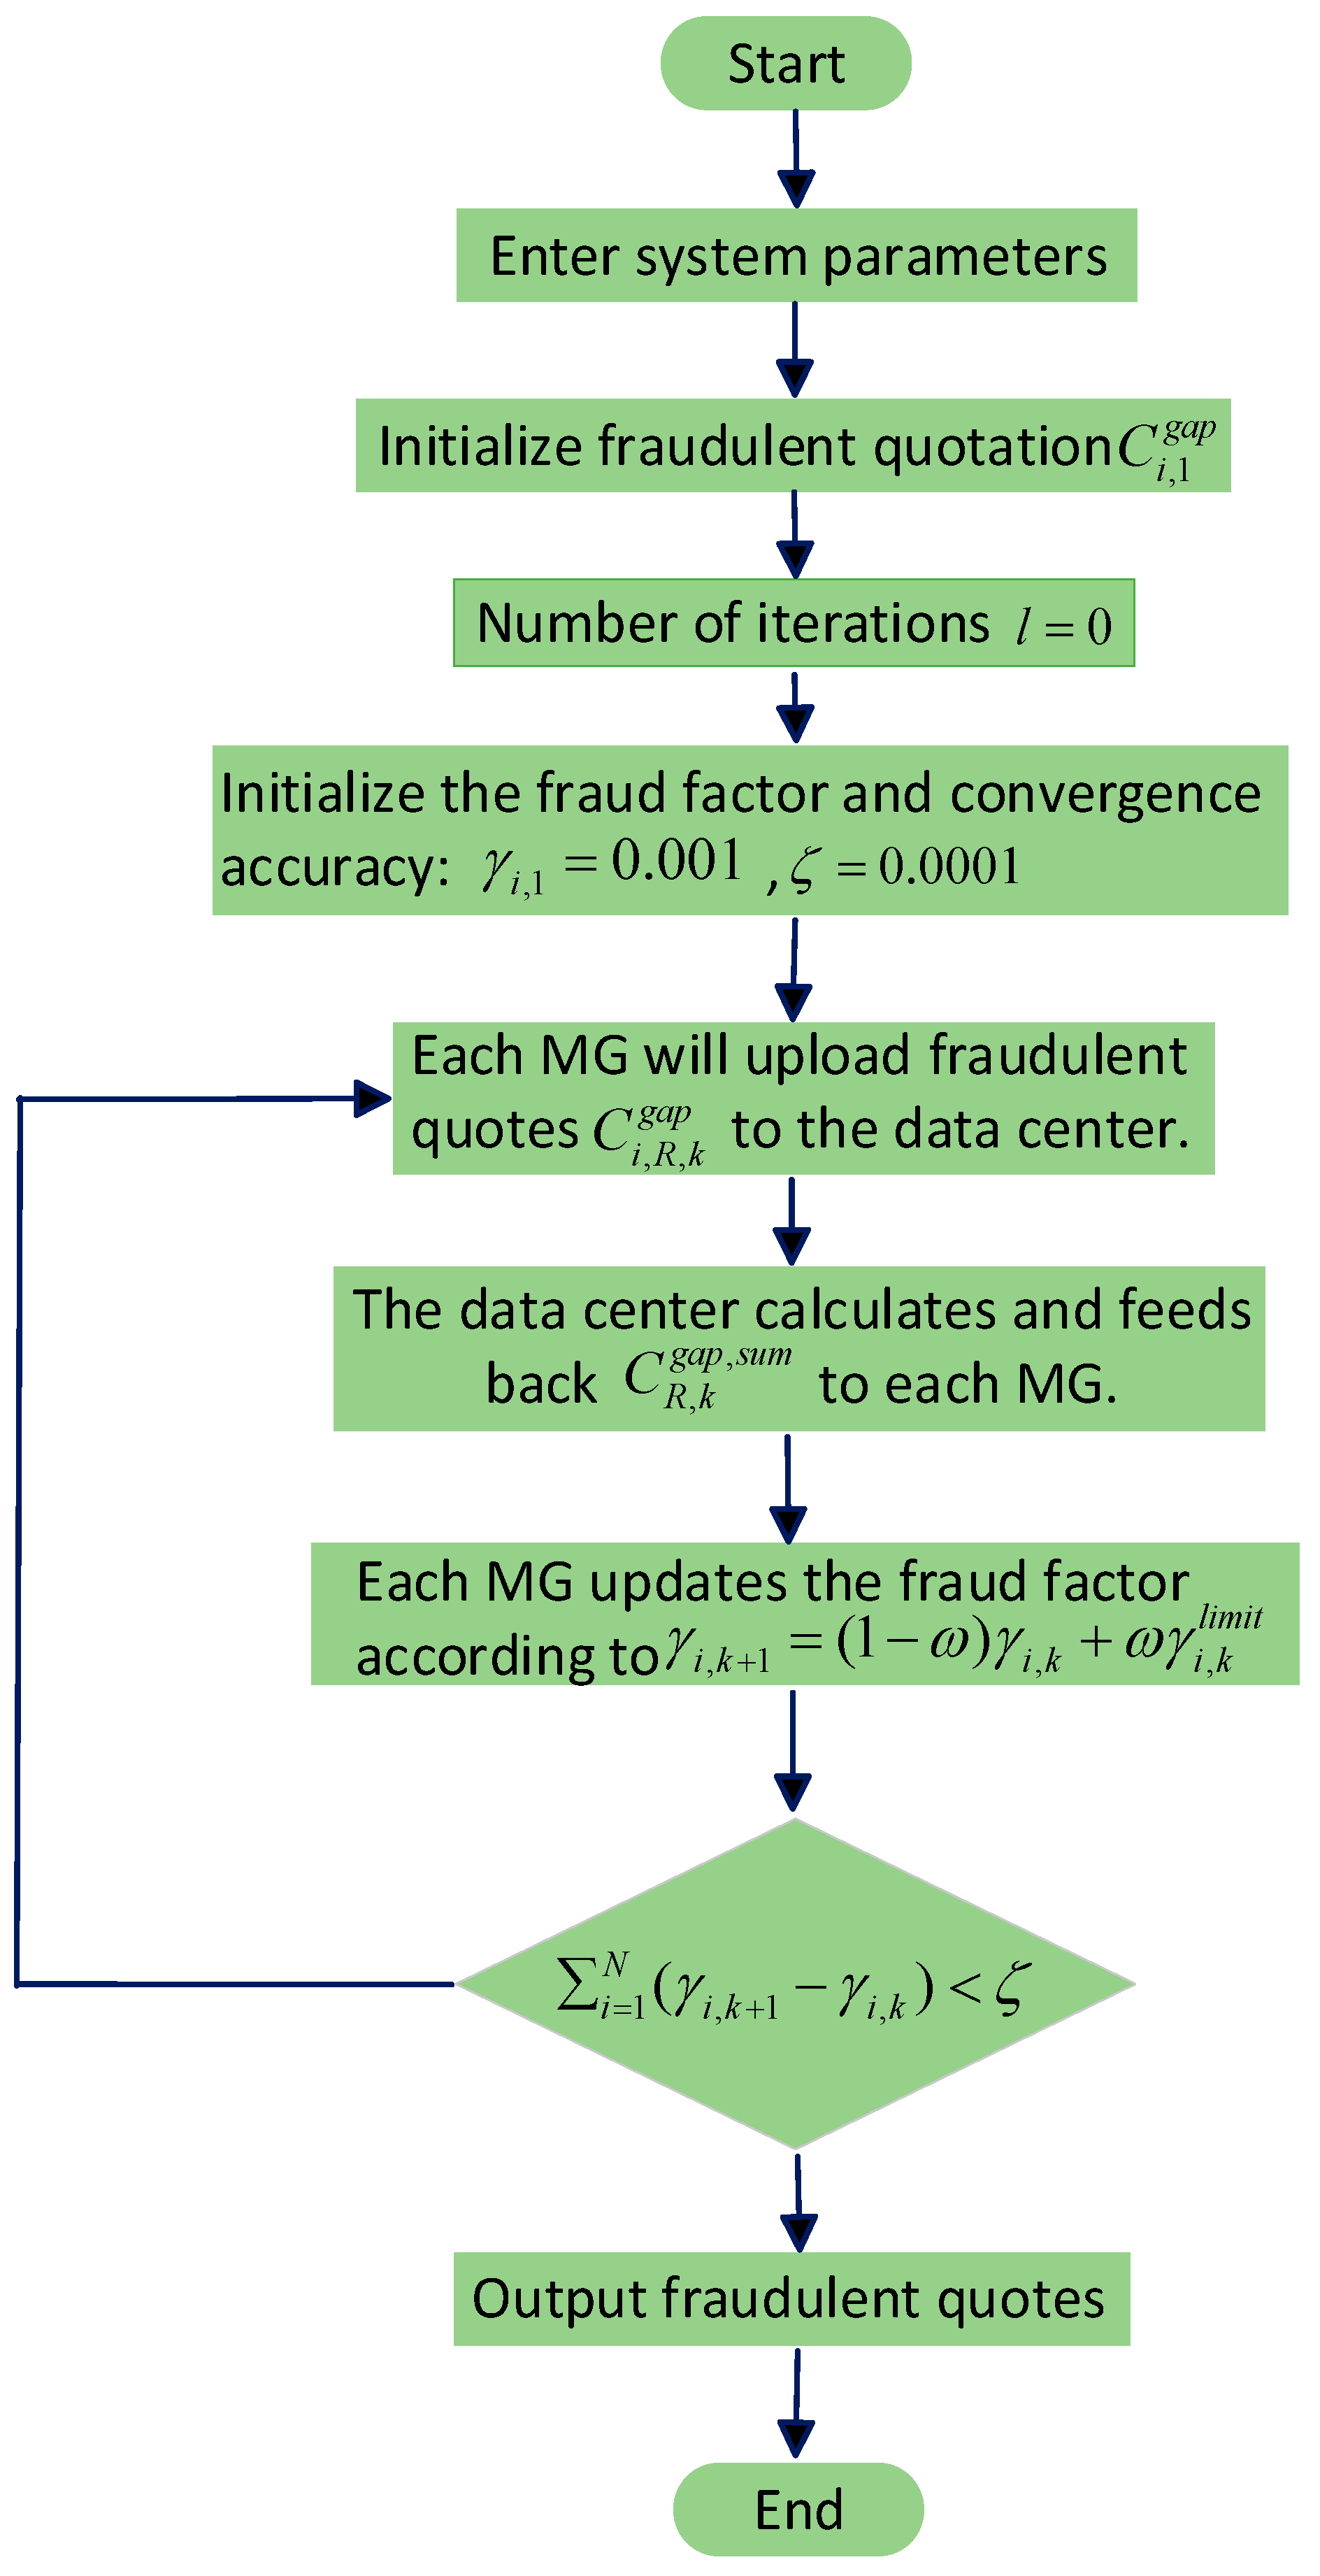
All MGs participate in deceptive negotiations through a data-centric mode, effectively avoiding the privacy disclosure of all participating entities. The data-centric mode requires a trusted third party by all MGs to aggregate the deceptive quotations and feedback the results to each MG. The flowchart is shown in Figure 4.
The solution process for the data-centric mode is as follows:
(1)
Initialize the deceptive quotation C i , 1 g a p for each MG, set the iteration count to k = 1, the deception factor to γ i , 1 = 0.001 , and the convergence precision ζ = 0.0001 .
(2)
Each MG performs a deceptive quotation according to the formula
C i , R , k g a p = C i g a p γ i , k | C i g a p |
and uploads the deceptive quotation C i , R , k g a p to the data center.
(3)
The data center calculates
C R , k g a p , s u m = i = 1 N C i , R , k g a p
and feeds back the sum of deceptive quotations C R , k g a p , s u m to each MG.
(4)
Each MG updates the deception factor according to the formula
γ i , k + 1 = ( 1 ω ) γ i , k + ω γ i , k l i m i t
where
γ i , k l i m i t = ( C i g a p + C R , k g a p , s u m C i , R , k g a p ) / | C i g a p |
and ω is the relaxation coefficient with a value range of 0 < ω < 1 / N .
(5)
Check for convergence; if i = 1 N ( γ i , k + 1 γ i , k ) < ζ , output the deceptive quotation C i , R , k g a p ; otherwise, set k = k + 1 and repeat steps (2) to (5).
The dynamic fraud factor adjustment mechanism proposed above essentially extends the classical Nash bargaining equilibrium. Unlike existing static penalty methods, which assume that fraudulent behavior is fixed, our model establishes a dynamic deception equilibrium characterized by an upper bound on the fraud factor that depends on the real-time quotes of other MG players, thereby forming a closed-loop feedback between players’ deception strategies. This captures the strategic interdependence that has been overlooked in previous studies. Second, data-centric update rules form a distributed iterative learning process. This process converges to a dynamic deception equilibrium where any unilateral deviation does not increase profits, thereby achieving Nash stability under deception.

4.2. Solution for the Multi-MG Energy Sharing Nash Bargaining Model

Considering separable convex functions and constraint conditions that the multi-MG coalition benefit maximization sub-problem and the electricity trading revenue maximization sub-problem have, the ADMM is utilized for distributed optimization.
Solution for the Multi-MG Coalition Benefit Maximization Sub-problem Based on ADMM
Introduce Lagrange multipliers λ i j and penalty factors ρ to construct the augmented Lagrangian function:
L = i = 1 N C i 1 + j N \ { i } t = 1 T λ i j P e i j , t + P e j i , t + j N \ { i } t = 1 T ρ 2 P e i j , t + P e j i , t 2 2
Based on the principle of the ADMM algorithm, decompose Equation (27) to obtain the distributed optimization operation model for each MG. For illustration purposes, take MG1 as an example:
min C i 1 + j N \ { i } t = 1 T λ i j P e i j , t + P e j i , t + j N \ { i } t = 1 T ρ 2 P e i j , t + P e j i , t 2 2   s . t .   Equation   ( 1 ) ( 8 ) Equation   ( 11 ) ( 19 )
The distributed optimization operation models for other MGs are the same as that of MG1.
Using three MGs as an example, establish a distributed algorithm for the multi-MG coalition benefit maximization sub-problem.
Solution for Electricity Trading Revenue Maximization Sub-problem Based on ADMM
By solving the multi-MG coalition benefit maximization sub-problem and the game deception problem, the optimal expected trading volume P e i j , t * between MGs and the deceptive quotation C i , R g a p * of each MG are obtained. Substituting them into the electricity trading revenue maximization sub-problem yields:
min i = 1 N ln C i , R g a p * + τ i   s . t .   ρ i j > λ s C i , R g a p * + τ i > 0 τ i = j N \ { i } t = 1 T ρ i j , t P e i j , t *
Introduce Lagrange multipliers σ i j and penalty factors γ to construct the augmented Lagrangian function.
L = i = 1 N ln C i , R g a p * + τ i + i = 1 N j N \ { i } t = 1 T σ i j ρ i j , t ρ j i , t + γ 2 ρ i j , t ρ j i , t 2 2
Based on the principle of the ADMM algorithm, decompose Equation (30) to obtain the distributed optimization operation model for each MG. An explanation is provided using MG1 as an example:
min ln C 1 , R gap * + τ 1 + j N \ { 1 } t = 1 T σ 1 j ρ 1 j , t ρ j 1 , t + γ 2 ρ 1 j , t ρ j 1 , t 2 2

4.3. Solution Algorithm

  • Distributed Algorithm for the Multi-MG Coalition Benefit Maximization Sub-problem
    (1)
    Set the maximum iteration count k max = 100 , convergence precision ζ = 0.1, penalty factor ρ = 0.01, initial iteration count k = 1, and initial inter-MG power exchange P e i j , t = 0 .
    (2)
    Solve the distributed optimization operation model for MG1. From MG2, receive the expected power transmission P e 21 , t k from MG2 to MG1; from MG3, receive the expected power transmission P e 31 , t k from MG3 to MG1. Obtain the expected power transmission P e 12 , t k + 1 from MG1 to MG2 and P e 13 , t k + 1 from MG1 to MG3.
    (3)
    Solve the distributed optimization operation model for MG2. From MG1, receive the expected power transmission P e 12 , t k + 1 from MG1 to MG2; from MG3, receive the expected power transmission P e 32 , t k from MG3 to MG2. Obtain the expected power transmission P e 21 , t k + 1 from MG2 to MG1 and P e 23 , t k + 1 from MG2 to MG3.
    (4)
    Solve the distributed optimization operation model for MG3. From MG1, receive the expected power transmission P e 13 , t k + 1 from MG1 to MG3; from MG2, receive the expected power transmission P e 23 , t k + 1 from MG2 to MG3. Obtain the expected power transmission P e 31 , t k + 1 from MG3 to MG1 and P e 32 , t k + 1 from MG3 to MG2.
    (5)
    Update the Lagrange multipliers:
    λ 12 , t k + 1 = λ 12 , t k + ρ P e 12 , t k + 1 + P e 21 , t k + 1 λ 13 , t k + 1 = λ 13 , t k + ρ P e 13 , t k + 1 + P e 31 , t k + 1 λ 23 , t k + 1 = λ 23 , t k + ρ P e 23 , t k + 1 + P e 32 , t k + 1
    (6)
    Check the convergence of the algorithm. If equation (B2) is satisfied, terminate the iteration:
    i = 1 N j N { i } t = 1 T P e i j , t k + 1 + P e j i , t k + 1 < ζ » ò   k > k max
    (7)
    Otherwise, set k = k + 1 and repeat steps (2) to (6).
  • Distributed Algorithm for the Electricity Trading Revenue Maximization Sub-problem
    (1)
    Set the maximum iteration count k max = 100 , convergence precision ζ = 0.1, penalty factor γ = 10, initial iteration count k = 1, and initial inter-MG trading price ρ i j , t = 0 .
    (2)
    Solve the distributed optimization operation model for MG1. From MG2, receive the expected trading price ρ 21 , t k from MG2 to MG1; from MG3, receive the expected trading price ρ 31 , t k from MG3 to MG1. Obtain the expected trading prices ρ 12 , t k + 1 from MG1 to MG2 and ρ 13 , t k + 1 from MG1 to MG3.
    (3)
    Solve the distributed optimization operation model for MG2. From MG1, receive the expected trading price ρ 12 , t k + 1 from MG1 to MG2; from MG3, receive the expected trading price ρ 32 , t k from MG3 to MG2. Obtain the expected trading prices ρ 21 , t k + 1 from MG2 to MG1 and ρ 23 , t k + 1 from MG2 to MG3.
    (4)
    Solve the distributed optimization operation model for MG3. From MG1, receive the expected trading price ρ 13 , t k + 1 from MG1 to MG3; from MG2, receive the expected trading price ρ 23 , t k + 1 from MG2 to MG3. Obtain the expected trading prices ρ 31 , t k + 1 from MG3 to MG1 and ρ 32 , t k + 1 from MG3 to MG2.
    (5)
    Update the Lagrange multipliers:
    σ 12 , t k + 1 = σ 12 , t k + γ ρ 12 , t k + 1 ρ 21 , t k + 1 σ 13 , t k + 1 = σ 13 , t k + γ ρ 13 , t k + 1 ρ 31 , t k + 1 σ 21 , t k + 1 = σ 21 , t k + γ ρ 21 , t k + 1 ρ 12 , t k + 1 σ 23 , t k + 1 = σ 23 , t k + γ ρ 23 , t k + 1 ρ 32 , t k + 1 σ 31 , t k + 1 = σ 31 , t k + γ ρ 31 , t k + 1 ρ 13 , t k + 1 σ 32 , t k + 1 = σ 32 , t k + γ ρ 32 , t k + 1 ρ 23 , t k + 1
    (6)
    Check the convergence of the algorithm:
    If the following condition is satisfied, terminate the iteration:
    i = 1 N j N { i } t = 1 T P e i j , t k + 1 + P e j i , t k + 1 < ζ or   k > k max
    (7)
    Otherwise, set k = k + 1, and repeat steps (2) to (5).

5. Case Study

In this paper, under the Matlab compilation environment, a multi-MG and CES fraud game model is established using the Yalmip toolbox. Because the microgrid model is MILP, the Gurobi solver is used to solve the cost minimization optimization problem of the alliance. The electricity trading problem between shared energy storage and microgrids involves non-linear terms as shown in “ln”, so the Mosek solver is used for solving, and the solution accuracy is set to the default accuracy.

5.1. Basic Data and System Structure Description

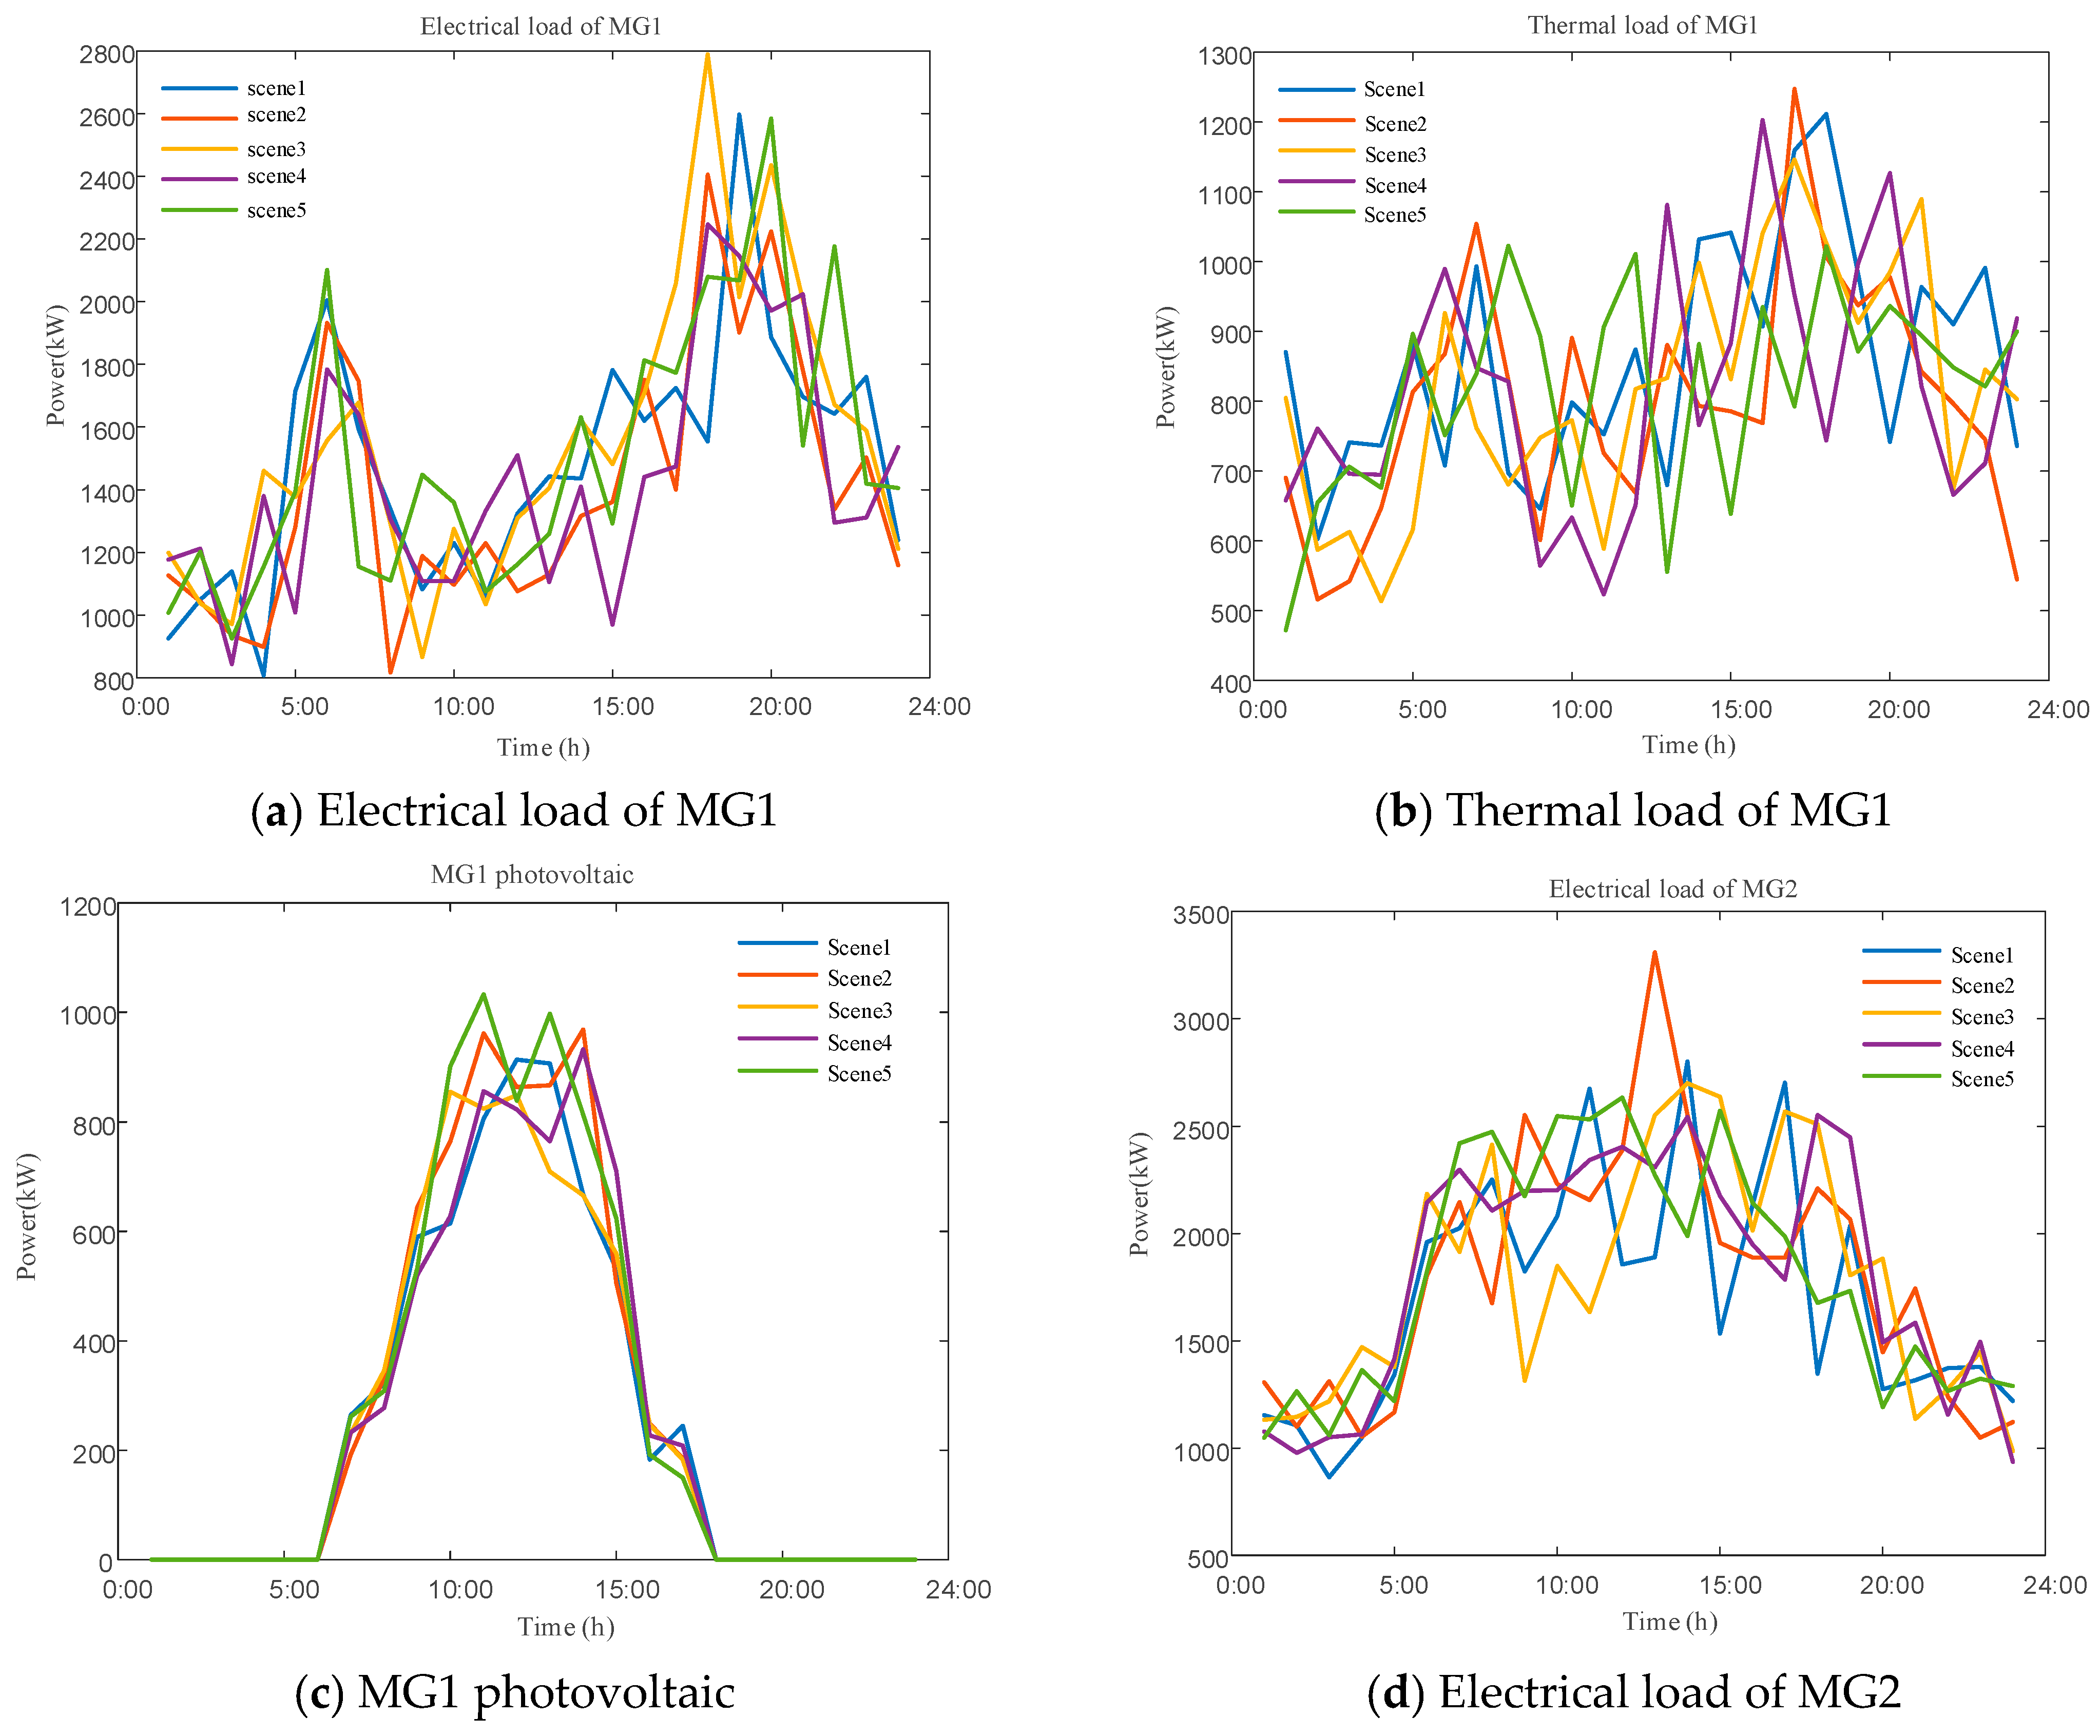
This paper considers power sharing between three MGs and one CES. All three MG models are CHP models, while the CES model is a pure electricity model. The purchase and sale prices of electricity from the external grid and the purchase price of gas from the gas network for the MG are shown in Table 1. All three MGs are equipped with renewable energy units. The renewable energy data and load data for the three MGs are shown in Figure 5. The total installed capacity of renewable energy across five scenarios is 32,730.14 kW, 31,635.38 kW, 30,345.92 kW, 30,897.53 kW, and 30,873.4 kW. The historical electricity sales prices of the CES are shown in Figure 6. The initial scenario probabilities of the three MGs are shown in Table 2. Due to the inaccuracy of the predicted data, we need to use more sample data to make the solution results more accurate. However, introducing a large number of samples will greatly increase the difficulty of solving it and even lead to the explosion of solution dimensions, making it impossible to solve. Based on this, this paper uses the super Latin sampling method to generate 1000 sets of historical data scenarios and K-means clustering to cluster the obtained 1000 sets of data into 5 categories, which can ensure the reliability of the data and the stability of the calculation.

5.2. Scheduling Plan

In this section, the goal of the dispatch plan is to optimize the energy exchange between MGs and CES to cope with various uncertainties such as fluctuations in renewable energy, changes in load demand, and fluctuations in electricity prices. The design of the dispatch plan should not only minimize the operating cost of each microgrid, but also ensure the reliability and economic benefits of the entire system.

5.2.1. Convergence Analysis

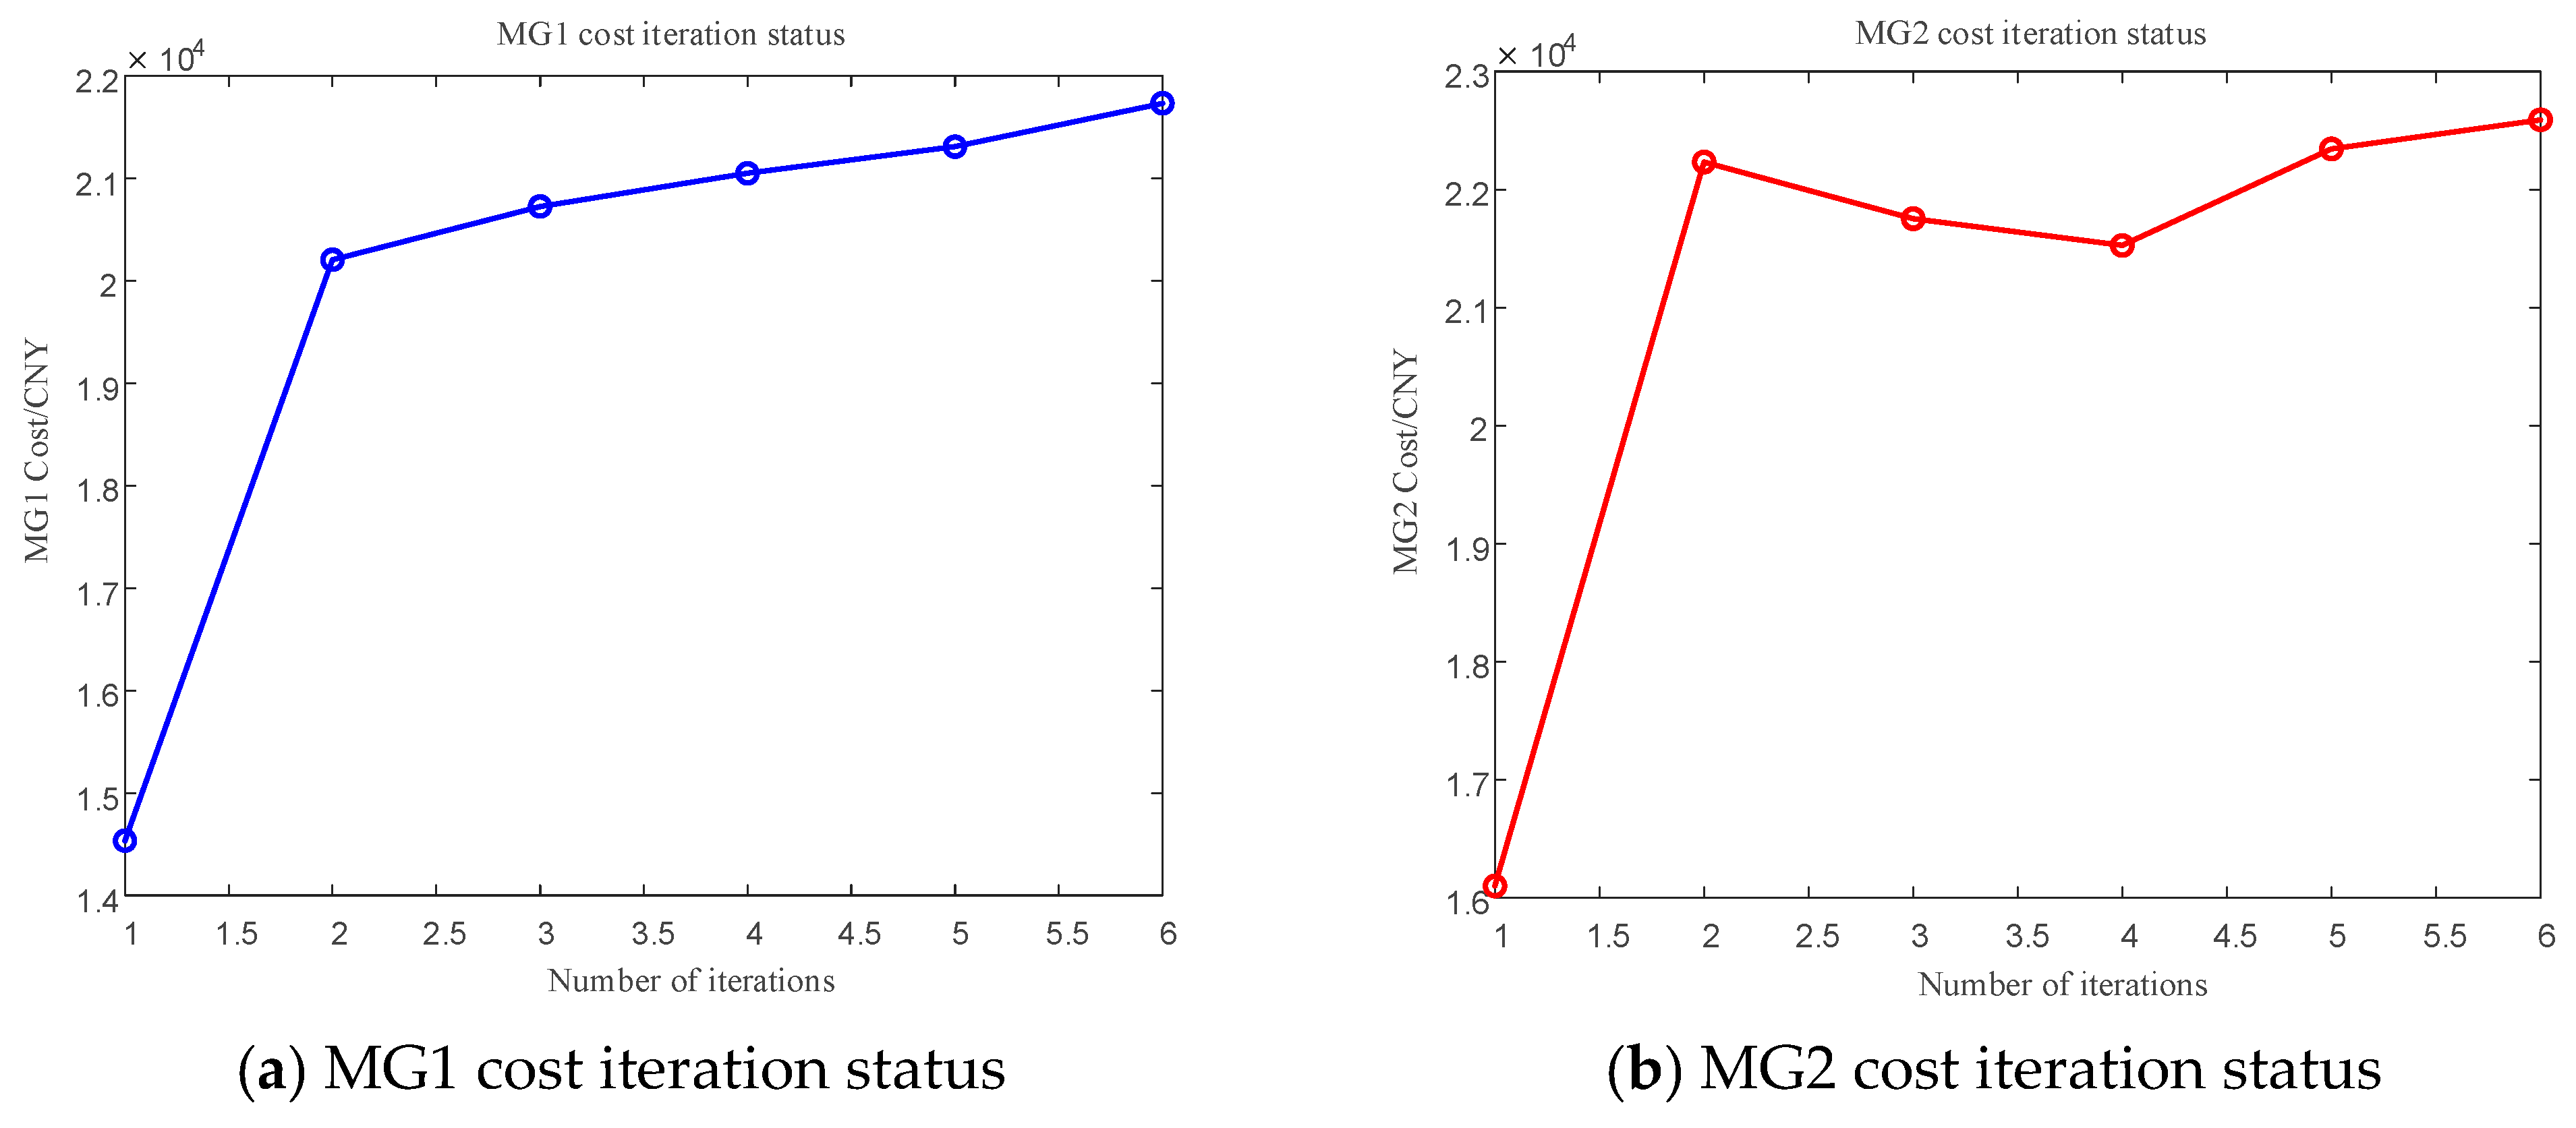
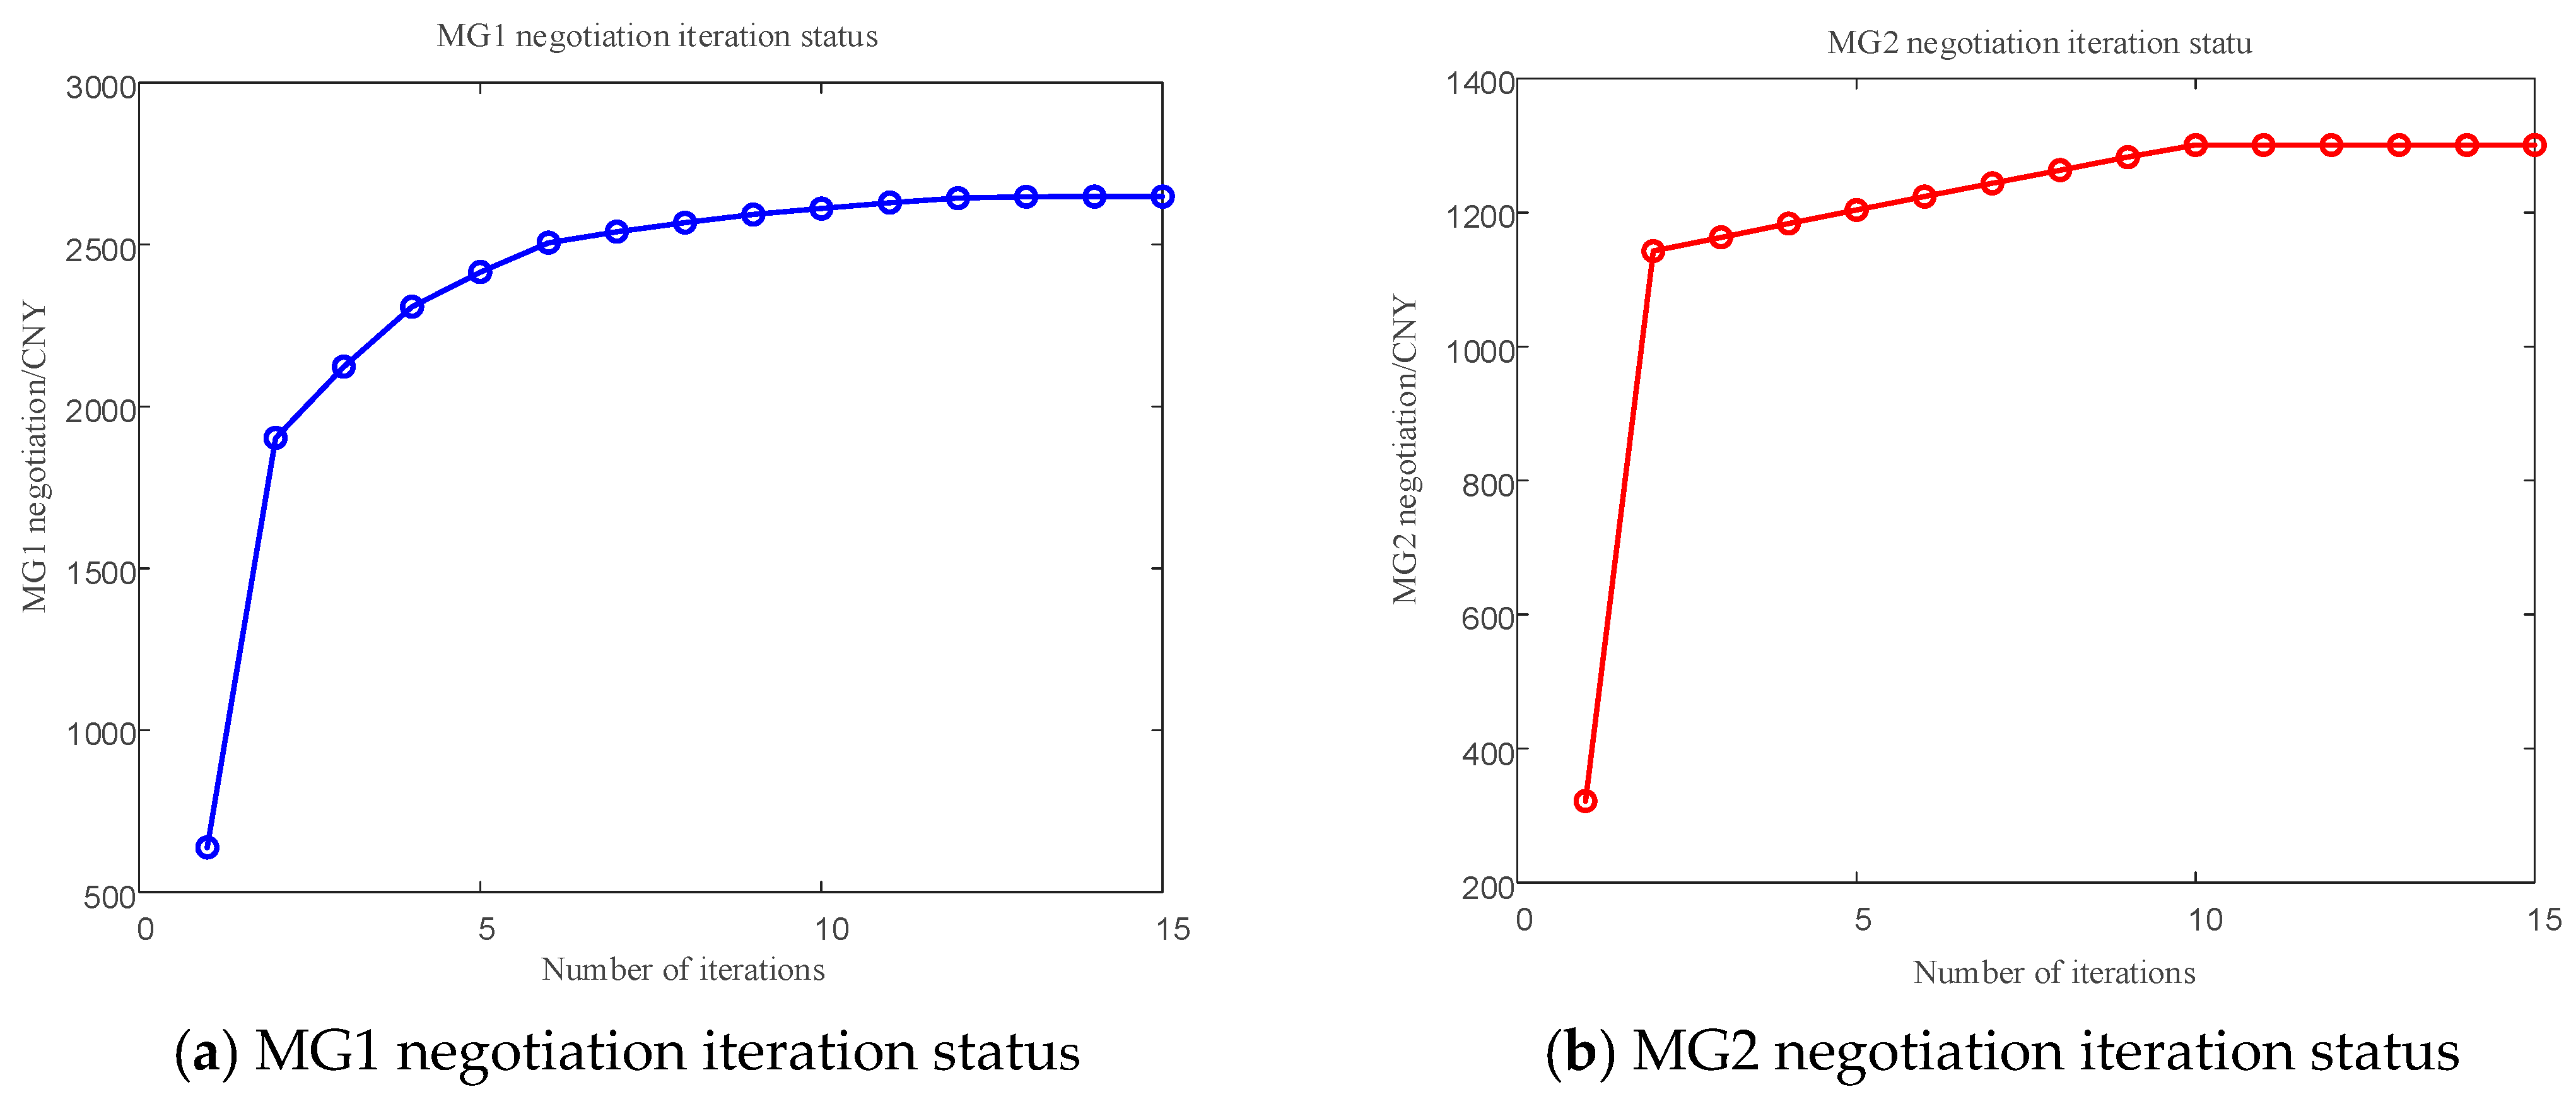
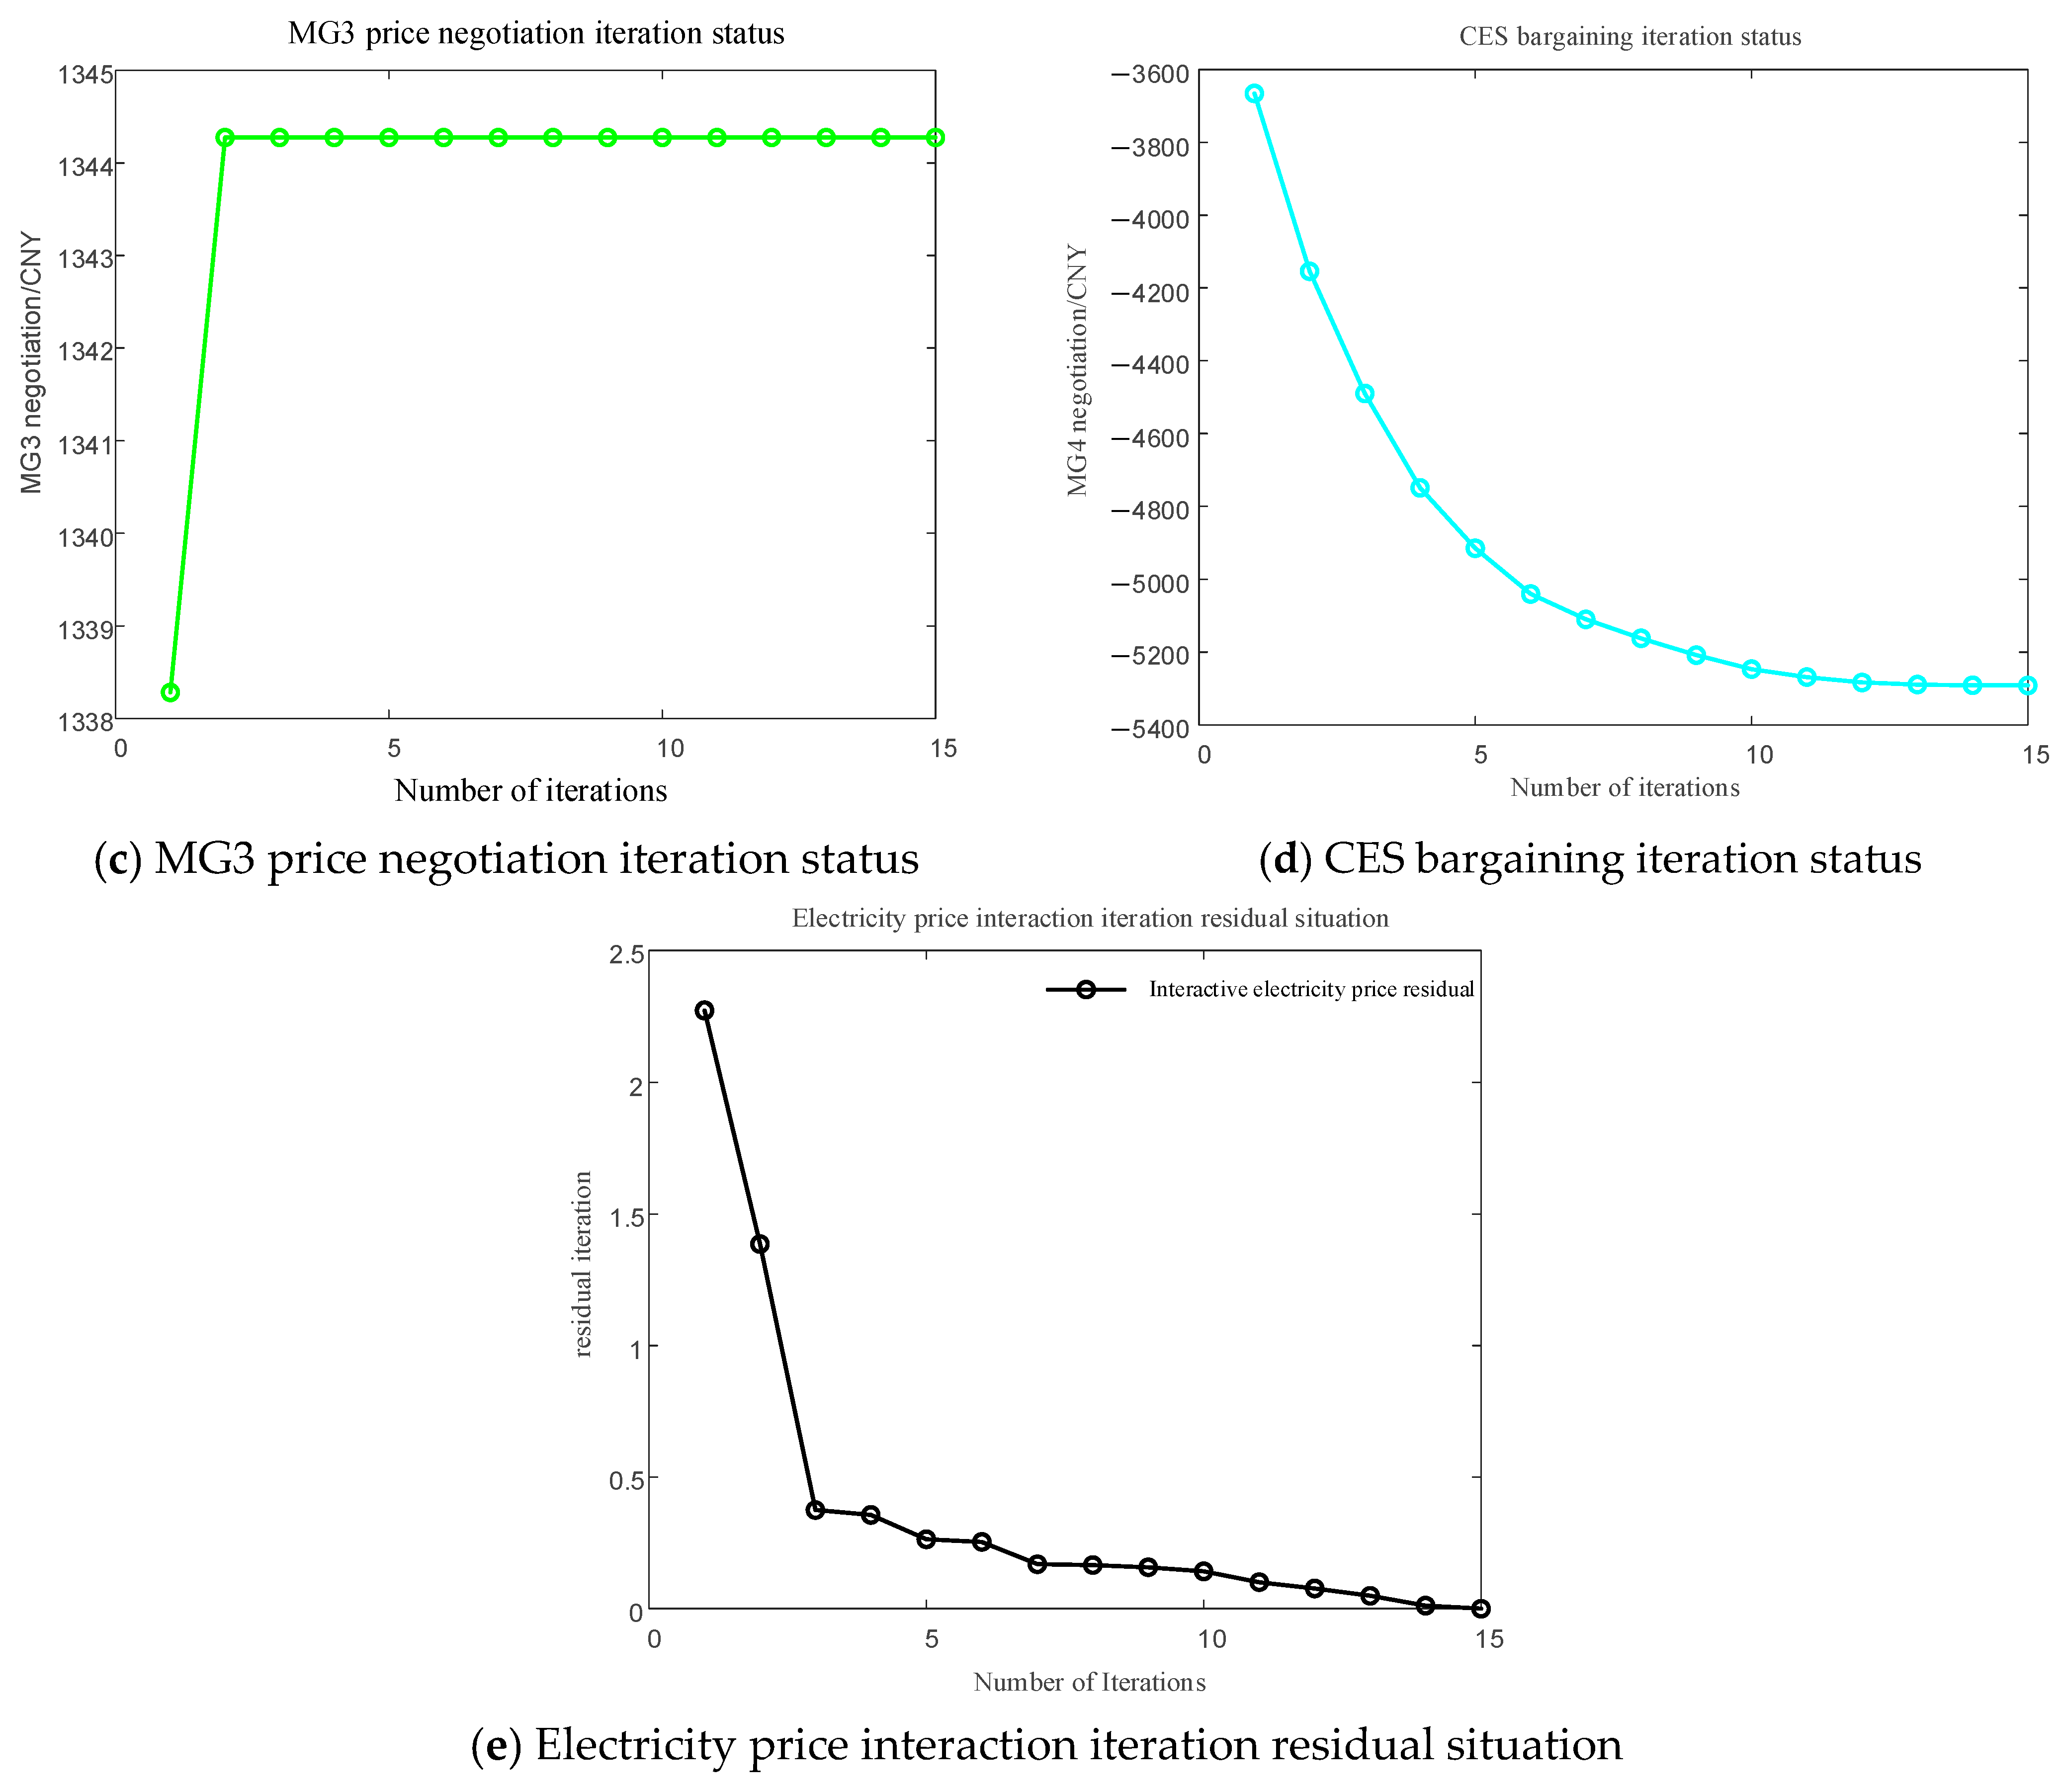
This paper employs the ADMM algorithm to distribute the solution of sub-problems 1 and 2. The iterative convergence results are shown in Figure 7 and Figure 8. Figure 4 presents the distributed iterative convergence results for sub-problem P1. As shown in Figure 7, under the assumption that the algorithm precision is set to 0.1, the proposed method converges after 6 iterations, with a computation time of 4278.3 s. The final convergence values for each MG are CNY 21,733.16, CNY 22,591.83, and CNY 14,423.83, and the final convergence value for CES is CNY 161.30. Figure 8 shows the distributed iterative convergence results for sub-problem P2. As shown in Figure 8, under the assumption that the algorithm precision is set to 0.1, the proposed method converged after 15 iterations, with a computation time of 27.1 s. The final bargaining results for each MG were CNY 2648.40, CNY 1300.48, and CNY 1344.27, while the final bargaining result for CES was CNY –5291.86. The residuals in Figure 4 and Figure 5 represent the sum of the differences in electricity interaction and electricity price interaction between microgrids, respectively. The formula are
r P 1 ( k ) = i = 1 N j i P e i j ( k ) P e j i ( k ) 2
and
r P 2 ( k ) = i = 1 N j i p e i j ( k ) p e j i ( k ) 2
The scalability results of the algorithm used in this paper under different objectives are shown in Table 3. We can see that as the microgrid scale increases, the number of iterations and the solution time also increase accordingly.
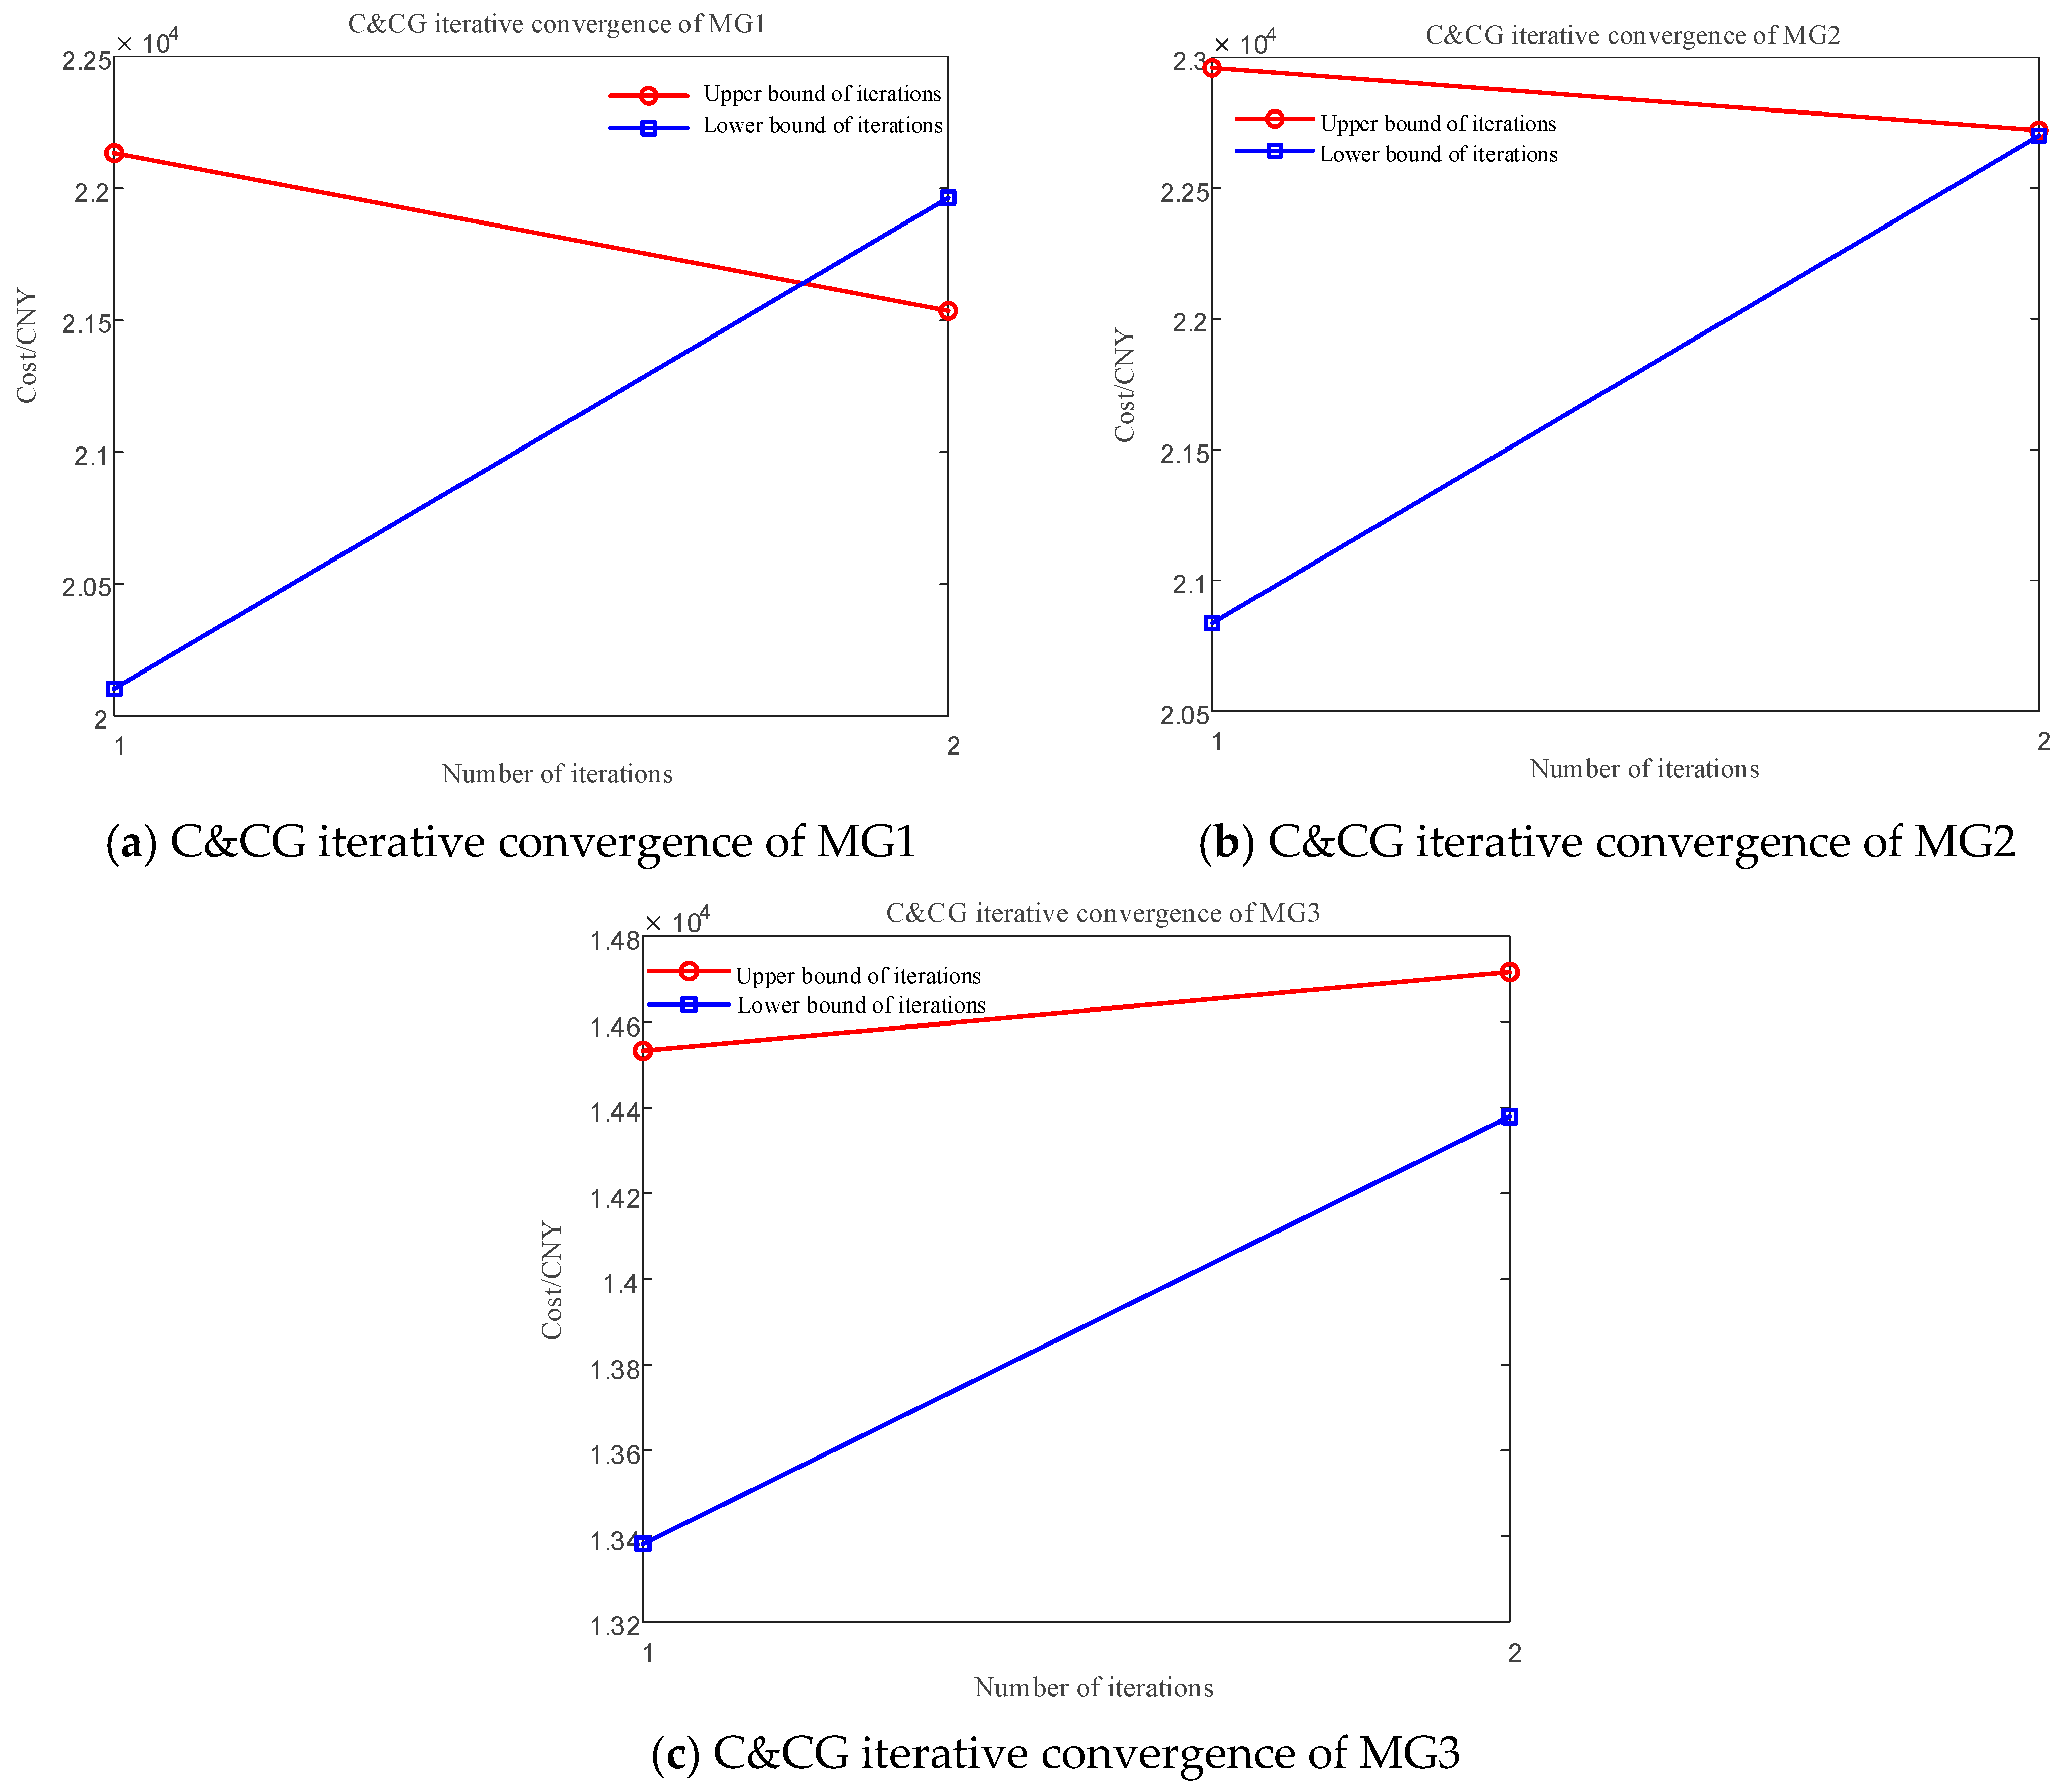
This paper employs the C&CG algorithm to solve the multi-scenario three-stage robust optimization model for each MG. The convergence status of the internal iterations within each MG at the 6th iteration under the distributed global problem-solving framework is shown in Figure 9. It can be observed that, under the condition of setting the algorithm accuracy to 0.01, the C&CG algorithm converges at the second iteration, reflecting its excellent convergence performance.
This paper employs the PH algorithm to solve the main problem MP in the multi-scenario three-stage robust optimization model for each MG. The convergence of the PH algorithm iterations for each MG during the second iteration under the C&CG algorithm framework is shown in Figure 10. It can be observed that, under the condition of setting the algorithm accuracy to 0.1, the PH algorithm converges within six iterations, reflecting its excellent convergence performance.
Since the optimization model for each MG in this paper is multi-scenario, three-stage, and robust and since the C&CG algorithm is used for solving it, let the current iteration number of the C&CG algorithm be k. Then, the number of decision variables for each MG is 1200k + 24, and there are a total of 75k + 1 constraints.
The results of solving each MG using the traditional C&CG algorithm and the C&CG -PH algorithm are shown in Table 4. It can be seen that the C&CG algorithm embedded with PH is superior to the ordinary C&CG algorithm in terms of the number of iterations and solution speed when solving problems.
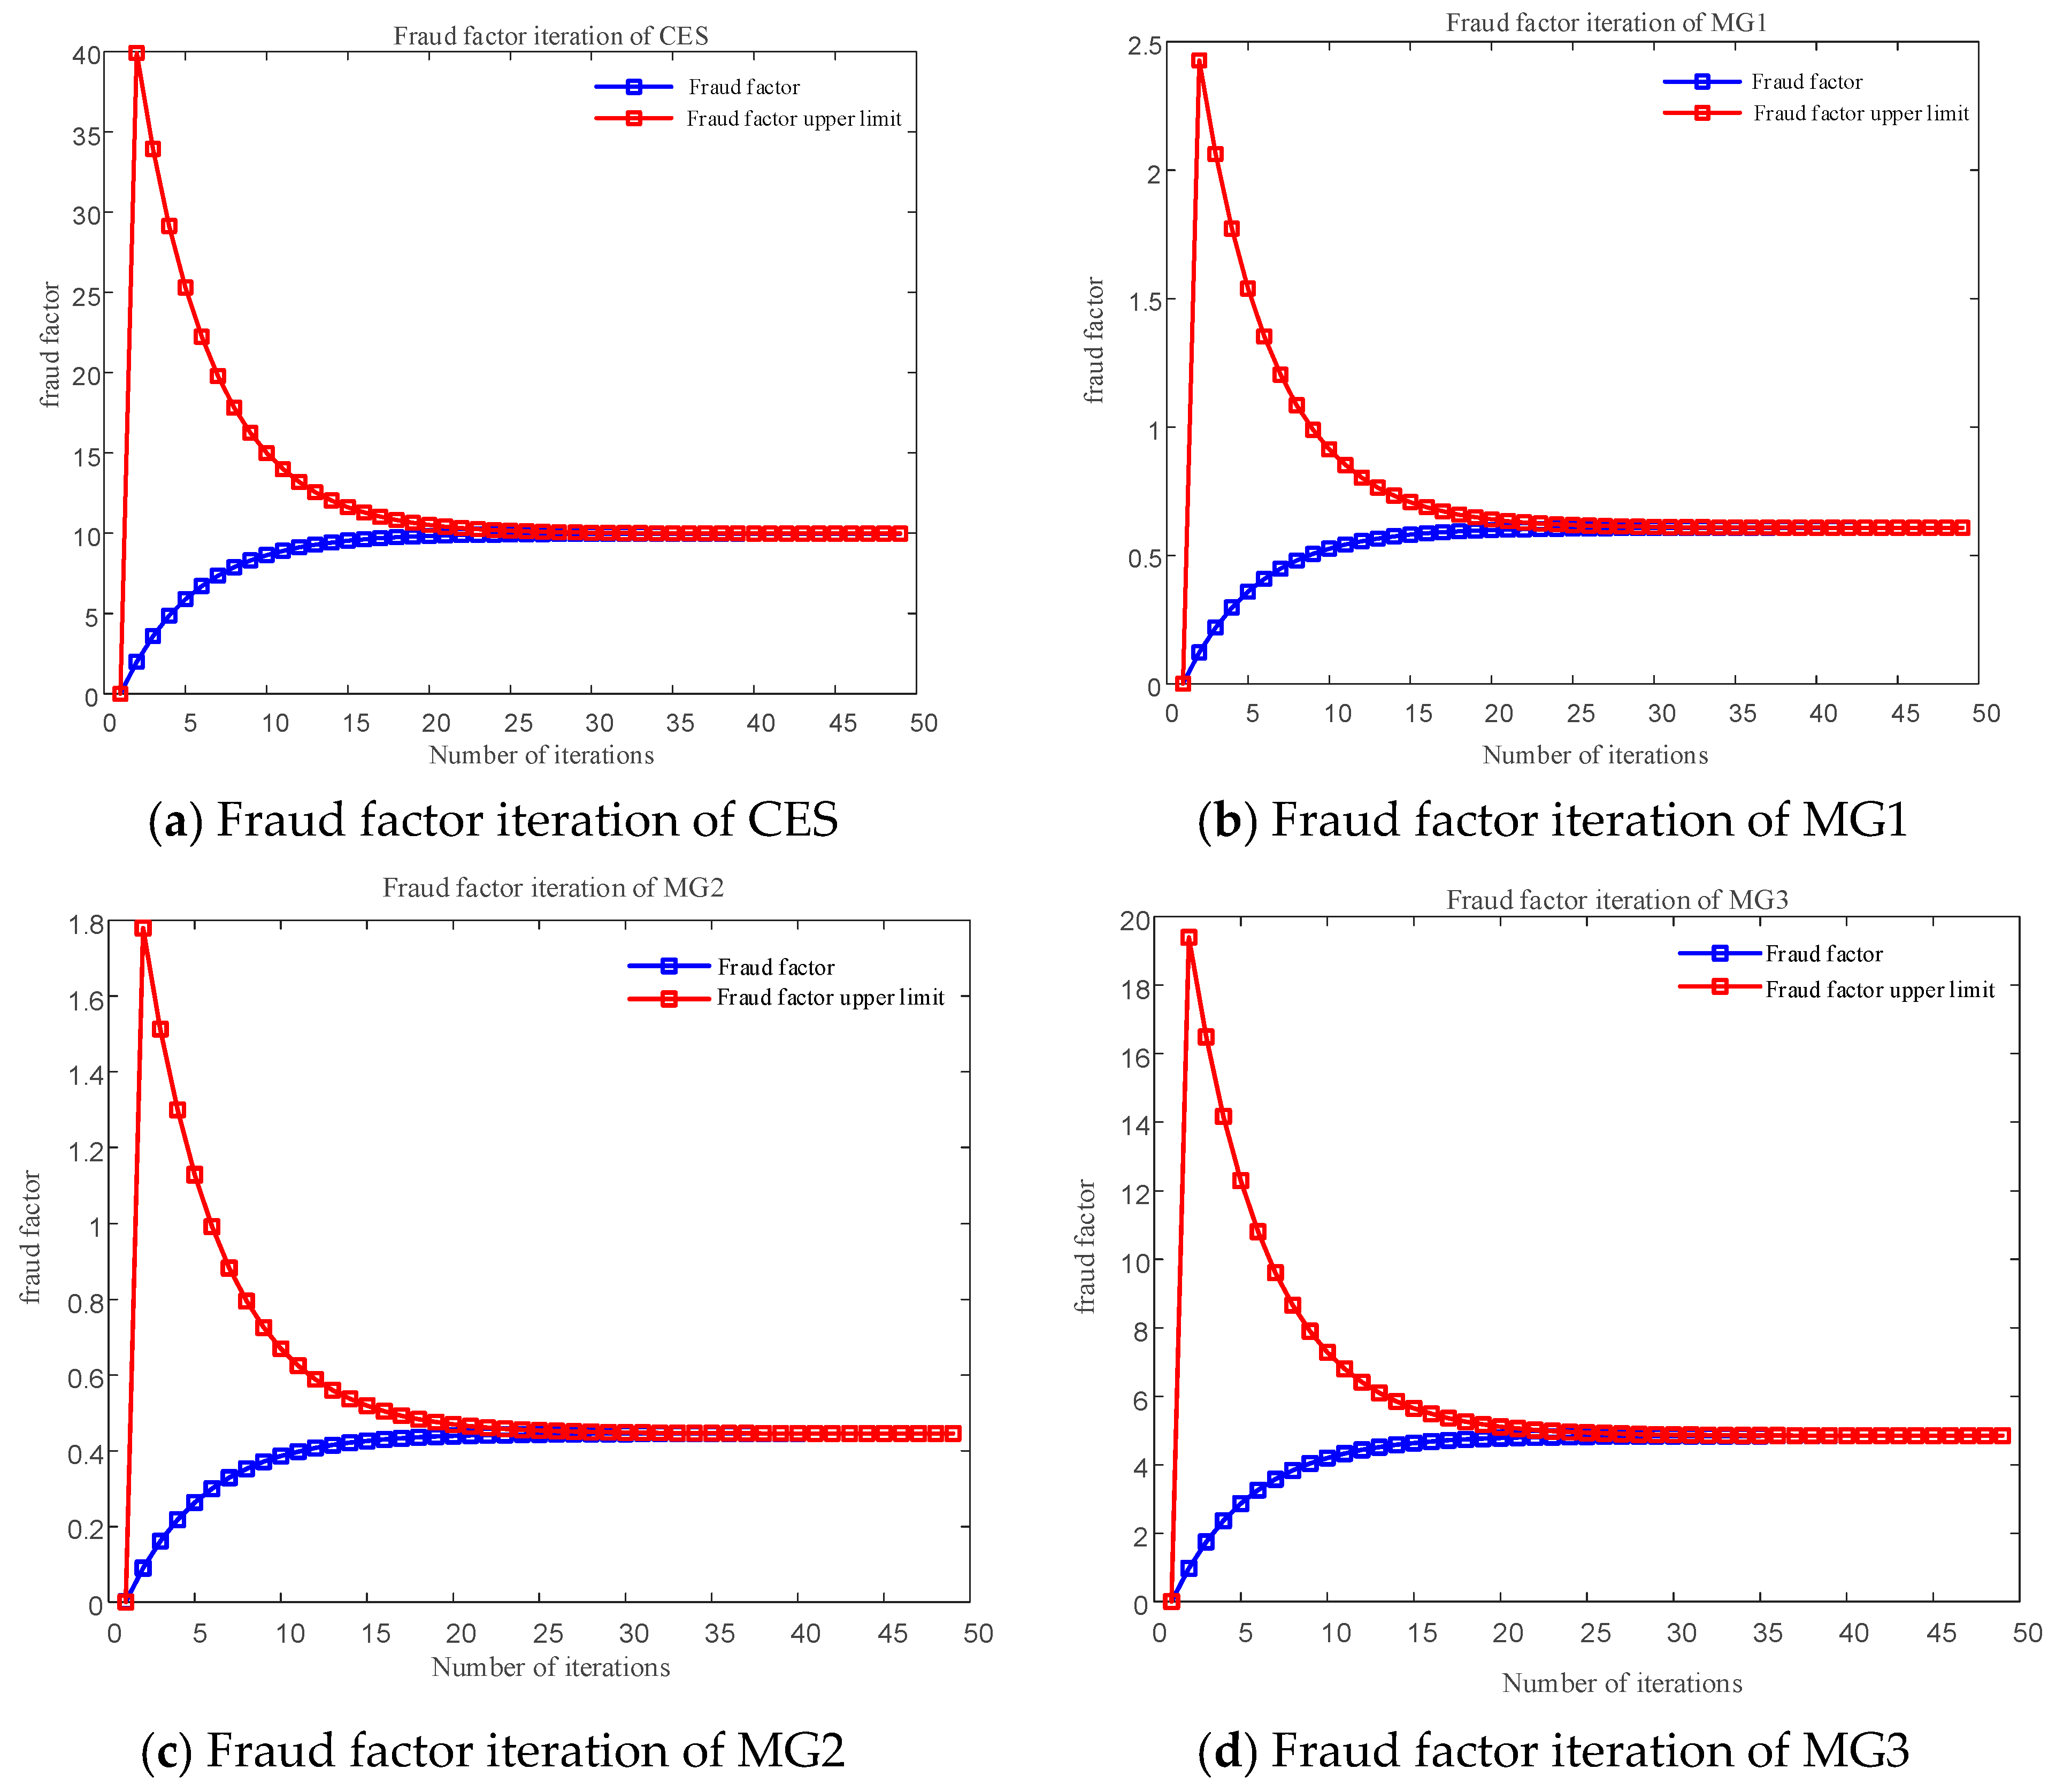
The iterative process of the fraud factor for CES and each MG is shown in Figure 11. As shown in Figure 11, the fraud factor gradually increases and reaches the upper bound of the fraud factor. At this point, fraud equilibrium is achieved among all entities, preventing the breakdown of multi-entity cooperation. Each entity believes that the fraudulent choices they make maximize the benefits obtained compared to honest behavior, achieving Pareto optimality for each entity and social optimality, while also enhancing the ability to cope with uncertain risks.
In terms of fraud tolerance, a high fraud equilibrium index indicates that the algorithm has a high tolerance for fraud by that participant, while a low index indicates low tolerance. It can be seen that the fraud tolerance for MG1 and MG2 is relatively low, with their speculation indices being 0.6 and 0.45, respectively. In contrast, the tolerance for shared energy storage and MG3 is relatively high, with their speculation indices being 0.98 and 4.85, respectively. From a mathematical perspective, this is because the absolute values of the shared benefits for MG1 and MG2 are larger, while those for shared energy storage and MG3 are smaller. From a physical perspective, MG1 and MG2 participate more fully in cooperation, and cooperation has a greater impact on their energy costs, while shared energy storage and MG3 are the opposite. Therefore, the algorithm imposes stricter requirements on participants who deeply engage in cooperation regarding honest negotiation.

5.2.2. Analysis of Traded Electricity Volume and Traded Electricity Price

The results of the electricity transactions and electricity price transactions between each MG and CES are shown in Figure 12 and Figure 13, respectively. Analysis of Figure 12 reveals that MG1 is in a power-selling state during the time periods from 1:00 to 15:00 and from 23:00 to 24:00. Due to the strong power supply capacity of its distributed power sources, it can meet its own load requirements and generate surplus electricity. Therefore, it chooses to feed the excess electricity back into the shared energy storage power station to convert the surplus electricity into value. During other time periods, when MG1’s local power supply is insufficient, it switches to obtaining the required electricity from the energy storage power station to ensure power supply needs and system efficiency. During the 1:00–7:00 and 21:00–24:00 time slots, when internal system resources are abundant and can adequately meet its own electricity load, MG2 sells the excess electricity to the energy storage power station to maximize its own revenue and enhance the overall resource utilization of the system. During other scheduling periods, MG2’s distributed resources cannot meet its own electricity load, so it purchases electricity from the shared energy storage power plant to maintain system stability. For MG3, during the 1:00–9:00 and 22:00–24:00 time periods, there is a significant surplus of electricity, which is then supplied to the energy storage power station. During other periods, MG3 primarily relies on purchasing electricity from the energy storage power station to maintain load balance.
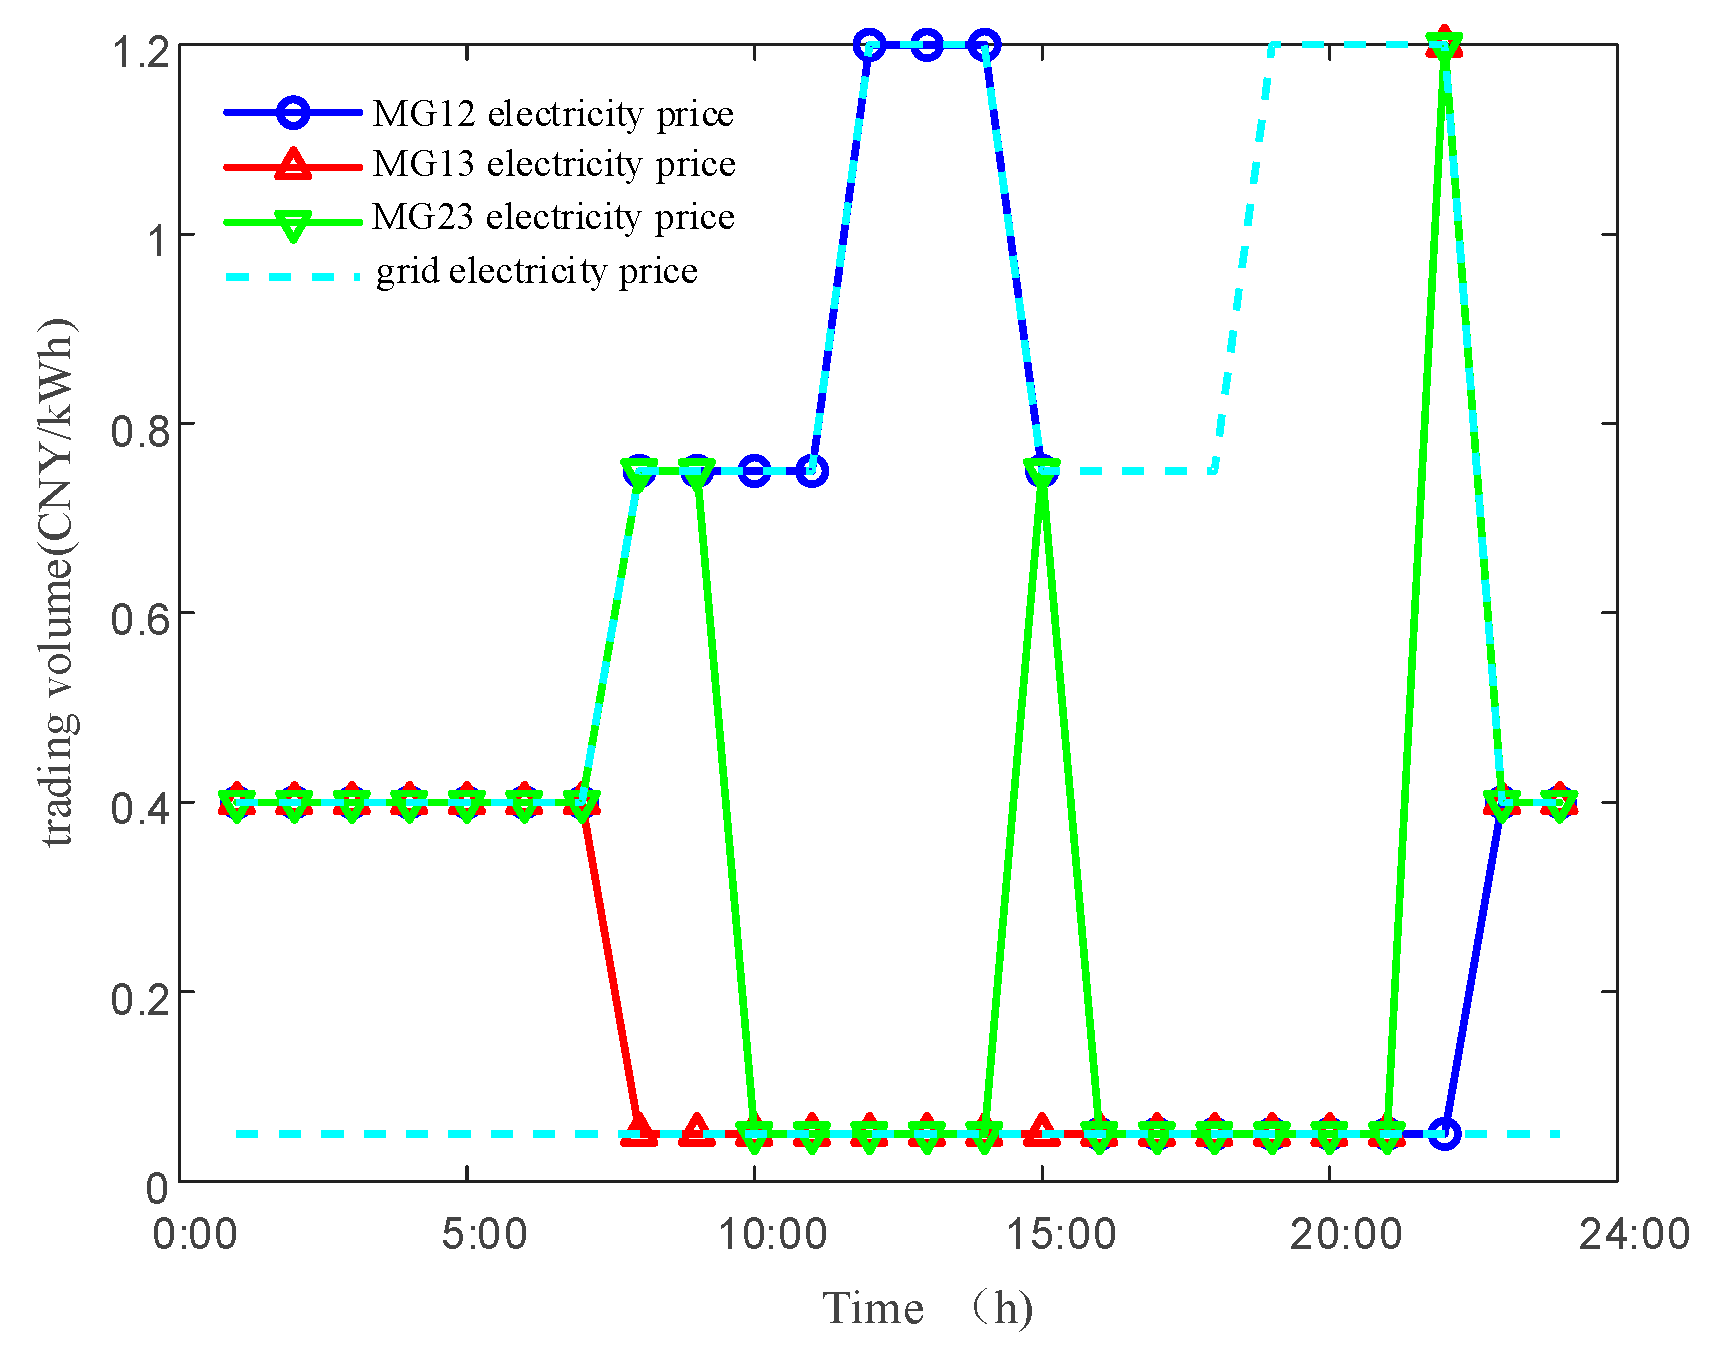
Analysis of Figure 13 shows that by introducing a fraud game model between the microgrid and the shared energy storage power station, all parties involved achieve dynamic negotiation and optimization of transaction prices while safeguarding their respective interests. This negotiation mechanism creates a favorable cooperative environment for all systems, ensuring that electricity transaction prices remain between the grid’s time-of-use rates and feed-in tariffs during different time periods. This pricing structure balances the economic interests of both the energy storage power plant and the microgrid, while incentivizing resource optimization and mutually beneficial transactions, thereby providing strong support for the high-proportion integration of renewable energy within the region.

5.2.3. Worst-Case Scenario Analysis

Taking the worst-case scenario of the source-load price under Scenario 1 of MG1 as an example for analysis. As shown in Figure 14, the predicted scenario is used as the baseline for the source-load price distribution. In the worst-case scenario for PV power generation, the worst-case PV power output is distributed at the extreme points of the lower fluctuation range during the 9:00–11:00 and 13:00–14:00 time periods. The actual output is lower than the predicted output, requiring the system to purchase additional electricity from external sources or increase the output of power generation units to compensate for the difference between the actual and predicted outputs.
In the worst-case electricity load scenario, the worst-case electricity load power is distributed at the upper interval extreme points during the 1:00, 4:00–6:00, 14:00, 18:00, and 23:00 time periods. In the worst-case thermal load scenario, the worst-case thermal load power is distributed at the upper interval extreme points during the 1:00, 5:00, 7:00, 12:00, 14:00–19:00, and 21:00–22:00, with actual power exceeding predicted power. To mitigate the impact of fluctuations during peak periods, the system must not only mobilize additional local controllable resources to ensure supply stability but also maintain flexible energy storage states to balance peak and off-peak loads.
In the worst-case scenario for electricity prices, the worst-case purchase price is distributed across the upper extremes of the fluctuation range during the 2:00–3:00, 5:00–7:00, 15:00–19:00, and 23:00–24:00 time slots. The worst-case selling price is distributed at the lower extreme of the fluctuation range during the 13:00 and 21:00 time slots. When facing market risks caused by electricity price uncertainty, MG1 can fully utilize the energy trading mechanism with shared energy storage power plants to mitigate the adverse effects of rising electricity purchase costs and declining electricity sales revenue by establishing flexible electricity purchase and sale strategies.

5.2.4. Scheduling Plan Analysis

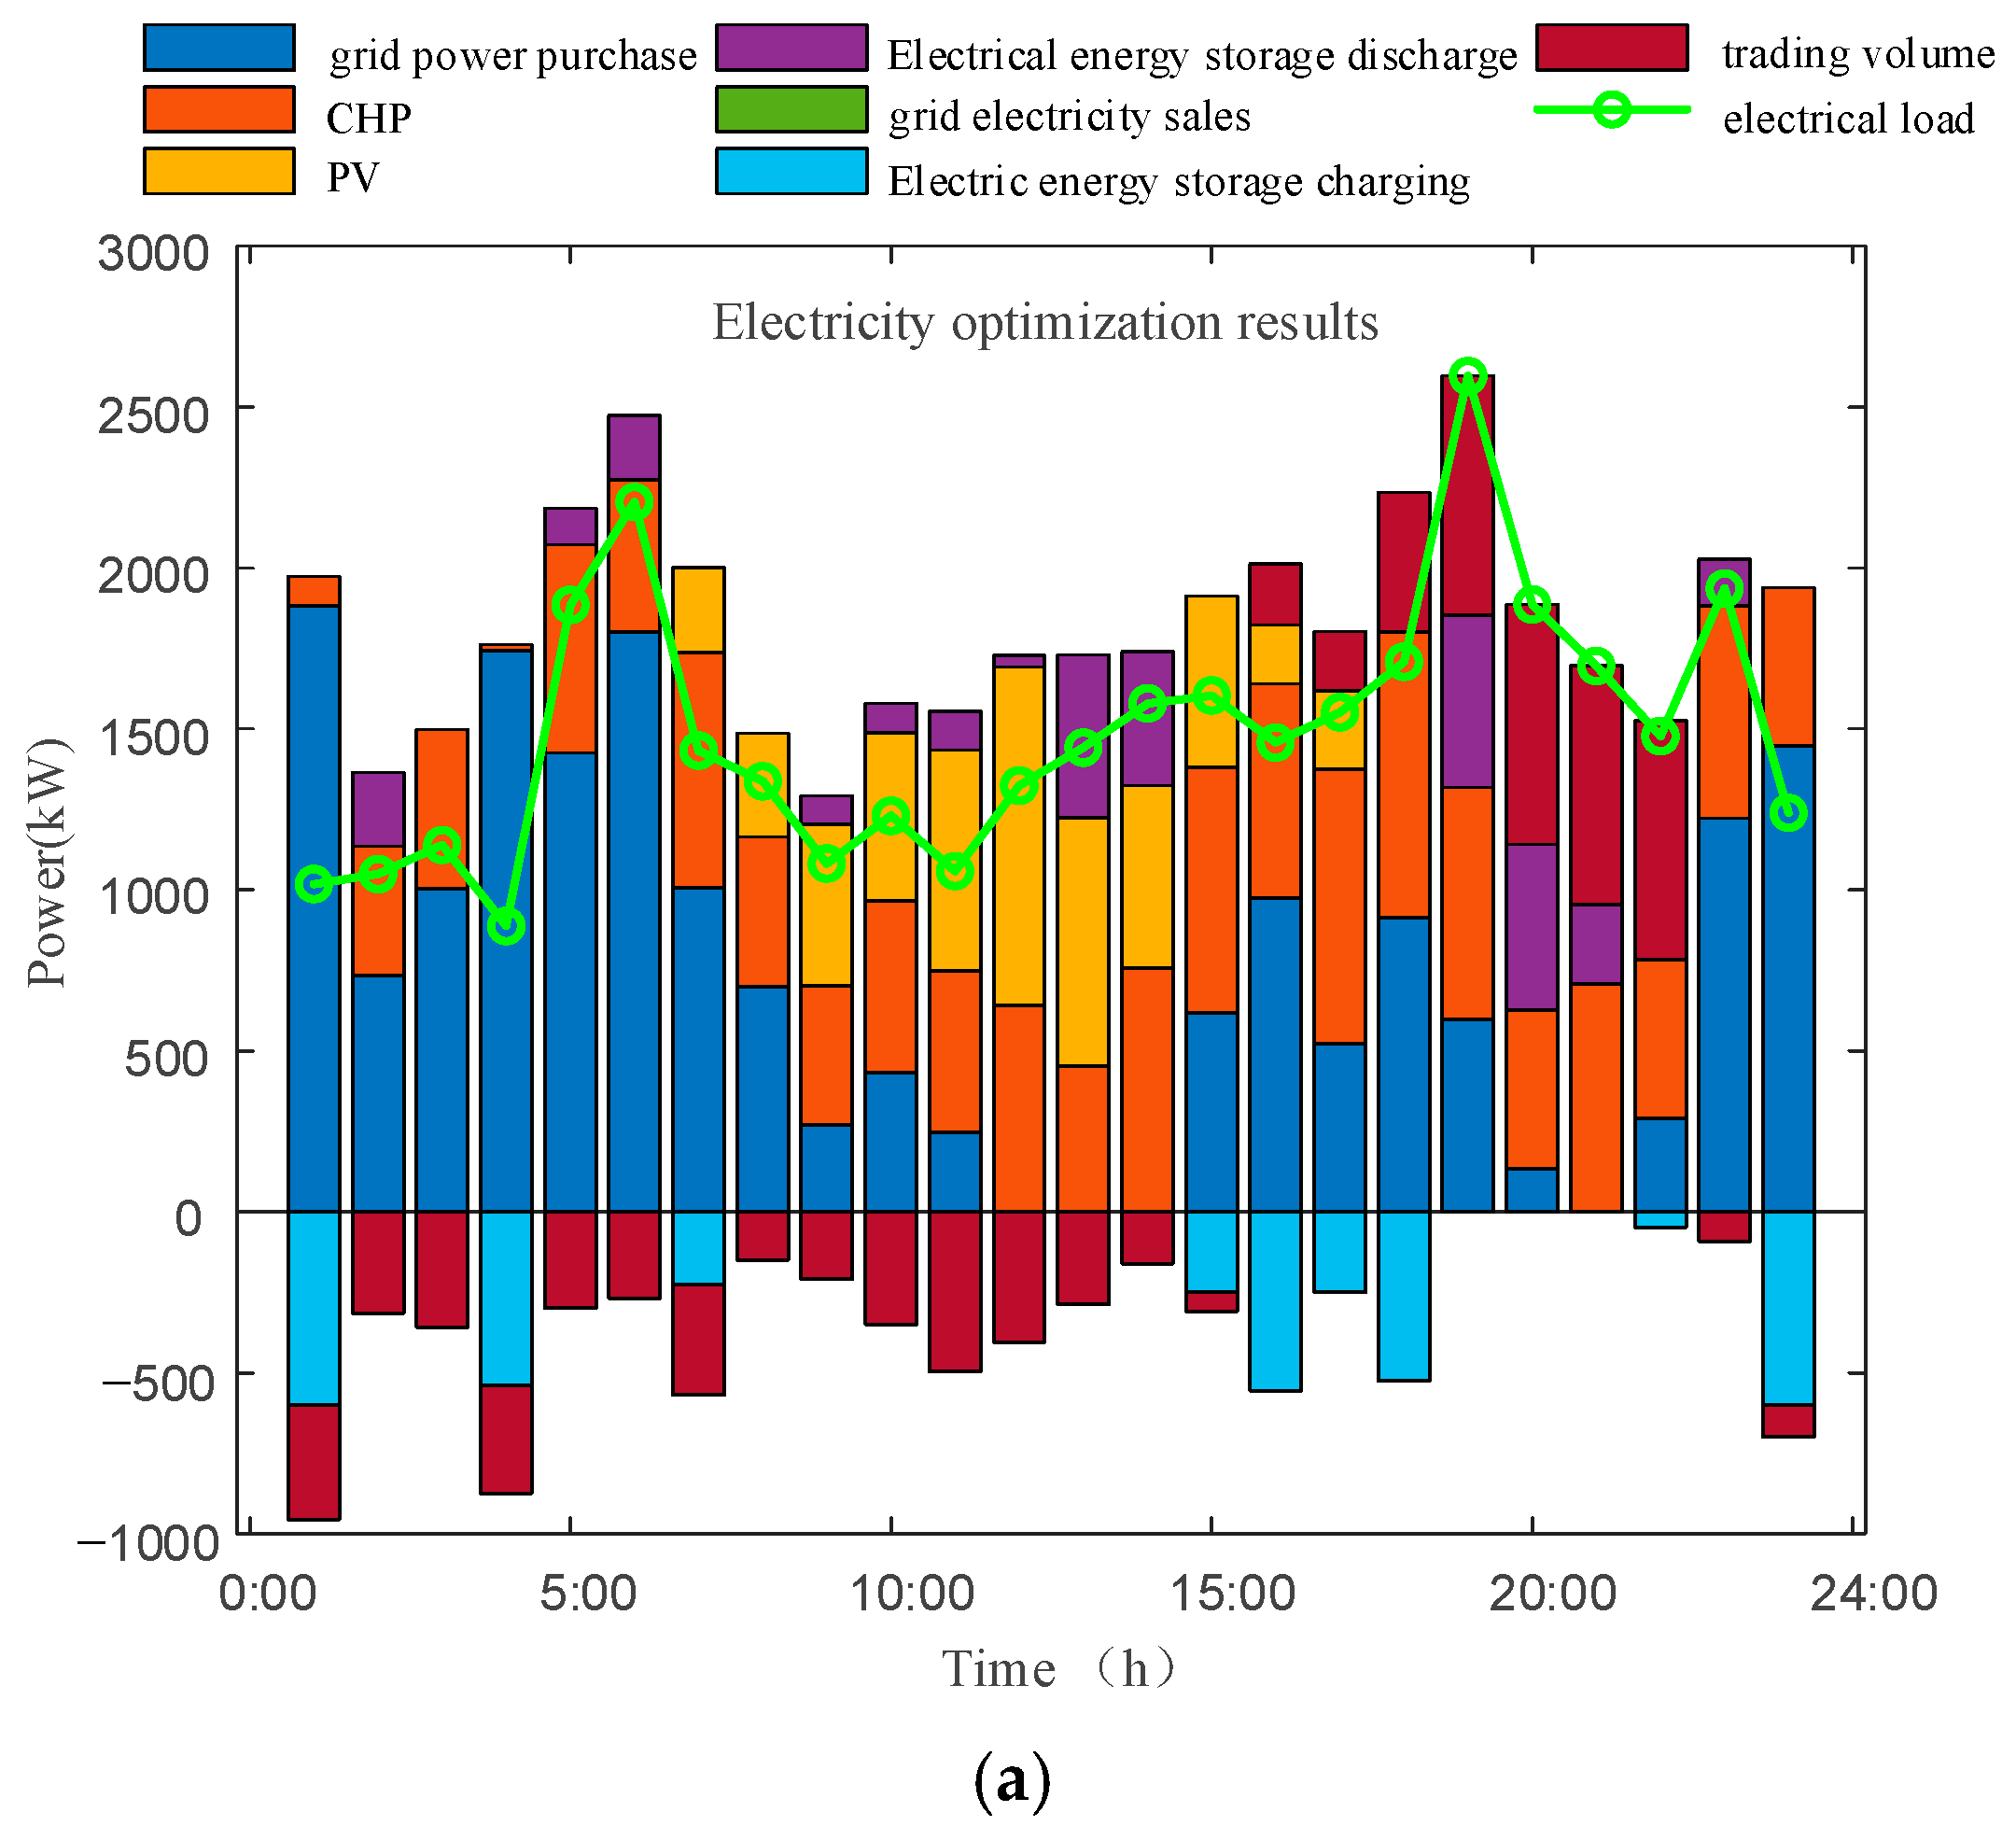
The scheduling operation plan under Scenario 1 of MG1 was taken as an example for analysis. As shown in Figure 15, based on the results of the power optimization analysis, the scheduling operation plan under Scenario 1 of MG1 was taken as an example for analysis. Based on the results of the power optimization analysis, it is evident that the renewable energy source configured for MG1 is PV, which exhibits significant temporal variability in its output characteristics. PV output begins to rise gradually from 7:00 AM, reaches a peak between 11:00 AM and 2:00 PM, and then decreases gradually after 5:00 PM, reflecting a trend highly correlated with changes in sunlight intensity. From the perspective of electricity procurement behavior, MG1 prioritizes purchasing electricity from the grid during low-cost periods such as 1:00–8:00 and 15:00–19:00 to reduce operational costs. During peak-price periods such as 19:00–22:00, it timely purchases electricity from the shared energy storage power station to fill the load gap, thereby avoiding the economic impact of peak-price electricity rates. Additionally, the energy storage within MG1 actively charges during low-cost periods, such as 1:00 AM, 4:00 AM, 7:00 AM, 15:00–18:00, and 24:00, and releases energy during high-load, high-tariff periods, such as 13:00–14:00 and 19:00–21:00, effectively leveraging the cost-optimization benefits of “charging during off-peak hours and discharging during peak hours.” The CHP unit serves as the primary power generation unit supporting the microgrid’s electricity demand, primarily operating during the 5:00–24:00 time slot. It possesses strong regulatory capabilities, maintaining a relatively stable output during daytime and nighttime peak load periods. It supplements energy supply needs during periods of insufficient PV output or high system electricity prices, while coordinating with the energy storage system and grid power purchase mechanisms to achieve system power balance.
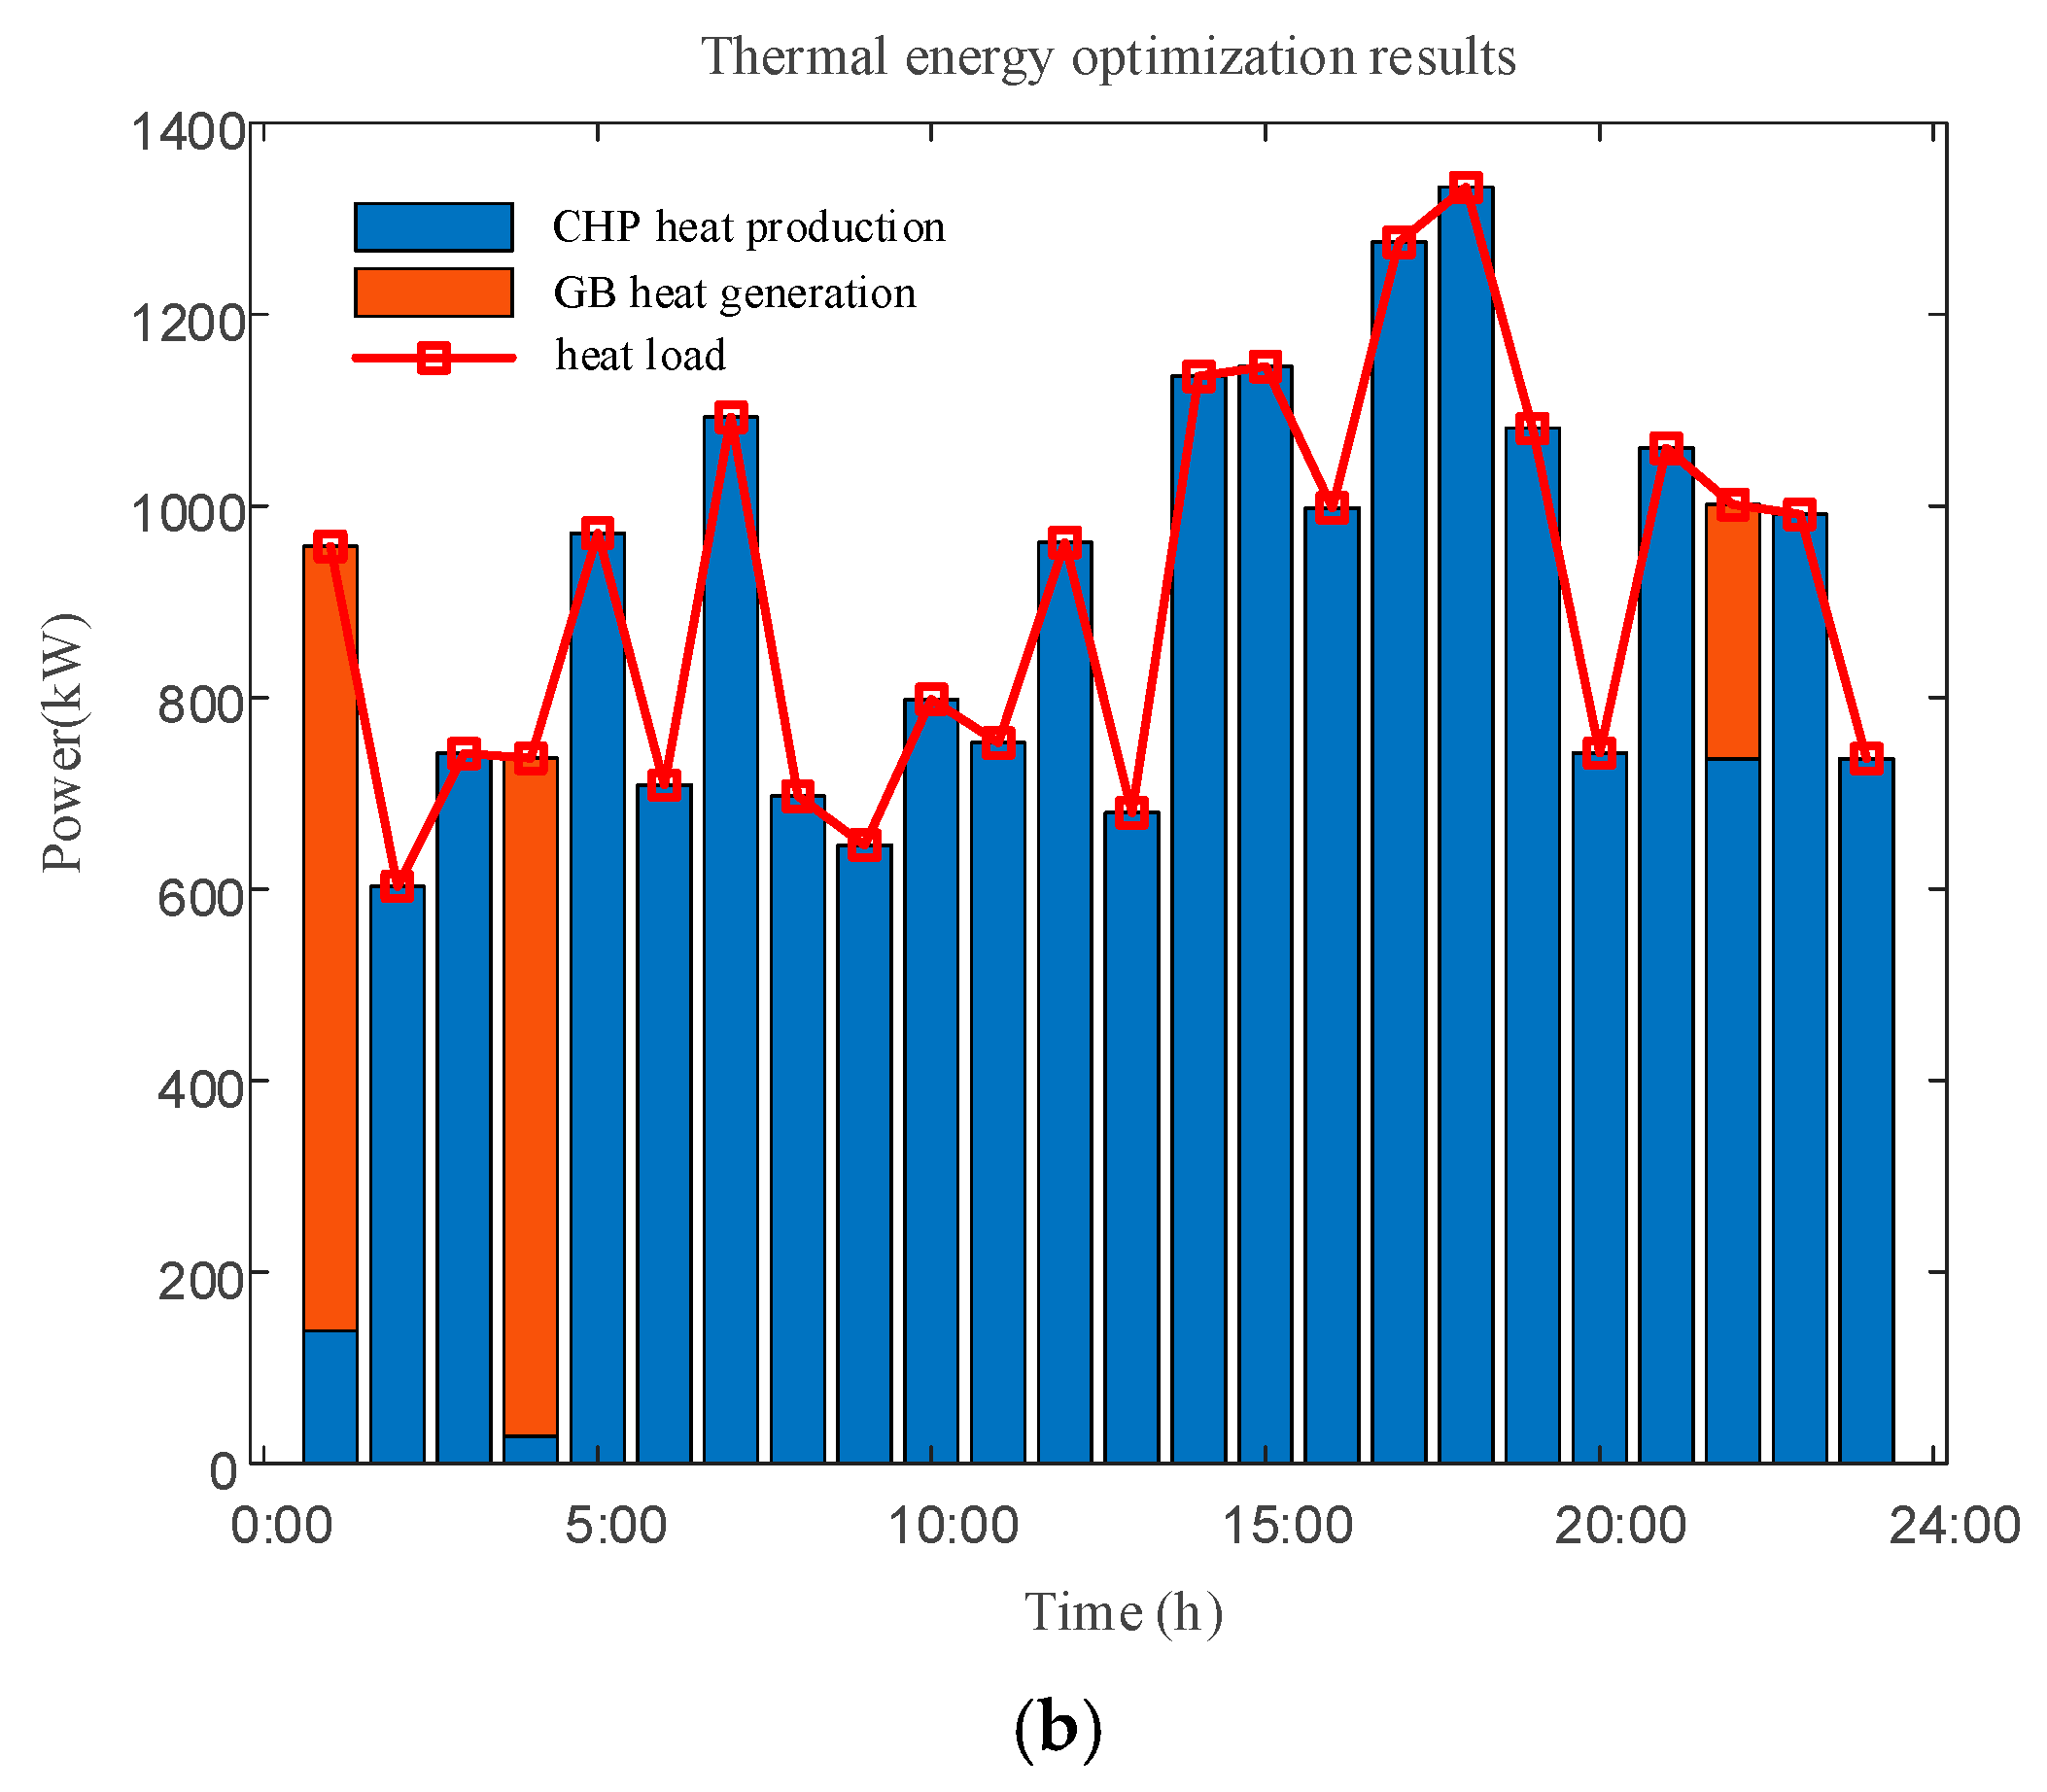
Based on the thermal energy optimization results, the heating system of MG1 is primarily composed of CHP units and GB units. The two units achieve thermal power balance regulation through complementary operation strategies: during periods of low thermal load and insufficient CHP output, such as 1:00 and 4:00, the GB units take the lead in heat production; during other periods, the CHP units dominate the heating tasks. This hybrid heating mode not only meets thermal demand but also optimizes thermal energy costs, thereby enhancing the overall coordination efficiency of the energy system.
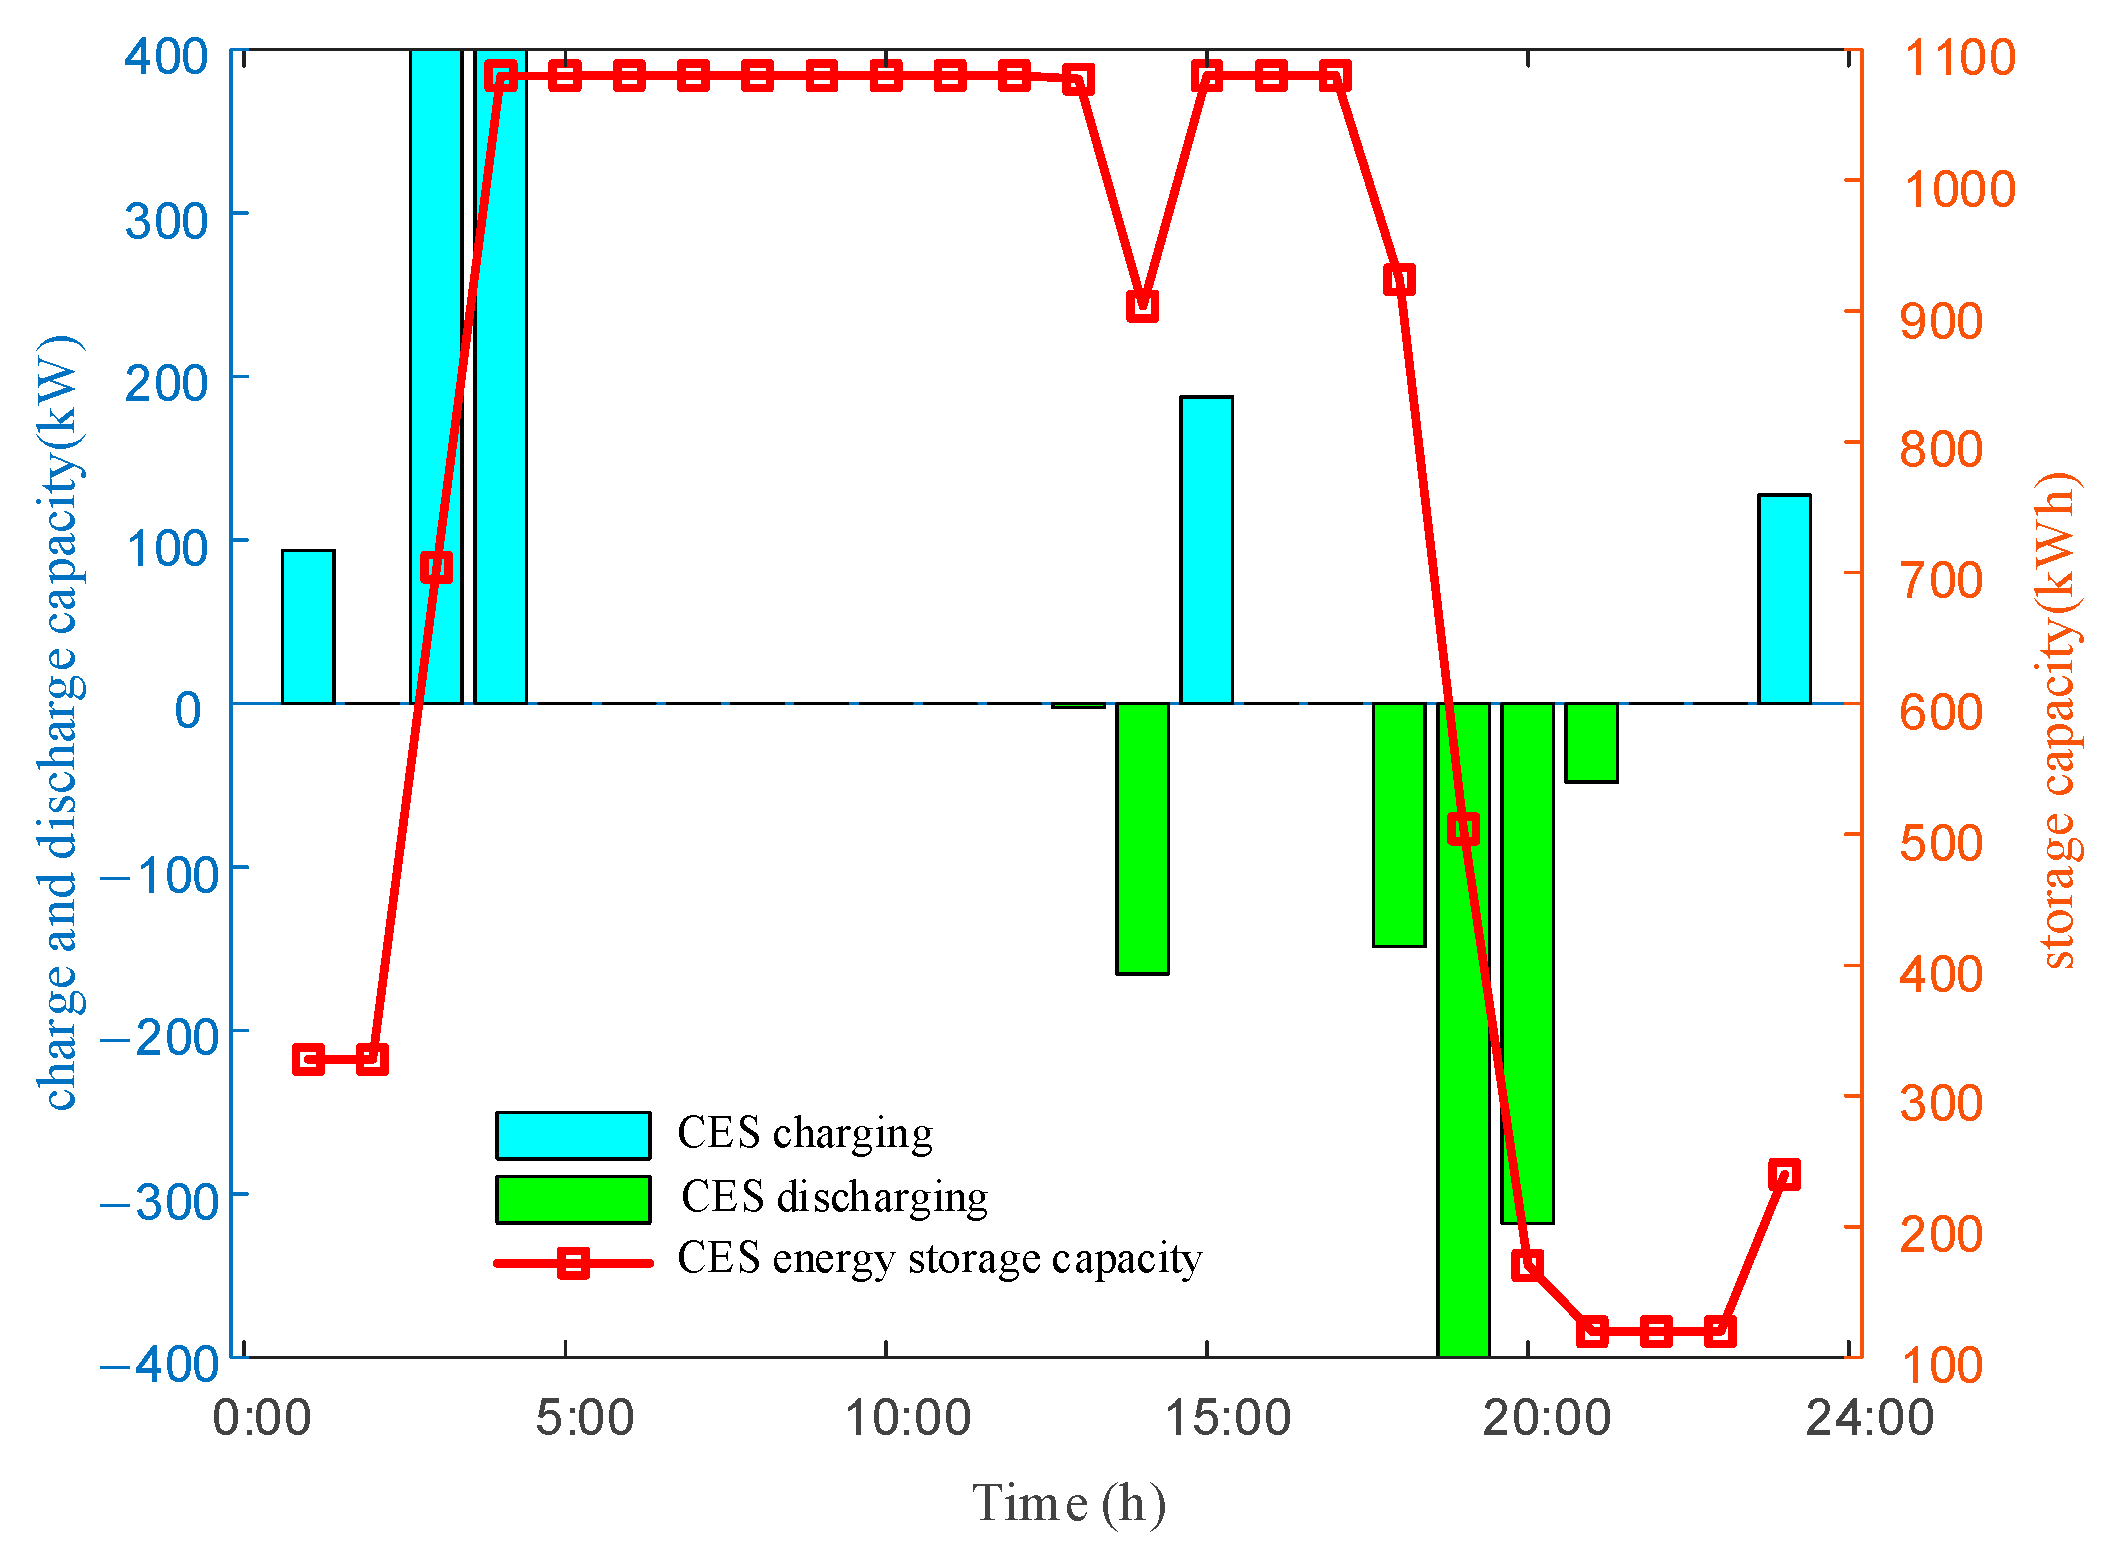
The CES scheduling operation plan is shown in Figure 16 and Figure 17. Driven by electricity prices, the CES exhibits typical peak-valley arbitrage characteristics. During periods of lower electricity prices, such as 3:00–4:00, 15:00, and 24:00, CES actively chooses to charge to absorb the system’s low-cost surplus electricity; during peak electricity demand periods and high-price periods, such as 14:00 and 18:00–21:00, CES releases stored electricity to meet regional power demand. This “charge at low prices, discharge at high prices” strategy effectively mitigates the impact of electricity price fluctuations on system operational economics, significantly reducing overall operating costs. By identifying the energy surpluses/deficits and cost requirements of each microgrid (MG) during different time periods, CES conducts targeted transactions and adjustments. This not only maximizes its own economic returns but also enhances the stability and economic efficiency of microgrid operations. This operational approach reflects the collaborative win-win characteristics among multiple stakeholders in distributed energy systems, effectively leveraging the differences in their interests to achieve overall optimized operation.

5.3. Cost-Benefit Analysis

The cost and benefit analysis for each MG and the CES is presented in Table 5. Table 5 provides a detailed cost and benefit analysis for each MG and CES, with the total alliance cost decreasing from CNY 66,319.37 at the initial negotiation failure to CNY 57,924.89 after the final negotiation, indicating a total system cost reduction of CNY 8394.48. This result demonstrates the overall optimization capability of the Nash bargaining mechanism in multi-energy collaborative systems. At the individual level, the costs of the three microgrids were reduced by CNY 742.60, CNY 1069.92, and CNY 1451.40. Meanwhile, the CES obtained a benefit of CNY 5130.56 through participation in energy transactions involving peak shaving and valley filling, highlighting its economic value as a regulatory hub within the system. Each microgrid realized increased profits in the sub-problem of maximizing electricity trading revenue by uploading relatively low fraudulent costs, thereby confirming the effectiveness of such behavior in enhancing the overall benefits. It can be concluded that the cooperative operation between multiple MGs and the CES, based on the Nash bargaining theory, contributes to reducing the costs for all MGs, the CES, and the alliance as a whole, while also ensuring a fair distribution of benefits.

5.4. Uncertainty Analysis

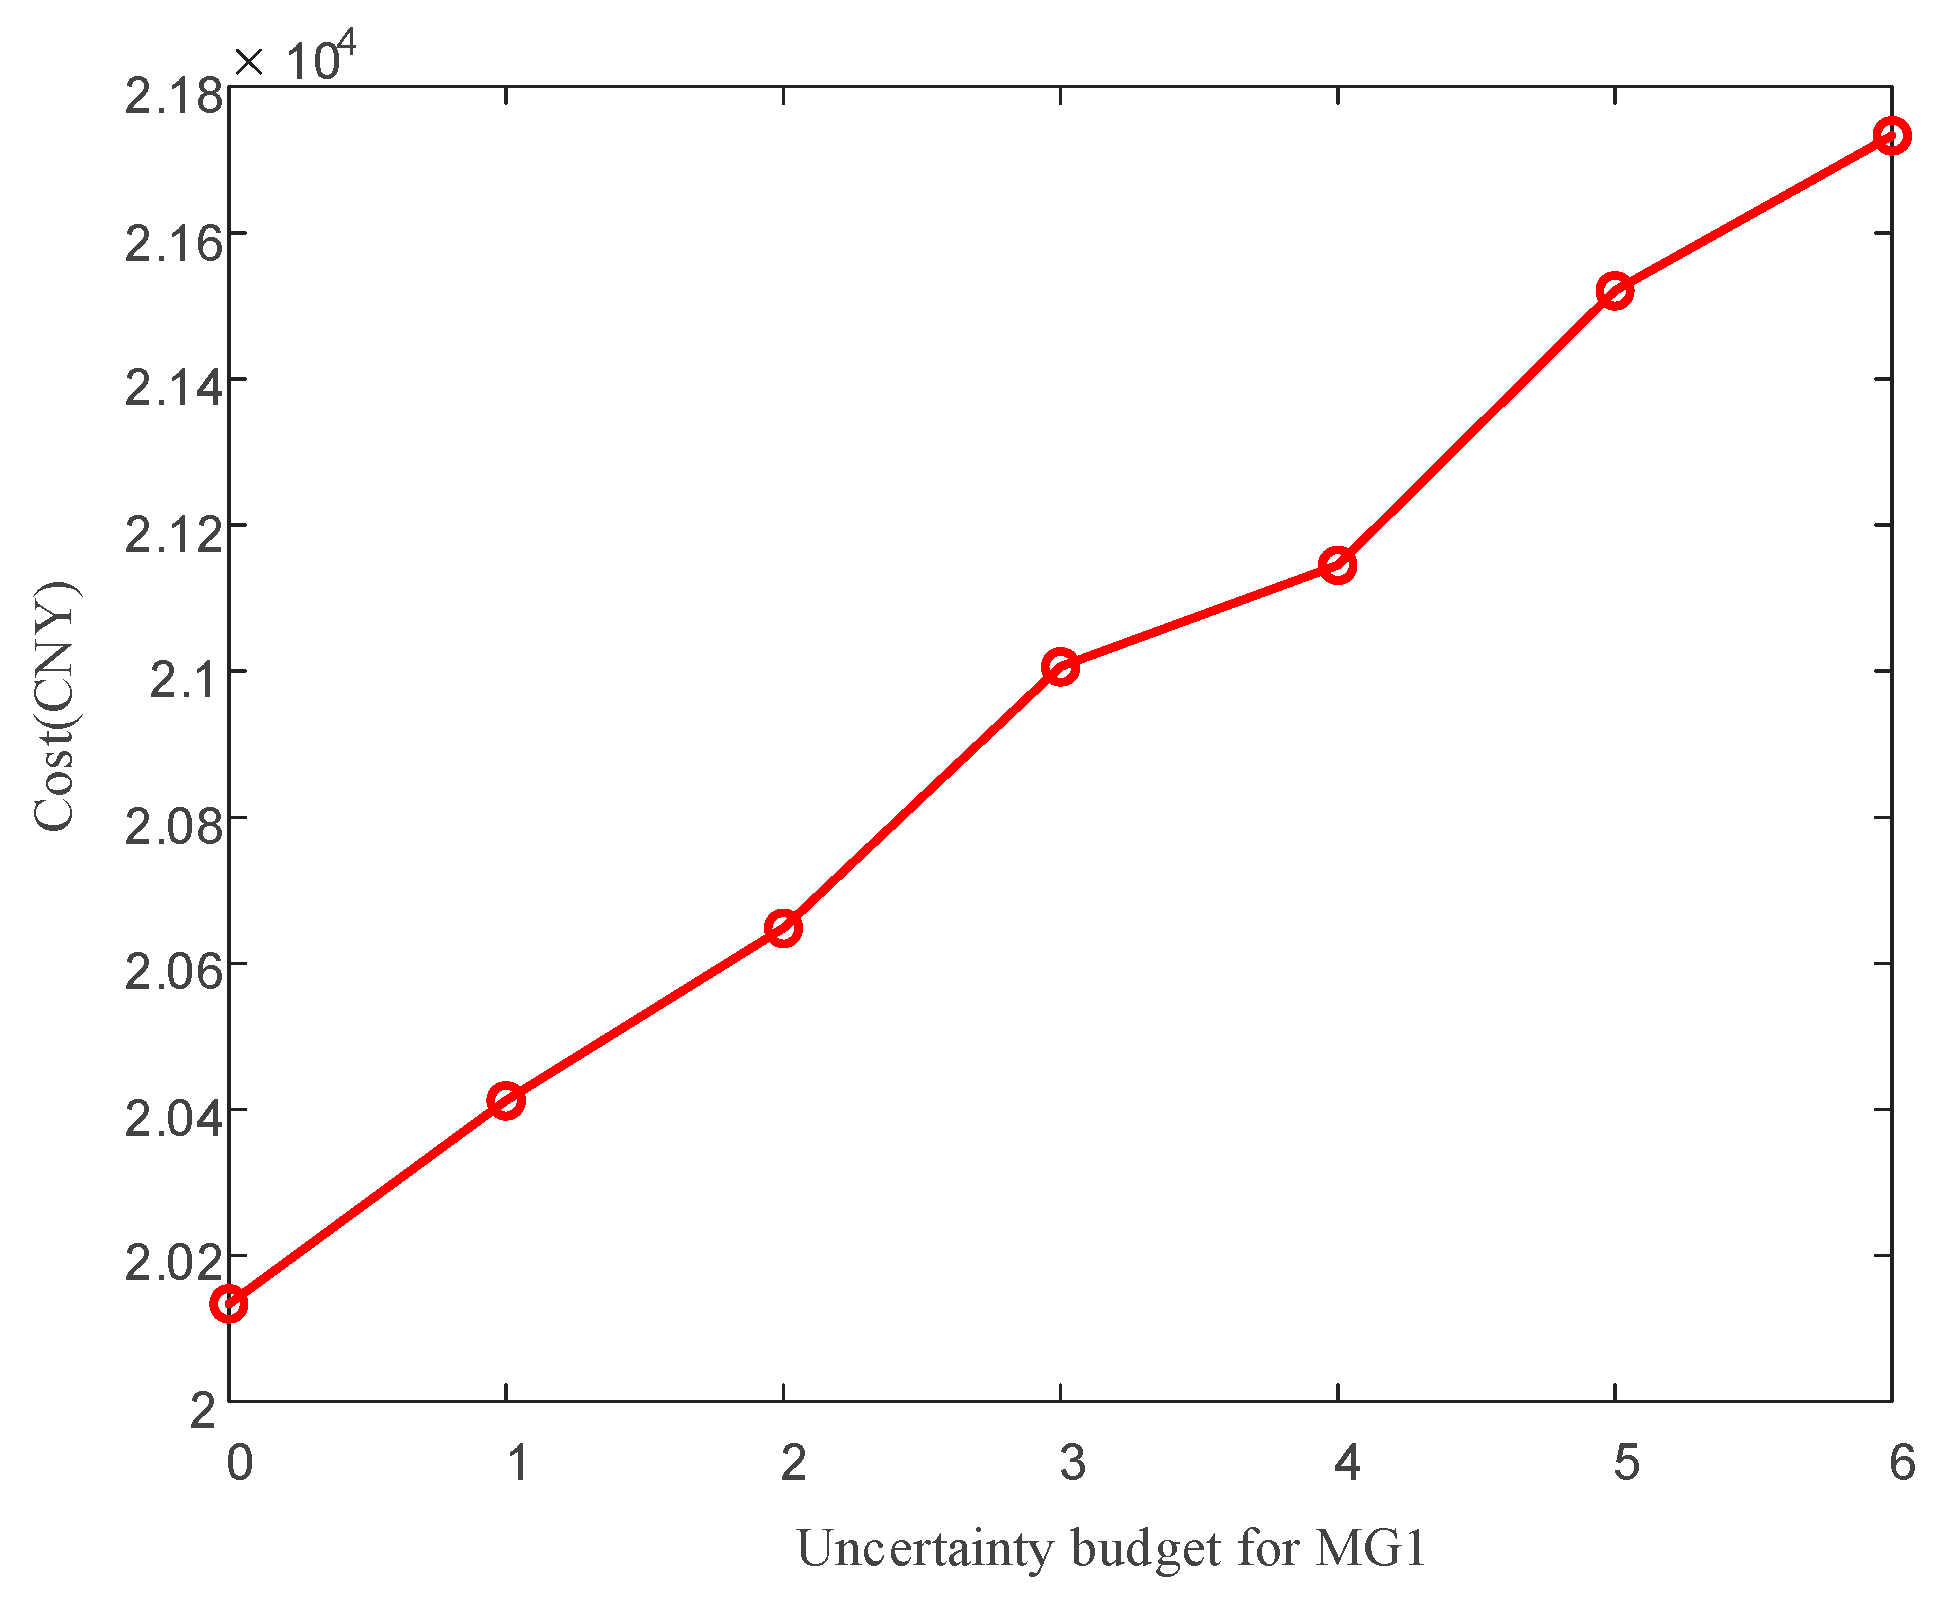
Taking the impact of PV uncertainty budgeting on costs under Scenario 1 of MG1 as an example, we conduct an analysis. As shown in Figure 18, the costs of MG1 vary under different uncertainty budgeting scenarios. As uncertainty budgeting increases, costs also increase. This is because the larger the uncertainty budgeting, the more often PV output is assigned to the most adverse scenarios, resulting in a decrease in total PV output over a scheduling cycle. During the worst-case period for renewable energy, if there is still excess output that can be sold to the upper-level distribution grid to reduce operating costs, the output sold to the distribution grid during the worst-case period will be less than during the baseline period, resulting in lower cost savings and an increase in total operating costs; Conversely, during periods when demand exceeds supply, the output from the supply side during the worst-case scenario is lower than that of the baseline period, leading MG1 to purchase more energy from the upper-level energy grid to meet demand, thereby increasing MG1’s total costs. Therefore, uncertainty budgeting affects MG1’s operating costs. Thus, uncertainty budgeting can serve as an indicator of MG1’s risk preference. MG1s with larger uncertainty budgets operate more conservatively and have stronger risk-bearing capacity, but their operating costs are higher.

6. Conclusions

This paper addresses the risk of fraudulent behavior in multi-microgrid and shared energy storage systems by developing a collaborative optimization framework that integrates robustness and game theory. By introducing a multi-source uncertainty-based electricity price model, the randomness and uncertainty inherent in microgrid operations are effectively characterized. At the scheduling level, a three-stage robust optimization method has been employed to enhance the risk resilience of operational plans. Additionally, to address potential fraudulent behavior in energy transactions, a Nash bargaining game mechanism is introduced and a dynamic adjustment model for fraud factors is established, ensuring that all parties attain overall Pareto optimality while pursuing their individual maximum benefits. Finally, a parallelizable AOP-Looped C&CG algorithm and a distributed solution framework based on ADMM have been designed to significantly improve the efficiency of solving the model.
Compared with existing methods, the proposed approach has several advantages. Most of the current studies on multi-microgrid energy management focus on economic optimization under ideal or deterministic conditions, without explicitly considering fraudulent users. In contrast, our method incorporates a robust optimization framework that accounts for possible fraudulent behaviors, thereby improving the reliability and practicality of the scheduling model. Furthermore, by introducing a shared energy storage system and a collaborative optimization strategy, the proposed method enhances the energy interaction among microgrids and achieves a better balance between local autonomy and global efficiency. Case studies demonstrate that the proposed approach can effectively reduce system operation costs and improve resilience compared with traditional optimization models.
Future research could explore more complex fraud strategies and integrate reputation-based incentive mechanisms to curb long-term opportunistic behavior, thereby enhancing the stability of multi-agent cooperation. The current study uses box-type uncertainty sets to represent source-load-price uncertainty. Future research could introduce data-driven methods (such as machine learning-based prediction intervals or distributed robust optimization) to construct more realistic uncertainty sets, balancing conservatism and economic efficiency in scheduling. This study primarily focuses on the interaction between electricity and energy. Extending the framework to multi-energy systems (integrating cooling, heating, and hydrogen energy) and incorporating ancillary services would enhance the model’s practical application value in complex integrated energy systems.

Author Contributions

H.B.: Writing—review and editing, Project administration, Methodology, Conceptualization. K.J.: Writing—review and editing, Project administration, Methodology, Conceptualization. All authors have read and agreed to the published version of the manuscript.

Funding

The authors declare that this research, authorship, and/or publication of this article have not received any financial support.

Data Availability Statement

The original contributions presented in the study are included in the article, further inquiries can be directed to the corresponding author.

Conflicts of Interest

The authors declare that the research was conducted in the absence of any commercial or financial relationships that could be construed as a potential conflict of interest.

Abbreviations

MGmicrogrid
CEScommunity energy storage
BdCbidirectional converters
DcUSdata-correlated uncertainty set
C&CGColumn-and-Constraint Generation
ADMMAlternating Direction Method of Multipliers
MMGmulti-microgrid
DFIGdynamics in doubly fed induction generators
P2Ppeer-to-peer
MEMGmulti-energy microgrids
CHPcogeneration of heat and power
GBgas boiler

References

  1. Ferrada, F.; Babonneau, F.; Homem-de-Mello, T.; Jalil-Vega, F. The role of hydrogen for deep decarbonization of energy systems: A Chilean case study. Energy Policy 2023, 177, 113536. [Google Scholar] [CrossRef]
  2. Khorramfar, R.; Mallapragada, D.; Amin, S. Electric-gas infrastructure planning for deep decarbonization of energy systems. Appl. Energy 2024, 354, 122176. [Google Scholar] [CrossRef]
  3. Abbasi, M.; Abbasi, E.; Li, L.; Aguilera, R.P.; Lu, D.; Wang, F. Review on the microgrid concept, structures, components, communication systems, and control methods. Energies 2023, 16, 484. [Google Scholar] [CrossRef]
  4. Tariq, A.H.; Kazmi, S.A.A.; Hassan, M.; Ali, S.M.; Anwar, M. Analysis of fuel cell integration with hybrid microgrid systems for clean energy: A comparative review. Int. J. Hydrogen Energy 2024, 52, 1005–1034. [Google Scholar] [CrossRef]
  5. Thirunavukkarasu, G.S.; Seyedmahmoudian, M.; Jamei, E.; Horan, B.; Mekhilef, S.; Stojcevski, A. Role of optimization techniques in microgrid energy management systems—A review. Energy Strategy Rev. 2022, 43, 100899. [Google Scholar] [CrossRef]
  6. Wang, Z.; Hou, H.; Wei, R.; Li, Z. A Distributed Market-Aided Restoration Approach of Multi-Energy Distribution Systems Considering Comprehensive Uncertainties from Typhoon Disaster. IEEE Trans. Smart Grid 2025, 16, 3743–3757. [Google Scholar] [CrossRef]
  7. Wu, X.; Li, S.; He, P.; Zhao, C.; Liu, M. Economic dispatch of multi-microgrids considering flexible load based on distributed consensus algorithm. Electr. Eng. 2025, 107, 4699–4710. [Google Scholar] [CrossRef]
  8. Tehrani, K.; Simde, D.; Fozing, J.; Jamshidi, M. (Eds.) A 3D design of small hybrid farm for microgrids. In Proceedings of the 2022 World Automation Congress (WAC), San Antonio, TX, USA, 11–15 October 2022. [Google Scholar]
  9. Lilliu, F.; Recupero, D.R. A cooperative game-theory approach for incentive systems in local energy communities. Sustain. Energy Grids Netw. 2024, 38, 101391. [Google Scholar] [CrossRef]
  10. Liu, X.; Ji, Z.; Sun, W.; He, Q. Robust game-theoretic optimization for energy management in community-based energy system. Electr. Power Syst. Res. 2023, 214, 108939. [Google Scholar] [CrossRef]
  11. Naji El Idrissi, R.; Ouassaid, M.; Maaroufi, M. Game theory approach for energy consumption scheduling of a community of smart grids. J. Electr. Eng. Technol. 2023, 18, 2695–2708. [Google Scholar] [CrossRef]
  12. Gao, X.; Zhang, X. Robust collaborative scheduling strategy for multi-microgrids of renewable energy based on a non-cooperative game and profit allocation mechanism. Energies 2024, 17, 519. [Google Scholar] [CrossRef]
  13. Dorahaki, S.; Muyeen, S.; Amjady, N. A Stackelberg Game Theory Model for Integrated Community Energy Storage Systems. IEEE Access 2024, 12, 152908–152920. [Google Scholar] [CrossRef]
  14. Wang, C.; Xu, H.; Guo, C.; Zhang, X.; Qiao, Y. Multi-stakeholder behavior analysis of shared energy storage market based on evolutionary game. CSEE J. Power Energy Syst. 2024, 1–2, early access. [Google Scholar]
  15. Liang, Z.; Chung, C.; Wang, Q.; Chen, H.; Yang, H.; Wu, C. Fortifying Renewable-Dominant Hybrid Microgrids: A Bi-Directional Converter Based Interconnection Planning Approach. Engineering 2025, 51, 130–143. [Google Scholar] [CrossRef]
  16. Hou, H.; Wang, Z.; Zhao, B.; Zhang, L.; Shi, Y.; Xie, C. Peer-to-peer energy trading among multiple microgrids considering risks over uncertainty and distribution network reconfiguration: A fully distributed optimization method. Int. J. Electr. Power Energy Syst. 2023, 153, 109316. [Google Scholar] [CrossRef]
  17. Zhang, R.; Zhang, Y.; Zou, Y.; Jiang, T.; Li, X. Privacy-Preserving Cooperative Optimal Operation for Reconfigurable Multimicrogrid Distribution Systems: A Noniterative Distributed Optimization Approach. IEEE Trans. Ind. Inform. 2025, 21, 5766–5776. [Google Scholar] [CrossRef]
  18. Zhong, J.; Li, Y.; Cao, Y.; Tan, Y.; Peng, Y.; Zhou, Y.; Nakanishi, Y.; Li, Z. Robust coordinated optimization with adaptive uncertainty set for a multi-energy microgrid. IEEE Trans. Sustain. Energy 2022, 14, 111–124. [Google Scholar] [CrossRef]
  19. Khaligh, V.; Ghezelbash, A.; Mazidi, M.; Liu, J.; Ryu, J.-H. P-robust energy management of a multi-energy microgrid enabled with energy conversions under various uncertainties. Energy 2023, 271, 127084. [Google Scholar] [CrossRef]
  20. Tan, B.; Lin, Z.; Zheng, X.; Xiao, F.; Wu, Q.; Yan, J. Distributionally robust energy management for multi-microgrids with grid-interactive EVs considering the multi-period coupling effect of user behaviors. Appl. Energy 2023, 350, 121770. [Google Scholar] [CrossRef]
  21. Yu, M.; Liao, M.; Du, M.; Chen, A. Cooperative Optimal Operation of Multi-Microgrids Based on Two-Staged Robustness. In Proceedings of the 2024 China Automation Congress (CAC), Qingdao, China, 1–3 November 2024. [Google Scholar]
  22. Zhang, S.; Hu, W.; Cao, X.; Du, J.; Zhao, Y.; Bai, C.; Liu, W.; Tang, M.; Zhan, W.; Chen, Z. A two-stage robust low-carbon operation strategy for interconnected distributed energy systems considering source-load uncertainty. Appl. Energy 2024, 368, 123457. [Google Scholar] [CrossRef]
  23. Liu, Y.; Li, X.; Liu, Y. A low-carbon and economic dispatch strategy for a multi-microgrid based on a meteorological classification to handle the uncertainty of wind power. Sensors 2023, 23, 5350. [Google Scholar] [CrossRef]
  24. Aminlou, A.; Hayati, M.; Zare, K. ADMM-based fully decentralized Peer to Peer energy trading considering a shared CAES in a local community. J. Energy Manag. Technol. 2024, 8, 141–147. [Google Scholar]
  25. Wang, J.; Li, Y.; Liu, J. Distributed coordinated planning for cross-border energy system: An ADMM-based decentralized approach. Electr. Power Syst. Res. 2023, 221, 109441. [Google Scholar] [CrossRef]
  26. Zhai, J.; Jiang, Y.; Shi, Y.; Jones, C.N.; Zhang, X.-P. Distributionally robust joint chance-constrained dispatch for integrated transmission-distribution systems via distributed optimization. IEEE Trans. Smart Grid 2022, 13, 2132–2147. [Google Scholar] [CrossRef]
  27. Lü, Y.; Zhao, X.; Shah, P. Robust optimal framework for doubly fed induction generator with uncertain dynamics. Prot. Control Mod. Power Syst. 2024, 9, 129–141. [Google Scholar] [CrossRef]
  28. Wang, Y.; Li, R.; Erofeev, A.; He, J. Benefit–cost model of microgrid integration based on Nash negotiation optimization algorithm. Electr. Eng. 2025, 1–12. [Google Scholar] [CrossRef]
  29. Fu, Y.; Sun, Q.; Wennersten, R.; Pang, X.; Liu, W. Interactive scheduling optimization of regional multi-agent integrated energy systems considering uncertainties based on game theory. J. Clean. Prod. 2024, 449, 141697. [Google Scholar] [CrossRef]
  30. Du, J.; Han, X.; Wang, J. Distributed cooperation optimization of multi-microgrids under grid tariff uncertainty: A nash bargaining game approach with cheating behaviors. Int. J. Electr. Power Energy Syst. 2024, 155, 109644. [Google Scholar] [CrossRef]
  31. Wang, Z.; Hou, H.; Zhao, B.; Zhang, L.; Shi, Y.; Xie, C. Risk-averse stochastic capacity planning and P2P trading collaborative optimization for multi-energy microgrids considering carbon emission limitations: An asymmetric Nash bargaining approach. Appl. Energy 2024, 357, 122505. [Google Scholar] [CrossRef]
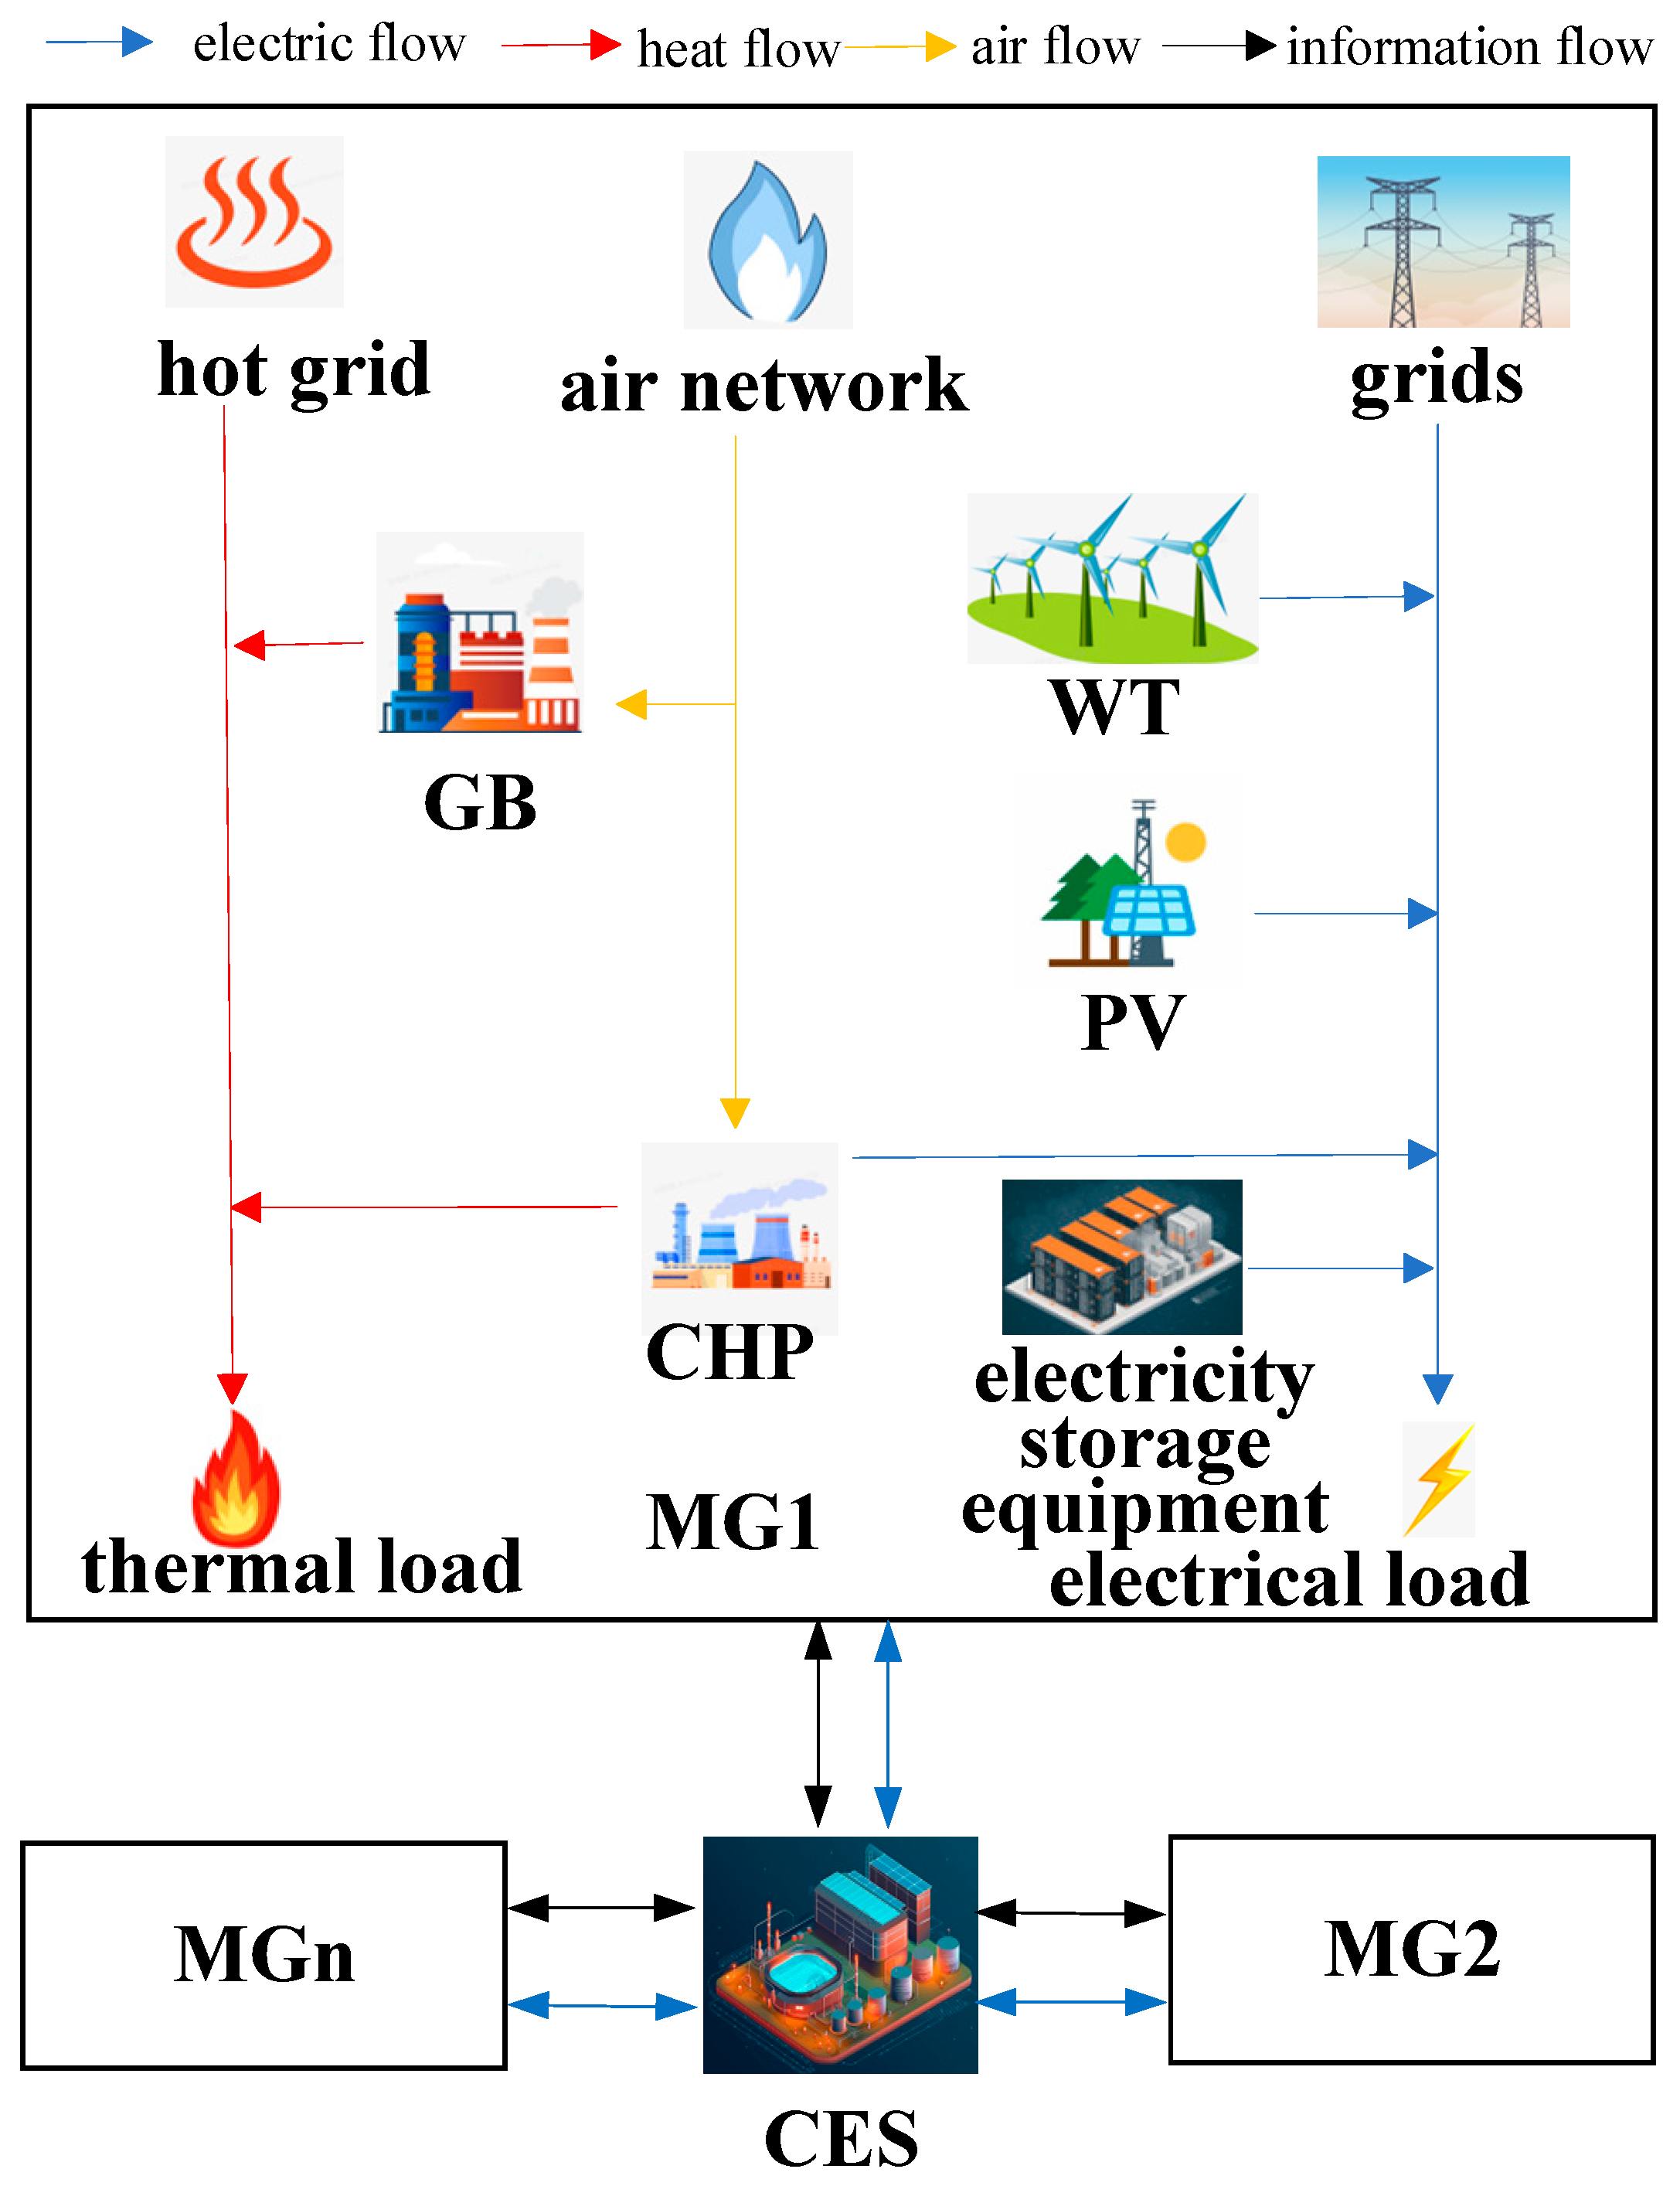
Figure 1. System model framework diagram.
Energies 18 04635 g001
Figure 2. System shared energy storage cooperation model.
Energies 18 04635 g002
Figure 3. AOP-looped C&CG algorithm flowchart.
Energies 18 04635 g003
Figure 4. Algorithm flowchart containing fraud factors.
Energies 18 04635 g004
Figure 5. Renewable energy data and load data for each MG: (a) electrical load of MG1; (b) thermal load of MG1; (c) MG1 photovoltaic; (d) electrical load of MG2; (e) thermal load of MG2; (f) MG2 wind power; (g) electrical load of MG3; (h) thermal load of MG3; (i) MG3 wind power.
Energies 18 04635 g005aEnergies 18 04635 g005b
Figure 6. Historical data on CES electricity sales prices.
Energies 18 04635 g006
Figure 7. Iterative convergence results for sub-problem 1: (a) MG1 cost iteration status; (b) MG2 cost iteration status; (c) MG3 cost iteration status; (d) CES cost iteration situation; (e) electric energy interaction iterative residual situation.
Energies 18 04635 g007aEnergies 18 04635 g007b
Figure 8. Iterative convergence results for sub-problem 2: (a) MG1 negotiation iteration status; (b) MG2 negotiation iteration status; (c) MG3 price negotiation iteration status; (d) CES bargaining iteration status; (e) electricity price interaction iteration residual situation.
Energies 18 04635 g008aEnergies 18 04635 g008b
Figure 9. Convergence of C&CG iterations for each MG: (a) C&CG iterative convergence of MG1; (b) C&CG iterative convergence of MG2; (c) C&CG iterative convergence of MG3.
Energies 18 04635 g009
Figure 10. PH iteration convergence for each MG: (a) PH iteration convergence of MG1; (b) PH iteration convergence of MG2; (c) PH iteration convergence of MG3.
Energies 18 04635 g010
Figure 11. Iteration of fraud factors for each entity: (a) fraud factor iteration of CES; (b) fraud factor iteration of MG1; (c) fraud factor iteration of MG2; (d) fraud factor iteration of MG3.
Energies 18 04635 g011
Figure 12. Electricity traded between each microgrid and the shared energy storage power station.
Energies 18 04635 g012
Figure 13. Transaction electricity prices between various microgrids and shared energy storage power stations.
Energies 18 04635 g013
Figure 14. Worst-case scenario for MG1 source load price. (a) Worst-case scenario for electricity purchase prices; (b) Worst-case scenario for electricity sales prices; (c) Worst-case scenario for electrical load; (d) Worst-case scenario for heat load; (e) Worst-case scenario for photovoltaics.
Energies 18 04635 g014
Figure 15. Scheduling operation plan under scenario 1 of MG1: (a) electricity optimization results; (b) thermal energy optimization results.
Energies 18 04635 g015aEnergies 18 04635 g015b
Figure 16. CES energy optimization results.
Energies 18 04635 g016
Figure 17. CES charging and discharging.
Energies 18 04635 g017
Figure 18. Impact of uncertainty budget values on MG1 costs.
Energies 18 04635 g018
Table 1. Electricity and gas price parameters.
Time Period TypeTime PeriodPurchase Price (CNY/kWh)Sale Price (CNY/kWh)Gas Price (CNY/m3)
Peak time12:00−14:00,
19:00−22:00
1.200.602.5
Off−peak time01:00−07:00,
23:00−24:00
0.400.20
Normal time08:00−11:00,
15:00−18:00
0.750.40
Table 2. Initial scene probabilities.
SceneMG1MG2MG3
10.120.170.17
20.380.150.38
30.150.110.14
40.130.350.16
50.220.220.15
Table 3. Solution of the algorithm used in this paper under different objectives.
Optimization PartMicrogrid ScaleIterationSolution Time/s
Maximizing social welfare364278.3
4125965.9
Distribution of benefits on Duowei Network31527.1
42333.2
Table 4. Solution under different algorithms.
AlgorithmMicrogridIterationSolution Time/s
Traditional C&CG12423.21
2376.19
3368.45
C&CG embedded with PH1230.06
2230.47
3230.53
Table 5. Costs and benefits of each MG and CES.
CostMG1MG2MG3CESAlliance
Break-even point cost/CNY24,360.8326,888.1815,070.36066,319.37
Cooperation cost/CNY21,733.1622,591.8314,423.83161.3058,910.12
Fraud cost/CNY1041.792007.84−1278.17−1771.28/
Negotiation conclusion cost/CNY23,618.2325,818.2613,618.96−5130.5657,924.89
Benefit increase value/CNY742.601069.921451.405130.568394.48
Disclaimer/Publisher’s Note: The statements, opinions and data contained in all publications are solely those of the individual author(s) and contributor(s) and not of MDPI and/or the editor(s). MDPI and/or the editor(s) disclaim responsibility for any injury to people or property resulting from any ideas, methods, instructions or products referred to in the content.