1. Introduction
With the growth of energy demands and the intensification of environmental pressures, the problems of CO
2 emissions and the abandonment of wind and solar energy in some areas have become increasingly severe. It is urgent to improve energy utilization efficiency [
1,
2]. An integrated energy system (IES), which has advantages such as multi-energy coupling and energy cascade utilization, can effectively reduce greenhouse gas emissions and improve energy efficiency through the coordinated planning of multiple energy sources [
3], contributing to China’s carbon reduction efforts under the dual carbon goals [
4,
5].
In low-carbon development, the IES with emission reduction potential has become a research focal point in the global arena. It enables bidirectional energy flow between the power grid and gas grid through P2G technology and MT, and allows for the coupling of different energy sources [
6]. Shi et al. [
7] proposed a flexible response model under a stepped carbon trading mechanism, using traditional CHP units and electric boilers to achieve optimization, but the consideration of wind and solar energy consumption was insufficient. Luo Zhao et al. [
8] put forward a dual optimization model, while considering the collection and utilization of carbon dioxide, ultimately striving to reduce the operational expenses of the IES in order to realize cost-effective operation of the park’s integrated energy system, but there were deficiencies in model construction. Jiao et al. [
9] constructed a model coupling P2G and wind power plants, which significantly improved the utilization rate of wind power, but the consideration of the system carbon emissions was not comprehensive, which was not conducive to the coordination of the system’s low-carbon and economic performance. Chen et al. [
10] proposed a model coupling wind power and hydrogen energy, which did not need to purchase hydrogen from outside, achieving a certain degree of energy self-sufficiency in the park. Liu Xiaojun et al. [
11] proposed the implementation of a green certification trading system within the IES, achieving the consumption of renewable energy and reducing system carbon emissions, but the demand-side load was relatively single, which could not fully utilize the flexibility of the model. Rutian W. et al. [
12] proposed an IES considering carbon capture technology and evaluated greenhouse gas emissions through life cycle assessment, using carbon emission coefficients and stepped carbon trading mechanisms with rewards and penalties to calculate carbon trading costs. Although this method significantly reduced carbon emissions, it led to an increase in system costs. Yiming M. et al. [
13] used carbon capture and storage (CCS) technology to capture CO
2 emissions from CHP systems and direct them into power-to-gas (P2G) processes, thereby eliminating the need for extensive transportation and storage infrastructure and reducing CO
2 emissions after CHP combustion of gas. Liu Sixian et al. [
14] introduced carbon capture and P2G into an IES, achieving carbon neutrality while improving system economic performance, but did not consider system operation costs. Li Jiangnan et al. [
15] proposed a multi-energy complementary model, adding system emission reduction to carbon trading to achieve low-carbon goals and selling the generated hydrogen to improve economic performance, but the proposed coupling model was relatively simple and did not accurately describe the actual operation state of the model. Liu Xia et al. [
16] produced hydrogen through renewable energy in an IES and stored it using hydrogen storage equipment, combining management schemes with renewable energy to achieve carbon reduction. Li W. et al. [
17] considered a new model for recovering waste heat and achieved certain results in carbon reduction through a stepped subsidy incentive mechanism. Yang Xiaohui et al. [
18] integrated the green certificate system with the carbon trading framework and introduced it into a regional IES, significantly increasing the utilization rate of renewable energy sources. Wu X. et al. [
19] proposed a capacity optimization method for energy storage microgrids considering electro-hydrogen coupling to realize the configuration in a comprehensive economy and power supply reliability analysis. Yang J.W. et al. [
20] found that the combined operation of CCS and P2G could reduce the waste of abandoned wind power and significantly lower carbon emissions. As a market-based policy tool for carbon reduction, the carbon trading mechanism is important in the operation of an integrated energy system. It prices carbon emissions to prompt energy producers to reduce emissions or purchase carbon quotas in order to achieve emission reduction targets. Zhao et al. [
21] investigated the effects of incorporating the conventional carbon trading mechanism into the dispatching framework of an integrated electricity and natural gas energy system. Their study demonstrated that the implementation of a carbon trading system significantly impacts both the economic performance and carbon emission levels of the energy system. Yan et al. [
22] proposed an IES multi-agent low-carbon trading model, enabling each stakeholder to achieve a balance of interests in a carbon-constrained environment and reducing carbon emissions during the interaction process. Although existing studies have explored the impact of various factors, such as electricity-to-gas conversion, carbon trading mechanisms, and carbon capture and storage on an IES, they often fall short in providing comprehensive discussions regarding the multi-level utilization and distribution of hydrogen production derived from electricity, combined heat and power systems, two-stage P2G processes, and carbon capture technologies. To fully harness the potential of hydrogen energy in reducing carbon emissions while enhancing the overall benefits of an IES—alongside increasing new energy utilization rates and achieving collaborative coupling among multiple energy sources—this paper proposes an optimal scheduling model for industrial parks that integrates cogeneration with CCS alongside P2G (referred to as CCP).
In summary, in response to the current research deficiencies, we have considered more energy coupling in the model and carried out multi-energy coupling optimization, addressing the pain point of conflicts between individual interests and system goals in traditional optimization. Moreover, an improved CCP model has been proposed, and the low-carbon economic performance of this model has been verified through case simulation, thereby contributing to the realization of the “dual carbon” goals.
2. Materials and Methods
2.1. The IES Framework for Considering the Rewards and Penalties of Carbon in Industrial Parks
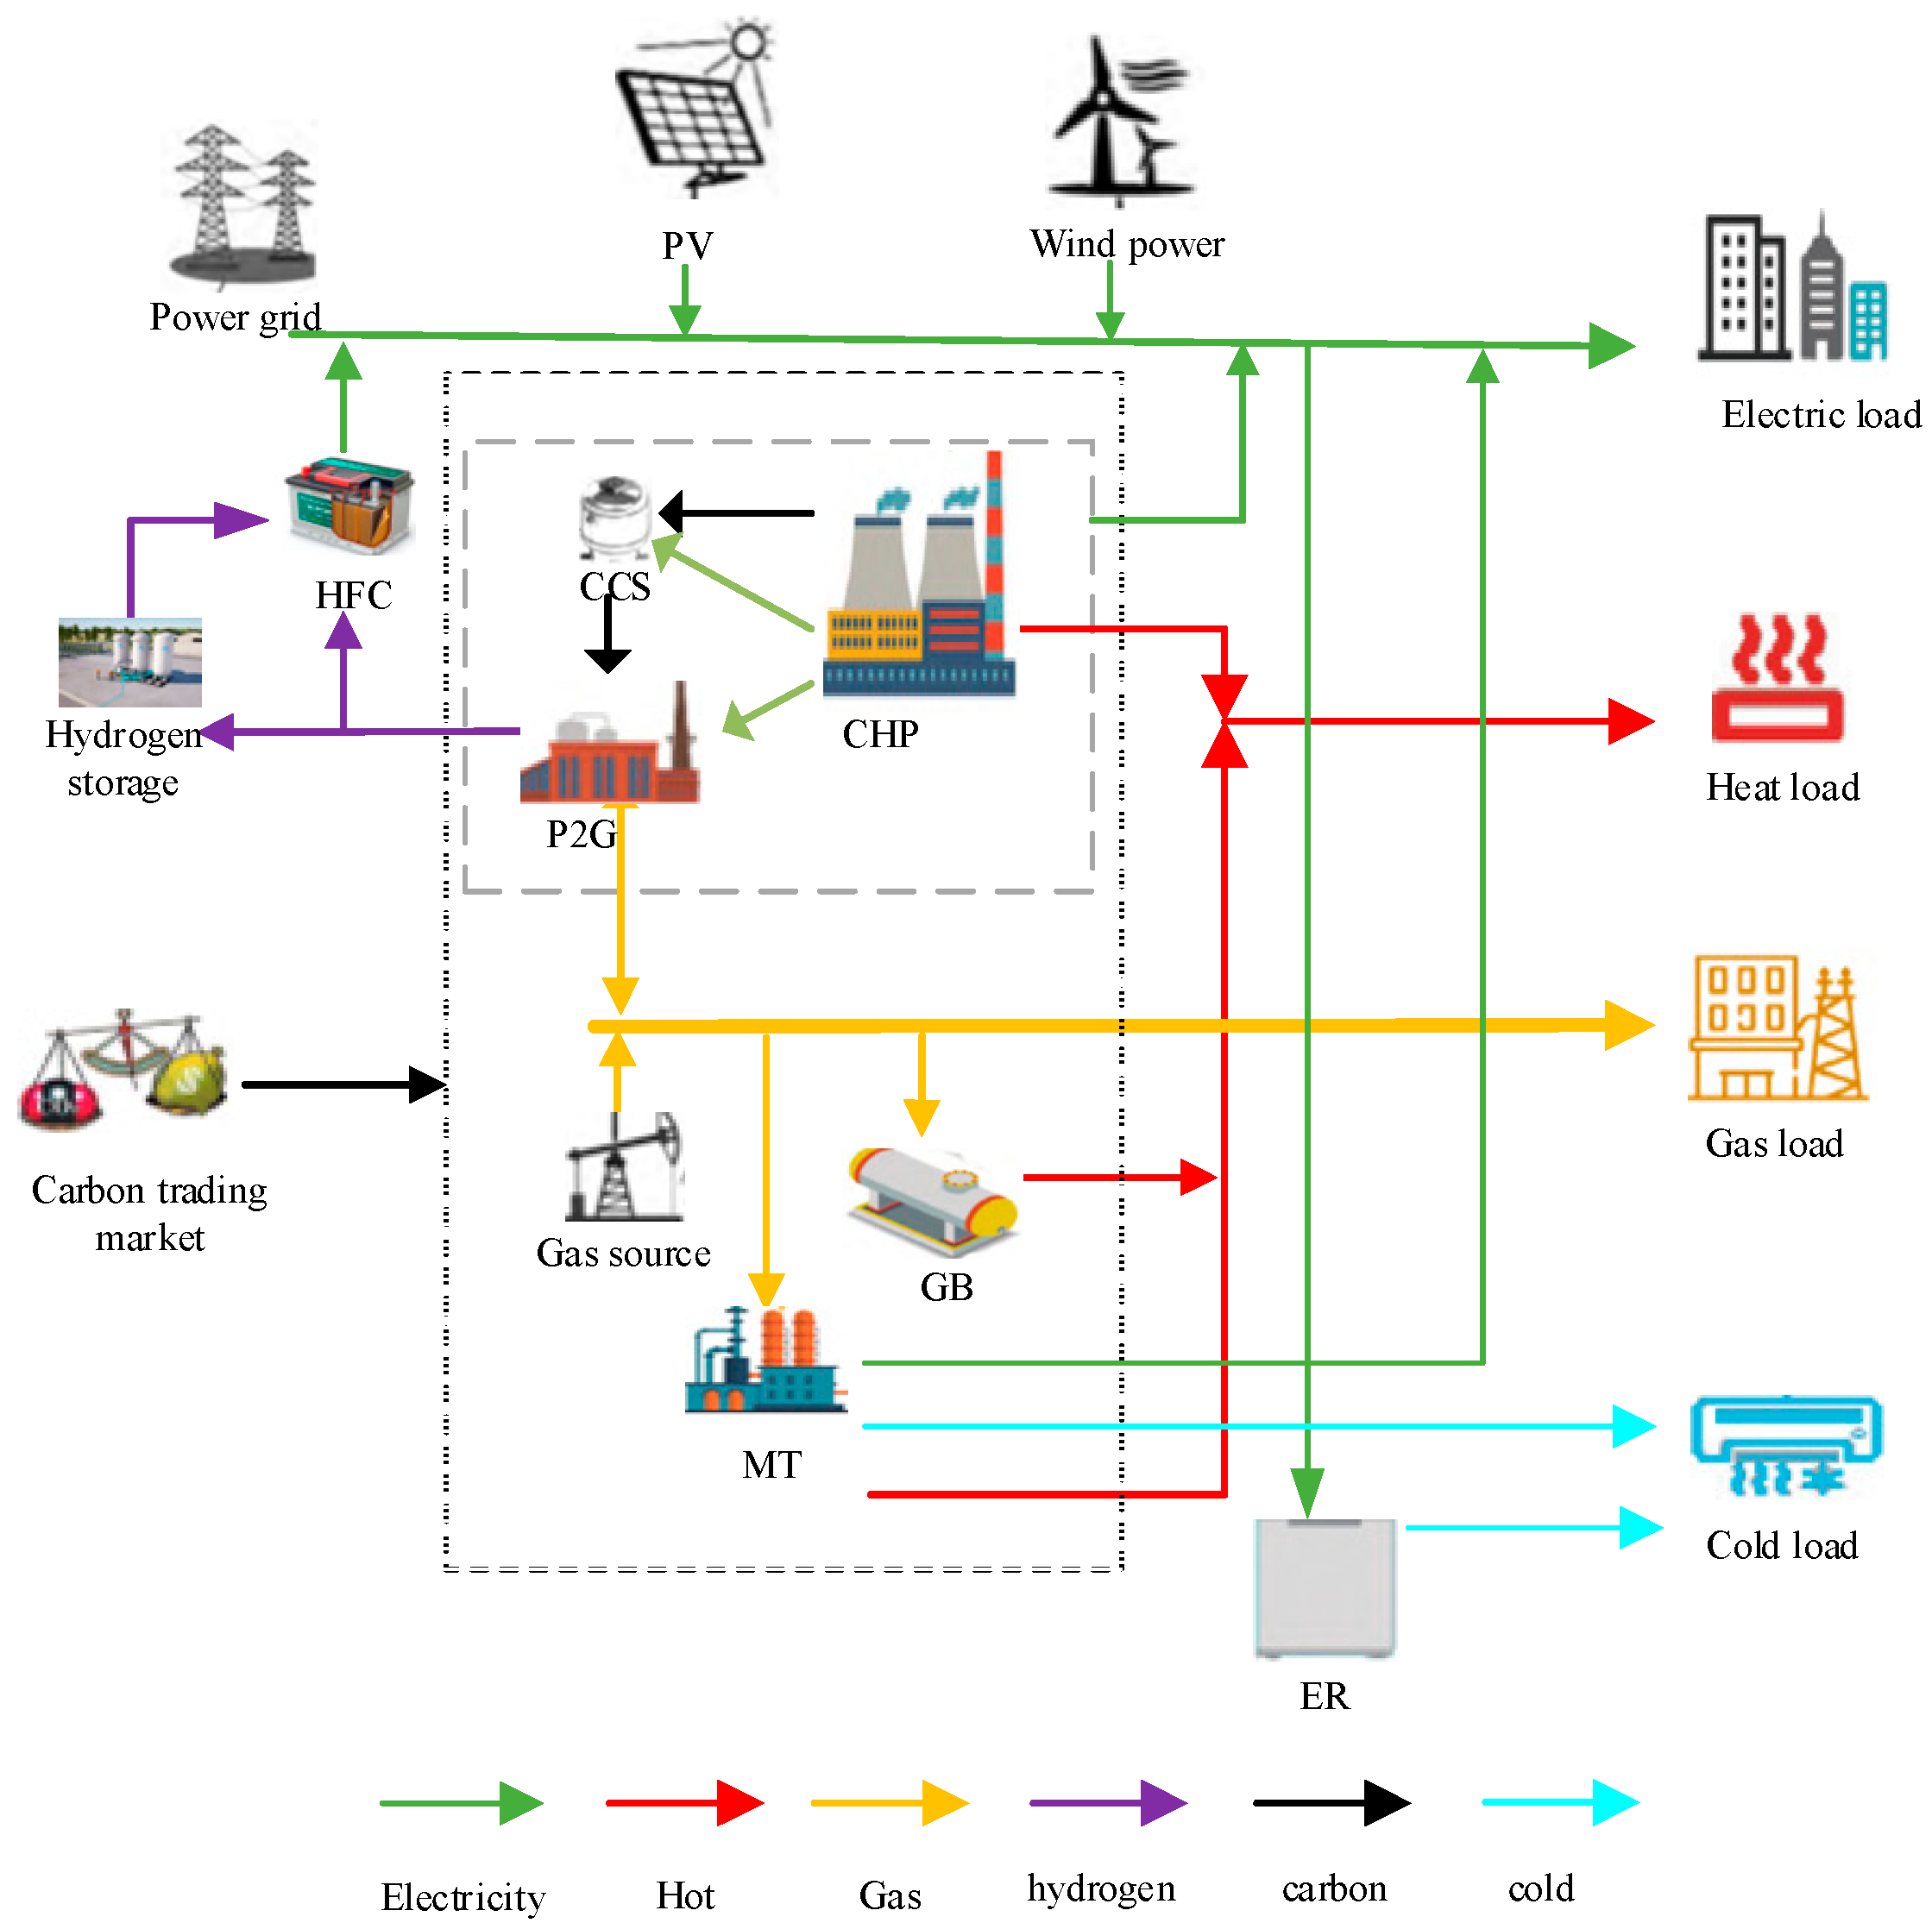
The IES industrial park is illustrated in
Figure 1. The electricity generation component comprises photovoltaic (PV) modules, wind turbines, micro gas turbines (MT), and combined heat and power units. The energy conversion devices encompass power-to-gas systems, gas boilers, electric chillers, and hydrogen fuel cells. On the energy storage side, there is a hydrogen storage tank, while the demand side reflects the requirements for electrical, thermal, gas, and cooling loads. Among them, the gas required for gas boilers, micro gas turbines and other gas applications is provided by electricity-to-gas systems as well as external natural gas pipelines. Among them, the P2G equipment supplies the converted methane gas to the MT, GB and gas loads, and purchases methane through the external gas network when the weather demand is high.
2.2. CCP Coupling Model
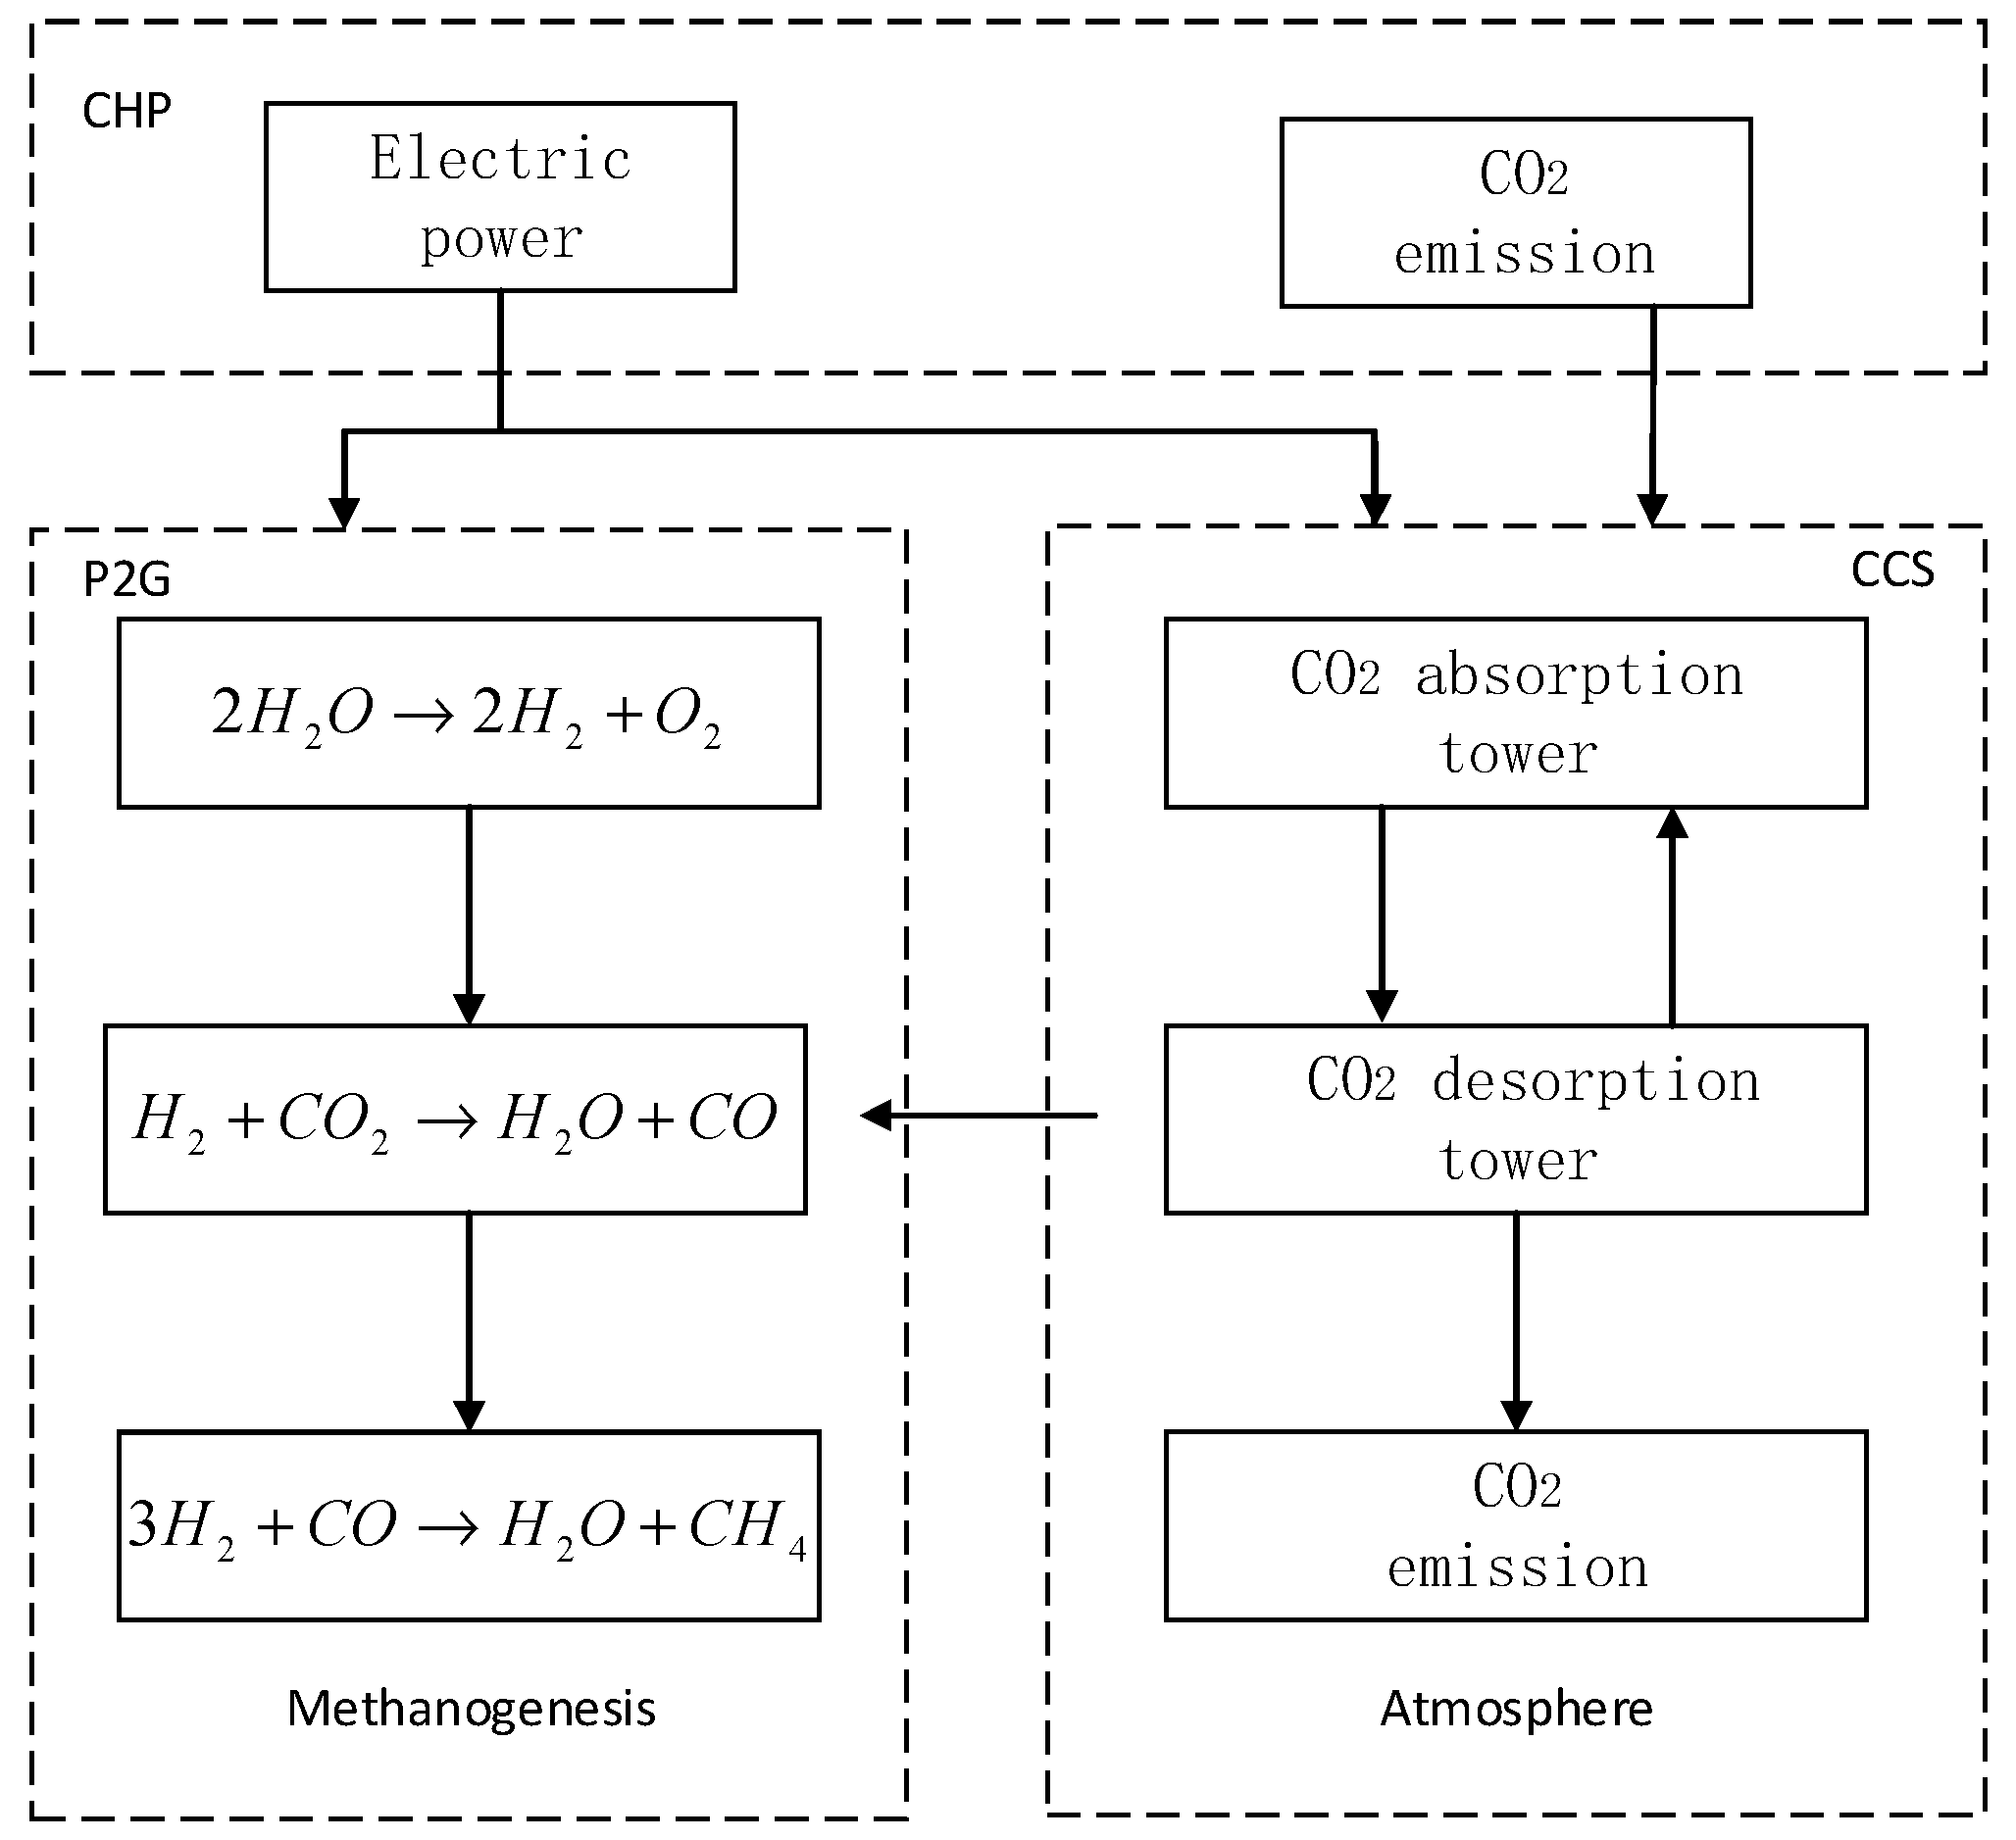
To enhance the economic efficiency and operational flexibility of IES scheduling within industrial parks, this paper proposes a CHP of P2G and CCS modes and constructs a CCP joint operation model. The operating mechanism of the CCP is shown in
Figure 2.
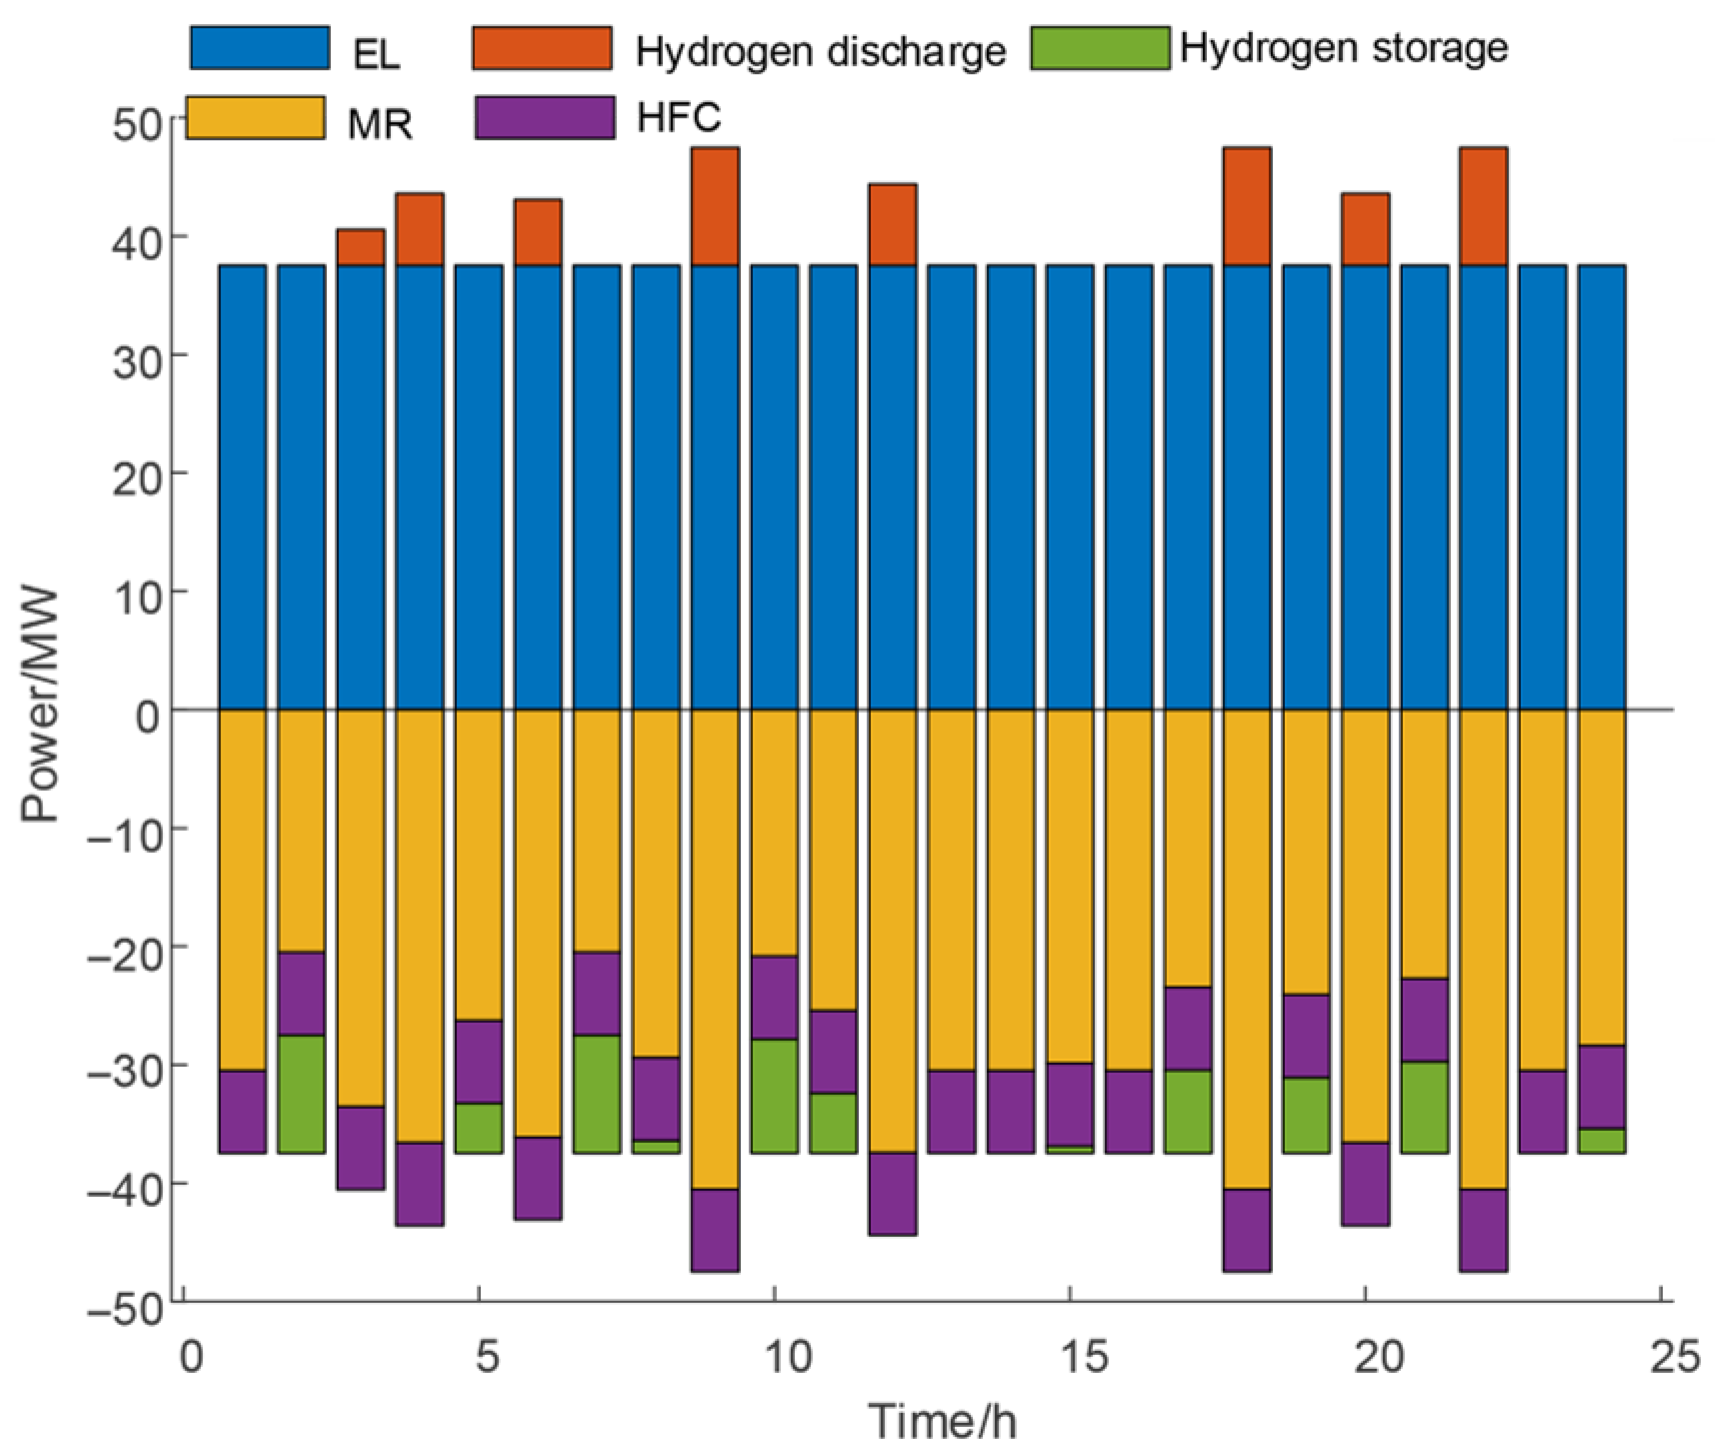
Under the CCP operation mode, CCS can capture the CO2 produced by the CHP unit, thereby reducing the CO2 emissions of the CHP unit. The CHP unit is integrated with P2G and CCS technologies. The P2G process can, in theory, be broken down into two distinct phases, namely the hydrogen production stage through water electrolysis and the hydrogen-to-methane conversion stage. In the first stage, the CHP unit supplies energy to the P2G to electrolyze water and obtain hydrogen. Part of the generated hydrogen is supplied to the hydrogen–oxygen fuel cell and the hydrogen storage tank, while the other part enters the second stage of methanation. In this stage, H2 and CO2 react to convert into CH4, which is easier to store and utilize, reducing the gas purchase cost of the system and lowering the electric coupling properties of cogeneration units.
2.3. CCS and P2G Models in CCP Mode
Within the equation, represents the electrical power supplied by CHP to the power grid, in MW; represents the electrical power consumed by P2G, in MW; and represents the electrical power used by CCS, in MW.
This paper captures and stores the CO
2 generated during the operation of CHP. CCS consumes electrical energy to integrate CO
2 into the absorption tower. Then, the rich liquid enters the desorption tower to release high-purity CO
2, which is then transferred to P2G. The energy consumption of CCS is divided into fixed power consumption and operational power consumption. The operational power consumption is positively correlated with the amount of CO
2 captured by CCS. The CCS model is shown in Equation (2).
Within the equation, represents the fixed energy consumption of CCS, in MW; represents the operating energy consumption, in MW; and represents the CO2 capture, t. represents the efficiency coefficient between the consumption of electrical energy and the capture of CO2, MW.
The P2G model is as follows:
In the formula, is the calculation coefficient between the electrical energy consumed by P2G and the amount of CO2 required; is the methane power generated by P2G, in MW; represents the power of hydrogen production, in MW; and is the conversion efficiency coefficient.
2.4. Integration Features of CHP Combined with P2G and CCS
The limits of the power of CHP during normal operation are described in (4).
Substituting Equation (1) into Equation (4), the upper and lower limits of the new power of CHP,
, are obtained as in Equation (5).
The constraints for the upper and lower limits of the electric power in P2G are kindly provided by the following Equation (6).
Among them, and represent the lower and upper bounds of the P2G system’s electrical power, respectively.
The electric power constraint of CCS is described in (7).
From Equations (5)–(7), we obtain a range of
, which is represented by Equation (8).
In the formula, and , the values mentioned, are kindly referred to as the upper and lower limits of the electrical power for the new CHP system.
The thermal power constraint of the CHP unit is described in (9).
Among them,
and
are the min and max thermal powers of the CHP unit, respectively. Equation (10) represents the range of electric power for
and
:
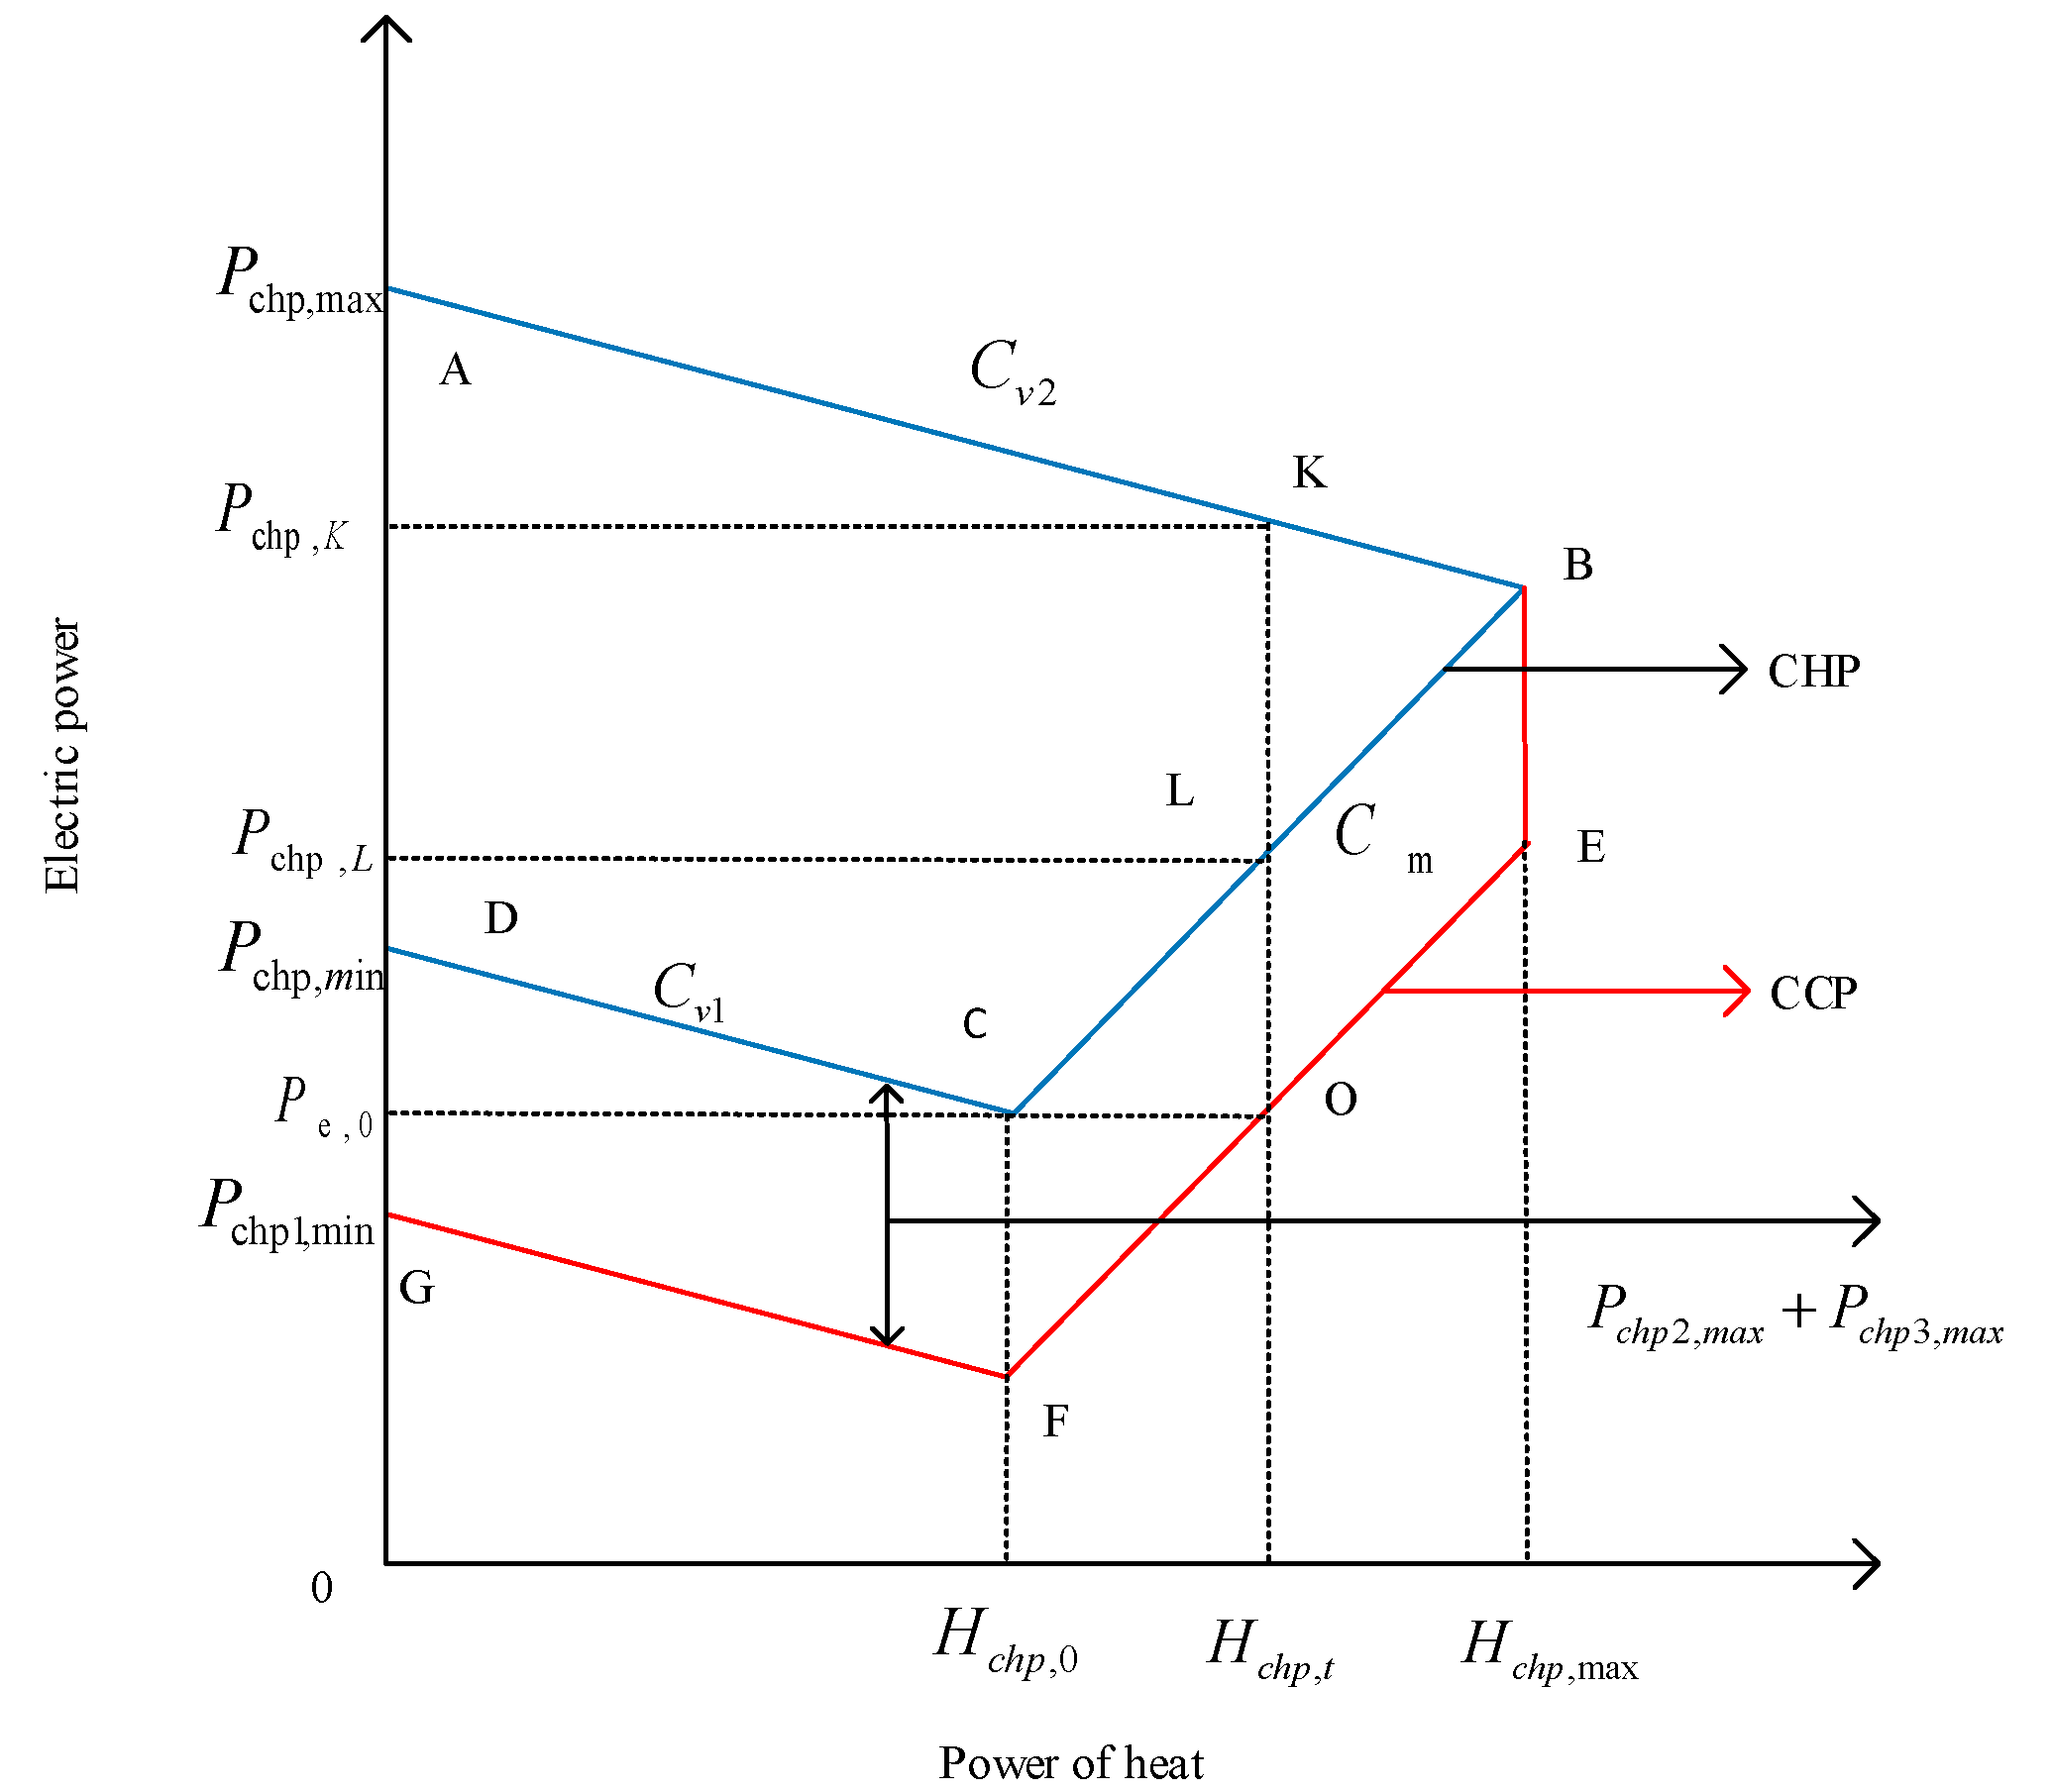
Combined with the characteristics of the unit, it can be known that the operating range of the conventional CHP is shown as the quadrilateral ABCD in
Figure 3. According to the above formula, it can be known that the feasible range of the electricity–thermal power of the model under the CCP is shown as the polygon ABEFG in
Figure 3. After introducing the P2G-CCS cooperative operation strategy, the lower limit of the electric power of the CHP system migrates from the original operation point D to point G, and its output range is expanded to ΔD-G. The power regulation margin has been significantly enhanced, thereby expanding the range. When the output of the CCP combined system is
, the feasible operating trajectory of CHP extends from the original constrained line segment LK to OK, and the corresponding range of electric power regulation expands. This mechanism effectively solves the thermoelectric output constraint of CHP through the absorption of the electrolytic load of P2G and the regulation of the CCS by the CCS, reducing its electrothermal coupling coefficient.
The CO
2 production of the CHP unit in CCP mode is as follows:
In the formula, , , and are the CO2 coefficients of the CHP unit, .
2.5. Other Equipment Models in the Industrial Park
Hydrogen–oxygen fuel cell:
and are the output powers of the electrical and thermal energy of the HFC, respectively, in MW, and is the input power of hydrogen energy, in MW. and are the conversion coefficients of electricity and heat energy; and is the lower limit of hydrogen input power and is the upper limit, in MW.
In the formula, is the thermal power generated by the gas boiler, in MW; represents the gas consumption power of the boiler, in MW; represents the efficiency of the gas boiler; and and are the limits of the thermal power of the GB, in MW.
Miniature gas turbine model:
represents the gas consumption power of the MT, in MW; , , and are the power conversion coefficients of electricity, heat, and cold, respectively, and represents the heat power of the MT, in MW. is the cooling power of the MT, in MW; and is the minimum output power of the MT and is the maximum output power, in MW. and illustrate the highest and lowest climbing speeds achieved by the MT, respectively, in MW.
Model of hydrogen storage tank:
In the formula, and are the charge and discharge powers of the hydrogen storage tank, respectively, in MW; and and are the upper and lower limits of the hydrogen storage tank capacity, respectively.
Electric refrigeration machine:
represents the power consumption of the electric chiller, in MW; is the conversion efficiency; and and are the limits of the power consumption of the electric chiller, in MW.
2.6. Carbon Emission Rights Quota Model
The CO
2 emission sources in the IES mainly fall into three categories: CHP, GB, and gas turbines. The carbon emissions quota is defined as follows:
In the formula, the components of are the unit carbon emission quotas, respectively.
2.7. Real Emission Model
The industrial park actual carbon emissions should exclude the CO
2 captured by CCS. The calculation formula is as follows:
In the formula, denotes the actual carbon emissions of the IES; indicates the total actual carbon emissions from CHP and GB, measured in tons; refers to the equivalent output power of CHP and GB during period t, expressed in megawatts; and includes the parameters used for the calculations.
2.8. An Incremental Carbon Trading Model Based on Incentives and Sanctions
The transaction volume of carbon emission rights is as follows:
To further mitigate carbon emissions, the carbon trading model meticulously computes the cost of carbon trading by delineating the spectrum of carbon emissions. The associated costs for engaging in carbon trading are as follows:
In the formula, represents the carbon trading price of the day, is the length of carbon interval, and and , respectively, represent the penalty coefficient and the reward coefficient.
2.9. Constraint Conditions
Constraints on the output of wind and photovoltaic energy:
In the formula, and represent the maximum power transmission of wind power and photovoltaic power, respectively, in MW.
Electric power constraints of P2G and CCS:
See Equations (6) and (7).
Gas Turbine Constraints:
See Equation (14).
Carbon capture constraints of CCS:
In the formula, represents the electrical load of the system at time t.
In the formula, represents the heat load of the system at time t.
Within the equation, denotes the volume of gas procured by the system at a given moment t; and signifies the gas demand imposed upon the system at that same instant t.
Cold power constraints:
Considering cold inertia, cold loss, and cold delay, the cold work constraints are as follows:
In the formula, and represent the limits of the cold network ratio, and is the cooling load of the system at time t, in MW.
2.10. Objective Function of the Comprehensive Energy Optimization Dispatching Model in the Park
The industrial IES optimization operation model under the carbon trading mechanism aims to achieve the optimal operation cost of the system on the premise of meeting the operation constraints of the system. The objective function is to minimize the sum of the energy purchase cost
, carbon trading cost
, wind power curtailment cost
, solar power curtailment cost
, and operation and maintenance cost
, in EUR.
Energy purchase cost:
When the generated power capacity is insufficient to satisfy the local demand, electricity is purchased from the higher-level power grid. Accordingly, the cost associated with purchasing energy can be expressed as follows:
In the formula, T represents one running cycle; represents the quantity of electricity procured at time t; and and denote the electricity price and gas price at that same moment, respectively.
Carbon trading cost:
See Equation (20).
Operation and maintenance cost:
In the formula, , , and are the operating cost coefficients of CHP, respectively; and are, respectively, the operating cost coefficient of P2G and the cost coefficient of CO2 consumption; and and are the operating coefficient of CCS and the CO2 storage cost coefficient, respectively. is the boiler cost coefficient and is the electric chiller cost coefficient.
Abandoning wind and light costs:
In the formula, is the wind abandonment penalty coefficient; is the light abandonment penalty coefficient; represents the predicted output of wind power at time t, in MW; and represents the predicted output of photovoltaic power at time t, in MW.
2.11. Model Solution
This paper built the industrial park of the IES with a nonlinear model. Using the subsection linearization method, this is transformed into a mixed integer linear model. The method is obtained by calling the Gurobi solver using the Yalmip toolkit in the MATLAB R2021a software to conduct optimization.
2.12. Parameter and Scene Settings
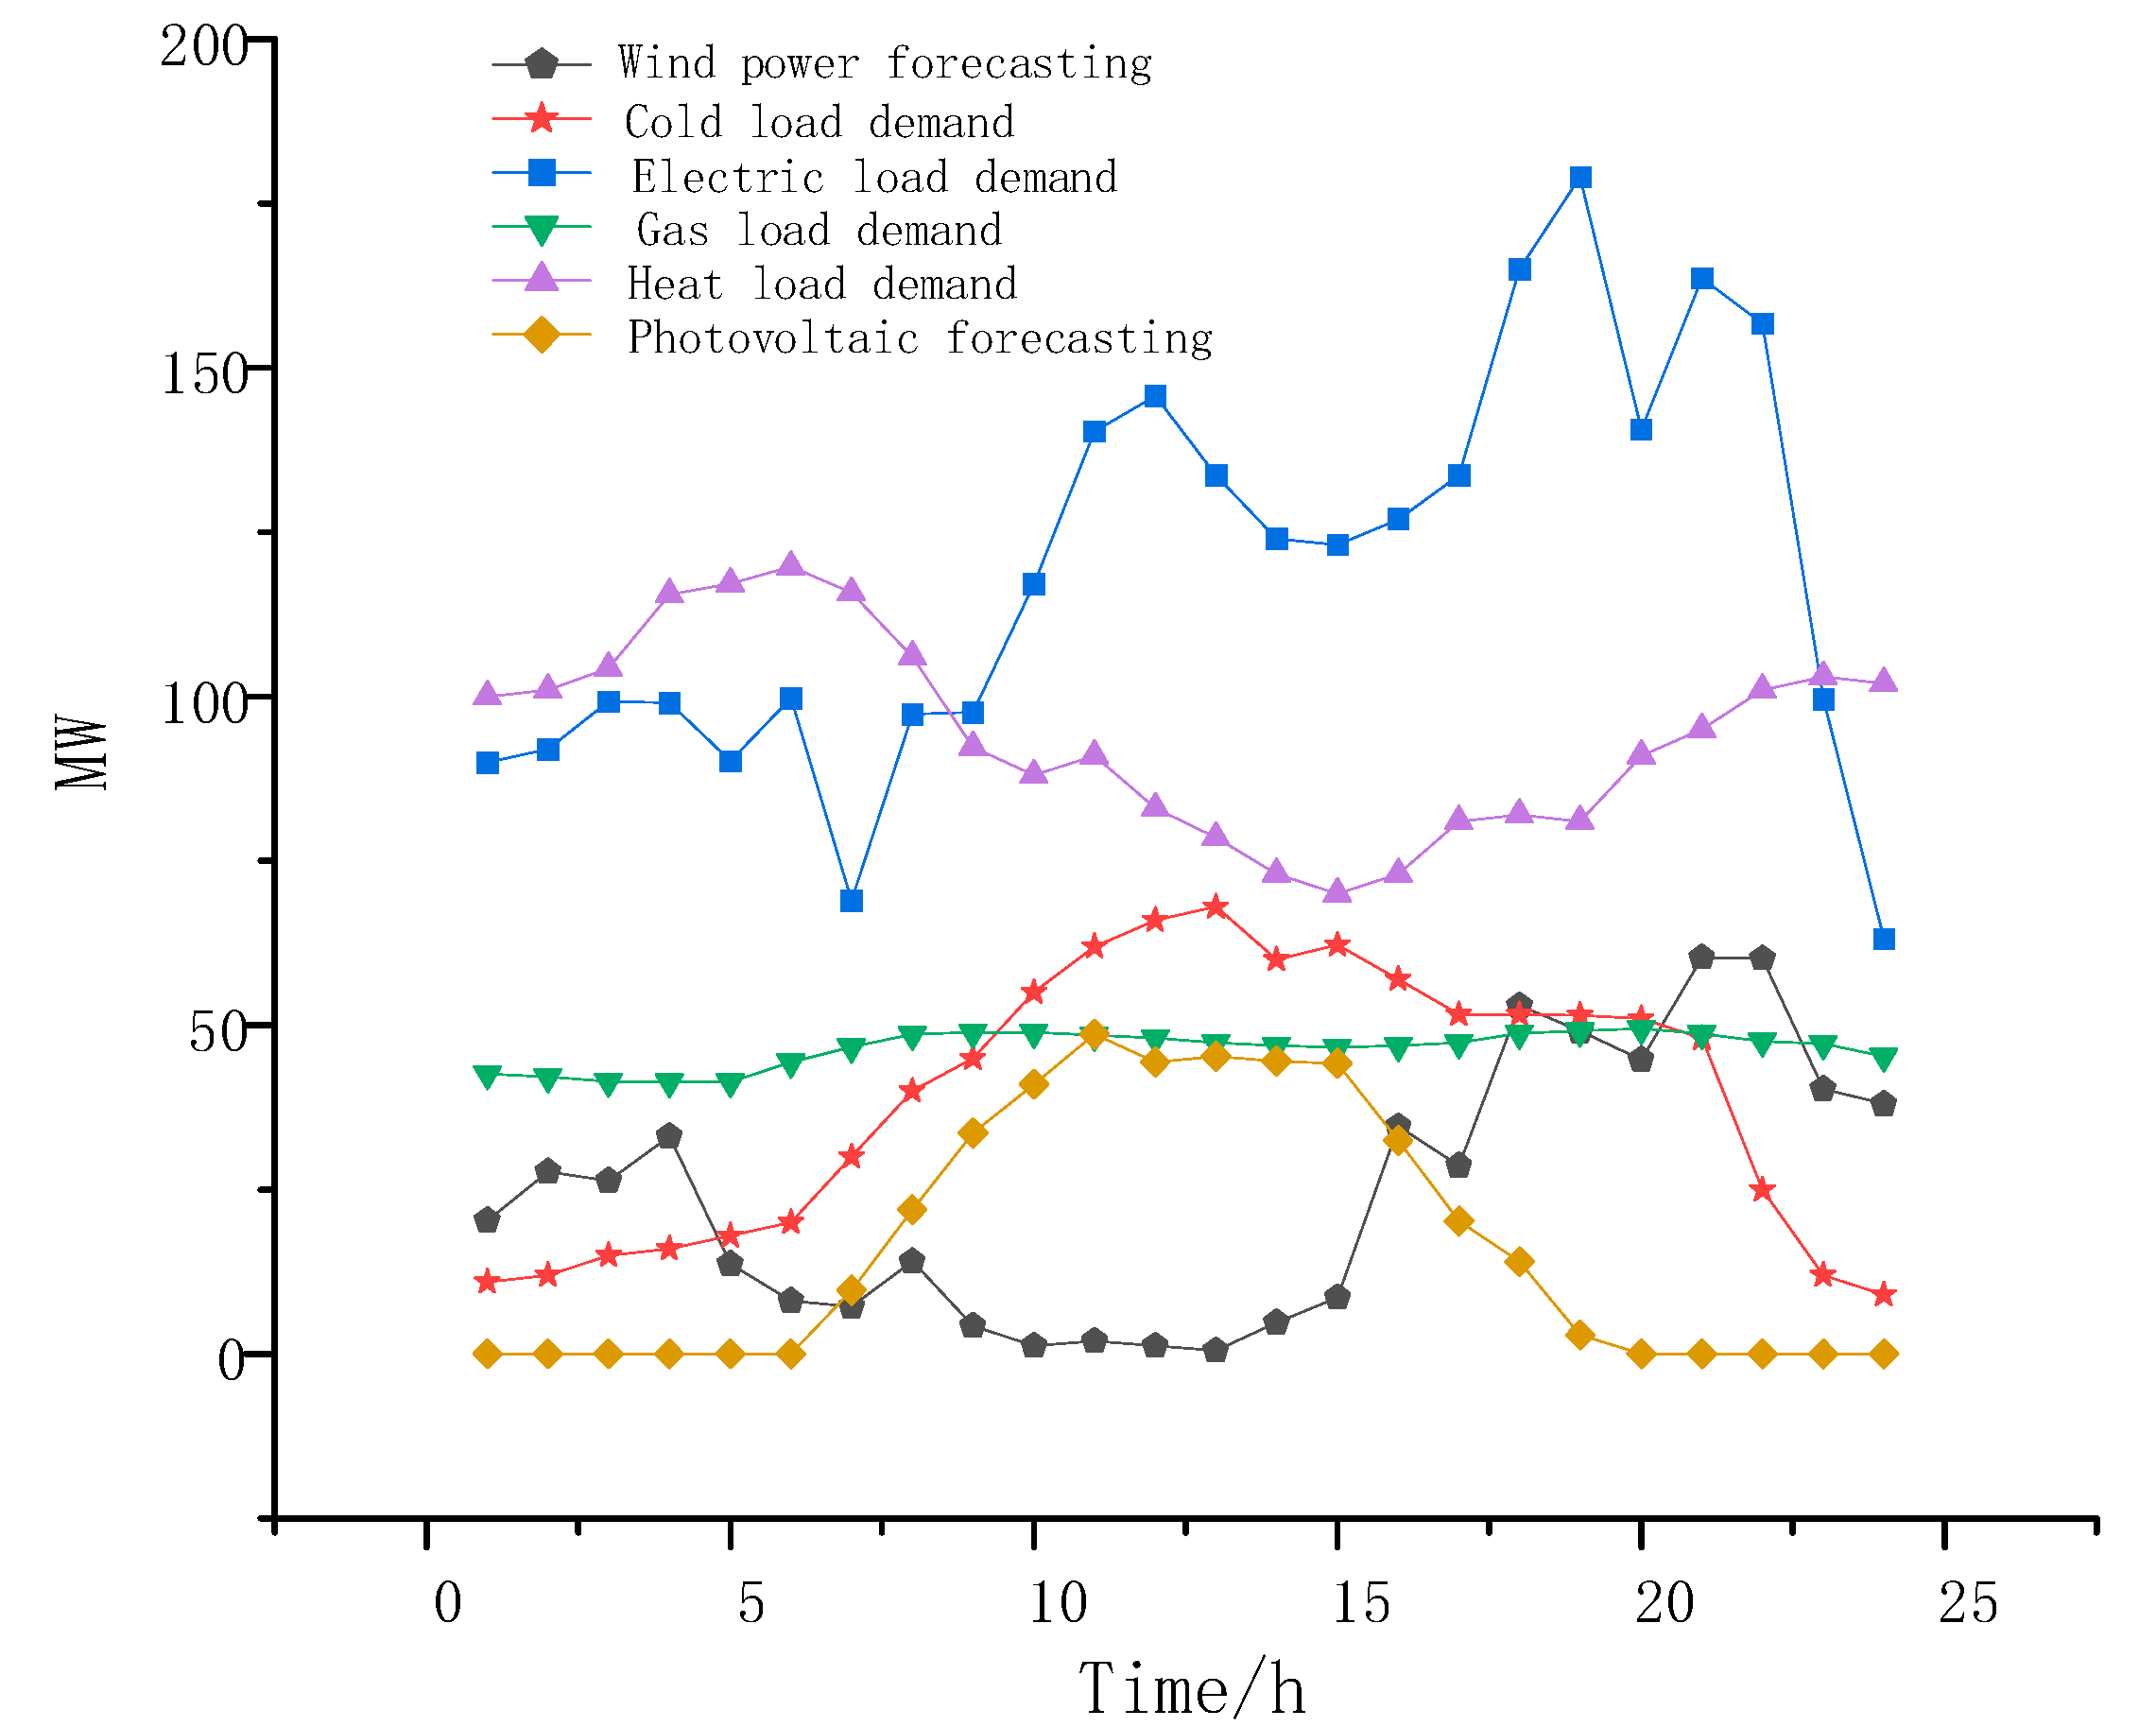
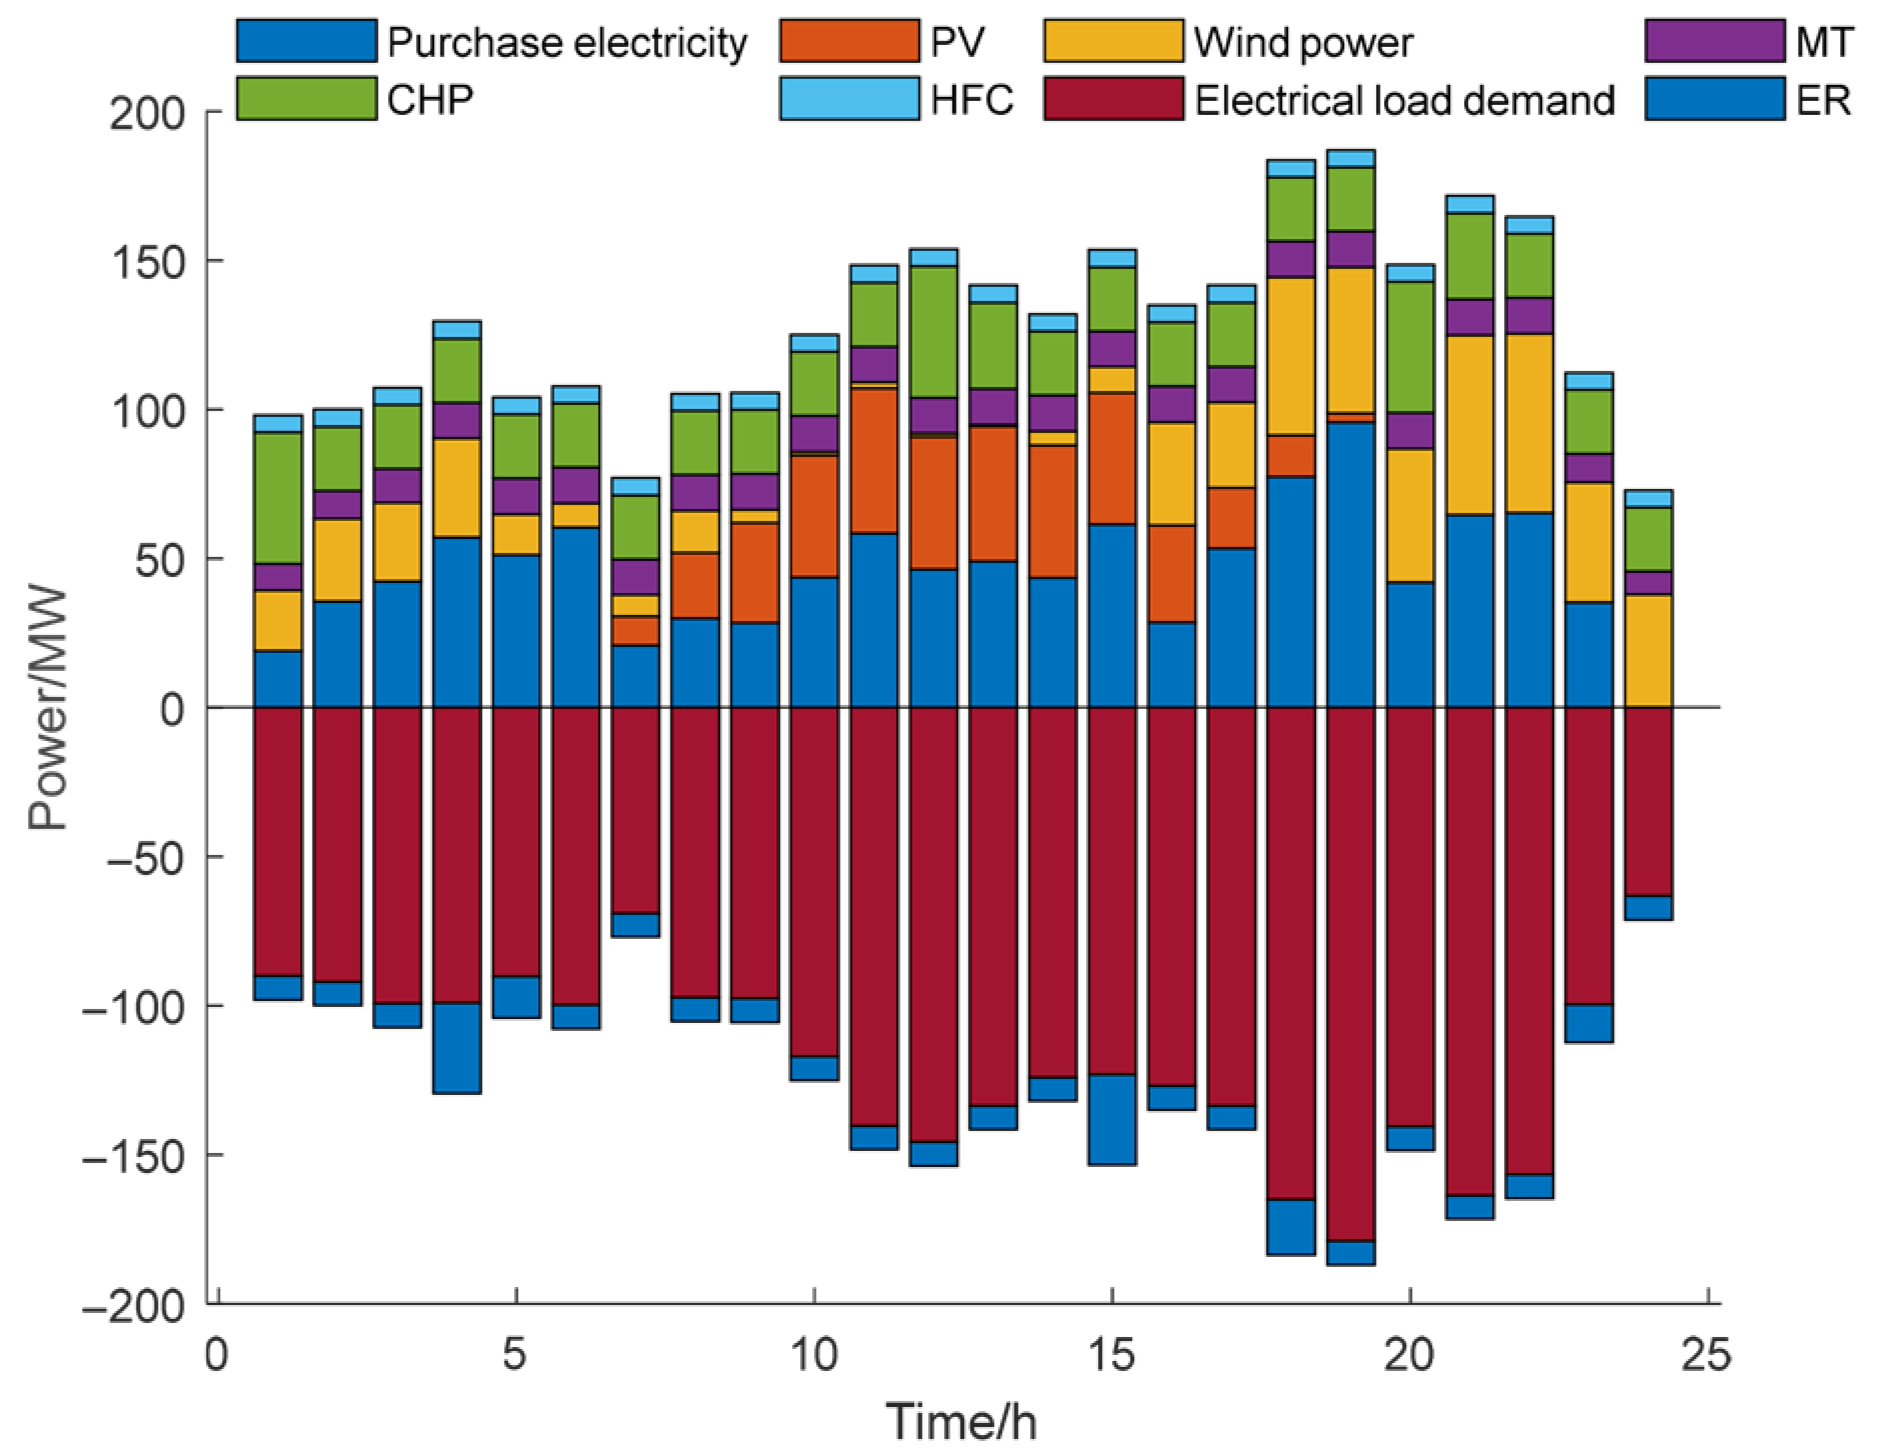
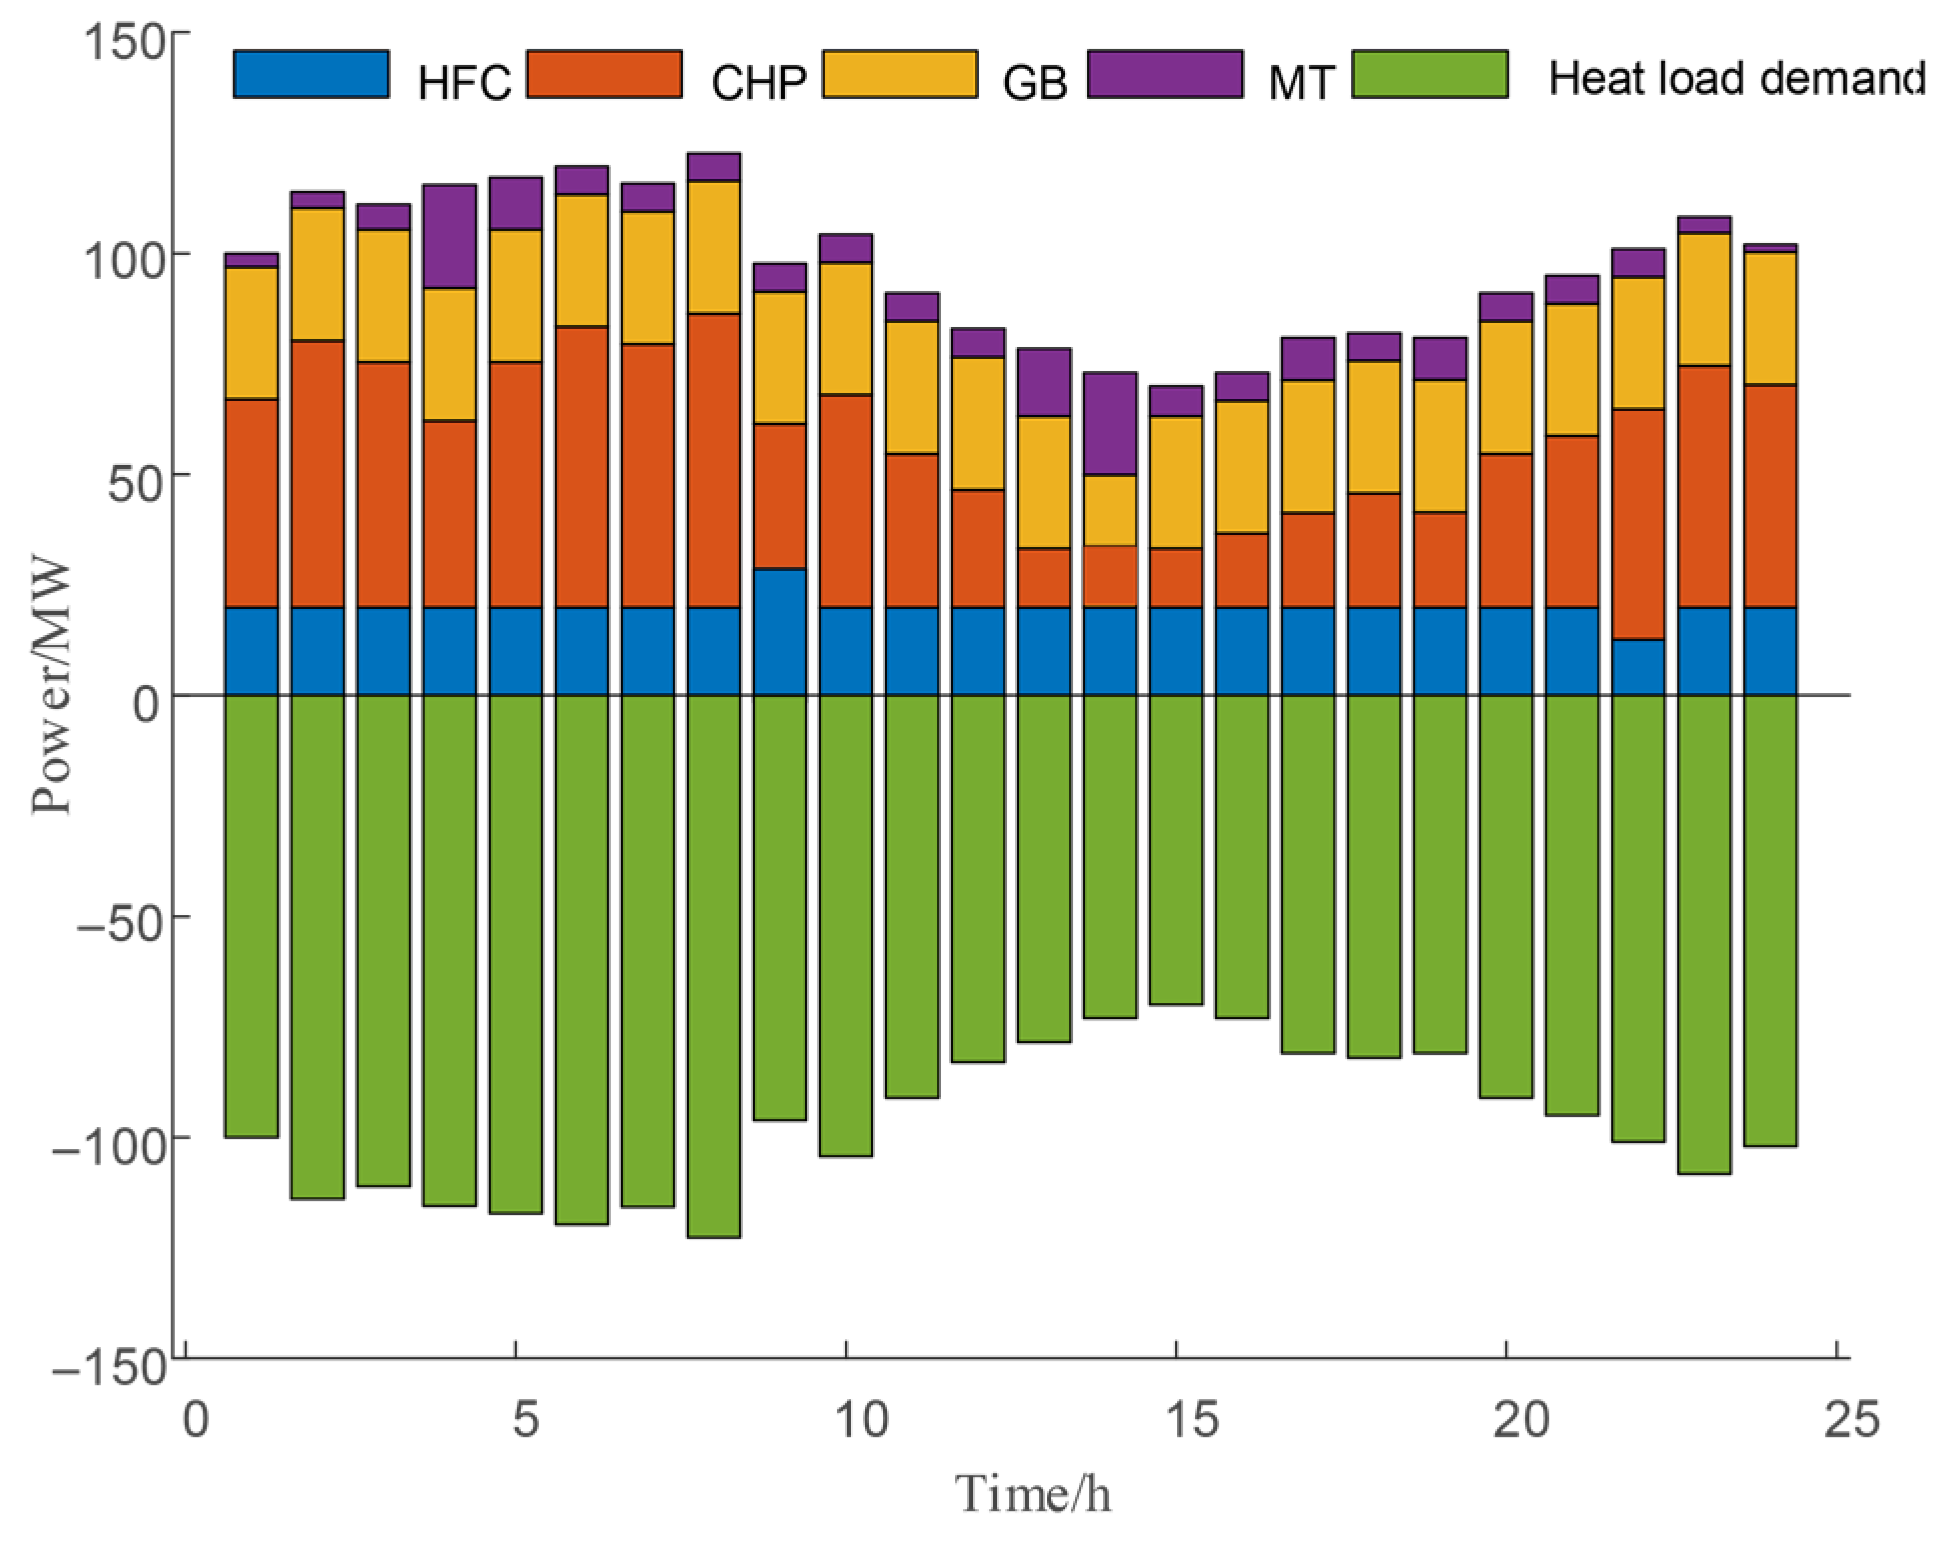
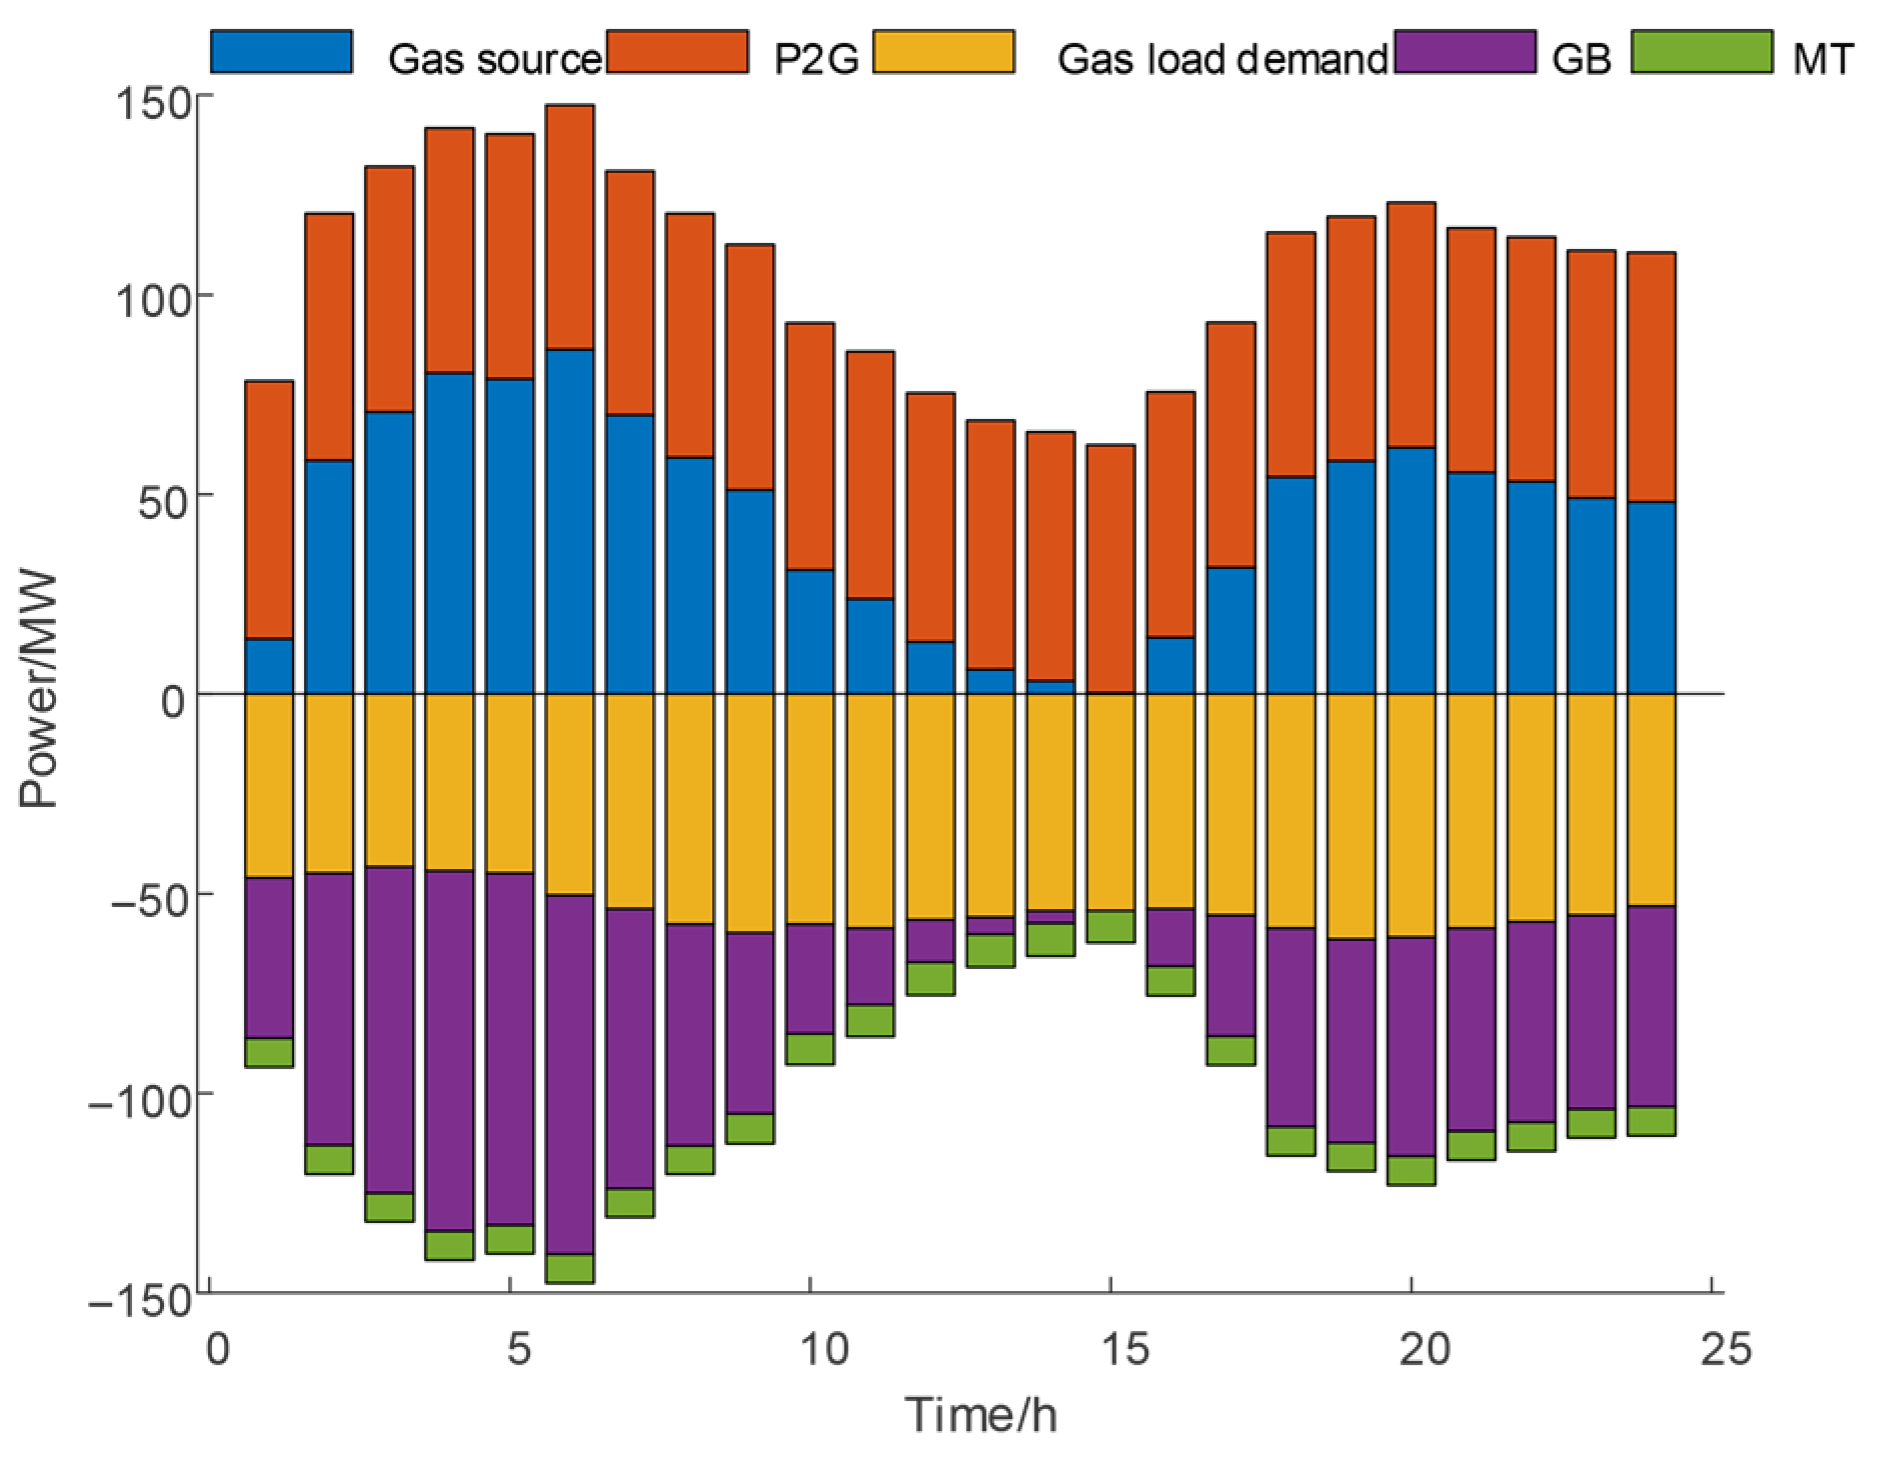
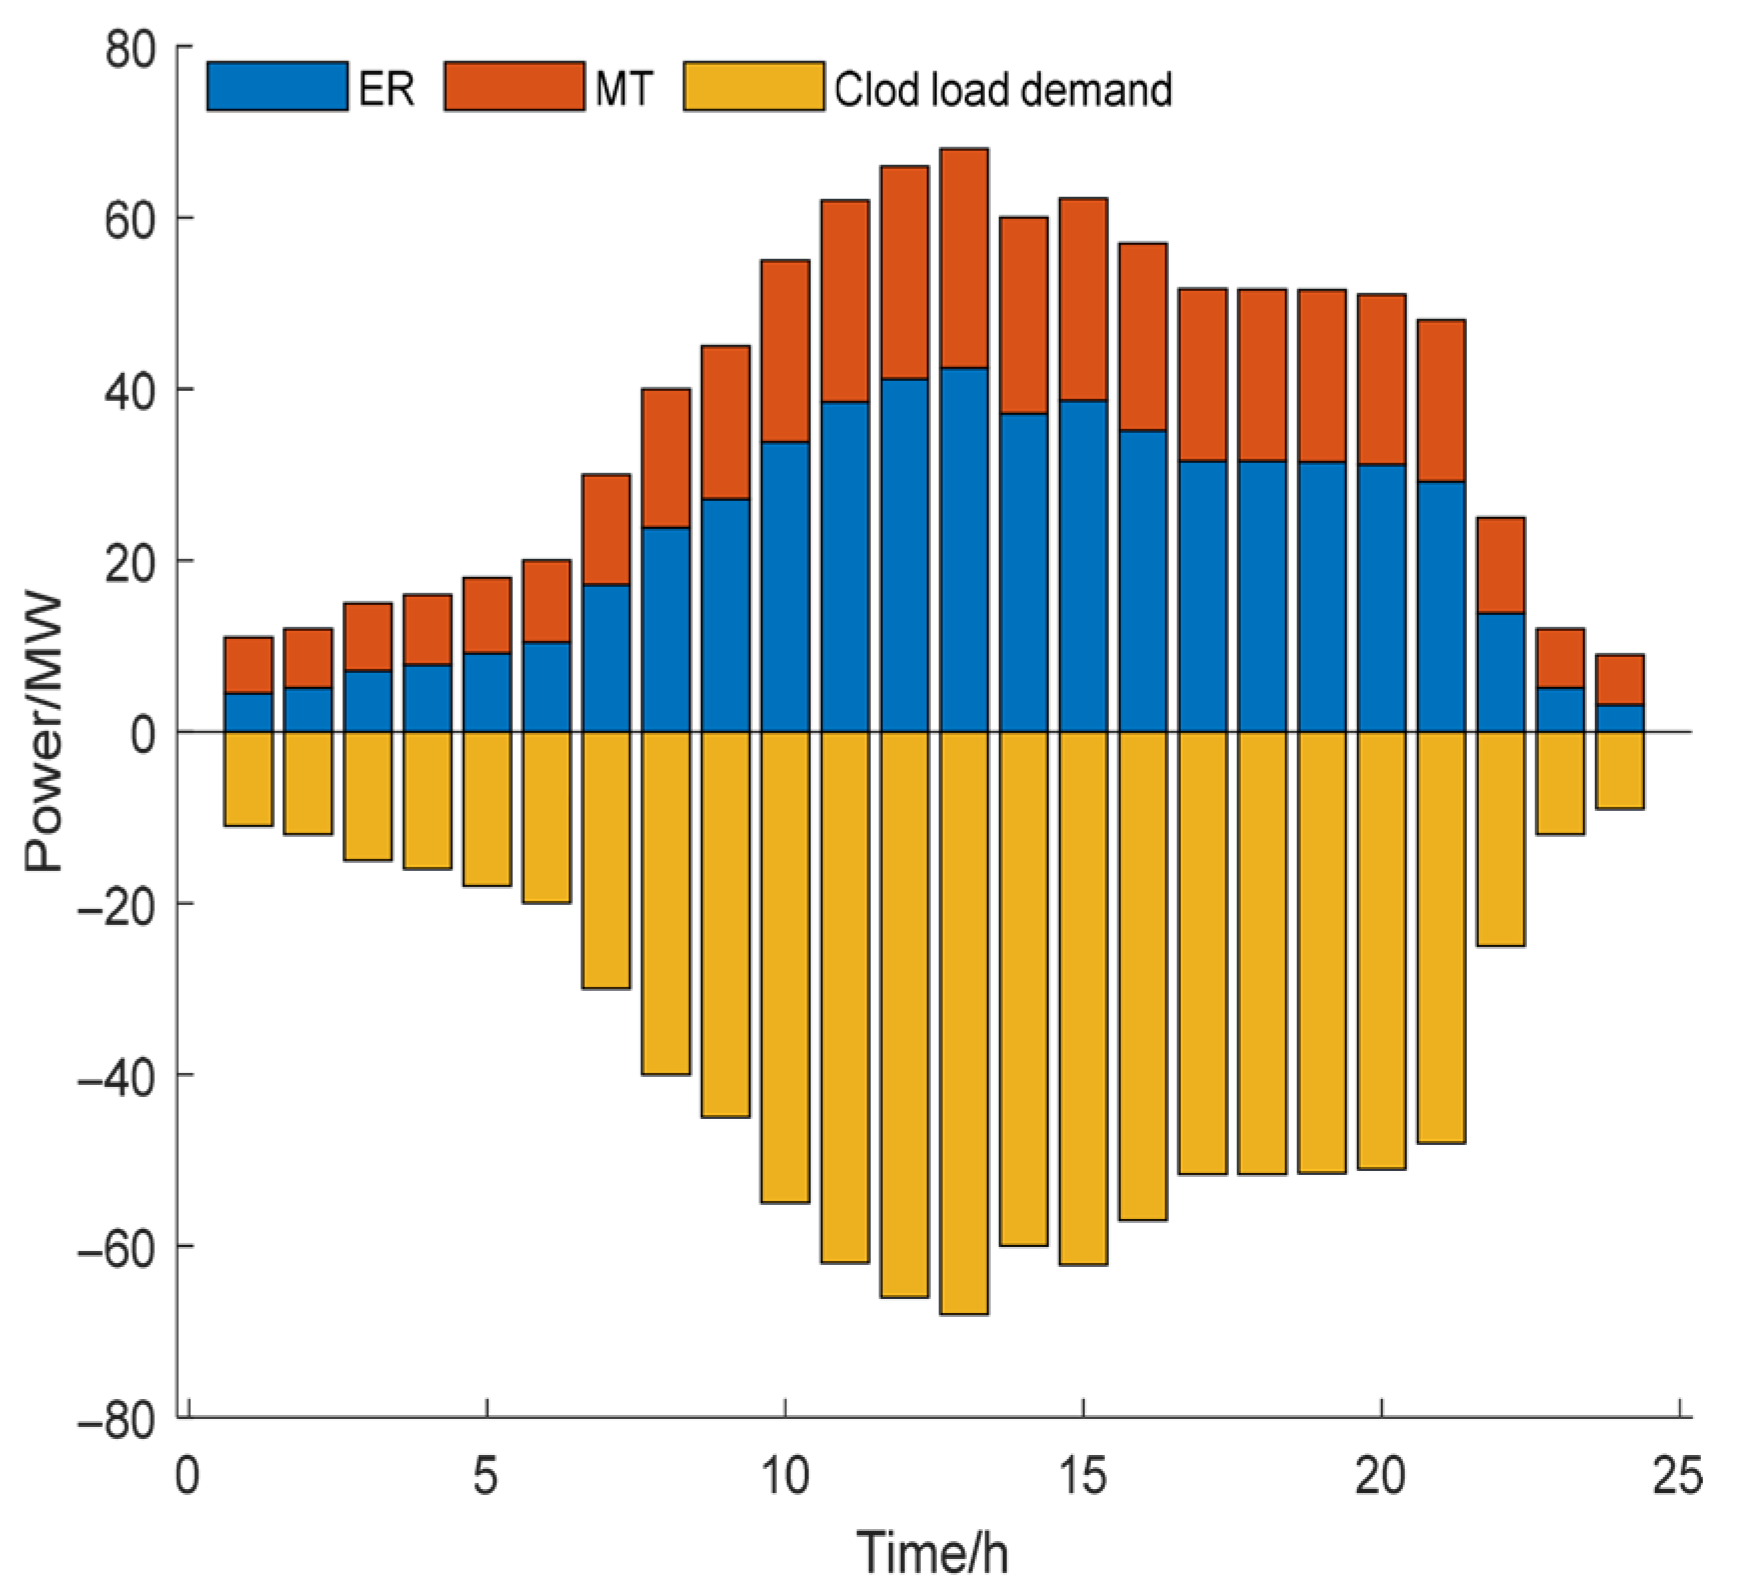
To verify the effect of the reward and punishment stepped carbon trading mechanism and the CCP joint operation model proposed on the economy and carbon emission reduction of industrial parks, the verification is conducted for one scheduling cycle. The load forecast output of the system is shown in
Figure 4. The parameters of the CHP unit are shown in
Table 1, the pricing details for electricity are presented in
Table 2, the natural gas price is taken as
, and other parameters are presented in
Appendix A.
This study establishes four distinct scenarios for comparative analysis, as presented in
Table 3. Scenario 1 excludes the integrated operation of carbon trading schemes and the CCP. Building upon Scenario 1, Scenario 2 introduces a carbon trading mechanism that incorporates both incentives and penalties. Scenario 3 introduces CCS and P2G on the basis of Scenario 1, that is, it considers the joint operation of CCP units. Scenario 4 is the optimization strategy considered in this paper.
4. Conclusions
To promote the harmonious enhancement of the low-carbon economy and the utilization potential of renewable energy within the comprehensive energy framework, and to ensure the reliable operation of the system at the same time, in this paper, the CCP is coupled for operation, and the IES model is constructed under the carbon trading mechanism. Through multi-scenario simulation verification, the following key conclusions are drawn:
The effect of electric-to-gas equipment with carbon and hydrogen storage equipment can decouple electric hydrogen production and electric-to-gas conversion, thereby enhancing the operational flexibility of electric-to-gas equipment. The connection of carbon storage equipment eliminates the reliance on purchasing CO2 from outside, thereby reducing costs. Meanwhile, the introduction of hydrogen storage equipment enables the electric-to-gas conversion device to fully utilize the surplus electricity, including renewable energy, and achieve full consumption.
Considering the tiered carbon trading mechanism of rewards and punishments, a 3.3% dip in carbon emissions coupled with a 3.34% cost reduction really drove home the point: a carbon trading system, with its carrot-and-stick approach, can indeed slash emissions and make the whole operation more cost-effective.
In an IES, comprehensively considering the CCP and carbon trading can further limit the CO2 emissions of the system. Under this model, costs drop by 12.36%, emissions are cut by 33.37%, and the utilization rate of renewable energy is increased by 36.7%. This proves that the combination of the two can maximize the economy.
