Article

Optimization of Industrial Parks Considering the Joint Operation of CHP-CCS-P2G Under a Reward and Punishment Carbon Trading Mechanism

School of Electronic Information Engineering, Taiyuan University of Science and Technology, Taiyuan 030024, China
*
Author to whom correspondence should be addressed.
Energies 2025, 18(17), 4589; https://doi.org/10.3390/en18174589
Submission received: 10 June 2025 / Revised: 21 August 2025 / Accepted: 27 August 2025 / Published: 29 August 2025

Abstract

Aiming at the demands for low-carbon transformation in multi-energy-coupled industrial parks, a model is proposed that incorporates a carbon trading system incorporating incentives and penalties. This model includes joint combined heat and power (CHP) units, carbon capture technologies, and power-to-gas (P2G) conversion equipment. Firstly, we develop a modeling framework for the joint operation of cogeneration units to establish a comprehensive energy system within the industrial park that integrates electricity, heat, gas, and cold energy sources. Subsequently, we introduce a reward and punishment carbon trading mechanism into an industrial park to regulate carbon emissions effectively. With an optimization objective focused on minimizing the overall operating costs of the system while considering relevant constraints, we formulate an optimization model. The Gurobi solver is employed through the Yalmip toolkit to address this optimization problem. Finally, four operational scenarios are established to compare and validate the feasibility of our proposed optimization strategy. The results from our computational example demonstrate that integrating combined heat and power along with carbon capture and P2G technologies—coupled with a tiered reward and punishment carbon trading mechanism—can significantly enhance the energy consumption structure of the system. Under this model, the overall expenses are decreased by 12.36%, CO2 emissions decrease by 33.37%, and renewable energy utilization increases by 36.7%. This approach has effectively improved both wind power consumption capacity and low-carbon economic benefits within the system while ensuring sustainable economic development in alignment with “dual carbon” goals.

1. Introduction

With the growth of energy demands and the intensification of environmental pressures, the problems of CO2 emissions and the abandonment of wind and solar energy in some areas have become increasingly severe. It is urgent to improve energy utilization efficiency [1,2]. An integrated energy system (IES), which has advantages such as multi-energy coupling and energy cascade utilization, can effectively reduce greenhouse gas emissions and improve energy efficiency through the coordinated planning of multiple energy sources [3], contributing to China’s carbon reduction efforts under the dual carbon goals [4,5].
In low-carbon development, the IES with emission reduction potential has become a research focal point in the global arena. It enables bidirectional energy flow between the power grid and gas grid through P2G technology and MT, and allows for the coupling of different energy sources [6]. Shi et al. [7] proposed a flexible response model under a stepped carbon trading mechanism, using traditional CHP units and electric boilers to achieve optimization, but the consideration of wind and solar energy consumption was insufficient. Luo Zhao et al. [8] put forward a dual optimization model, while considering the collection and utilization of carbon dioxide, ultimately striving to reduce the operational expenses of the IES in order to realize cost-effective operation of the park’s integrated energy system, but there were deficiencies in model construction. Jiao et al. [9] constructed a model coupling P2G and wind power plants, which significantly improved the utilization rate of wind power, but the consideration of the system carbon emissions was not comprehensive, which was not conducive to the coordination of the system’s low-carbon and economic performance. Chen et al. [10] proposed a model coupling wind power and hydrogen energy, which did not need to purchase hydrogen from outside, achieving a certain degree of energy self-sufficiency in the park. Liu Xiaojun et al. [11] proposed the implementation of a green certification trading system within the IES, achieving the consumption of renewable energy and reducing system carbon emissions, but the demand-side load was relatively single, which could not fully utilize the flexibility of the model. Rutian W. et al. [12] proposed an IES considering carbon capture technology and evaluated greenhouse gas emissions through life cycle assessment, using carbon emission coefficients and stepped carbon trading mechanisms with rewards and penalties to calculate carbon trading costs. Although this method significantly reduced carbon emissions, it led to an increase in system costs. Yiming M. et al. [13] used carbon capture and storage (CCS) technology to capture CO2 emissions from CHP systems and direct them into power-to-gas (P2G) processes, thereby eliminating the need for extensive transportation and storage infrastructure and reducing CO2 emissions after CHP combustion of gas. Liu Sixian et al. [14] introduced carbon capture and P2G into an IES, achieving carbon neutrality while improving system economic performance, but did not consider system operation costs. Li Jiangnan et al. [15] proposed a multi-energy complementary model, adding system emission reduction to carbon trading to achieve low-carbon goals and selling the generated hydrogen to improve economic performance, but the proposed coupling model was relatively simple and did not accurately describe the actual operation state of the model. Liu Xia et al. [16] produced hydrogen through renewable energy in an IES and stored it using hydrogen storage equipment, combining management schemes with renewable energy to achieve carbon reduction. Li W. et al. [17] considered a new model for recovering waste heat and achieved certain results in carbon reduction through a stepped subsidy incentive mechanism. Yang Xiaohui et al. [18] integrated the green certificate system with the carbon trading framework and introduced it into a regional IES, significantly increasing the utilization rate of renewable energy sources. Wu X. et al. [19] proposed a capacity optimization method for energy storage microgrids considering electro-hydrogen coupling to realize the configuration in a comprehensive economy and power supply reliability analysis. Yang J.W. et al. [20] found that the combined operation of CCS and P2G could reduce the waste of abandoned wind power and significantly lower carbon emissions. As a market-based policy tool for carbon reduction, the carbon trading mechanism is important in the operation of an integrated energy system. It prices carbon emissions to prompt energy producers to reduce emissions or purchase carbon quotas in order to achieve emission reduction targets. Zhao et al. [21] investigated the effects of incorporating the conventional carbon trading mechanism into the dispatching framework of an integrated electricity and natural gas energy system. Their study demonstrated that the implementation of a carbon trading system significantly impacts both the economic performance and carbon emission levels of the energy system. Yan et al. [22] proposed an IES multi-agent low-carbon trading model, enabling each stakeholder to achieve a balance of interests in a carbon-constrained environment and reducing carbon emissions during the interaction process. Although existing studies have explored the impact of various factors, such as electricity-to-gas conversion, carbon trading mechanisms, and carbon capture and storage on an IES, they often fall short in providing comprehensive discussions regarding the multi-level utilization and distribution of hydrogen production derived from electricity, combined heat and power systems, two-stage P2G processes, and carbon capture technologies. To fully harness the potential of hydrogen energy in reducing carbon emissions while enhancing the overall benefits of an IES—alongside increasing new energy utilization rates and achieving collaborative coupling among multiple energy sources—this paper proposes an optimal scheduling model for industrial parks that integrates cogeneration with CCS alongside P2G (referred to as CCP).
In summary, in response to the current research deficiencies, we have considered more energy coupling in the model and carried out multi-energy coupling optimization, addressing the pain point of conflicts between individual interests and system goals in traditional optimization. Moreover, an improved CCP model has been proposed, and the low-carbon economic performance of this model has been verified through case simulation, thereby contributing to the realization of the “dual carbon” goals.

2. Materials and Methods

2.1. The IES Framework for Considering the Rewards and Penalties of Carbon in Industrial Parks

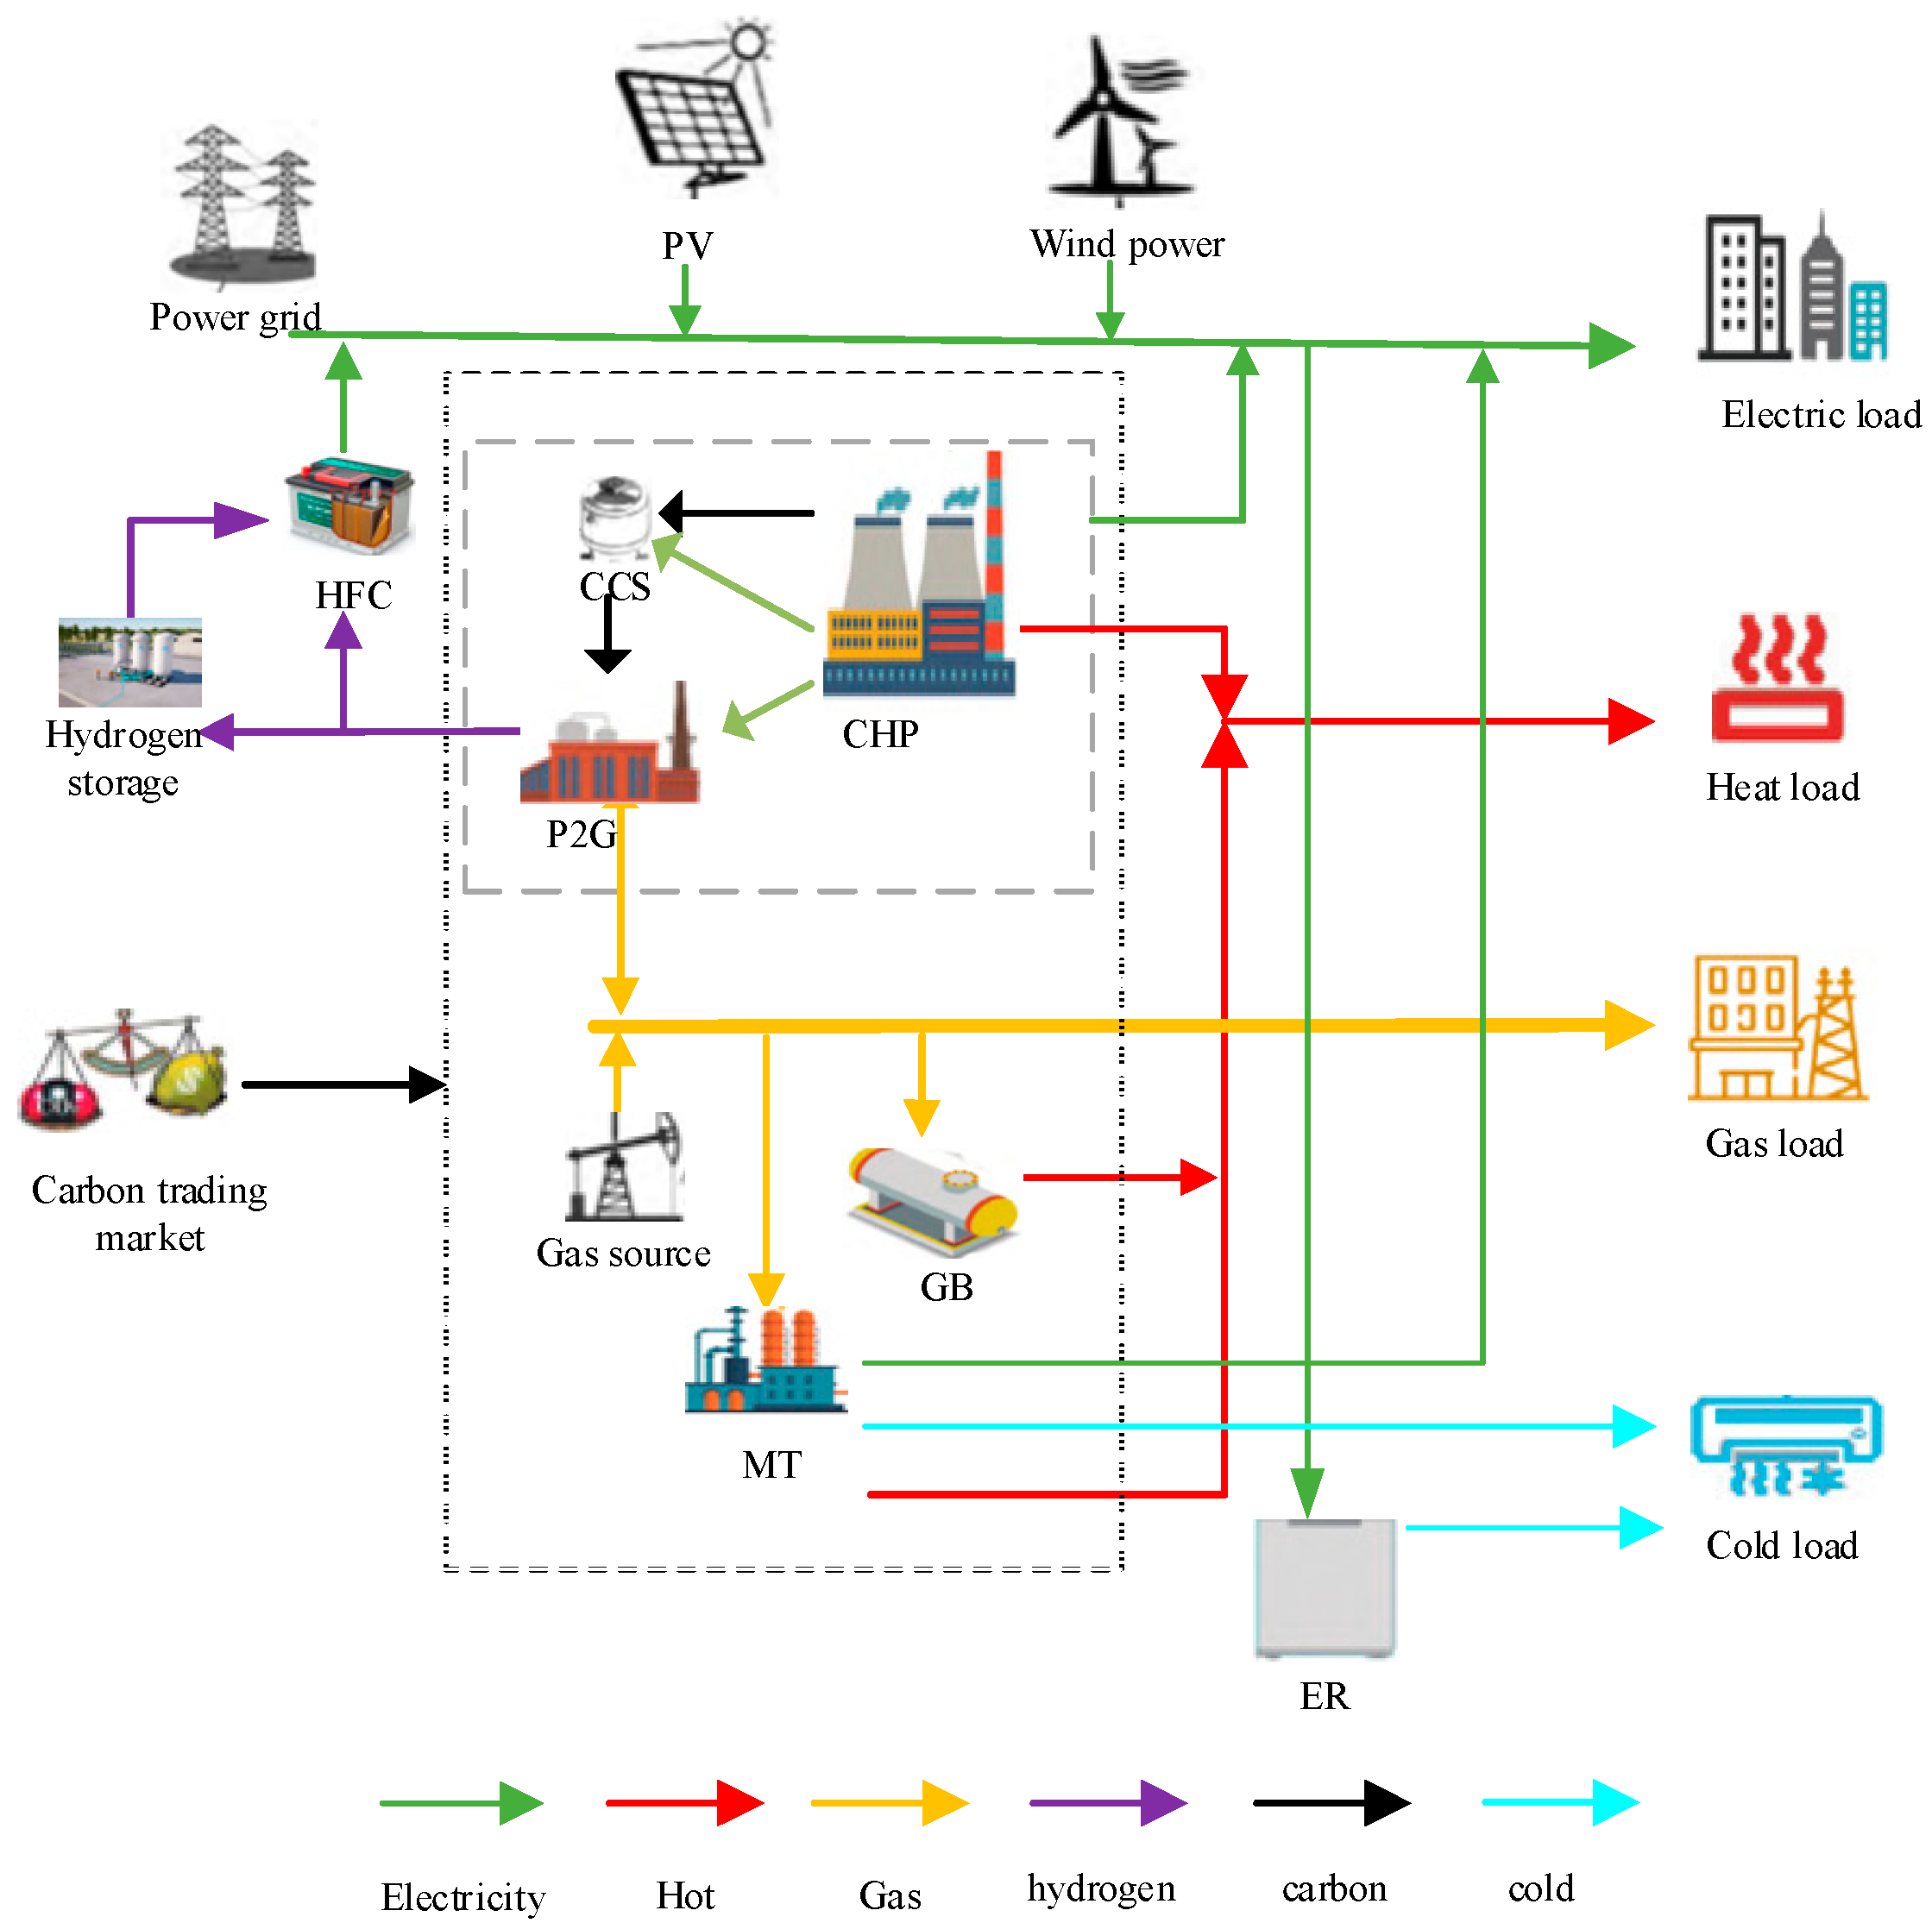
The IES industrial park is illustrated in Figure 1. The electricity generation component comprises photovoltaic (PV) modules, wind turbines, micro gas turbines (MT), and combined heat and power units. The energy conversion devices encompass power-to-gas systems, gas boilers, electric chillers, and hydrogen fuel cells. On the energy storage side, there is a hydrogen storage tank, while the demand side reflects the requirements for electrical, thermal, gas, and cooling loads. Among them, the gas required for gas boilers, micro gas turbines and other gas applications is provided by electricity-to-gas systems as well as external natural gas pipelines. Among them, the P2G equipment supplies the converted methane gas to the MT, GB and gas loads, and purchases methane through the external gas network when the weather demand is high.

2.2. CCP Coupling Model

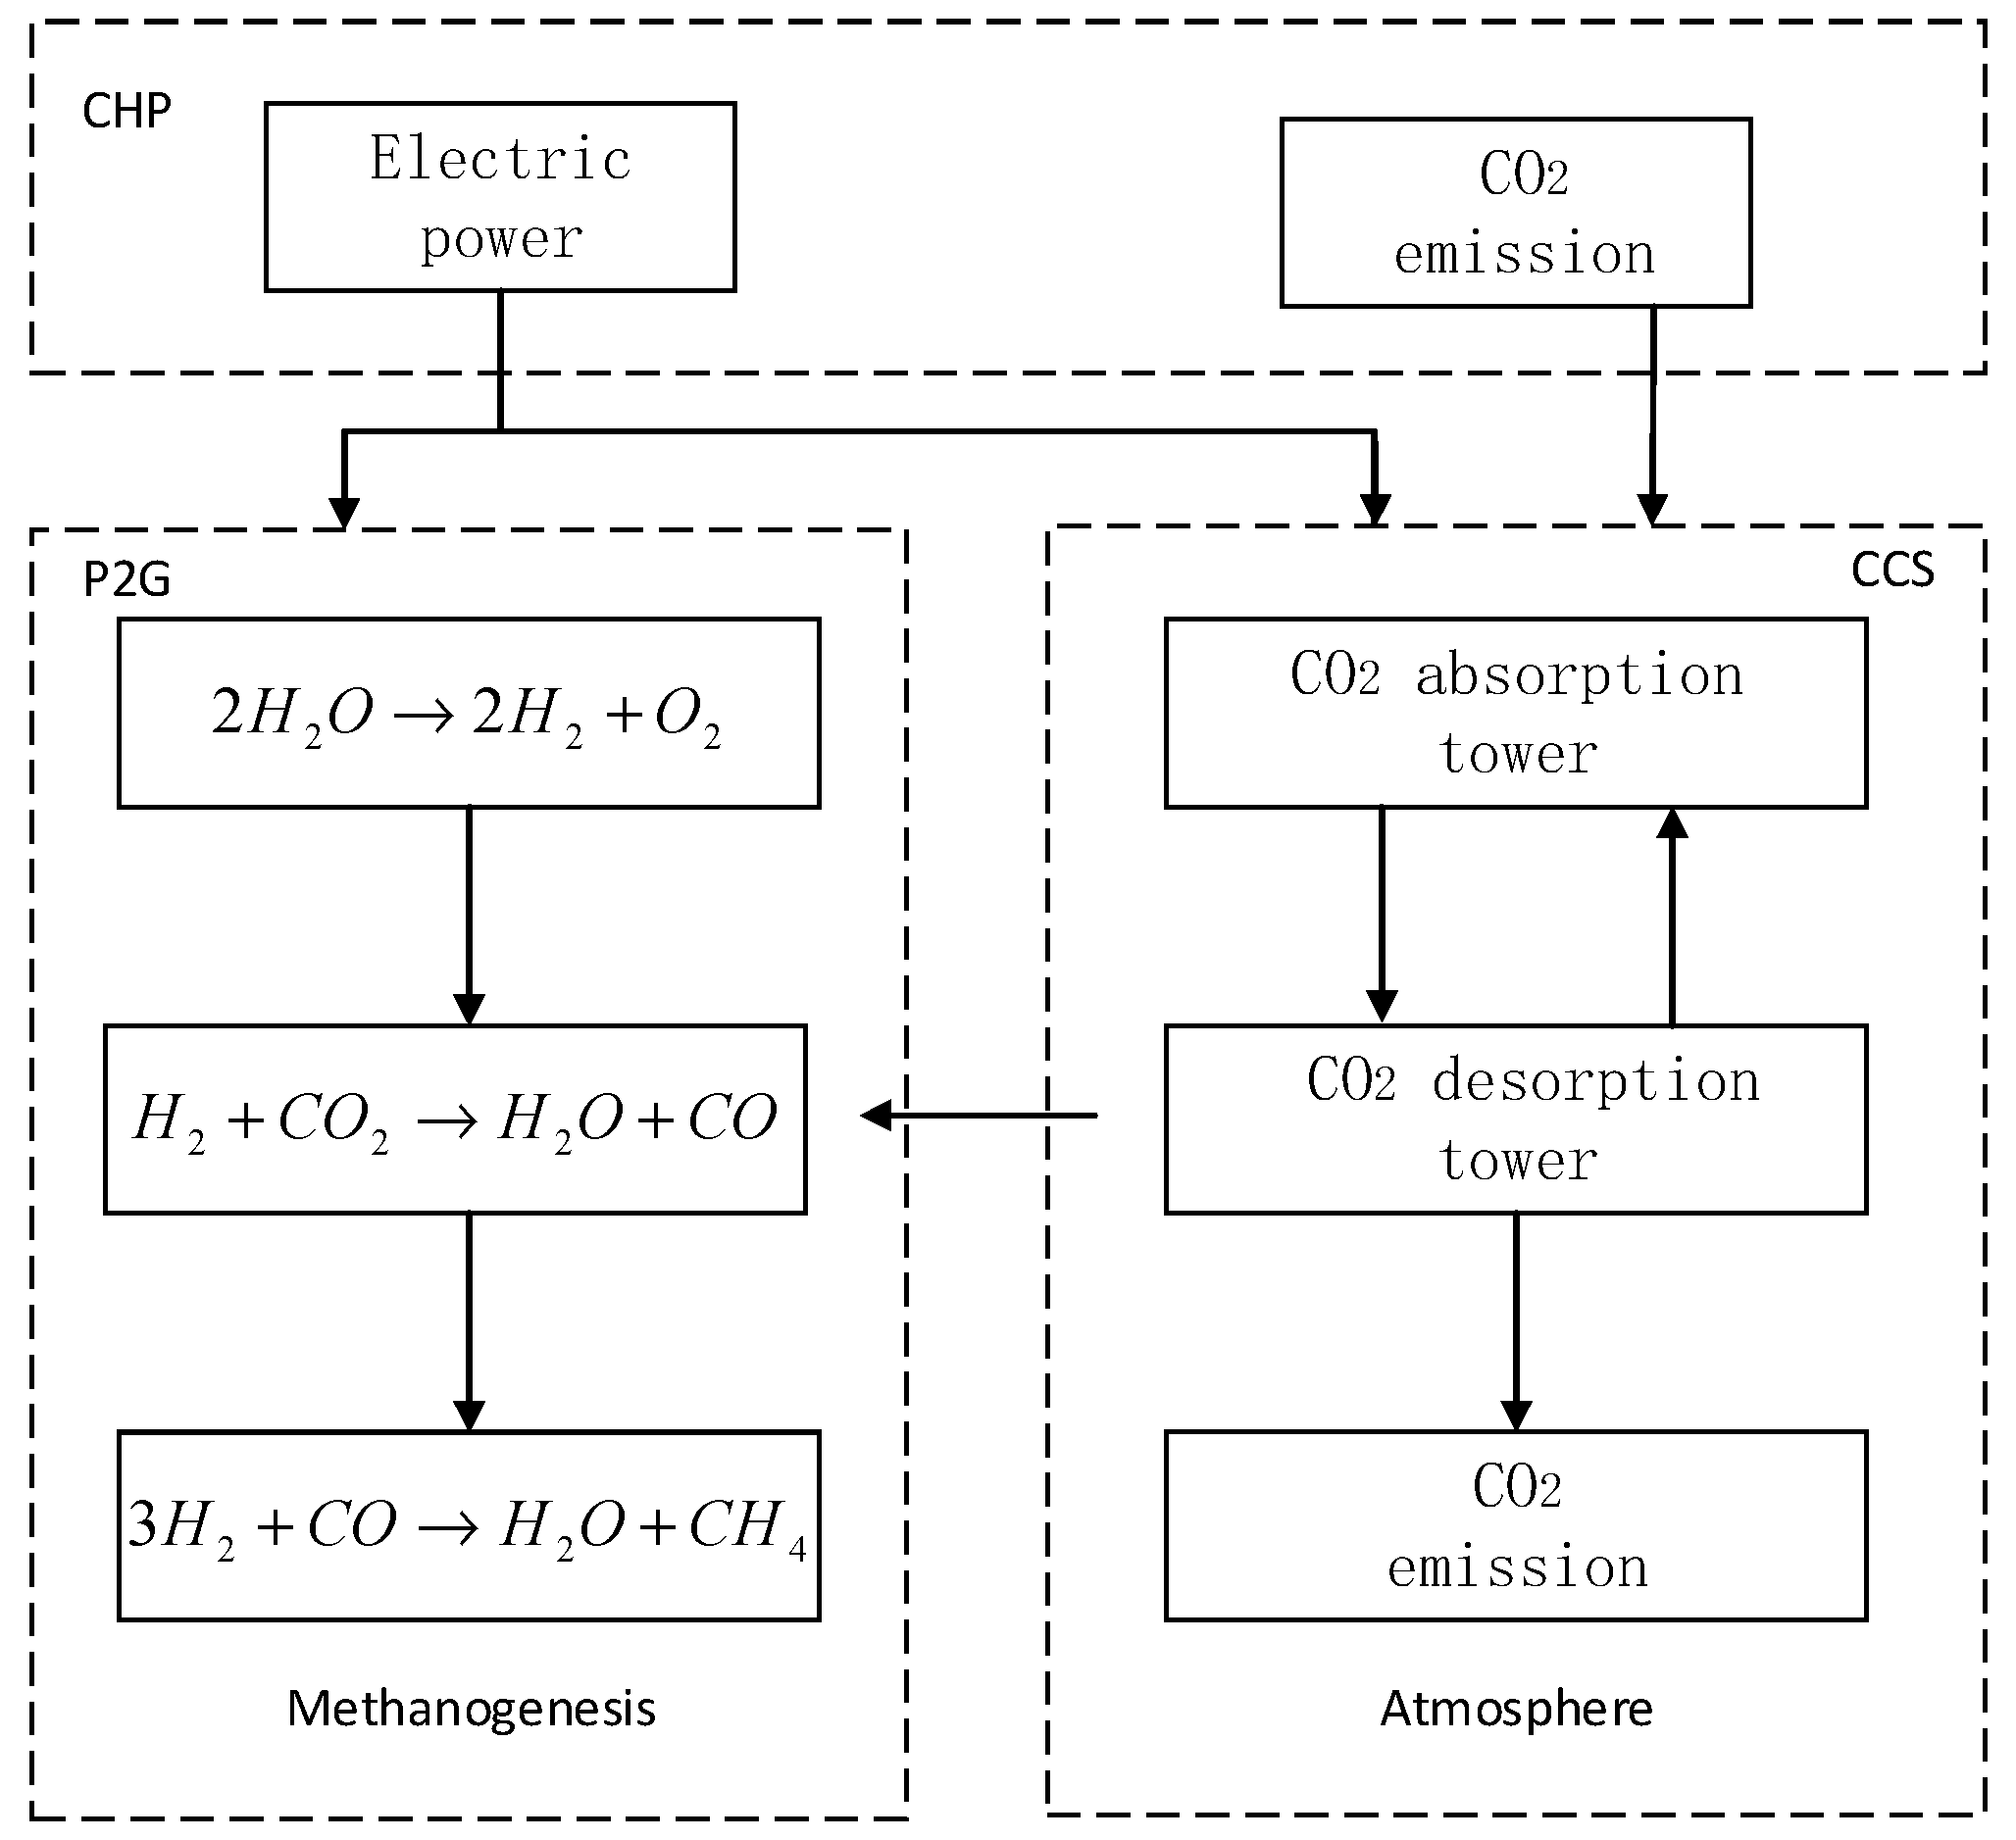
To enhance the economic efficiency and operational flexibility of IES scheduling within industrial parks, this paper proposes a CHP of P2G and CCS modes and constructs a CCP joint operation model. The operating mechanism of the CCP is shown in Figure 2.
Under the CCP operation mode, CCS can capture the CO2 produced by the CHP unit, thereby reducing the CO2 emissions of the CHP unit. The CHP unit is integrated with P2G and CCS technologies. The P2G process can, in theory, be broken down into two distinct phases, namely the hydrogen production stage through water electrolysis and the hydrogen-to-methane conversion stage. In the first stage, the CHP unit supplies energy to the P2G to electrolyze water and obtain hydrogen. Part of the generated hydrogen is supplied to the hydrogen–oxygen fuel cell and the hydrogen storage tank, while the other part enters the second stage of methanation. In this stage, H2 and CO2 react to convert into CH4, which is easier to store and utilize, reducing the gas purchase cost of the system and lowering the electric coupling properties of cogeneration units.

2.3. CCS and P2G Models in CCP Mode

In CCP mode,
P chp , t = P chp 1 , t + P chp 2 , t + P chp 3 , t
Within the equation, P chp 1 , t represents the electrical power supplied by CHP to the power grid, in MW; P chp 2 , t represents the electrical power consumed by P2G, in MW; and P chp 3 , t represents the electrical power used by CCS, in MW.
This paper captures and stores the CO2 generated during the operation of CHP. CCS consumes electrical energy to integrate CO2 into the absorption tower. Then, the rich liquid enters the desorption tower to release high-purity CO2, which is then transferred to P2G. The energy consumption of CCS is divided into fixed power consumption and operational power consumption. The operational power consumption is positively correlated with the amount of CO2 captured by CCS. The CCS model is shown in Equation (2).
P chp 3 , t = P b + P ccs , t P ccs , t = α c c s E c c s , t
Within the equation, P b represents the fixed energy consumption of CCS, in MW; P ccs , t represents the operating energy consumption, in MW; and E c c s , t represents the CO2 capture, t. α c c s represents the efficiency coefficient between the consumption of electrical energy and the capture of CO2, MW.
The P2G model is as follows:
P chp 2 , t = E ccs , t β P gas , t = α p 2 g P chp 2 , t P h 2 , t = α p 2 g P chp , t
In the formula, β is the calculation coefficient between the electrical energy consumed by P2G and the amount of CO2 required; P gas , t is the methane power generated by P2G, in MW; P h 2 , t represents the power of hydrogen production, in MW; and α p 2 g is the conversion efficiency coefficient.

2.4. Integration Features of CHP Combined with P2G and CCS

The limits of the power of CHP during normal operation are described in (4).
P chp , min P chp , t P chp , max
Substituting Equation (1) into Equation (4), the upper and lower limits of the new power of CHP, P chp 1 , t , are obtained as in Equation (5).
P chp , min P chp 2 , t P chp 3 , t P chp 1 , t P chp , max P chp 2 , t P chp 3 , t
The constraints for the upper and lower limits of the electric power in P2G are kindly provided by the following Equation (6).
P chp 2 , min P chp 2 , t P chp 2 , max
Among them, P chp 2 , min and P chp 2 , max represent the lower and upper bounds of the P2G system’s electrical power, respectively.
The electric power constraint of CCS is described in (7).
P chp 3 , min P chp 3 , t P chp 3 , max
From Equations (5)–(7), we obtain a range of P chp 1 , t , which is represented by Equation (8).
P chp 1 , min P chp 1 , t P chp 1 , max
In the formula, P chp 1 , max and P chp 1 , min , the values mentioned, are kindly referred to as the upper and lower limits of the electrical power for the new CHP system.
The thermal power constraint of the CHP unit is described in (9).
P chph , min P chph , t P chph , max
Among them, P chph , min and P chph , max are the min and max thermal powers of the CHP unit, respectively. Equation (10) represents the range of electric power for P chp 2 , t and P chp 3 , t :
P chp 2 , min + P chp 3 , min P chp 2 , t + P chp 3 , t P chp 2 , max + P chp 3 , max
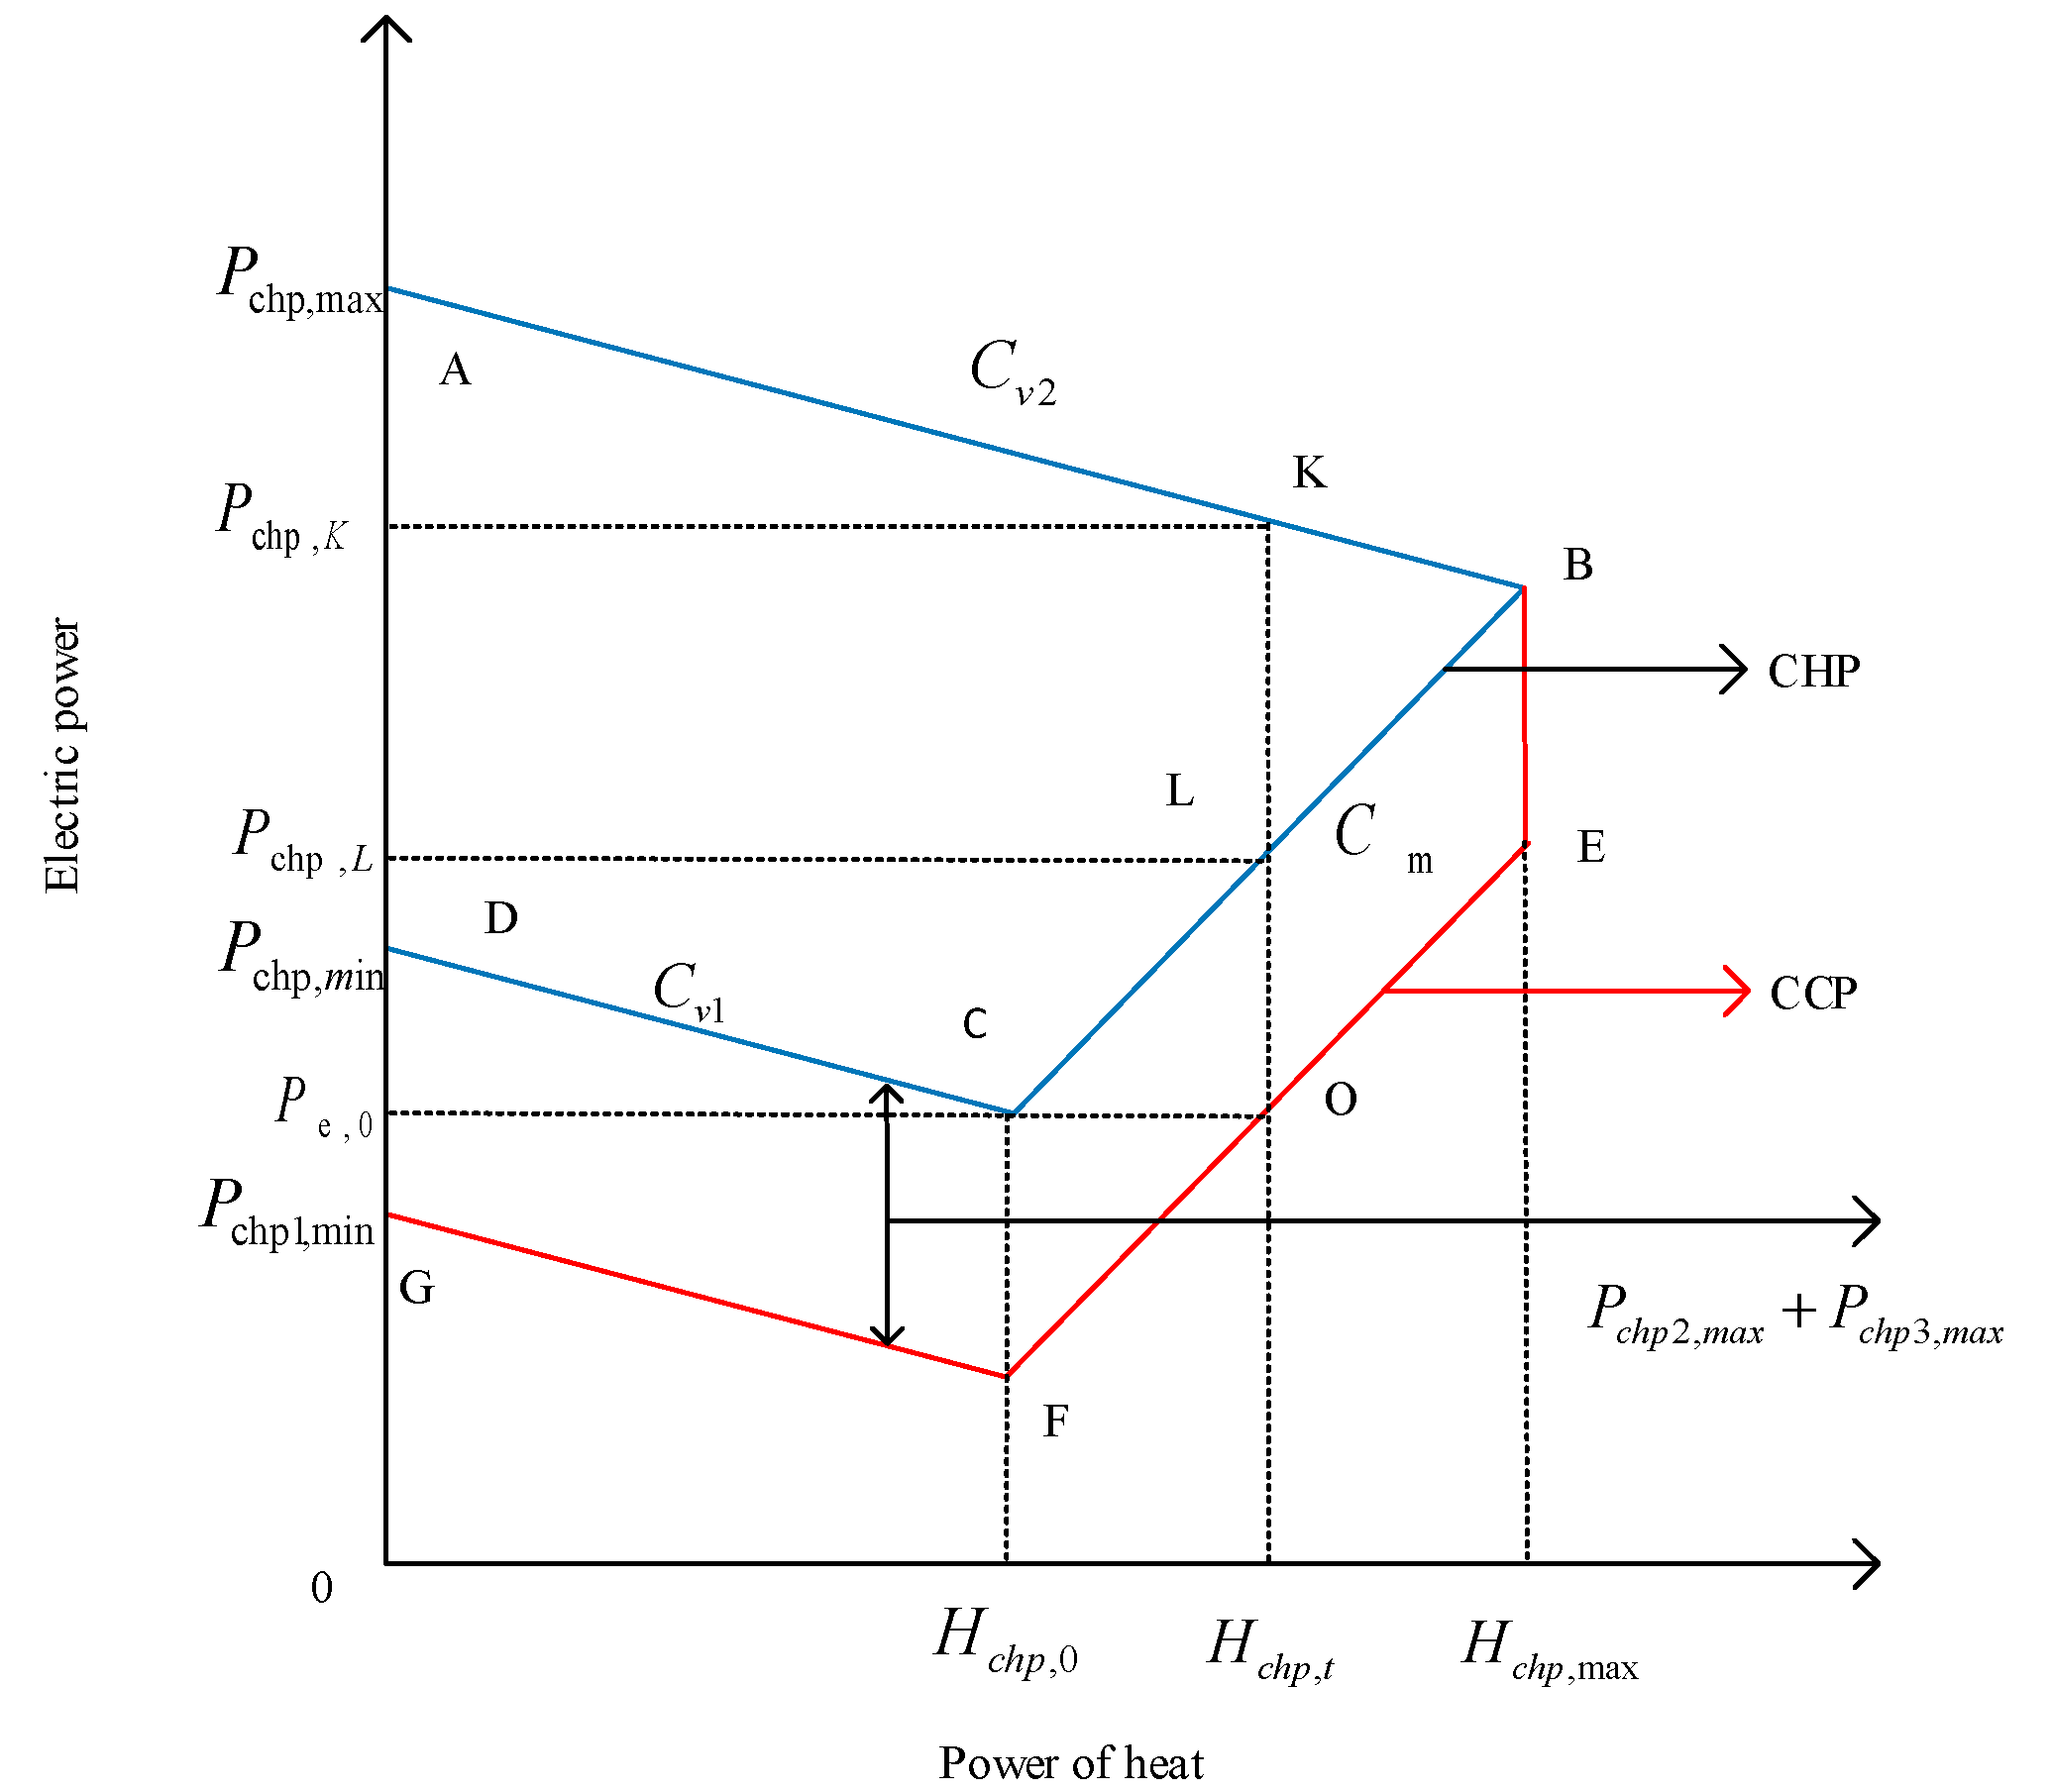
Combined with the characteristics of the unit, it can be known that the operating range of the conventional CHP is shown as the quadrilateral ABCD in Figure 3. According to the above formula, it can be known that the feasible range of the electricity–thermal power of the model under the CCP is shown as the polygon ABEFG in Figure 3. After introducing the P2G-CCS cooperative operation strategy, the lower limit of the electric power of the CHP system migrates from the original operation point D to point G, and its output range is expanded to ΔD-G. The power regulation margin has been significantly enhanced, thereby expanding the range. When the output of the CCP combined system is P h , t , the feasible operating trajectory of CHP extends from the original constrained line segment LK to OK, and the corresponding range of electric power regulation expands. This mechanism effectively solves the thermoelectric output constraint of CHP through the absorption of the electrolytic load of P2G and the regulation of the CCS by the CCS, reducing its electrothermal coupling coefficient.
The CO2 production of the CHP unit in CCP mode is as follows:
E chp , t = a 1 P chp , t + C v 2 H chp , t + b 1 P chp , t + C v 2 H chp , t 2 + c 1
In the formula, a 1 , b 1 , and c 1 are the CO2 coefficients of the CHP unit, ( Euro / MW ) .

2.5. Other Equipment Models in the Industrial Park

Hydrogen–oxygen fuel cell:
P hfc , t = η hfc P hfch 2 , t P hfch , t = η hfch P hfch 2 , t P hfc , min P hfch 2 , t P hfc , min
P hfc , t and P hfch , t are the output powers of the electrical and thermal energy of the HFC, respectively, in MW, and P hfch 2 , t is the input power of hydrogen energy, in MW. η hfc and η hfch are the conversion coefficients of electricity and heat energy; and P hfc , min is the lower limit of hydrogen input power and P hfc , max is the upper limit, in MW.
GB model:
H gb , t = H g , t η gb H gb , min H gb , t H gb , max
In the formula, H gb , t is the thermal power generated by the gas boiler, in MW; H g , t represents the gas consumption power of the boiler, in MW; η gb represents the efficiency of the gas boiler; and H gb , max and H gb , min are the limits of the thermal power of the GB, in MW.
Miniature gas turbine model:
P mt , t = η mt P m t s , t P m t h , t = η m t , h P m t s , t P m t c , t = η m t , c P m t s , t P mt , min P mt , t P mt , max P mt , down P mt , t P mt , t - 1 P mt , up
P m t s , t represents the gas consumption power of the MT, in MW; η mt , η m t , h , and η m t , c are the power conversion coefficients of electricity, heat, and cold, respectively, and P m t h , t represents the heat power of the MT, in MW. P m t c , t is the cooling power of the MT, in MW; and P mt , min is the minimum output power of the MT and P mt , max is the maximum output power, in MW. P mt , up and P mt , down illustrate the highest and lowest climbing speeds achieved by the MT, respectively, in MW.
Model of hydrogen storage tank:
0 P h 2 , t c h a P h 2 , t max 0 P h 2 , t d i s P h 2 , t max S h 2 , min S h 2 , t S h 2 , max P h 2 ( 1 ) = P h 2 ( T )
In the formula, P h 2 , t c h a and P h 2 , t d i s are the charge and discharge powers of the hydrogen storage tank, respectively, in MW; and S h 2 , max and S h 2 , min are the upper and lower limits of the hydrogen storage tank capacity, respectively.
Electric refrigeration machine:
P erc , t = ρ e P er , t P er , min P er , t P er , max
P er , t represents the power consumption of the electric chiller, in MW; ρ e is the conversion efficiency; and P er , max and P er , min are the limits of the power consumption of the electric chiller, in MW.

2.6. Carbon Emission Rights Quota Model

The CO2 emission sources in the IES mainly fall into three categories: CHP, GB, and gas turbines. The carbon emissions quota is defined as follows:
E i e s 1 = Z P c h p , t + H c h p , t + P m t h , t + P g b , t
In the formula, the components of Z are the unit carbon emission quotas, respectively.

2.7. Real Emission Model

The industrial park actual carbon emissions should exclude the CO2 captured by CCS. The calculation formula is as follows:
E i e s 2 = E total 1 + E m t 2 E c c s P t o t a l , t = P c h p , t + H c h p , t + P m t h , t + H g b , t E total 1 = a 1 + b 1 P t o t a l , t + c 1 P t o t a l , t 2 E m t 2 = d 1 P m t , t
In the formula, E i e s 2 denotes the actual carbon emissions of the IES; E total 1 indicates the total actual carbon emissions from CHP and GB, measured in tons; P t o t a l , t refers to the equivalent output power of CHP and GB during period t, expressed in megawatts; and d 1 includes the parameters used for the calculations.

2.8. An Incremental Carbon Trading Model Based on Incentives and Sanctions

The transaction volume of carbon emission rights is as follows:
E s t = E i e s 2 t E i e s 1 t
To further mitigate carbon emissions, the carbon trading model meticulously computes the cost of carbon trading by delineating the spectrum of carbon emissions. The associated costs for engaging in carbon trading are as follows:
C c o 2 = c 2 + 3 ω h + c 1 + 3 ω E s t + 2 h , E s t 2 h c 1 + ω h + c 1 + 2 ω E s t + h , 2 h E s t h c 1 + ω E s t , h E s t 0 c E s t , 0 E s t h c h + c 1 + σ E s t h , h E s t 2 h c 2 + σ h + c 1 + 2 σ E s t 2 h , 2 h E s t
In the formula, c represents the carbon trading price of the day, h is the length of carbon interval, and σ and ω , respectively, represent the penalty coefficient and the reward coefficient.

2.9. Constraint Conditions

Constraints on the output of wind and photovoltaic energy:
0 P w i n d , t P w i n d , max 0 P p v , t P p v , max
In the formula, P w i n d , max and P p v , max represent the maximum power transmission of wind power and photovoltaic power, respectively, in MW.
Electric power constraints of P2G and CCS:
See Equations (6) and (7).
Gas Turbine Constraints:
See Equation (14).
Carbon capture constraints of CCS:
0 E c c s , t E c h p , t
Electric power balance:
P e b u y , t + P p v , t + P w i n d , t + P m t , t + P h f c , t + P c h p 1 , t = P e l o a d , t + P e r , t
In the formula, P e l o a d , t represents the electrical load of the system at time t.
Thermal power balance:
P c h p h , t + P g b , t + P m t h , t + P hfch , t = P h l o a d , t
In the formula, P h l o a d , t represents the heat load of the system at time t.
Gas power balance:
P g a s , t + P g b u y , t = P g l o a d , t + H g , t + P m t s , t
Within the equation, P g b u y , t denotes the volume of gas procured by the system at a given moment t; and P g l o a d , t signifies the gas demand imposed upon the system at that same instant t.
Hydrogen power balance:
P h 2 , t + P h 2 , t d i s = P h f c h 2 , t + P g a s , t + P h 2 , t c h a
Cold power constraints:
Considering cold inertia, cold loss, and cold delay, the cold work constraints are as follows:
C e , min P c l o a d , t P e r c , t + P m t c , t C e , max P c l o a d , t
In the formula, C e , max and C e , min represent the limits of the cold network ratio, and P c l o a d , t is the cooling load of the system at time t, in MW.

2.10. Objective Function of the Comprehensive Energy Optimization Dispatching Model in the Park

The industrial IES optimization operation model under the carbon trading mechanism aims to achieve the optimal operation cost of the system on the premise of meeting the operation constraints of the system. The objective function is to minimize the sum of the energy purchase cost C b u y , carbon trading cost C c o 2 , wind power curtailment cost C w , solar power curtailment cost C p , and operation and maintenance cost C o p , in EUR.
F = min C b u y + C c o 2 + C o p + C w + C p
Energy purchase cost:
When the generated power capacity is insufficient to satisfy the local demand, electricity is purchased from the higher-level power grid. Accordingly, the cost associated with purchasing energy can be expressed as follows:
C b u y = t = 1 T P e b u y , t κ 1 + P g b u y , t κ 2
In the formula, T represents one running cycle; P e b u y , t represents the quantity of electricity procured at time t; and κ 1 and κ 2 denote the electricity price and gas price at that same moment, respectively.
Carbon trading cost:
See Equation (20).
Operation and maintenance cost:
C o p = C c h p + C p 2 g + C c c s + C g b + C e r
C c h p = t = 1 T a 2 P c h p , t + C v 1 H c h p , t + b 2 P c h p , t + C v 1 H c h p , t 2 + c 2 P c h p 2 , t + e 1 P c h p 3 , t + g
C p 2 g = t = 1 T c 2 P c h p 2 , t + d 2 E c c s , t
C c c s = t = 1 T e 1 P c h p 3 , t + f 1 E c c s , t
C g b = t = 1 T h 1 H g b , t
C e r = t = 1 T h 2 P e r , t
In the formula, a 2 , b 2 , and g are the operating cost coefficients of CHP, respectively; c 2 and d 2 are, respectively, the operating cost coefficient of P2G and the cost coefficient of CO2 consumption; and e 1 and f 1 are the operating coefficient of CCS and the CO2 storage cost coefficient, respectively. h 1 is the boiler cost coefficient and h 2 is the electric chiller cost coefficient.
Abandoning wind and light costs:
C w = t = 1 T α w P w , t P w i n d , t
C p = t = 1 T α p P p , t P p v , t
In the formula, α w is the wind abandonment penalty coefficient; α p is the light abandonment penalty coefficient; P w , t represents the predicted output of wind power at time t, in MW; and P p , t represents the predicted output of photovoltaic power at time t, in MW.

2.11. Model Solution

This paper built the industrial park of the IES with a nonlinear model. Using the subsection linearization method, this is transformed into a mixed integer linear model. The method is obtained by calling the Gurobi solver using the Yalmip toolkit in the MATLAB R2021a software to conduct optimization.

2.12. Parameter and Scene Settings

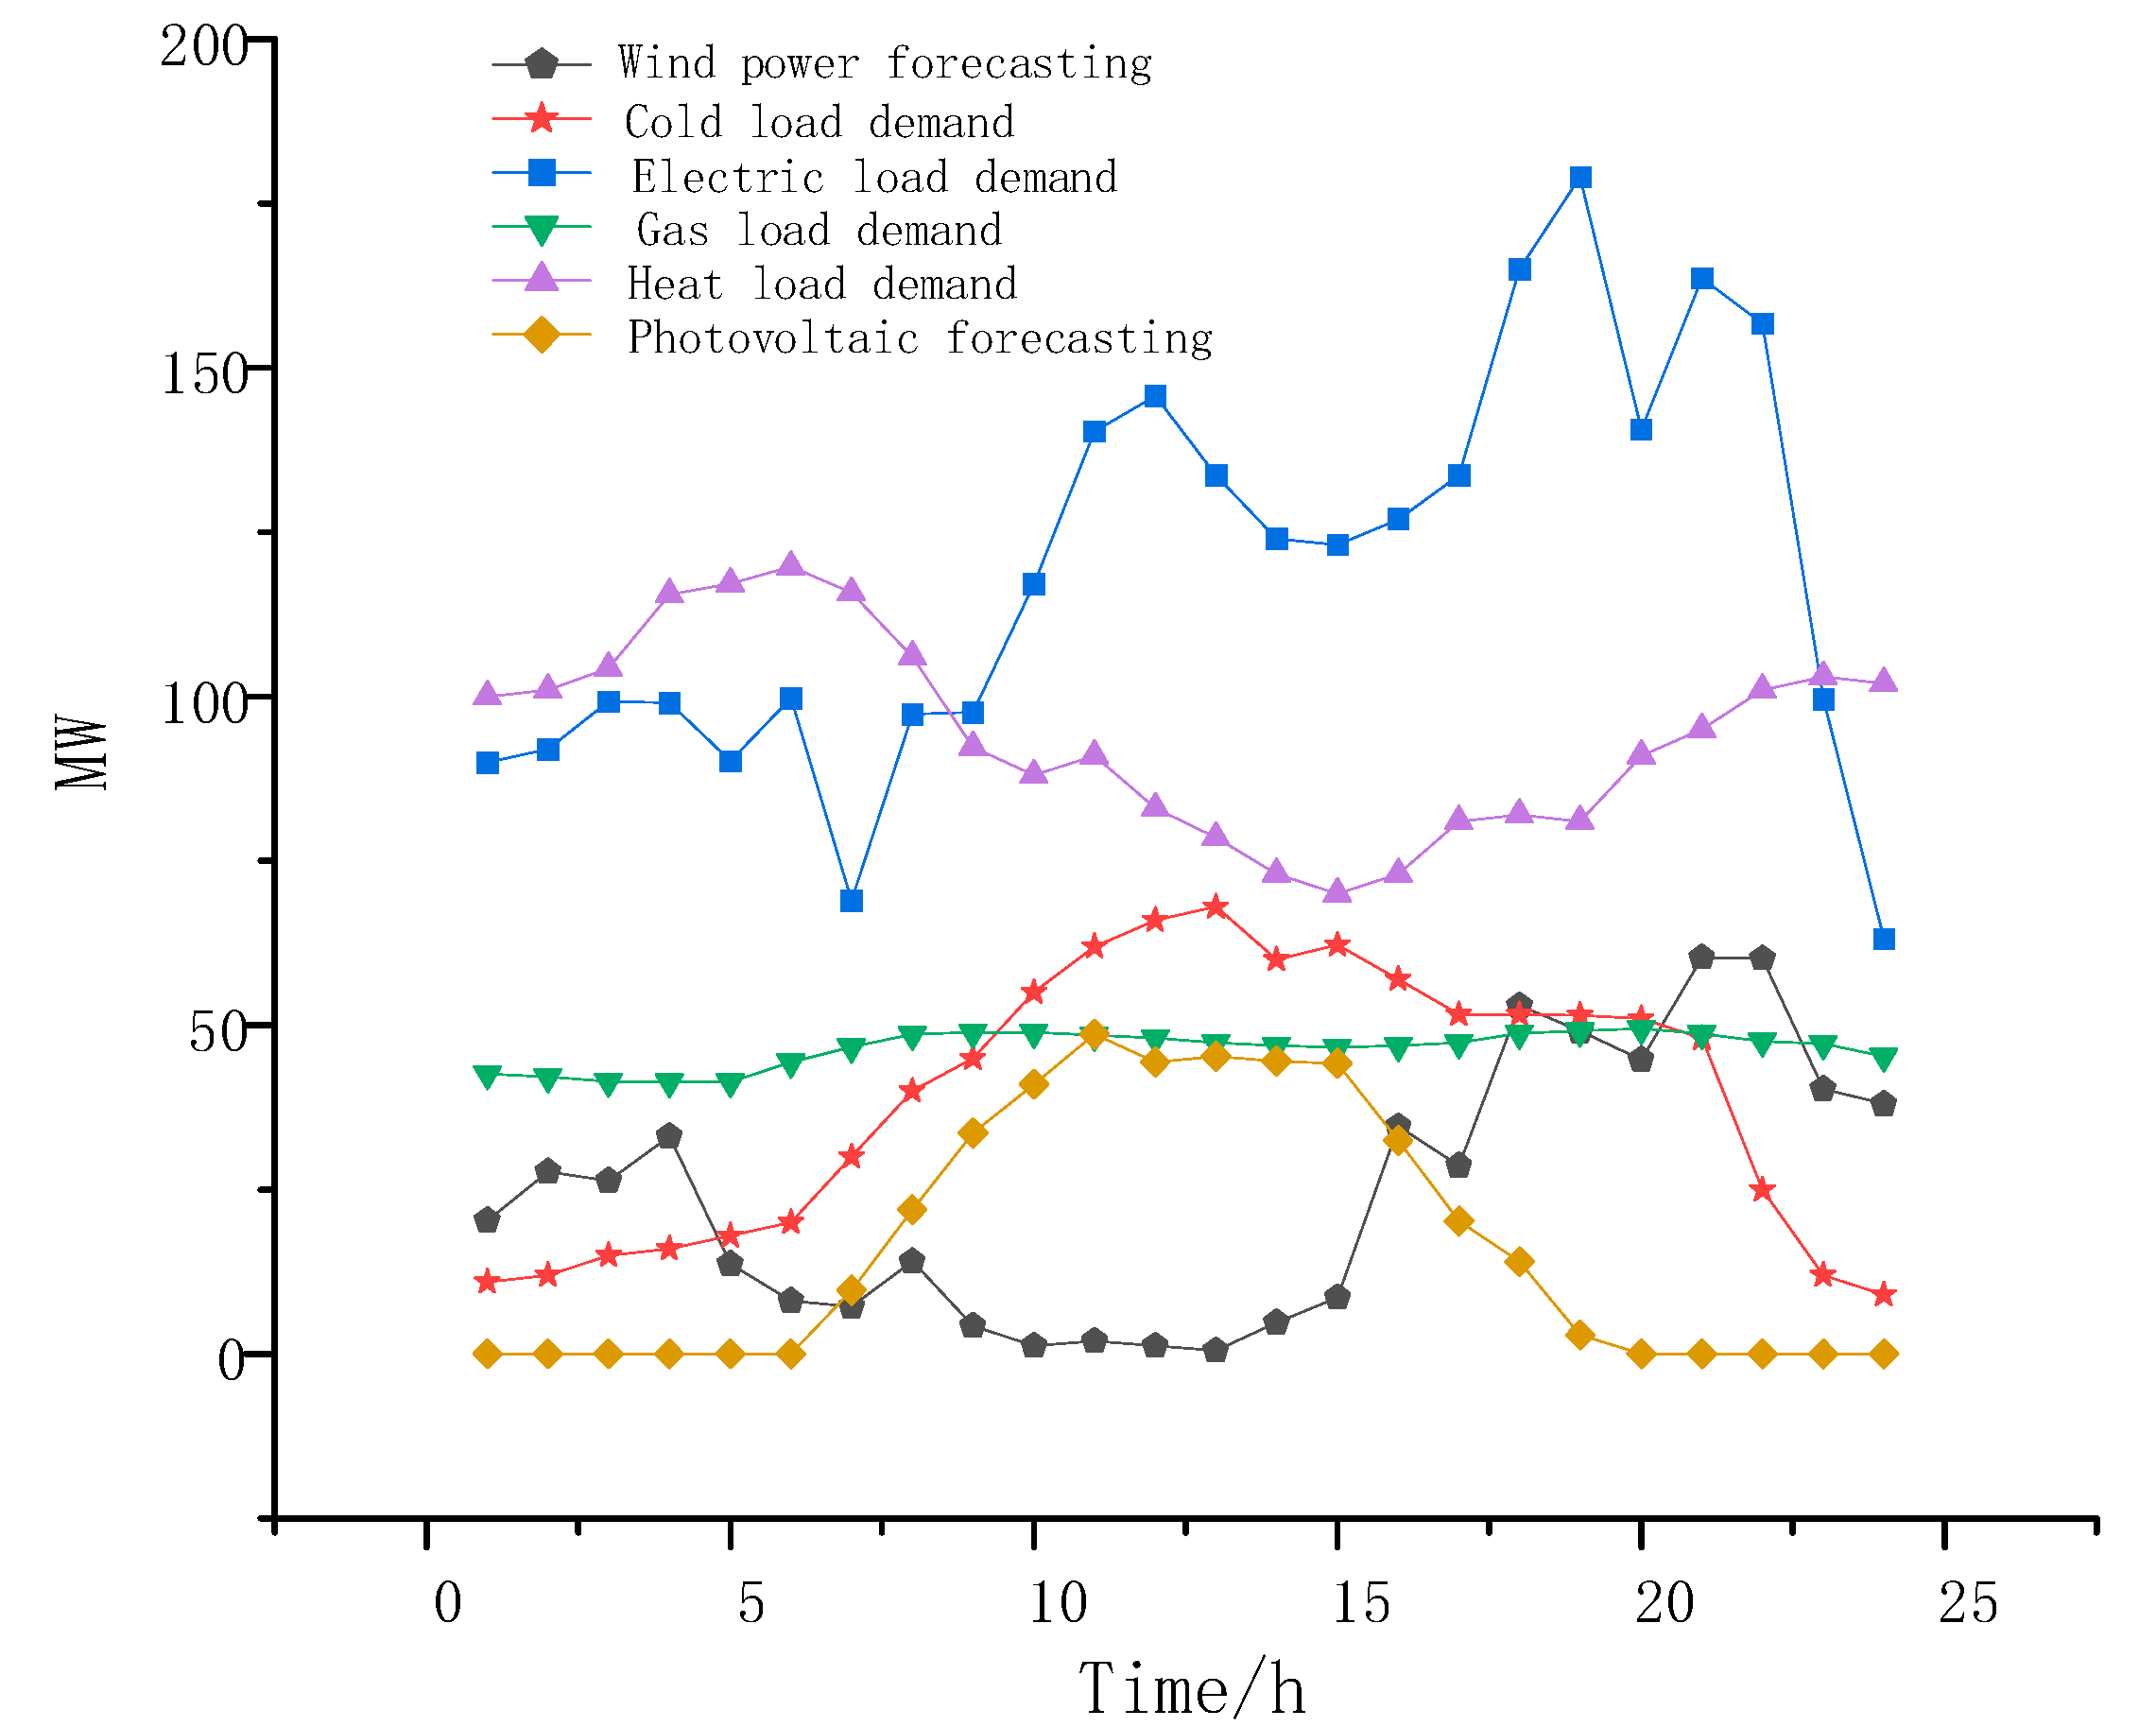
To verify the effect of the reward and punishment stepped carbon trading mechanism and the CCP joint operation model proposed on the economy and carbon emission reduction of industrial parks, the verification is conducted for one scheduling cycle. The load forecast output of the system is shown in Figure 4. The parameters of the CHP unit are shown in Table 1, the pricing details for electricity are presented in Table 2, the natural gas price is taken as 0.042 Euros / ( kw × h ) , and other parameters are presented in Appendix A.
This study establishes four distinct scenarios for comparative analysis, as presented in Table 3. Scenario 1 excludes the integrated operation of carbon trading schemes and the CCP. Building upon Scenario 1, Scenario 2 introduces a carbon trading mechanism that incorporates both incentives and penalties. Scenario 3 introduces CCS and P2G on the basis of Scenario 1, that is, it considers the joint operation of CCP units. Scenario 4 is the optimization strategy considered in this paper.

3. Results

3.1. Scheduling Results of Each Scenario

The dispatch results for different scenarios are shown in Table 4. Compared with Scenario 1, the curtailment rate of wind and solar power in Scenario 2 decreased by 3.37%, carbon emissions reduced by 3.3%, and the total cost decreased by 3.34%. This is mainly due to the introduction of a reward and punishment carbon trading mechanism in the industrial park, which increased carbon revenue. Compared with Scenario 1, Scenario 3 saw a 13.7% reduction in energy purchase cost, a 4.2% increase in operation and maintenance cost, and a 2.74% decrease in total cost. This is because the introduction of CCS and P2G equipment led to an increase in equipment operation and maintenance costs. When the CCP operates in conjunction, it generates methane to provide energy for the system, which can reduce energy purchase costs. The curtailment costs of wind and solar power decreased by 34.87%, and carbon emissions decreased by 10.3%. This indicates that the CCP not only promotes the output of wind and solar power but also avoids the system’s purchase of carbon sources from outside and suppresses the system’s carbon emissions. Compared with Scenario 1, Scenario 4, which considers the CCP and carbon trading, saw a 12.36% decrease in total cost, a 33.37% reduction in carbon emissions, and a 36.7% increase in the utilization rate of renewable energy. Compared with Scenario 2, which only considers the reward and punishment carbon trading mechanism, and Scenario 3, which only considers the joint operation of the CCP, Scenario 4 saw significant decreases in energy purchase cost, operation and maintenance costs, and carbon emissions, as well as an increase in carbon trading revenue and the utilization rate of renewable energy. Additionally, the total cost of Scenario 4 is better than that of other scenarios. Considering a disciplinary step-by-step carbon trading mechanism combined with a CCP model industrial park, this not only can reduce the carbon emissions of the system, but can reduce the wind and solar abandoned electricity.

3.2. The Impact of Reward Coefficients on Carbon Trading

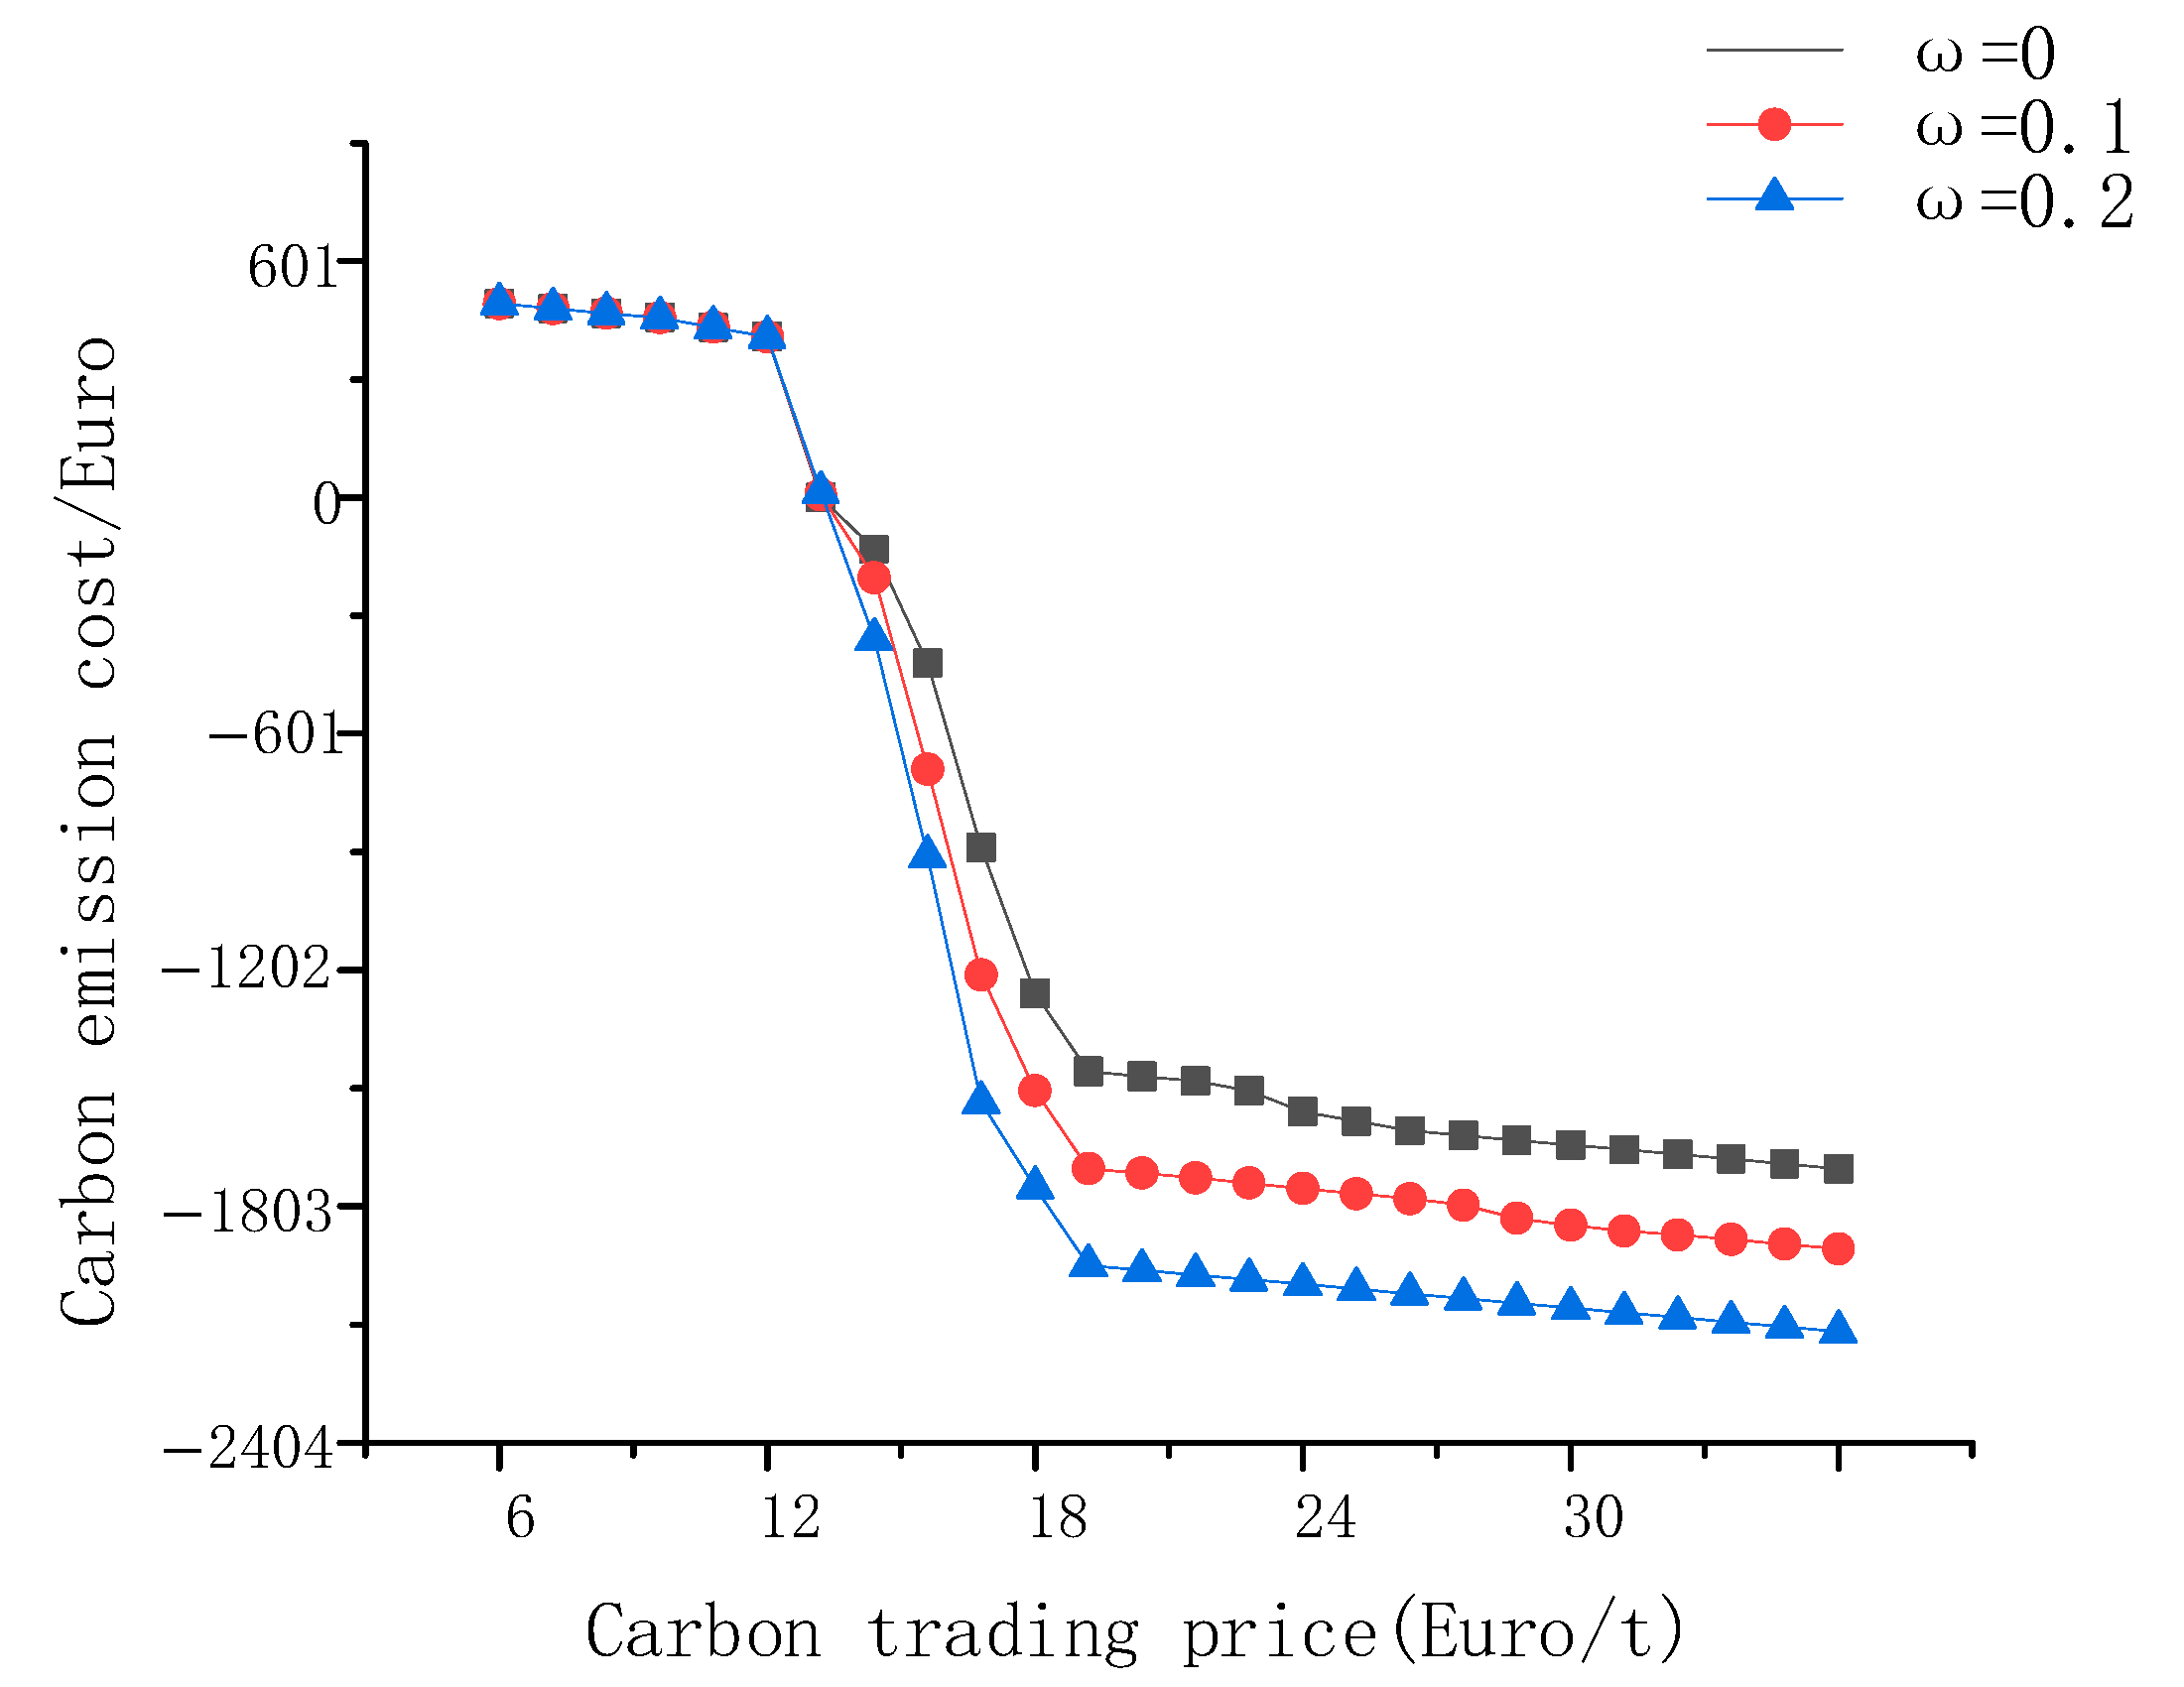
The article introduces a reward coefficient, rewarding while constraining the carbon emissions of the park. The influence of different incentive coefficients on the carbon emission cost is shown in Figure 5:
Figure 5 illustrates the activation of the reward system upon a negative carbon trading cost, coinciding with actual emissions beneath the allocated free quota. The reward coefficient is proportional to the carbon trading income. Due to the constraints of carbon emissions, when the carbon traded at EUR 19.75 a ton, the carbon trading costs under each coefficient show a stable trend.

3.3. Scenario 4 Output Analysis of the Unit

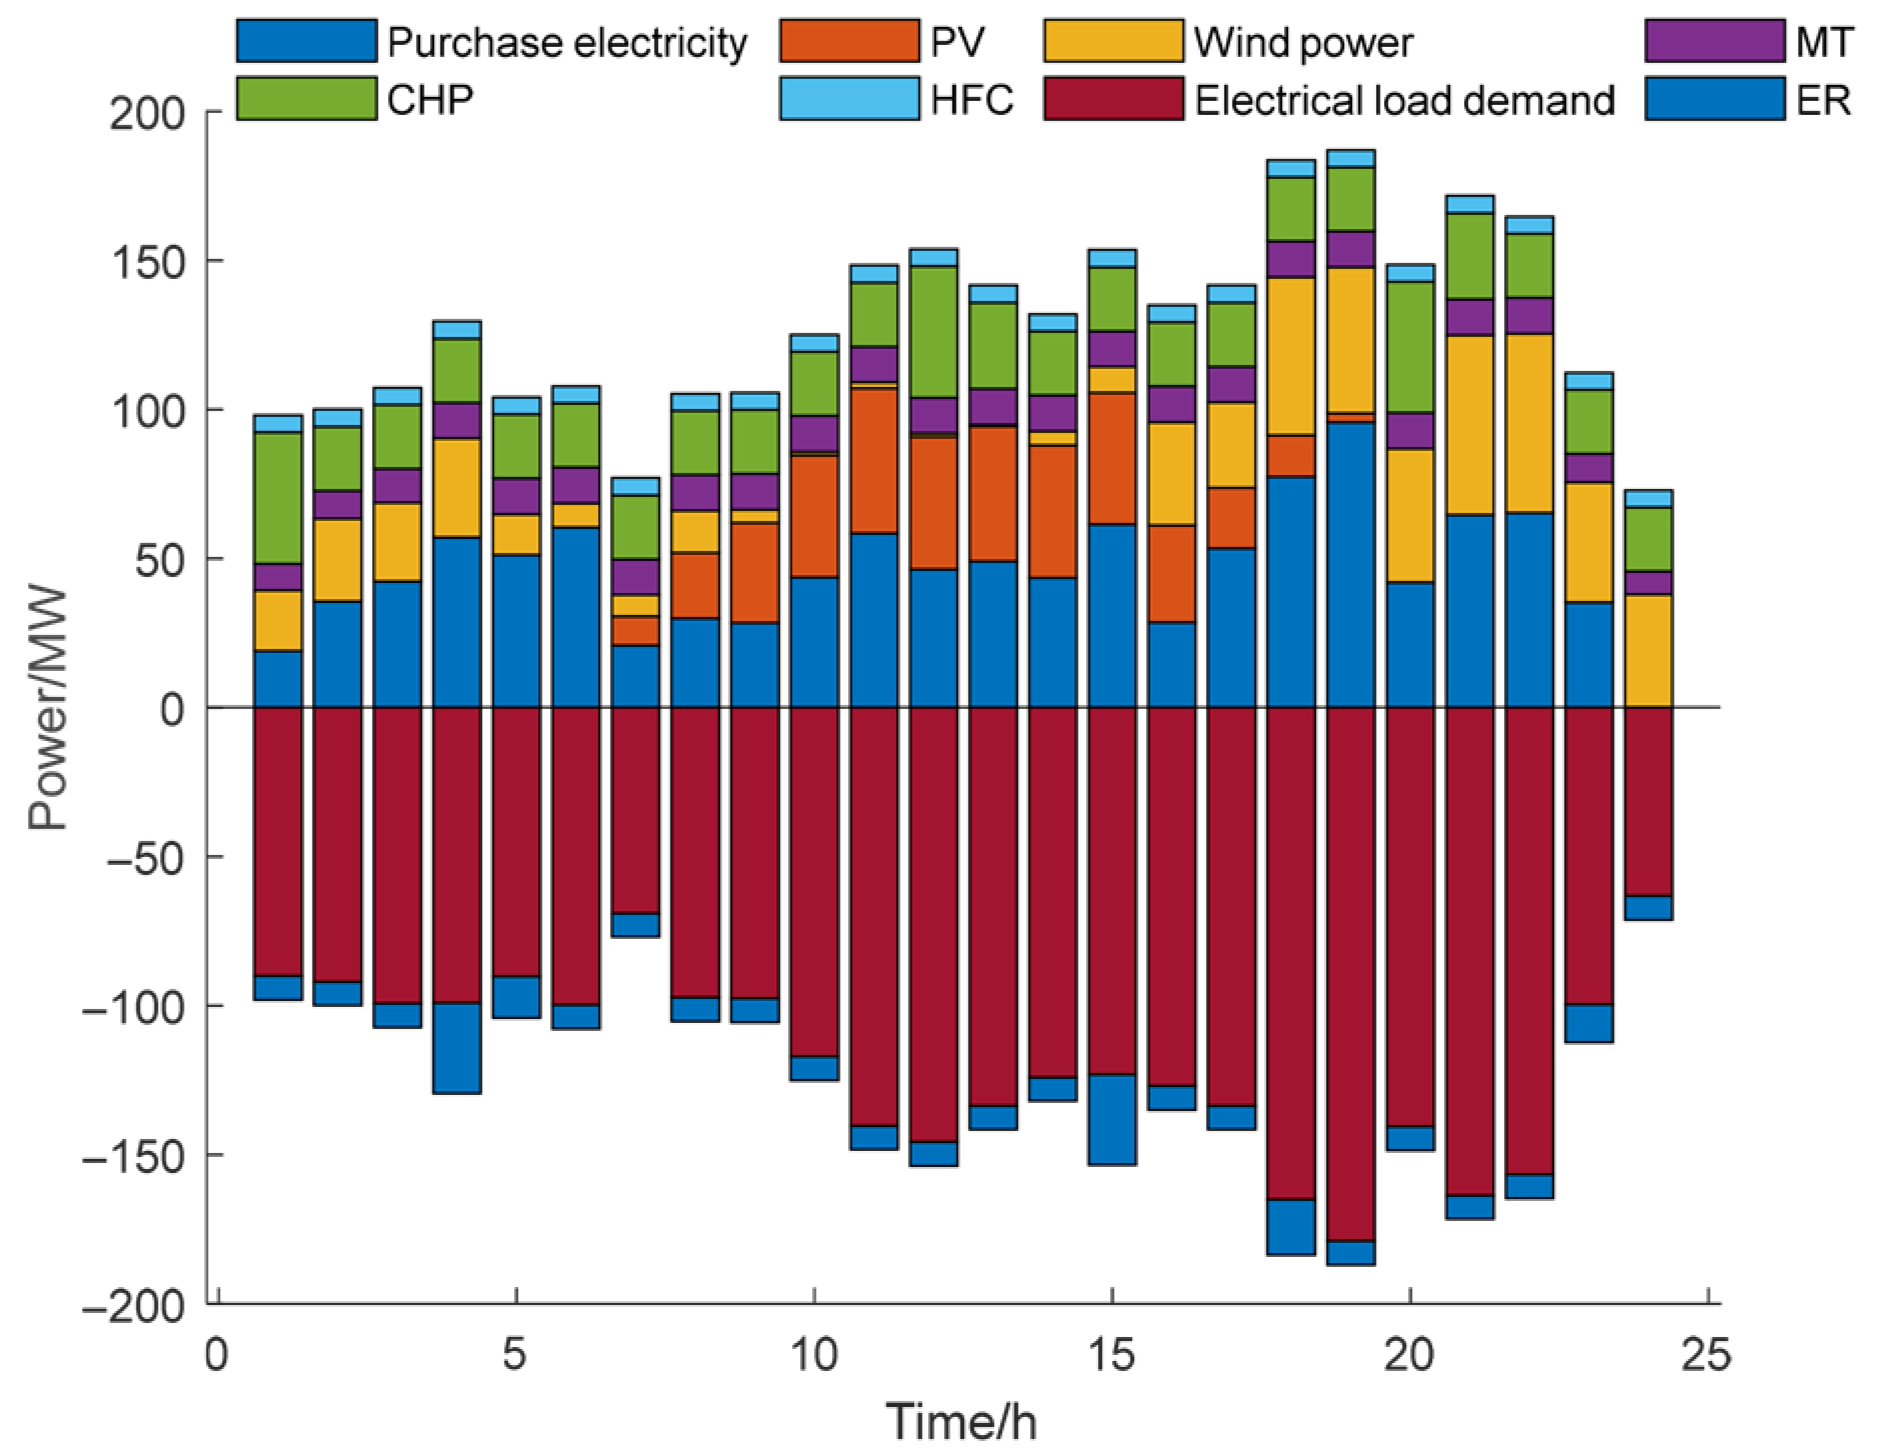
Further analyzing Model 4, as shown in Figure 6, the electrical energy required by the electrical load and the electric chiller is provided by market-purchased electricity, photovoltaic units, wind turbine units, micro gas turbines, CHP units, and hydrogen fuel cells. From 19:00 to 24:00 and from 00:00 to 06:00, the periods are in the evening and at night. During this time, the output of the wind turbine is relatively high, while the output of the photovoltaic power generation is almost zero. During this period, the operation of the electrical load and the electric chiller is mainly provided by the CHP unit, the wind turbines, and the gas turbines. When the demand for power load rises, the system is required to draw power from the superior power grid to guarantee the stable operation of the system. During the period from 07:00 to 16:00, the output of the wind turbines is relatively low, while the output of the photovoltaic power generation increases. The PV works in coordination with the traditional units, and the power load demand is met by purchasing electricity from outside. During the period from 14:00 to 15:00, the output of the photovoltaic units and wind turbines is relatively high, and the demand for electricity load is low. Therefore, the power used for electric refrigerators increases.
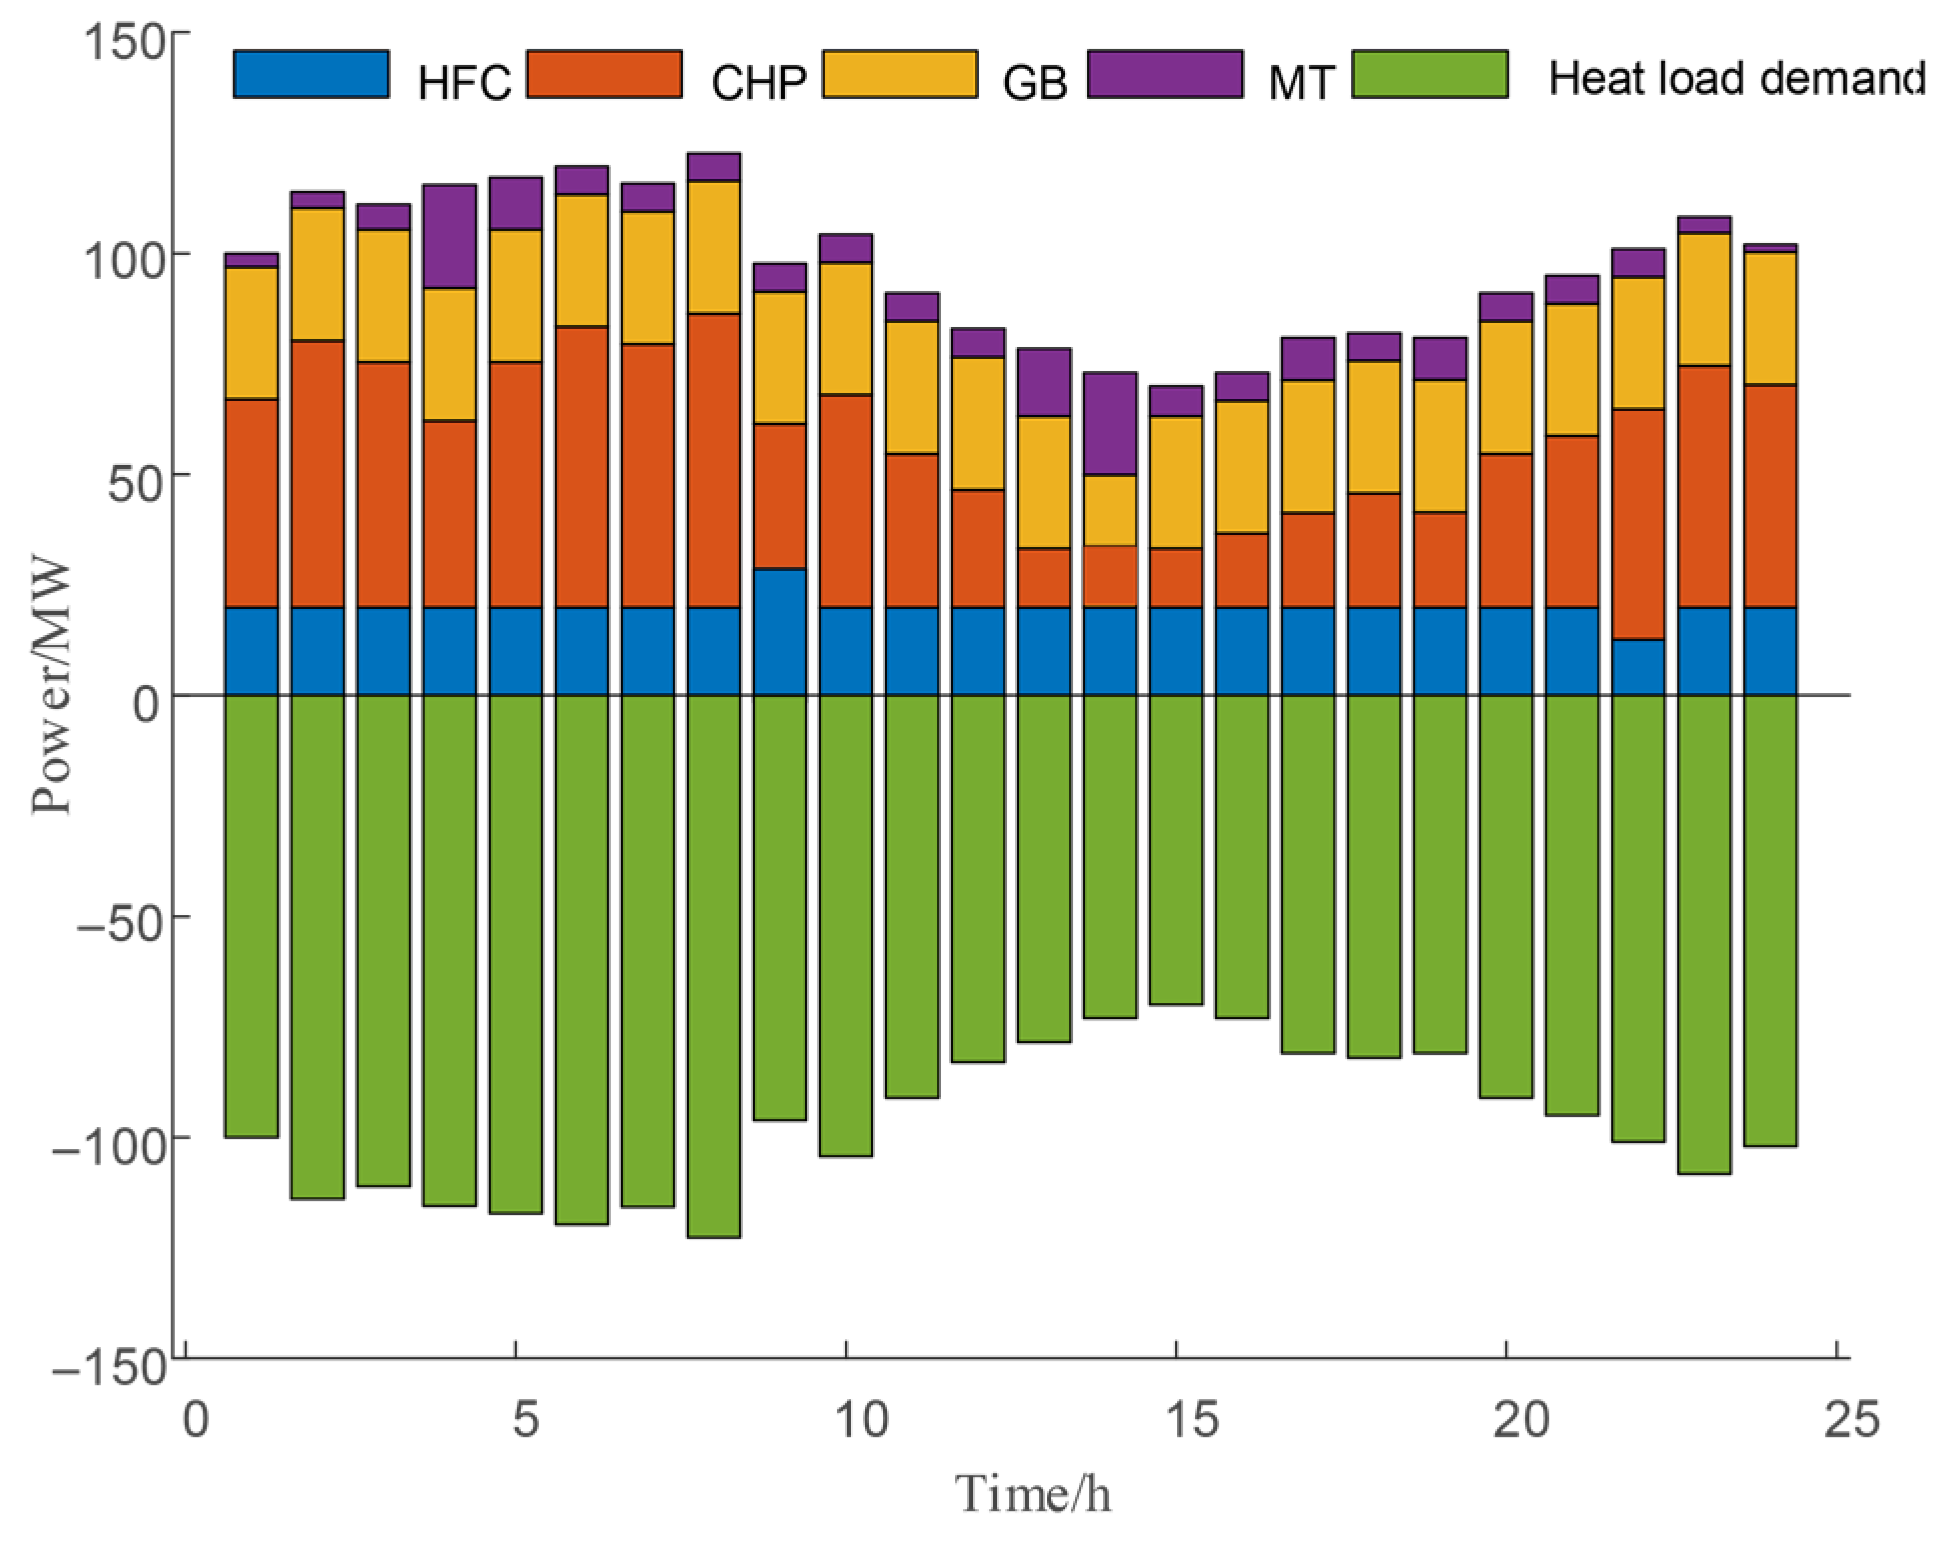
The thermal balance relationship is displayed in Figure 7. The heat load is given by the CHP, MT, GB, and HFC. During the period from 10:00 to 15:00, as the temperature rises, the heat output power of the cogeneration unit will decrease accordingly with the increase in temperature, and the MT output will gradually increase. During 20:00–06:00, the heat load demand is high, and the output of cogeneration units and gas boilers increases. During the period from 10:00 to 19:00, when the heat load demand is relatively low, the system mainly provides heat through the GB. The CHP unit operates in a state of “more heat and less electricity”.
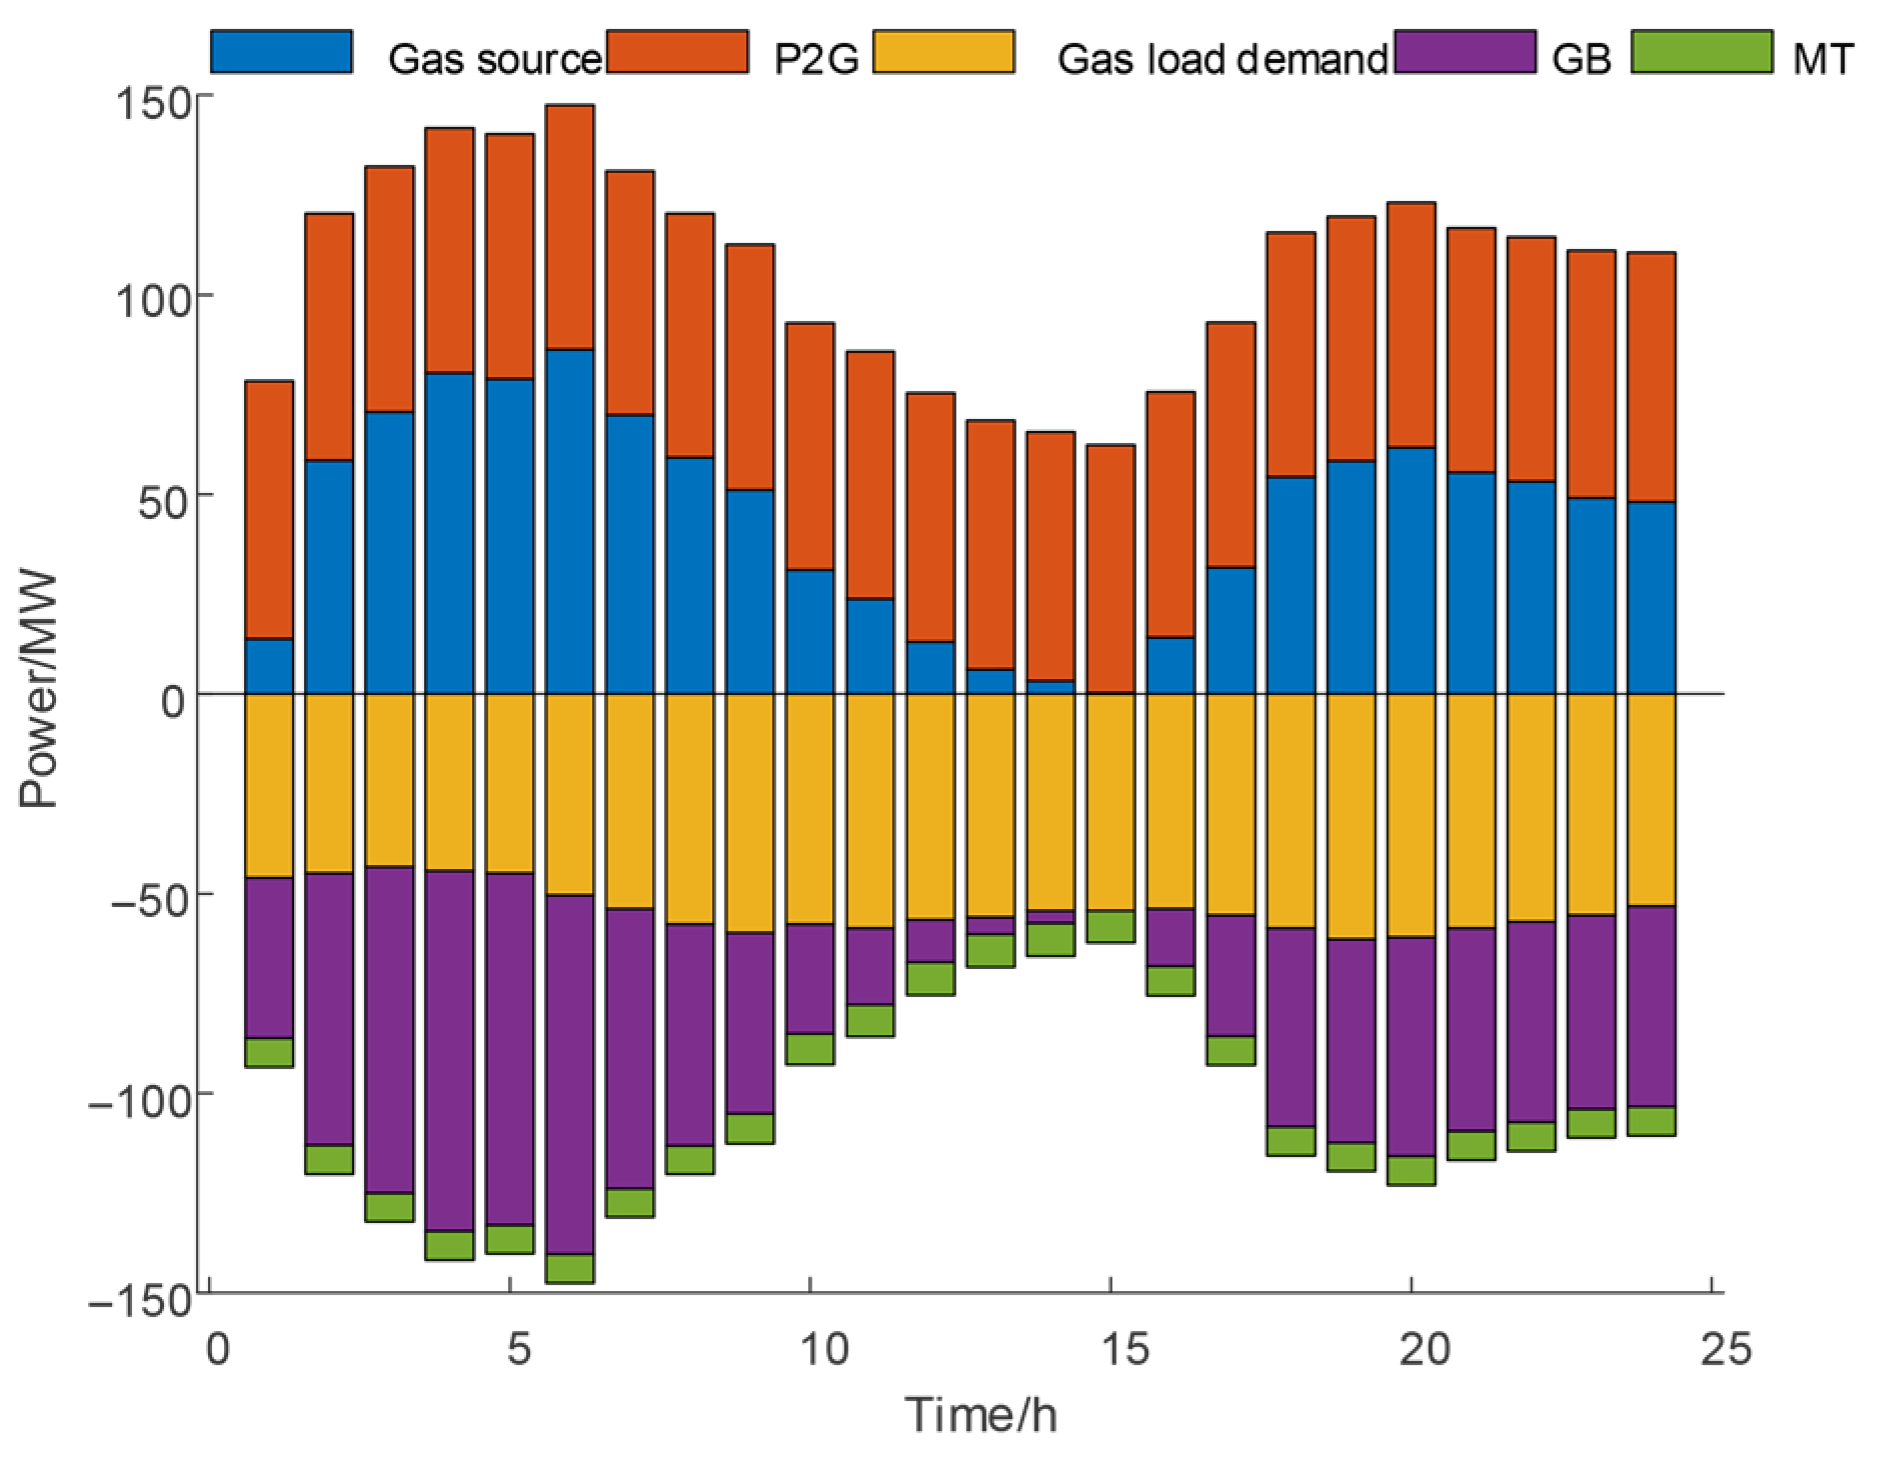
As shown in Figure 8, the 11:00–16:00 gas load demand is relatively low, and the GB’s gas load and natural gas consumption and the MT are mainly supplied by P2G. During the period from 15:00 to 10:00, when the gas load demand is too high, the system needs to purchase some gas from the external gas network.
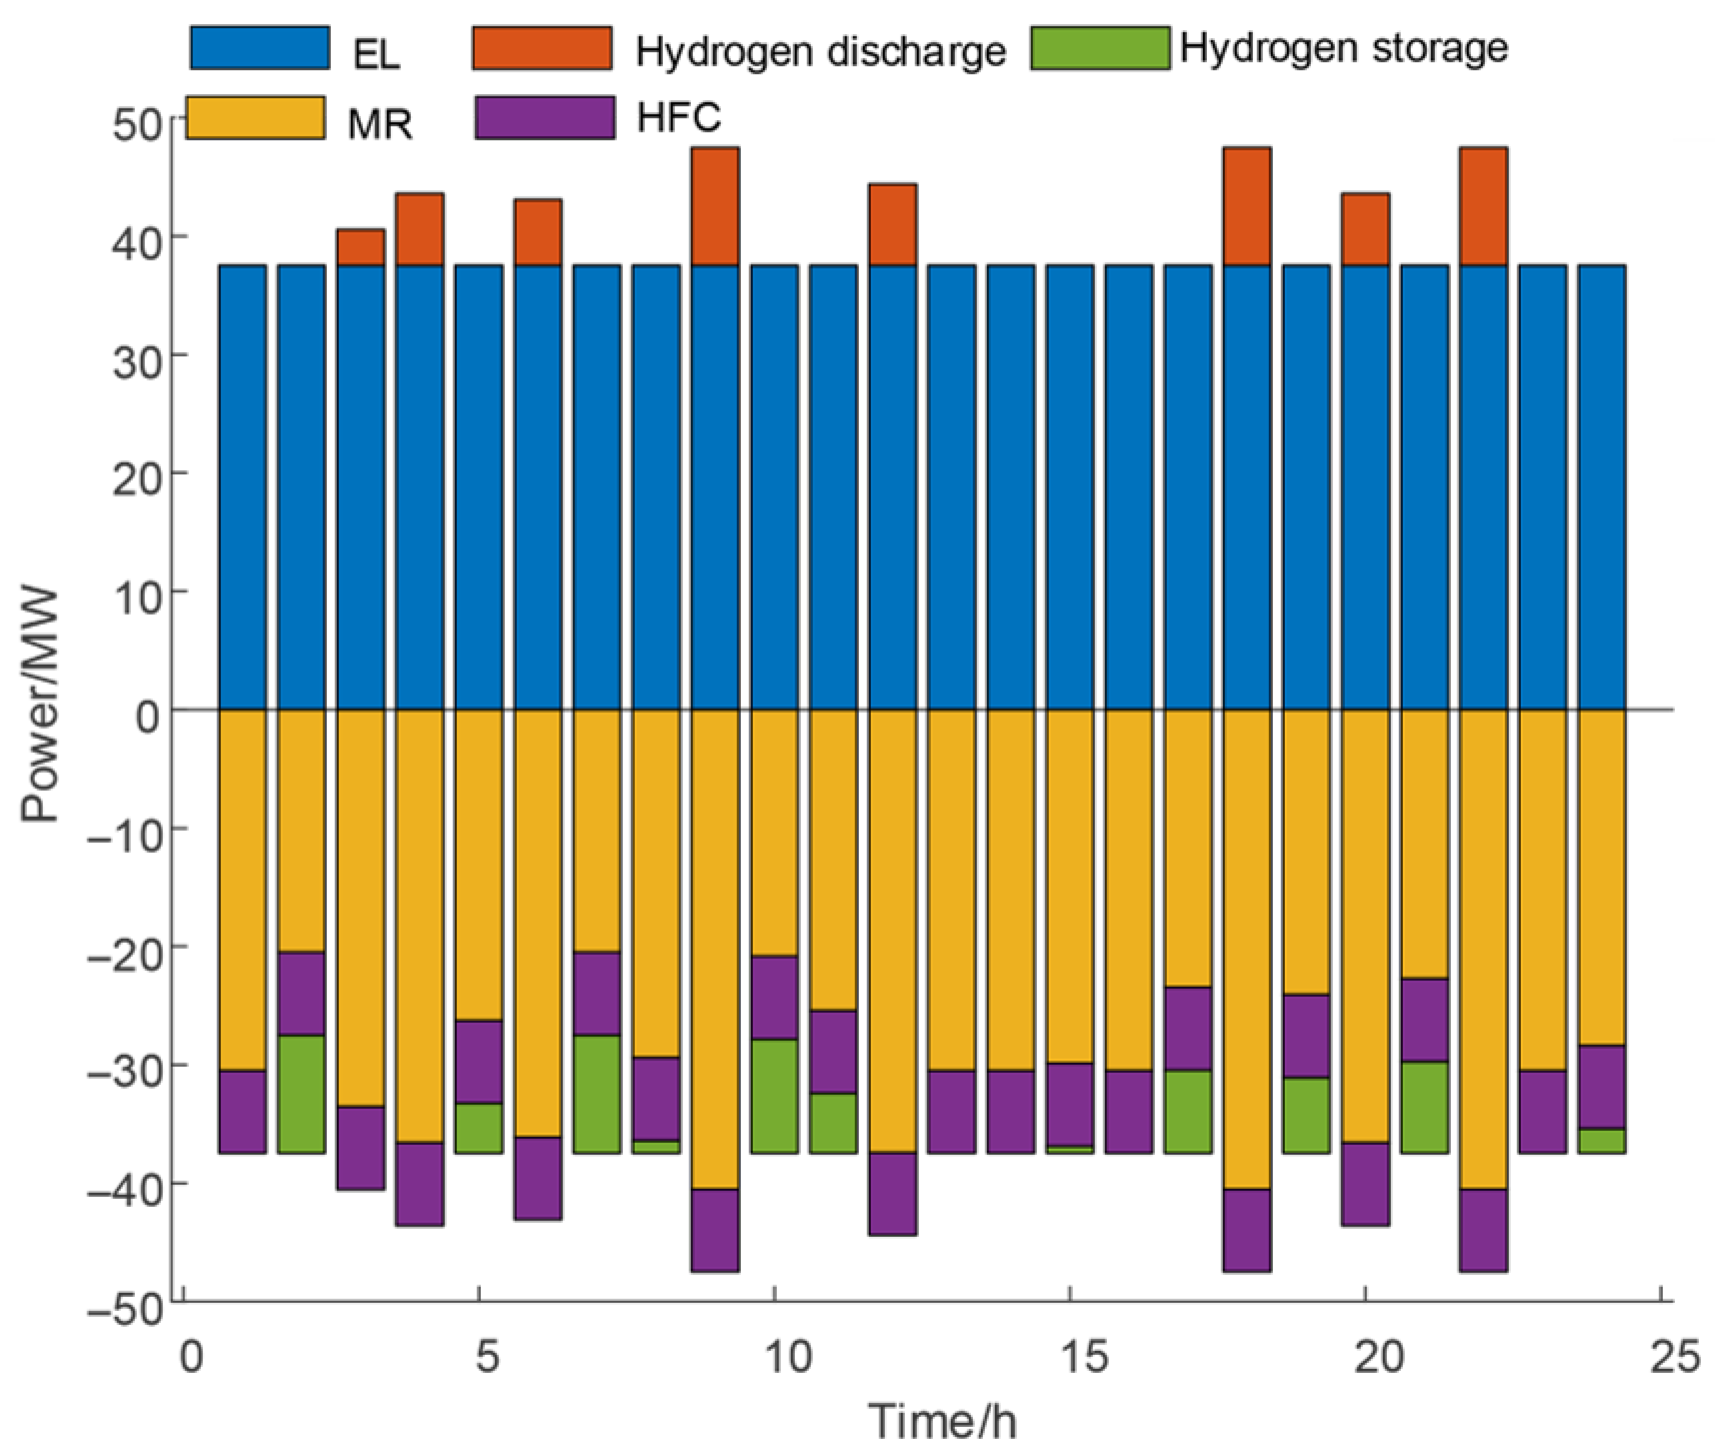
The hydrogen energy balance relationship is shown in Figure 9. The electrolyzer converts the electricity into hydrogen. The generated hydrogen energy has three destinations: A portion is stored in hydrogen storage tanks and supplied when the power supply within the system is inadequate; it helps to achieve peak load reduction and valley load augmentation, thereby stabilizing the power demand curve. A part of it directly generates electrical and thermal energy through the HFC to meet the demands of the electrical and thermal loads, promote the conversion of electrical energy to thermal energy, and enhance the overall efficiency of the system. A portion of the natural gas is generated through the MR equipment and jointly purchased from the upper level to meet the gas power balance. The generated natural gas is then supplied to the electrical and thermal loads through the CHP and GB equipment, achieving the simultaneous conversion of electrical energy into gas energy and thermal energy.
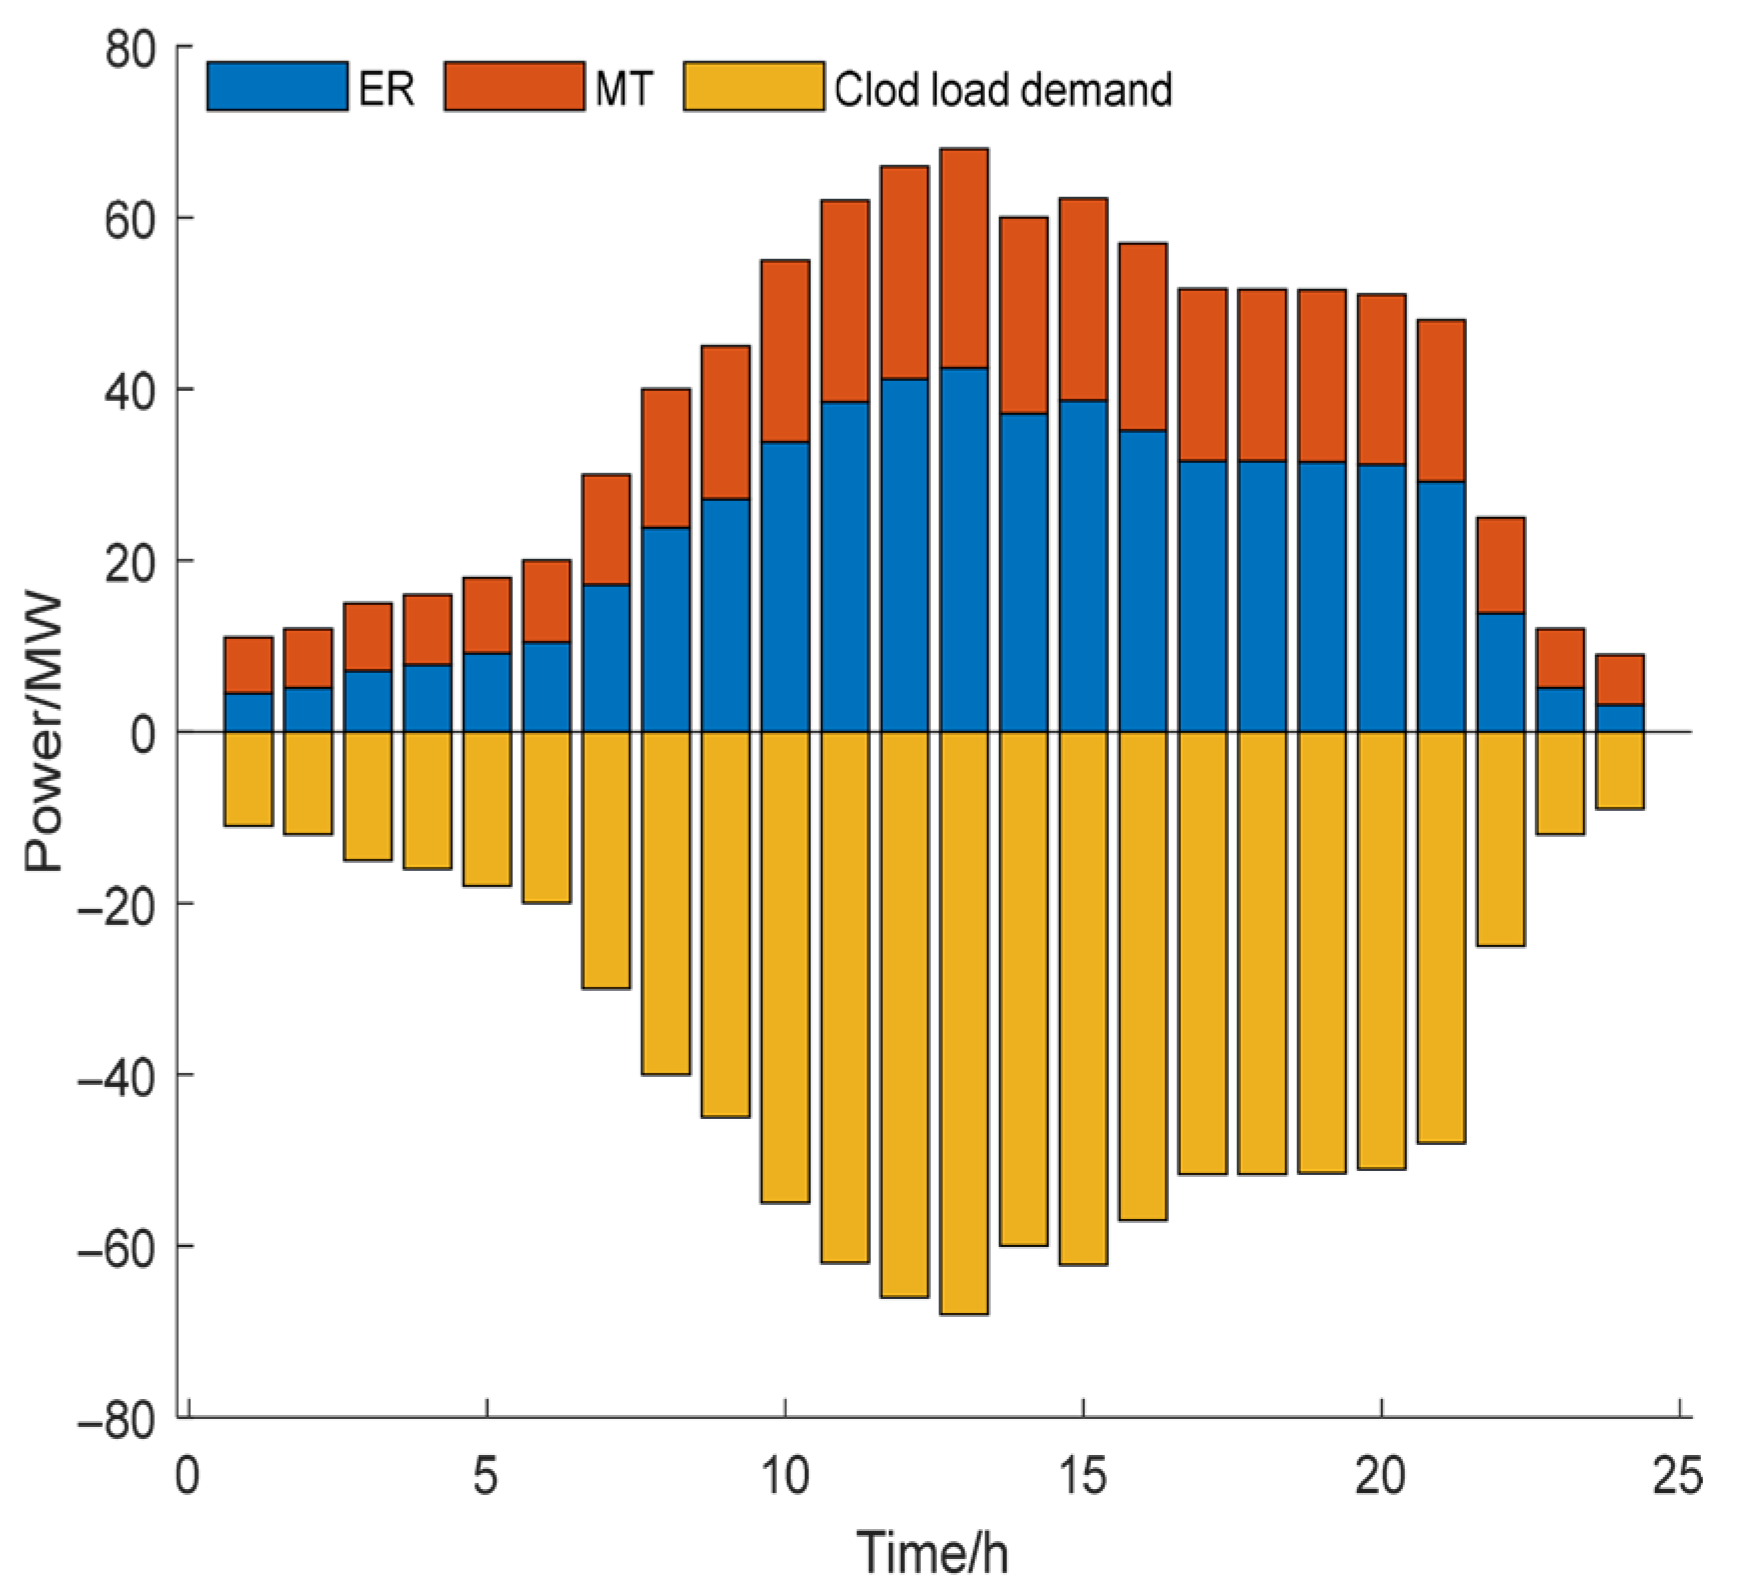
The cooling load relationship is shown in Figure 10. From 22:00 to 07:00, due to the relatively low cooling load demand at night and in the early morning, the MT drives the refrigeration equipment through the waste heat recovery system to achieve cold energy output. From 08:00 to 21:00, the cooling load demand increases, and the ER provides the majority of the cooling load. The refrigeration machine meets the cooling load demand by consuming electrical energy, which not only satisfies the system’s demand response but also reduces the power generation output of the gas turbine, thereby effectively increasing the penetration rate of renewable energy in the energy system.

4. Conclusions

To promote the harmonious enhancement of the low-carbon economy and the utilization potential of renewable energy within the comprehensive energy framework, and to ensure the reliable operation of the system at the same time, in this paper, the CCP is coupled for operation, and the IES model is constructed under the carbon trading mechanism. Through multi-scenario simulation verification, the following key conclusions are drawn:
The effect of electric-to-gas equipment with carbon and hydrogen storage equipment can decouple electric hydrogen production and electric-to-gas conversion, thereby enhancing the operational flexibility of electric-to-gas equipment. The connection of carbon storage equipment eliminates the reliance on purchasing CO2 from outside, thereby reducing costs. Meanwhile, the introduction of hydrogen storage equipment enables the electric-to-gas conversion device to fully utilize the surplus electricity, including renewable energy, and achieve full consumption.
Considering the tiered carbon trading mechanism of rewards and punishments, a 3.3% dip in carbon emissions coupled with a 3.34% cost reduction really drove home the point: a carbon trading system, with its carrot-and-stick approach, can indeed slash emissions and make the whole operation more cost-effective.
In an IES, comprehensively considering the CCP and carbon trading can further limit the CO2 emissions of the system. Under this model, costs drop by 12.36%, emissions are cut by 33.37%, and the utilization rate of renewable energy is increased by 36.7%. This proves that the combination of the two can maximize the economy.
5. Discussion

5.1. Advantages

In terms of modeling, CCS technology captures the CO2 emitted by CHP units and gas boilers, and transmits it to the P2G. This process reduces direct carbon emissions and also converts carbon into usable chemical energy, achieving the recycling of carbon resources. The P2G system adopts a two-stage design. The hydrogen produced can be used for methane synthesis or directly stored for use by the HFC, supplying micro gas turbines and gas boilers. The carbon trading model in this article differs from the traditional fixed carbon price. It divides carbon emissions into multiple intervals and sets an increasing stepped carbon price: when carbon emissions are higher, the unit cost in the carbon price ladder exhibits a rising trend. For instance, when the carbon emissions exceed the free quota, for each additional range, the carbon price can increase by up to 50%, forming a nonlinear penalty mechanism that significantly raises the cost of high-emission behaviors. Conversely, if the amount of carbon emitted falls below the allocated limit, the IES can earn profits by selling the quota and enjoy the government’s reward coefficient, thus forming a positive cycle of “emission reduction equals benefit”. The system can utilize surplus renewable energy electricity to produce hydrogen and methane during the off-peak electricity price period, reducing the cost at high prices. Meanwhile, the system generates electricity during peak hours, reducing the cost of purchasing electricity. This joint design significantly enhances the flexibility and system energy efficiency, while overcoming the problem of low efficiency in a single methanation process. For large-scale mixed-integer nonlinear programming problems, in terms of solution, this research employs the YALMIP toolbox within the MATLAB R2021a environment to access the efficient CPLEX solver, which not only ensures the quality of the solution but also improves the computational efficiency. The empirical application in a certain industrial park in northern China has shown that this model can boosts energy utilization in the park to over 90% and reduce carbon emissions by about 33%, providing a practical example for similar parks.

5.2. Future Prospects

This thesis conducts a cursory exploration of this field, hoping to provide some models and methods to support subsequent research. However, due to the limitations of the authors, there are still some deficiencies. One can be delved into deeper in upcoming research. In the subsequent research work, the multi-time-scale optimization scheduling considering the demand response in the cooperative operation model based on CHP-CCS-P2G will be studied. Meanwhile, the joint trading model of green certificates and carbon trading should be considered. Advanced artificial intelligence algorithms should also be integrated. In the future, IES research will integrate artificial intelligence algorithms more deeply to achieve more intelligent energy management and optimized control. Using mechanical equipment learning models, the energy demand and the supply of renewable energy can be predicted accurately, and the energy distribution strategy can be automatically adjusted to achieve efficient energy utilization.

Author Contributions

Conceptualization, Z.Z. and L.L.; methodology, Z.Z.; software, Z.Z.; validation, Z.Z., L.L., and Q.W.; formal analysis, Z.Z.; investigation, Z.Z.; resources, L.L.; data curation, Z.Z.; writing—original draft preparation, L.L.; writing—review and editing, L.L.; visualization, Z.Z.; supervision, J.H.; project administration, Q.W.; funding acquisition, H.J. All authors have read and agreed to the published version of the manuscript.

Funding

This research work was supported by the National Natural Science Foundation of China for Young Scientists (No. 61703297) and General Project of Shanxi Province Basic Research Program (No. 202203021221153).

Data Availability Statement

The original contributions presented in this study are included in the article. Further inquiries can be directed to the corresponding author.

Conflicts of Interest

The authors declare no conflicts of interest.

Abbreviations

The following abbreviations are used in this manuscript:
CHPCombined heat and power
P2gPower-to-gas
IESIntegrated energy system
CCPCHP-CCS-P2G
MTMicro turbine
GBGas boiler
ERElectric refrigeration machine
HFCHydrogen fuel cell
CCSCarbon capture and storage
PVPhotovoltaic

Appendix A

Table A1. Main parameters of other equipment.
ParametersValueParametersValue
α c c s MW 0.5 P chp 2 , min MW 0
β 1.03 P chp 2 , max MW 15
α p 2 g 0.56 P chp 3 , min MW 0
C v 1 0.15 P chp 3 , max MW 10
C v 2 0.2 η hfc 0.9
η gb 0.8 P hfc , min MW 0
H gb , min MW 0 P hfc , max MW 25
H gb , max MW 30 P mt , min MW 5
η mt 0.6 P mt , max MW 30
P m t , d o w n MW 15 P m t , u p MW 15
η h 1.9 ρ e 0.5
η c 2.4 P er , min MW 0
η hfc , t 0.7 P h 2 , t max ( M W ) 18
a 1 t / MW 0.89 P er , max MW 4
b 1 t / MW 0.0017 Z 0.798
c 1 t / MW 26.15 c Euro / t 19.83
d 1 t / MW 1.09 h / t 50
a 2 Euro / MW 1.60 σ / ω 0.2/0.2
b 2 Euro / MW 0.00048 e 1 Euro / MW 14.42
c 2 Euro / MW 14.42 d 2 Euro / MW 14.42
g Euro / MW 28.85 f 1 Euro / MW 0.02
h 1 Euro / MW 2.40 h 2 Euro / MW 2.88
α w Euro / MW 14.42 α p Euro / MW 14.42

References

  1. Danning, H.; Zhijian, H.; Zhukui, T.; Tiange, L.; Yang, W.; Hao, H.; Zhuo, D. Low-carbon Economic Scheduling of the Integrated energy System Considering the bidirectional interaction of green certificates—Stepped carbon and carbon capture. Electr. Power Autom. Equip. 2025, 45, 69–77. [Google Scholar]
  2. Ting, W.; Jing, Z.; Chong, G.; Qi, Y. Optimal Scheduling of Integrated Energy System under Mutual Recognition and Offset of Green Certificates and Carbon Markets. Smart Power 2025, 53, 104–110+118. [Google Scholar]
  3. Luxin, P.; Donglin, W.; Jinming, G.; Dan, P.; Zhenhao, W. Comprehensive Energy Optimization of P2G System Parks Considering Demand Response and carbon-Green Certificate Trading. Power Grid Clean Energy 2020, 41, 92–102. [Google Scholar]
  4. Xiaogang, X.; Xiangpeng, M.; Huijie, W. Research on Optimal Configuration of Integrated Energy System Coupled with P2G-CCS. Energy Conserv. 2025, 44, 23–27. [Google Scholar]
  5. Shuang, W.; Shuna, G.; Cailing, Z.; Yan, Z. Wei, H. Wenyan, D. Low-carbon Optimal Scheduling of Integrated Energy Systems Considering flexible source-load response and joint operation of CCPP-P2G. J. Electr. Power Syst. Its Autom. 2025, 37, 1–11. [Google Scholar]
  6. Ruihuan, C.; Kun, Y.; Chaoyun, F.; Guangzheng, Y. Optimal Scheduling of Integrated Energy System Containing Carbon Capture and Electricity-to-Gas Conversion under the “Dual Carbon” Goals. Electr. Meas. Instrum. 2025, 7, 1–9. [Google Scholar]
  7. Shi, W.; Chenchen, H.; Dechang, Y.; Lijun, Z.; Dong, L. Multi-load Forecasting of Integrated Energy System Based on Time Series Large Model. Power Grid Technol. 2025, 1–10. [Google Scholar]
  8. Zhao, L.; Jinghui, W.; Hua, W.; Weijie, Z.; Linyan, Y.; Xin, S. Optimal scheduling of Integrated Energy System Considering carbon Capture and Electricity-to-gas Conversion. Electr. Power Autom. Equip. 2023, 43, 127–134. [Google Scholar]
  9. Jiao, N.; Wen native, Y.; Yida, W. Research on Carbon Emission Reduction Economic Scheduling of Integrated Energy System for Hydrogen Production by Water Electrolysis. Heilongjiang Sci. 2020, 16, 27–31. [Google Scholar]
  10. Chen, X. Operation Analysis of Multi-Microgrid with P2G Based on Stepped Carbon Trading. Foreign Electron. Meas. Technol. 2025, 44, 151–158. [Google Scholar]
  11. Liu, X.; Fanjie, N.; Dongfeng, Y.; Yong, W.; Yang, X. Low-carbon Economic Dispatching of the Integrated Energy System Considering the Green Certificate—Carbon Trading Mechanism under the Carbon Capture Power Plant—Electricity-to-Gas Combined Operation Mode. Power Grid Technol. 2023, 47, 2207–2222. [Google Scholar]
  12. Wang, R.; Wen, X.; Wang, X.; Fu, Y.; Zhang, Y. Low carbon optimal operation of integrated energy system based on carbon capture technology, LCA carbon emissions and ladder-type carbon trading. Appl. Energy 2022, 311, 118664. [Google Scholar] [CrossRef]
  13. Ma, Y.; Wang, H.; Hong, F.; Yang, J.; Chen, Z.; Cui, H.; Feng, J. Modeling and optimization of combined heat and power with power-to-gas and carbon capture system in integrated energy system. Energy 2021, 236, 121392. [Google Scholar] [CrossRef]
  14. Liu, S.; Kun, D.; Haiying, D. Economic scheduling of integrated Energy System in Zero-carbon parks considering carbon capture and electric-to-gas conversion. Acta Energiae Solaris Sin. 2024, 45, 188–196. [Google Scholar]
  15. Li, J.; Rengli, C.; Baorong, Z.; Jiajin, L.; Tian, M.; Wenmeng, Z.; Tao, W.; Guanglei, H.; Yinliang, X. Random Optimization Adjustment of the Integrated Energy System in low-carbon Parks with Carbon Capture and Electricity-to-Hydrogen Conversion Equipment. China Electr. Power 2024, 57, 149–156. [Google Scholar]
  16. Xia, L.; Xiang, T. An Improved IES Multi-Energy Flow Calculation Method Containing Cold, Heat, Electricity and Gas. Electr. Power Surv. Des. 2025, 7, 22–28. [Google Scholar]
  17. Li, W.; He, M.; Cai, T. Low-carbon economic dispatch of hydrogen-containing integrated energy system considering stepped demand response. Energy Rep. 2024, 11, 4222–4232. [Google Scholar] [CrossRef]
  18. Yang, X.; Yeheng, D.; Xiaopeng, W.; Fuwei, D.; Zhonglian, Z.; Linghao, M. Low-carbon Economic Scheduling of Regional Integrated Energy Systems with CHP-CCS-P2G Coupling Based on the Joint trading Mechanism of carbon trading—Green Certificates. Acta Energiae Solaris Sin. 2024, 45, 244–254. [Google Scholar]
  19. Wu, X.; Cao, B.; Liu, B.; Zhang, Z.; Wang, X. Capacity planning of carbon-free microgrid with hydrogen storage considering robust short-term off-grid operation. Renew. Energy 2023, 202, 242–254. [Google Scholar] [CrossRef]
  20. Yang, J.; Zhang, N.; Cheng, Y.; Kang, C.; Xia, Q. Modeling the operation mechanism of combined P2G and gas-fired plant with CO2; recycling. IEEE Trans. Smart Grid 2019, 10, 1111–1121. [Google Scholar] [CrossRef]
  21. Zhao, Y.; Huihui, X.; Jing, P.; Yi, C.; Jiafu, L.; Ning, L. Optimal Scheduling of Integrated Energy Systems Considering Carbon Emissions and Multi-level Utilization of Hydrogen Energy. J. Nanjing Univ. Inf. Sci. Technol. 2025, 1–11. [Google Scholar]
  22. Yan, X.; Lili, H.; Haitao, L.; Zhenlan, D.; Kunyin, J. Sequential Recovery Optimization Decision for Electricity-Gas Integrated Energy System Considering Comprehensive Demand Response. Electr. Power Autom. Equip. 2025, 1–23. [Google Scholar]
Figure 1. IES block diagram in CCP mode.
Energies 18 04589 g001
Figure 2. CCP operation model.
Energies 18 04589 g002
Figure 3. CCP coupling characteristics.
Energies 18 04589 g003
Figure 4. Load forecasting.
Energies 18 04589 g004
Figure 5. Impact of the reward coefficient on the carbon emission cost.
Energies 18 04589 g005
Figure 6. Electric power balance.
Energies 18 04589 g006
Figure 7. Heat power balance.
Energies 18 04589 g007
Figure 8. Gas power balance.
Energies 18 04589 g008
Figure 9. Hydrogen power balance.
Energies 18 04589 g009
Figure 10. Cold power imbalance.
Energies 18 04589 g010
Table 1. CHP unit parameters.
ParametersValuesParametersValues
P chp , min ( MW ) 10 b 1 ( Euro / MW ) 0.002
P chp , max ( MW ) 35 c 1 ( Euro / MW ) 25
H c h p , min ( MW ) 0 d 1 ( Euro / MW ) 1
H c h p , max ( MW ) 40 P c h p , d o w n ( MW ) 15
a 1 ( Euro / MW ) 0.9 P c h p , u p ( MW ) 15
Table 2. Assumed electricity price.
TimeElectricity Price/[EUR·(KW·h)−1]
01:00–07:00, 23:00–24:000.045
08:00–11:00, 13:00–16:000.081
12:00–14:00, 19:00–22:000.14
Table 3. Scenario information.
OptionsCHP-CCS-P2G Joint OperationReward and Punishment Carbon Trading Mechanism
1××
2×
3×
4
Table 4. The scenario scheduling results.
Case 1Case 2Case 3Case 4
Energy purchase cost (EUR)16,027.4715,081.4913,830.2110,176.13
Operation and maintenance cost (EUR)61,567.6462,677.0964,260.1261,934.25
Carbon trading cost (EUR)0−1574.620−2163.60
The cost of wind and solar power abandonment (EUR)7987.297718.045202.265058.02
CO2 emissions (t)1961.371897.621759.461306.84
Costs (EUR)85,582.4083,902.083,292.5975,004.80
Disclaimer/Publisher’s Note: The statements, opinions and data contained in all publications are solely those of the individual author(s) and contributor(s) and not of MDPI and/or the editor(s). MDPI and/or the editor(s) disclaim responsibility for any injury to people or property resulting from any ideas, methods, instructions or products referred to in the content.