Article

Modeling and Validation of High-Pressure Hydrogen Joule-Thomson Effect for Enhanced Hydrogen Energy System Safety

by
Mu-Yao Zhou
1,†,
Yi Fang
1,†,
Qian-Hua Wang
1,
Yi-Ming Dai
2,
Zhan-Hao Liu
3,
Ji-Qiang Li
1,* and
Jeong-Tae Kwon
4,*
1
School of Transportation, Ludong University, Yantai 264025, China
2
Department of Electronic, Electrical and Systems Engineering, University of Birmingham, Birmingham B15 2TT, UK
3
School of Transportation and Vehicle Engineering, Shandong University of Technology, Zibo 255049, China
4
Department of Mechanical Engineering, Hoseo University, Asan 31499, Republic of Korea
*
Authors to whom correspondence should be addressed.
These authors contributed equally to this work.
Energies 2025, 18(17), 4573; https://doi.org/10.3390/en18174573
Submission received: 30 June 2025 / Revised: 11 August 2025 / Accepted: 26 August 2025 / Published: 28 August 2025

Abstract

With the rapid development of hydrogen fuel cell vehicles, the research on the throttling effect of high-pressure hydrogen is crucial to the safety of hydrogen circulation systems for fuel cells. This paper studies the Joule-Thomson coefficients ( μ J T ) of ten gas state equations. The four equations, Van Der Waals (VDW), Redlich-Kwong (RK), Soave-Redlich-Kwong (SRK), and Beattie Bridgeman (BB), were selected for calculation. These were compared with the database of the National Institute of Standards and Technology (NIST), aiming to determine the optimal state equation under different temperature and pressure conditions. The empirical formula of the μ J T pressure and temperature was compounded, and the temperature rise effect was further calculated using the empirical formula of compounding. The results show that the calculated value of μ J T by using the VDW equation in the low-pressure range (0–2 MPa) is closer to the value in the NIST database with an error less than 0.056 K · M P a 1 . The tendency of μ J T described by the RK equation corresponds to the NIST database; meanwhile, the maximum error in the SRK equation is 0.143916 K · M P a 1 . The BB equation is more applicable within the pressure range of 20 to 50 MPa with a maximum error of 0.042853 K · M P a 1 . The fitting error of the empirical formula is within 9.52%, and the relative error of the calculated temperature rise is less than 4%. This research might provide several technical ideas for the study of the throttling effect of hydrogen refueling stations and the hydrogen circulation system of on-board hydrogen fuel cells.

1. Introduction

Recently, the global energy structure has been moving gradually towards a diversification, low carbon and cleanliness situation. Hydrogen energy has characteristics with high combustion calorific value, high energy density, environmentally friendly with low carbon, renewable and reusable, large deposit, and others, which makes it regarded as an ideal secondary energy source. H2 is an excellent energy carrier with a calorific value of 141.9 J/kg, while liquefied gasoline and natural gas have calorific values of 48.8 J/kg and 50 J/kg, respectively [1]. In the hydrogen energy-related industry, the hydrogen fuel cell vehicle is considered one of the most promising commercial ways to use hydrogen [2,3]. Furthermore, the infrastructure for hydrogen storage and refueling is developing rapidly due to the development and pilot application of technologies and industries related to hydrogen fuel cell vehicles. Therefore, environmentally friendly and renewable energy sources such as hydrogen are potential candidates for meeting energy demands and achieving a hydrogen economy [4]. At present, hydrogen fuel cell vehicles mainly store hydrogen under high pressure. The temperature inside the onboard hydrogen storage tank rises sharply during refueling. Excessively high temperatures can affect the structure of the hydrogen storage material, posing a potential safety risk [5]. To precisely control intake and exhaust pressures in the hydrogen circulation system, the throttling elements, such as pressure regulating valves and back pressure valves, are required. For example, when hydrogen passes through the throttling elements, a throttling effect occurs, resulting in energy loss and temperature changes [6,7]. Therefore, it is necessary to investigate the throttling effect of high-pressure hydrogen during the performance test of hydrogen compressors to avoid excessive changes in gas temperature that affect the stability of the test system.
Currently, researchers at domestic and international levels have carried out a large number of studies on the throttling effect of high-pressure hydrogen. Liu et al. [8] established a 3D model of the hydrogen gas tank valve and conducted numerical simulation studies on the Joule-Thomson (JT) effect using dynamic mesh and UDF techniques. Li et al. [9] developed a thermodynamic model to study the JT characteristics of hydrogen-mixed natural gas. The main research focuses on the characteristics of the JT effect of hydrogen mixed with natural gas at 24 MPa. Zhang et al. [10] coupled multiphysics equations to develop a turbulence equation and a mass transfer equation and conducted a numerical study on the valve body flow characteristics of hydrogen-mixed natural gas. Chen et al. [11] built a pressure regulator model to study the hydrogen discharge behavior and the JT effect, and verified the accuracy of the model under complex conditions. Tiuman et al. [12] employed the CPA equation of state to research the μ J T and inversion curves of different substances. Pakravesh et al. [13] used multiple state equations to predict the μ J T and JT inversion curves of the eight main components of natural gas. Rößler et al. [14] studied the JT property and used the JT property to evaluate three thermodynamic models, discussing the rationality of the classical corresponding state principle. Shoghl et al. [15] used six equations of state to predict the μ J T , specific heat capacity, inversion curve and outlet temperature after throttling of the main components of natural gas. Huang et al. verified the applicability of the four state equations, namely PR, BWRS, AGA8-92D and GERG-2008, to the calculation of the J-T coefficient of hydrogen-mixed natural gas [16]. Wang et al. evaluated the accuracy of the four state equations, RK, SRK, PR and BWRS, in in calculating the physical properties of hydrogen-mixed natural gas [17]. Alanazi et al. studied the application of the two state equations, SR-RK and PC-SAFT, in hydrogen systems containing gaseous impurities [18]. Wu et al. [19] improved the Lee phase transition model and proposed a novel 3D model of the complex physical properties of liquid helium to study the thermodynamic characteristics of the throttling process in the JT cooler. Chen et al. [20] studied the JT characteristics of low-temperature coolers operating at liquid hydrogen temperatures and conducted experiments to verify the accuracy of the model. Ariadji et al. [21] improved the concentration of the JT equation by optimizing supercritical conditions and the gas coefficients or heat capacities of various carbon monoxide, which is applicable to the gas production systems. Zhang et al. [22] established a helium JT cryocooler model to study the numerical simulation of choked flow and superfluid in cryocoolers. Wang et al. [23] proposed a JT cooler model for single-stage mixed refrigerants, optimized the components’ effective refrigeration method, and conducted simulation analyses on mixed refrigerants under different working conditions. Wang et al. [24] suggested a new improvement approach for mixed refrigerants and conducted a study on the JT refrigeration machine. The results showed that the mixed refrigerant operating at 120 K had a better cooling effect. Farzaneh-Gord et al. [25] proposed a new correlation to study the influence law of natural gas components on the μ J T and the JT inversion curve. Hosseini et al. [26] studied the JT effect of different natural gas and condensate oil samples and analyzed the translational uniform equation of state of the JT effect under high temperature and high pressure. Tada et al. [27] studied the μ J T and the JT inversion curve of helium gas, and compared the research outcomes with previous studies. Most of the above references are studies on the μ J T and the JT inversion curve of the main components of natural gas, while there are relatively few studies on the μ J T of high-pressure hydrogen and the temperature change of the post-throttling behavior.
However, the existing research has three main limitations: (1) The research objects are mostly focused on natural gas and its components, while systematic studies on the applicability of the gas state equation for high-pressure pure hydrogen are relatively scarce; (2) The selection of state equations is limited, and there is a lack of systematic comparisons among multiple equations. (3) The development of semi-empirical formulas for practical engineering applications is insufficient. It is particularly worth noting that within the ultra-high pressure range above 70 MPa, the non-ideal characteristics of hydrogen significantly increase, and the prediction accuracy of the conventional equation of state drops sharply.
To sum up, there are relatively few studies on the throttling effect of high-pressure hydrogen, and the derivation of the μ J T for multi-state equation of high-pressure hydrogen is not comprehensive. Based on this, this paper conducts research on the throttling effect of high-pressure hydrogen in the field of hydrogen energy applications. Figure 1 shows our research method. By applying the classical gas state equation and empirical formula method, the μ J T expressions for calculating the throttling process of high-pressure hydrogen have been derived. A general calculation framework for the throttling temperature rise of high-pressure hydrogen is established, and the results contrast with the experimental consequences. Secondly, the calculation formula for the temperature rise of high-pressure hydrogen throttling is derived and solved by using the classical equation of state, and the accuracy of the calculation formula is confirmed through experimental data. The research results will give theoretical assistance for the design and optimization of key equipment in hydrogen energy systems, and can also provide reference and guidance for the engineering applications related to high-pressure hydrogen in the hydrogen energy field.

2. The JT Effect

When gas flows in a sealed pipe, as it passes through some suddenly reduced cross-sectional structures, such as small holes and slits, it causes throttling of the gas and a temperature decrease. This phenomenon is called the JT effect. When a gas is throttled without exchanging heat with the outside environment, such a process is called adiabatic throttling. In the ideal adiabatic throttling effect, the entropy increases, but the enthalpy value remains unchanged, resulting in the gas temperature remaining constant. However, in practice, the temperature of the gas is not only related to the enthalpy value but also to other factors; therefore, the temperature may vary during the actual throttling process.
The JT effect is generally reflected by μ J T , and the definition formula of μ J T is as follows:
μ J T = ( T p ) h
Equation (2) shows the thermodynamic differential equation of specific enthalpy. Since the enthalpy value remains constant during the adiabatic throttling process, when d h = 0 , Equation (3) can be derived. Combined with the definition of the μ J T Equation (1), the expression of the μ J T (4) can be derived.
d h = c p , r e a l d T + [ V T ( V T ) p ] dp
c p , r e a l d T h = [ T ( V T ) p V ] d p h
μ J T = ( T p ) h = 1 C p , r e a l [ T ( V T ) p V ]
In Equation (2), h represents the enthalpy of the gas, with the unit of J.
According to the relevant derivations of engineering thermodynamics, there is:
( v T ) p ( T p ) V ( p v ) T = 1
Equation (6) is obtained by substituting Equation (5) into the μ J T , expressed in Equation (4):
u J T = 1 C p , r e a l [ T ( p / T ) V ( p / v ) T V ]
Among them, u J T represents the μ J T , with the unit of K · M P a 1 ; C p , r e a l is regarded as the molar specific heat capacity at constant pressure of the real gas, with the unit of J · m o l 1 · K 1 ; T represents the temperature of the gas, with the unit of K; p represents gas pressure, with the unit of MPa; V represents specific volume, with the unit of m 3 · K g 1 . Z represents the compression factor; R represents the gas constant, which is 8.314 J · m o l 1 · K 1 .

3. The Derivation of μ J T for Multiple State Equations

3.1. Multiple Expressions of State Equations

Table 1 shows the 10 gas state equations used to calculate μ J T in this paper.

3.2. The Derivation of the μ J T

By calculating ( P T ) v and ( P v ) T of each state equation from Equations (7)–(16), and then combining Equations (7)–(16) with Equation (6), respectively, the μ J T expressions of these 10 equations were derived, shown in Table 2.
In this paper, the μ J T is defined as the four commonly used state equations, among them, the VDW, RK, SRK and BB.
Among them, the VDW state equation was proposed by Van der Waals in 1873 for the extension of the ideal gas state equation to describe the relationship between different state parameters of real gases [28]. It is a relatively classic state equation. Due to the accuracy limitations of the VDW state equation and the high computational complexity of some current research projects, many cubic state equations have been developed to improve the computational accuracy. Redlich and Kwong proposed the RK equation in 1949 [29]. In 1993, Soave, based on the research of Redlich and Kwong, improved the constants of the RK equation and proposed the SRK state equation [30]. The BB equation was proposed in 1928 and is a state equation based on five constants [31].

3.3. Calculation of Physical Parameters of Hydrogen

3.3.1. Calculation of Hydrogen Compression Factor and Specific Volume

According to Equation (6), it can be known that when the temperature T and pressure p of hydrogen before the throttling is determined, it is also necessary to solve the specific volume V of hydrogen and the specific heat capacity C P at constant pressure, and then the μ J T can be solved.
The specific volume V of hydrogen is the reciprocal of the density ρ of hydrogen, and the expression is as follows:
V = 1 ρ
The hydrogen density ρ is calculated as follows:
ρ = M p Z R T
Among them, in Equation (28), Z is the compressibility factor of hydrogen, and the calculation formula is as shown in Equation (29) [32]:
Z = i = 1 6 j = 1 4 ν i j p i 1 ( 100 T ) j 1        
In Equation (28), is the density of hydrogen gas, with the unit of k g / m 3 ; M is the molar mass of a hydrogen molecule, with the unit of g / m o l ; Z is the hydrogen compression factor; R is the gas constant; ν i j is a constant, and its values are shown in Table 3.

3.3.2. The Actual Molar Specific Heat Capacity of Hydrogen at Constant Pressure

The specific heat capacity C p , r e a l of the actual gas at constant pressure is both a function of temperature and pressure, which consists of two parts: the specific heat capacity ( C p , i d e a l ) of an ideal gas and the residual specific heat capacity ( Δ C p ). In this paper, the calculation formula of the residual specific heat capacity ( Δ C p ) is derived by using the residual enthalpy ( H R ) of the state equation [33].
C p , r e a l = C p , i d e a l + Δ C p
H R = p 0 p V T ( V T ) p T d p = p V R T + V V T p T V p v d V
Δ C p = H R T p = H R T V + H R V T H R T p
By combining (31), (32), and (7)–(9) in Table 1, the calculation formulas for the remaining specific heat capacity ( Δ C p ) derived, respectively, according to the VDW equation, the RK equation and the SRK equation can be obtained as follows [33].
VDW : Δ C p = R R T V 3 2 a ( V b ) 1
RK : Δ C P = 0.75 a b T 1.5 l n ( 1 + b V ) R + T R V b + 0.5 a T 1.5 V ( V + b ) 2 R T ( V b ) 2 a ( 2 v + b ) T 0.5 V 2 ( V + b ) 2
SRK : Δ C p = T b d 2 a d T 2 l n ( 1 + b V ) R + T R V b + d a / d T V ( V + b ) 2 R T ( V b ) 2 a ( 2 v + b ) V 2 ( V + b ) 2
The formula for calculating the heat capacity of an ideal gas at a constant pressure is shown in Equation (36) [33], and the parameters are presented in Table 4.
C p , i d e a l = C 1 + C 2 C 3 T / s i n h C 3 T 2 + C 4 C 5 T / c o s h C 5 T 2 1000

4. Results and Analysis

4.1. Analysis of Calculation Errors of Four State Equations

In this paper, the four state equations of VDW, RK, SRK and BB are selected for the calculation error analysis. Due to the relatively limited direct experimental data on the μ J T of hydrogen at present, an effective calculation error analysis cannot be carried out. Therefore, the JT coefficient of the NIST database is selected for the calculation error analysis in this paper. The data range exported by NIST is as follows: temperature 273.15 to 313.15 K, with a temperature step of 1; pressure 5 to 90 MPa, with a pressure step of 2.
By comparing the numerical differences between μ J T V D W and μ J T N I S T through Table 5, the Joule-Thomson coefficients of hydrogen in the VDW equation under different pressures are analyzed. In the low-pressure area (0.1–2 MPa), μ J T V D W gradually decreased from −0.24346 to −0.305945, μ J T N I S T only dropped from −0.2994 to −0.30851, and Δ μ J T was relatively small, within 0.05594. In the high-pressure area (p > 2 MPa), μ J T V D W decreased to −0.539488, μ J T N I S T dropped to −0.35342, and Δ μ J T reached a maximum of 0.186068 (p = 10 MPa).
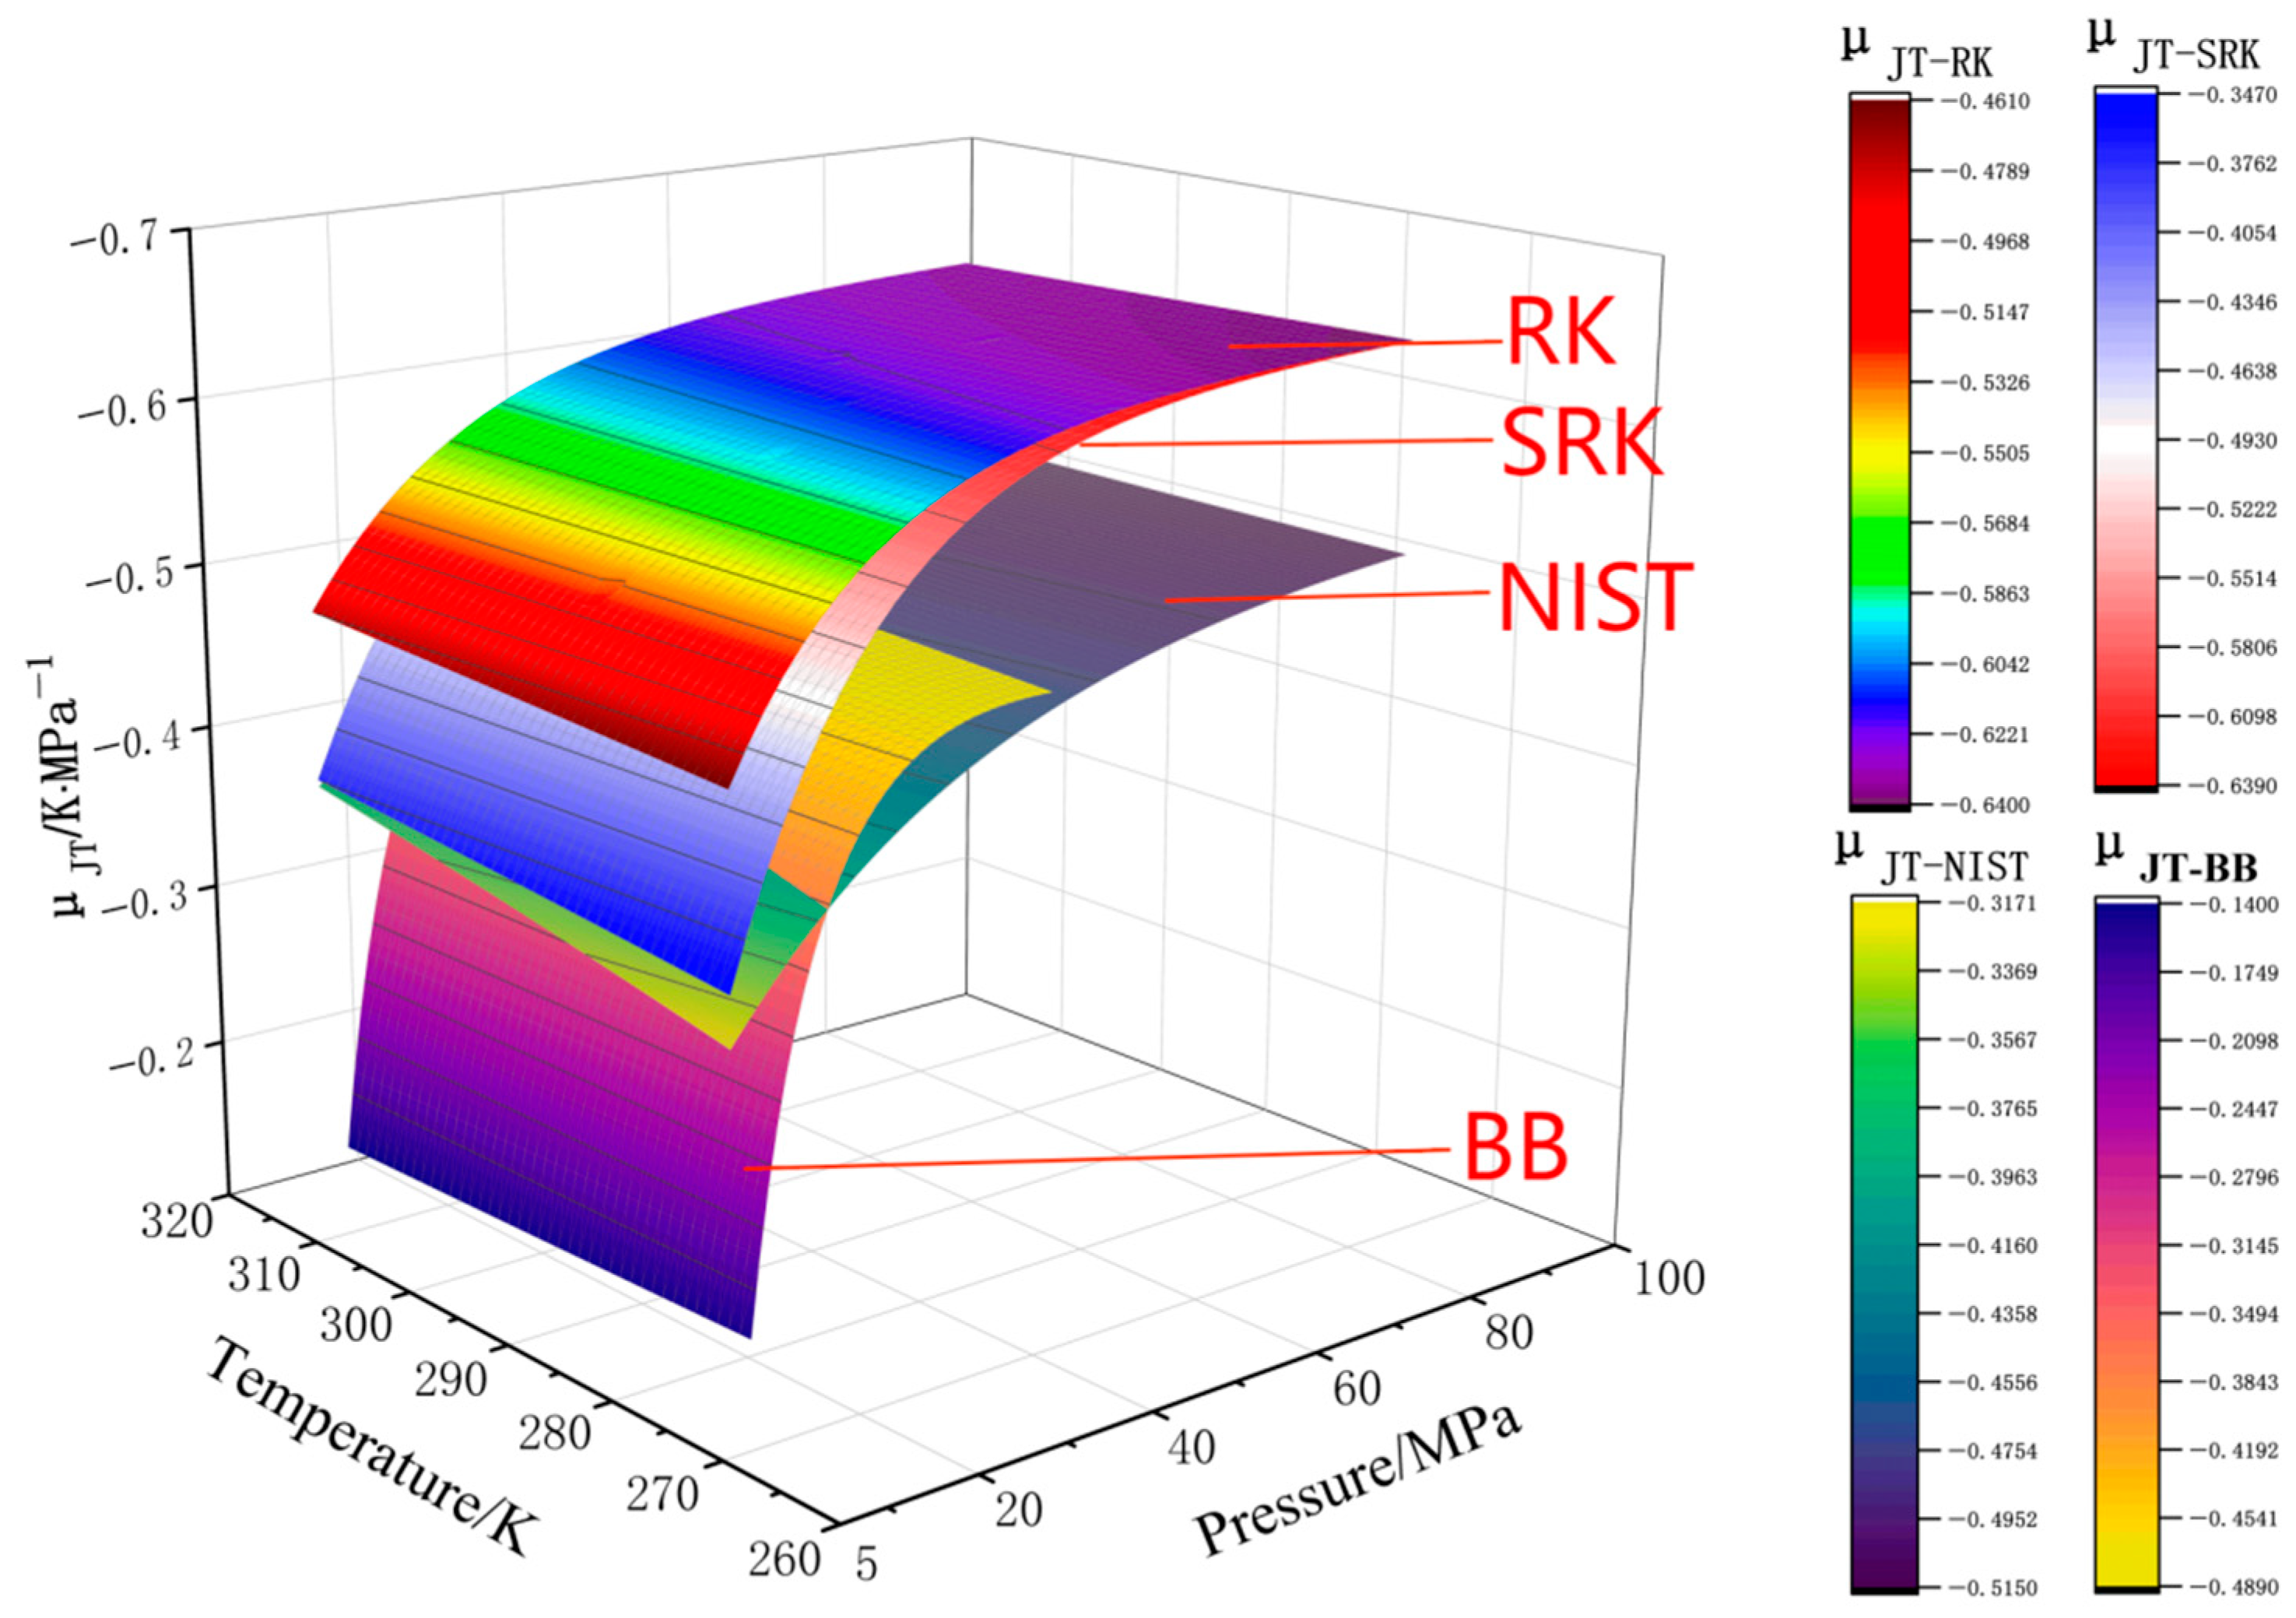
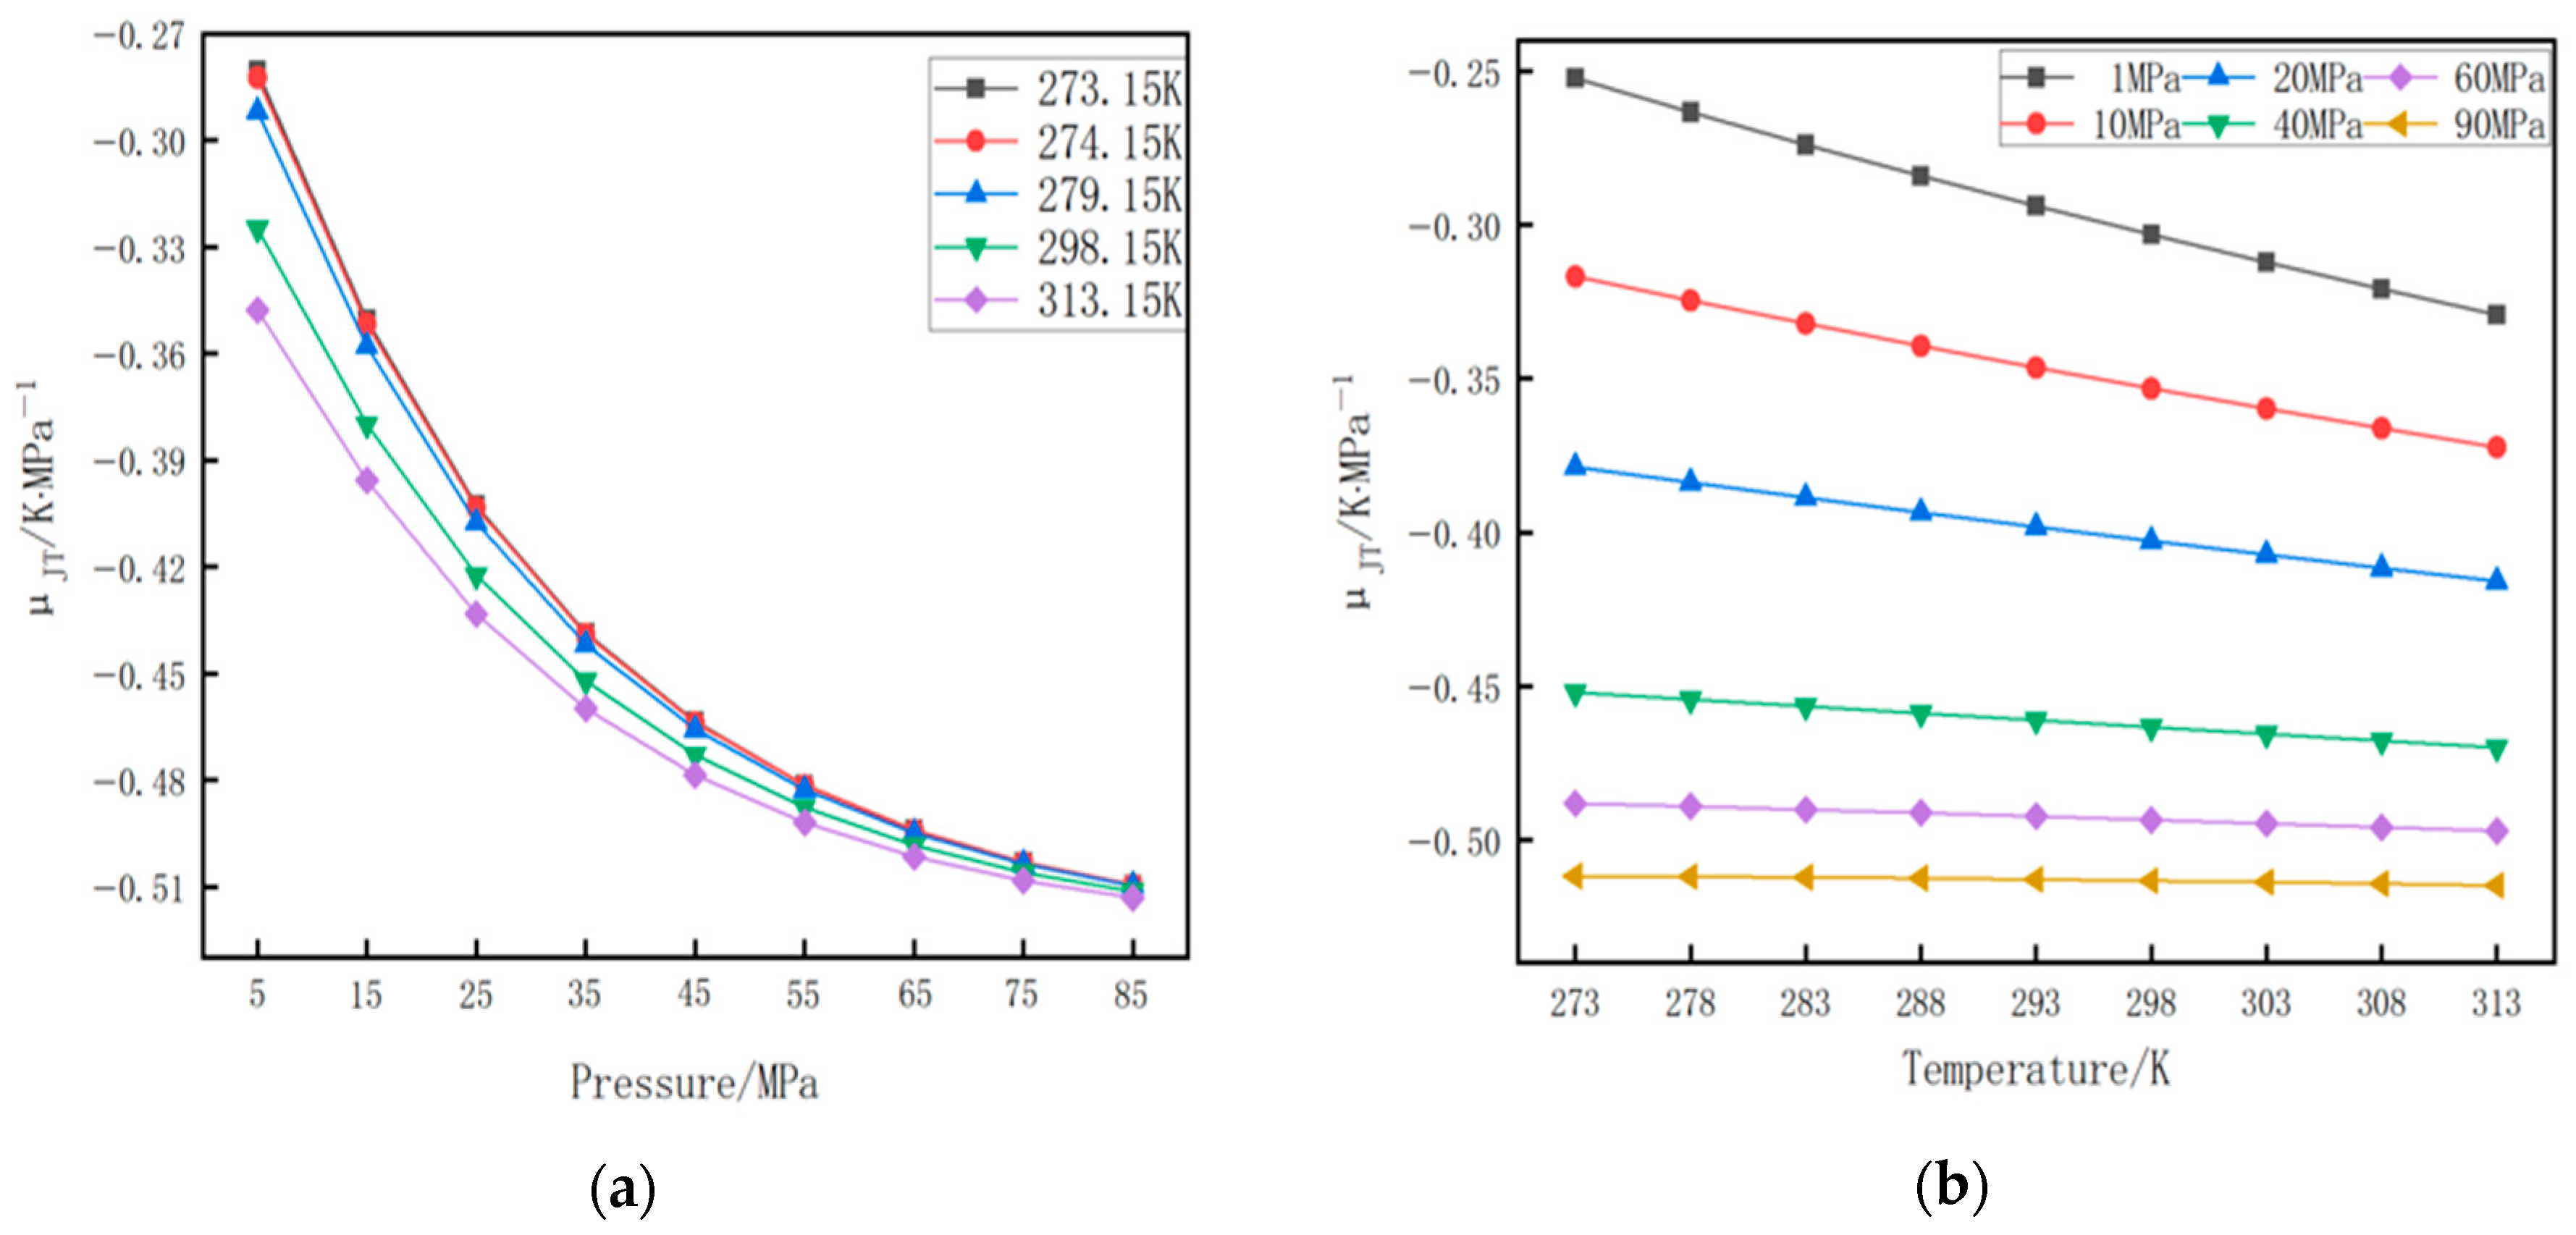
As is clear from Figure 2, the μ J T of hydrogen is both a function of temperature T and pressure P. As can be seen from Figure 3, when the temperature remains constant and the pressure increases, the μ J T changes are significant, while when the pressure remains constant and the temperature increases, the change is not obvious. Therefore, the μ J T is greatly affected by pressure. This paper conducts a relative analysis of the μ J T of the three state equations, RK, SRK, and BB, with those of the NIST database. Firstly, the changing trends of the μ J T values from the RK and SRK equations are roughly the same as those of NIST, and the changing trend of RK compared with SRK is highly consistent with that of NIST. The variation trend of BB’s μ J T under lower pressure conditions differs greatly from that of NIST. With the increase in pressure, BB’s μ J T decreases rapidly, and its change rate is much greater than that of the data of RK, SRK and NIST. However, it can be clearly seen from the figure that at a lower pressure, the μ J T of the BB equation has a smaller and smaller error with the NIST as the pressure increases until, under the condition of a pressure range of 20–46 MPa, the μ J T of BB matches the NIST data. It is worth mentioning that before 20 MPa, the JT surface of BB was located below the JI curve of NIST, that is, the μ J T calculated by the BB equation was greater than the NIST data. After 20 MPa, the JT surfaces of the three state equations RK, SRK and BB are above the NIST data, that is, the μ J T calculated values by the three equations are less than the NIST data. The calculation error of the BB equation is the smallest, that of RK is the largest, and that of SRK is between the two. It can be known from Equation (1) that when μ J T is larger, the temperature transformation amplitude resulting from the same pressure is greater. When μ J T < 0, the temperature rises after throttling. Therefore, before the pressure of 20 MPa, the hydrogen temperature changes in the RK and SRK state equations are greater than those in NIST, while the BB equation is the opposite, and the temperature change amplitude caused by it is smaller than that of the NIST data. This indicates that under pressure conditions lower than 20 MPa, the RK and SRK state equations have a certain overestimation in predicting the temperature changes caused by the JT effect of hydrogen, that is, the calculated throttling temperature is greater than the calculation result of NIST, while the BB equation has a certain underestimation, that is, the calculated throttling temperature is less than the calculation result of NIST.
Figure 4 shows the relative errors of the μ J T of the three state equations RK, SRK and BB with the NIST data. It can be obtained from Figure 4 that the BB equation has the highest calculation accuracy, and its calculation error is between 1.2 ×   10 5   K · M P a 1 and 0.241156 K · M P a 1 . Another important aspect is for the SRK state equation, for which the calculation error range is from 0.00392 K · M P a 1 to 0.143916 K · M P a 1 . The poorest accuracy is in the RK equation, whose calculation error ranges from 0.106537 K · M P a 1 to 0.167157 K · M P a 1 . In the BB equation, the calculation error is the largest below 20 MPa. For the pressure above 20 MPa, the calculation error ranges from 1.2   × 10 5   K · M P a 1 to 0.042853   K · M P a 1 , with relatively high accuracy. This indicates that the BB equation is applicable to the condition with a pressure range of 20–50 MPa. In the SRK equation, contrary to the BB equation, when the pressure range is 10–16 MPa, the calculation error is moderately small and remains within 0.082 K · M P a 1 . Under the pressure range of 16 to 90 MPa, the calculation error increases compared with the former, and the maximum increase is 0.143916 K · M P a 1 . In the RK equation, the calculation error within the range 0.106537–0.167157   K · M P a 1 , and the difference between the maximum and minimum calculation error is only 0.06062   K · M P a 1 . This indicates that the variation trend of the μ J T in the RK equation is approximately consistent with that of NIST.

4.2. Derive the Empirical Expression About μ J T

According to the μ J T surface graph of the NIST database in Figure 2, the μ J T of hydrogen is both a quadratic function of temperature T and a quadratic function of pressure p, but it is greatly affected by pressure. The empirical form of the fitting μ J T is shown as Equation (37).
μ J T = a T 2 + b p 2 + c T + d p + e
Among them, u J T represents the μ J T , with the unit of K · M P a 1 ; T represents the temperature of hydrogen gas, with the unit of K; p represents the hydrogen pressure, with the unit of MPa; a, b, c, d and e are the five constants of the empirical Equation (37) derived. In the previous research, it was found that the three state equations RK, SRK and BB have very high calculation accuracy under specific temperature and pressure conditions. Therefore, in this study, the μ J T data with the smallest calculation error was selected from the calculation data of these three state equations to fit the required empirical formula. In this study, the calculation data of the BB state equation under the pressure conditions of 20–46 MPa and the calculation data of the SRK state equation under the pressure conditions of 10–20 MPa and 46–90 MPa were selected. The values of these five constants were fitted, as shown in Table 6.
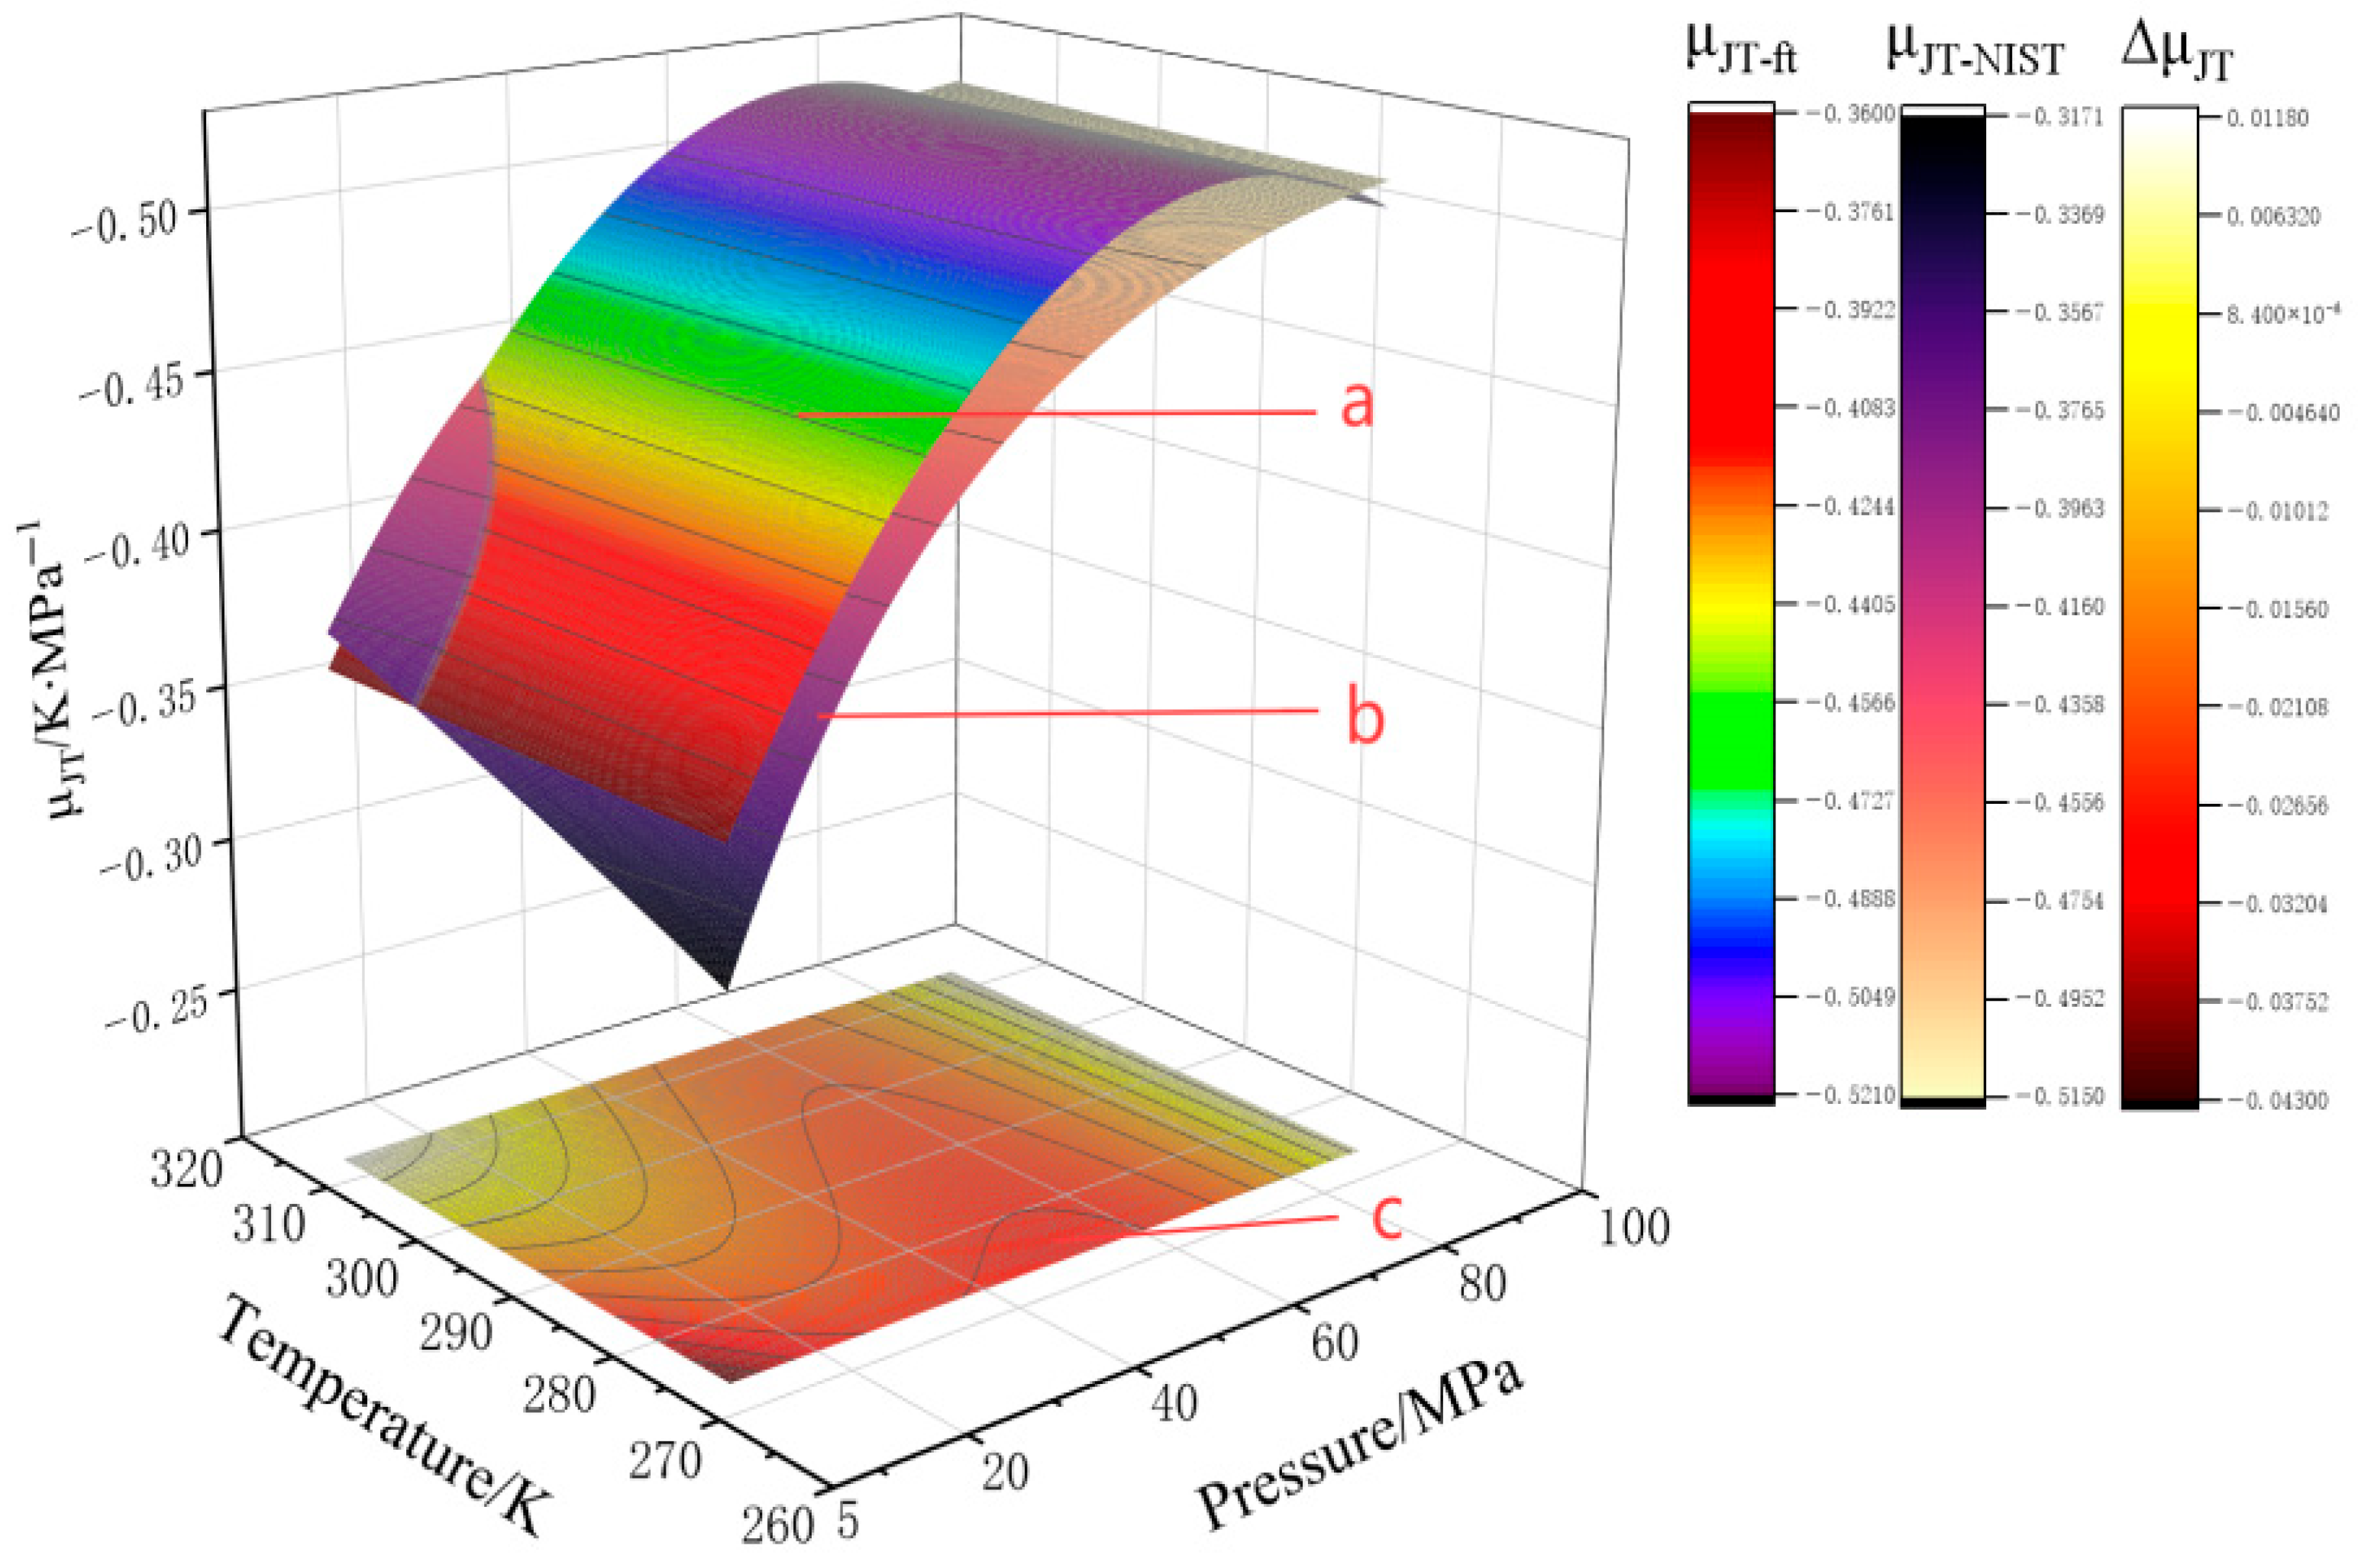
In Figure 5, surface a represents the μ J T of the empirical Formula (37), surface b represents the μ J T exported from the NIST database, and the bottom plane c represents the difference between the two ( Δ μ J T ), which is equal to the μ J T of the empirical formula minus the μ J T .
It is apparent from Figure 5 that the fitting empirical Formula (37) has a better fitting effect with the μ J T of the NIST database. The maximum fitting error is 9.52%, and the maximum value of Δ μ J T occurs at the pressure extent of 10–15 MPa and the temperature extent of 273.15–280 K. When the pressure conditions are between 10 and 30 MPa and the temperature conditions are between 300 K and 313.15 K, the empirical formula of fitting is basically at the bottom of the NIST database. This indicates that compared with the calculation data of NIST, the empirical formula of fitting is relatively low in calculating the temperature after hydrogen throttling and has a certain degree of underestimation.

4.3. Calculation of Throttling Temperature Rise

It can be known from the JT definition that the temperature change in the adiabatic process of hydrogen is only affected by temperature and pressure. In the process of calculating u J T , this paper adopts the empirical formula method with higher accuracy. The calculation formula for the temperature rise of adiabatic throttling expansion of high-pressure hydrogen is shown in Equation (38).
Δ T = T 1 T 0 = P 0 P 1 μ J T d p
Among them, T 1 represents the temperature of hydrogen after throttling, with the unit of K; T 0 is the temperature of hydrogen before throttling, with the unit of K; p 1 represents the pressure after hydrogen throttling, with the unit being MPa. p 0 represents the pressure of hydrogen before throttling, with the unit being MPa.
To confirm the exactness of the empirical Formula (38) derived above in the JT effect of hydrogen, this paper compares the experimental data in the reference [33]. The pressure before throttling of the experimental data is 22–87.5 MPa, the temperature before throttling is 285.15–303.15 K, and the pressure after throttling is 5–15 MPa. The theoretical temperature rise Δ T was calculated by using the empirical formula u J T to derive Formula (37) and the throttling temperature rise calculation Formula (38). In addition, the relative error with the experimental data was calculated as well.
It is apparent from the data in Table 7 that under different pressure and temperature conditions, the relative error between the calculated values of the empirical formula and the experimental values is generally small. When p 0 = 40 MPa, T 0 = 292.15 K, and p 1   = 15 MPa, the relative error is only 0.22%, indicating that this formula has high calculation accuracy in most scenarios. However, in a few working conditions, there are cases where the relative error is relatively large. When p 0 = 40 MPa, T 0 = 285.15 K, and p 1 = 7.5 MPa, the relative error reaches −3.65%. This might be due to the actual physical properties of hydrogen under this working condition deviating from the applicable range of the empirical formula, or there being certain errors in the experimental measurement. Further verification through experiments or more complex state equations is required. With the increase of the pressure p 0 before throttling (from 22 MPa to 87.5 MPa), the relative error between the calculated value and the experimental value did not show a significant increasing or decreasing trend, indicating that the formula has certain adaptability to the high-pressure range. When the temperature T 0 before throttling varies within the range of 285.15–303.15 K, the fluctuation of the relative error is small, indicating that the formula is not sensitive to the temperature change in the normal temperature range. When the pressure p1 after throttling increases from 5 MPa to 15 MPa, the relative error in most working conditions is relatively small, less than 2.3%, indicating that the formula has good robustness for different throttling degrees.

5. Conclusions

In this paper, the μ J T of hydrogen was calculated through four state equations of VDW, RK, SRK and BB, compared with the NIST database, and the throttling temperature rise of hydrogen was calculated by the empirical formula method. The following conclusions were obtained:
(1) In this paper, the μ J T expressions of 10 state equations are derived, and the μ J T of the four state equations, VDW, RK, SRK and BB, are calculated. It is concluded that the difference between the μ J T of the VDW state equation under low pressure and NIST is the minimum within 0.056 K · M P a 1 . The RK equation is most similar in describing the overall variation trend of the μ J T with pressure. The BB equation is more applicable within the pressure range of 20–50 MPa, with a maximum error of 0.042853 K · M P a 1 . The SRK equation has a maximum error of 0.143916 K · M P a 1 .
(2) In this paper, the μ J T equation regarding the quadratic function relationship between pressure and temperature under the states of pressure ranging from 10 to 90 MPa and temperature ranging from 273.15 to 313.15 K was fitted by using empirical formulas, and the maximum error was calculated to be 9.52%.
(3) Through theoretical derivation and comparison with experimental data, this paper verifies the accuracy of the temperature increase calculation formula in the calculation of the temperature rise of adiabatic throttling expansion of high-pressure hydrogen. The results show that the calculated values of this formula are in great agreement with the experimental values under most working states, and the maximum relative error is less than 4%, which can meet the requirements of engineering applications. For a few working conditions with large errors, it is necessary to combine more precise state equations or supplement experimental data for further optimization. This research provides certain calculation method references for the design and operation of high-pressure hydrogen systems.

6. Future and Outlook

Hereafter, research can be deepened in the forthcoming directions: (1) Improve the correlation coefficient of the RK equation to make the calculated μ J T closer to the NIST database; (2) Integrate the research results into the hydrogen energy system design software to facilitate engineering applications.
The model and method established in this study can provide theoretical references for the design of the pressure regulation system of a 70 MPa hydrogen fuel cell vehicle hydrogen refueling station, and offer important theoretical support for the safety optimization of hydrogen energy infrastructure.

Supplementary Materials

The following supporting information can be downloaded at: https://www.mdpi.com/article/10.3390/en18174573/s1, File S1: BB equation calculation data; File S2: Data calculated by the RK equation; File S3: Data used for fitting empirical formulas; File S4: NIST database data and fitting result data; File S5: SRK equation calculation data [Data].

Author Contributions

Conceptualization, J.-Q.L. and J.-T.K.; methodology, J.-Q.L. and J.-T.K.; software, M.-Y.Z. and Y.F.; validation, Q.-H.W., M.-Y.Z. and Y.F.; formal analysis, Z.-H.L., Y.-M.D., M.-Y.Z. and Y.F.; investigation, Q.-H.W. and Z.-H.L.; resources, J.-Q.L. and J.-T.K.; data curation, M.-Y.Z. and Y.F.; writing—original draft preparation, Y.-M.D., M.-Y.Z. and Y.F.; writing—review and editing, Y.-M.D., J.-Q.L. and J.-T.K.; visualization, Q.-H.W.; supervision, Q.-H.W. and Z.-H.L.; project administration, J.-Q.L. and J.-T.K.; funding acquisition, J.-Q.L. and J.-T.K. All authors have read and agreed to the published version of the manuscript.

Funding

This paper was supported by Korea Institute for Advancement of Technology (KIAT) grant funded by the Korea Government (MOTIE) (RS-2025-02263458), HRD Program for Industrial Innovation and Ludong University (20220035).

Data Availability Statement

The original contributions presented in this study are included in the article/Supplementary Materials.

Acknowledgments

This research is also the result of receiving the support for the 2025 college student’s innovation and entrepreneurship training program project (Project Name: Study and Development of Core Components for Hydrogen Circulation System in Fuel Cells and Safety Synergistic Optimization), China.

Conflicts of Interest

The authors declare no conflicts of interest.

Appendix A

Table A1. Parameters of the first four state equations.
Equationab
VDW 27 R 2 T c 2 64 p c R T c 8 p c
RK 0.42748 R 2 T c 2.5 p c T c 2.5 0.08664 R T c 8 p c
SRK 0.42748 R 2 T c 2 p c 1 + m ( 1 T r 0.5 ) 2
m = 0.480 + 1.574 w + 0.176 w 2
0.08664 R T c 8 p c
PR 0.45724 R 2 T c 2 p c 1 + k ( 1 T r 0.5 ) 2
k = 0.3746 + 1.54226 w 0.26992 w 2
0.0778 R T c 8 p c
In Table A1, T c represents the critical temperature, with the unit of K; p c represents the critical pressure, with the unit of MPa; T r stands for Reduce Temperature. On the critical parameters and eccentricity factors of hydrogen, T c = 33.19   K , p c = 1.32   M P a , w = 0.215 .
In the PT equation, a(T) is a function of temperature T, as shown in Equation (A1); b is a constant, and the calculation formula is shown as Equation (A2).
a ( T ) = Ω a α ( T ) R 2 T c 2 / p c α ( T ) = [ 1 + F ( 1 T r 0.5 ) ] 2
b = Ω b R T c / p c
Ω a = 3 ζ c 2 + 3 ( 1 2 ζ c ) Ω b + Ω b 2 + 1 3 ζ c
Ω b 3 + ( 2 3 ζ c ) Ω b 2 + 3 ζ c 2 Ω b ζ c 3   =   0
Ω c = 1 3 ζ c
In the NB equation of state, α ( T ) is a function of temperature T, and a C and b are constants. The calculation formula is as follows:
a C = 0.421875 R 2 T C 2 p C
b = 0.079246 R T C p C
α ( T r ) = { b 1 T r + b 2 T r 2 + b 3 T r 3 ,   T r > 1 [ 1 + m ( 1 T r 0.5 ) ] 2 ,   T r 1
b 1 = 0.25 ( 12 11 m + m 2 ) b 2 = 0.5 ( 6 + 9 m m 2 ) b 3 = 0.25 ( 4 + 7 m + m 2 )
m = 0.4857 + 1.6308 w 0.2089 w 2
In the HK equation of state,
a = α ( T r ) Ω a R 2 T c 2 p c Ω a = 1 3 ξ + 3 ξ 2 + β ξ ( 3 6 ξ + β ξ ) α ( T r ) = ( 1 + A ( 1 T r ) B ( 1 1 T r ) ) 2 ω 0.2 A = 0.5 + 0.27767 ω + 2.17225 ω 2 B = 0.022 + 0.338 ω 0.845 ω 2 ω 0.2 A = 0.41311 + 1.14657 ω B = 0.0118
b = Ω b R T c p c Ω b = β ξ ; β = 0.107700 + 0.76405 ξ 1.24282 ξ 2 + 0.96210 ξ 3
c = 1 + 1 3 ξ β ξ
ξ = 0.3211 0.08 ω 0.0384 ω 2
In the BB equation, A = A 0 ( 1 a V ) ,   B = B 0 ( 1 b V ) . Among them, A 0 , a, B 0 , b and c these five parameters are all constants, and their values are shown in Table A2.
Table A2. Parameters in the BB equation.
GAS A 0 a B 0 b c
H 2 20.0117−0.005060.02096−0.04359504
In the Virial equation, a ( T ) and b(T) are virial coefficients and are functions of temperature T.
In the BWR equation, the eight parameters a, A 0 , b, B 0 , c, C 0 ,   α and γ are all empirical parameters.

References

  1. Naseem, K.; Khalid, F.; Fei, Q.; Suo, G.; Khan, A.A.; Jabeen, T.; Karamat, S.; Shah, B.A. Role of carbon-based materials to promote the hydrolysis performance of magnesium-based materials. Renew. Sustain. Energy Rev. 2025, 219, 115864. [Google Scholar] [CrossRef]
  2. Wang, J.; Cui, X.; Geng, H.; She, H.; Chang, Z. Performance prediction of a distributed Joule-Thomson effect cooler with pillars. Appl. Therm. Eng. 2023, 218, 119265. [Google Scholar] [CrossRef]
  3. Geng, H.; Cui, X.; Weng, J.; She, H.; Wang, W. Review of experimental research on Joule–Thomson cryogenic refrigeration system. Appl. Therm. Eng. 2019, 157, 113640. [Google Scholar] [CrossRef]
  4. Naseem, K.; Qin, F.; Suo, G.; Ahmed, S.; Hanif, M.; Gilani, N. Recent progress of mechanically activated Mg-based materials to promote hydrogen generation via hydrolysis. Fuel 2025, 391, 134783. [Google Scholar] [CrossRef]
  5. Su, Y.; Lv, H.; Liu, D.; Zhang, C. The effects of different hydrogen incident angles on the temperature rise of the Type IV tanks for fuel cell passenger cars. Process Saf. Environ. Prot. 2025, 199, 107285. [Google Scholar] [CrossRef]
  6. Li, J.Q.; Chen, Y.; Ma, Y.B.; Kwon, J.T.; Xu, H.; Li, J.C. A study on the Joule-Thomson effect of during filling hydrogen in high pressure tank. Case Stud. Therm. Eng. 2023, 41, 102678. [Google Scholar] [CrossRef]
  7. Kumar, N.; Singh, D.; Verma, S.; Paul, A.R.; Tolj, I. Numerical study of Joule-Thomson effect for high-pressure hydrogen injection. Int. J. Hydrog. Energy 2025, 138, 595–604. [Google Scholar] [CrossRef]
  8. Liu, C.; Xue, D.; Li, W.; Yu, L.-J.; Zhao, J.; Yang, J.-Y.; Jin, Z.-J.; Chen, D.-Y.; Qian, J.-Y. Dynamic behavior and Joule-Thomson characteristics analysis on flow limiter inside hydrogen On Tank Valve for hydrogen fuel cell vehicles. Int. J. Hydrogen Energy 2025, 123, 162–172. [Google Scholar] [CrossRef]
  9. Li, Z.; Zhang, C.; Li, C.; Wu, X.; Xie, H.; Jiang, L. Thermodynamic evaluation of the effects of hydrogen blending on the Joule-Thomson characteristics of hydrogen-blended natural gas. J. Clean. Prod. 2023, 406, 137074. [Google Scholar] [CrossRef]
  10. Zhang, C.; Li, Z.; Li, C.; Wu, X.; Sun, L.; Chen, C. Insight into the effects of hydrogen on inside-valve flow and Joule-Thomson characteristics of hydrogen-blended natural gas: A numerical study. Int. J. Hydrogen Energy 2024, 49, 1056–1074. [Google Scholar] [CrossRef]
  11. Chen, J.; Veenstra, M.; Purewal, J.; Hobein, B.; Papasavva, S. Modeling a hydrogen pressure regulator in a fuel cell system with Joule–Thomson effect. Int. J. Hydrogen Energy 2019, 44, 1272–1287. [Google Scholar] [CrossRef]
  12. Tiuman, E.T.; Pereira, M.V.R.; Neto, M.A.M.; Bertoldi, D.; Morales, R.E.M. Predictions of the Joule-Thomson coefficients and inversion curves from the CPA equation of state. J. Supercrit. Fluids 2021, 168, 105077. [Google Scholar] [CrossRef]
  13. Pakravesh, A.; Zarei, H. Prediction of Joule–Thomson coefficients and inversion curves of natural gas by various equations of state. Cryogenics 2021, 118, 103350. [Google Scholar] [CrossRef]
  14. Rößler, J.; Antolović, I.; Stephan, S.; Vrabec, J. Assessment of thermodynamic models via Joule–Thomson inversion. Fluid Phase Equilibria 2022, 556, 113401. [Google Scholar] [CrossRef]
  15. Shoghl, S.N.; Naderifar, A.; Farhadi, F.; Pazuki, G. Comparing the predictive ability of two-and three-parameter cubic equations of state in calculating specific heat capacity, Joule–Thomson coefficient, inversion curve and outlet temperature from Joule–Thomson valve. Cryogenics 2021, 116, 103288. [Google Scholar] [CrossRef]
  16. Huang, H.; Li, J.; Sun, X.; Yu, B.; Wang, X.; Wang, N.; Ma, L. Adaptability Study of Gas Equations of State for the Calculation of Thermophysical Parameters of Hydrogen-Blended Natural Gas. J. Pipeline Sci. Eng. 2025, 100313. [Google Scholar] [CrossRef]
  17. Wang, J.; Ouyang, X.; Cheng, L.; Peng, S.; Wang, Z.; Wang, J. Investigation on adaptability of physical property state equation model for hydrogen-blended natural gas. Int. J. Hydrogen Energy 2024, 81, 1256–1277. [Google Scholar] [CrossRef]
  18. Alanazi, A.; Bawazeer, S.; Ali, M.; Keshavarz, A.; Hoteit, H. Thermodynamic modeling of hydrogen–water systems with gas impurity at various conditions using cubic and PC-SAFT equations of state. Energy Convers. Manag. X 2022, 15, 100257. [Google Scholar] [CrossRef]
  19. Wu, S.; Zhao, B.; Tan, J.; Zhao, Y.; Zhai, Y.; Xue, R.; Tan, H.; Ma, D.; Wu, D.; Dang, H. Thermodynamic study on throttling process of Joule-Thomson cooler to improve helium liquefaction performance between 2 K and 4 K. Energy 2023, 277, 127691. [Google Scholar] [CrossRef]
  20. Chen, S.; Qiu, C.; Shen, Y.; Tao, X.; Zhang, Z.; Wan, A.; Gan, Z. Experimental and dynamic simulation study of the Joule-Thomson cryocooler working at liquid hydrogen temperature. Appl. Therm. Eng. 2023, 235, 121285. [Google Scholar] [CrossRef]
  21. Ariadji, T.; Adisasmito, S.; Mucharam, L.; Abdassah, D. Improved Joule Thomson equation of supercritical CO2-rich natural gas in separation system. Nat. Gas Ind. B 2023, 10, 245–253. [Google Scholar] [CrossRef]
  22. Zhang, X.; Yang, L.; Wang, Y.; Shang, X.; Bao, W.; Li, Z.; Shao, C.; Cui, Z. Cryogenic helium flow in adiabatic capillary tubes: Numerical insights into choked flow and superfluid behavior in Joule-Thomson cryocoolers. Cryogenics 2025, 147, 104043. [Google Scholar] [CrossRef]
  23. Wang, Y.; Zhao, Y.; Wang, H.; Gao, S.; Gong, M. Evaluation and analysis from pressure and component in the single-stage mixed-refrigerant Joule-Thomson cooler from 100 to 200 K. Energy 2025, 319, 135018. [Google Scholar] [CrossRef]
  24. Wang, Y.; Zhao, Y.; Sun, Y.; Wang, H.; Guo, H.; Gong, M. Optimization method for mixed refrigerants in Joule–Thomson refrigerators with fixed-temperature heat loads. Appl. Therm. Eng. 2023, 233, 121198. [Google Scholar] [CrossRef]
  25. Farzaneh-Gord, M.; Rahbari, H.R.; Zangeneh, J. Effects of natural gas compositions on its Joule–Thomson coefficients and Joule–Thomson inversion curves. Cryogenics 2020, 111, 103169. [Google Scholar] [CrossRef]
  26. Hosseini, A.; Khoshsima, A. Evaluation of translated-consistent equations of state compared for the prediction of the Joule–Thomson effect at high pressures and high temperatures. Fluid Phase Equilibria 2020, 523, 112775. [Google Scholar] [CrossRef]
  27. Tada, K. The full range Joule-Thomson inversion curve of helium-3. Int. J. Refrig. 2021, 127, 157–164. [Google Scholar] [CrossRef]
  28. Soave, G. Improvement of the van der Waals equation of state. Chem. Eng. Sci. 1984, 39, 357–369. [Google Scholar] [CrossRef]
  29. Redlich, O.; Kwong, J.N.S. On the thermodynamics of solutions. V. An equation of state. Fugacities of gaseous solutions. Chem. Rev. 1949, 44, 233–244. [Google Scholar] [CrossRef]
  30. Soave, G. Improving the Treatment of Heavy Hydrocarbons by the SRK EOS. Fluid Phase Equilibria 1993, 84, 339–342. [Google Scholar] [CrossRef]
  31. Cengel, Y.A.; Boles, M.A. Thermodynamics: An engineering approach. Sea 2002, 1000, 287–293. [Google Scholar]
  32. Li, Z.; Tian, Z. Research on Throttling Effect of High-Pressure Hydrogen. China Plant Eng. 2025, S1, 138–141. [Google Scholar]
  33. Deng, C.; Song, P.; Ma, A. Analysis of Joule-Thomson effect of real gas system sealed by dry gas. CIESC J. 2016, 67, 3833. [Google Scholar]
  34. Perry, R.H. Perry’s Chemical Engineers’ Handbook, 7th ed.; McGraw-Hill: New York, NY, USA, 1997; pp. 132–182. [Google Scholar]
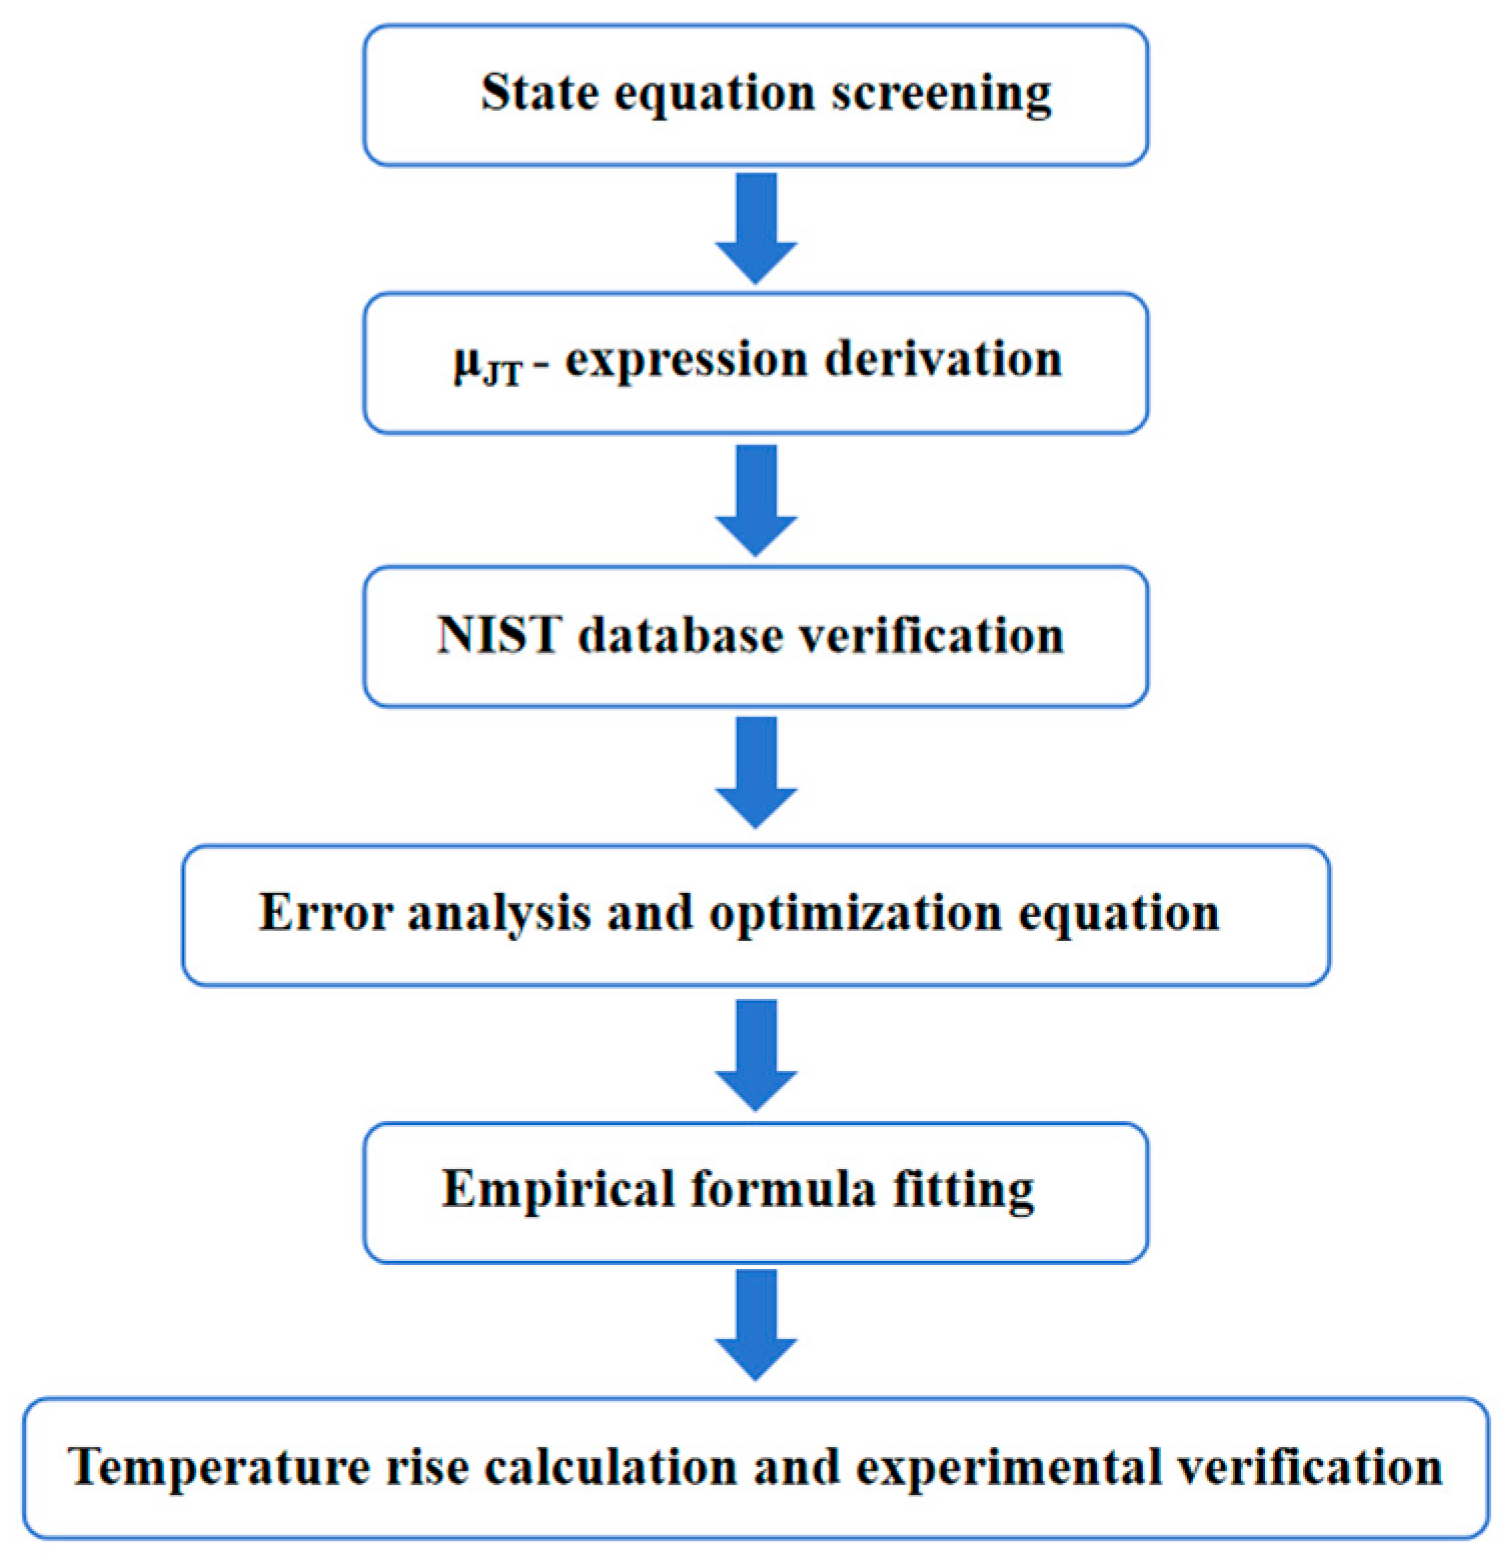
Figure 1. Schematic diagram of the research method.
Energies 18 04573 g001
Figure 2. μ J T surface plots of the RK, SRK, BB and NIST databases.
Energies 18 04573 g002
Figure 3. μ J T curve of the NIST database with constant temperature and changing pressure (a) μ J T curve of the NIST database with constant pressure and changing temperature (b).
Energies 18 04573 g003
Figure 4. The error plots of the μ J T of RK, SRK and BB and the NIST data.
Energies 18 04573 g004
Figure 5. The μ J T surface graph of the derived empirical formula (a), the μ J T surface graph of the NIST database (b), and the graph of both (c).
Energies 18 04573 g005
Table 1. Expressions of 10 state equations [Appendix A].
VDW p = R T V b a V 2 (7)
RK p = R T V b a T V V + b (8)
SRK p = R T V b a α T V V + b (9)
PR p = R T V b a α T V 2 + 2 b V b 2 (10)
PT p = R T V b a ( T ) V ( V + b ) + c ( V b ) (11)
NB p = R T V b a c α ( T ) ( V + b / 3 ) 2 (12)
HK p = R T V b a c α ( T ) V 2 + V c b ( c 1 ) b 2 (13)
BB p = R T V 2 ( 1 c V T 3 ) ( V + B ) A V 2 (14)
Virial p = R T V + a ( T ) V 2 + b ( T ) V 3 (15)
BWR p = R T V + B 0 R T A 0 C 0 T 2 1 V 2 + b R T a V 3 + a α V 6 + c V 3 T 2 ( 1 + γ V 2 ) e γ / V 2 (16)
Table 2. Expressions of μ J T for ten state equations.
State Equation μ J T  Expression
VDW 1 C p , r e a l R T V 3 V b R T V 3 2 a V b 2 V (17)
RK 1 C p , r e a l T R V 2 V + b 2 + a V V + b 2 T R T V 2 V + b 2 + a 2 V + b V b 2 V (18)
SRK 1 C p , r e a l T R V V + b α T V b R T V 2 V + b 2 + α T 2 V + b V b 2 V (19)
PR 1 C p , r e a l T R V 2 + 2 b V b 2 α T V b R T V 2 + 2 b V b 2 2 + 2 α T V + b V b 2 V (20)
PT 1 C p , r e a l [ [ ( V b ) T a ( T ) R T [ V ( V + b ) + c ( V b ) ] ] [ ( V b ) [ V ( V + b ) + c ( V b ) ] ] ( 2 V + b + c ) ( V b ) 2 R T [ V ( V + b ) + c ( V b ) ] 2 V ] (21)
NB 1 C p , r e a l [ ( V b ) a c α ( T r ) R T ( V + b / 3 ) 2 ] ( v b ) ( V + 3 ) 2 a c ( V b ) 2 α ( T r ) R T ( V b / 3 ) 3 V (22)
HK 1 C p , r e a l [ ( V b ) T a ( T ) R T [ V 2 + b c V ( c 1 ) b 2 ] ( V b ) [ V 2 + b c V ( c 1 ) b 2 ] ] ( 2 V + b c ) ( V b ) 2 a ( T ) R T [ V 2 + b c V ( c 1 ) b 2 ] 2 V (23)
BB 1 C p , r e a l R T ( V + B ) V 2 ( 1 + 2 c V T 3 ) R T V 2 2 B R T 2 C R T 2 2 A V 3 3 B C R V 4 T 2 V (24)
Virial 1 C p , r e a l V 3 + V 2 B T + V C T V 2 + 2 V B T + 3 C T V (25)
BWR 1 C p , r e a l R T V T V 2 [ B 0 R + 2 C 0 T 3 ] 6 R T V 3 + 2 C T V 3 T 3 ( 1 + γ V 2 ) e γ V 2 R T V 2 2 ( B 0 R T A 0 C 0 T 2 ) 1 V 3 + 3 ( b R T a ) V 4 + 6 a α V 7 + C V 4 T 3 ( 2 γ 2 V 4 3 3 γ V 2 ) e γ V 2 V (26)
Table 3. Calculation Coefficient of Hydrogen Compression Factor [32].
ν i j j
1234
i11.00018−0.00225460.01053−0.013205
2−0.000672910.028051−0.024126−0.0058663
30.000010817−0.000126530.000197880.00085677
4−1.4368 × 10−71.2171 × 10−67.7563 × 10⁻⁷−1.7418 × 10⁻⁵
51.2441 × 10⁻⁹−8.965 × 10⁻⁹−1.6711 × 10−81.4697 × 10−7
6−4.4709 × 10−123.0271 × 10−116.3329 × 10⁻¹¹−4.6974 × 10⁻¹⁰
Table 4. Parameters of Hydrogen Specific Heat Capacity at Constant Pressure under Ideal Conditions [34].
Gas C 1 × 10 5 C 2 × 10 5 C 3 × 10 3 C 4 × 10 5 C 5 T m i n /K T m a x /K
H 2 0.27620.09562.46600.0376567.62501500
Table 5. Comparison of the JT coefficient calculation results of the VDW state equation with NIST.
P/MPaT/K μ J T V D W μ J T N I S T Δ μ J T
0.1298.15−0.24346−0.29940.05594
0.5298.15−0.256743−0.301190.044447
1298.15−0.273245−0.303540.030295
2298.15−0.305945−0.308510.002565
4298.15−0.36966−0.319270.05039
6298.15−0.430465−0.330610.099855
8298.15−0.487648−0.342090.145558
10298.15−0.539488−0.353420.186068
Table 6. Five constants of the empirical formula for fitting.
abcde
6.67971 × 10−82.4358 × 10−5−5.774 × 10⁻⁵ 0.00615 0.29209
Table 7. Comparison Table of Throttling Temperature Rise Calculation and Experimental Results.
Pressure Before Throttling
p0/MPa
Temperature Before Throttling
T0/K
Pressure After Throttling
p1/MPa
Experimental Value
T1/K
Calculated Value
T1/K
Δ T / K Relative Error
%
22285.155286.56291.629086.479081.77%
40285.155298.54300.083814.93380.52%
40285.157.5310.57299.232314.0823−3.65%
40288.1510300.54301.346413.19640.27%
40292.1515302.81303.467311.31730.22%
60288.157.5309.73313.213725.06371.12%
60293.1510313.41317.330724.18071.25%
80287.157.5318.4324.482637.33261.91%
80297.1510326.83333.60836.4582.07%
80299.1515324.55333.728534.57852.83%
87.5287.157.5322.45329.337142.18712.14%
87.5297.1510329.54338.463841.31382.71%
87.5303.1515335.52342.589739.43972.11%
Disclaimer/Publisher’s Note: The statements, opinions and data contained in all publications are solely those of the individual author(s) and contributor(s) and not of MDPI and/or the editor(s). MDPI and/or the editor(s) disclaim responsibility for any injury to people or property resulting from any ideas, methods, instructions or products referred to in the content.