Article

Investigation of the Influence of Gyroid Lattice Dimensions on Cooling

1
Higher School of Power Engineering, Institute of Energy, Peter the Great St. Petersburg Polytechnic University, 29 Politechnicheskaya Str., St. Petersburg 195251, Russia
2
Scientific and Educational Center “Mechanical Engineering Technologies and Materials”, Institute of Mechanical Engineering, Materials and Transport, Peter the Great St. Petersburg Polytechnic University, 29 Politechnicheskaya Str., St. Petersburg 195251, Russia
3
Russian-Chinese Scientific and Educational Center “Additive Technologies”, Institute of Mechanical Engineering, Materials and Transport, Peter the Great St. Petersburg Polytechnic University, 29 Politechnicheskaya Str., St. Petersburg 195251, Russia
4
Institute of Energy, Peter the Great St. Petersburg Polytechnic University, 29 Politechnicheskaya Str., St. Petersburg 195251, Russia
5
Institute of Mechanical Engineering, Materials and Transport, Peter the Great St. Petersburg Polytechnic University, 29 Politechnicheskaya Str., St. Petersburg 195251, Russia
*
Authors to whom correspondence should be addressed.
Energies 2025, 18(17), 4552; https://doi.org/10.3390/en18174552
Submission received: 16 June 2025 / Revised: 21 July 2025 / Accepted: 20 August 2025 / Published: 27 August 2025

Abstract

This study investigates the influence of geometric parameters of a gyroid lattice structure on the thermal performance of internal cooling channels relevant to gas turbine blade design. Various gyroid configurations were analyzed using CFD simulations in ANSYS CFX to evaluate heat transfer effectiveness (Nusselt number), cooling flow penetration depth (cooling depth coefficient), and aerodynamic losses (pressure drop and drag coefficient). A series of simulations were conducted, varying lattice wall thickness, structure period, and Reynolds number, followed by the development of regression models to identify key trends. Experimental verification was carried out using 3D printed samples tested on a specially assembled aerodynamic test rig. Results confirmed the existence of an optimal lattice density, providing a favorable balance between heat transfer and pressure losses. The study highlights the high potential of gyroid TPMS structures for turbine blade cooling systems, where additive manufacturing enables complex internal geometries unattainable by traditional methods. The research demonstrates the practical feasibility and thermo-hydraulic advantages of lattice-based cooling channels and provides accurate predictive models for further optimization of turbine blade designs under high-temperature turbomachinery conditions.

1. Introduction

The development of gas turbine units (GTUs) is characterized by a stepwise improvement in technical and operational performance [1], primarily driven by the increase in gas temperature before the turbine—a key parameter determining cycle efficiency [2]. However, raising the temperature leads to higher thermal and mechanical loads on turbine blade materials [3], necessitating advancements in cooling systems [4,5]. Under these conditions, the demands on heat-resistant alloys and the internal architecture of blades increase significantly [6]. The evolution of cooling channel designs is closely linked to technological progress—particularly the use of additive manufacturing, which enables the fabrication of geometrically complex and functionally optimized structures [7,8].
In the 2010s, the first studies were published on the production of components from high-strength nickel-based superalloys with a γ′ phase based on Ni3 (Al, Ti), using selective laser melting (SLM) [9,10]. One of the key milestones was the announcement by Siemens of successful full-scale testing of the SGT-400 industrial gas turbine, in which turbine blades manufactured exclusively using SLM technology were employed.
The use of additive manufacturing methods enables the creation of not only geometrically complex but also topologically optimized structures aimed at improving cooling efficiency and mechanical reliability [11]. The ability to design internal channels with arbitrary configurations opens new opportunities for optimizing the cooling systems of gas turbine engine components [12].
Improving the efficiency of gas turbine engine cooling systems is achievable through the integration of additive manufacturing technologies, biomimetic topologies, and computational modeling methods, opening new possibilities for extending service life and enhancing overall GTE performance [13]. Additive technologies, combined with advances in biomimetics, enable the creation of designs that surpass conventional “classical” solutions currently in use [14].
Nature has skillfully and subtly optimized structures with specific configurations to meet the functional demands of living organisms [15]. Researchers leverage these principles to enhance the performance and functionality of various structures across numerous fields [16,17], including the cooling of gas turbine blades. Among porous materials, triply periodic minimal surfaces (TPMSs) have attracted particular interest. A significant number of studies have focused on investigating their thermophysical and mechanical properties. For instance, experimental results by Fangxi Ren et al. [18] demonstrate that the stiffness and strength of optimized TPMS-based samples increase by 31% and 21%, respectively, compared to a conventional lattice with a graded TPMS density.
In the study by Hussain S. et al. [19], the effectiveness of using lattice structures in gas turbine blades was investigated to achieve weight reduction and improved vibrational performance. A solid blade model was developed using the NACA 23012 airfoil (developed by NACA (now NASA), Langley Research Center located in the Hampton, VA, USA) as a reference. Three lattice-based blades were designed and fabricated via additive manufacturing by replacing the internal volume of the solid blades with octet truss elements of varying strut thickness. Experimental and computational analyses of the vibrational characteristics were performed to assess their feasibility for turbine applications. As a result, a mass reduction of 24.91% was achieved. The natural frequencies of the lattice blades were higher than those of their solid counterparts. Additionally, stress levels were reduced by up to 38.6%, and deformations decreased by 21.5% compared to traditional solid blades. The experimental and numerical results showed good agreement, with a maximum deviation in natural frequencies of 3.94%. Thus, in addition to reduced weight, lattice-based blades exhibit improved vibrational properties and lower stress levels, making them promising candidates for applications aimed at enhancing the efficiency and durability of gas turbines.
The modeling and application of triply periodic minimal surfaces (TPMSs) as cooling structures, due to their high specific surface area, enable a significant enhancement of heat transfer performance with only a moderate increase in pressure losses [20,21].
The use of TPMS structures, such as the “Diamond” configuration, offers promising opportunities for enhancing cooling efficiency in gas turbine blades [22]. In the study by Kirttayoth Yeranee et al. [23], it was demonstrated that integrating this structure into the cooling channels of the blade’s trailing edge improves heat transfer and reduces temperature gradients. In the study, the “classical” pin-fin structures were replaced with a “Diamond” TPMS structure. Compared to pin fins, this configuration enables a more uniform distribution of the coolant flow within the blade body. This approach also increases heat transfer efficiency by a factor of 1.5.
TPMSs represent a promising solution for advanced turbine blades by increasing cooling efficiency and reducing the risk of thermal damage, which is crucial for enhancing the overall reliability and performance of turbines under high-temperature conditions.
One of the most studied and promising types of TPMSs is the gyroid (Figure 1). The gyroid belongs to the family of triply periodic minimal surfaces (TPMSs) and represents a continuous, non-self-intersecting surface with zero mean curvature, free from sharp edges and discontinuities. Its analytical representation can be defined by the following equation:
sin x · cos y + sin y · cos z + sin z · cos x = 0
The gyroid exhibits high thermal and mechanical efficiency due to its optimal combination of specific surface area, uniform heat flux distribution, and inherent vibration damping capability. Despite these advantages, gyroid lattices are not currently used in industrial applications [24]. Owing to their geometric complexity, such structures can only be manufactured using additive technologies [25], particularly selective laser melting (SLM). Although the integration of TPMS geometries into real components remains at the experimental stage, they are considered promising candidates for future engineering solutions [26].
In recent years, a number of studies have demonstrated the potential of the gyroid as a heat transfer surface element. In particular, the work [27] showed that integrating gyroid structures into the heat exchanger contour can simultaneously enhance the heat transfer coefficient and reduce equivalent structural stresses by 10–20%, depending on the flow regime. Additionally, a significant increase in natural frequencies was observed, indicating improved vibration resistance characteristics.
Numerical analysis [28] demonstrated that triply periodic minimal surface (TPMS) structures, including the gyroid, exhibit significantly better thermal performance compared to conventional geometries such as cylindrical and square pin-fin arrays [29]. Specifically, under equal hydraulic losses, TPMS configurations provided higher heat transfer coefficients, with the gyroid geometry offering one of the best trade-offs between thermal efficiency and flow resistance. Moreover, TPMS structures were shown to promote uniform temperature distribution and reduce local overheating zones, which is particularly important under cyclic thermal loading. These results highlight the high potential of the gyroid as a basis for designing efficient heat transfer surfaces in geometrically constrained channels, including the cooling passages of gas turbine blades.
Despite the potential advantages of TPMS structures, including the gyroid, their integration into real turbine blade cooling systems faces several challenges: the high geometric complexity of the channels, manufacturing limitations, the lack of standardized design methodologies, and the absence of validated heat transfer models under curvilinear flow conditions.
In the present study, a simplified flow configuration in a straight cylindrical channel with a gyroid insert is considered. While this setup does not directly replicate real conditions within a turbine blade, it allows identification of key geometric parameters that affect heat transfer efficiency and pressure losses. This approach can be characterized as preliminary parametric modeling, serving as an initial source of data for subsequent research aimed at adapting TPMS structures to the operational conditions of actual gas turbine engine components.
The proposed model omits many factors typical for turbine blade cooling: the influence of rotation and centrifugal forces, the Coriolis effect, local flow distortions at channel bends, thermal interaction with the blade’s outer surface, and the unsteady nature of the thermal load. Nevertheless, due to strictly controlled conditions and independent variation of geometric parameters (such as gyroid wall thickness and lattice period), it becomes possible to conduct a systematic analysis and identify trends and empirical relationships. The resulting data may serve as a foundation for developing a library of topological configurations suitable for further multifactorial modeling under more realistic conditions, accounting for complex channel geometry, rheological effects, and manufacturing constraints.

2. Materials and Methods

In the present study, the “gyroid” structure was selected as the object of analysis due to its high specific surface area, topological continuity, and potential for application in internal cooling systems.
The aim of the study is to quantitatively assess the influence of the geometric parameters of a gyroid-type lattice structure—specifically, the periodicity and wall thickness—on heat transfer and hydraulic resistance characteristics within a cooling channel under various flow regimes.
To achieve the stated objective, the following tasks were formulated:
  • Develop geometric models of channels with integrated lattice structures of varying periodicity and wall thickness;
  • Perform numerical simulations of flow and heat transfer in the channels under different cooling flow regimes;
  • Determine key thermophysical parameters: Nusselt number, cooling depth coefficient, and hydraulic drag coefficient;
  • Conduct a comparative analysis of the performance of lattice structures relative to a smooth channel;
  • Prepare and carry out experimental studies of channel flow for verification of the numerical results.
It should be noted that due to the inability to implement controlled thermal boundary conditions in the current experimental setup, experimental validation of heat transfer was not conducted. This is a limitation of the present study and will be addressed in future research.

2.1. Numerical Simulation

For the numerical investigation of heat transfer and gas dynamics in the cooling channel, a simplified computational model was developed. All geometric models were constructed in a parametric format, allowing for variation of key structural characteristics. The simulations were carried out in ANSYS CFX 2019 R2 (calculation software developed by Ansys Inc. located in Canonsburg, PA, USA) using the finite volume method and accounted for conjugate heat transfer between the channel wall and the cooling air.
When lattice structures are integrated into the cooling system of a turbine blade, numerous unknowns arise, each influencing the target parameters of the system to varying degrees. Evaluating the impact of each parameter on the cooling efficiency of a blade using a full blade model is challenging due to the vast number of possible configurations, which would require a large volume of complex CFD simulations and significant computational resources.
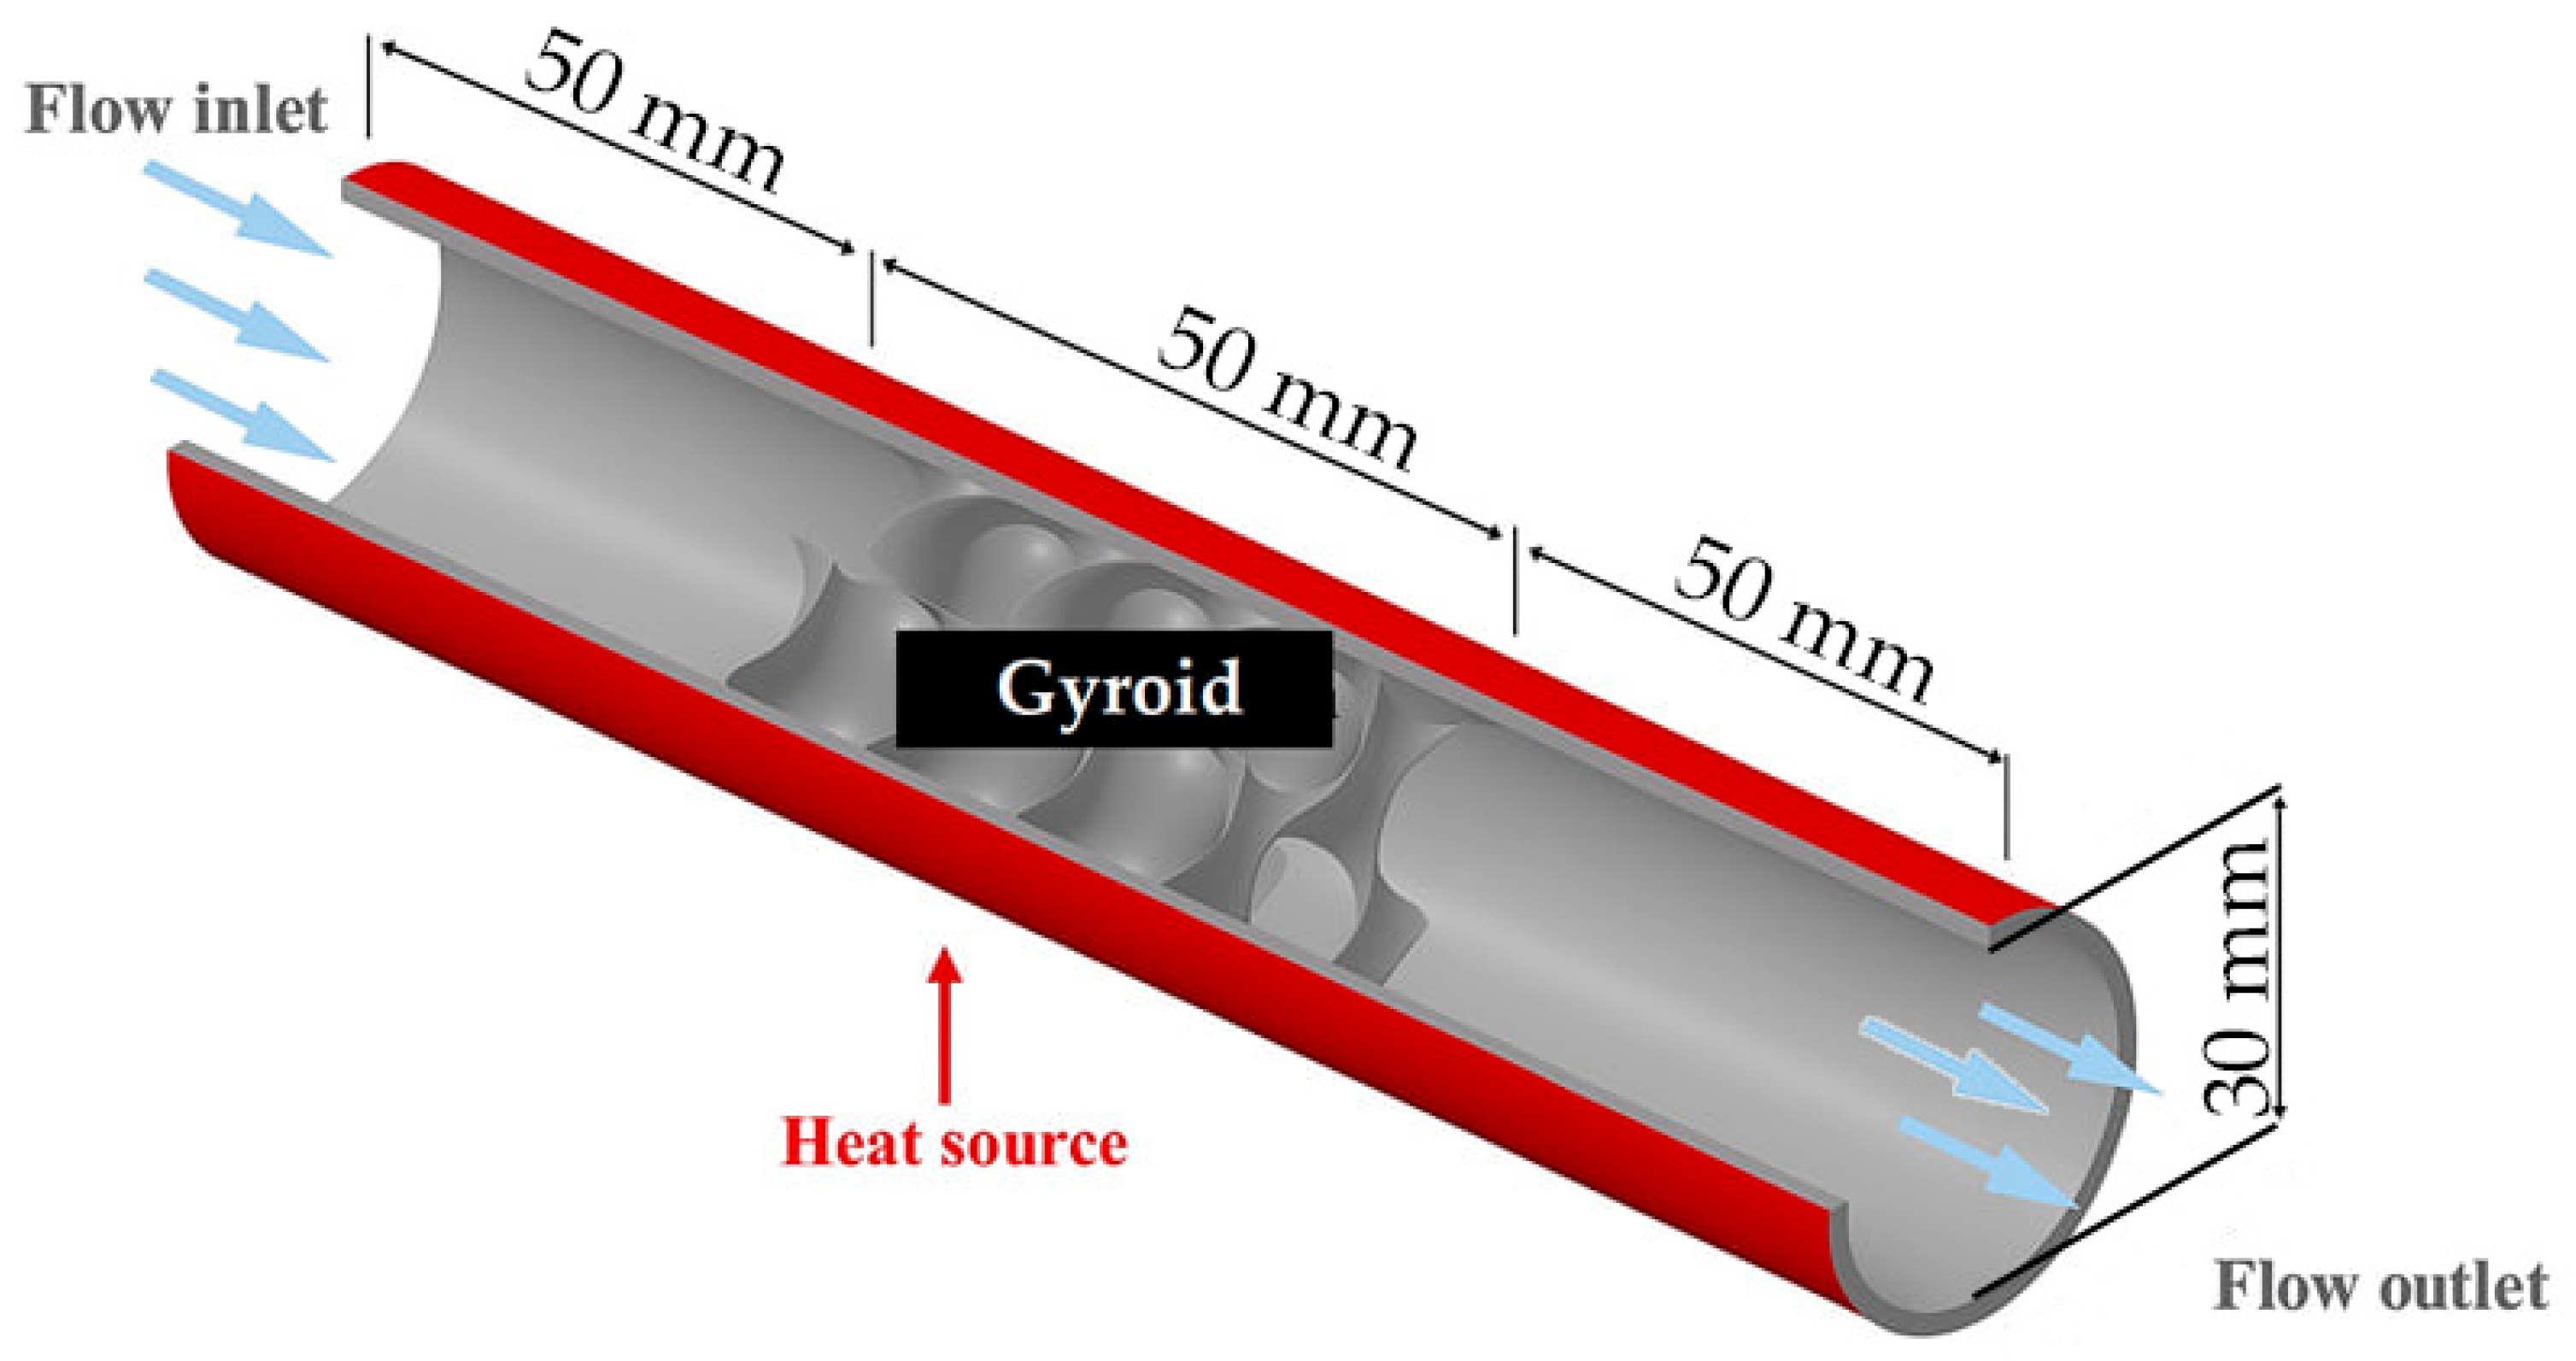
Due to the high computational cost of simulating the complete geometry, a simplified computational model was selected for the analysis. This model consists of a cylindrical channel representing a serpentine cooling passage in a turbine blade. The internal diameter of the channel is 30 mm, corresponding to typical dimensions of turbine blade cooling channels. The length of the channel section containing the lattice structure is 50 mm. Cooling air flows through the interior of the channel, while the outer surface is subjected to simulated heating from hot gases.
To obtain generalized dimensionless correlations, it is acceptable to use simplified computational models, provided that the boundary conditions remain consistent. Various lattice structures with differing parameters were embedded within the internal section of the channel. Because strong flow non-uniformities develop both upstream and downstream of these structures—and since CFD simulations involve parameter averaging at boundaries—it was decided to include smooth channel segments before and after the lattice structure. As a result, the total channel length was set to 150 mm.
Figure 2 shows the geometric layout of the cooling channel model with a gyroid lattice insert, used for numerical simulation in ANSYS CFX.
Considering the variability of geometric and flow parameters, 5 simulations were performed for the smooth channel and 60 for the gyroid lattice. The following notations were adopted for the varying parameters: s —lattice periodicity (mm); t —lattice wall thickness (mm); ν —inlet air velocity ( m s ).
The main geometric parameters of the gyroid TPMS lattice structure are the periodicity and wall thickness. In constructing the lattice structure for the study, these geometric parameters were varied. Table 1 presents the variants of the lattice models.
In addition, a smooth channel model was created to enable comparative analysis and assess the improvement in cooling system efficiency.
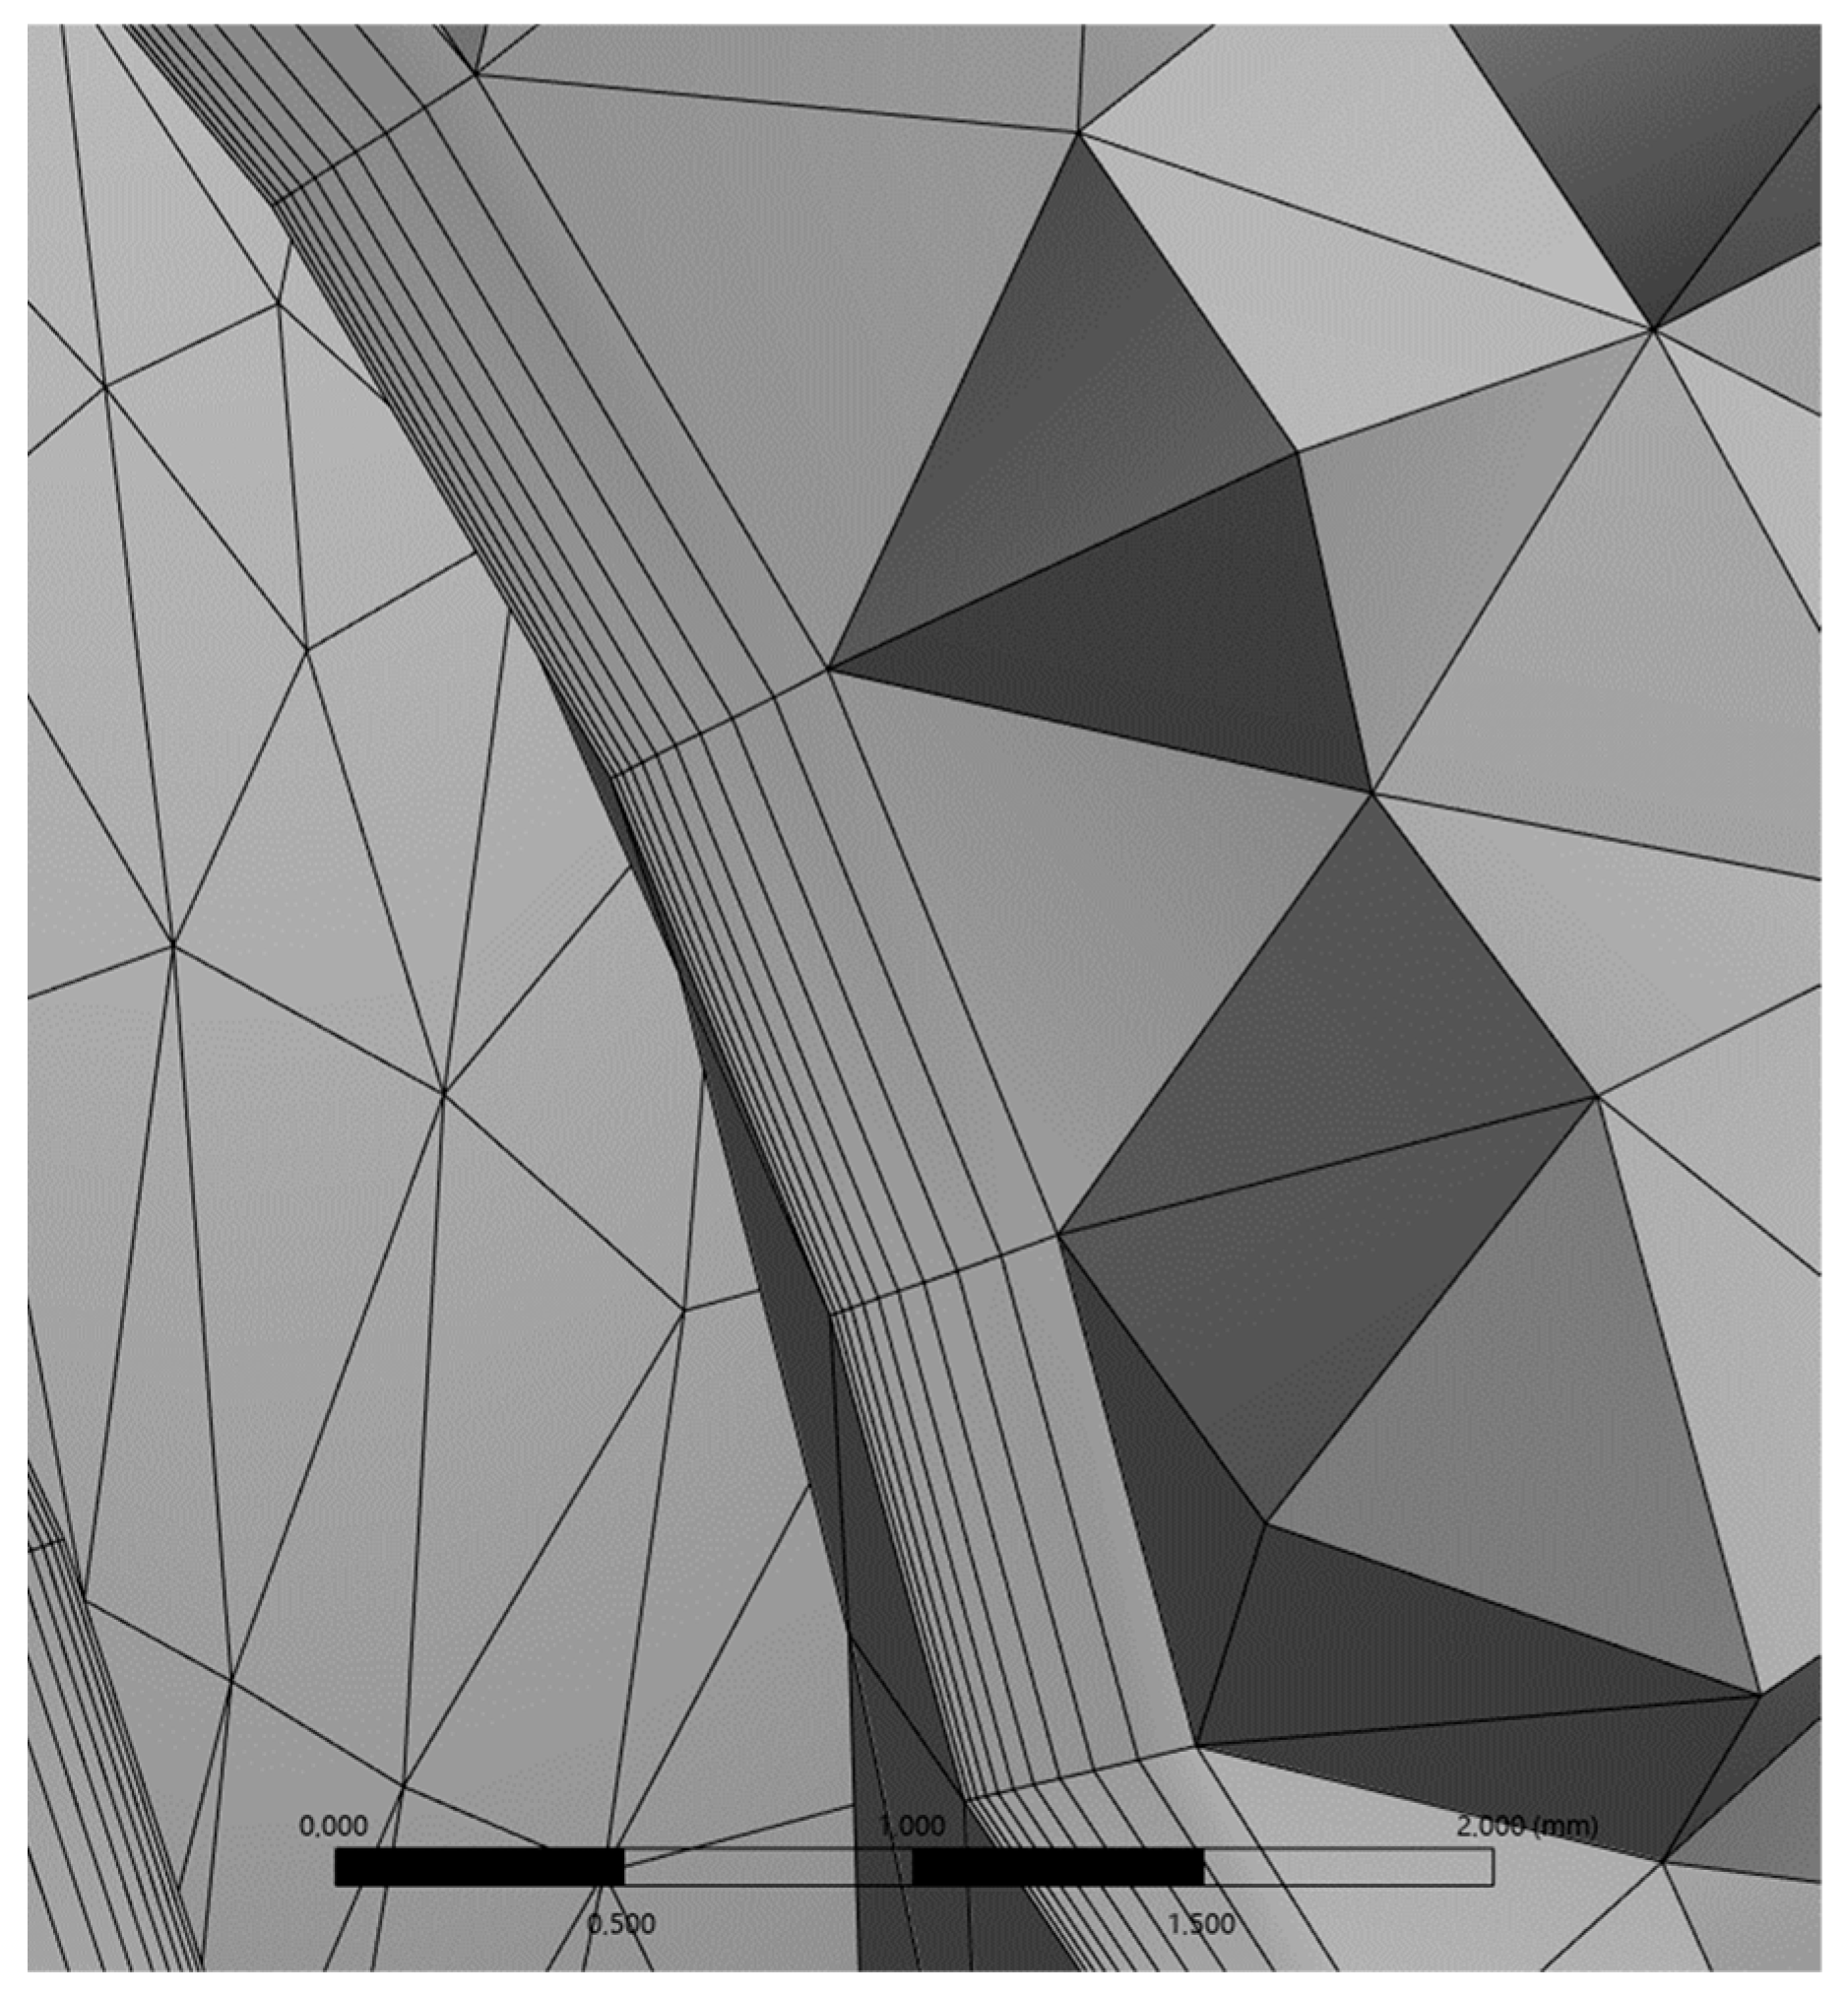
After the geometric models were created, the cooling air domain was generated by filling the internal volume of the tubes. A finite volume mesh was then constructed with refinement near the walls to accurately model the boundary layer.
The boundary layer consists of 10 layers; the growth coefficient is 1.3. The first layer is 10 microns. The appearance of the mesh is presented in Figure 3.
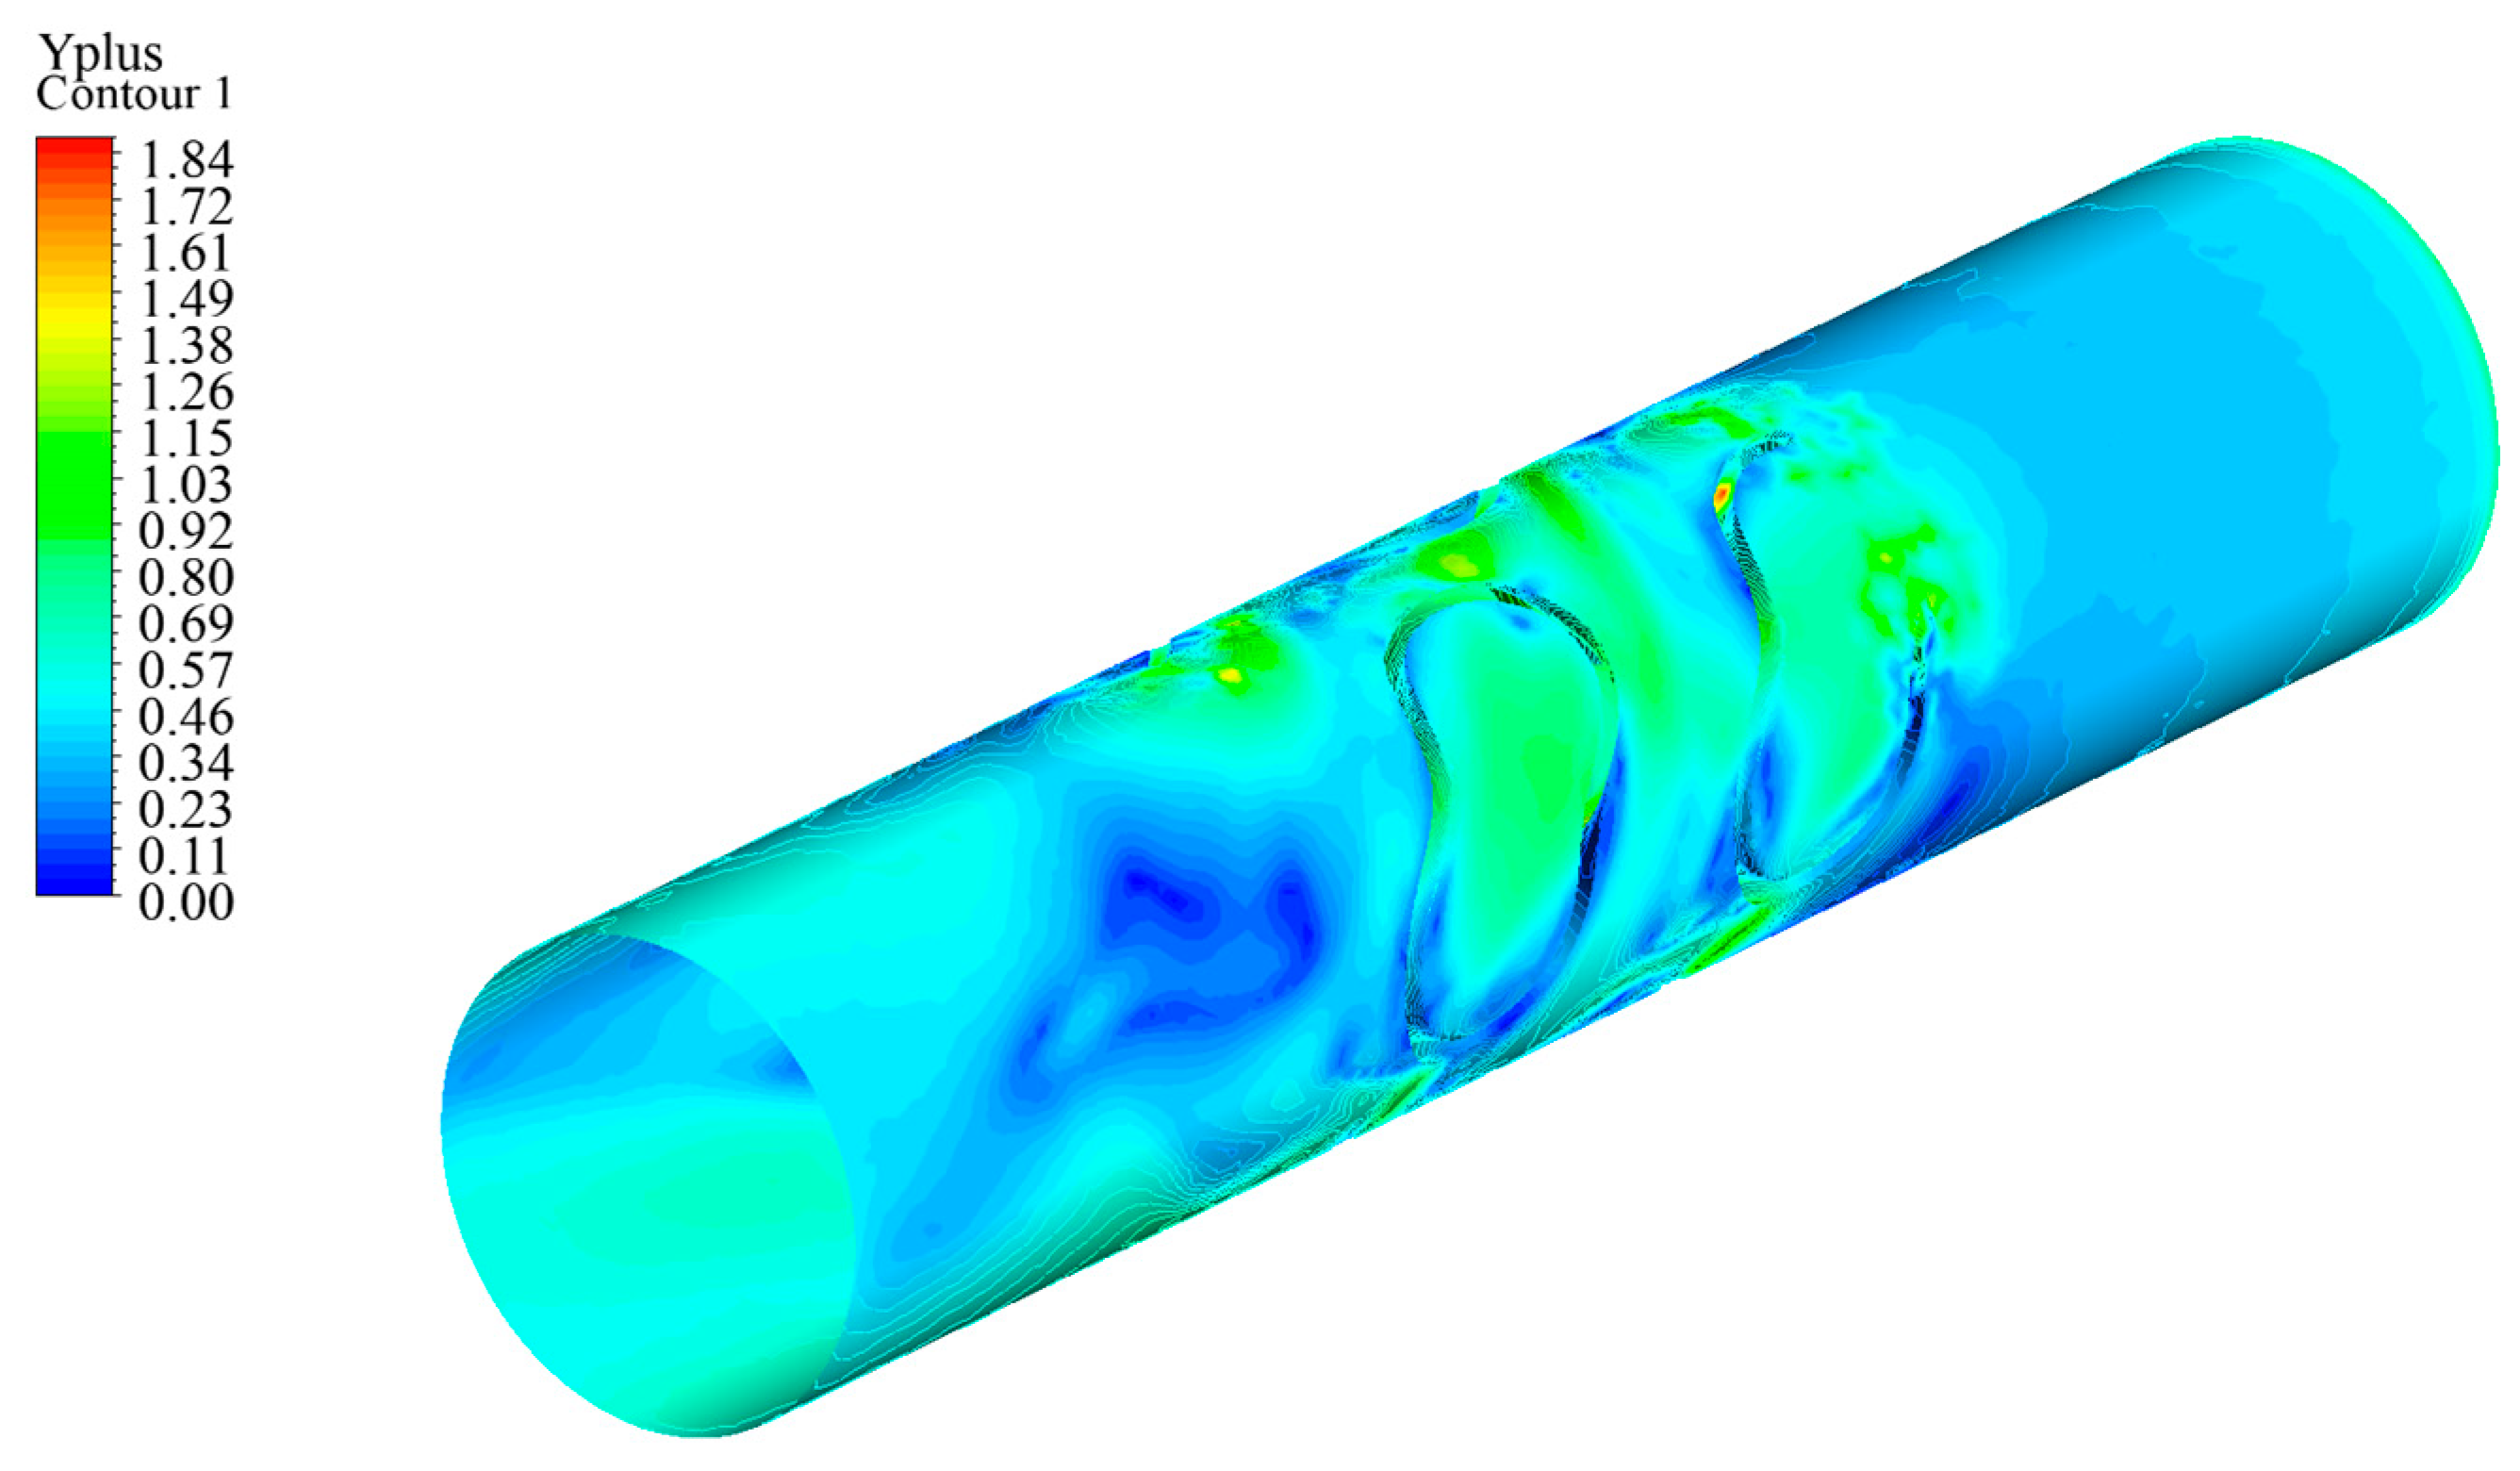
Also, when creating the mesh model, a wall layer was generated considering the settings recommended for such tasks, while considering Y + , a dimensionless parameter that characterizes the distance from the wall to the first node of the mesh in units of a viscous sublayer. This parameter plays an important role in CFD calculations, especially when modeling turbulent flows, as it determines how well the boundary layer is resolved. This parameter is defined as
Y + = y · u d v ,
where y —the distance from the wall to the first node of the mesh; u d —dynamic velocity (friction velocity); v —kinematic viscosity.
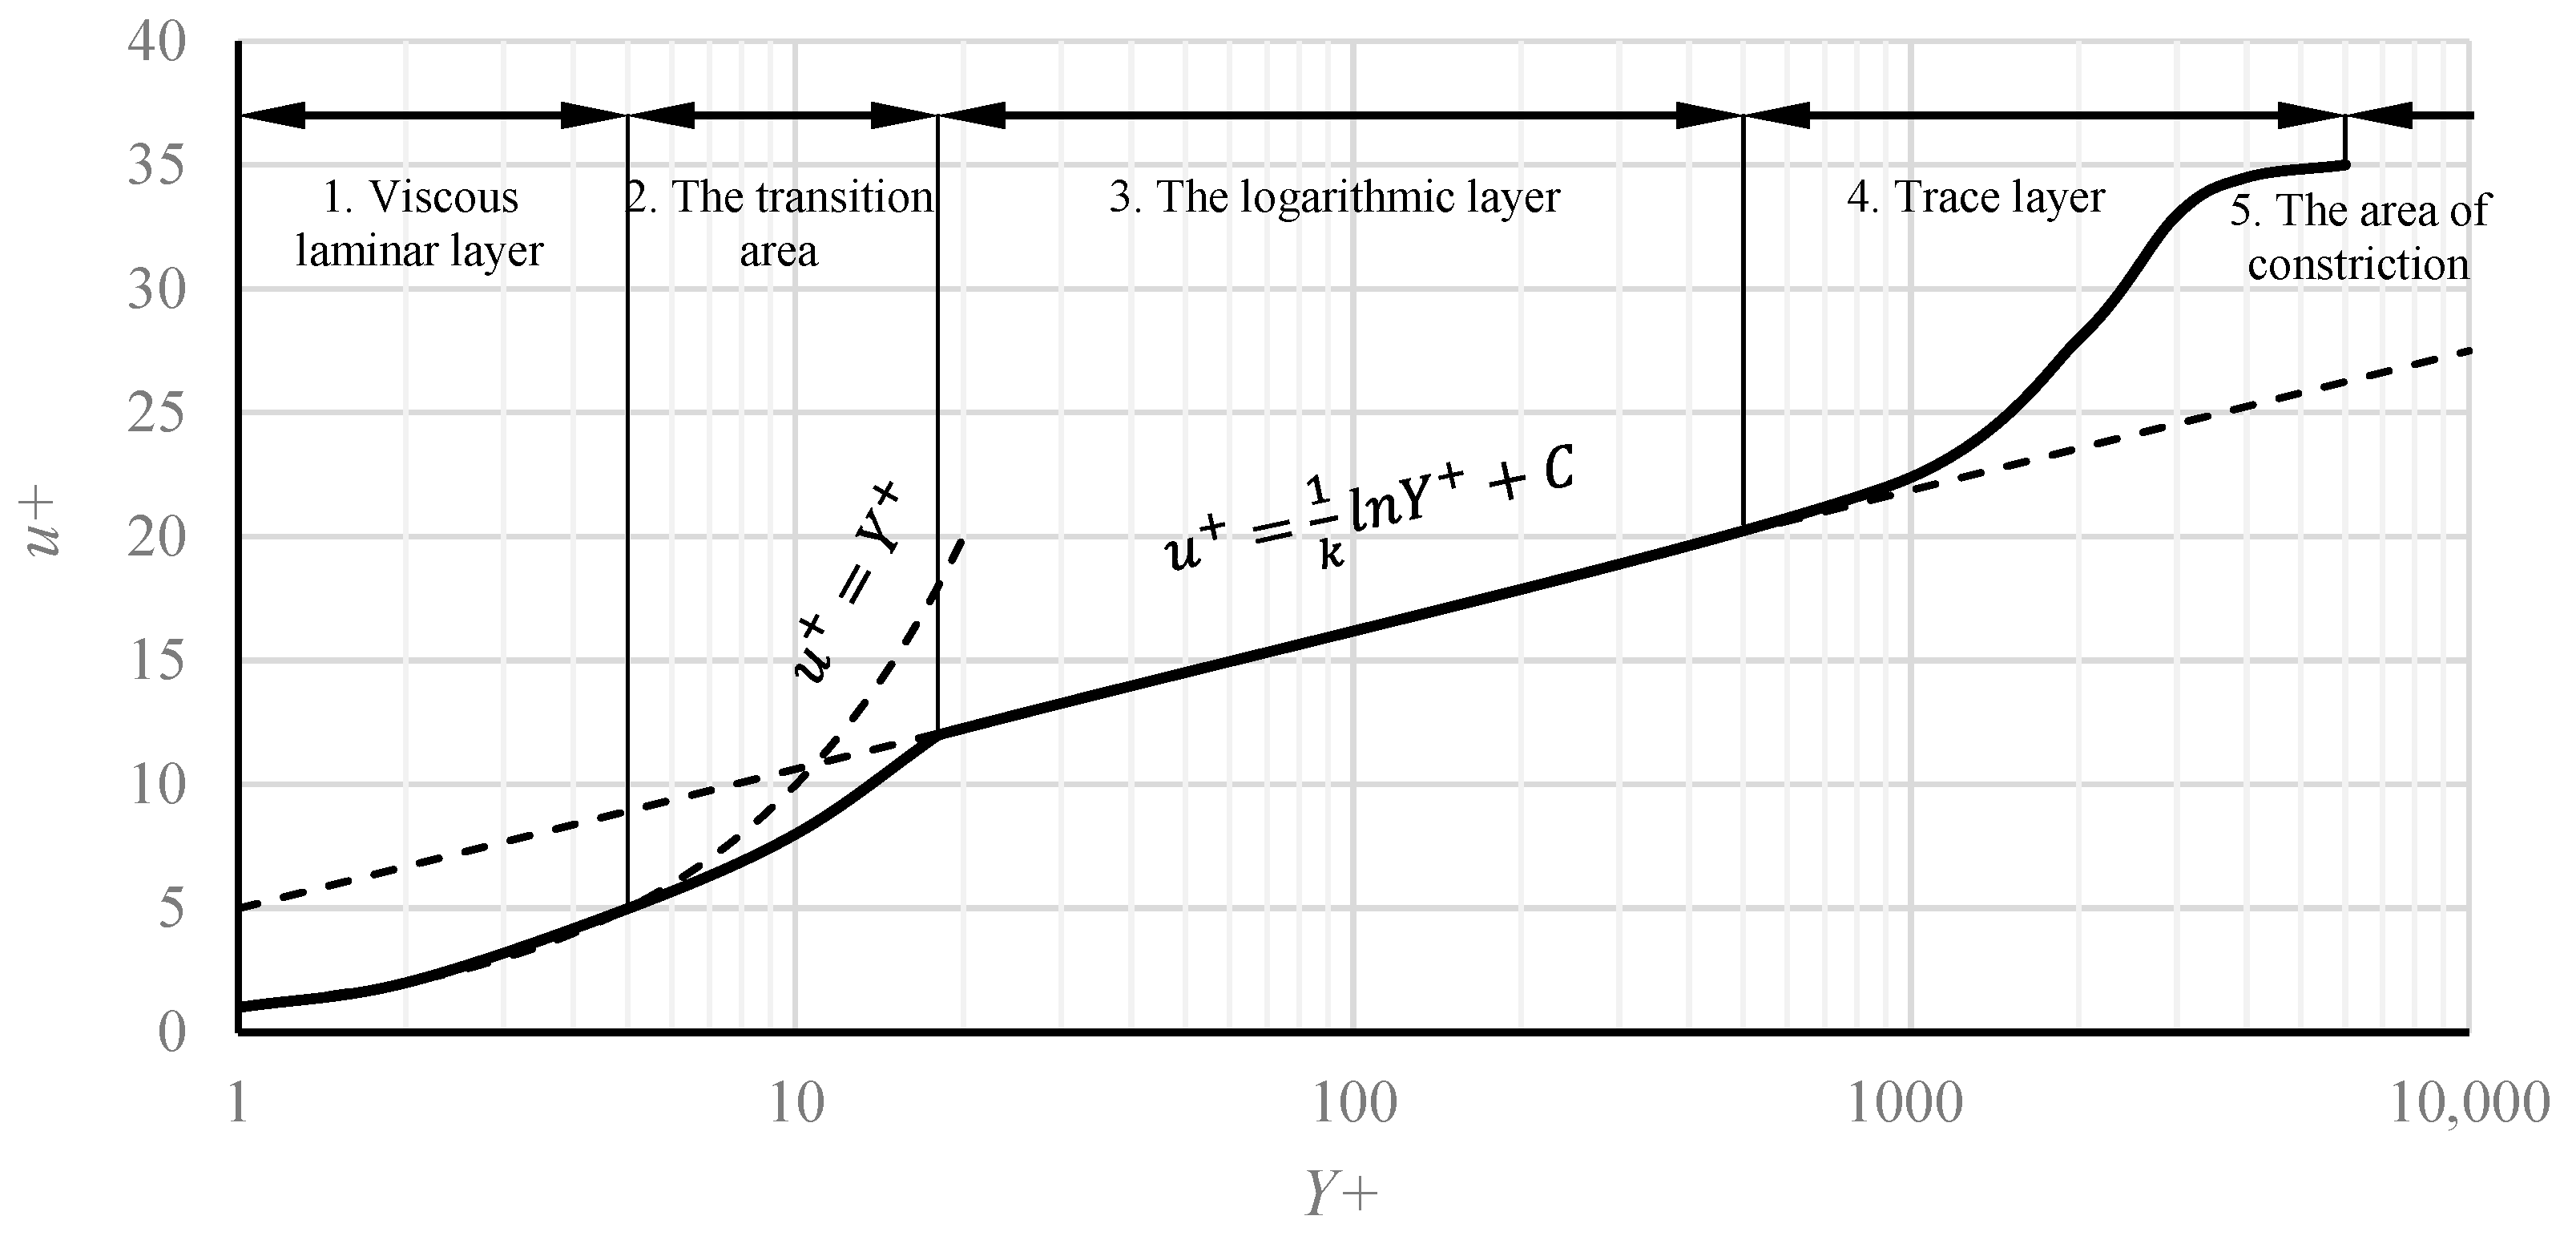
A certain value of the Y + parameter is recommended for solving CFD tasks. This parameter was checked after the calculation. For the correct and accurate calculation of the viscous flow in the flow part, it is very important to allow the flow in the wall area. Figure 4 shows a dimensionless velocity profile characteristic of fluid flow in the wall region [30].
This is how the mesh size was iteratively selected to ensure the solvability of all layers, including the viscous laminar sublayer. Figure 5 shows a Y + plot for one of the models.
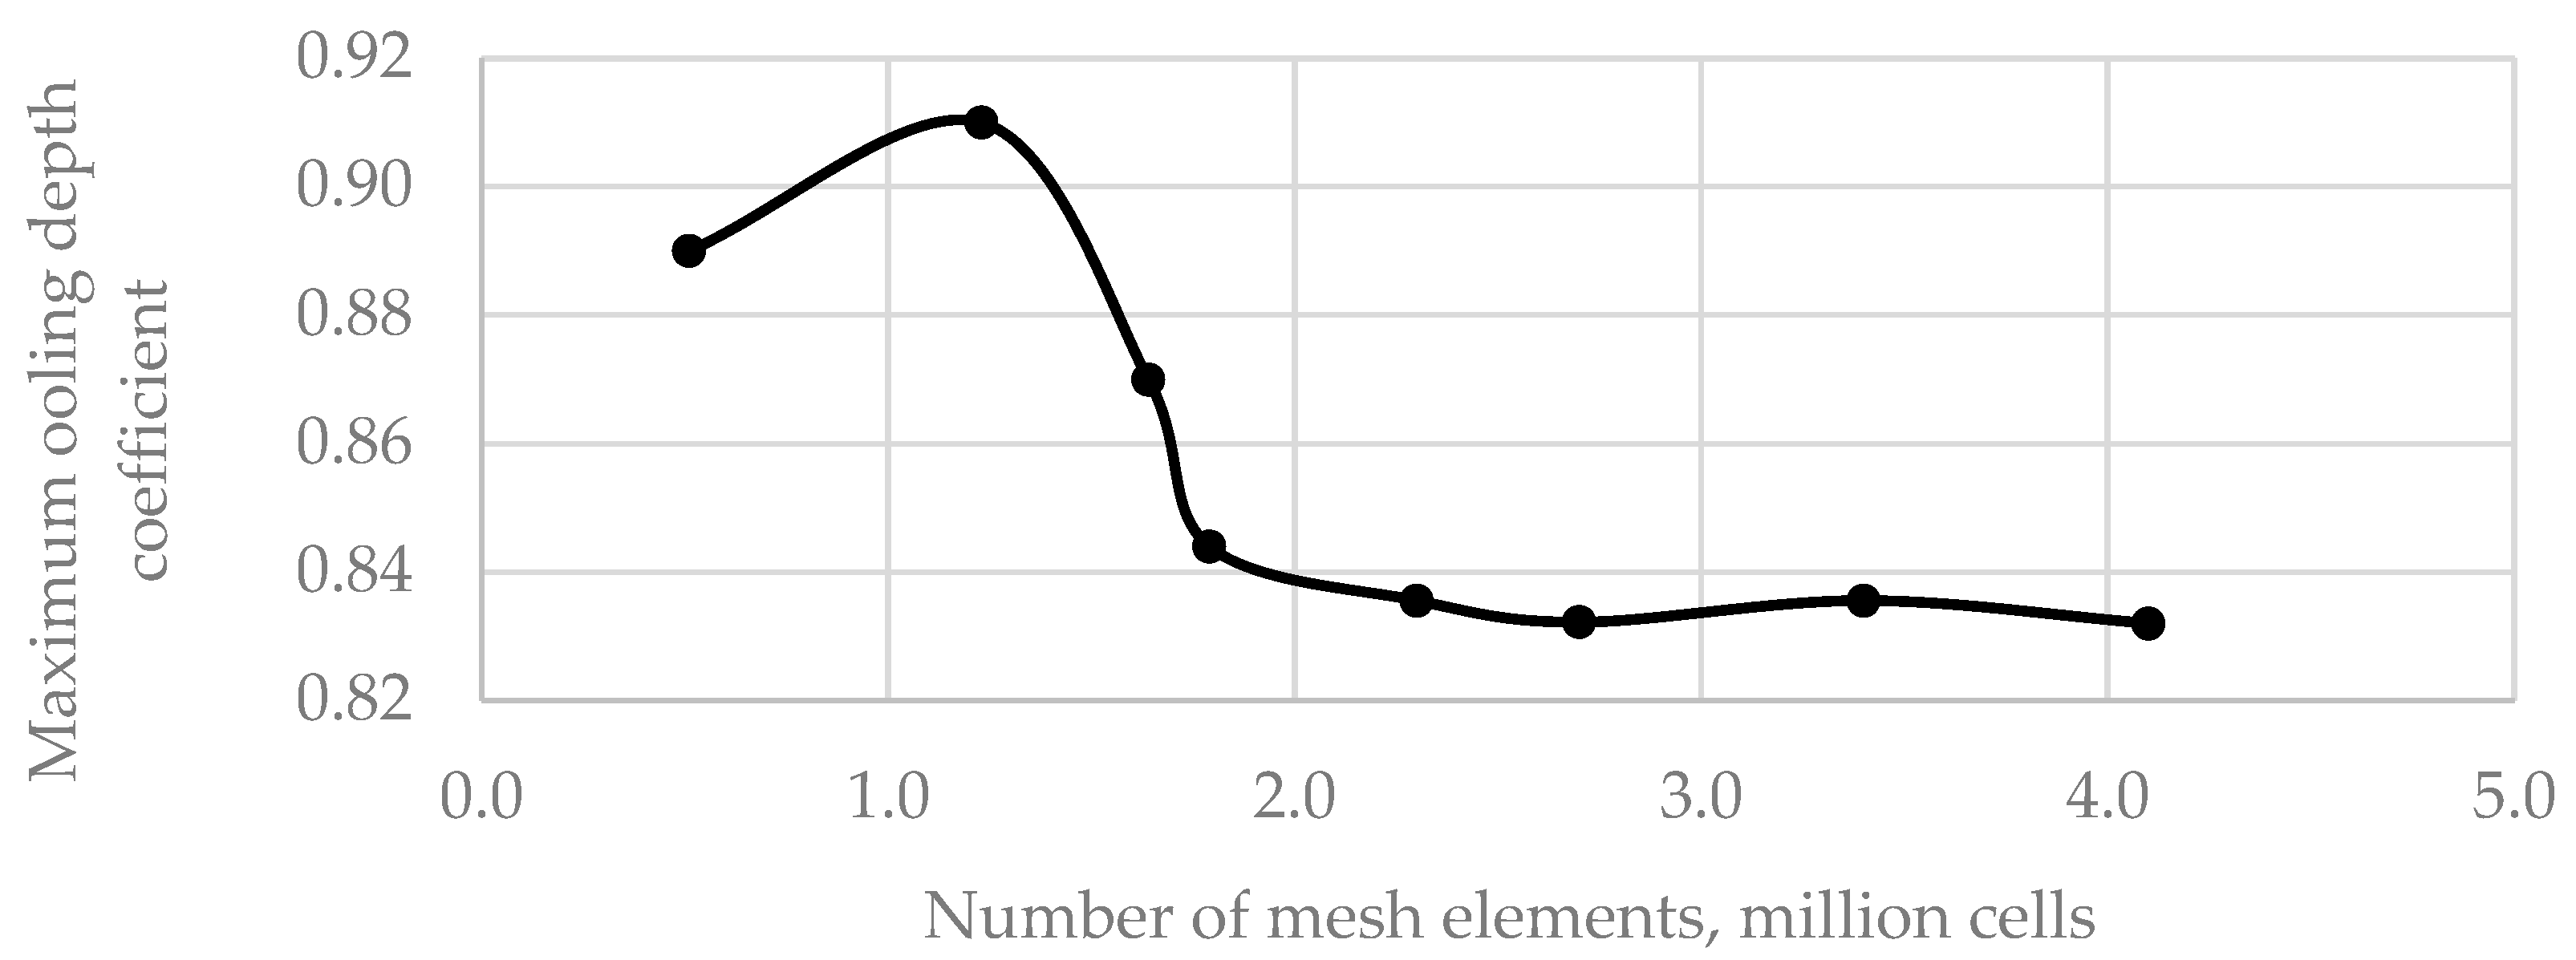
When creating the computational mesh, a mesh independence study was also conducted to determine the optimal number of computational mesh cells, in which the independence of the results obtained from the number of elements is achieved. The cooling depth was chosen as a criterion for assessing mesh independence. Figure 6 shows, as an example, a graph for determining mesh independence for one of the models (with a mesh periodicity step of 30 mm and a wall thickness of 2 mm).
As can be seen from this graph, with the number of mesh elements equal to 2.3 million cells, mesh independence is achieved. Further reduction in the cell sizes has no significant effect on the result. In general, since all models are similar to each other, when further constructing the mesh, the target value of the number of elements of the calculated mesh was 2.3 million.
Subsequently, in the ANSYS CFX preprocessor, computational models were created by defining domains, interface boundaries for heat transfer between different domains, and boundary conditions for the working fluids.
Each computational model consisted of two domains: a solid domain (steel) and a cooling air domain. A heating condition was applied to the outer surface of the channel. The simulation setup involved selecting the turbulence model, energy equations, and interface parameters. For the working fluid, the “Total Energy” formulation was used to account for the contribution of flow kinetic energy to heat transfer. For the heat exchanger wall material, the standard “Thermal Energy” model was applied, excluding the possibility of treating the separating walls as adiabatic. To describe the turbulent flow, the Menter SST turbulence model was selected as the most appropriate for problems involving strong near-wall velocity gradients and laminar-to-turbulent transition. This model combines the advantages of both the standard k–ε and k–ω models, allowing for accurate and physically realistic simulations both near the wall and in the bulk flow. To account for transition phenomena, the “Gamma-Theta” transition model was enabled, along with the “SST Curvature Correction” option. The choice of the SST turbulence model is justified by the fact that this model can take into account the curvature of the surface and transition processes (from laminar to turbulent flow) by using the “Gamma-Theta” function. To couple the interfaces between contacting domains, the General Grid Interface (GGI) model with heat transfer enabled was used. Air was modeled as an ideal gas for the working fluid, while structural steel was selected as the channel wall material. The domain settings for the working fluids in both the coolant and hot gas flow cases included parameters listed in Table 2. The inlet velocity of the cooling air ranged from 1 to 9 m per second in increments of 2 m s . The inlet velocity values were set as described earlier. The Reynolds numbers were determined from these velocities. The velocities were selected within the range corresponding to the Reynolds numbers before the turbine blade cooling systems (approximately 1000–10,000). The wall touching the flow inside the channel was set to a no-slip condition. No roughness was set; the “Smooth Wall” model was selected. The outer wall was chosen with heating in accordance with the boundary conditions. It is worth saying that of course there is a temperature gradient on the outer side of the blade. However, as a simplification, this model was chosen with a uniform temperature distribution.
Using the CFX-Post postprocessor, the flow parameters required for further comparative analysis were determined. Static parameters were averaged over area and volume, while dynamic parameters were averaged based on mass flow rate.
To evaluate the efficiency of convective heat transfer, the Nusselt number was calculated using the following formula, specifically for the section containing the lattice:
N u = h · l λ
λ—thermal conductivity, W m · K ; l—characteristic length (hydraulic diameter; for a tubular channel d h = 4 A P = D ), m;
h —convective heat transfer coefficient, W m 2 · K , which, according to Newton–Richman’s law, is defined as
h = Q A · ( t w t f ) = q t w t f
Q —heat flux, W; A —heat transfer surface area, m 2 ; t w —wall temperature, K; t f —fluid temperature, K.
Since hydraulic resistance is also a critical factor in the design of cooling systems, the local loss coefficient was determined as follows:
ζ = P i n * P o u t * ρ o u t · ( c o u t 2 / 2 )
P i n * ,   P o u t * —total pressure at the inlet and outlet, respectively, Pa; ρ o u t —air density at the outlet, k g m 3 ; c o u t —air velocity at the outlet, m s .
The most important criterion for a blade cooling system is the dimensionless cooling depth coefficient. This number reflects the efficiency of the cooling system and ranges from 0 to 1, where 0 indicates that the blade temperature at a given point equals the gas temperature at the domain inlet, and 1 indicates that the blade temperature equals the coolant air temperature at that point. This coefficient is calculated using the following formula:
θ = T g a s T w a l l T g a s T a i r
T g a s —gas temperature, K; T w a l l —wall temperature, K; T a i r —cooling air temperature, K.
Using the CFX-Post postprocessor, the flow parameters required for subsequent comparative analysis were determined. Static parameters were averaged over area and volume, while dynamic parameters were averaged based on mass flow rate.

2.2. Analysis of the Influence of Geometric and Flow Parameters on Objective Functions

To analyze the influence of geometric and flow parameters on the objective functions, the polynomial regression method was used. Polynomial regression is a statistical technique that extends linear regression by modeling the relationship between the dependent variable and one or more independent variables using a polynomial of a specified degree. This approach allows for capturing nonlinear relationships between variables. The general form of the mathematical model is expressed as follows:
Y = β 0 + β 1 X + β 2 X 2 + + β n X n + ϵ
Y is the objective function, X is the independent variable, β 0 is the intercept term, β 1 is the slope coefficient that indicates how a one-unit change in X affects Y , n is the degree of the polynomial, and ϵ is the random error term, representing the difference between the actual and predicted values of Y .
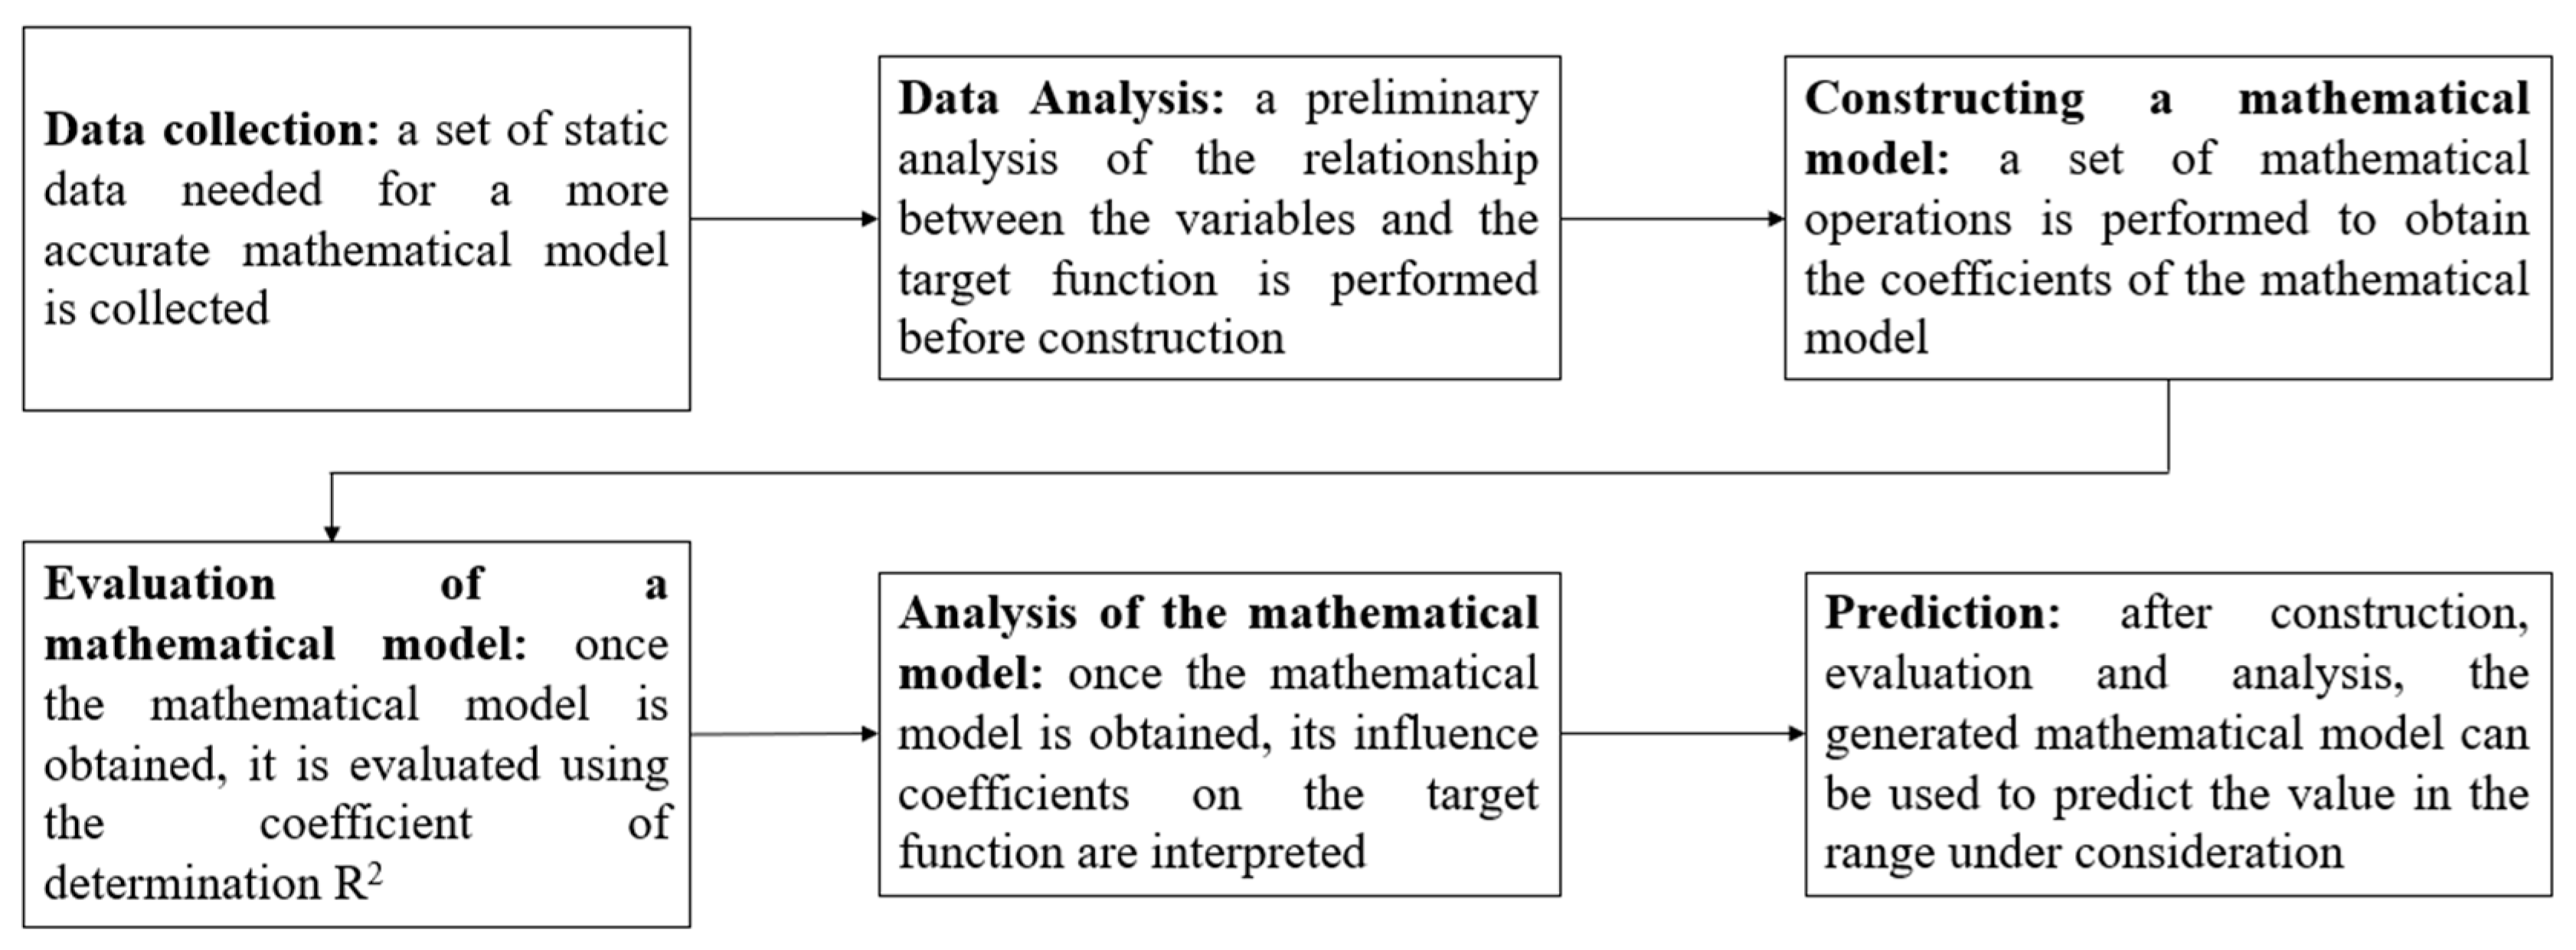
The polynomial regression calculation process involves the following steps, as illustrated in Figure 7.
The process of constructing the mathematical model involves a series of mathematical operations, including assembling the feature matrix, forming the response vector, transposing the matrix, performing matrix multiplication, computing the inverse matrix, and determining the regression coefficients:
  • Formation of the observation matrix. At this stage, the initial matrix is constructed from the dataset of flow regime parameters obtained during the three-dimensional CFD simulation. The final matrix has the following structure: the first column represents the intercept term of the matrix, and the second column contains the values of the dependent parameter.
    X = x 1   1 x 2   1 x 1   2 x 2   2 x 1   n x 2   n
  • Formation of the response vector. At this stage, a matrix is constructed representing the values of the objective functions in the order in which they were computed. The resulting matrix has the following form: a single column containing the values of the objective functions.
    y = y 1 y 2 y n
  • Transposition of the observation matrix. Matrix transposition is the process by which the rows of a matrix are converted into columns, and the columns into rows. The formation of the transposed matrix is a necessary step in the computation of the inverse matrix.
    X T = x 1   1 x 1   2 x 1   3 x 2   1 x 2   2 x 2   3         x 1   n x 2   n
  • Matrix multiplication. This step involves multiplying the observation matrix by its transposed counterpart. The resulting product provides important insights into the relationships between the variables.
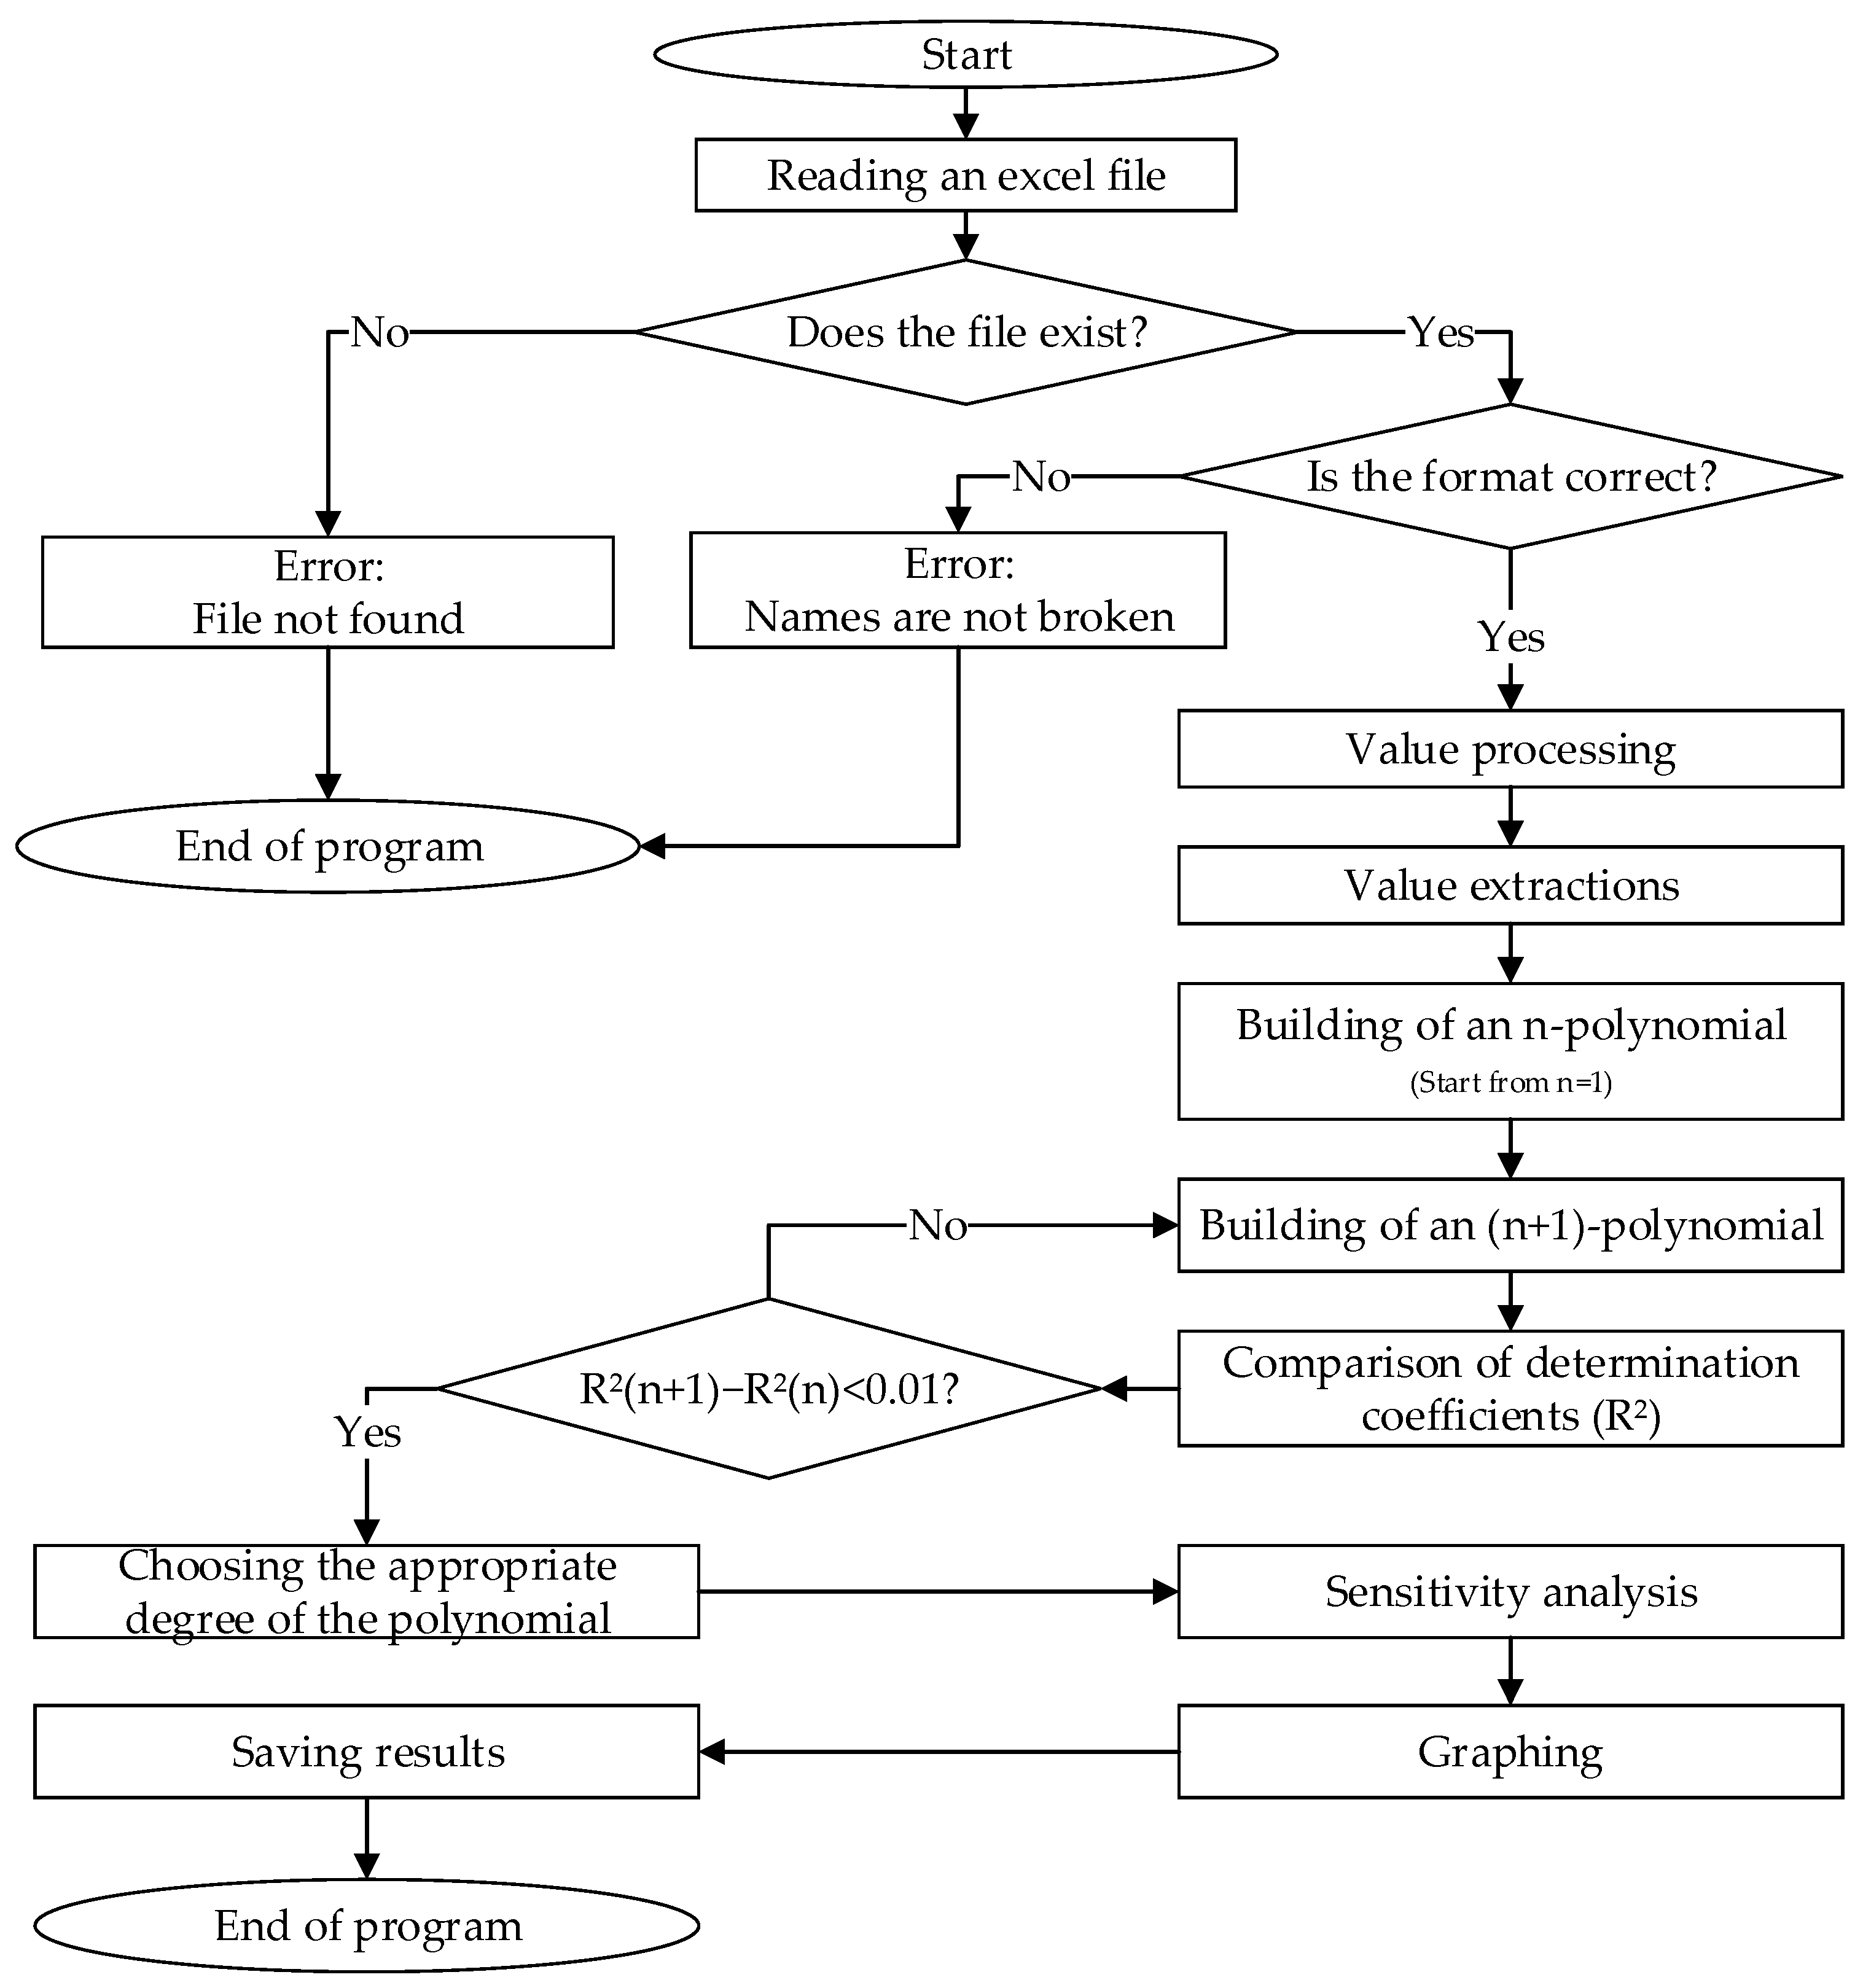
To simplify and automate the process of constructing mathematical models for the remaining geometric parameters of the simulation, regression analysis program was developed using a Python 3.12. This program replicates all the mathematical operations described above and computes the coefficients of the mathematical model. An additional advantage of using the program is its ability to perform multi-iterative calculations aimed at maximizing the coefficient of determination of the model. The algorithm of the program is shown in Figure 8.
This software, by analyzing the dependencies of a given set of objective functions Y n on variables X n , constructs polynomial relationships, determines the coefficients of determination for the mathematical models, calculates correlation coefficients between parameters, and evaluates the quality of the resulting models.

2.3. Experimental Hydraulic Investigation

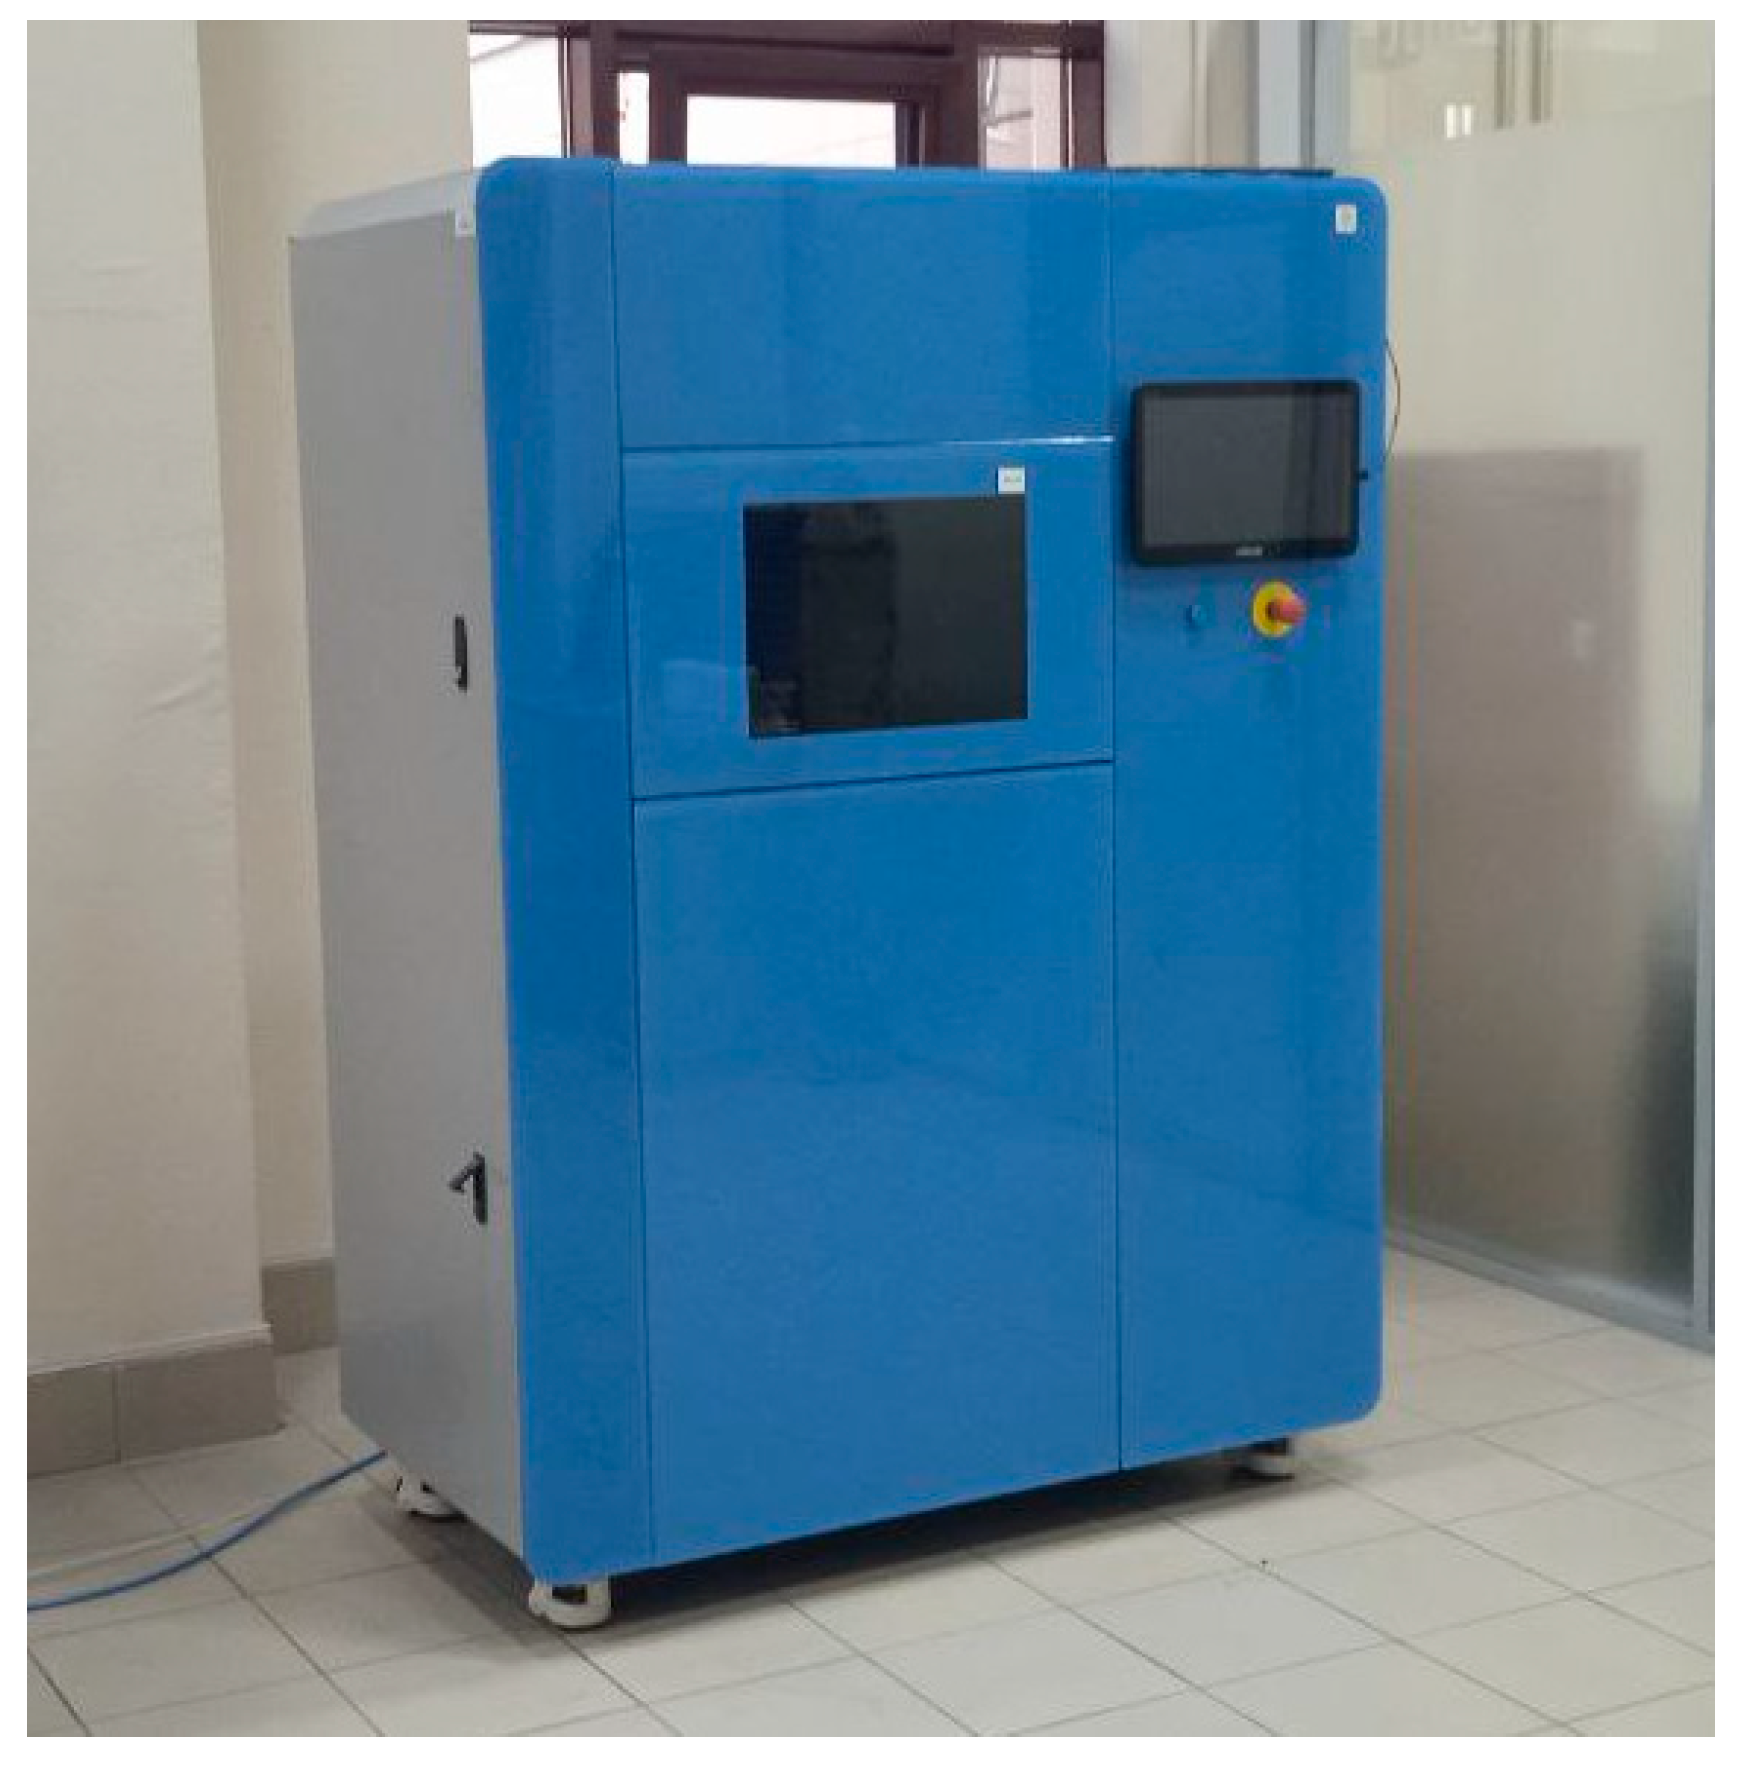
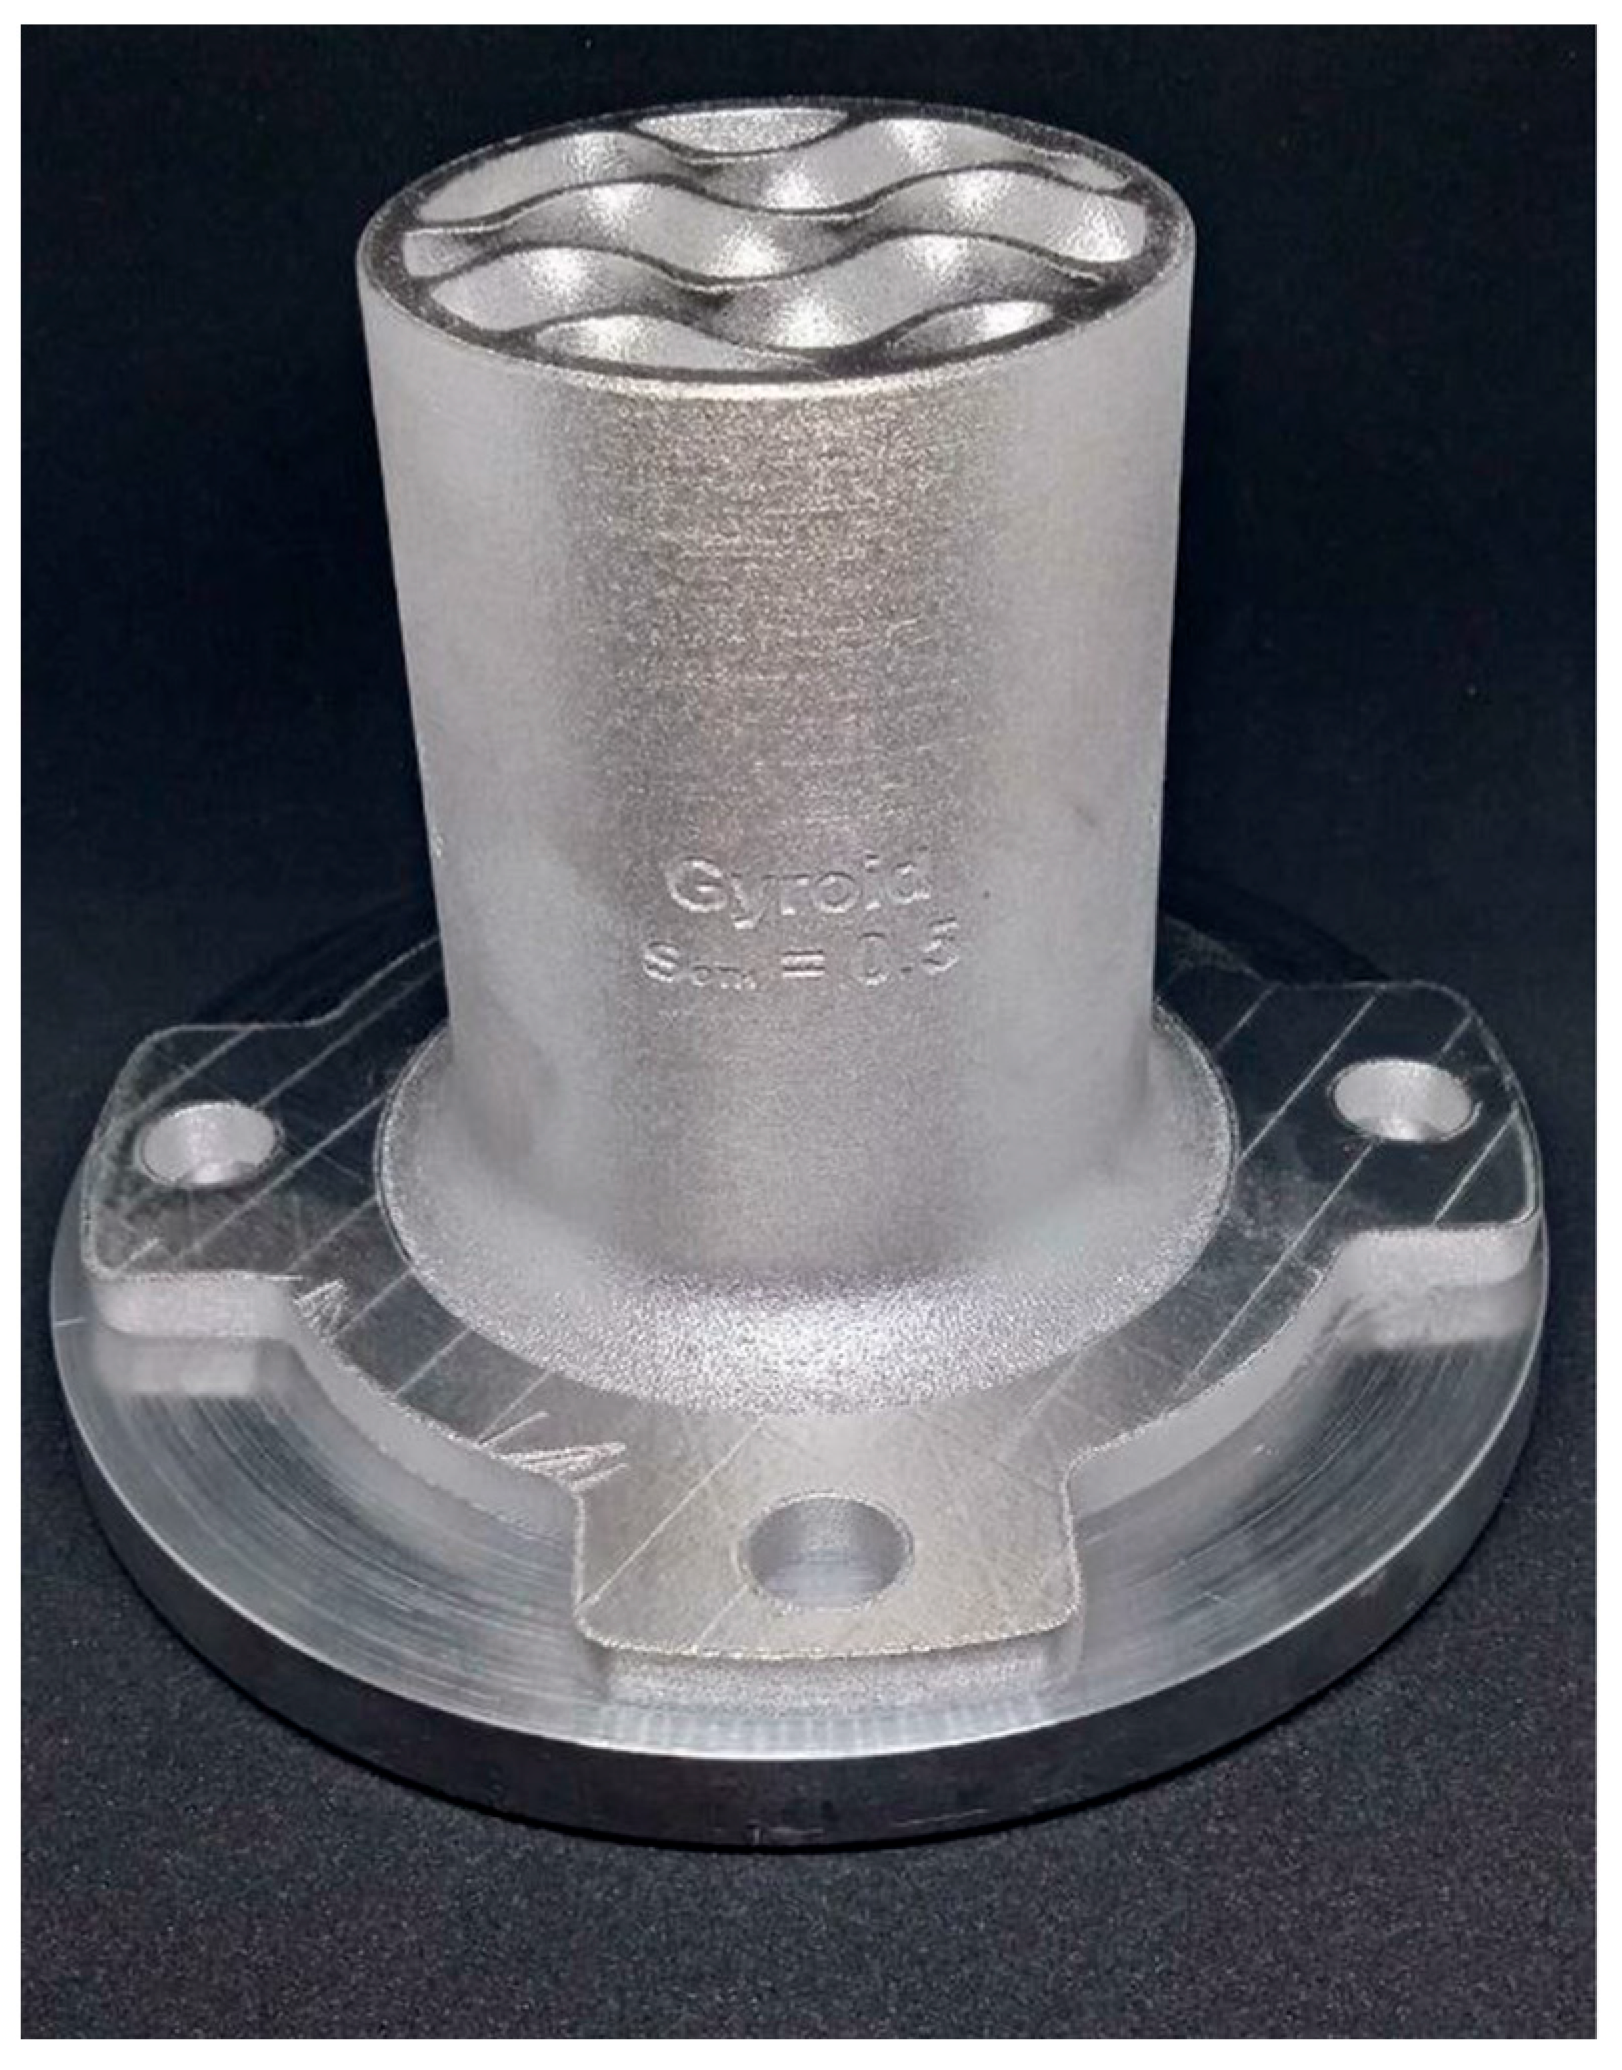
To evaluate the influence of lattice structures on hydraulic resistance, experimental tests of the samples were carried out on a dedicated test rig. The samples were manufactured using selective laser melting (SLM) (Figure 9) on an 3DLAM Mid machine developed by 3DLAM company located in Saint Petersburg, Russia. Figure 10 shows the sample on the build platform. Afterward, the platform was cut off. After printing, the geometry of the lattice structures was inspected using an optical profilometer and high-precision calipers to ensure that the actual dimensions matched the specified parameters.
When investigating the hydraulic characteristics of lattice channels, it is necessary to measure the airflow rate passing through them. For this purpose, an orifice plate is used in the test rig as a flow-measuring device. The schematic diagram of the setup is shown in Figure 11. The experimental setup includes the following components: a compressor (C), a ball valve (BV), a coarse filter (F1), a fine filter (F2), an air dryer (AD), two needle regulating valves (NRV1 and NRV2), resistance thermometers (T1 and T2), a barometer (B), pressure gauges or pressure transducers (P1 and P2), a differential pressure gauge or transducer (DP), an orifice plate (O) for flow measurement, an equalizing chamber (EC), and the test sample or object under investigation (TS).
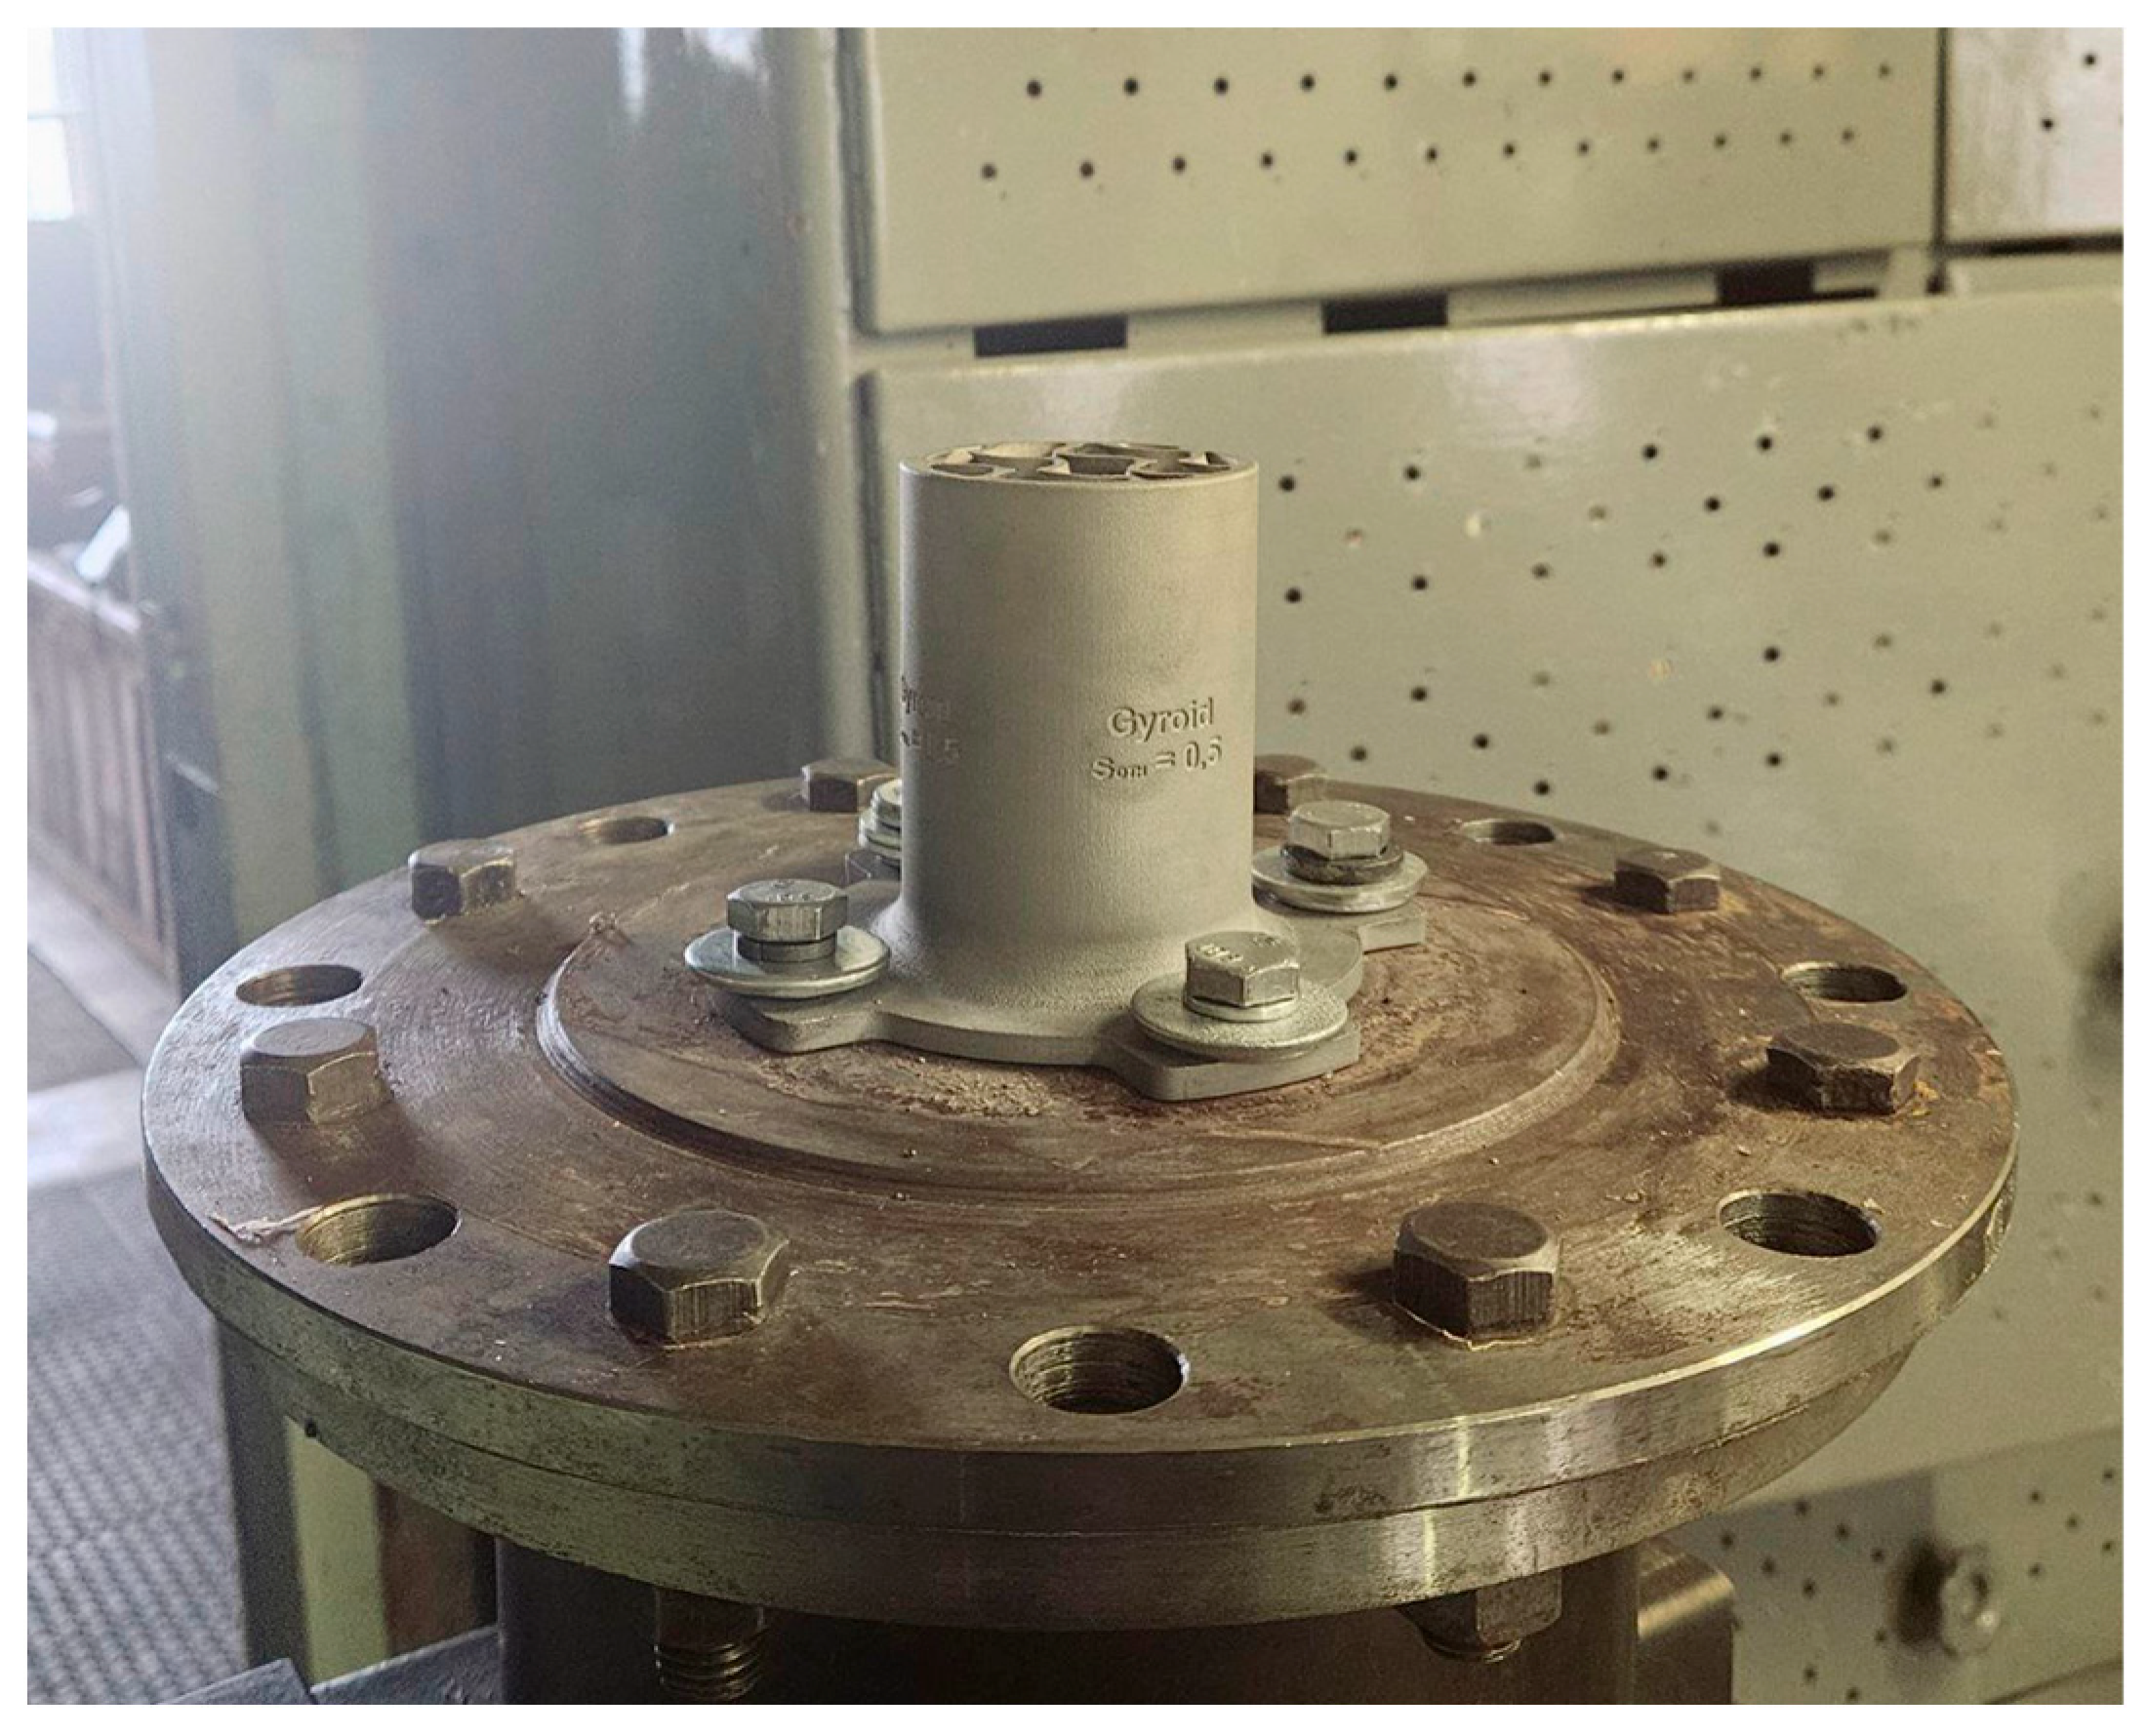
After the experimental samples were mounted onto the test rig, a paronite gasket, manufactured according to the dimensions of the mating flanges, was used to ensure airtight sealing of the connection. This gasket minimizes air leakage at the flange joint between the samples and the test rig. The experimental samples were secured to the rig using four screws and washers. The appearance of the sample mounted on the test rig is shown in Figure 12.
High-pressure air supply to the setup during testing is provided by a Kraftmann VEGA 110–8 screw-type air compressor developed by Kraftmann company in Wermelskirchen, Germany. A shut-off valve is installed at the inlet section connecting the main manifold to the laboratory test rig branch, controlling the activation and deactivation of the airflow.
To ensure accurate air flow measurements through the orifice plate, a high degree of air drying and purification is critical. For this purpose, two filters—coarse and fine—are installed in series after the shut-off valve, followed by an adsorption dryer to reduce air humidity, a regulating valve to control flow intensity, and an elbow fitting with a thermocouple to monitor the air temperature upstream of the orifice plate.
Downstream of the thermocouple, a straight pipeline section of 100 diameters in length ensures flow stabilization before entry into the flow measurement device.
During the experiment, readings were recorded from three pressure gauges (P1, P2, and DP) and two thermocouples (T1 and T2).
The relationship between flow rate and pressure difference is described by Poiseuille’s law:
Q = Δ P · π · R 4 8 · μ · L
Q —volumetric flow rate, m 3 s ; R —pipe radius, m; μ —dynamic viscosity, Pa·s; L —pipe length, m; Δ P —pressure difference, Pa.
Additionally, using the temperature and pressure data along with the Mendeleev–Clapeyron equation, the air density is determined.
During testing, data from the instrumentation and control devices were processed and recorded using MasterSCADA 1.3.4. software developed by LLC “MPS soft” located in Moscow, Russia. To determine the pressure losses within the sample, data from pressure gauge P2 were used. This gauge measures the gauge pressure immediately upstream of the test sample, while the pressure downstream of the sample equals atmospheric pressure. Thus, the readings from pressure gauge P2 represent the pressure drop across the test section.
After the tests were completed, the collected data were averaged.

2.4. Analysis of Experimental Investigation Results

To analyze the results of the experimental investigation, the hydraulic drag coefficient was determined:
ζ = P i n * P o u t * ρ o u t · ( c o u t 2 / 2 ) = 2 · Δ P ρ o u t · c o u t 2
P i n * ,   P o u t * —total pressure at the inlet and outlet, respectively, Pa; ρ o u t —air density at the outlet, k g m 3 ; c o u t —air velocity at the outlet, m s .
Let us express the velocity in terms of flow rate and density. According to the continuity equation,
G m 1 = ρ 1 · c 1 · F 1 = G m 2 = ρ 2 · c 2 · F 2 ζ
G m i —mass flow rate, k g s ; ρ i —air density, k g m 3 ; c i —flow velocity, m s ; F i —cross-sectional area of the channel, m 2 .
From this,
c = G ρ · F
Then, by substituting velocity with the ratio of mass flow rate to the product of density and cross-sectional area, the following equation is obtained:
ζ = 2 · Δ P ρ · c 2 = 2 · Δ P · ρ · F 2 G 2

2.5. Validation of Results Using Model Conditions and the Theory of Geometric and Dynamic Similarity

The results were also validated. A calculation model was created that fully corresponded to the experiment.
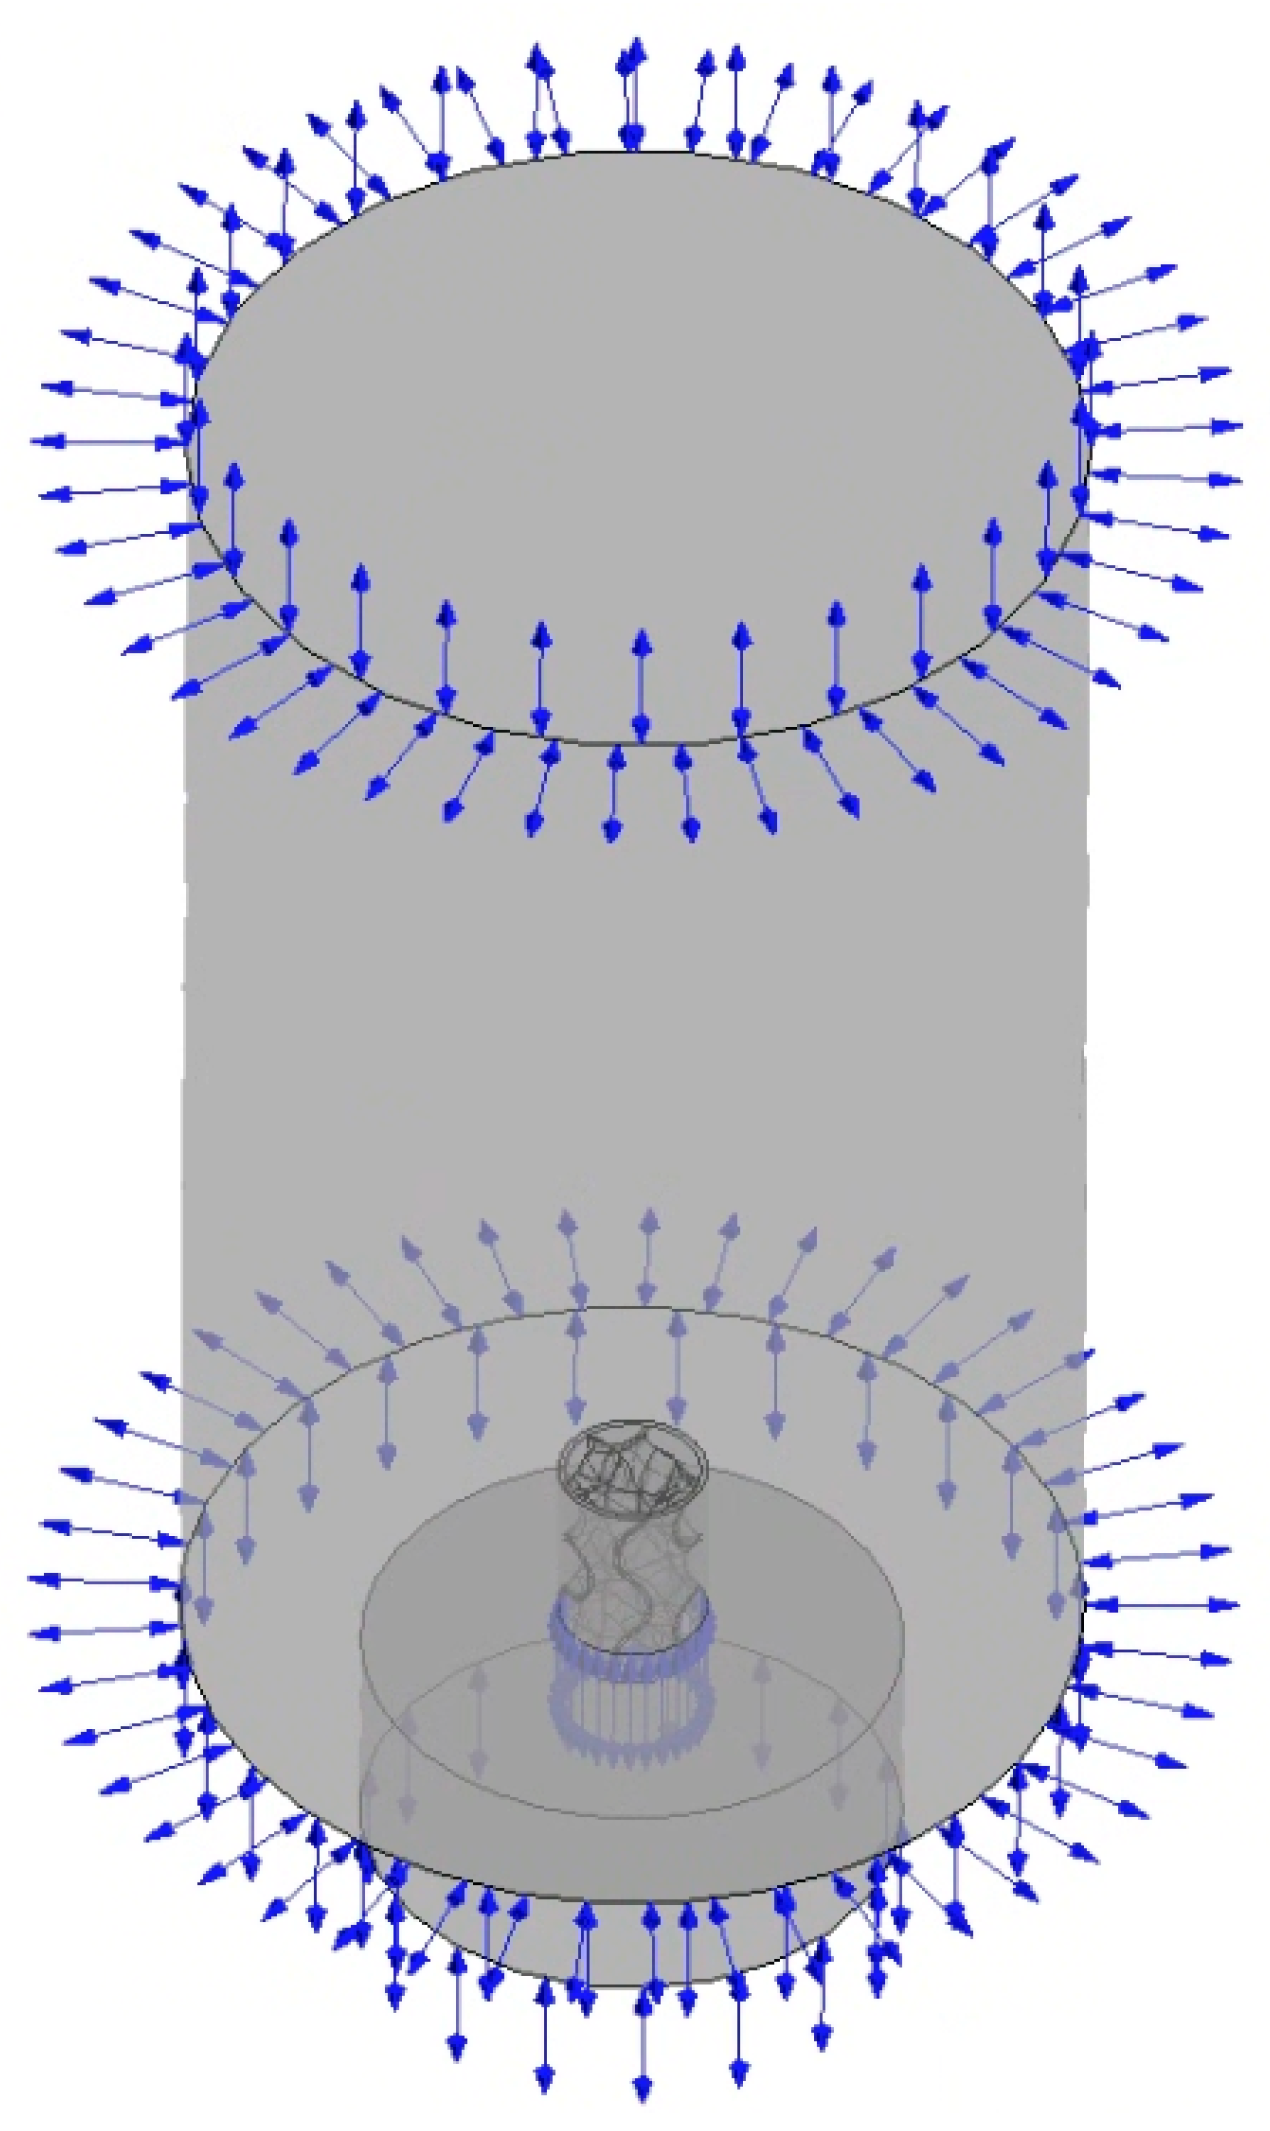
The boundary conditions were set according to the obtained pressure. In this case, the correspondence of the flow rates and other parameters to the experiment when setting pressures as boundary conditions means that the calculations correspond to the actual flow pattern. Despite the fact that heat exchange is used in the initial calculations, and it is almost completely absent in the experiment, confirmation of the correctness of the calculation model using model conditions according to the theory of geometric and dynamic similarity means validation of the calculation studies.
The validation model ideally replicates the flow bodies in the experimental setup. In this case, if the parameters of this model coincide with the experiment, then this means that all calculations are validated due to experimental confirmation. The calculation model of the model conditions on the stand is shown in Figure 13.

3. Results and Discussion

3.1. Results of Numerical Simulation

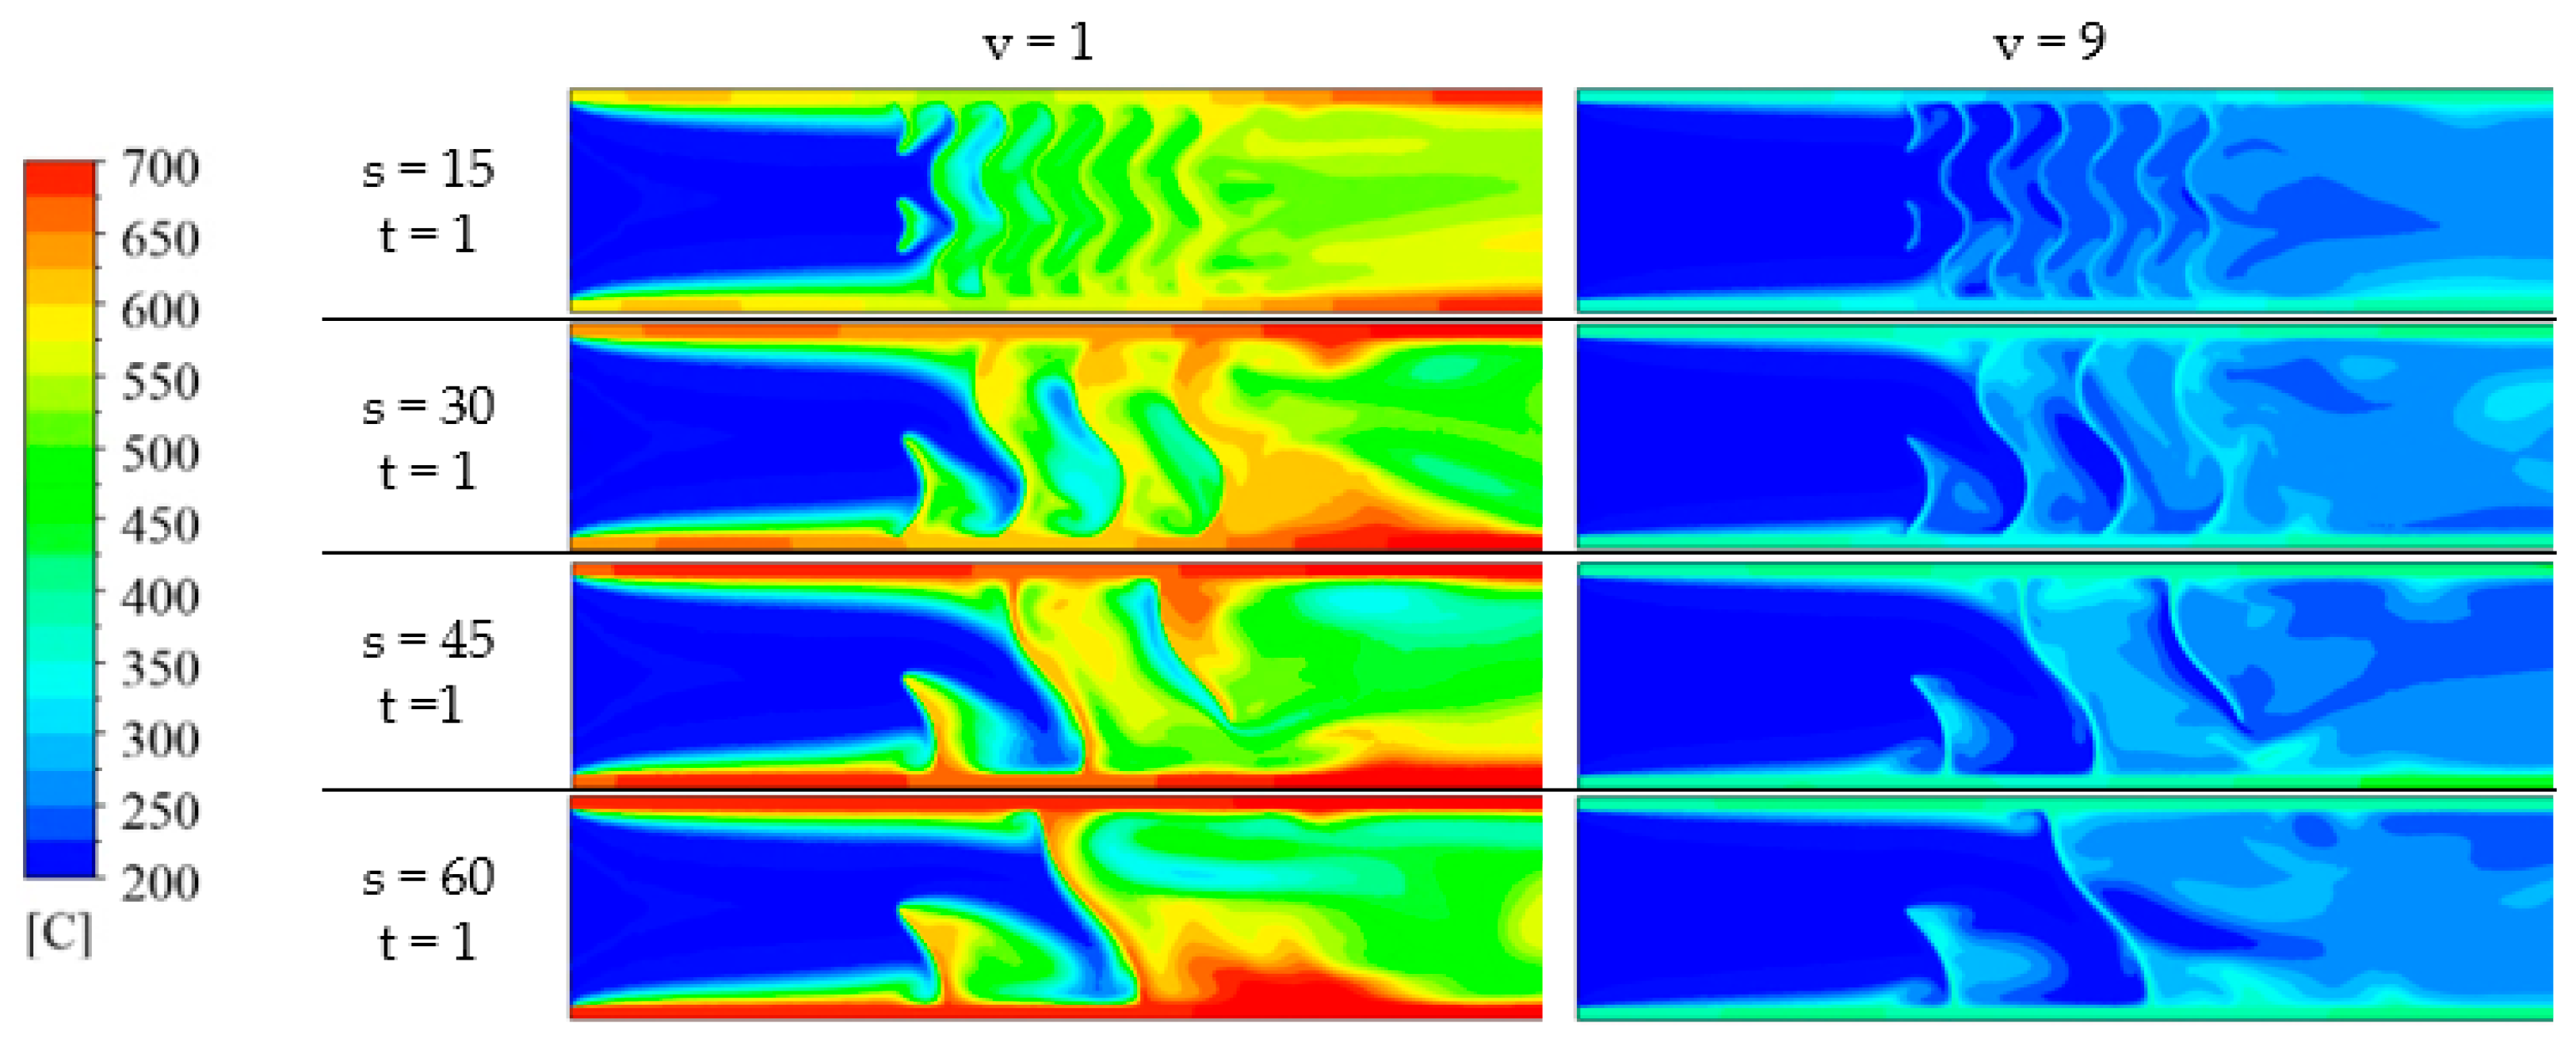
A conjugate computational fluid dynamics (CFD) simulation was performed, accounting for the heat transfer between the cooling air and the hot wall.
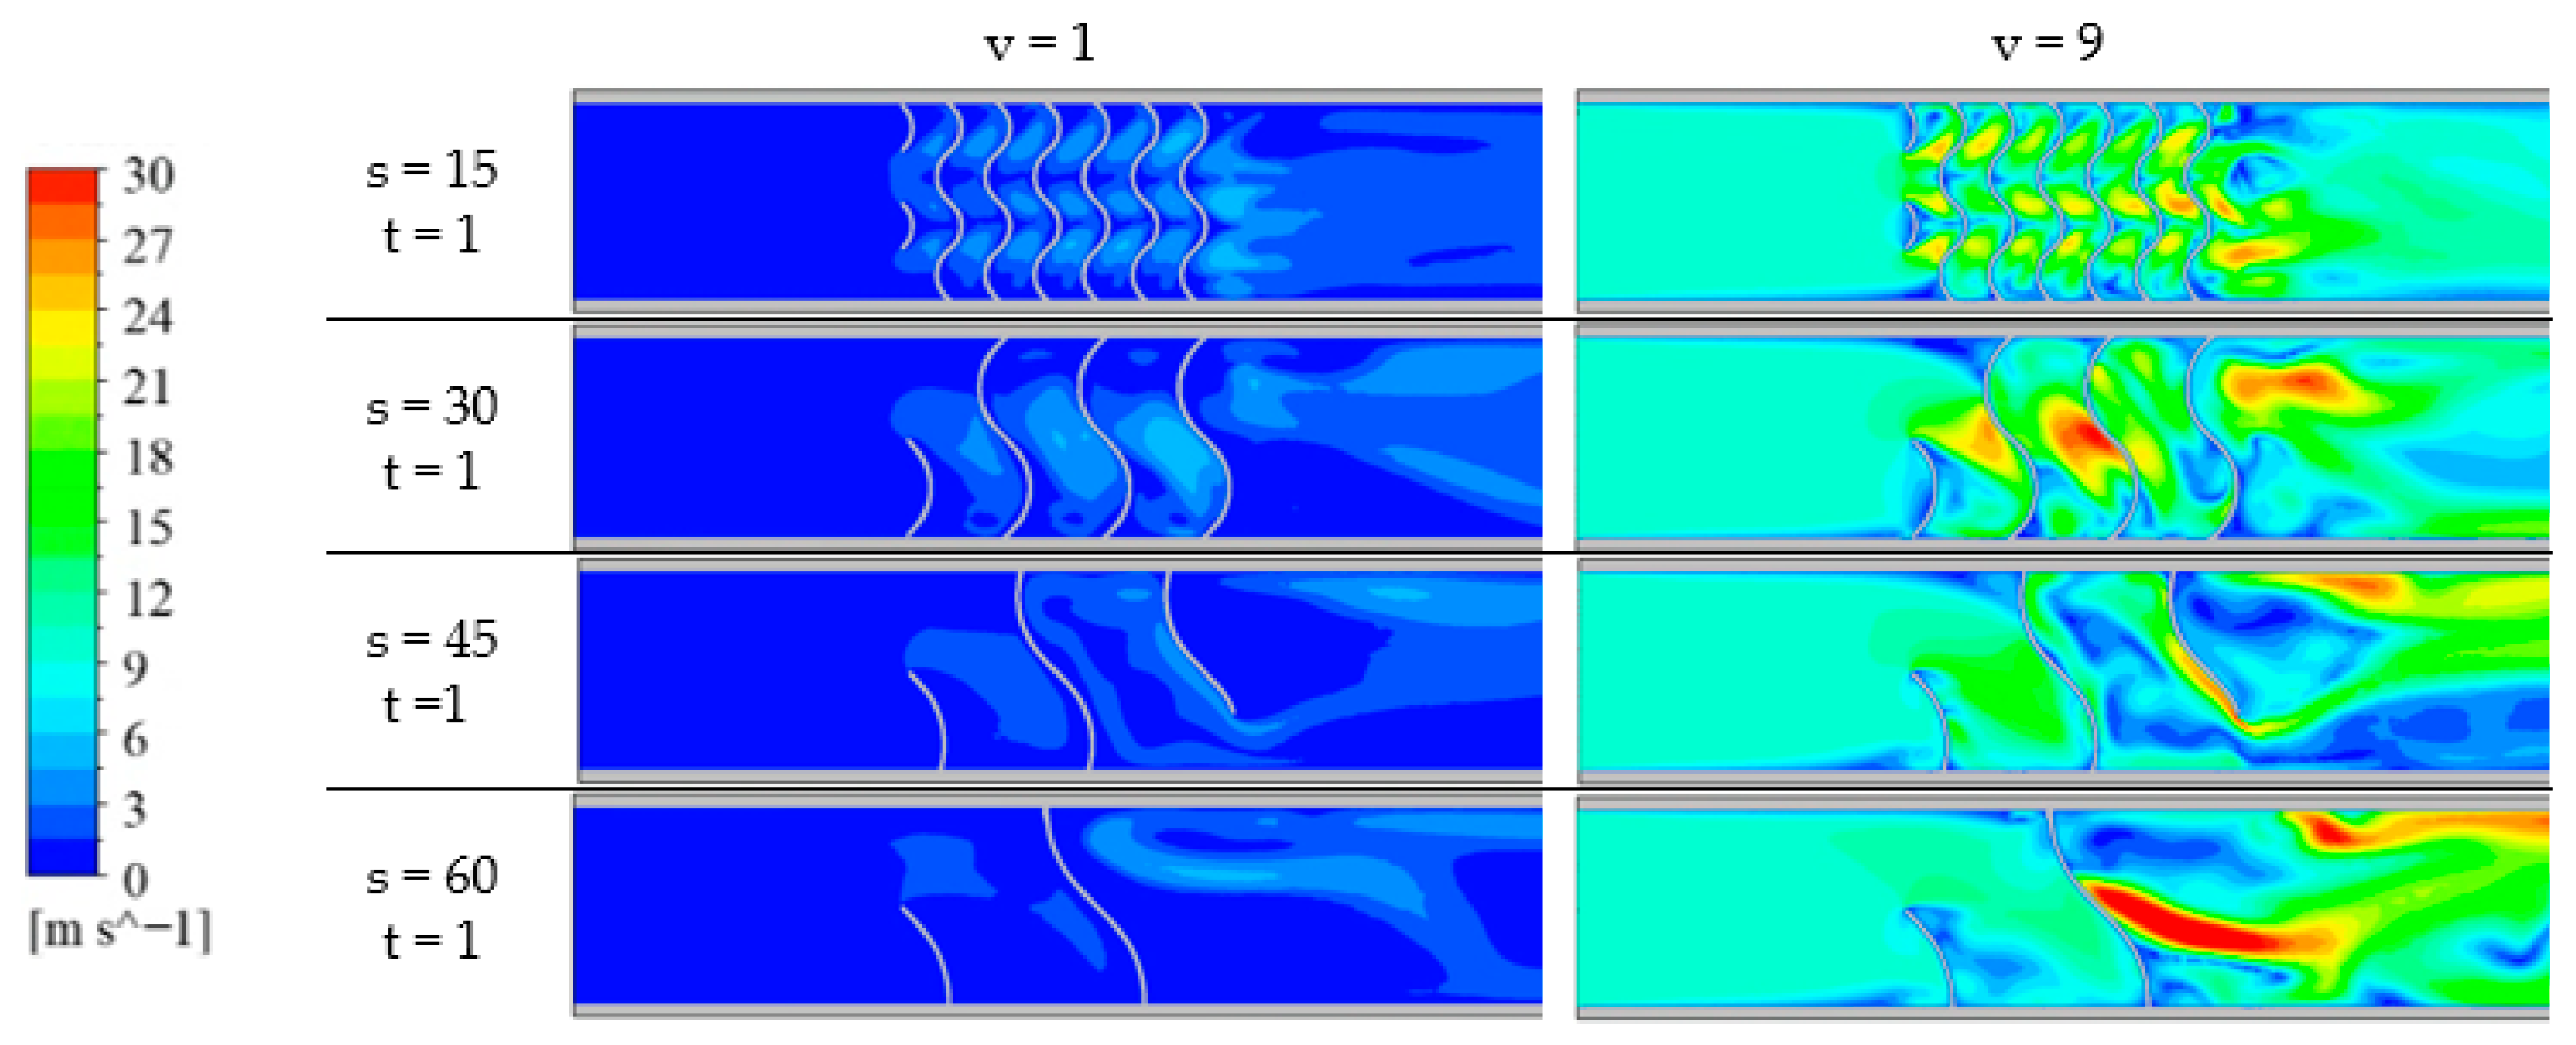
Examples of the obtained results are presented below in Figure 14 and Figure 15.
From the presented distributions, the influence of the geometric parameters of the lattice on heat transfer intensification can be observed. Denser lattice structures provide more effective heat removal from the outer surface of the channel. However, the pressure losses in such lattices are significantly higher compared to those with larger structural dimensions.
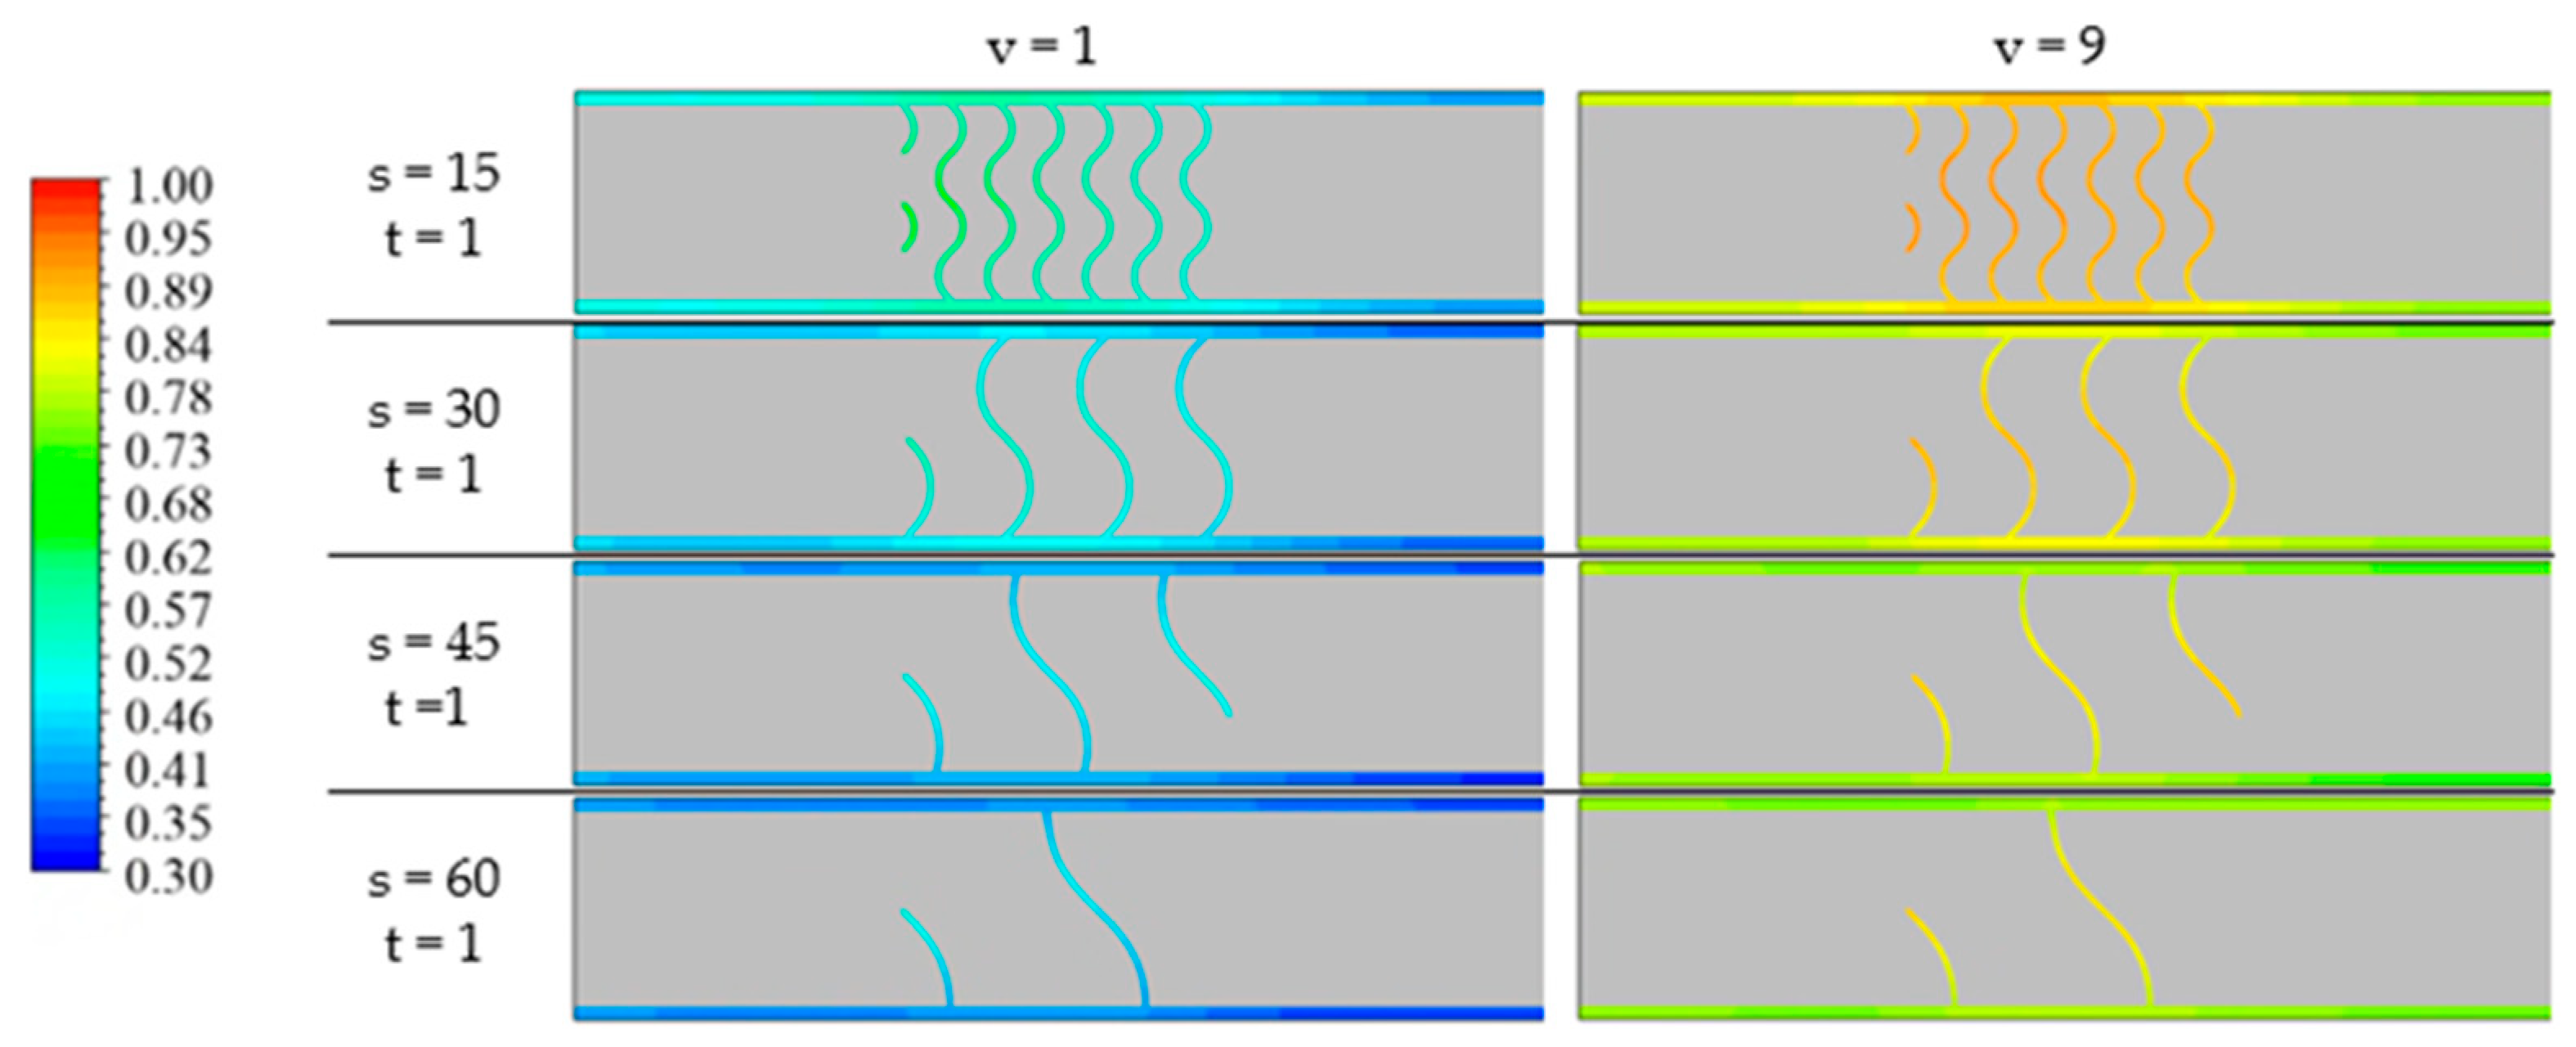
Cooling depth coefficient distributions were generated. Figure 16 presents examples of the resulting distributions for this parameter. In subsequent evaluation and comparison of cooling depth values for each configuration, the parameters were taken from the outer surface of the wall, since in blade cooling system assessments, the focus is on regions directly exposed to the hot gas flow.
The simulation results for the smooth tube are presented in Figure 17.
Table 3 presents all the obtained values for the calculation models with different types of turbulators. For comparative analysis, in addition to the TPMS lattice structure of the Gyroid type, similar models with typical ribs and pins, as well as a smooth channel, were calculated.

3.2. Results of the Influence of Geometric and Flow Parameters on Objective Functions

Relative lattice dimensions represent the ratios of the lattice size to the channel diameter. These dimensions are denoted with the subscript “rel”.
Polynomial dependencies for the surrogate model with a gyroid-type lattice structure:
Dependence of the Nusselt number:
N u = 69.45 7.6016 · s r e l + 615.8744 · t r e l + 0.0252 · R e + 29.4947 · s r e l 2 + 2156.4 · t r e l 2 0.00001 · R e 2 567.384 · s r e l · t r e l 0.0037 · s r e l · R + 0.0246 · t r e l · R e
Dependence of the cooling depth coefficient:
θ = 0.5033 0.1973 · s r e l + 2.9518 · t r e l + 0.0001 · R e + 0.0414 · s r e l 2 + 22.23 · t r e l 2 0.00001 · R e 2 0.5076 · s r e l · t r e l 0.00001 · s r e l · R e + 0.00001 · t r e l · R e
Dependence of the hydraulic drag coefficient:
ζ = 26.4425 39.7789 · s r e l + 611.6327 · t r e l 0.002 · R e + 14.1147 · s r e l 2 2218.5 · t r e l 2 0.00001 · R e 2 224.556 · s r e l · t r e l 0.0005 · s r e l · R e + 0.0033 · t r e l · R e
Dependence of the ratio of the Nusselt number to the hydraulic drag coefficient:
N u / ζ = 47.93 10.2923 · s r e l 1858.64 · t r e l + 0.0013 · R e 3.0194 · s r e l 2 13906.46 · t r e l 2 0.00001 · R e 2 + 424.6831 · s r e l · t r e l 0.004 · s r e l · R e + 0.0041 · t r e l · R e .
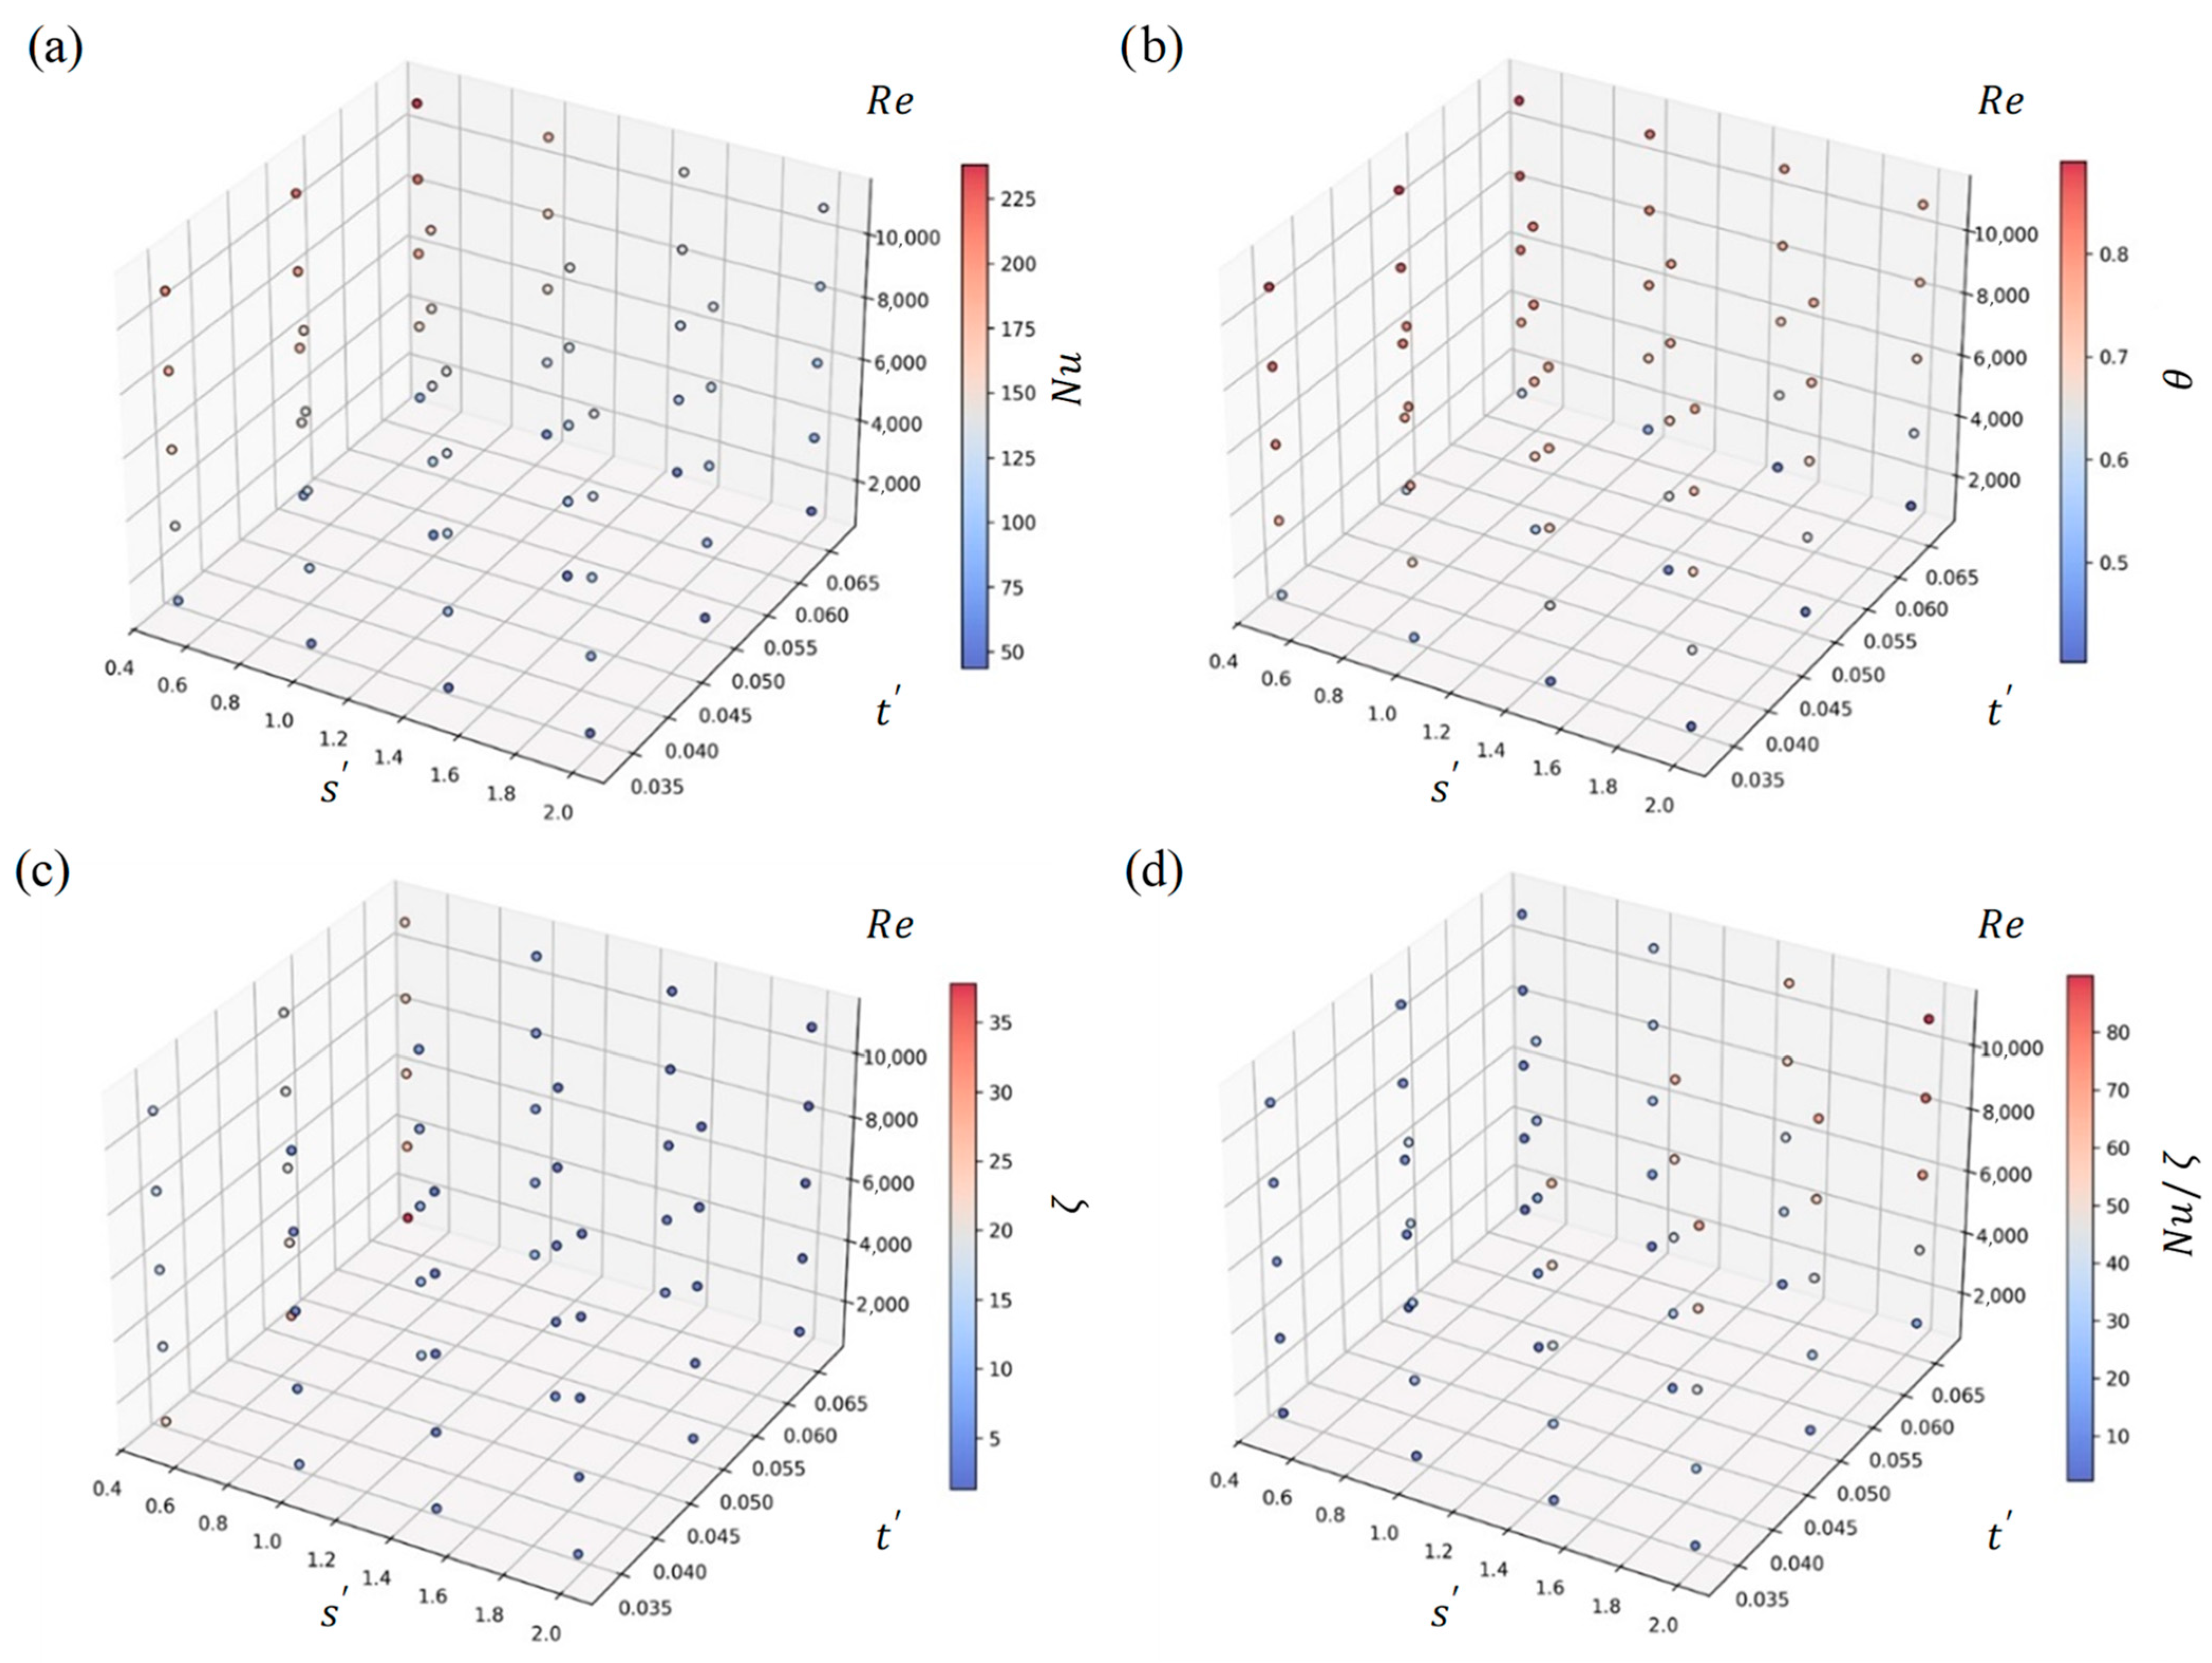
The obtained dependencies are presented in the graphs shown in Figure 18. In this case, the three axes represent the varying parameters, while the colored points indicate the values of the objective functions corresponding to the coordinates on the axes.
From the obtained mathematical models, it can be seen that the highest values of the Nusselt number and the cooling depth coefficient are achieved at the minimum value of s r e l and the maximum Reynolds number. However, under these conditions, the hydraulic drag coefficient is also among the highest. At the same time, the highest ratio of the Nusselt number to the hydraulic drag coefficient is observed when using the least dense lattice. Thus, reducing the lattice period enhances heat transfer efficiency, but it is accompanied by a disproportionate increase in hydraulic resistance. Overall, it is evident that wall thickness has a relatively minor effect on the objective functions.
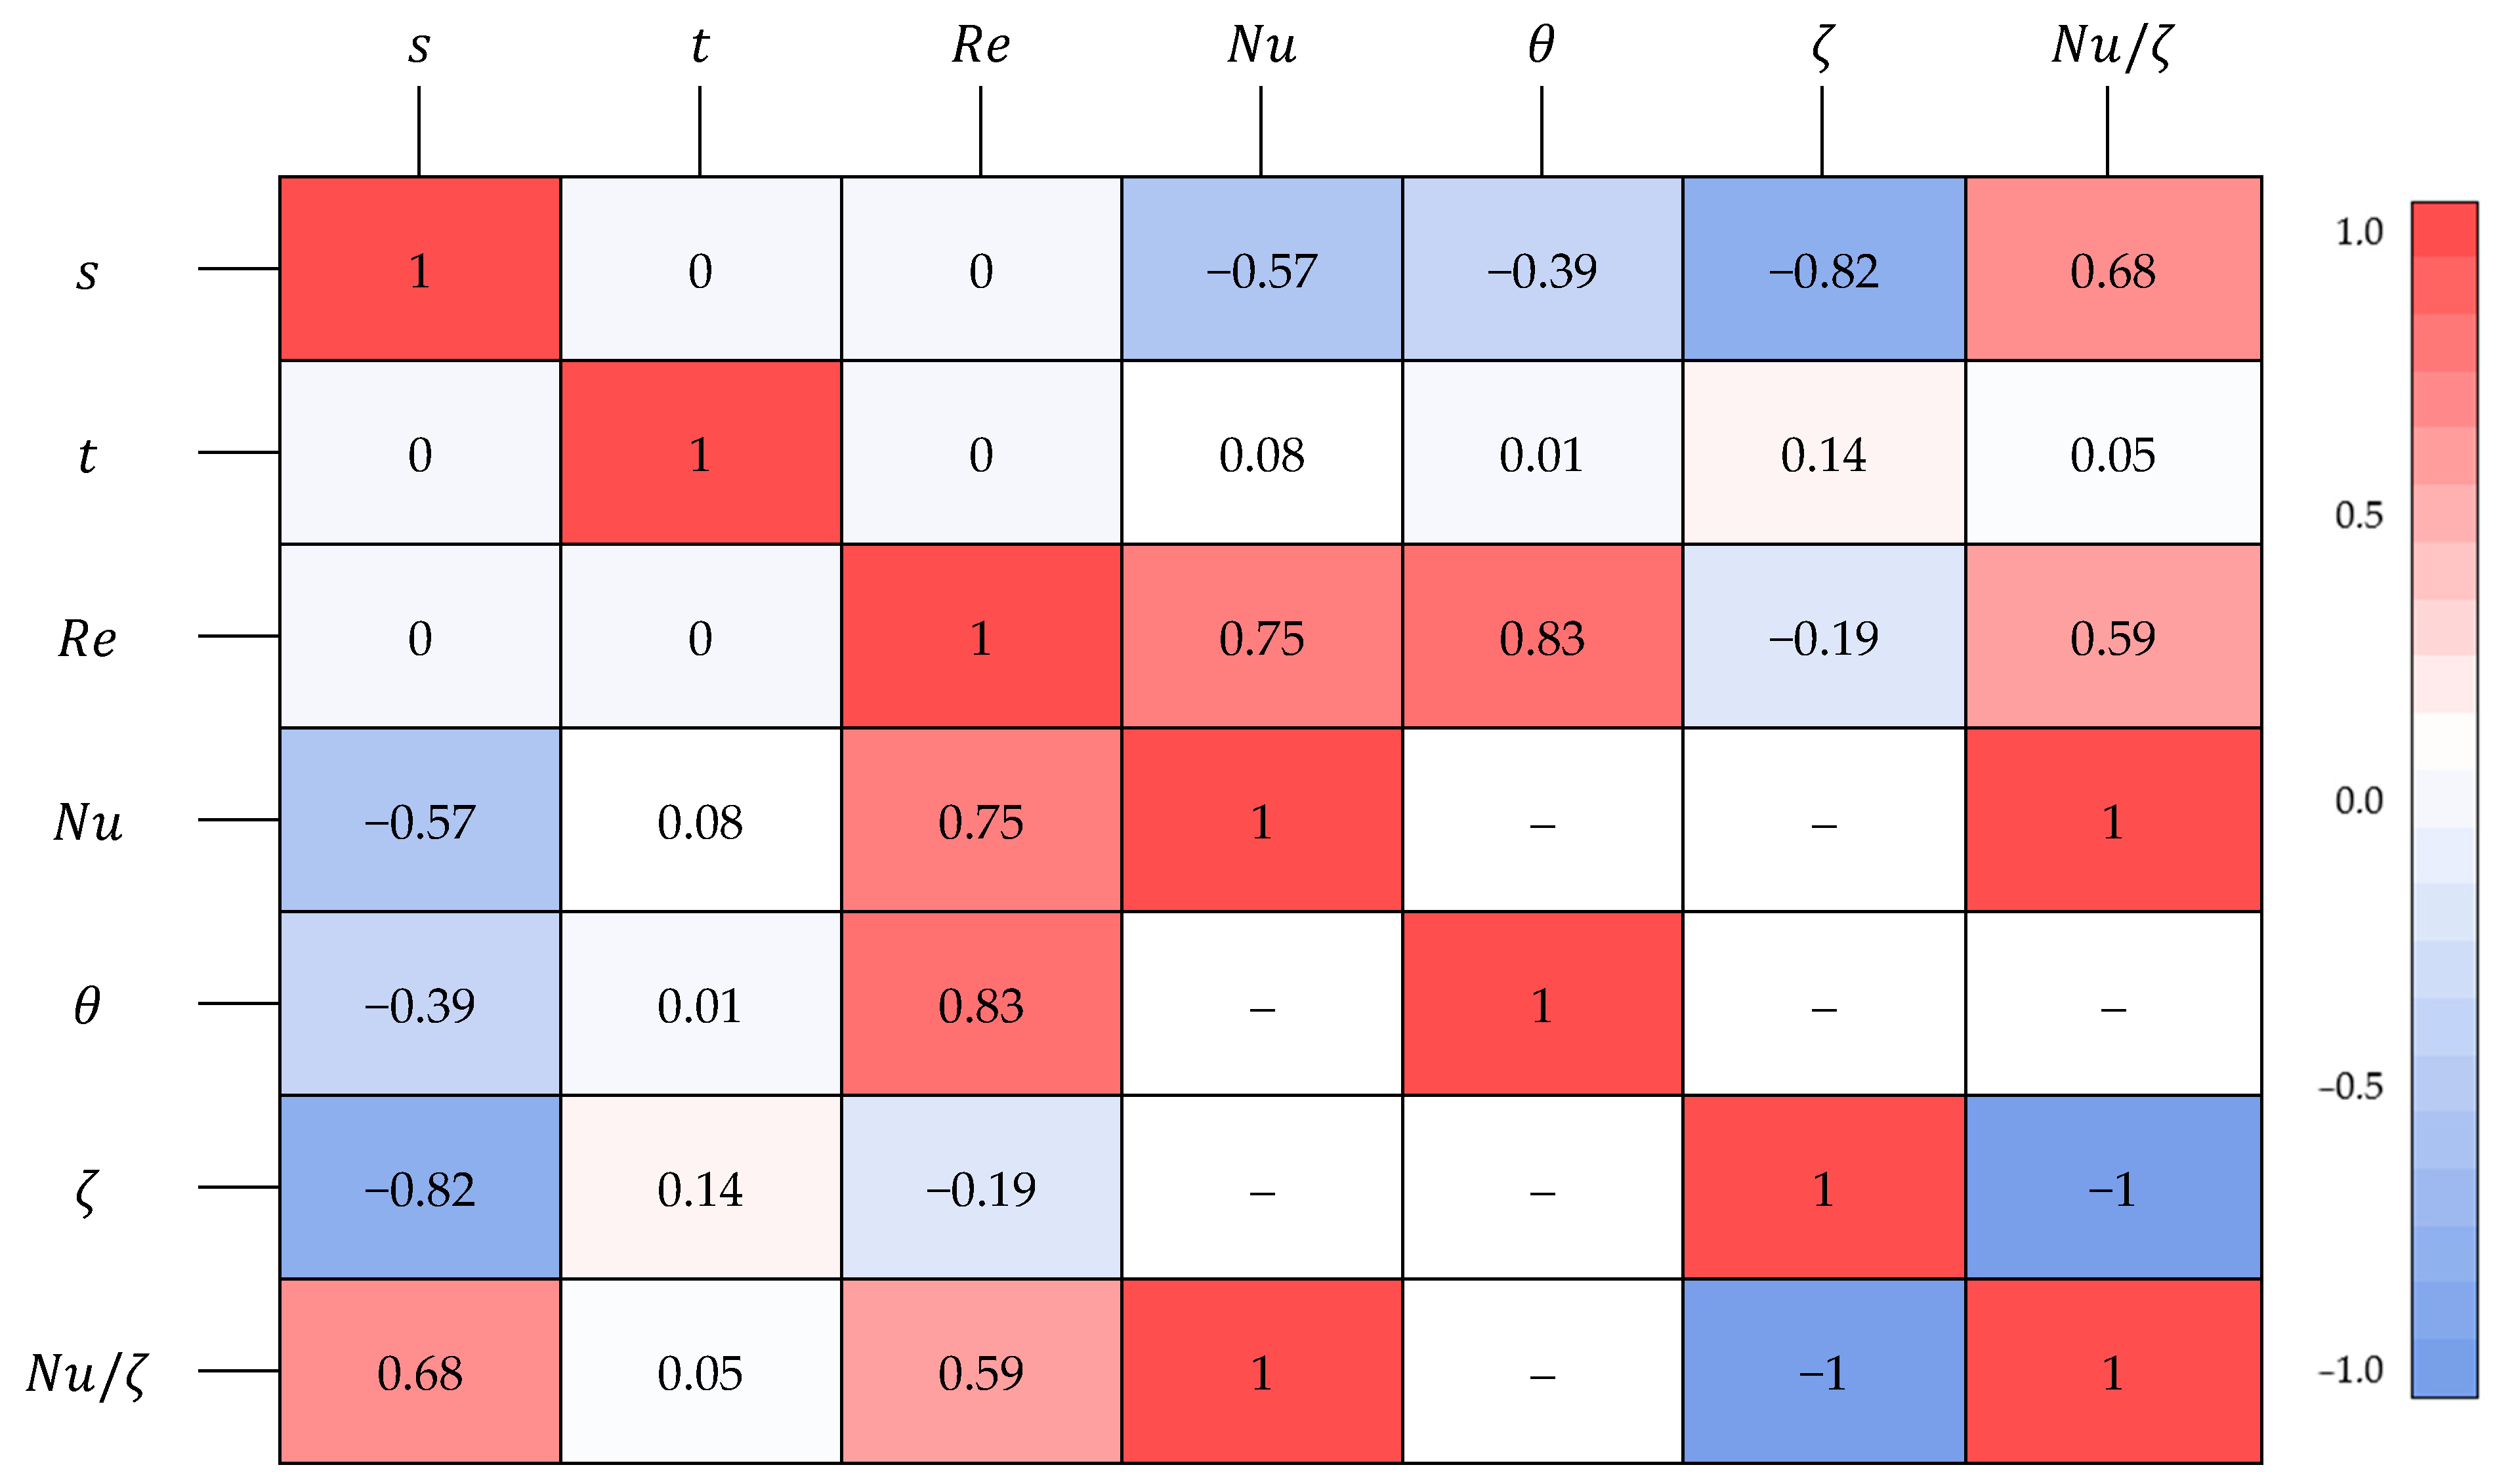
After the mathematical models were obtained, correlation coefficients were calculated. In mathematical statistics, a correlation coefficient is a measure that characterizes the strength of the statistical relationship between two or more variables. Correlation matrices are used to analyze the interrelationships among multiple variables within a dataset. They help to understand how one variable influence another and to identify patterns or dependencies. The correlation matrix is presented in Figure 19.
Overall, the values of the correlation coefficients confirm the conclusions drawn from the mathematical models and quantitatively reflect the degree of influence of one parameter on another. To assess the quality of the mathematical models, additional metrics were calculated, including the coefficient of determination, root mean square error, deviation, and mean absolute error. In general, the analysis of model quality yielded high values of the coefficient of determination R 2 , ranging from 0.961 to 0.978. In engineering and technical sciences, it is commonly accepted that for a mathematical model to be considered reliable, the R 2 value should fall within the range of 0.7 to 1. The obtained models exhibit consistently high R 2 values, indicating a high level of accuracy and reliability.

3.3. Results of the Experimental Hydraulic Investigation

Since numerical analysis previously revealed that the lattice pitch has the most significant influence on the parameters of the investigated section, subsequent experimental research focused on examining the effect of lattice pitch (essentially, the density of the lattice structure) on hydraulic characteristics—namely flow rate, pressure loss, and hydraulic drag coefficient.
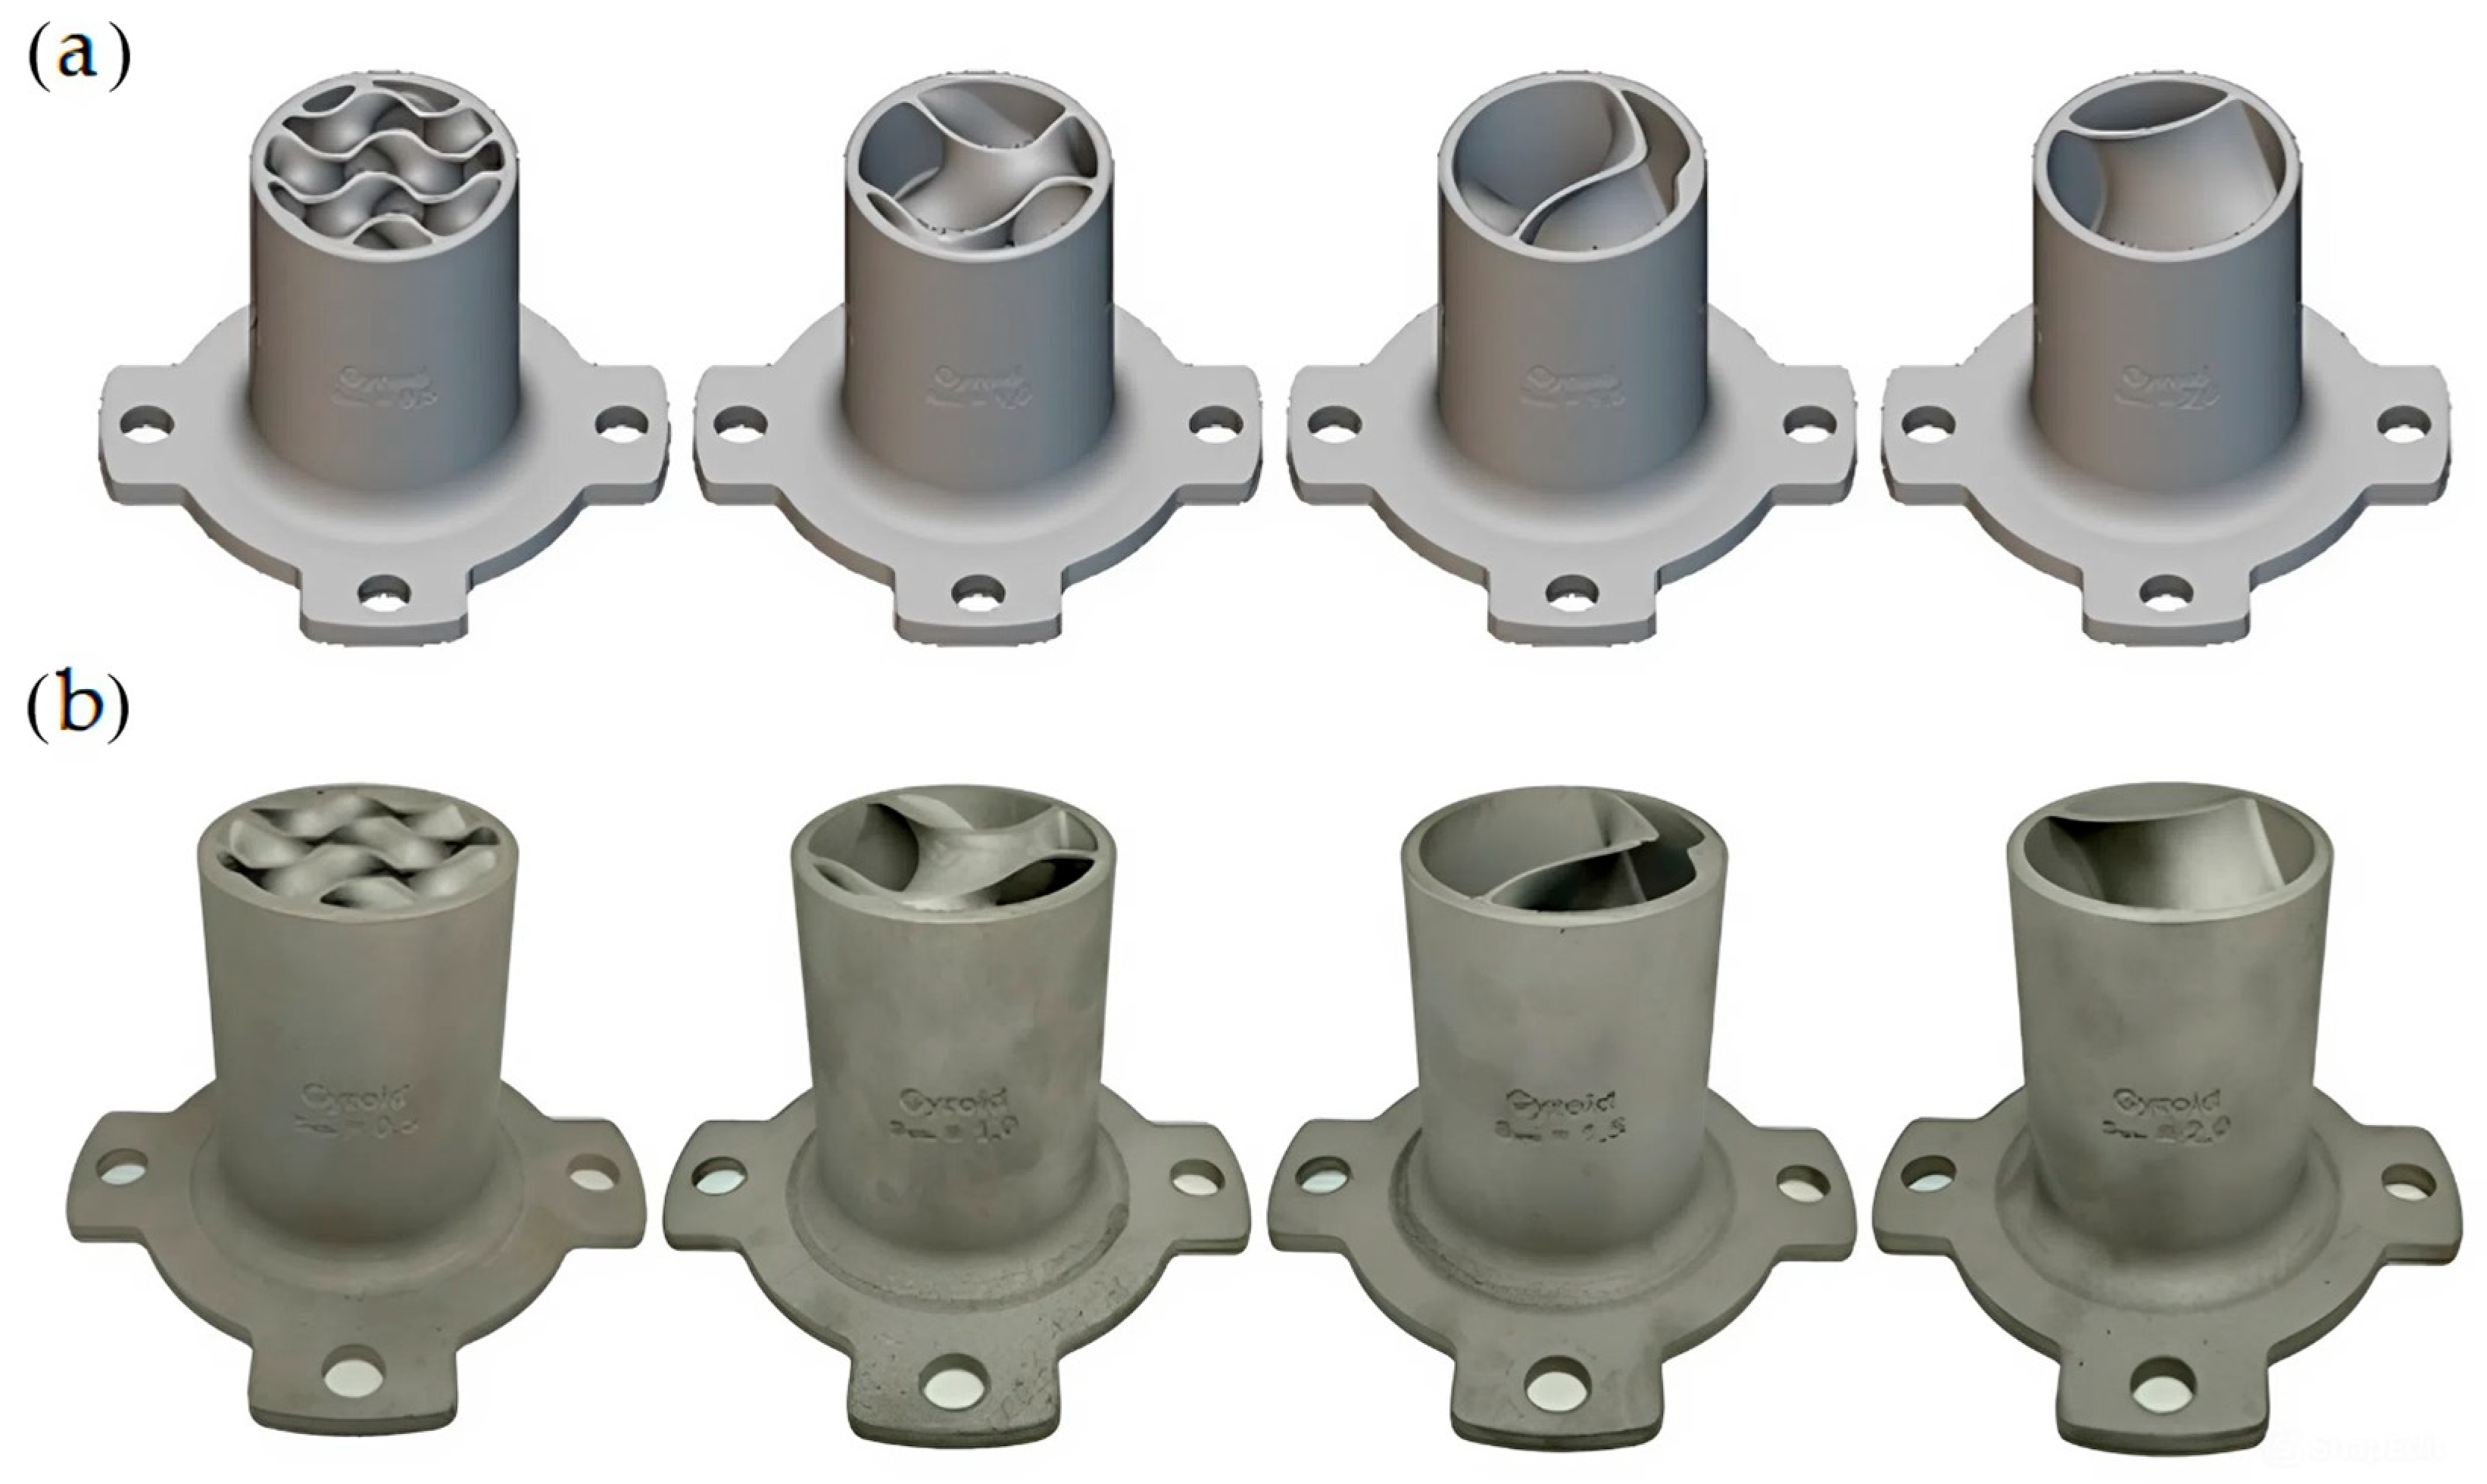
Several tubular sections with gyroid-type lattice structures, previously described, were used as test samples. Since the diameter of the test rig’s flow section is 60 mm, while the diameter of the investigated channels is 30 mm, a geometric scaling factor of 2 was applied. In subsequent analysis, the term “periodicity size” refers to the lattice structure’s periodicity relative to the channel dimensions. Geometric models and photographs of the samples are presented in Figure 20.
Table 4 presents the average values for four samples with gyroid lattice structures of varying periodicity, as well as for one experiment without a sample (smooth outlet channel only).
Graphs showing the dependencies of flow rate, hydraulic drag coefficient, and pressure losses were obtained and are presented in Figure 21. The gray line on the graphs represents the values for the smooth channel without a lattice structure.
These values were converted into relative units (with respect to the corresponding values for the smooth channel). The resulting graphs are presented in Figure 22.
In an analysis of the obtained dependencies, it can be observed that the airflow rate changes significantly when the relative lattice pitch is below 1. However, when the pitch varies within the range of 1 to 2 relative units, the flow rate remains almost constant and differs from that of the smooth channel (without turbulator) by less than 1%. At the same time, the pressure losses decrease with reduced lattice density and, as demonstrated by this experimental study, may exhibit an optimal point—where the pressure loss is minimized and the turbulator is most efficient.
In general, it can be traced that the growth rate of dependencies changes sharply in the region of values when the channel size is equal to the periodicity size of the lattice TPMS structure. This is largely due to a change in the flow area. Losses obviously increase strongly with decreasing values of the TPMS periodicity. At the same time, the difference between the hydraulic resistance of systems with values of the relative periodicity size greater than 1 does not have significant differences. And the extremum in hydraulic resistance is due to the fact that at large values of the periodicity size, “overlaps” of the flow part by the lattice are formed.

3.4. Results of Calculations Under Model Conditions of the Experimental Stand

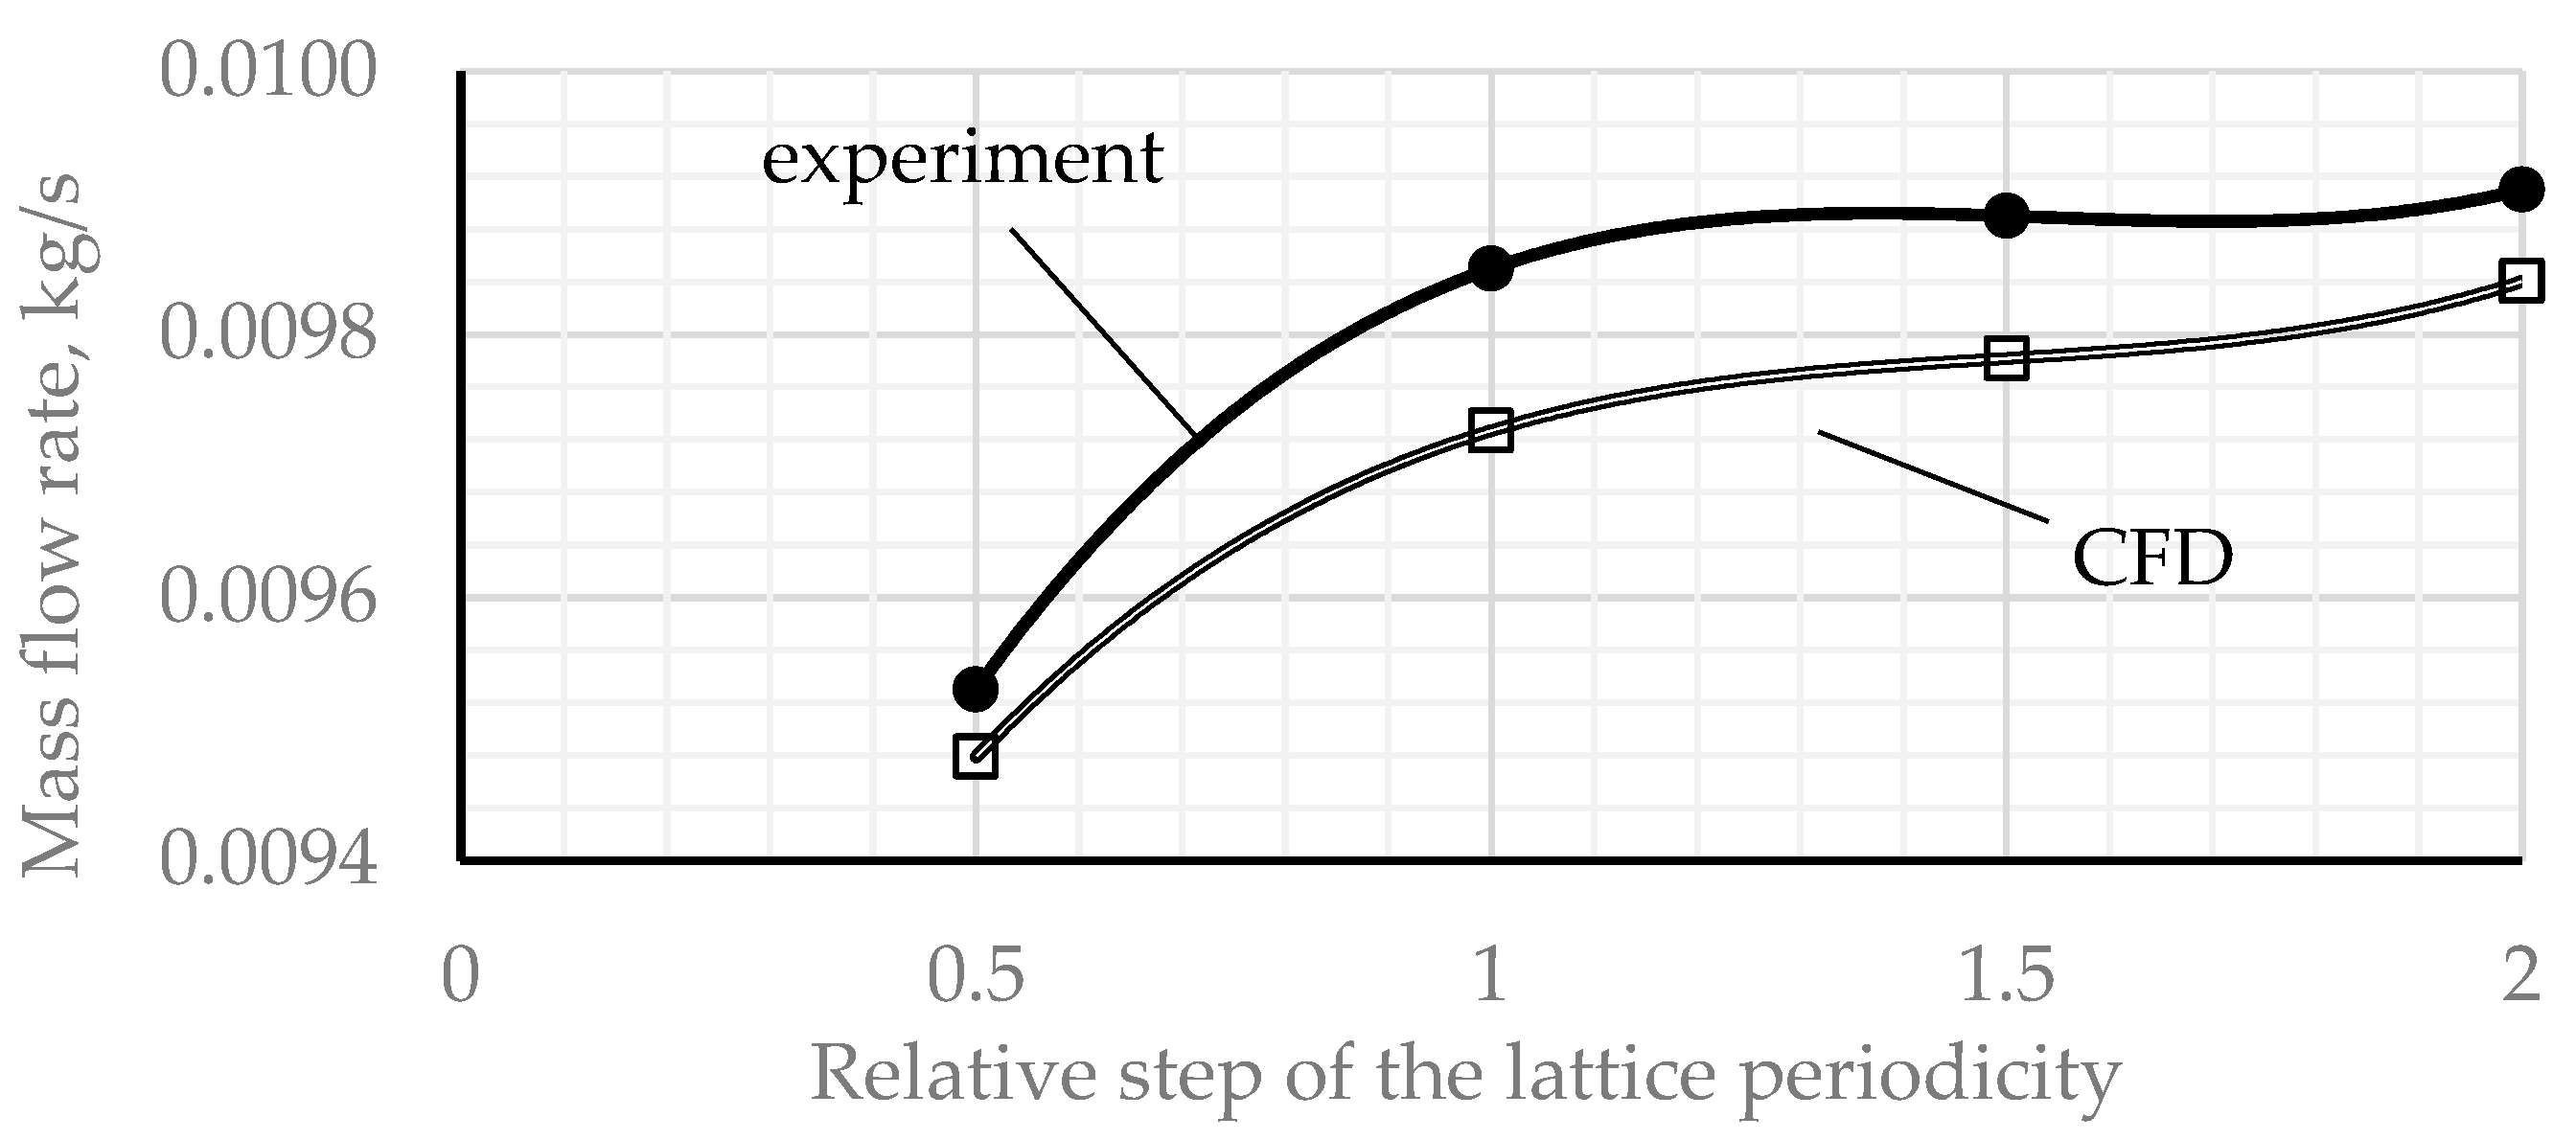
Thus, calculations were carried out for each of the samples, taking into account the model parameters. Based on the results of numerical modeling, a comparison of mass flows through the samples was made, and the deviation of the data obtained in the calculation process from the experimental data was determined. The mass flow rate graph for the experiment and the calculated model is shown in Figure 23.
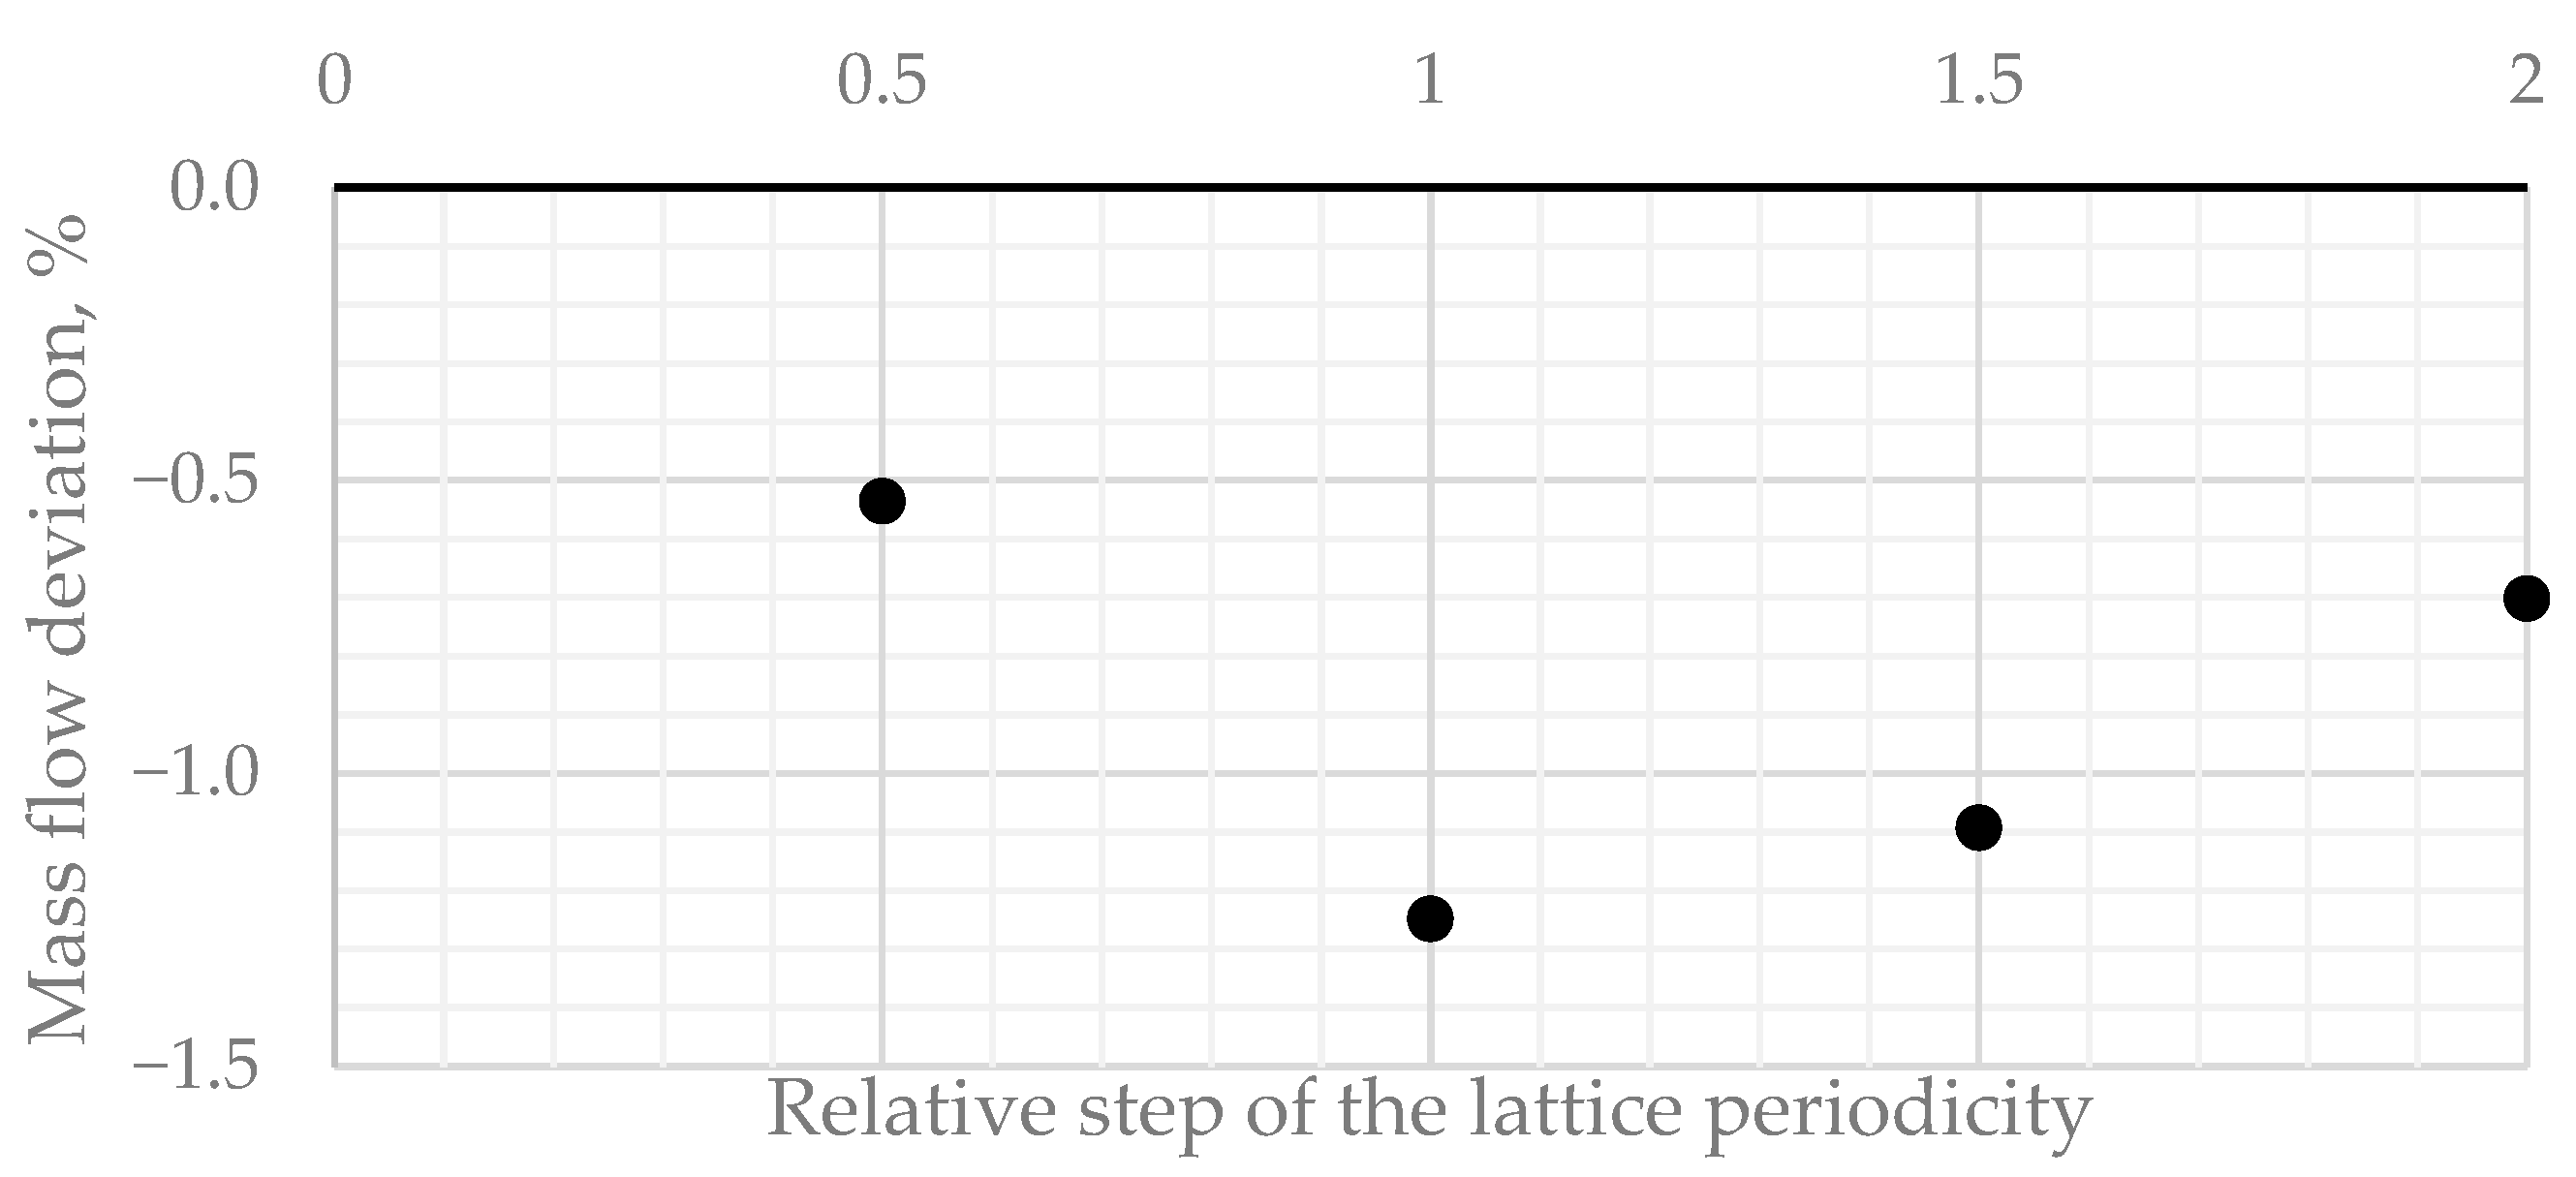
Figure 24 shows the values of deviations of the costs of the calculation model from the experiment.
As can be seen from the deviation values, for all the cases considered, the deviation was no more than 1.5 percent, which is good accuracy for the calculation model. The difference is due to the presence of roughness and the impossibility of accurately repeating it in the calculation model. However, these values of the deviations of the calculation and experiment are generally recognized as a good result guaranteeing the correspondence of the calculation and experiment. This in turn leads to the conclusion about the correctness of the calculations presented earlier.

4. Conclusions

The conducted study demonstrates the significant potential of using gyroid lattice structures (TPMS type) to enhance the efficiency of internal cooling systems in gas turbine engines. The implementation of gyroid structures increases the heat transfer coefficient (Nusselt number) by a factor of up to 8.28 within the investigated regimes and geometries due to flow turbulization. However, the rate of increase in hydraulic resistance surpasses the rate of convective heat transfer enhancement.
It was also established that the use of gyroid structures significantly increases the cooling depth coefficient by up to 1.93 times compared to a smooth channel. The maximum cooling depth is achieved at the minimum lattice periodicity; however, the simulation results show that further densification of the lattice structure leads to a decrease in the rate of improvement of the cooling depth coefficient.
The developed polynomial-regression-based mathematical models exhibit high accuracy (coefficient of determination R2 > 0.96) and enable the prediction of heat transfer, cooling depth, and hydraulic resistance without the need for labor-intensive CFD simulations.
The experimental validation confirmed the numerical results and helped refine the optimal range of relative lattice periodicity values, within which effective cooling is achieved with minimal hydraulic losses.
The obtained results are of considerable interest for further research into gas turbine cooling systems and can be used in the design of cooling channels with enhanced performance characteristics. It is worth noting that this study provides a formula for determining the optimal lattice parameters. Often, the optimum relative to the cold channel differs from absolute numbers. It is also important to mention that in the future, the optimum can be interconnected with the need to maintain a small mass of the object, in which case the target function will be the volume of the lattice. Further work involves the development of a full-fledged cooling system based on the derived dependencies. However, absolute indicators of the efficiency of the cooling system will be achieved with the densest lattice structure. In this case, mass restrictions will also play an important role. With the same mass of the lattice, it can have different sizes and thicknesses. And these dependencies will allow you to determine the optimum among the options for the lattice system.
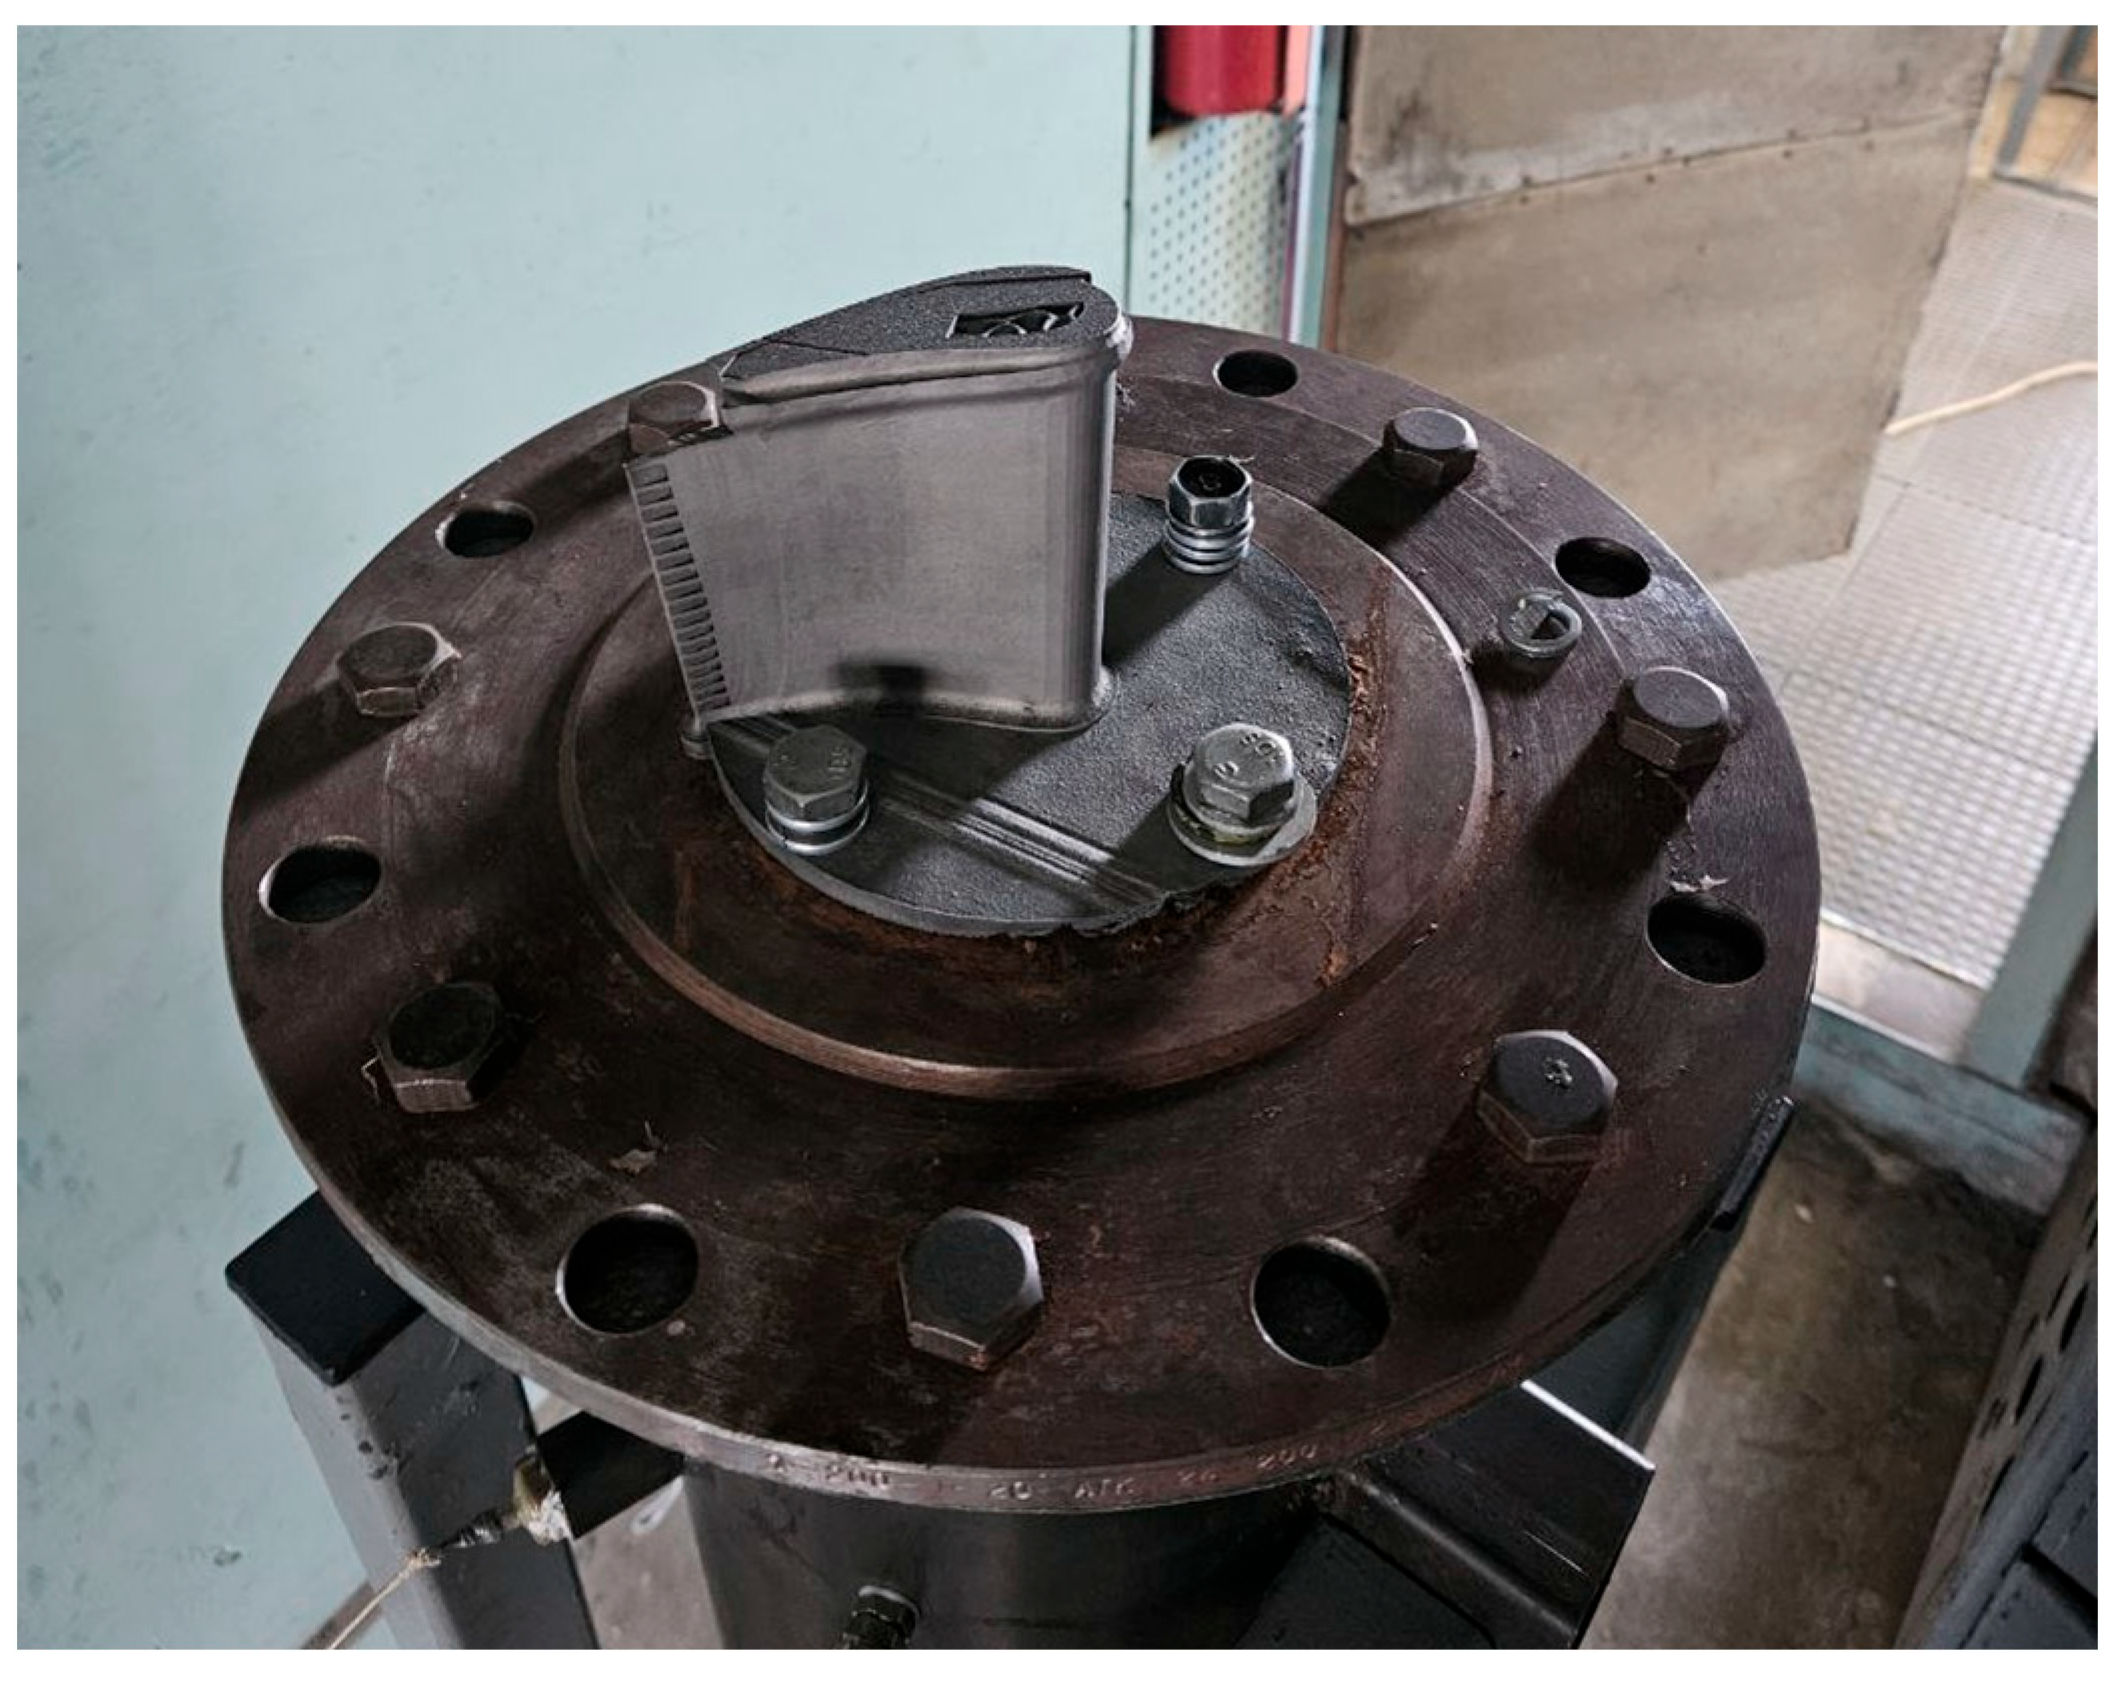
Further work on this topic includes the development of a full-fledged turbine blade cooling system using lattice structures inside as a turbulator. Figure 25 shows a photograph of a blade prototype with this cooling system. This blade is a blade of an existing gas turbine unit with a classic cooling system (convective-film with deflectors). As part of the R&D, a new system was developed for this blade, which showed higher cooling system efficiency indicators in contrast to the classic system, while the cooling air consumption decreased.
The prospect is to create a unified methodology for designing these blade cooling systems. This study is the first step in a series of large studies on the use of nature-like blade cooling systems manufactured using additive technologies.

Author Contributions

Conceptualization, A.P. (Anton Pulin), I.T., V.B. and A.P. (Anatoliy Popovich); methodology, I.T. and M.L.; software, M.L.; validation, D.K.; formal analysis, D.K. and K.S.; investigation, A.P. (Anton Pulin), I.T., D.K., K.A., M.K. and E.K.; resources, M.K., V.B. and A.P. (Anatoliy Popovich); data curation, A.P. (Anton Pulin), I.T. and K.A.; writing—original draft preparation, A.P. (Anton Pulin), I.T. and M.L.; writing—review and editing, D.K., M.L., V.B. and A.P. (Anatoliy Popovich); visualization, A.P. (Anton Pulin), I.T., K.A. and E.K.; supervision, V.B. and A.P. (Anatoliy Popovich); project administration, K.S.; funding acquisition, A.P. (Anatoliy Popovich) and K.S. All authors have read and agreed to the published version of the manuscript.

Funding

This research was funded by the Ministry of Science and Higher Education of the Russian Federation (project No. 075-15-2024-562 from 25 April 2024).

Data Availability Statement

The original contributions presented in this study are included in the article. Further inquiries can be directed to the corresponding author.

Conflicts of Interest

The authors declare no conflict of interest.

References

  1. Takeishi, K. Evolution of Turbine Cooled Vanes and Blades Applied for Large Industrial Gas Turbines and Its Trend toward Carbon Neutrality. Energies 2022, 15, 8935. [Google Scholar] [CrossRef]
  2. Invernizzi, C.M.; Di Marcoberardino, G. An Overview of Real Gas Brayton Power Cycles: Working Fluids Selection and Thermodynamic Implications. Energies 2023, 16, 3989. [Google Scholar] [CrossRef]
  3. Xu, L.; Sun, Z.; Ruan, Q.; Xi, L.; Gao, J.; Li, Y. Development Trend of Cooling Technology for Turbine Blades at Super-High Temperature of above 2000 K. Energies 2023, 16, 668. [Google Scholar] [CrossRef]
  4. Chang, S.W.; Wu, P.-S.; Wan, T.-Y.; Cai, W.-L. A Review of Cooling Studies on Gas Turbine Rotor Blades with Rotation. Inventions 2023, 8, 21. [Google Scholar] [CrossRef]
  5. Zhu, S.; Li, Y.; Yan, J.; Zhang, C. Recent Advances in Cooling Technology for the Leading Edge of Gas Turbine Blades. Energies 2025, 18, 540. [Google Scholar] [CrossRef]
  6. Wee, S.; Do, J.; Kim, K.; Lee, C.; Seok, C.; Choi, B.-G.; Choi, Y.; Kim, W. Review on Mechanical Thermal Properties of Superalloys and Thermal Barrier Coating Used in Gas Turbines. Appl. Sci. 2020, 10, 5476. [Google Scholar] [CrossRef]
  7. Guo, X.; Li, X.; Ren, J. Evolution of Rotating Internal Channel for Heat Transfer Enhancement in a Gas Turbine Blade. Aerospace 2024, 11, 836. [Google Scholar] [CrossRef]
  8. Xu, L.; Bo, S.; Hongde, Y.; Lei, W. Evolution of Rolls-Royce Air-Cooled Turbine Blades and Feature Analysis. Procedia Eng. 2015, 99, 1482–1491. [Google Scholar] [CrossRef]
  9. Shuai, L.; Qingsong, W.; Zhang, D.; Kai, C.C. Microstructures and Texture of Inconel 718 Alloy Fabricated by Selective Laser Melting. In Proceedings of the 1st International Conference on Progress in Additive Manufacturing, Singapore, 17–19 May 2016. [Google Scholar] [CrossRef]
  10. Raju, R.; Duraiselvam, M.; Arun, G.; Petley, V.; Shweta, R.; Rajendran, R. Mechanical and Metallurgical Characterization of Laser Metal Deposited Aero-Engine Blade Materials; Tampere University of Technology: Tampere, Finland, 2014. [Google Scholar]
  11. Wang, W.; Yan, Y.; Zhou, Y.; Cui, J. Review of Advanced Effusive Cooling for Gas Turbine Blades. Energies 2022, 15, 8568. [Google Scholar] [CrossRef]
  12. Yang, H.; Shan, Z.; Wu, R.; Yan, D.; Shi, J.; Huang, J.; Shi, H.; Dong, S.; Fang, X.; Hu, T. Research Progress on Additive Manufacturing Technology and Equipment for the Vat Polymerization of Ceramic Cores of Aeroengine Blades. Addit. Manuf. Front. 2025, 4, 200204. [Google Scholar] [CrossRef]
  13. Yeranee, K.; Rao, Y. A Review of Recent Research on Flow and Heat Transfer Analysis in Additively Manufactured Transpiration Cooling for Gas Turbines. Energies 2025, 18, 3282. [Google Scholar] [CrossRef]
  14. Huang, G.; Zhu, Y.; Liao, Z.; Xu, R.; Jiang, P.-X. Biomimetic Self-Pumping Transpiration Cooling for Additive Manufactured Porous Module with Tree-like Micro-Channel. Int. J. Heat Mass Transf. 2019, 131, 403–410. [Google Scholar] [CrossRef]
  15. Du Plessis, A.; Broeckhoven, C.; Yadroitsava, I.; Yadroitsev, I.; Hands, C.H.; Kunju, R.; Bhate, D. Beautiful and Functional: A Review of Biomimetic Design in Additive Manufacturing. Addit. Manuf. 2019, 27, 408–427. [Google Scholar] [CrossRef]
  16. Gad-el-Hak, I. Fluid–Structure Interaction for Biomimetic Design of an Innovative Lightweight Turboexpander. Biomimetics 2019, 4, 27. [Google Scholar] [CrossRef]
  17. Li, J.; Li, M.; Koh, J.J.; Wang, J.; Lyu, Z. 3D-Printed Biomimetic Structures for Energy and Environmental Applications. DeCarbon 2024, 3, 100026. [Google Scholar] [CrossRef]
  18. Ren, F.; Zhang, C.; Liao, W.; Liu, T.; Li, D.; Shi, X.; Jiang, W.; Wang, C.; Qi, J.; Chen, Y. Transition Boundaries and Stiffness Optimal Design for Multi-TPMS Lattices. Mater. Des. 2021, 210, 110062. [Google Scholar] [CrossRef]
  19. Hussain, S.; Ghopa, W.A.W.; Singh, S.; Azman, A.H.; Abdullah, S. Experimental and Numerical Vibration Analysis of Octet-Truss-Lattice-Based Gas Turbine Blades. Metals 2022, 12, 340. [Google Scholar] [CrossRef]
  20. Ligrani, P. Heat Transfer Augmentation Technologies for Internal Cooling of Turbine Components of Gas Turbine Engines. Int. J. Rotating Mach. 2013, 2013, 275653. [Google Scholar] [CrossRef]
  21. Zhang, G.; Rui, Z.; Gongnan, X.; Shulei, L.; Sunden, B. Optimization of Cooling Structures in Gas Turbines: A Review. Chin. J. Aeronaut. 2022, 35, 18–46. [Google Scholar] [CrossRef]
  22. Yeranee, K.; Xu, C.; Rao, Y.; Chen, J.; Zhang, Y. Rotating Flow and Heat Transfer Characteristics of a Novel Cooling Channel for Gas Turbine Blade Trailing Edge with Diamond-Type TPMS Structures. ASME J. Heat Mass Transf. 2024, 146, 051002. [Google Scholar] [CrossRef]
  23. Yeranee, K.; Rao, Y.; Xu, C.; Zhang, Y.; Su, X. Turbulent Flow Heat Transfer and Thermal Stress Improvement of Gas Turbine Blade Trailing Edge Cooling with Diamond-Type TPMS Structure. Aerospace 2023, 11, 37. [Google Scholar] [CrossRef]
  24. Patil, A.Y.; Hegde, C.; Savanur, G.; Kanakmood, S.M.; Contractor, A.M.; Shirashyad, V.B.; Chivate, R.M.; Kotturshettar, B.B.; Mathad, S.N.; Patil, M.B. Biomimicking Nature-Inspired Design Structures—An Experimental and Simulation Approach Using Additive Manufacturing. Biomimetics 2022, 7, 186. [Google Scholar] [CrossRef] [PubMed]
  25. Olivas-Alanis, L.H.; Fraga-Martínez, A.A.; García-López, E.; Lopez-Botello, O.; Vazquez-Lepe, E.; Cuan-Urquizo, E.; Rodriguez, C.A. Mechanical Properties of AISI 316L Lattice Structures via Laser Powder Bed Fusion as a Function of Unit Cell Features. Materials 2023, 16, 1025. [Google Scholar] [CrossRef]
  26. Wang, H.; Zhao, C.; Liu, W.; Liu, Z.; Bian, H.; Zhang, K. Advances in Triply Periodic Minimal Surface Structures for Thermal Management Systems: A Comprehensive Review. Appl. Therm. Eng. 2025, 279, 127481. [Google Scholar] [CrossRef]
  27. Pulin, A.; Laptev, M.; Alisov, K.; Barskov, V.; Rassokhin, V.; Gong, B.; Kotov, V.; Roshchenko, G.; Balakin, A.; Golubtsov, M. Heat Exchanger and the Influence of Lattice Structures on Its Strength. Mater. Phys. Mech. 2024, 52, 61–80. [Google Scholar] [CrossRef]
  28. Pulin, A.; Laptev, M.; Kortikov, N.; Barskov, V.; Roschenko, G.; Alisov, K.; Talabira, I.; Gong, B.; Rassokhin, V.; Popovich, A. Numerical Investigation of Heat Transfer Intensification Using Lattice Structures in Heat Exchangers. Energies 2024, 17, 3333. [Google Scholar] [CrossRef]
  29. Yeranee, K.; Rao, Y. A Review of Recent Investigations on Flow and Heat Transfer Enhancement in Cooling Channels Embedded with Triply Periodic Minimal Surfaces (TPMS). Energies 2022, 15, 8994. [Google Scholar] [CrossRef]
  30. Svoboda, D.G.; Zharkovskii, A.A.; Ivanov, E.A. Gidrodinamicheskoe Modelirovanie Techenii v Protochnoi Chasti Lopastnykh Nasosov s Ispol’zovaniem Programmnogo Paketa Ansys Fluent: Uchebnoe Posobie; SPbPU Press: St. Petersburg, Russia, 2022. (In Russian) [Google Scholar]
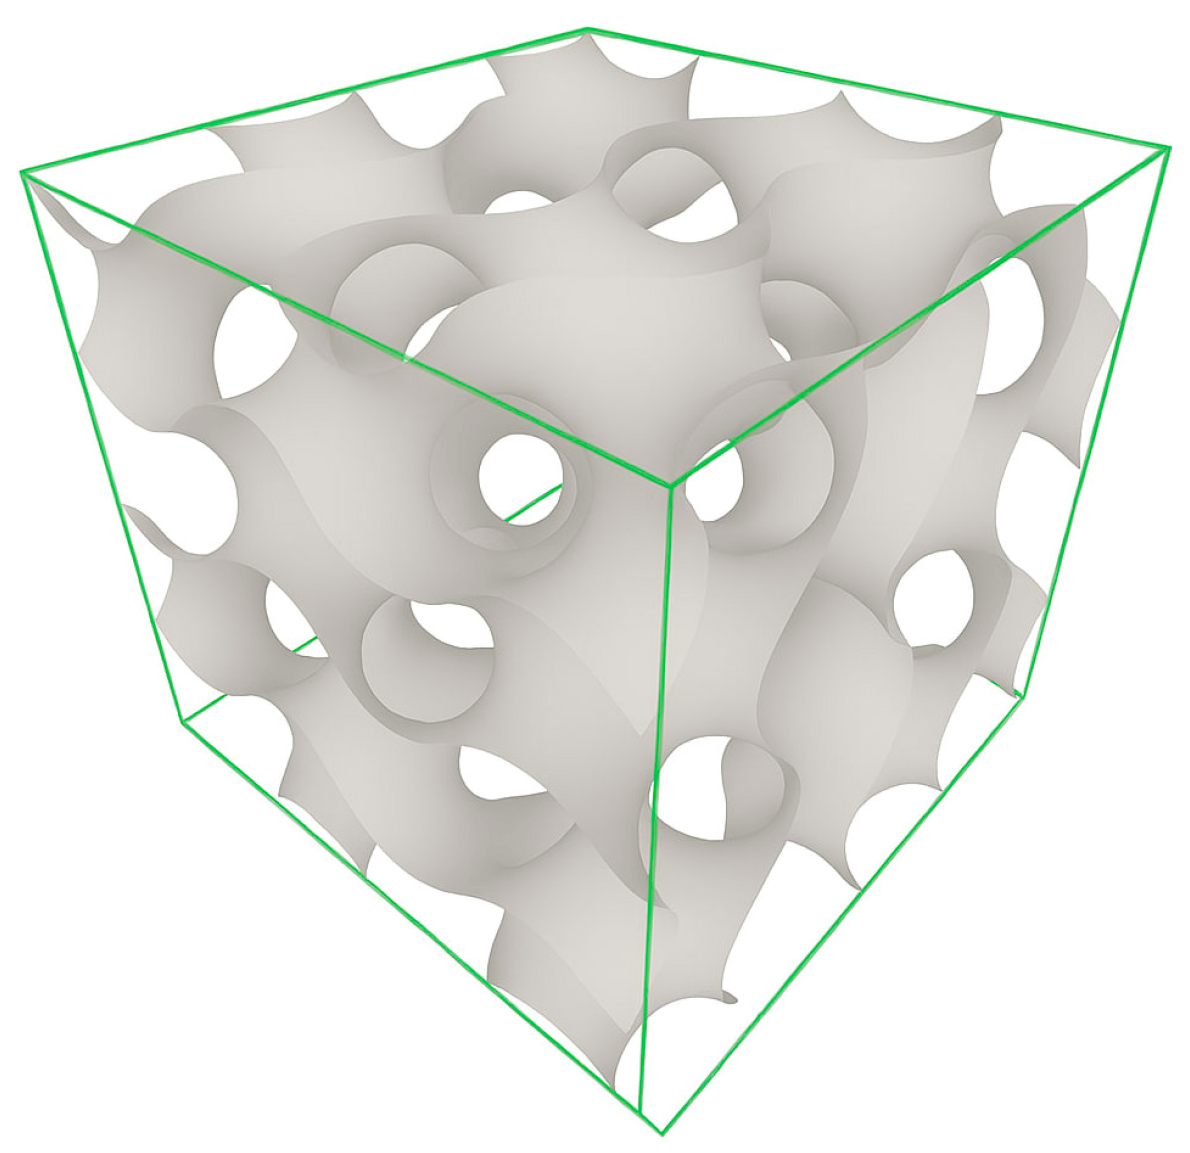
Figure 1. Gyroid lattice.
Energies 18 04552 g001
Figure 2. Computational model.
Energies 18 04552 g002
Figure 3. The appearance of the mesh model near the wall.
Energies 18 04552 g003
Figure 4. The structure of the turbulent boundary layer.
Energies 18 04552 g004
Figure 5. The plot of the Y + parameter for one of the models.
Energies 18 04552 g005
Figure 6. Graph of the mesh independence study.
Energies 18 04552 g006
Figure 7. Flowchart of the polynomial regression method.
Energies 18 04552 g007
Figure 8. Program flowchart.
Energies 18 04552 g008
Figure 9. Photograph of the “SLM printer” setup.
Energies 18 04552 g009
Figure 10. Gyroid lattice sample for flow testing.
Energies 18 04552 g010
Figure 11. Schematic and measurement diagram of the test rig.
Energies 18 04552 g011
Figure 12. Sample mounted on the test rig.
Energies 18 04552 g012
Figure 13. CFD model of the experiment for validation.
Energies 18 04552 g013
Figure 14. Temperature distributions.
Energies 18 04552 g014
Figure 15. Velocity distributions.
Energies 18 04552 g015
Figure 16. Cooling depth coefficient distributions.
Energies 18 04552 g016
Figure 17. Parameter dependencies on Reynolds number for the smooth tube: (a) Nusselt number; (b) cooling coefficient θ; (c) hydraulic drag coefficient.
Energies 18 04552 g017
Figure 18. Obtained mathematical models for the Gyroid-type lattice: (a) N u = f ( s r e l , t r e l , R e ) ; (b) θ = f ( s r e l , t r e l , R e ) ; (c) ζ = f ( s r e l , t r e l , R e ) ; (d) N u ζ = f ( s r e l , t r e l , R e ) .
Energies 18 04552 g018
Figure 19. Correlation matrix.
Energies 18 04552 g019
Figure 20. Geometric models (a) and photographs (b) of the samples.
Energies 18 04552 g020
Figure 21. Graph of dependence on relative lattice pitch: (a) flow rate, k g s ; (b) outlet pressure loss, kPa; (c) hydraulic drag coefficient.
Energies 18 04552 g021
Figure 22. Graph of dependence on relative lattice pitch: (a) relative flow rate; (b) relative pressure loss; (c) relative hydraulic drag coefficient.
Energies 18 04552 g022
Figure 23. The mass flow rate graph for the experiment and the calculated model.
Energies 18 04552 g023
Figure 24. Deviation of flow values for the calculation model from the experiment.
Energies 18 04552 g024
Figure 25. Prototype of blade manufactured using SLM with lattice cooling system.
Energies 18 04552 g025
Table 1. Investigated TPMS gyroid lattices.
Thickness, mmLattice Structure Periodicity, mm
15304560
1.0Energies 18 04552 i001Energies 18 04552 i002Energies 18 04552 i003Energies 18 04552 i004
1.5Energies 18 04552 i005Energies 18 04552 i006Energies 18 04552 i007Energies 18 04552 i008
2.0Energies 18 04552 i009Energies 18 04552 i010Energies 18 04552 i011Energies 18 04552 i012
Table 2. Boundary conditions of the simulation.
ParameterNotationUnit of
Measurement
Value
Inlet coolant
velocity
ν m s 1–9
Inlet coolant
temperature
T i n °C200
Wall heater
temperature
T w a l l °C1000
Outlet pressure P o u t atm.1
Table 3. Data obtained during the calculation process.
TurbulizerThe Value of Nusselt NumberThe Value of the Depth Coefficient of Cooling θThe Value of the Coefficient of Hydraulic Resistance ζ
Reynolds Number at Inlet
120036356080854011,000120036356080854011,000120036356080854011,000
Gyroid s r e l = 0.5; t = 1.0 mm76.85139.61169.83191.04208.960.5700.7710.8310.8610.88223.1616.2414.6714.5314.57
Gyroid s r e l = 0.5; t = 1.5 mm81.03149.49181.00203.29222.850.5800.7810.8400.8690.88828.9621.8120.0719.3319.05
Gyroid s r e l = 0.5; t = 2.0 mm84.46159.05192.76217.12238.310.5800.7800.8400.8700.89037.8027.4724.8123.7623.88
Gyroid s r e l = 1.0; t = 1.0 mm57.97108.33128.61145.65157.210.4880.7000.7720.8080.8318.235.374.574.424.40
Gyroid s r e l = 1.0; t = 1.5 mm63.10109.71132.00152.13166.900.5340.7230.7830.820.83813.378.937.637.436.13
Gyroid s r e l = 1.0; t = 2.0 mm61.05119.98152.59164.09182.120.4890.7170.7850.8190.8449.817.716.316.036.31
Gyroid s r e l = 1.5; t = 1.0 mm46.9588.09110.63126.82139.780.4250.6370.7180.7600.7874.823.272.682.342.24
Gyroid s r e l = 1.5; t = 1.5 mm49.1692.15114.1129.72142.730.4280.6430.7230.7650.7915.023.392.752.372.23
Gyroid s r e l = 1.5; t = 2.0 mm51.4794.32116.72132.76145.430.4350.6450.7240.7660.7945.093.282.872.42.32
Gyroid s r e l = 2.0; t = 1.0 mm43.5883.76104.87121.06132.590.4070.6350.7160.7560.7824.363.012.442.061.88
Gyroid s r e l = 2.0; t = 1.5 mm44.9283.65101.98115.33125.760.4170.6290.7070.7490.7743.792.842.352.011.81
Gyroid s r e l = 2.0; t = 2.0 mm43.6577.9195.35110.7123.930.4030.6090.6940.7370.7662.991.751.301.361.38
Typical ribs21.5443.7350.3264.7777.40.3410.5720.6700.7100.7391.460.940.730.710.69
Typical pins28.3444.9651.0566.1079.940.3700.6210.7270.7510.7801.771.631.611.581.48
Smooth channel10.2019.8632.7947.7761.850.5500.3790.3210.3030.2790.550.380.320.300.20
Table 4. Averaged data of experimental study.
s r e l Air DensityDP PressureAir Flow RateTemperature T1Temperature T2Pressure P1Pressure P2
k g m 3 kPa k g s °C°CkPakPa
0.52.083722.20750.0095327.0621.7678.4760.3322
12.131623.13560.0098527.5122.0882.6660.2370
1.52.137423.25970.0098927.7022.2583.1860.2526
22.140923.35090.0099127.6922.3383.5620.2942
Smooth2.142923.38260.0099227.7422.4283.6710.2100
Disclaimer/Publisher’s Note: The statements, opinions and data contained in all publications are solely those of the individual author(s) and contributor(s) and not of MDPI and/or the editor(s). MDPI and/or the editor(s) disclaim responsibility for any injury to people or property resulting from any ideas, methods, instructions or products referred to in the content.