Article

BENEFIT: An Energy Management Platform for Smart and Energy Efficient Buildings

by
Mihaela Aradoaei
,
Romeo-Cristian Ciobanu
*,
Cristina Mihaela Schreiner
,
Gheorghe Grigoras
and
Razvan-Petru Livadariu
Faculty of Electrical Engineering, Energetics, and Applied Informatics, “Gheorghe Asachi” Technical University of Iasi, 700050 Iasi, Romania
*
Author to whom correspondence should be addressed.
Energies 2025, 18(17), 4542; https://doi.org/10.3390/en18174542
Submission received: 25 July 2025 / Revised: 22 August 2025 / Accepted: 26 August 2025 / Published: 27 August 2025

Abstract

Buildings are among the most significant sources of energy consumption worldwide. Unfortunately, many are inefficient in terms of energy use, leading to high operational expenses. With modern technologies such as IoT sensors, smart meters, secure real-time communication, and advanced mathematical algorithms for data processing integrated into an efficient energy management platform, traditional buildings can be transformed into smart structures. In this context, a platform called “Building Energy Efficiency in Totality” (BENEFIT), which incorporates the smart building energy management (SBEM) concept, has been designed, developed, integrated, and tested as an innovative tool for monitoring and optimally controlling energy consumption. The platform is based on open-source software, enabling rapid and straightforward development of comprehensive solutions that address all aspects of the SBEM concept. The BENEFIT architecture allows the management of a wide range of devices within the building, including energy generation units, heating, ventilation, and air conditioning systems, indoor lighting, environmental sensors, surveillance cameras, and others. BENEFIT has been implemented and tested in a building belonging to the Faculty of Electrical Engineering at the Technical University of Iasi, Romania. The analysis of the results after one year of integrating the BENEFIT platform has resulted in a plan focused on measures to reduce energy consumption and improve the building’s performance and efficiency. The implementation of two measures (upgrading window insulation and improving lighting) resulted in a 12.14% reduction in total energy consumption.

1. Introduction

Global warming, the resource crisis, and rapid technological progress have increased awareness among international organizations, governments, cities, and communities about developing a green, sustainable energy economy. This strategy emphasizes innovation and technological advancements, promotes the efficient use of renewable natural resources, and aims for sustainable development, a reduction in fossil fuel consumption, and environmental conservation [1]. The construction industry is a leading advocate of sustainable practices and energy-efficient technology. Increasingly, housing complexes, administrative buildings, universities, and hospitals are incorporating sustainable structural elements and technological processes [2]. This development signifies a shift in the European Union (EU) countries from traditional buildings (which are usually high energy consumers) towards self-sustainable, energy-efficient structures that are more economical, durable, and comfortable [3].
The principle of “energy efficiency first” plays a vital role in EU environmental policies. According to EU documents, traditional buildings make up 40% of total energy consumption, with 36% of that consumption linked to energy-producing emissions. About 85% of the buildings were constructed before 2000 [4]. Improving energy efficiency is important for energy saving, reducing costs for citizens and businesses, and achieving a zero-emission, fully decarbonized building sector by 2050. Currently, however, the annual rate of energy upgrades is only 1%, which is very low. By comparison, the United States relies on about 37%, Africa on 34%, and Asia on 25% [5].
As expected, several directives influence the EU countries’ policies on green buildings, energy efficiency, renewable energy, and related fields. The most frequently referenced regulations in research papers included Directive 2010/31/EU on the energy performance of buildings [6], Directive 2009/28/EC concerning the promotion of renewable energy sources [7], and Directive 2012/27/EU on energy efficiency [8].
The updated Energy Efficiency Directive (EU/2023/1791) [9] has significantly increased the targets for the EU. It officially recognizes “energy efficiency first” as a core principle of EU energy policy, assigning it legal status for the first time. The directive mandates all EU member states to integrate energy efficiency into their various policies and investments. The 2023 update originates from a proposal for a recast directive on energy efficiency introduced by the EU in July 2021 as part of the Green Deal program [10]. This proposal was further developed within the REPowerEU plan [11], which aims to reduce the EU’s dependency on Russian fossil fuel imports. To meet a 55% reduction in greenhouse gas (GHG) emissions by 2030, Europe must accelerate its transition to systems powered by renewable electricity and gases. EU institutions are currently establishing new targets to increase the share of renewable energy and improve energy efficiency by 2030. This effort demands strong commitment from both EU and national decision-makers, who are responsible for implementing urgent, no-regret measures and driving a profound, systemic transformation of our economies into a reality. Member States are collectively required to reduce energy consumption by at least 9% by 2030 compared to 2020 levels. The EU member states are required to contribute to the energy efficiency of their buildings and other facilities. Additionally, they should outline an indicative pathway for these contributions in updates to their national energy and climate plans [12].
All EU policies on green buildings, energy efficiency, and renewable energy converge under the concept of Smart Buildings, which has been around for some time, but defining what makes a building smart can be challenging. The word “smart” suggests that the rising demand for such buildings indicates a lack of intelligence in many existing structures. The importance of Smart Buildings is growing as data access expands and technology advances. These innovative technologies include Advanced Metering Infrastructure (AMI) and Wireless Sensor Networks (WSNs), which support Artificial Intelligence (AI) techniques, Machine Learning (ML), Digital Twins (DT), Internet of Things (IoT), Cyber-Physical Systems (CPS), Edge and Cloud Computing (ECC), and Building Information Modeling (BIM) [13]. Recent progress based on these technologies has enabled the development of highly adaptable Smart Building Energy Management Systems (SBEMS). By integrating real-time data from IoT sensors that monitor temperature, occupancy, and energy consumption, these systems allow smart buildings to automatically adjust their heating, ventilation, and air conditioning (HVAC), lighting, and other equipment/devices. Such features not only improve operational efficiency but also increase the occupant comfort and support sustainability [14].
The SBEMS include smart building automation (SBA), marking a significant change in modern management infrastructure, designed to make buildings more efficient, comfortable, and sustainable through technological solutions. SBA technology involves a network of connected hardware and software designed to monitor and control a building’s environment [15].
To address practical challenges, the SBEMS must consider the building’s physical characteristics, weather forecasts, occupancy predictions, and resulting consumption. This framework, integrated by the SBA, offers an innovative solution for buildings, helping the decision-makers (DM) optimize energy consumption, monitor performance, and maintain occupant comfort.
In this context, a management platform called “Building Energy Efficiency in Totality” (BENEFIT), which integrates the SBEMS concept, has been designed, developed, and implemented as an innovative tool for controlling, monitoring, and implementing building management strategies. Its goal is to optimize energy consumption for each building. The platform is built on open-source software, enabling rapid and straightforward development of comprehensive solutions that cover all aspects of the SBEMS concept. The architecture allows the management of a wide range of devices within the SBEMS, including energy generation units, indoor lighting, environmental sensors, surveillance cameras, and other devices.
The original contributions of the BENEFIT platform, including the SBMES, refer to the following:
  • Data management involves handling both static and dynamic data collected from various acquisition points equipped with IoT sensors capable of measuring different parameters, such as temperature, humidity, energy consumption, pressure, and thermal comfort, depending on sensor placement and the overarching objective set by the DM.
  • Data security and system integrity are safeguarded against cyber threats by three main measures: unique and confidential MAC addresses for network devices, hardware key coding using 128-bit AES for all data exchanges within the network, and strict regulation of node access to remote terminal units (RTUs) and data concentrators (CDs).
  • A software application is developed and integrated to supervise, manage, and monitor the building, complemented by a Building Simulation Tool to improve energy efficiency. Remote control and access features enabled advanced automated control, monitoring, management, and maintenance of systems and services, both on-site and remotely, in a seamless and coordinated manner.
  • Identifying recommended actions that suggest measures to improve energy efficiency and optimize energy transfer within the building. The platform selects these actions using complex decision-making processes that consider data from multiple sources, detected events, and various situational constraints.
The paper is structured into five sections, as outlined below. Section 2 addresses a background literature review, highlighting the challenges, opportunities, and the main gaps that affect their adoption and implementation. Section 3 presents details regarding the BEMSs integrating smart automation. Section 4 details the proposed platform based on a BEMS, which can be used for any type of building. Section 5 contains the discussions regarding the results and the main strengths of the BENEGIT. Finally, Section 6, which covers the conclusions and recommendations, emphasizes the main contributions of the study and suggests possible directions for future research.

2. Background Literature Review

Smart technologies revolutionized energy management, comfort, and data security in buildings. The choice of technology and features often depends on the specific building type adopting them. This section reviews the significant studies from 2019 to 2025 that integrate research on SBEMS within buildings, examining the unique challenges and opportunities influencing their adoption and implementation.
Suciu et al. proposed in [16] two management tools for buildings: a business platform and a smart energy service. The business intelligence tool helps analyze and visualize energy consumption and production. Additionally, it simulates the economic impact of implementing energy efficiency measures. The second management tool is designed to help manage data related to energy consumption in buildings. The system can provide actionable information and enable informed decision-making by utilizing analytics and forecasting. The study proposed in [17] analyzed how knowledgeable people are about energy management. It looked into their environmental and user behavior impacts, as well as how this knowledge affects their energy consumption and costs. Based on a survey that collected 100 valid responses in Palestine, the research model evaluated the knowledge and habits of building occupants. A smart PLS software was utilized to analyze the model through partial least squares structural equation modeling. According to the findings, disseminating information can result in behavioral changes among residents, which can lead to reduced expenses and an improved environment.
Grigoras and Neagu [18] proposed an advanced management platform for industrial buildings that can help improve a facility’s energy efficiency. It comprises different modules, such as forecasting, production scheduling, and database management. Through the use of data mining and artificial intelligence, the system can eliminate uncertainties related to the behavior of certain processes.
The study presented in [19] examined the connection between energy management and smart city policies. To achieve a more efficient and sustainable building, the researchers developed an artificial intelligence technique for monitoring systems in smart buildings, which can monitor and control a building’s energy consumption. Additionally, it can also help predict the future generation of renewable energy and assess recycling.
The study conducted by Chatzikonstantinidis et al. in [20] analyzed the role of digital twins in improving the energy systems of a residential complex in Cyprus. They employed various predictive models (Skforecast, XGBoost, LightGBM, CatBoost, Long Short-Term Memory—LSTM, and recurrent neural networks—RNNs) to forecast the complex’s energy consumption. Although the gradient boosting models could predict changes in energy consumption, the LSTM model proved more accurate in capturing long-term trends. These models are essential for identifying potential shifts in energy demand caused by unexpected events, such as the coronavirus pandemic. Digital Twins enable the researchers to monitor and make informed decisions in real-time.
An efficient algorithm, called the Modified Weighted Mean of Vectors algorithm, has been proposed in [21] to improve energy management in smart buildings. It overcomes some limitations of existing methods by providing a more accurate and comprehensive approach. The algorithm uses an Elite Centroid Quasi-Oppositional Base Learning method to improve its exploitation capabilities. It also incorporates an adaptive levitation motion technique for exploration. The algorithm aims to optimize the energy consumption of smart buildings. It utilizes a time-of-use strategy for electricity management, which helps to reduce costs and improve the peak-to-average ratio.
The study conducted by Swetha et al. in [22] highlighted a framework that enables machine learning to improve the efficiency of energy management systems in buildings. Using a systematic approach, they demonstrated how this could reduce operational costs and increase occupant comfort. Through machine learning, the researchers identified potential energy-saving systems and enhanced the efficiency of air conditioning, heating, and ventilation systems in buildings. They also managed to implement intelligent lighting schedules by analyzing data collected from various sources.
Shukla et al. [23] introduced a real-time monitoring system that tracks the dynamic energy usage graphs within buildings, aiming to reduce energy waste and establish an efficient energy management framework focused on battery storage. This system can be expanded by integrating IoT to continuously monitor and control device energy consumption through frequent analysis of real-time data. An energy management algorithm then ensures the optimal scheduling of smart appliances, heating, ventilation, and local power generation devices. Zhu [24] examined the use of smart energy management systems in green buildings. It explored the integration of green buildings, smart structures, and energy management systems to find practical solutions for building energy efficiency. The findings indicated that adopting these systems can enhance both energy efficiency and environmental sustainability in green buildings. Overall, the research combined smart technologies with energy management to provide an innovative, integrated approach in the green building sector, supporting the future development of the construction industry.
Revati et al. [25] focused on a data-driven method for predicting load profiles in a commercial smart building using Gaussian Process Regression (GPR). They also compared GPR with Polynomial Regression, Artificial Neural Network (ANN), Dynamic Mode Decomposition (DMD), and Hankel DMD (HDMD) to identify issues associated with these methods. The results indicated that HDMD and GPR are reliable and effective for making accurate predictions, supporting the planning of demand response schedules to gain benefits such as financial incentives and reduced carbon emissions. Berbakov et al. [26] introduced the InBetween IoT platform, developed to improve energy efficiency in intelligent buildings. The platform relies on open-source software that facilitates the integration of field-deployed devices with advanced energy services. These services, customized for specific use cases, analyze user energy consumption patterns and offer recommendations via a mobile application, thereby promoting a more energy-efficient lifestyle.
An energy management approach centered on user satisfaction was proposed by Khezzane et al. in [27], built on three core principles that enable measuring user satisfaction. Energy allocation, constrained by a fixed budget, was carried out using a genetic algorithm, introducing an energy consumption pattern that maximizes user satisfaction within the budget. The outcomes of each simulation demonstrate that the algorithm effectively maximized user satisfaction while also minimizing the cost per unit of satisfaction. Saluja et al. [28] introduced a smart system for monitoring energy use in intelligent buildings, serving as a bridge between the smart grid and the buildings. They developed a web-based platform that allows users to view sensor data and track energy consumption across the entire grid. Utilizing AI, the system provides energy-saving recommendations by analyzing consumption patterns and weather data. Its adaptable design permits modifications to automated protocols to meet changing power demands and grid conditions. Data transfer between client devices and the central server occurs via a Zigbee network with a star topology, ensuring smooth communication.
An energy management system using Q-learning to optimize building energy operations has been proposed in [29]. It combines Renewable Energy Sources (RES) with Demand-Side Management (DSM) to reduce costs and enhance sustainability. The Q-learning algorithm dynamically adjusts system components, such as photovoltaic (PV) capacity, grid purchases, and storage, to minimize costs. The study presented in [30] describes the design and development of a home energy management system (HEMS) that collects and stores energy usage data from household appliances and the main energy load. It includes two configurations: one operating locally, disconnected from the Internet, using an edge device for processing and storage; and another functioning in the cloud, utilizing AWS IoT Core to manage data messages and deliver data-driven services and applications. Khan et al. [31] developed a Smart Building Energy Management System connected to a bidirectional power network that integrates thermal and electrical power loops. To address the optimization challenge, they employed an optimization model whose solution was obtained using a genetic algorithm. Piras et al. [32] focused on the Digital Twin and Smart Building concepts integrated into a smart energy management system. It included diverse IoT components, designed automation flows for energy-efficient lighting, HVAC, indoor air quality management, and supported decision-making through real-time data visualization via user interfaces and dashboards that included geometric and informational models. The system provides tools for monitoring, simulation, planning, and decision support by developing and implementing machine learning algorithms. In a study conducted by Saeed et al. [33], an energy management system has been developed that enables smart buildings to share energy efficiently. It employs game theory, specifically the Shapley value, to fairly allocate surplus energy from buildings with excess capacity to those with shortages, considering demand differences. The primary aim is to minimize energy waste while maintaining a balance between supply and demand.
Data analysis, monitoring, simulation, and identification of actions to enhance energy efficiency are essential tasks in the SBEMS. Data analysis using advanced mathematical algorithms involves examining raw data to identify patterns and trends, supporting the decision-maker in the decision-making process. Monitoring evaluates progress based on measured parameters, utilizing classical or IoT sensors and smart meters, which enable strategic adjustments when necessary. Simulations using integrated professional software assess the potential outcomes under various actions based on key performance indicators (KPIs), assisting in risk assessment and mitigation.
In this context, Table 1 presents a synthesis of the state-of-the-art references, including the key characteristics related to an SBEMS. The main gaps identified at the level of the SBEMS mainly concern data security, software tools, and energy efficiency actions based on KPIs.
Almost all studies neglect data security, with only one addressing this aspect. Furthermore, only two studies have used professional software for scenario analysis to identify vulnerabilities in energy consumption. Only two studies incorporate energy efficiency measures based on KPIs derived from the software’s output data. Lastly, two-thirds of the studies focused solely on residential buildings.
A deeper analysis, building on the synthesis above, revealed the following specific weaknesses:
  • Predefined control strategies are connected to systems that operate based on fixed energy management plans. For instance, HVAC and lighting systems activate only when certain thresholds are reached, with their control actions predetermined. As a result, these systems often fail to respond reliably and lack the ability to adapt to changing conditions, such as current or forecasted outdoor weather, occupancy levels, and activities within the building. Additionally, other high-energy-consuming devices are managed solely according to fixed operational schedules.
  • Lack of integration refers to inadequate coordination between local energy generation within the building, overall energy consumption, and utility supply conditions. Currently, energy generation and consumption are treated as separate entities, lacking proper integration.
  • Centralized control without efficiency algorithms means that, although these systems provide centralized management of energy-consuming resources, they lack specific energy efficiency algorithms.
The main strengths of the BENEFIT platform compared to existing solutions include the following:
  • Integrating a smart user interface (SUI) that enables users to set energy schedules and receive notifications, thereby improving energy efficiency. The integrated smart BMES identifies the most energy-efficient actions to maintain comfort. The system offers cooperation and awareness services via this multimodal SUI, which is accessible through operating systems and mobile devices.
  • Developing a simulation and analysis tool linked to the DesignBuilder software that utilizes data from all smart sensors and meters, providing precise information on variables such as temperature and building envelope properties, which are essential for calculating heat transfer. This allows for the estimation of heat input or removal by the air conditioning. The platform also includes a real-time consumption management algorithm that plans operations based on performance indicators, projected requirements, and flexibility. It adjusts schedules dynamically to match actual energy demand and optimizes resource use through multiple strategic algorithms.

3. Building Energy Management System Integrating Smart Automation

The smart BMES is a control system that efficiently manages automation operations, considering factors such as residents’ comfort preferences, grid energy prices, climate change, and other relevant factors. It also supplies power for automation from available energy sources such as the grid, renewables, and energy storage [34].
A smart BMES allows an operator to access, oversee, and regulate all connected building systems through a single interface. By utilizing SBA technology, the DM can centrally control the building’s systems via interconnected electronic devices. Previously, fine-tuning HVAC, lighting, power, and access control demanded substantial manual effort. Modern solutions not only unify these traditionally separate systems but also provide visibility and management from one interface, making decision-making easier and saving time. Additionally, SAB’s key benefit is its ability to optimize comfort and efficiency. Analyzing extensive data allows for informed decisions to reduce or eliminate energy waste.
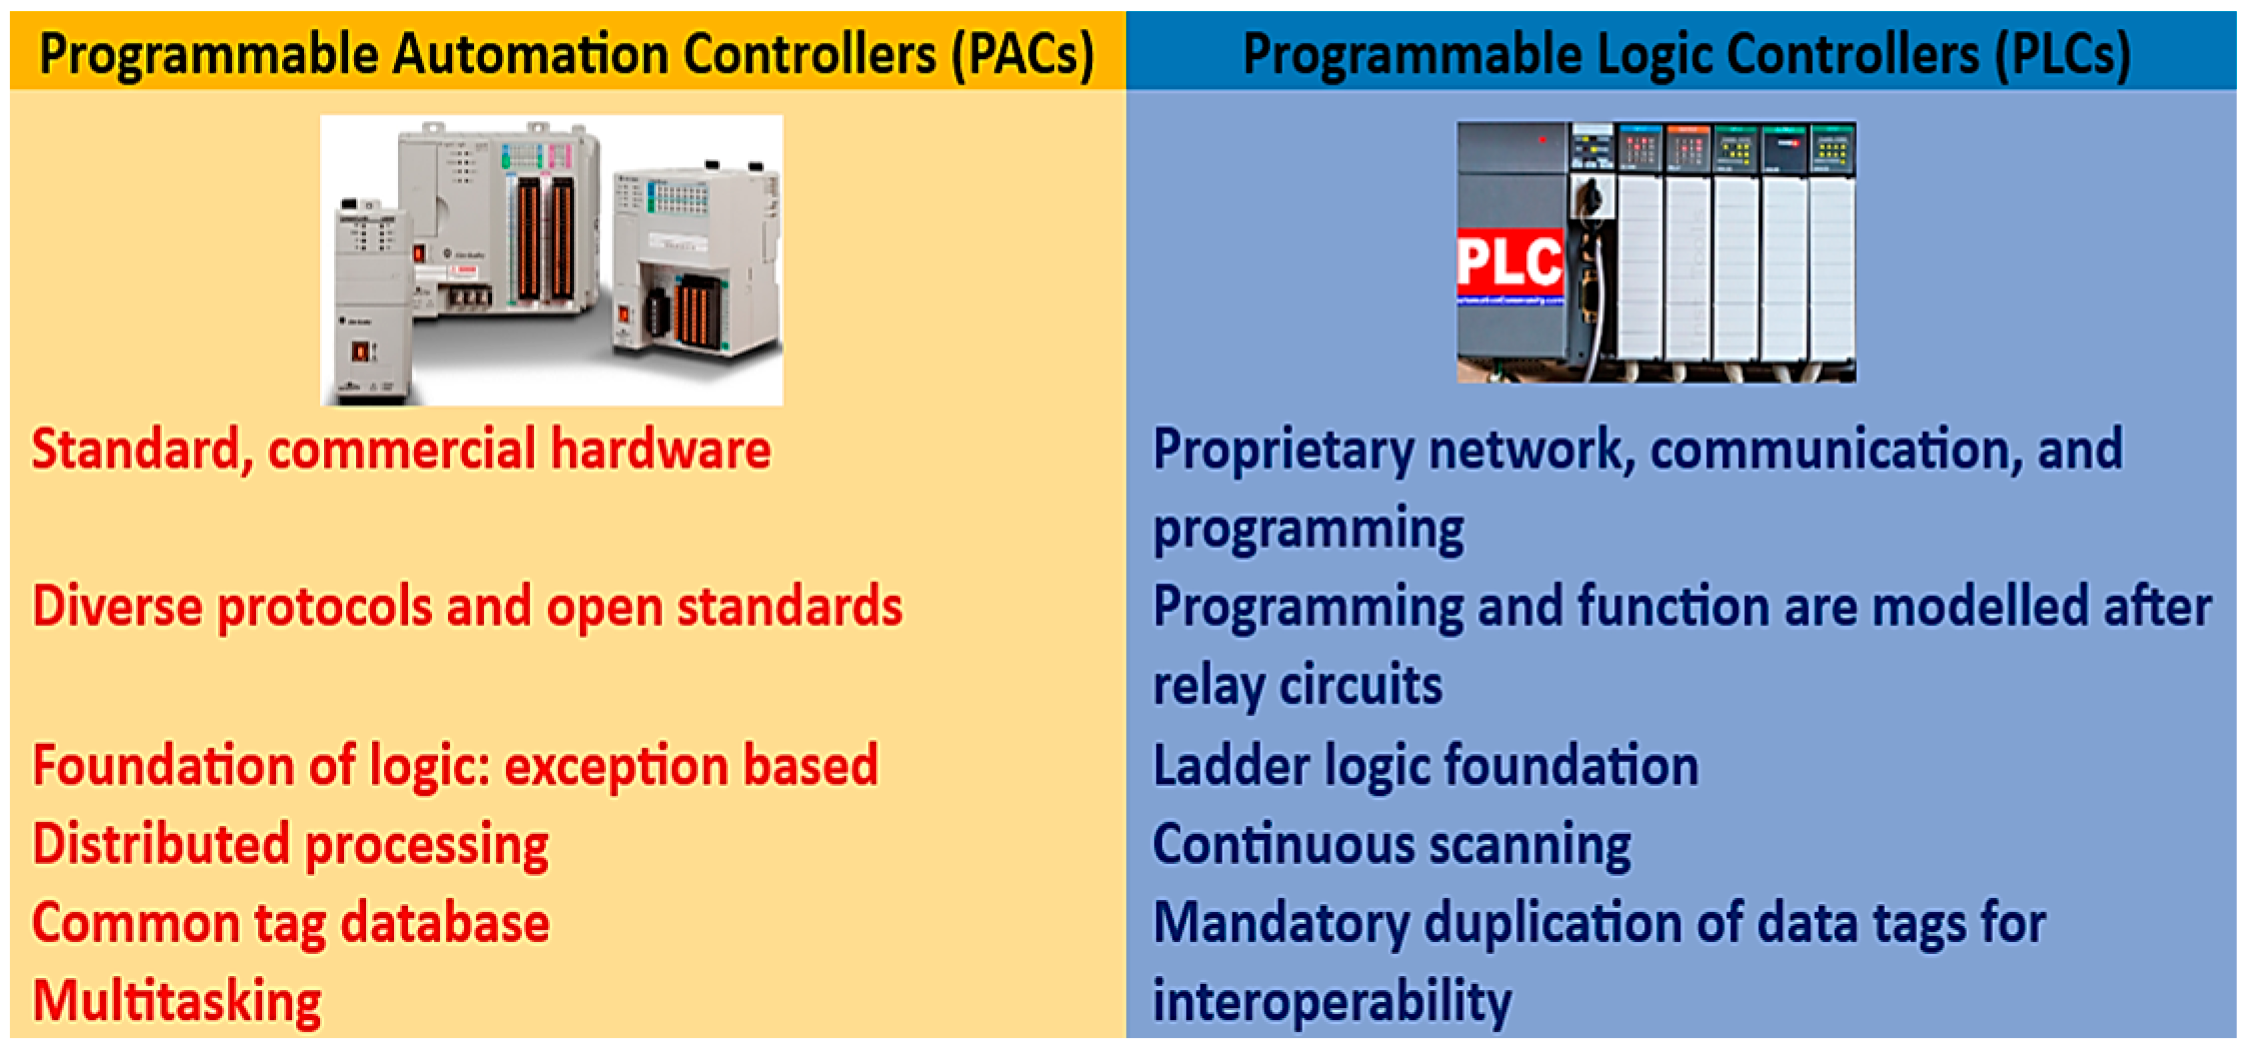
Figure 1 illustrates a simplified structure related to a BEMS. These components include automation systems that serve residents’ needs, energy sources supplying power to these systems and potentially to the grid, and energy storage used to balance energy production and consumption [35]. SBA relies on the Programmable Automation Controllers (PACs). A PAC is a compact controller that combines the functions of a PC-based control system with those of a traditional Programmable Logic Controller (PLC). This combination provides the reliability of a PLC along with the flexibility and computing power of a PC. Figure 2 depicts the differences between traditional PLC systems and various platforms supporting the latest innovative energy management system (EMS) implementations [36]. PACs are used in different environments for various tasks, including process control, data collection, remote equipment monitoring, and motion control. They also communicate using standard network protocols such as TCP/IP, OLE for Process Control (OPC), and SMTP. This enables them to transfer data from the devices they use to other devices, components within a networked control system, as well as to application software and databases.
When designing the architecture of the platform, it is essential to organize the nodes efficiently to ensure connectivity between different devices. This approach helps prevent congestion and allows quick restoration of connectivity when necessary. To manage information transmission channels effectively, the platform will include functions for monitoring the status of the nodes.
Another essential function of a management platform is to protect against cyber-attacks. This involves controlling actions and assigning user access levels to maintain data security and integrity. The design and deployment of the management platform employed the object-oriented modeling approach known as Object Modeling Technique (OMT). OMT enables the identification of real objects, their attributes, and how they interact. Compared to data- or function-based approaches, OMT provides a faster and more efficient method for decomposing and classifying objects and actions into subsystems, including events, classes, structures, sets of operations, and model-specific associations. However, during the implementation of the platform, especially in the notification-sending module, new AI-driven, agent-oriented techniques were adopted, which proved more effective in this context.
The primary objective of the proposed SBEMS is to create a user-oriented environment for connected subsystems and to further analyze building data. As these systems develop, they are becoming increasingly intelligent. Therefore, they perform several different functions, which can be categorized as follows (see Figure 3) [37,38,39]:
  • The human–machine interface function provides an intuitive way for users to interact with connected technical systems.
  • The system security function prevents unauthorized access by restricting each operator’s access to only the functions necessary for their specific tasks.
  • The segregation function manages the data flow within the system, such as presenting information from various types of technical installations at designated operator stations.
  • The alarm management function sequentially displays potentially dangerous situations or deviations in process values based on their importance and urgency, guiding the operator on required actions or informing them of automatic responses to alarms.
  • The global occupancy scheduling function consolidates occupancy schedules from multiple substations into logical units, such as sections of a building, allowing the operator to modify them with a single action.
  • The event recording function automatically logs alarms, operator changes, and other important events to a printer and/or hard disk.
  • The reporting function clearly and effectively presents subsets of data related to the current or past states of process values on a screen or printer.
  • The trend logging function automatically collects data from field equipment and stores it for future analysis.
  • The plotting and charting function displays relationships of process values through plots and bar charts generated from dynamically or historically gathered data.
As previously noted, the trend is increasingly moving towards integrating advanced algorithms into calculation engines. Achieving this requires measuring and analyzing both objective and subjective data. Currently, embedded technologies are being developed to establish a closer connection between buildings, their systems, and the occupants who use them. The decision-making process related to these systems is complex and involves multiple stakeholders, with each decision influenced by a range of factors.
The SBEMS relies on various mathematical models designed to emulate human behavior. These models employ analytical methods, probability-based approaches, or knowledge-based strategies. The SBEMS functionality involves developing a detailed energy management plan that considers key performance indicators (KPIs) and the building’s current operational conditions. This includes factors such as occupant needs and comfort, including electrical appliance use, lighting, temperature, and humidity, as well as local energy generation and energy costs.
The strategy also predicts how these factors will change over the next few hours, considering both outdoor and indoor conditions. This includes weather fluctuations, energy exchanges between the building and its surroundings, occupancy levels, indoor activities, as well as local energy generation and storage solutions. Additionally, it considers utility supply scenarios, such as day-ahead and real-time hourly prices, to minimize energy demand, reduce costs, and lower carbon dioxide (CO2) emissions.

4. BENEFIT Management Platform—A Vision on Practical Implementation of Smart Energy Management Building Concept

The “Building Energy Efficiency in Totality” (BENEFIT) management platform, designed to incorporate the SBEMS concept, serves as an innovative tool for controlling, monitoring, and implementing management strategies for a building. It aims to optimize energy use customized for each building. The platform’s architecture is designed as open-source software, enabling quick and straightforward development of comprehensive solutions that address all aspects of the Smart Energy Building concept. This architecture facilitates the management of a wide range of devices within the Smart Energy Building management system, including energy generation units, indoor lighting, environmental sensors, surveillance cameras, and more.
Complete integration, which combines all resources of an SEB into a single management system, benefits the environment by lowering emissions, improving energy efficiency and distribution within the building, enhancing quality of life, and supporting sustainable development.
The implementation of the system, focused on resource management within the SEB concept, achieves the following objectives:
  • Data Management involves handling static or dynamic data collected from various acquisition points equipped with specialized sensors capable of measuring different parameters, such as temperature, humidity, energy consumption, pressure, and thermal comfort, depending on sensor placement and the overarching objective set by the DM.
  • The Graphical User Interface (GUI) enables residents to access real-time data on monitored parameters within the BENEFIT platform. Furthermore, the platform allows residents to review detailed analyses that show how the monitored quantities of interest fluctuate over specified periods.
  • Identifying the set of recommended actions is a crucial part of the management platform that suggests measures to users to improve energy efficiency and optimize energy transfer within the building. The platform determines these suggested actions through complex decision-making processes that incorporate data from various sources, detected events, and a series of situational constraints. The recommended actions can have an immediate effect (e.g., lowering the room temperature) or a long-term impact (e.g., modifying the building’s energy consumption).

4.1. Architecture

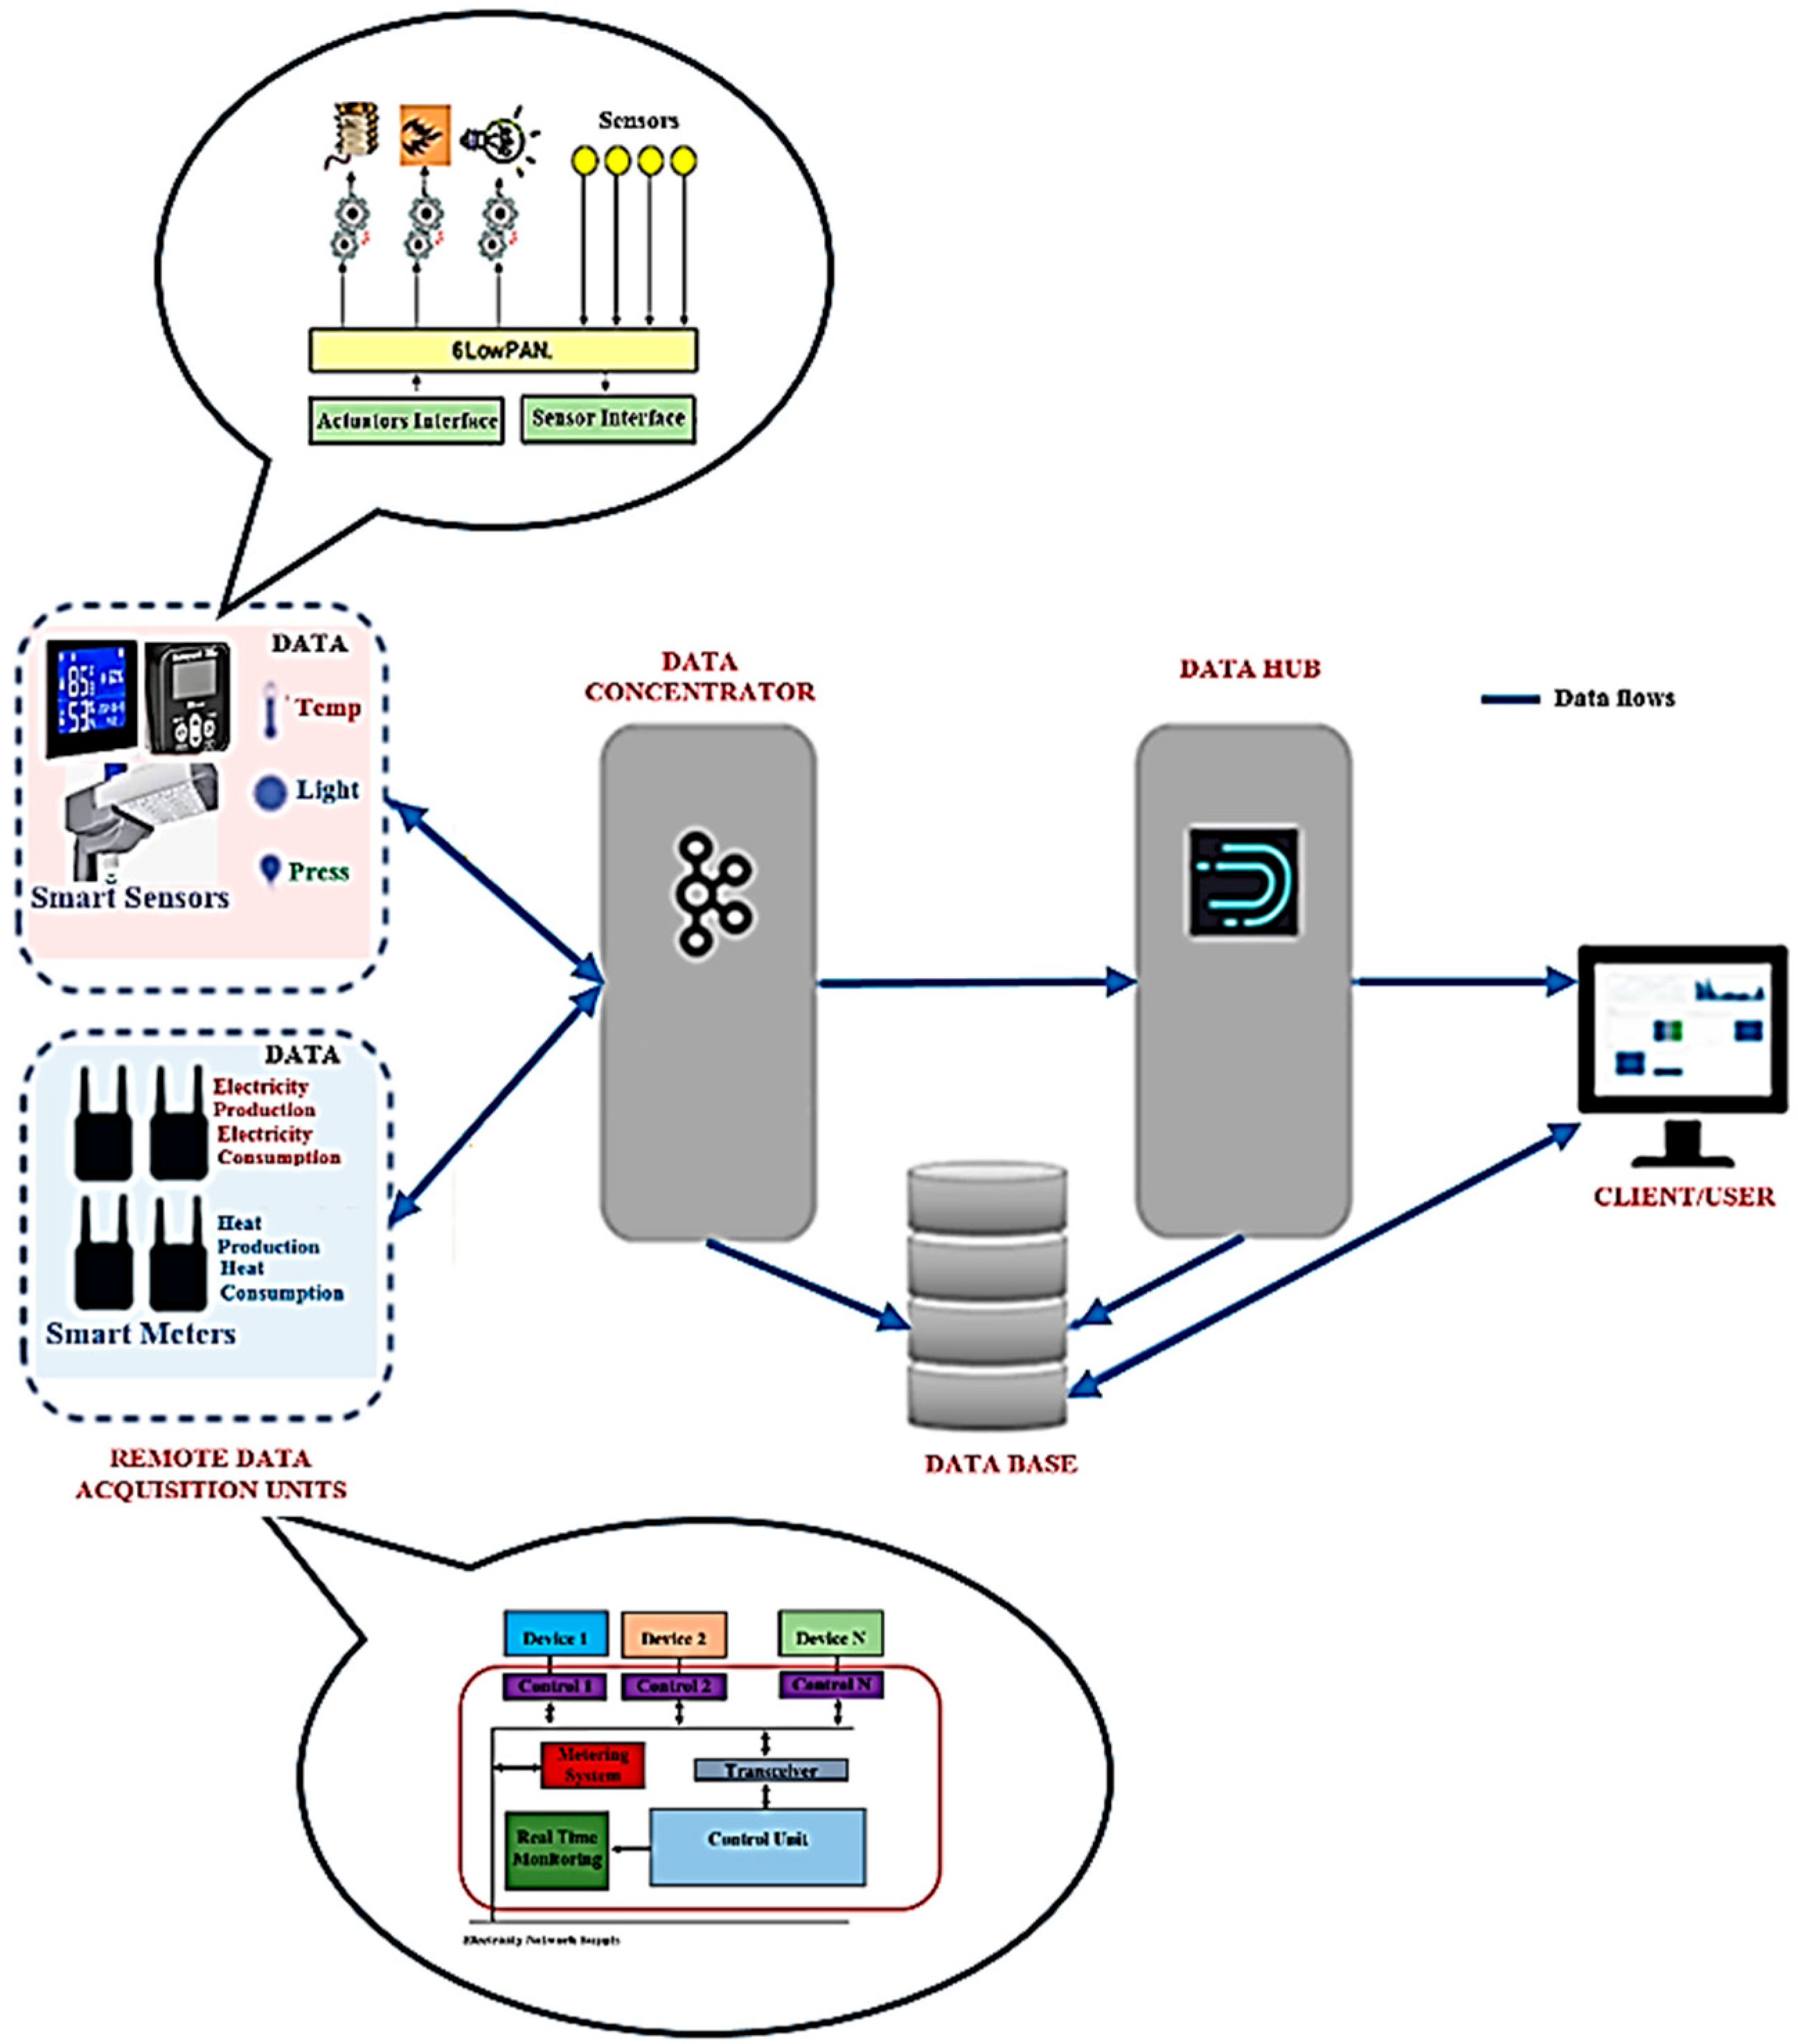
Figure 4 presents the simplified architecture of the BENEFIT platform. The architecture includes two data acquisition systems: a smart sensor network and a smart meter network. The sensor network gathers data such as temperature, brightness, and pressure through sensors installed on various devices at specific locations within the building. As for the smart meter network, it collects the data on electricity and heat consumption or generation [40]. All this information is transmitted to a data concentrator associated with a specific zone within the building. Ultimately, a data hub aggregates all information, which is then transferred to a MySQL database. BENEFIT introduces innovation through software adaptable for sensor nodes that can be adjusted dynamically, along with software support that ensures interoperability with existing commercial communication and control systems. To facilitate this, the use of IPv6 over Low-Power Wireless Personal Area Networks (6LowPAN) will be investigated, aiming to define data compression mechanisms that enable the transmission and reception of IPv6 packets over IEEE 802.15-based networks. 6LowPAN assigns IP addresses to sensors, enhancing interoperability across different sensor system vendors.
The architecture is based on a multilayer structure that combines three layers to meet the set objectives, as seen in Figure 5.
  • The first layer consists of various devices and components within the management network, which may be active data collection devices or passive sensors. These are connected through different communication protocols within the data monitoring and management network and can transmit and receive data.
  • The second layer comprises the communication protocols essential to RePowerTUI, enabling data exchange between devices on the monitoring network. Devices communicate using protocols such as ZigBee, LoRaWAN, WiFi, GSM/GPRS, or those specifically designed for sensor networks.
  • The third layer pertains to monitoring, storage, and data analysis within the management network and operates on a server that provides vital services for the platform’s effective operation. These services, accessible to network devices, facilitate communication with the central server to send or receive relevant data. This enables devices responsible for data collection to transmit their gathered information to the management platform.

4.2. Data Acquisition

The BENEFIT energy management platform allows secure access to data from all devices within the monitoring network via authentication and safety protocols.
Devices use this data to display relevant indicators or assess performance based on the equipment managed by BENEFIT. The smart data management system serves as the central component of the SEB’s management infrastructure, enabling devices, users, administrators, and DMs to access system data. This centralized system for data collection, storage, analysis, and visualization is hosted on a server that provides access to management resources at different priority levels, controlling the information available to various client types. The data collection system is viewed from the perspective of a horizontal network architecture, comprising measurement points that integrate the remote data acquisition units (RDAUs) distributed across a building. The types and distribution of measured values depend on their specific locations.
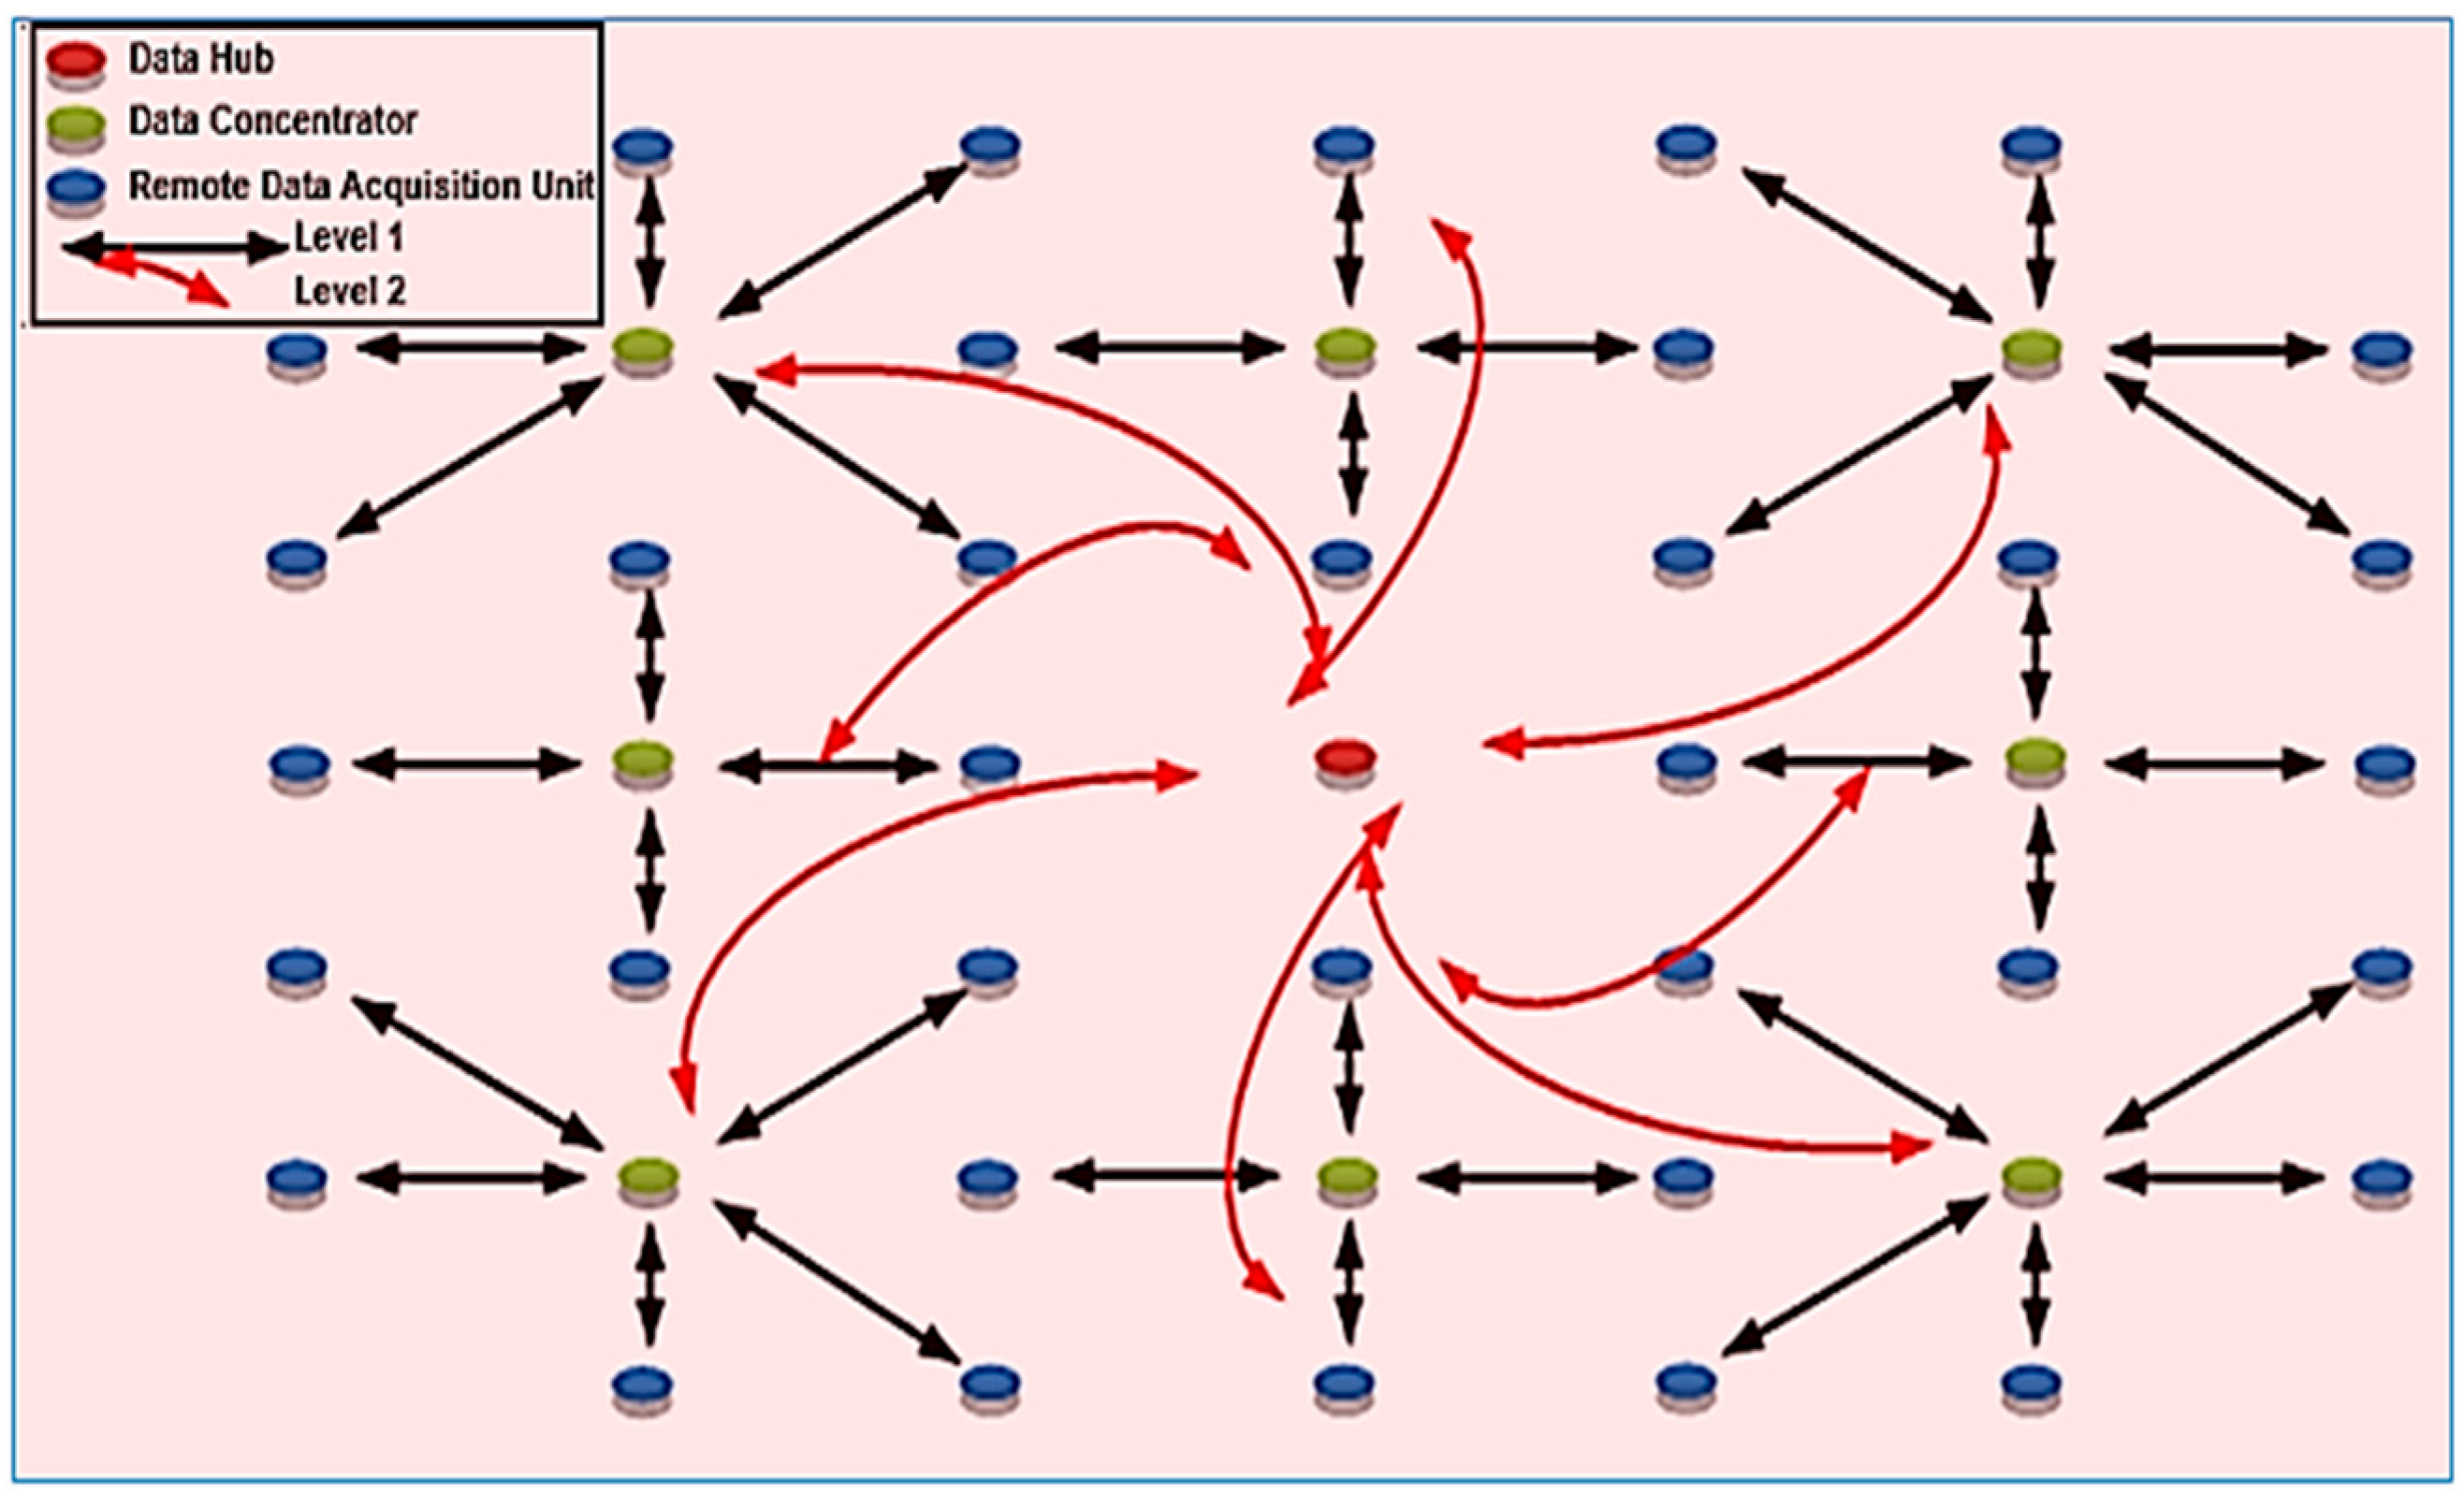
For instance, data networks can measure environmental parameters (such as temperature, humidity, and pressure) using dedicated sensors, monitor energy consumption with smart meters, and collect user-selected parameters via a smartphone app. Data from these various RDAUs is gathered locally by the data concentrators (DCs) and finally transmitted to the Data Hub (HD) of the BENEFIT energy management platform through communication links within the architecture. Figure 6 illustrates the architecture of this distributed data collection system. Bidirectional communication between RDAUs and DCs, and between the DCs and network HD, is secured through a tree-structured wireless network.
In this architecture, the DH, positioned at the top level (level 0), manages network synchronization, dispatches commands to the DCs and RDAUs, and collects data from them. Below it, DCs at level 1 relay commands to RDAUs and forward data packets from these units back to the DH.
Each device has a unique MAC (Media Access Control) address, which is used during network setup to assign data transmission responsibilities and troubleshoot potential data flow issues. The DH sends data to the server that manages data collection within the BENEFIT.
The wireless network’s connectivity is vital for data transmission between RDAUs, DCs, and DH. Connectivity and security can be threatened by factors such as greater distance between RDAUs, physical barriers, or cyber-attacks. To maintain reliable connectivity and optimize energy use during monitoring, system components are strategically positioned so that low-power RDAUs remain within the coverage of at least one larger-range DC. This arrangement ensures that, even if the distance varies or a DC fails due to hardware, software, or cyber issues, data has at least one route to the DH. Proper placement of RDAUs and DCs, along with failover mechanisms, enables automatic recovery from failures. Obstacle-related connectivity issues are also considered when designing the network.

4.3. Data Security

Data security and the integrity of the entire data collection system for the Intelligent Energy Building’s parameters are protected against cyber-attacks through three main measures: unique and confidential MAC address identification of network devices, hardware key coding with 128-bit AES for all data exchanged within the network, and strict control over node access to RTUs and DCs. The first two measures have been introduced to be effective against DOS (denial of service) attacks aimed at interrupting or disrupting data flow. Precisely specifying which MAC addresses can access specific network components improved security by blocking unrecognized devices and also enabled automatic reconnection with the DH if a failure occurs.

4.4. Data Processing

A software application is developed and integrated to oversee, manage, and monitor the building, supported by the Building Simulation Tool to improve energy efficiency. Remote control and access features will enable advanced automated control, monitoring, management, and maintenance of systems and services, both on-site and remotely, in a smooth and unified way.
The DesignBuilder Software platform includes the following functions: calculating building energy consumption; evaluating façade options for overheating and aesthetics; conducting thermal simulations of naturally ventilated buildings; developing strategies to save artificial lighting by utilizing daylight; generating daylight distribution predictions through solar radiation simulations; visualizing site layouts and solar shading; determining the operating regimes of heating and cooling systems; modeling HVAC and natural ventilation, including air distribution effects such as temperature and recirculation speed, with CFD (computational fluid dynamics); implementing ASHRAE 90.1 and LEED energy standards; and enhancing energy efficiency through multi-objective optimization involving various constraints and variables.

4.5. Performance Indicators

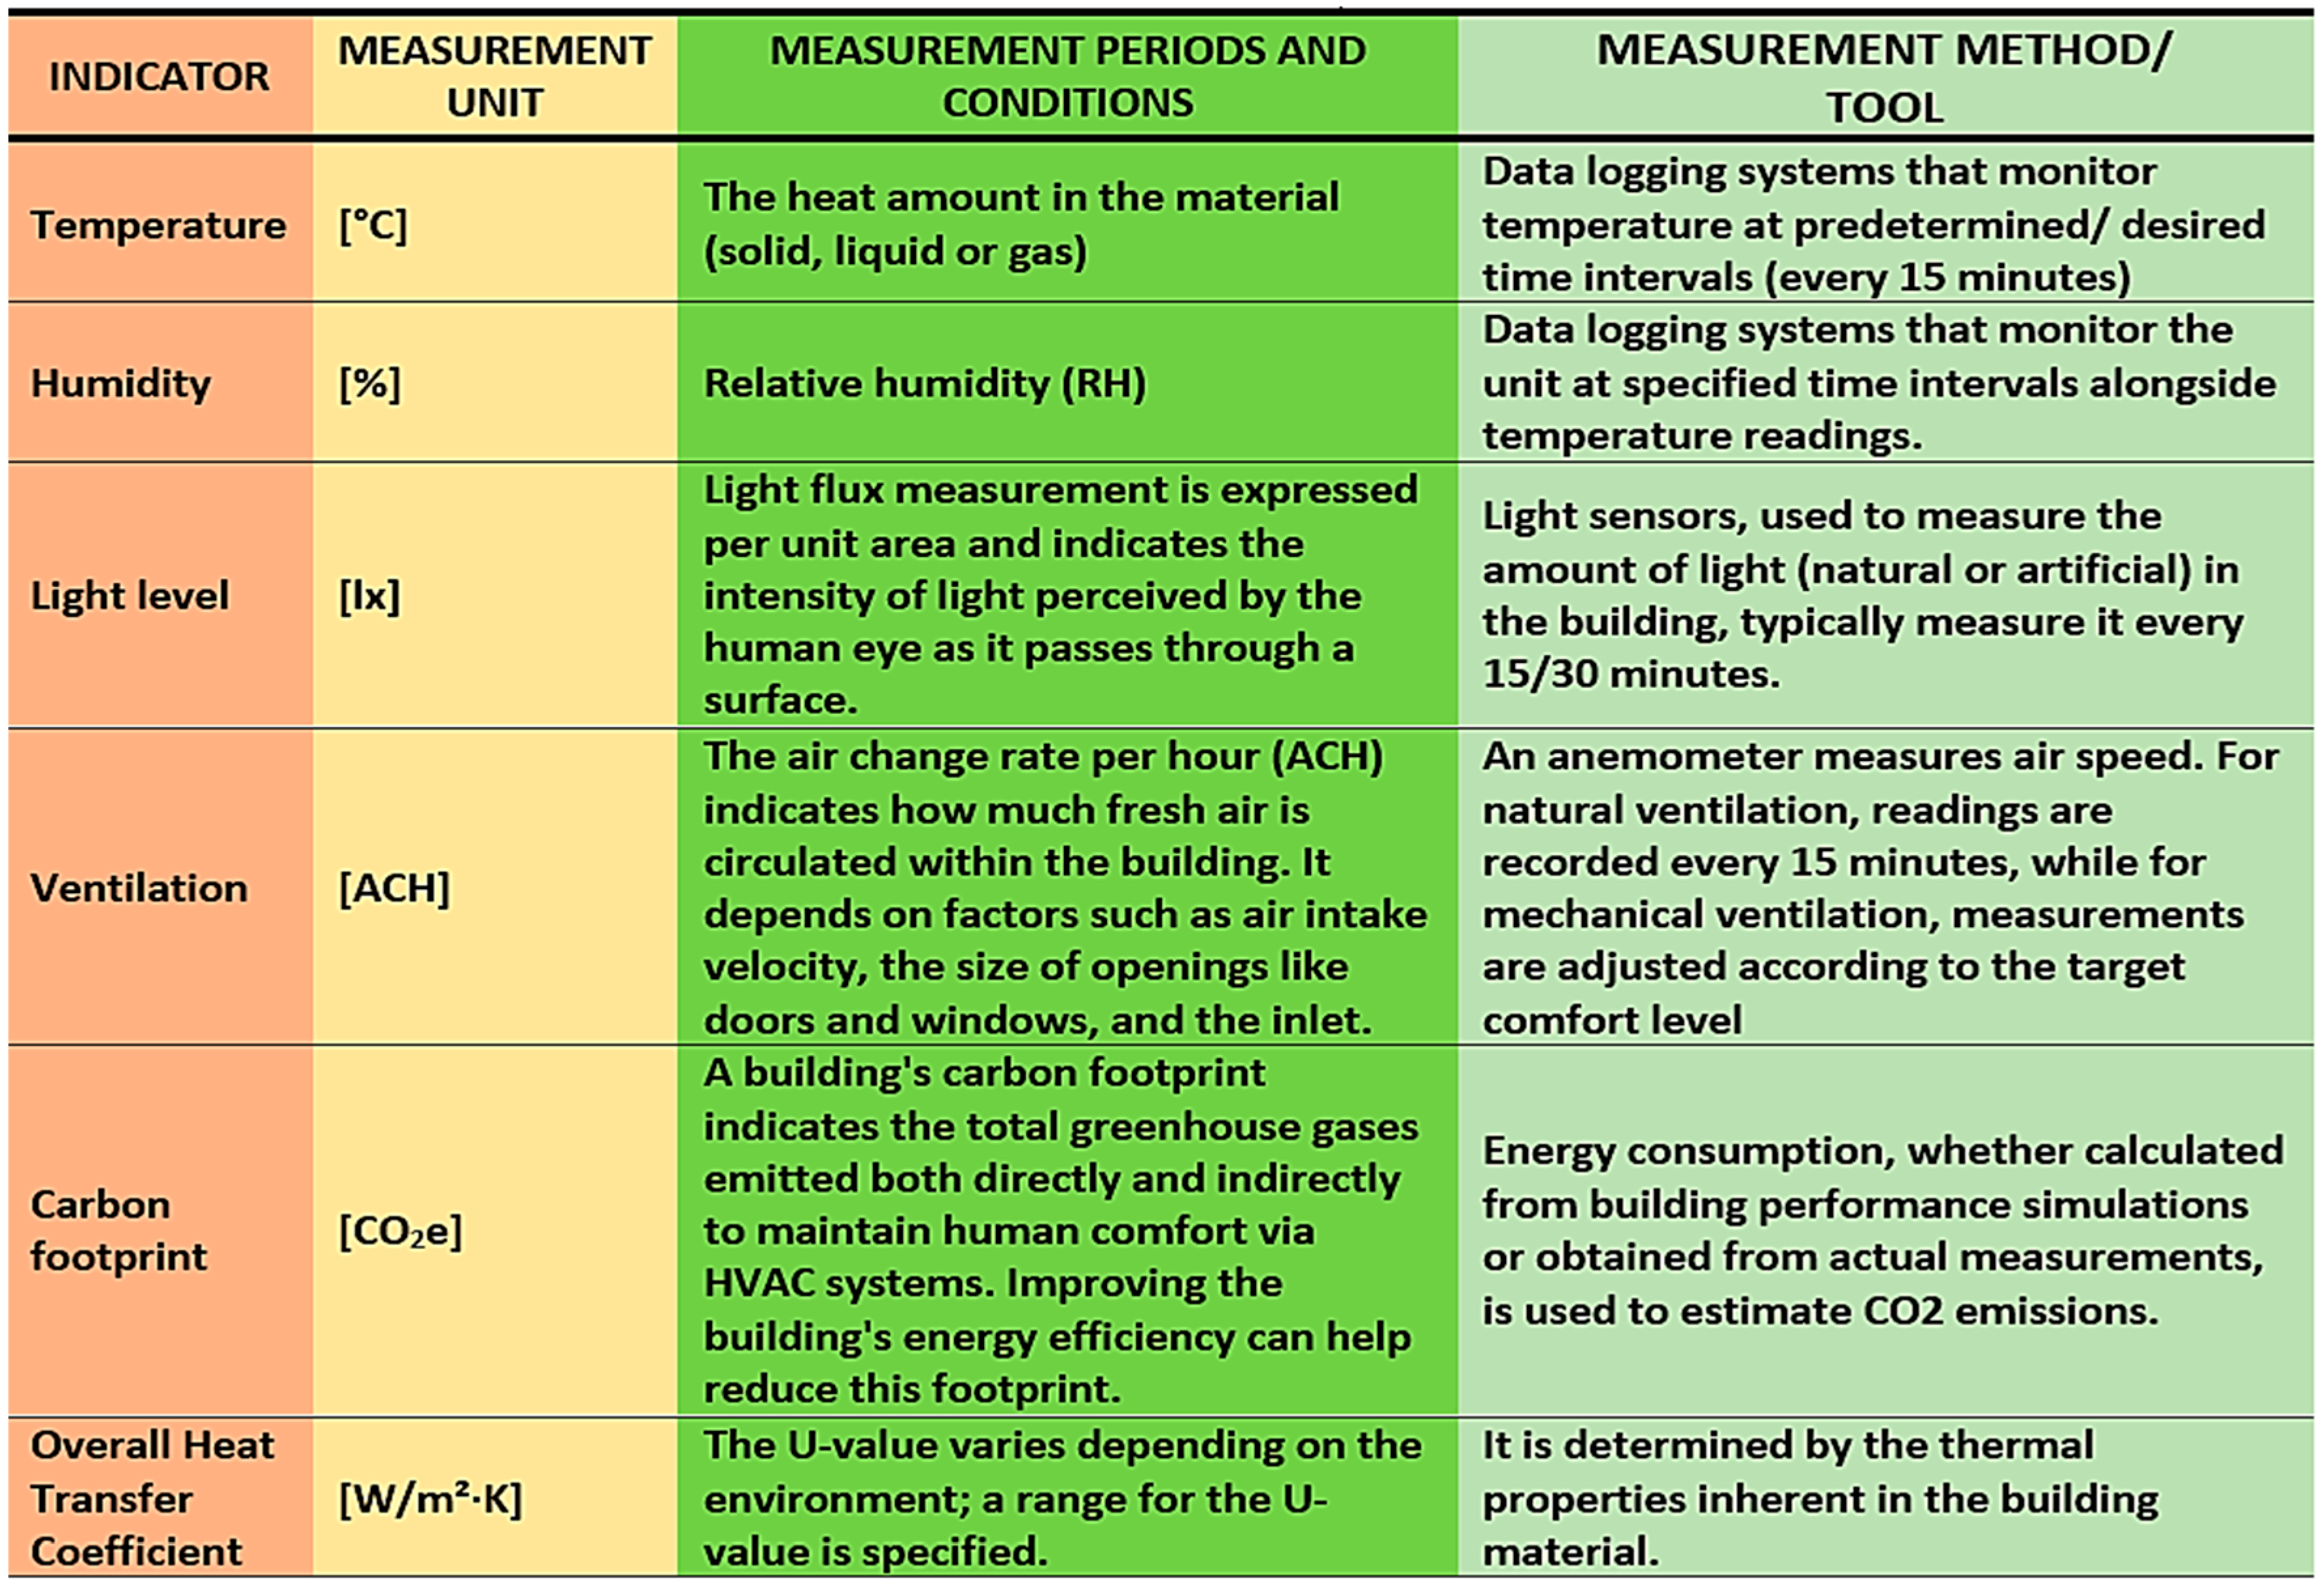
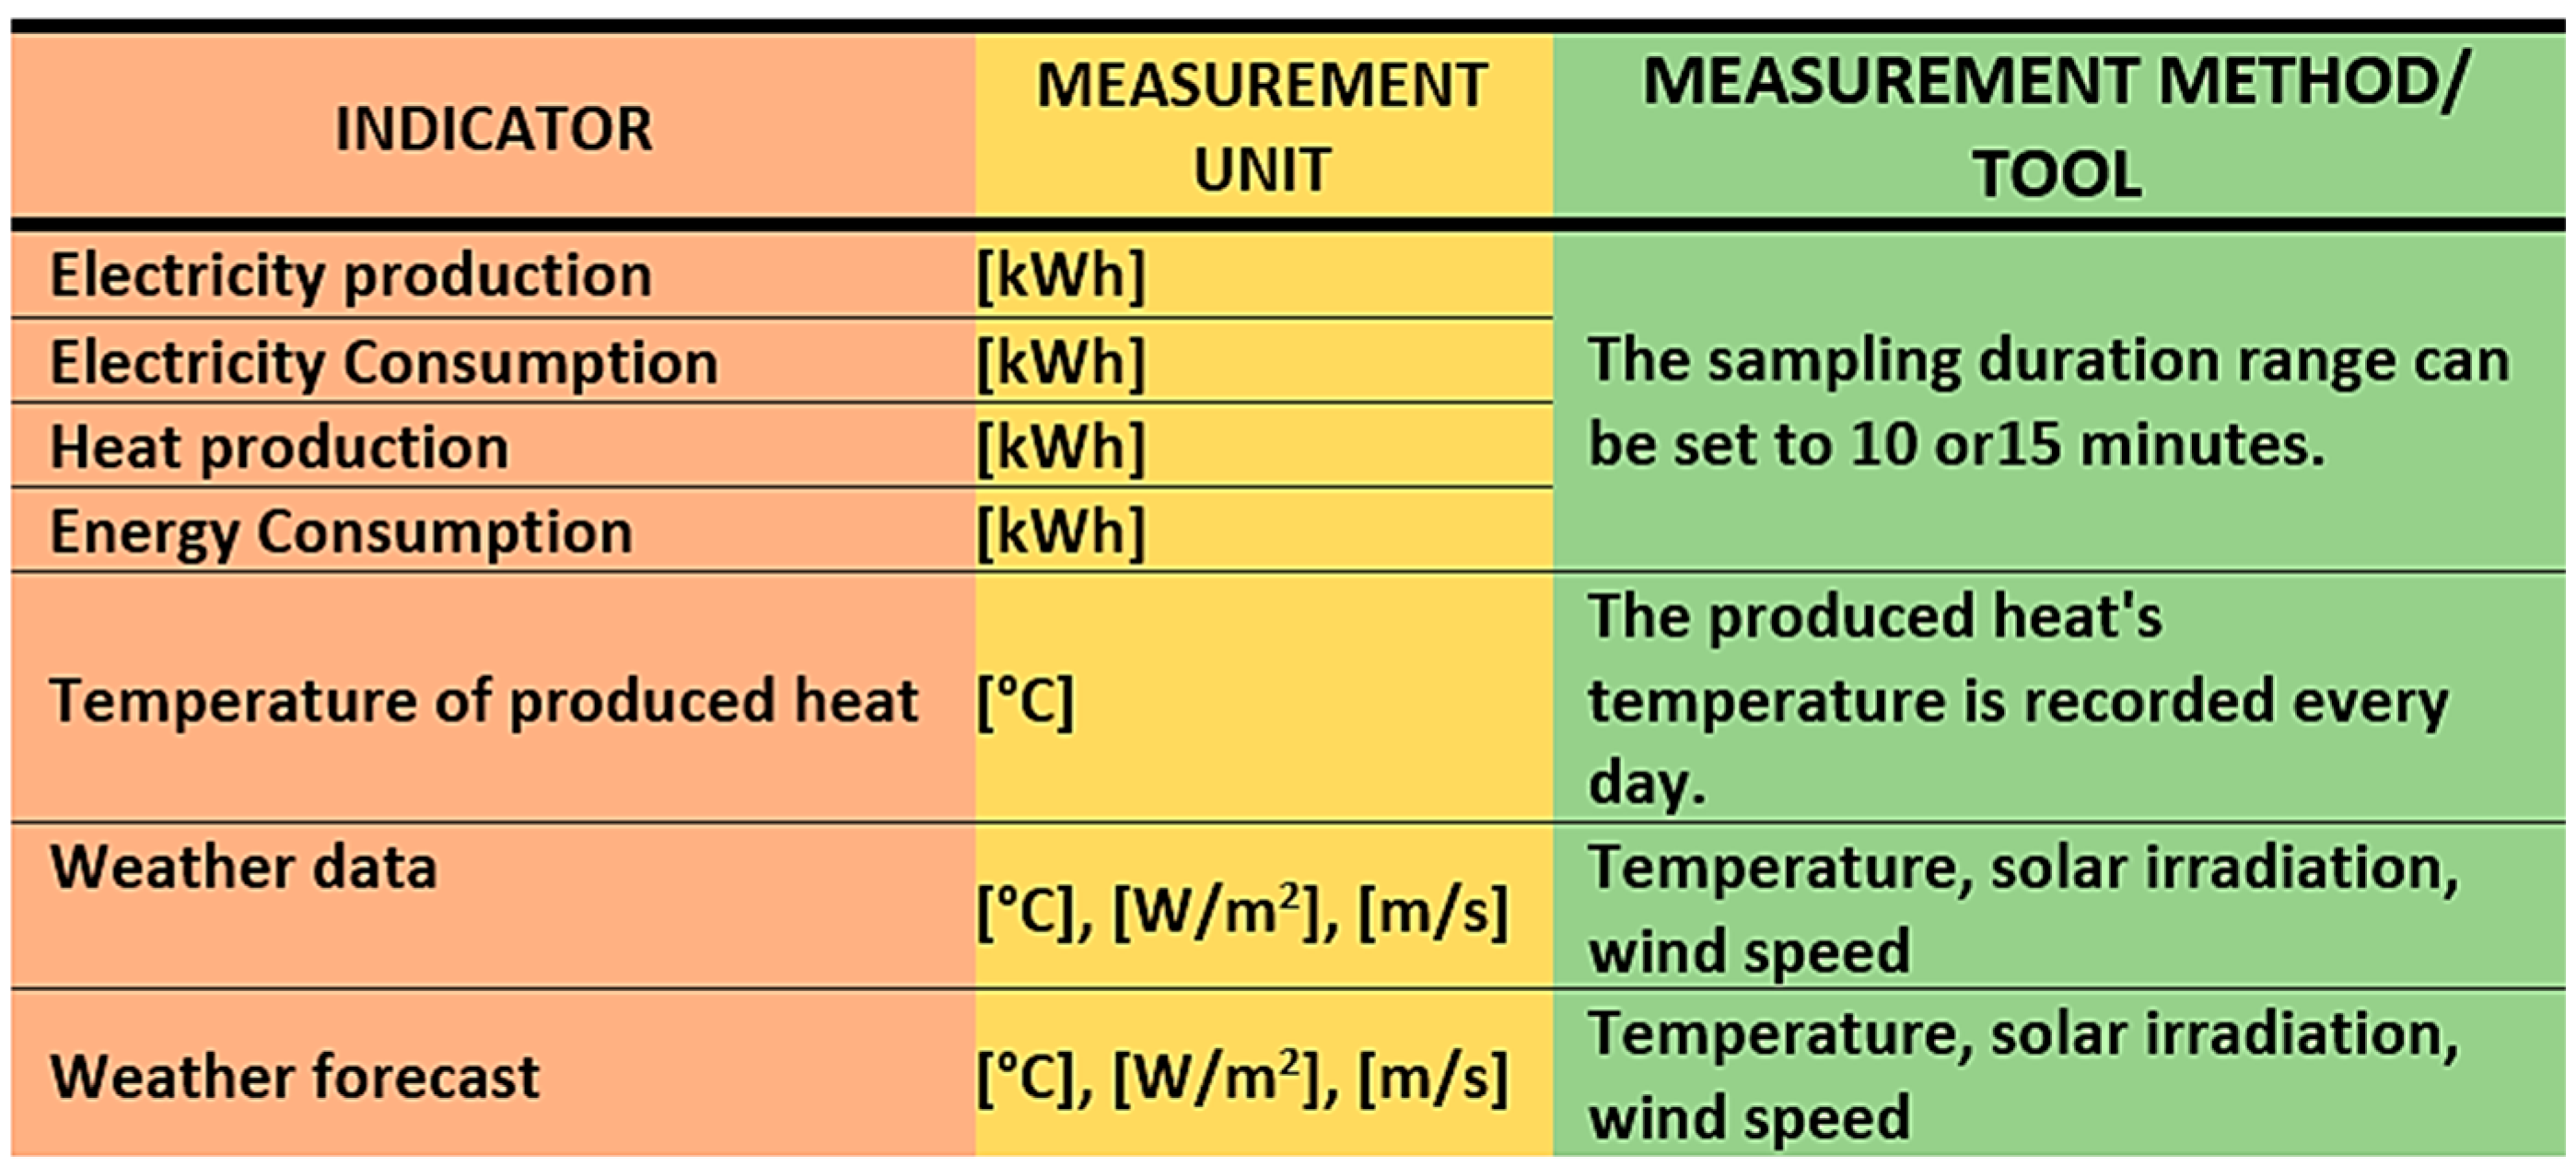
The platform provides a detailed report on specific and general KPIs based on data analysis when requested by the decision-maker or occupants. Figure 7 and Figure 8 briefly describe the aspects related to measurement periods and conditions, as well as the measurement methods or tools used in connection with the specific and general KPIs.

4.6. BENEFIT Platform

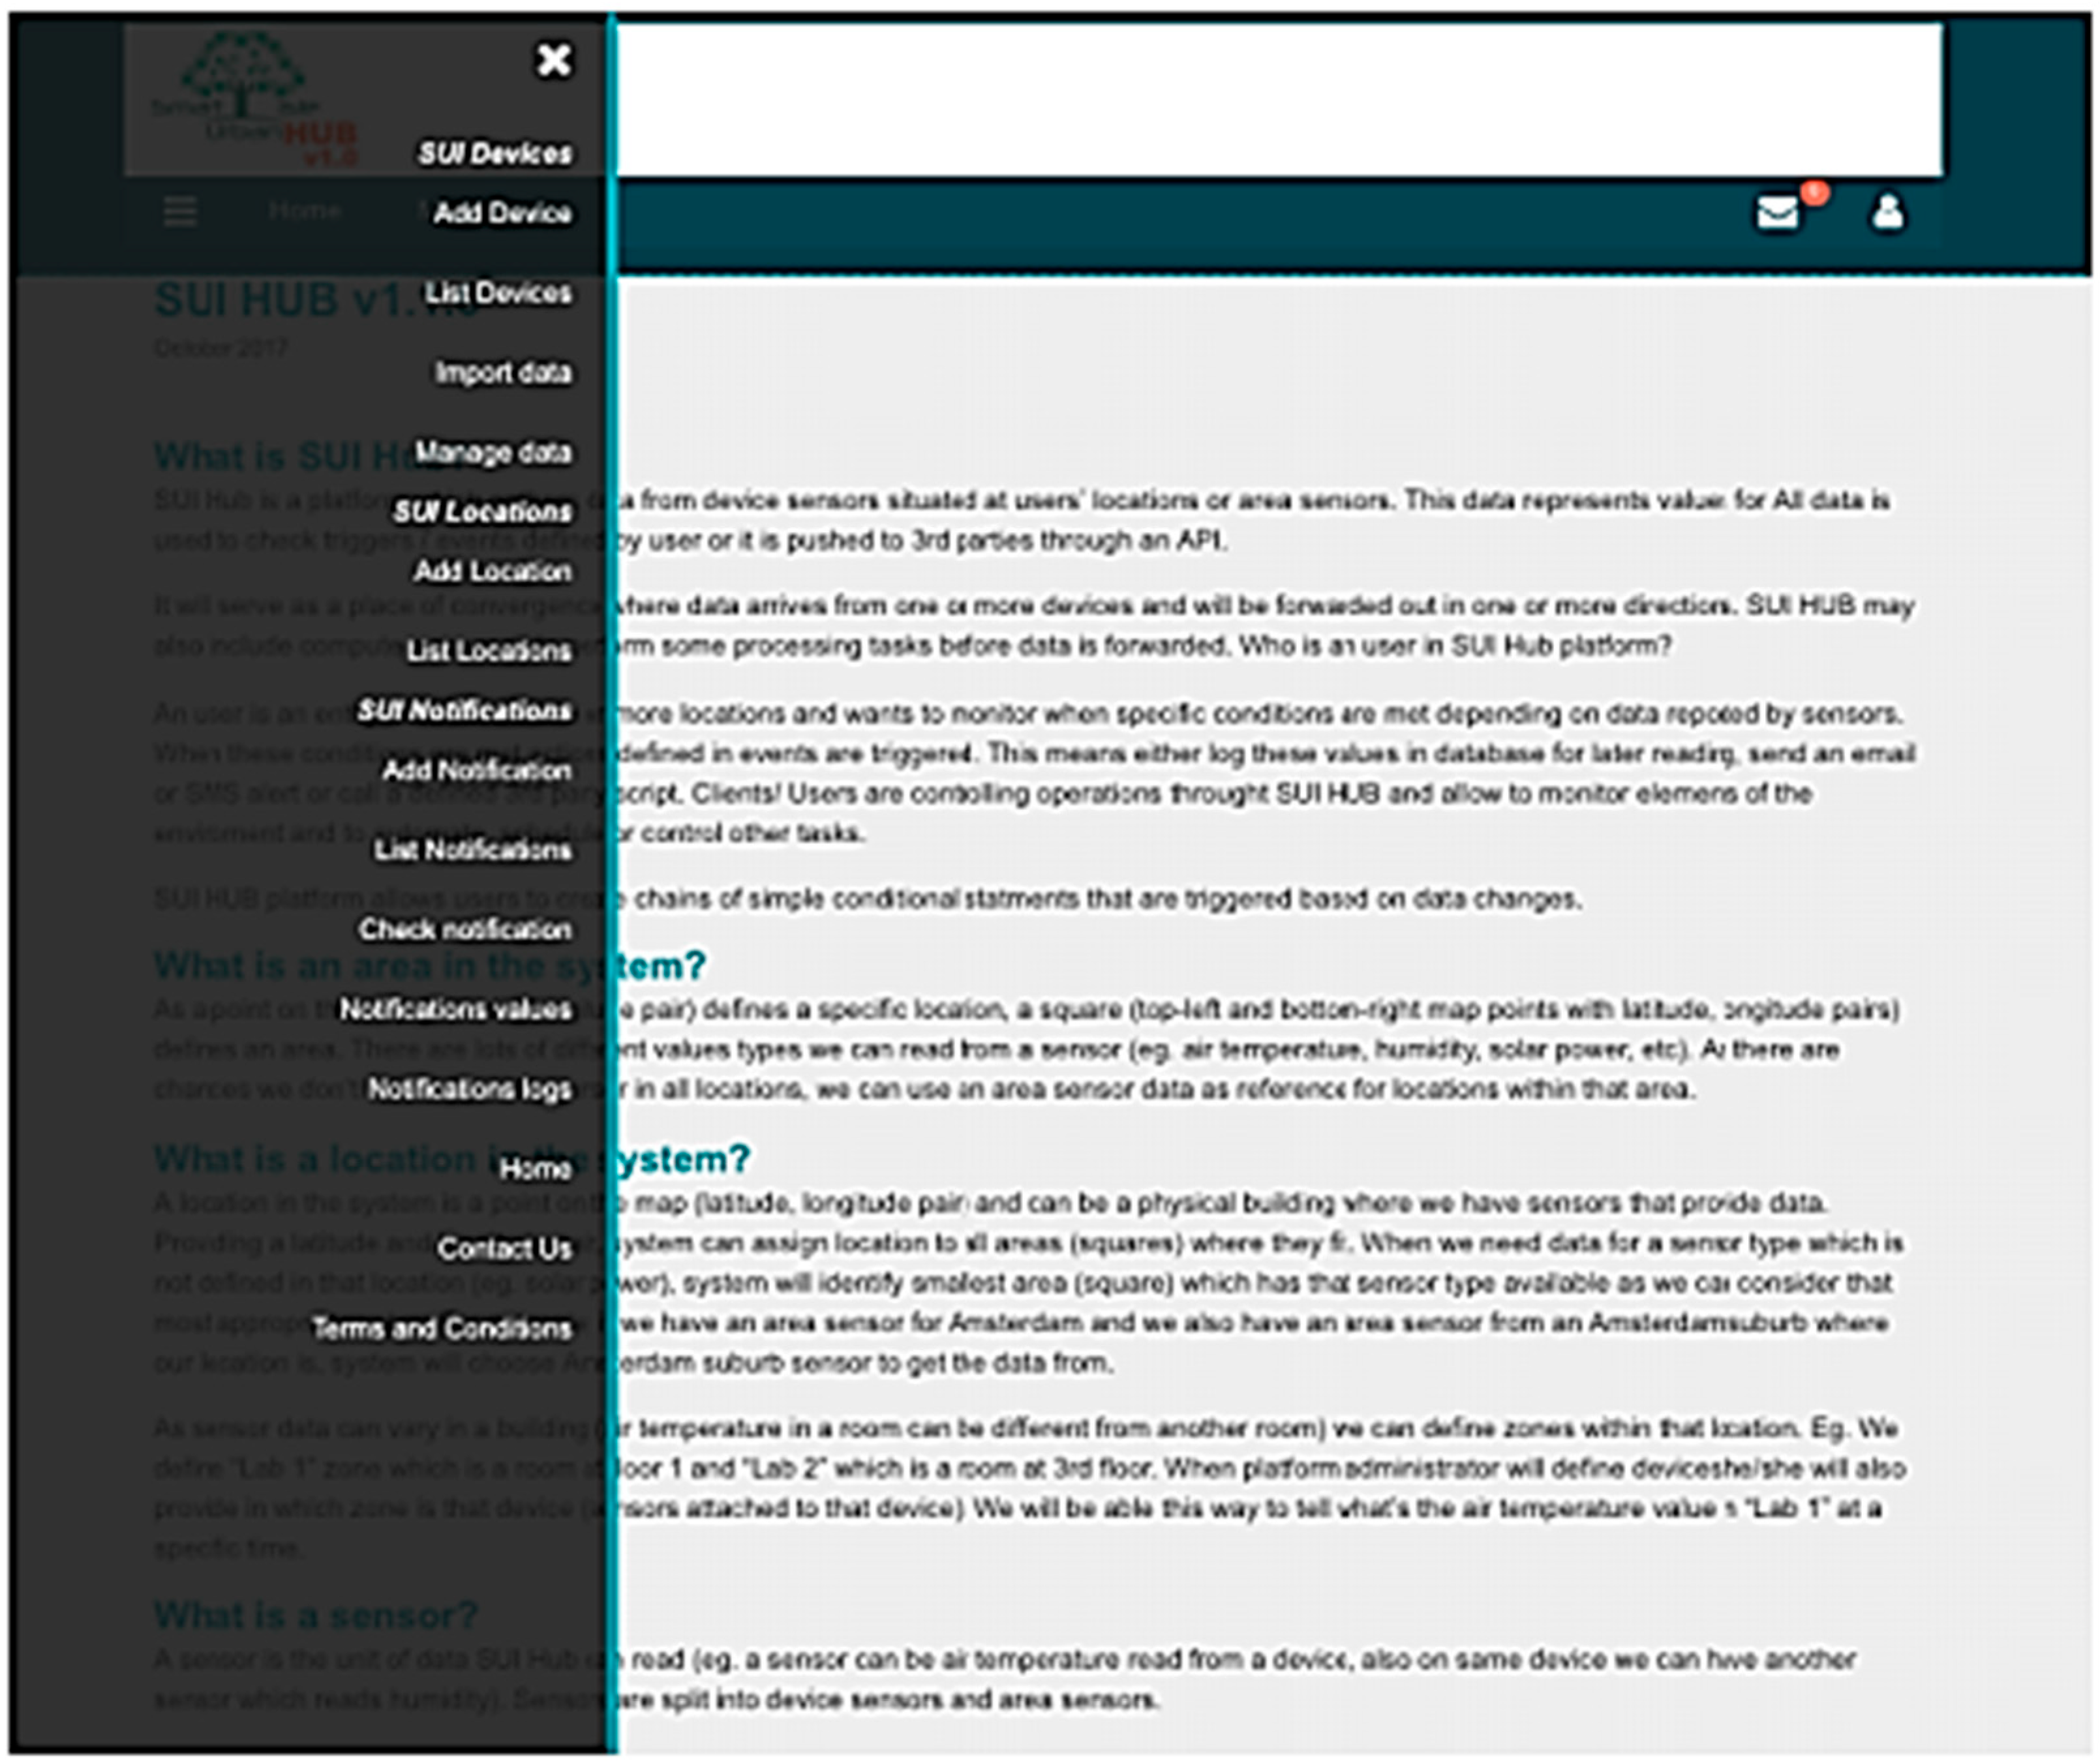
The BENEFIT platform requires logging in with an email address and credentials provided by the administrator (represented by the DM) to access the Smart User Interface Hub (SUI-HUB). After logging in, the user can access a list of functions that open the menu, as shown in Figure 9, which includes functions grouped into three sections: devices, locations, and notifications.
In the Devices Section, the user can add a monitoring device, view a list of connected devices, import data, and select operations that can be applied to recorded data. In the Locations section, the user can add a new location or view all locations from the building entered into the BENEFIT platform.
The Notifications Section allows the user to carry out the following functions: add, view, and check notifications, as well as identify the notification type by value and logo.
Adding and viewing locations involves assigning a series of sensors and devices.
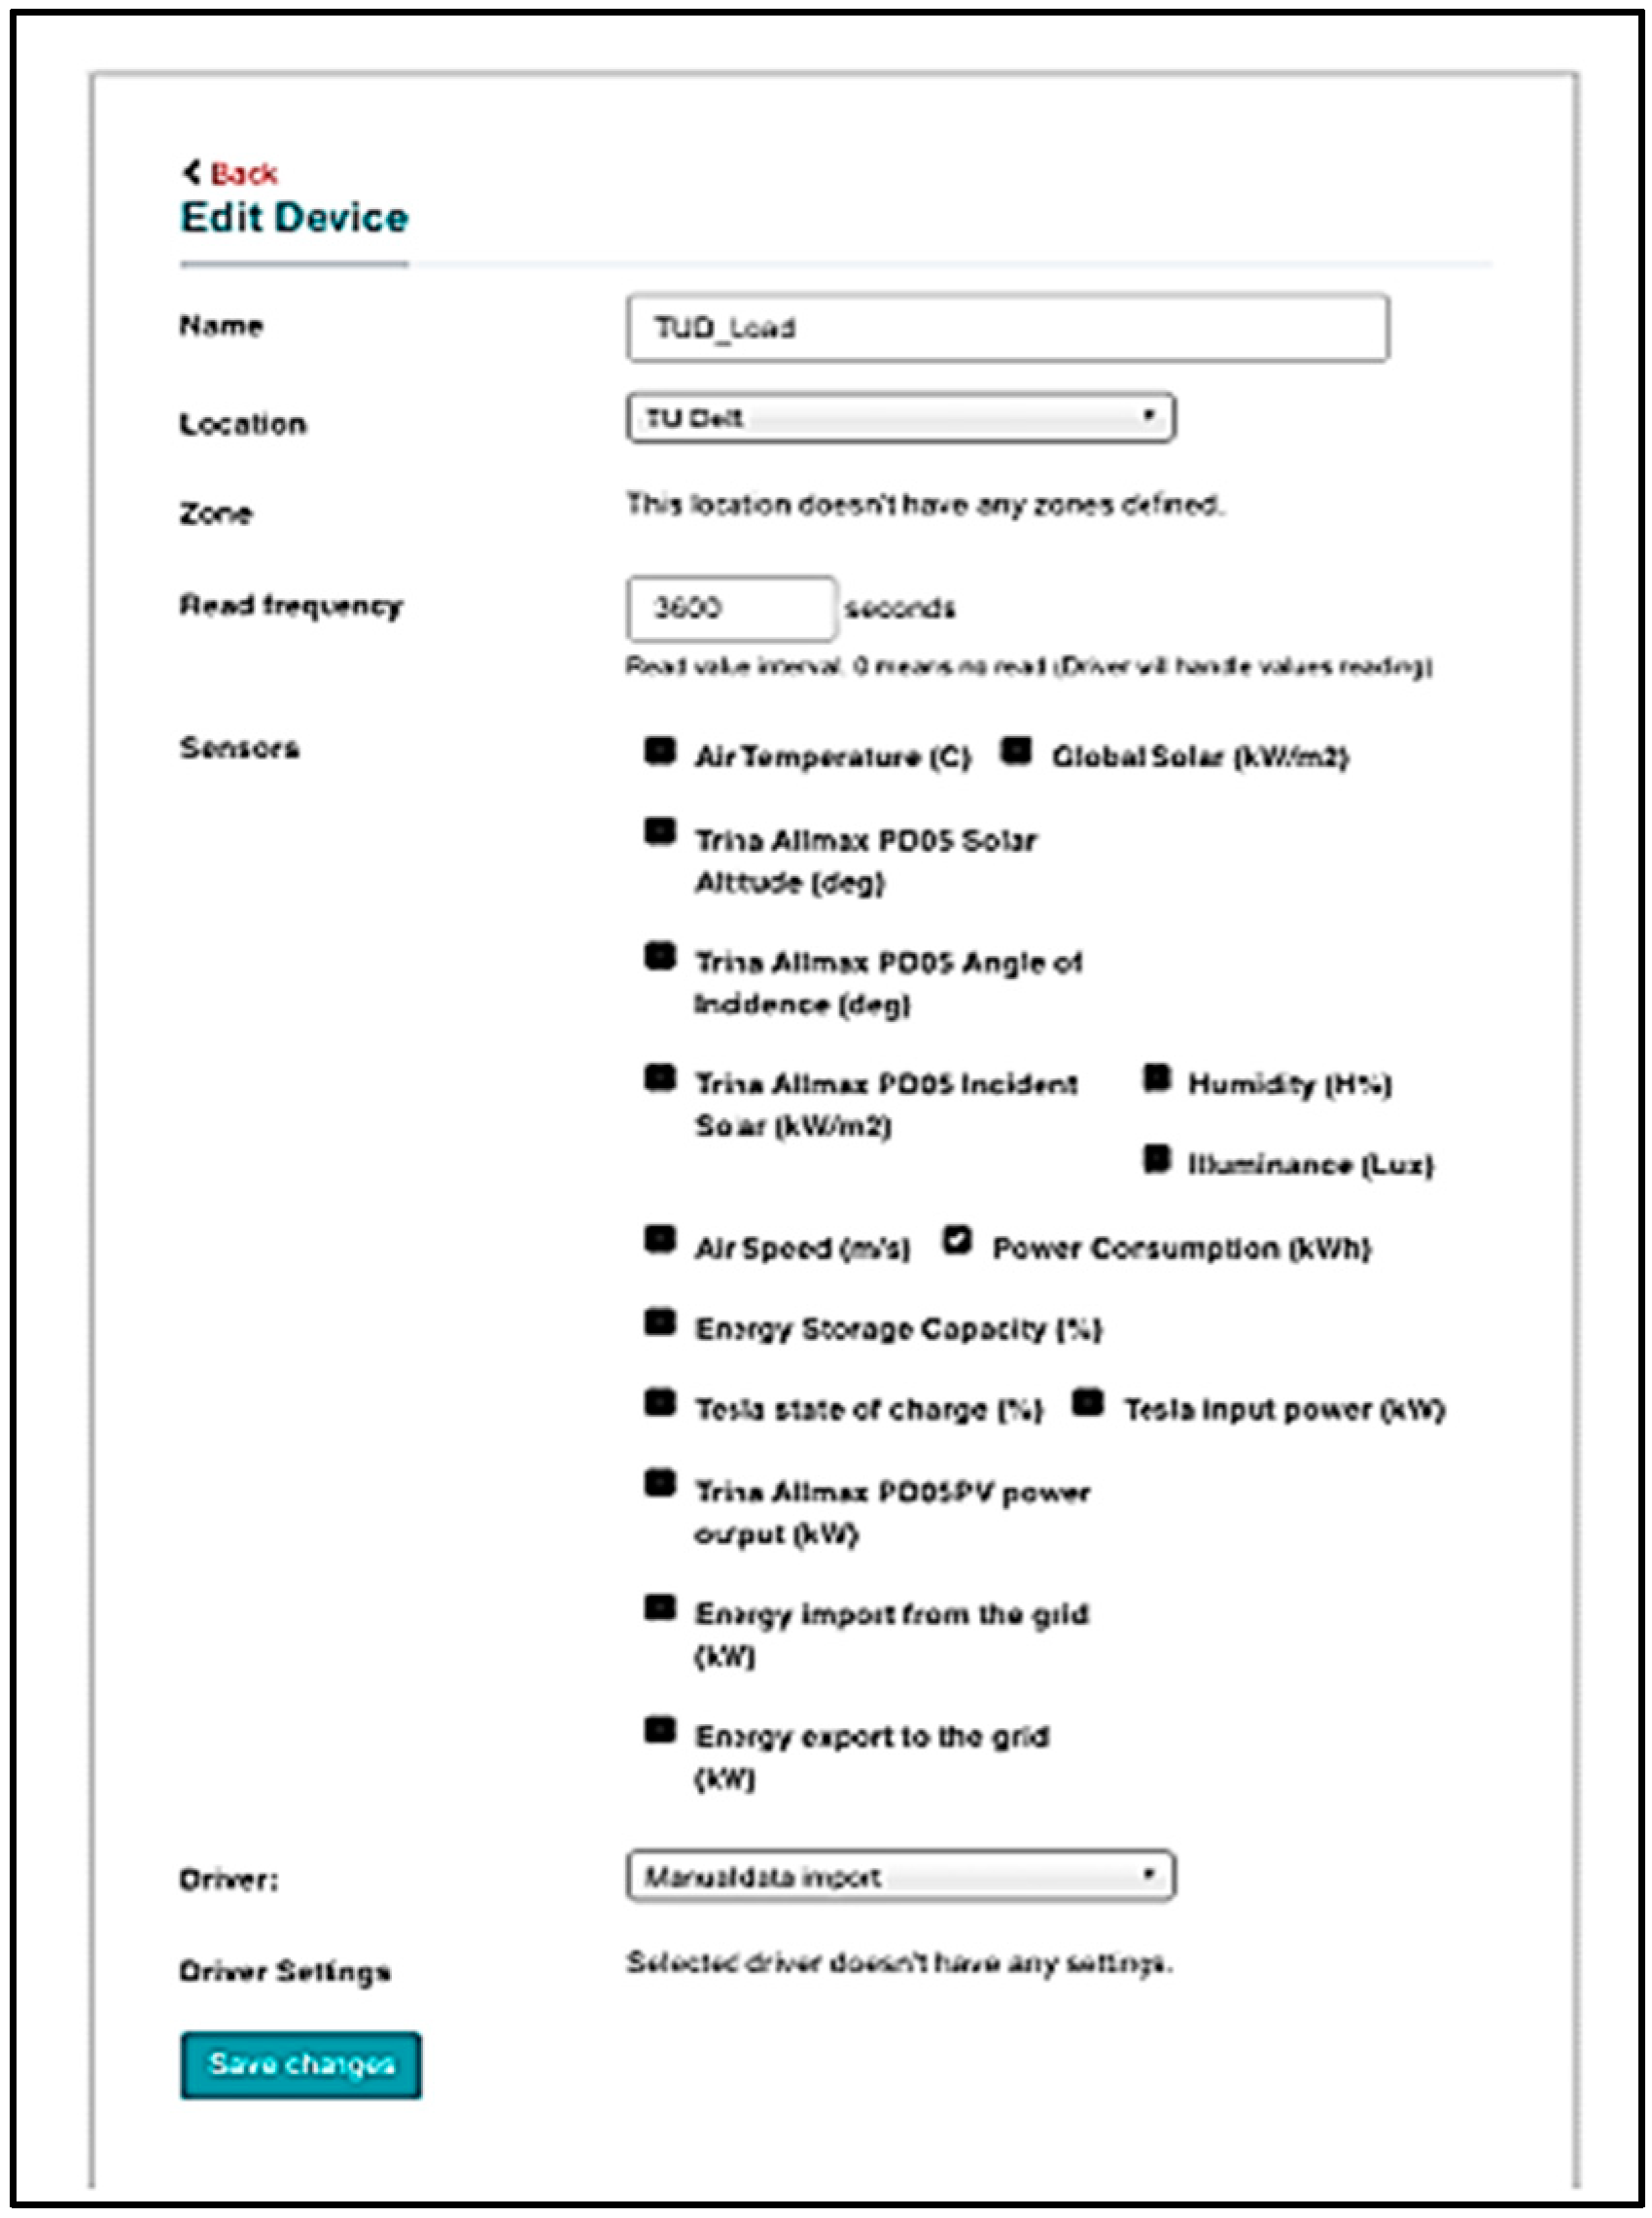
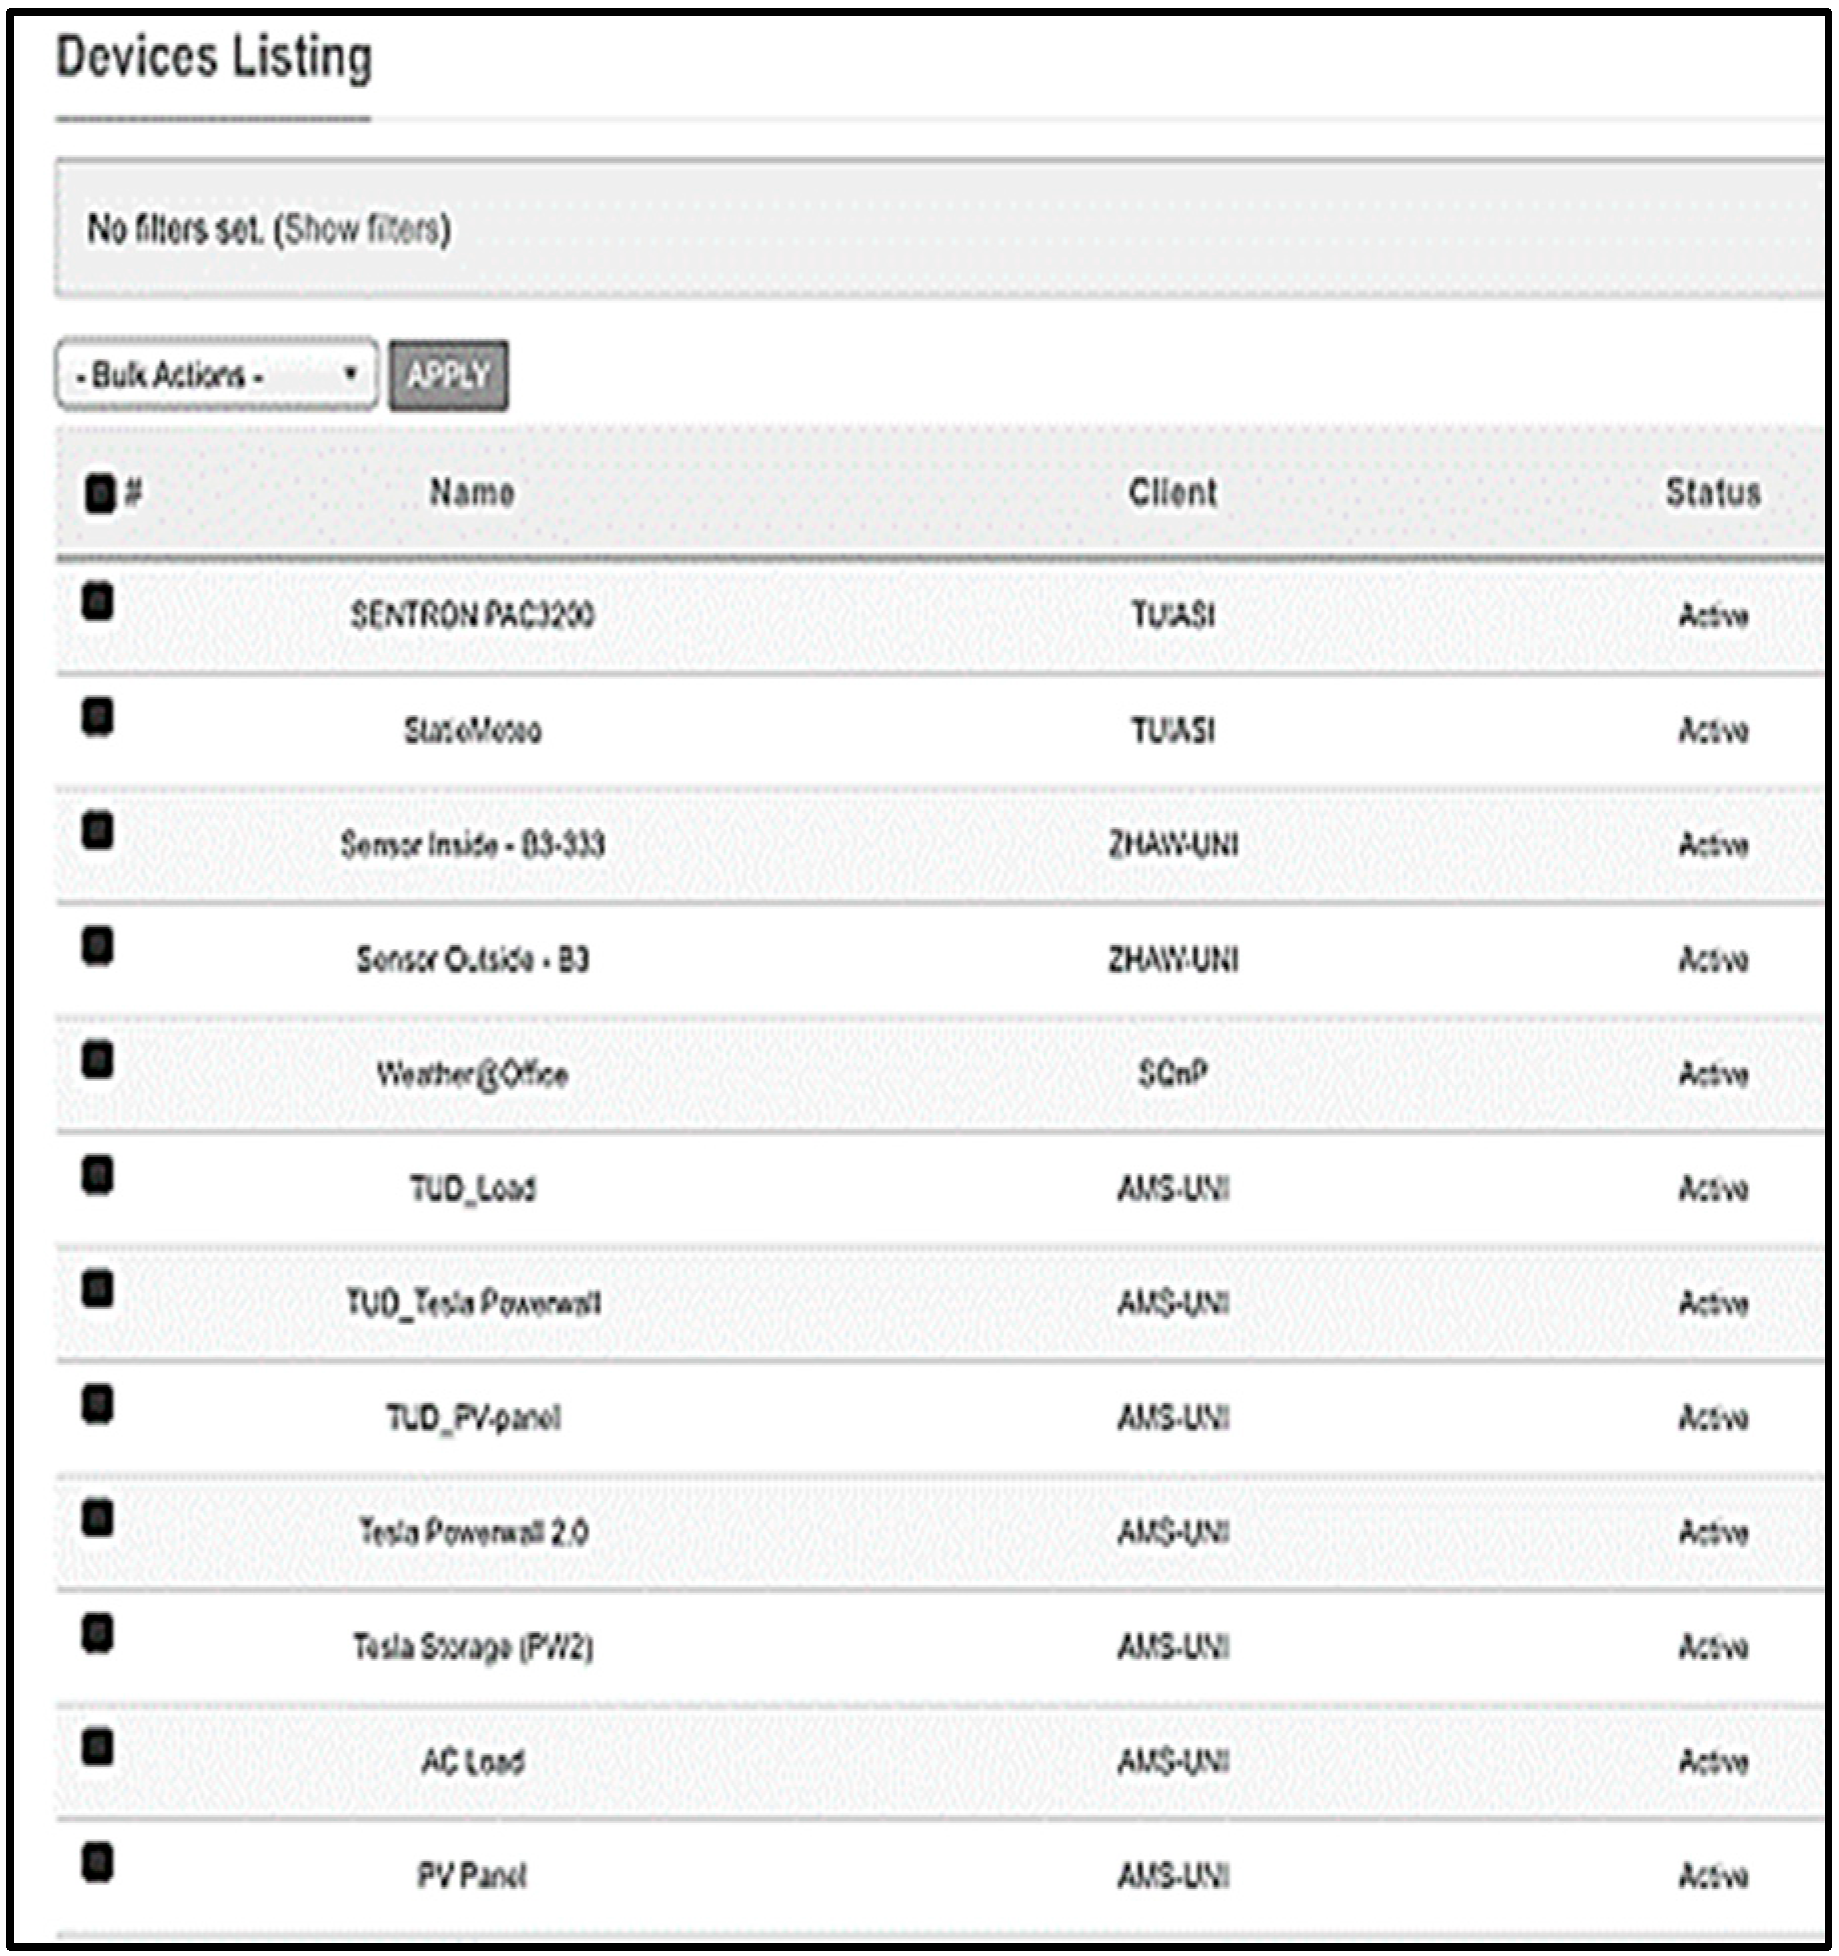
Once a location from the building is assigned to the user account, the user can add a device (see Figure 10), view the list of connected devices (see Figure 11), import data (see Figure 12), and select operations to apply to recorded data. A device can have one or more sensors associated with it. For example, a weather device may have sensors for outdoor temperature and indoor temperature. Each device is assigned a specific location and operates at a designated reading frequency. This frequency decides how often data is collected and when the device can provide real-time data.
The user can view the uploaded data by selecting View Device Data from the device list, as shown in Figure 13.
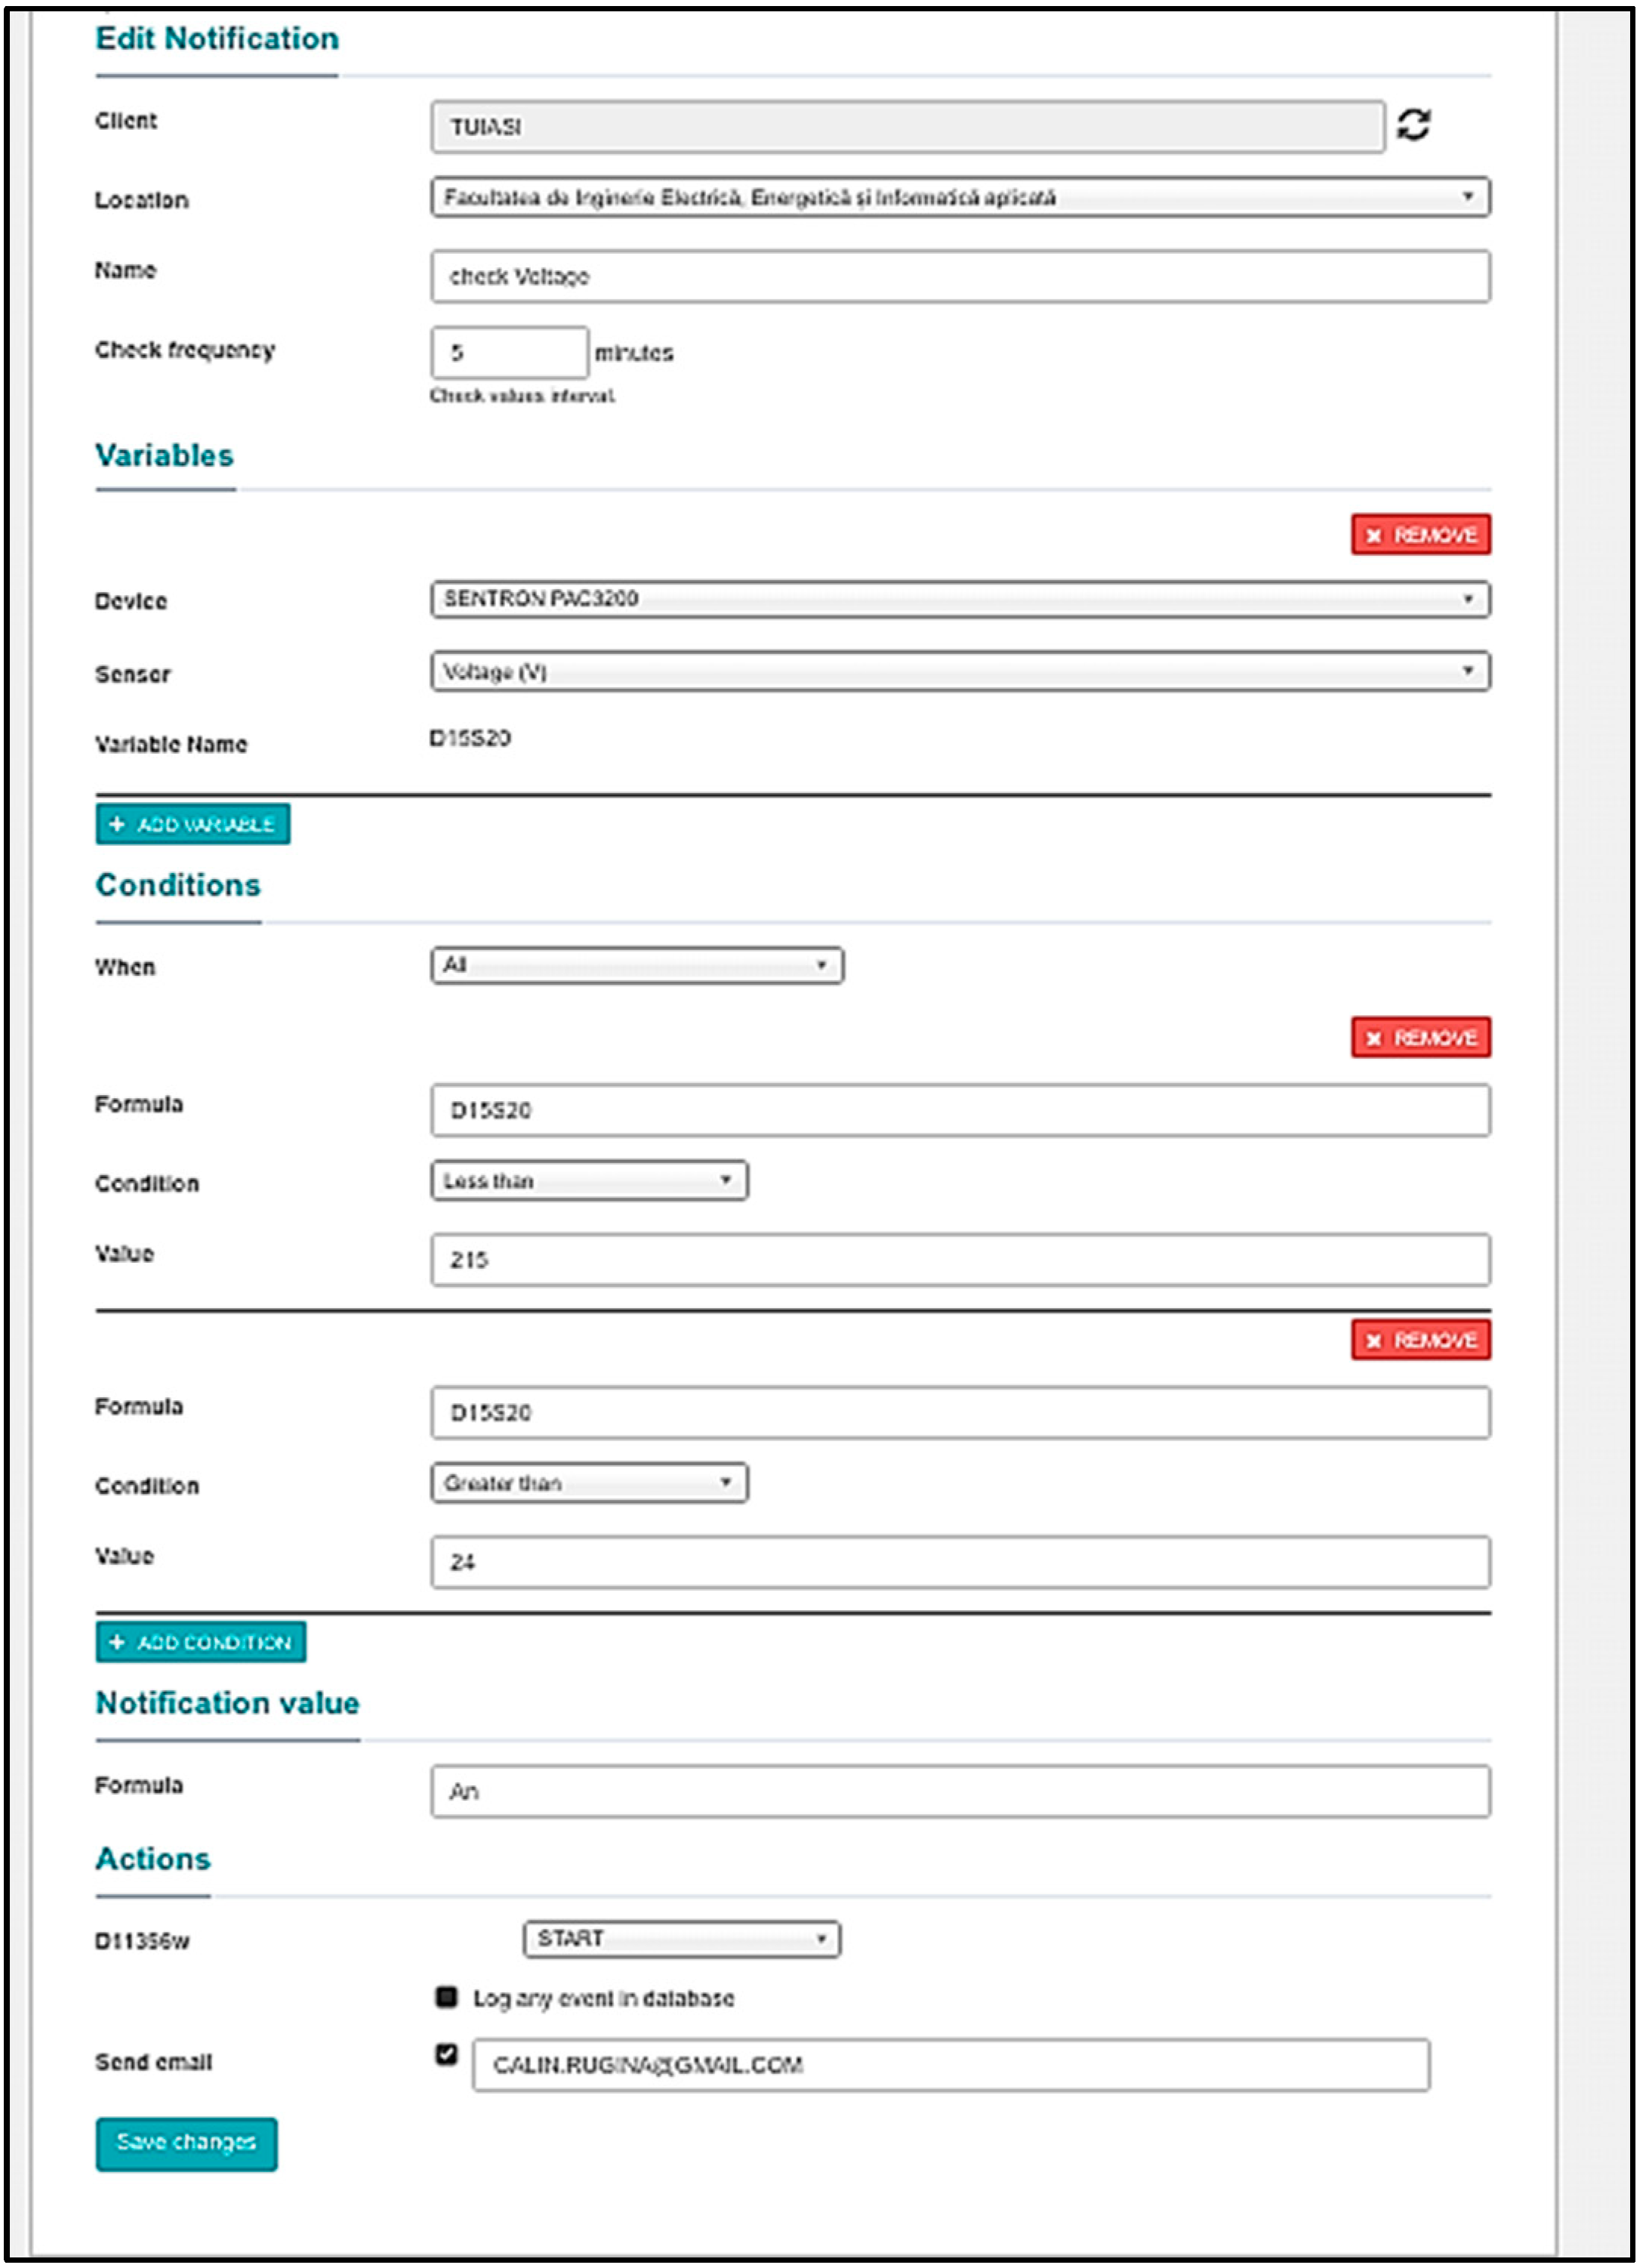
The Notifications section includes the following fields (see Figure 14):
  • details—where each notification’s name is defined for future use. Additionally, if the event is validated on location and through specific data, the frequency range is specified.
  • variables—for devices and sensors used within the premises, the notification variables and thresholds are established;
  • conditions—for data received from sensors, the logical conditions that will trigger actions when the specified values are reached are set;
  • actions—in the BENEFIT Platform, when a notification is issued, the corresponding actions are executed:
  • A log of the records is created (for later use);
  • An email is sent to the DM.
  • notifications—the KPIs calculated by retrieving data from the involved sensors and using the variables. The values for the specified event are saved and can be exported for later use in a *cvs file, which is processed and displayed in various graphical representations.

5. Results

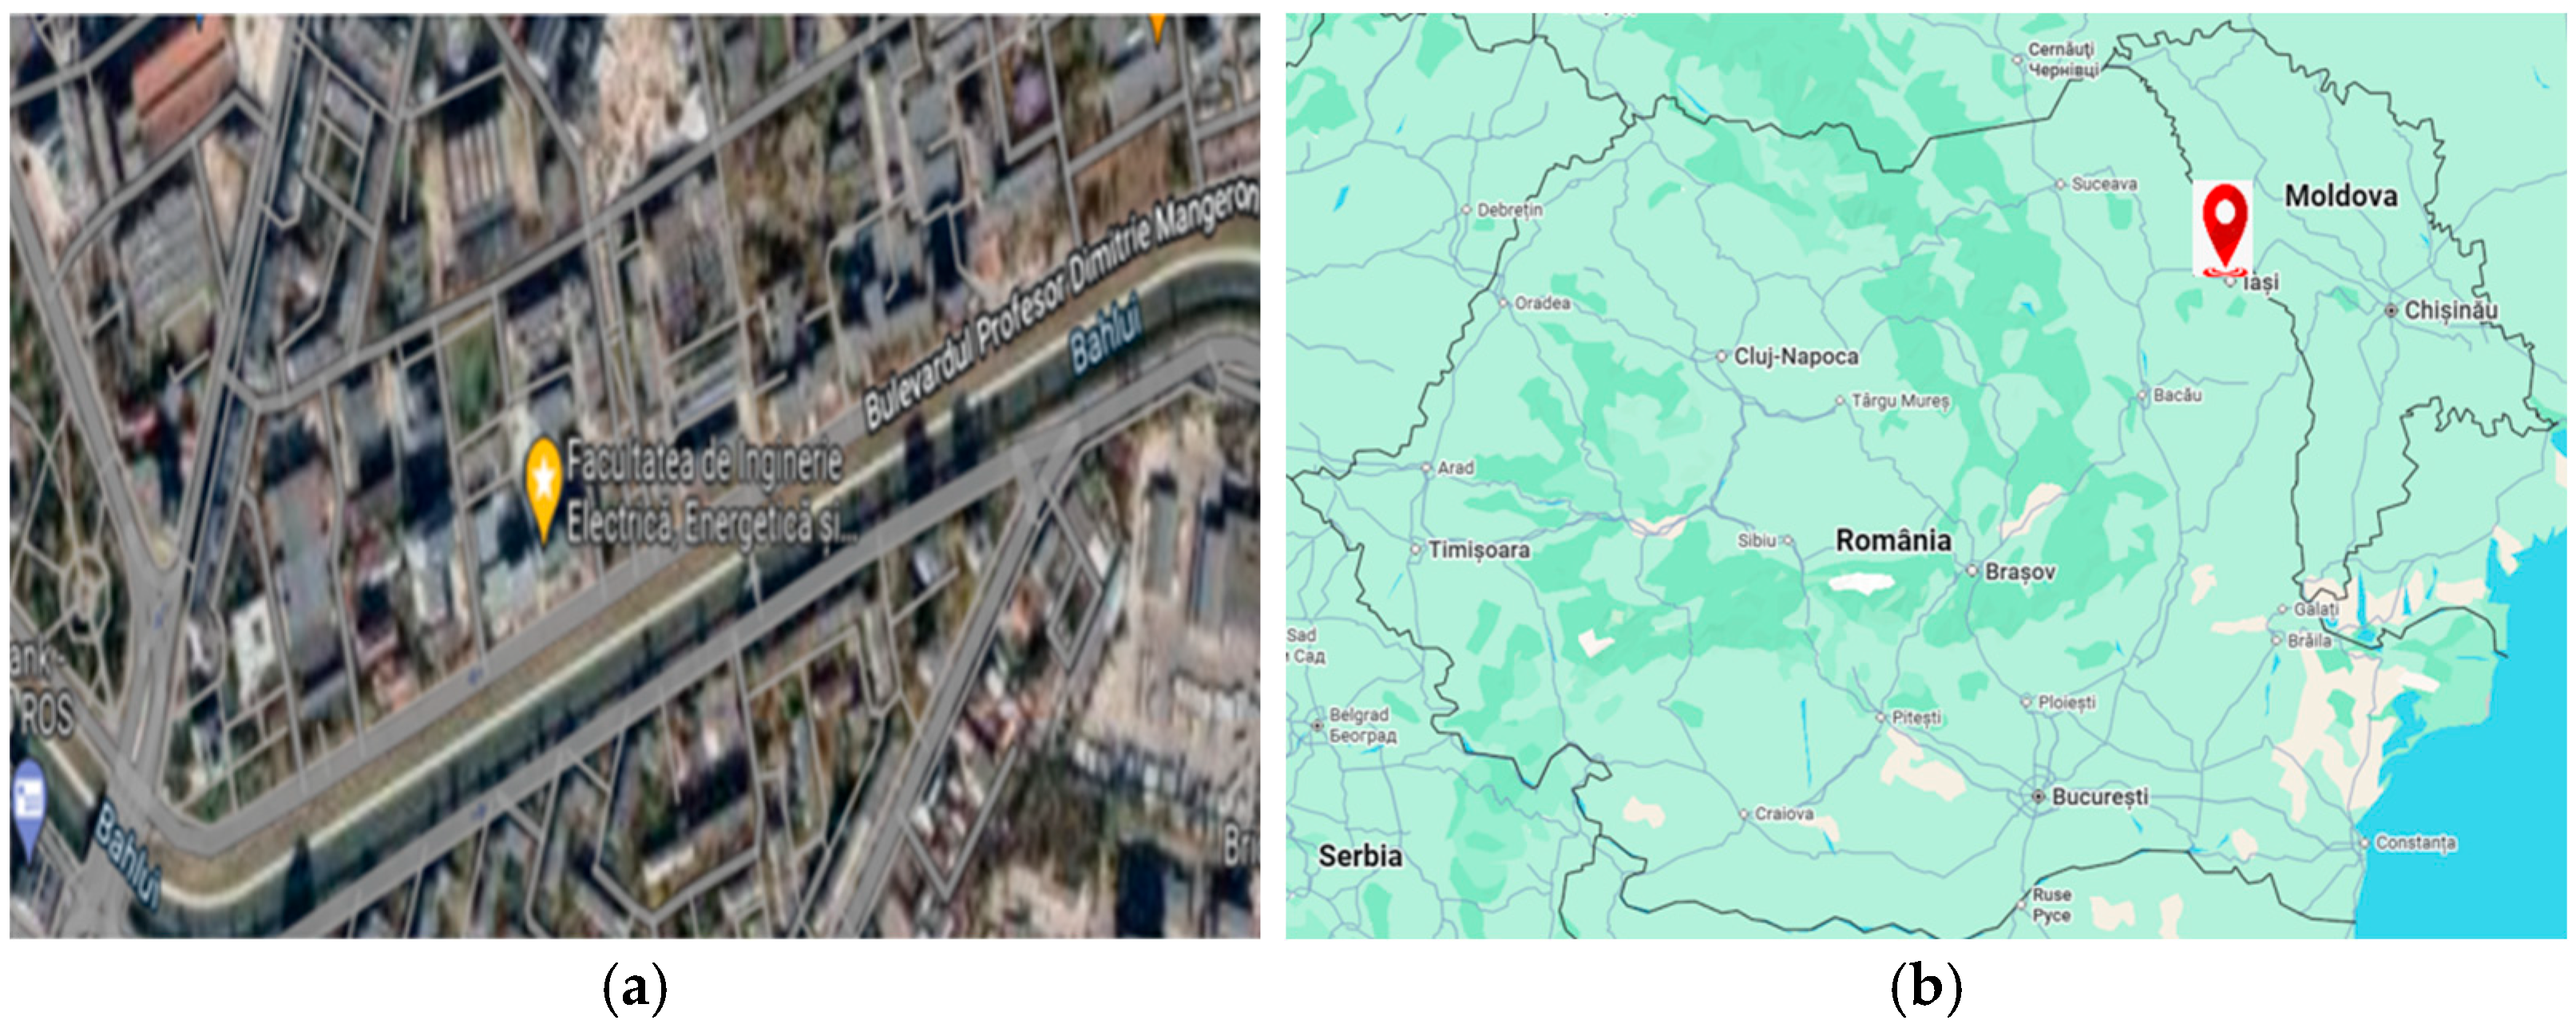
The case study refers to the implementation of the proposed smart BEMS in a building owned by the Faculty of Electrical Engineering at the “Gheorghe Asachi” Technical University of Iasi, Romania; see Figure 15a. Iasi is a city situated in the northeast of Romania, as shown in Figure 15b. The implementation of smart BEMS always begins with gathering information about the climate, weather, and building infrastructure. Consequently, the following figure presents this important information.
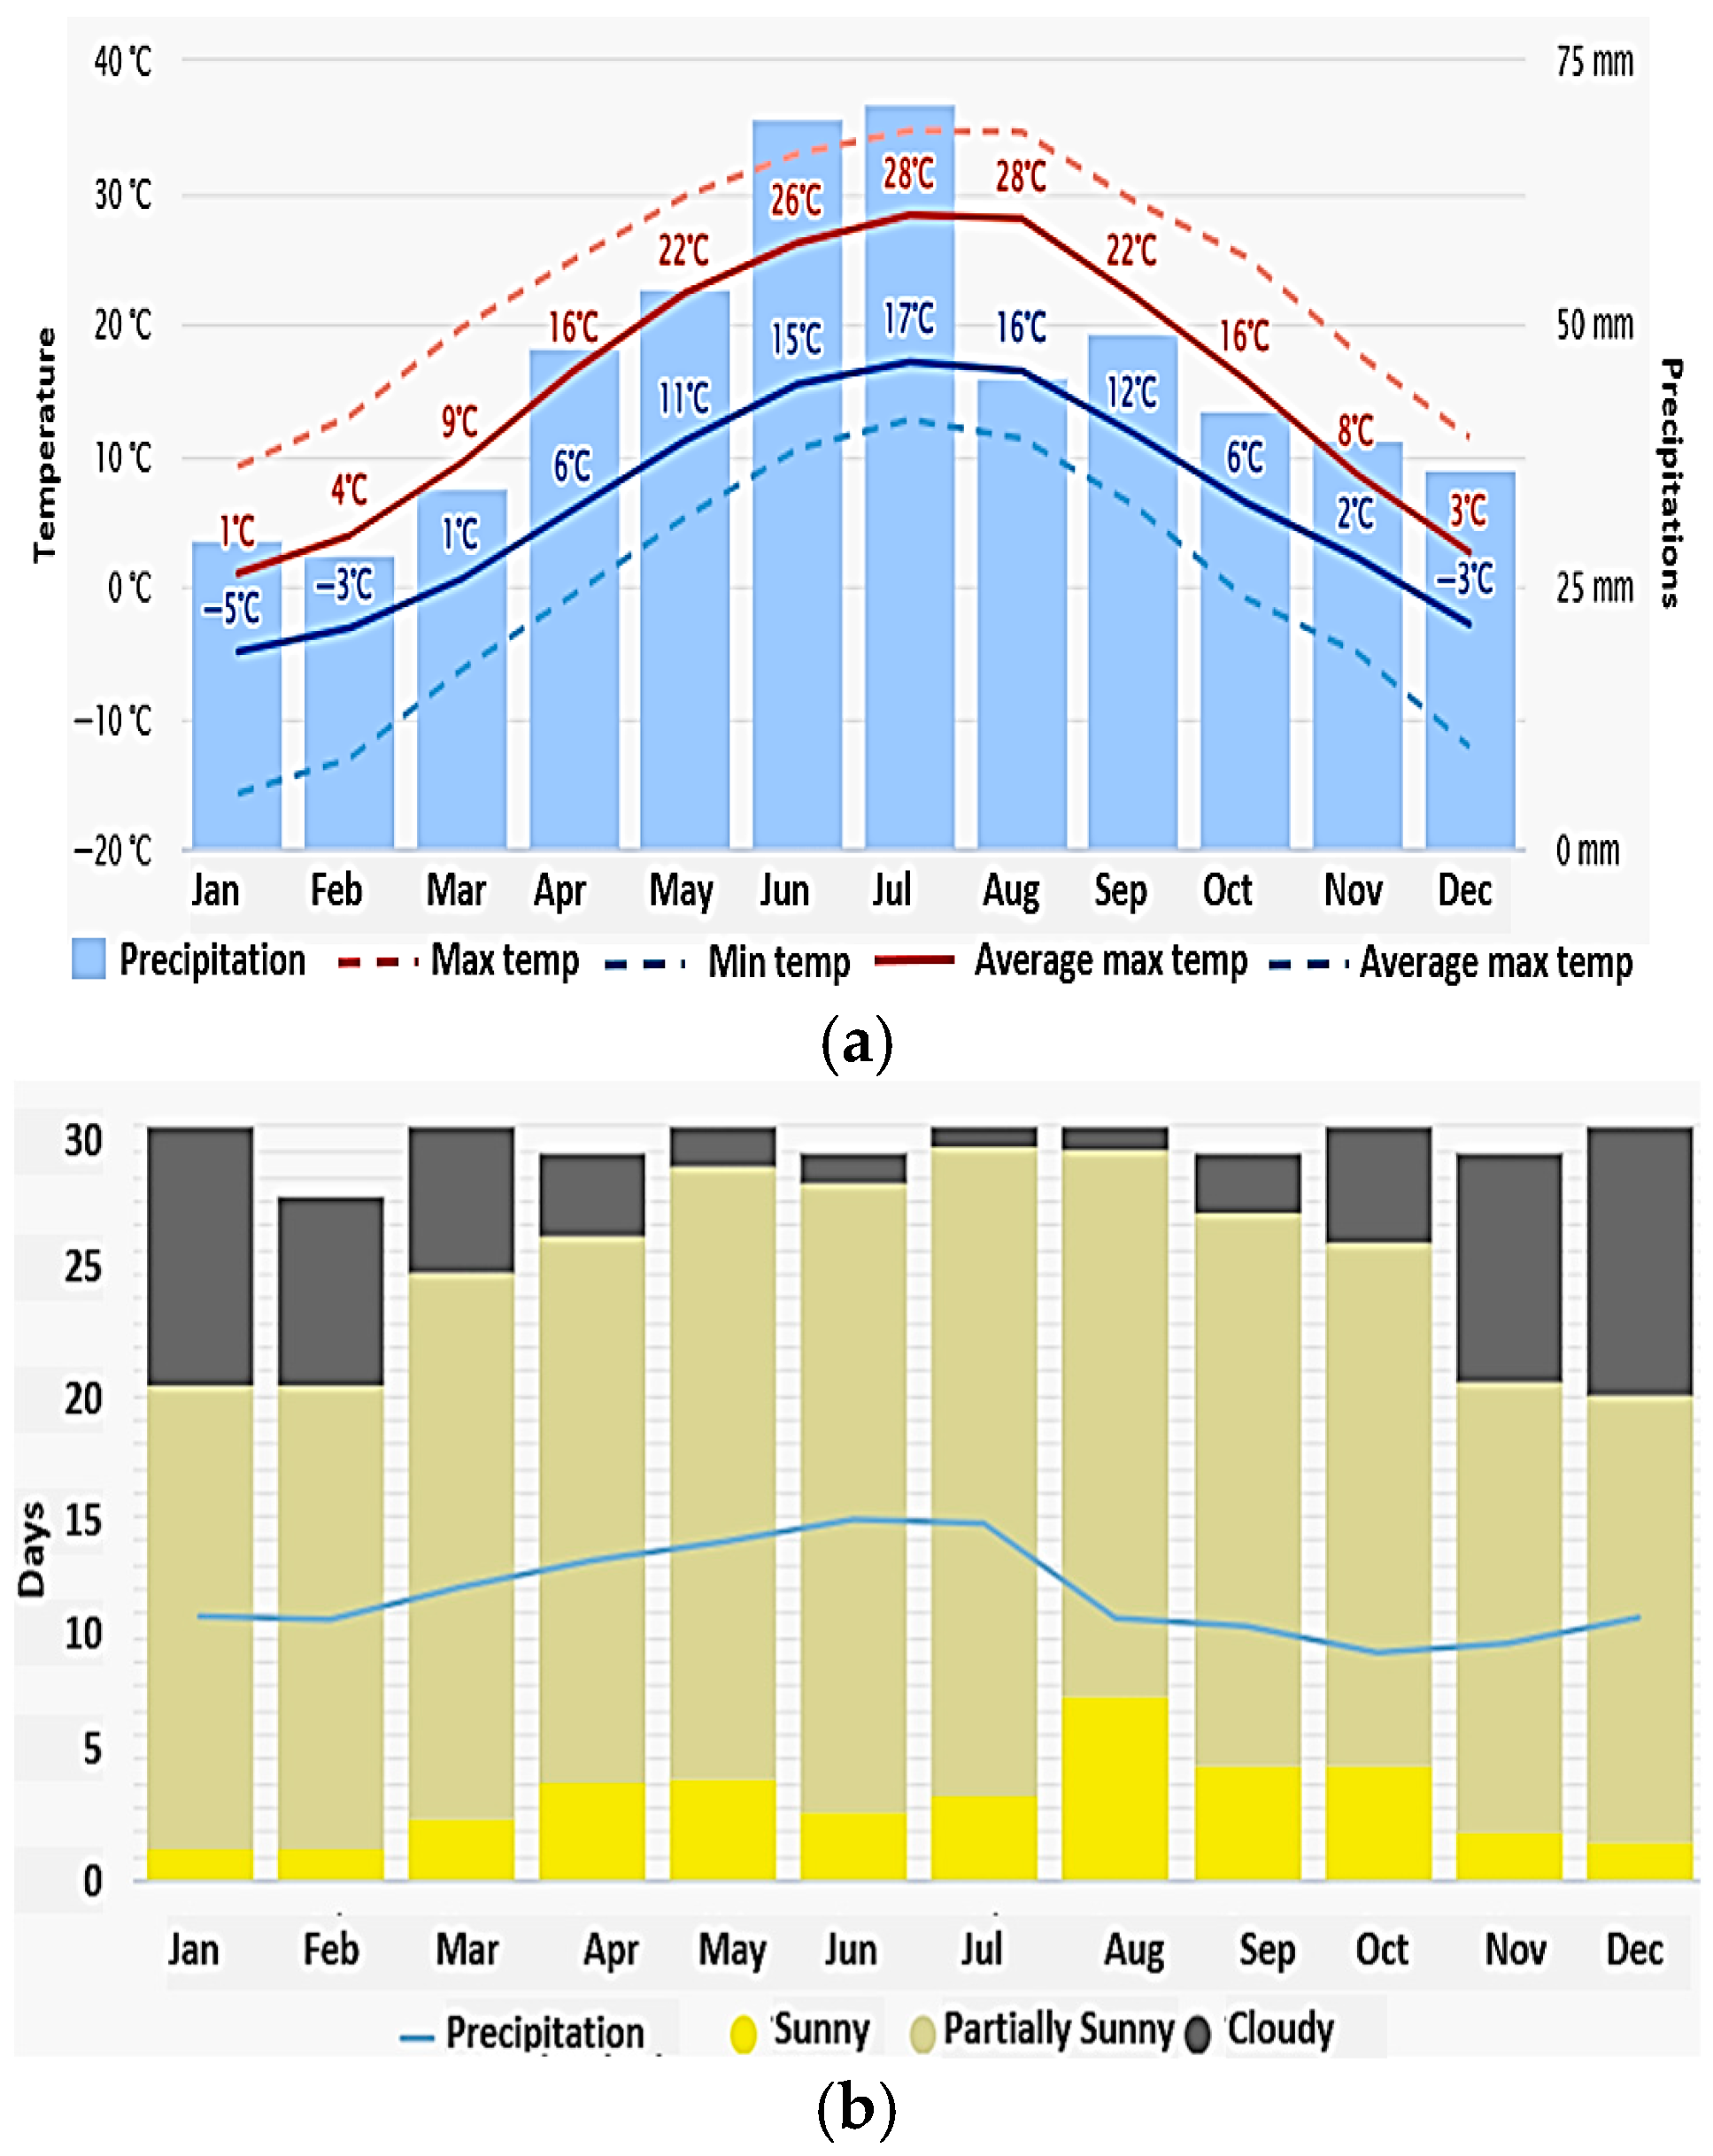
Weather data were collected from the platform [41] and are based on 30 years of hourly weather model simulations. They provide a reliable overview of typical climate patterns and expected conditions, including temperature, precipitation, solar irradiation, and wind speed, with a spatial resolution of approximately 30 km. In the Iași region, the climate is predominantly temperate continental, characterized by mostly dry summers and high temperatures, with temperature variations between −36 °C and +40 °C, the annual average during this period being +9.5 °C. The average number of days with sunny skies is 106.7, those with cloudy skies amount to 114.4, and days with overcast skies total 143.9.
Precipitation distribution is uneven, with 55 mm to 85 mm falling during the rainiest months (May–July), significantly higher than the 20 to 30 mm recorded in January and February. Wind speed in Iaşi varies throughout the year, ranging from 7.2 km/h to 14.4 km/h. From July to October, the average wind speed is approximately 2 km/h. The months of February, March, and April experience higher averages around 14.4 km/h, marking the peak windy period. Figure 16a shows the weather data for Iasi, including average temperature and precipitation.
The average maximum (solid red line) indicates the typical highest temperature for each month, while the average minimum (solid blue line) shows the usual lowest temperature. The minimum and maximum (dotted blue and red lines) represent the average of the hottest days and coldest nights over the past 30 years. Monthly precipitation below 30 mm indicates drought periods. The distribution of cloudy, partly cloudy, and sunny days across the months is indicated in Figure 16b. The maximum temperature for Iasi is displayed in Figure 16c, illustrating how many days a month reach certain temperatures. Lastly, Figure 16d and Figure 16e show the wind speed data shared by days and the solar radiance in the Iasi area.
The “front view” and “back view” of a 3D model presented in Figure 17 show the sides of the building.
Table 2 provides the building’s characteristics derived from its thermo-physical properties. The occupancy rate indicates the number of people per square meter. In our case, it is 0.11 people/m2, with a total of 500 occupants.
Based on the electricity and heat data collected from smart meters and sensors (temperature and light) sent to DH, the data processing module provides the user or decision-maker with information regarding performance indicators.
The electricity monitoring has been made with the Siemens Sentron PAC 3200 energy monitoring device (Siemens, Munich, Germany), see Figure 18. SENTRON PAC3200 is a power monitoring device that shows all key parameters for low-voltage supply networks [42]. It can be integrated into single-phase, two-phase, or three-phase systems and works in two-wire, three-wire, or four-wire setups. The SENTRON PAC3200 provides a range of proper monitoring, diagnostics, and service functions, including an active energy and reactive energy meter, a universal meter, and a working hour counter to track the operating time of connected loads.
Communication can be facilitated through the built-in Ethernet interface or an optional interface module. Additionally, the device includes a multifunctional digital input and digital output. Parameters can be configured either directly on the device or via the communication interface.
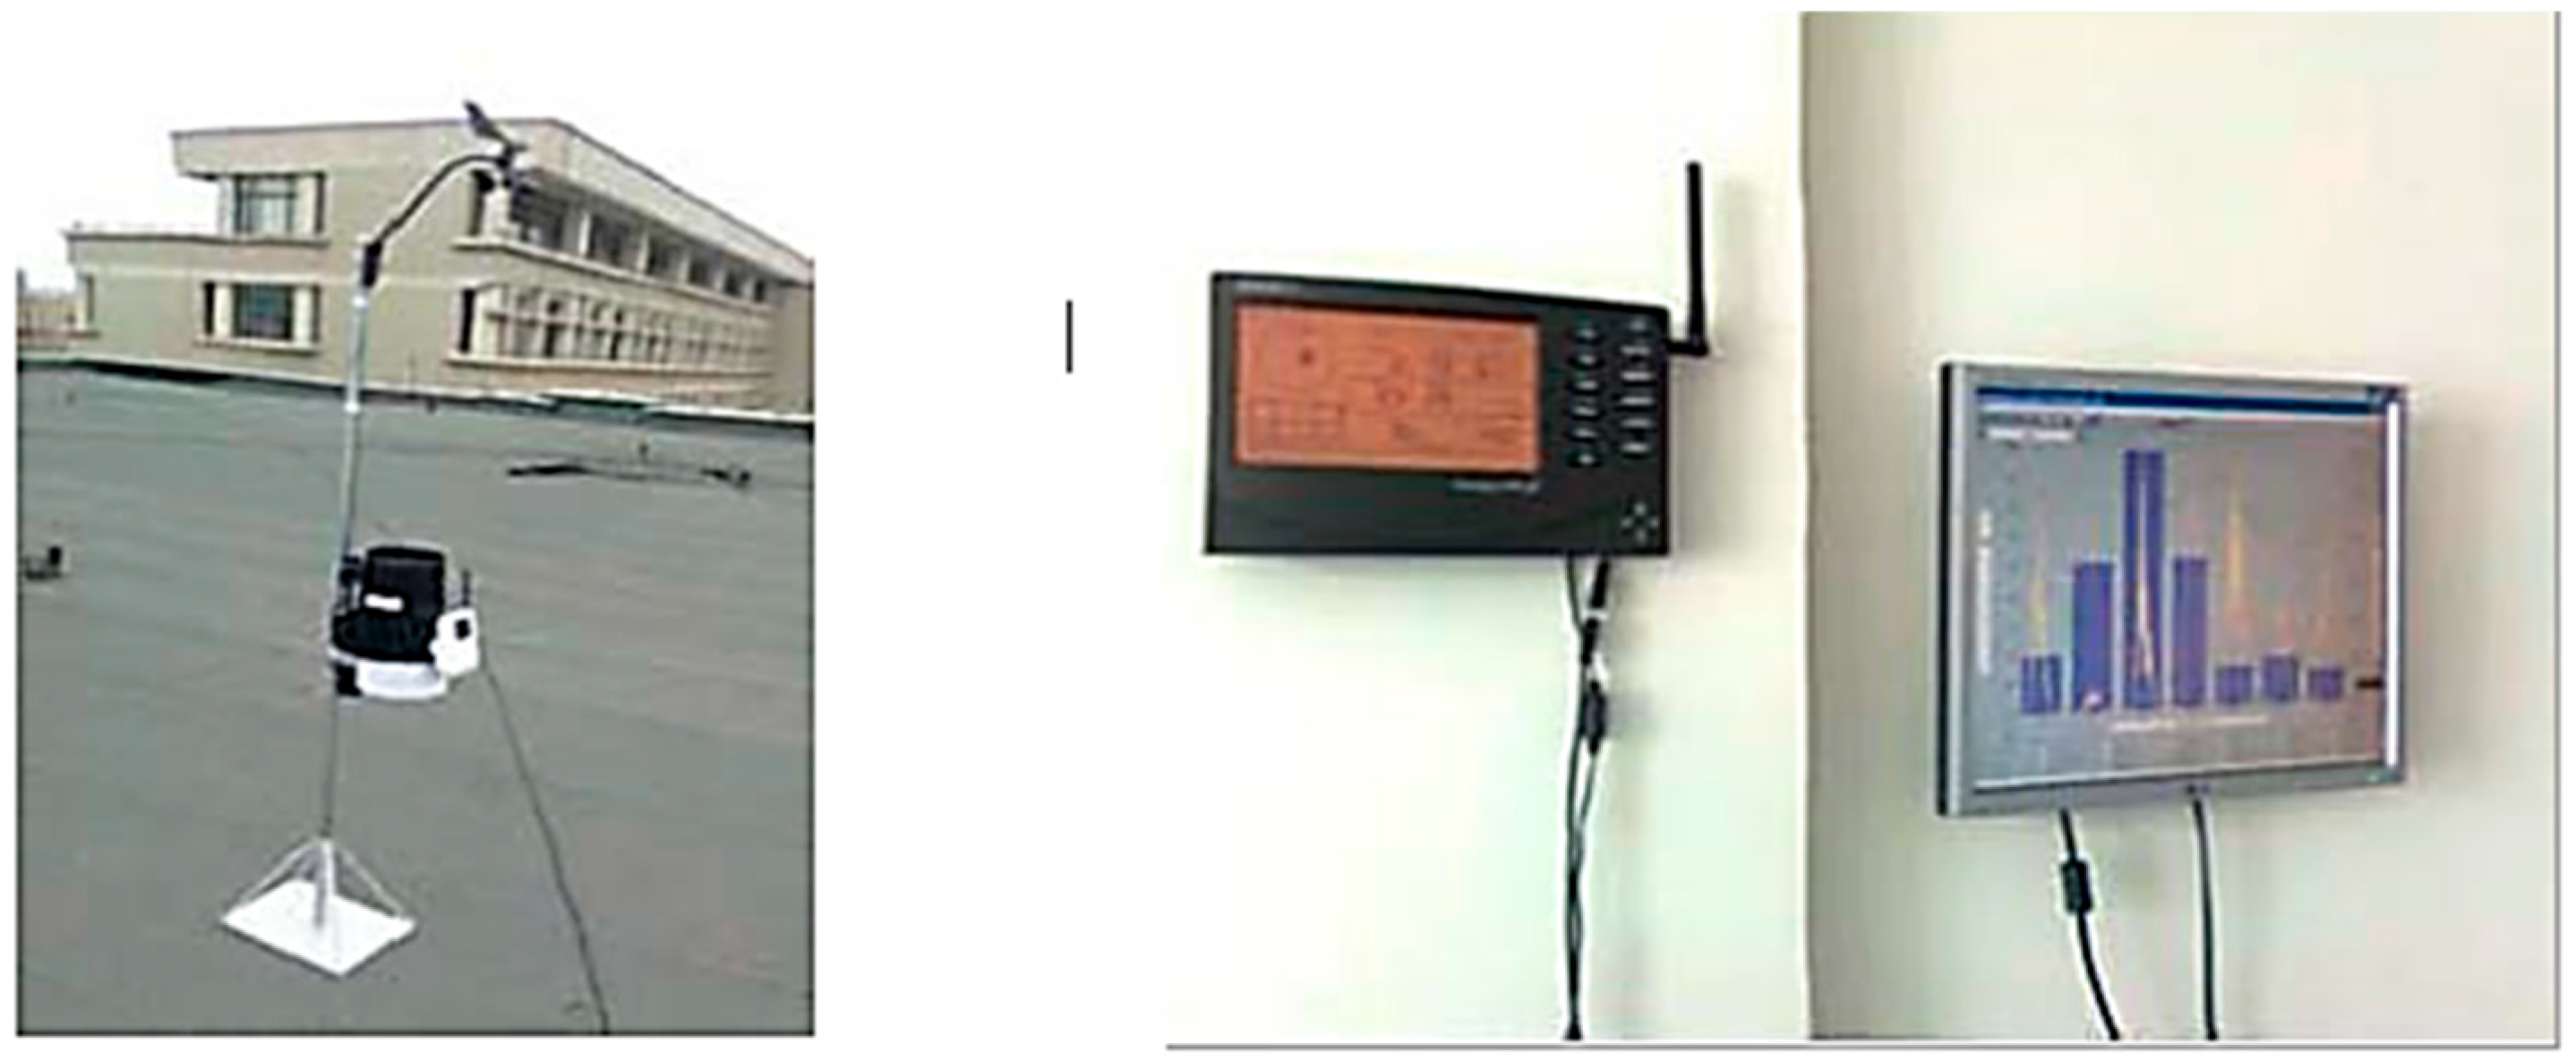
The Davis Vantage Pro2 weather station (Davis Instruments, Hayward, CA, USA) has been used to collect weather data and transmit it wirelessly to the platform, as shown in Figure 19.
The weather station incorporates a LoRaWAN communication system. The station, rugged and versatile, is fitted with a wide array of sensors and provides dependable weather data even in the most challenging conditions, along with these variables: inside and outside temperature, relative humidity, barometric pressure, rainfall, dew point, wind speed and direction, and solar radiation.
Regarding the heating monitoring, by installing the heat smart meters, the amount of thermal energy flowing through the pipes of the building has been monitored continuously. Then, the data collected by the meter has been wirelessly transmitted to the platform.
While some indicators have known values, aggregated at the building level, others are calculated using the DesignBuilder software tool based on data loaded from the database (such as energy consumption by source type and usage; indoor and outdoor temperatures; and heating and cooling loads). Figure 20, Figure 21 and Figure 22 present the energy consumption, heat gain, and temperature for each day over an analyzed year.
It is notable from a temperature perspective that the overheating hours during summer are limited and occur when the building is not in use, such as during the summer holiday.
The importance of some indicators represented in the figures is presented below.
The sensible heating zone indicates the warming effect of the HVAC system on heat balance, caused by introducing air warmer than the current zone air. Likewise, Zone Sensible Cooling shows the cooling effect. These effects are not always directly related to the actual heating or cooling delivered, primarily due to free cooling from outside air. For instance, even if the cooling system was not running at a specific moment, the Zone Sensible Cooling value on the Heat Balance graph can still be high due to the intake of cooler outside air through mechanical ventilation. Moreover, both the zone sensible heating and cooling values include some warming from fans, which tend to heat the air they move.
Solar gain through exterior windows refers to the increase in indoor heat resulting from solar radiation passing through and being absorbed inside the building.
Occupancy (presence and number of occupants) is a crucial factor affecting the energy efficiency of HVAC systems, as it influences heating and cooling demands by changing conditioning periods and settings. On our platform, occupancy is linked to heating and cooling demands, optimizing efficiency.
The data aggregation at the monthly and yearly levels is presented in Figure 23, Figure 24, Figure 25, Figure 26, Figure 27 and Figure 28.
As outlined in the previous section, the DM can visualize data either in the graphical form associated with Figure 20, Figure 21, Figure 22, Figure 23, Figure 24, Figure 25, Figure 26, Figure 27 and Figure 28 or through a statistical analysis. Since the main daily, monthly, and seasonal variations in energy consumption at the building level were identified for heating and cooling components, as observed in the above figures (lighting being a constant part of total energy use), the statistical analysis will focus on these.
The main statistical parameters in analysis are the mean, standard deviation, and quartiles (Q0–Q4), which divide data into four parts. The signification of the quartiles is the following: Q0: minimum value; Q1: 25th percentile (lower quartile); Q2: median (50th percentile); Q3: 75th percentile (upper quartile), and Q4: maximum value.
The representation of the data using the quartiles can be performed with the help of the box plots, which offer several advantages:
  • They show the sizes of the center quartiles (Q1, Q2, and Q3).
  • They display the interquartile range (IQR), calculated as Q3–Q1, which measures data spread.
  • The IQR reveals the range of the middle 50% of the data, represented by the width of the “box”. The IQR indicates the range of the middle 50% of the data, essentially showing the width of the “box” on the box plot.
Figure 29 and Figure 30 display the box plots for heating and cooling consumption for each month. Table 3 and Table 4 present the calculated values of the statistical parameters, including the mean, standard deviation, and quartiles (Q0–Q4), only for the months when the energy consumption was not zero.
The analysis of the results highlighted that the heating consumption covers the spring, autumn, and winter in Romania when lower outdoor temperatures are recorded, as indicated in Figure 16a. The mean of the consumption exceeds 8000 kW during the winter season, followed by autumn with a mean between 3000 and 8000 kW, and spring with a mean in the range of 2000 to 5000 kW. Indicator IQR, which measures the spread of the data, has values between 5000 and 6500 kW for the months at the beginning and end of the year and lower values for the months of October (4366 kW) and April (2635 kW). Regarding cooling consumption, it covers the summer season (from May to September). The values are below 2500 kW (maximum recorded in July), approximately seven times lower than that recorded for heat consumption (17,174 kW). However, to compare the two types of consumption, heating consumption has been converted from the measurement unit [Gcal] to [kW]. The average has ranged between 1300 and 1600 kW during the warmest months (June, July, and August) and was lower in May and September (below 600 kW). The indicator IQR has values between 600 and 870 kW for the warmest months, with the smallest value recorded in September (337 kW). The highest value was observed in May, as quartile Q0 was 0 (there were days when the outside temperature was lower, and cooling was not needed).
The analysis of the results after one year of BENEFIT platform integration has led to a plan focused on measures to reduce energy consumption and enhance the building’s performance and efficiency. The first measure involved upgrading window insulation using low-emissivity glass (or low-E glass), which allows natural light to pass through while helping to reduce heat gain and thermal energy transfer (identified in the following with W1). Another aims to improve lighting efficiency through the use of LED tubes in conjunction with upgrading window insulation (identified with W2). A third proposal is to integrate renewable energy systems, such as photovoltaic panels, to create a net-zero electric energy building (W3). These measures will reduce energy consumption and create a more comfortable environment for faculty members and students.
The first two measures are being implemented, and the results based on the measured data to date and simulations using the DesignBuilder software tool are presented in Table 5 and Table 6.
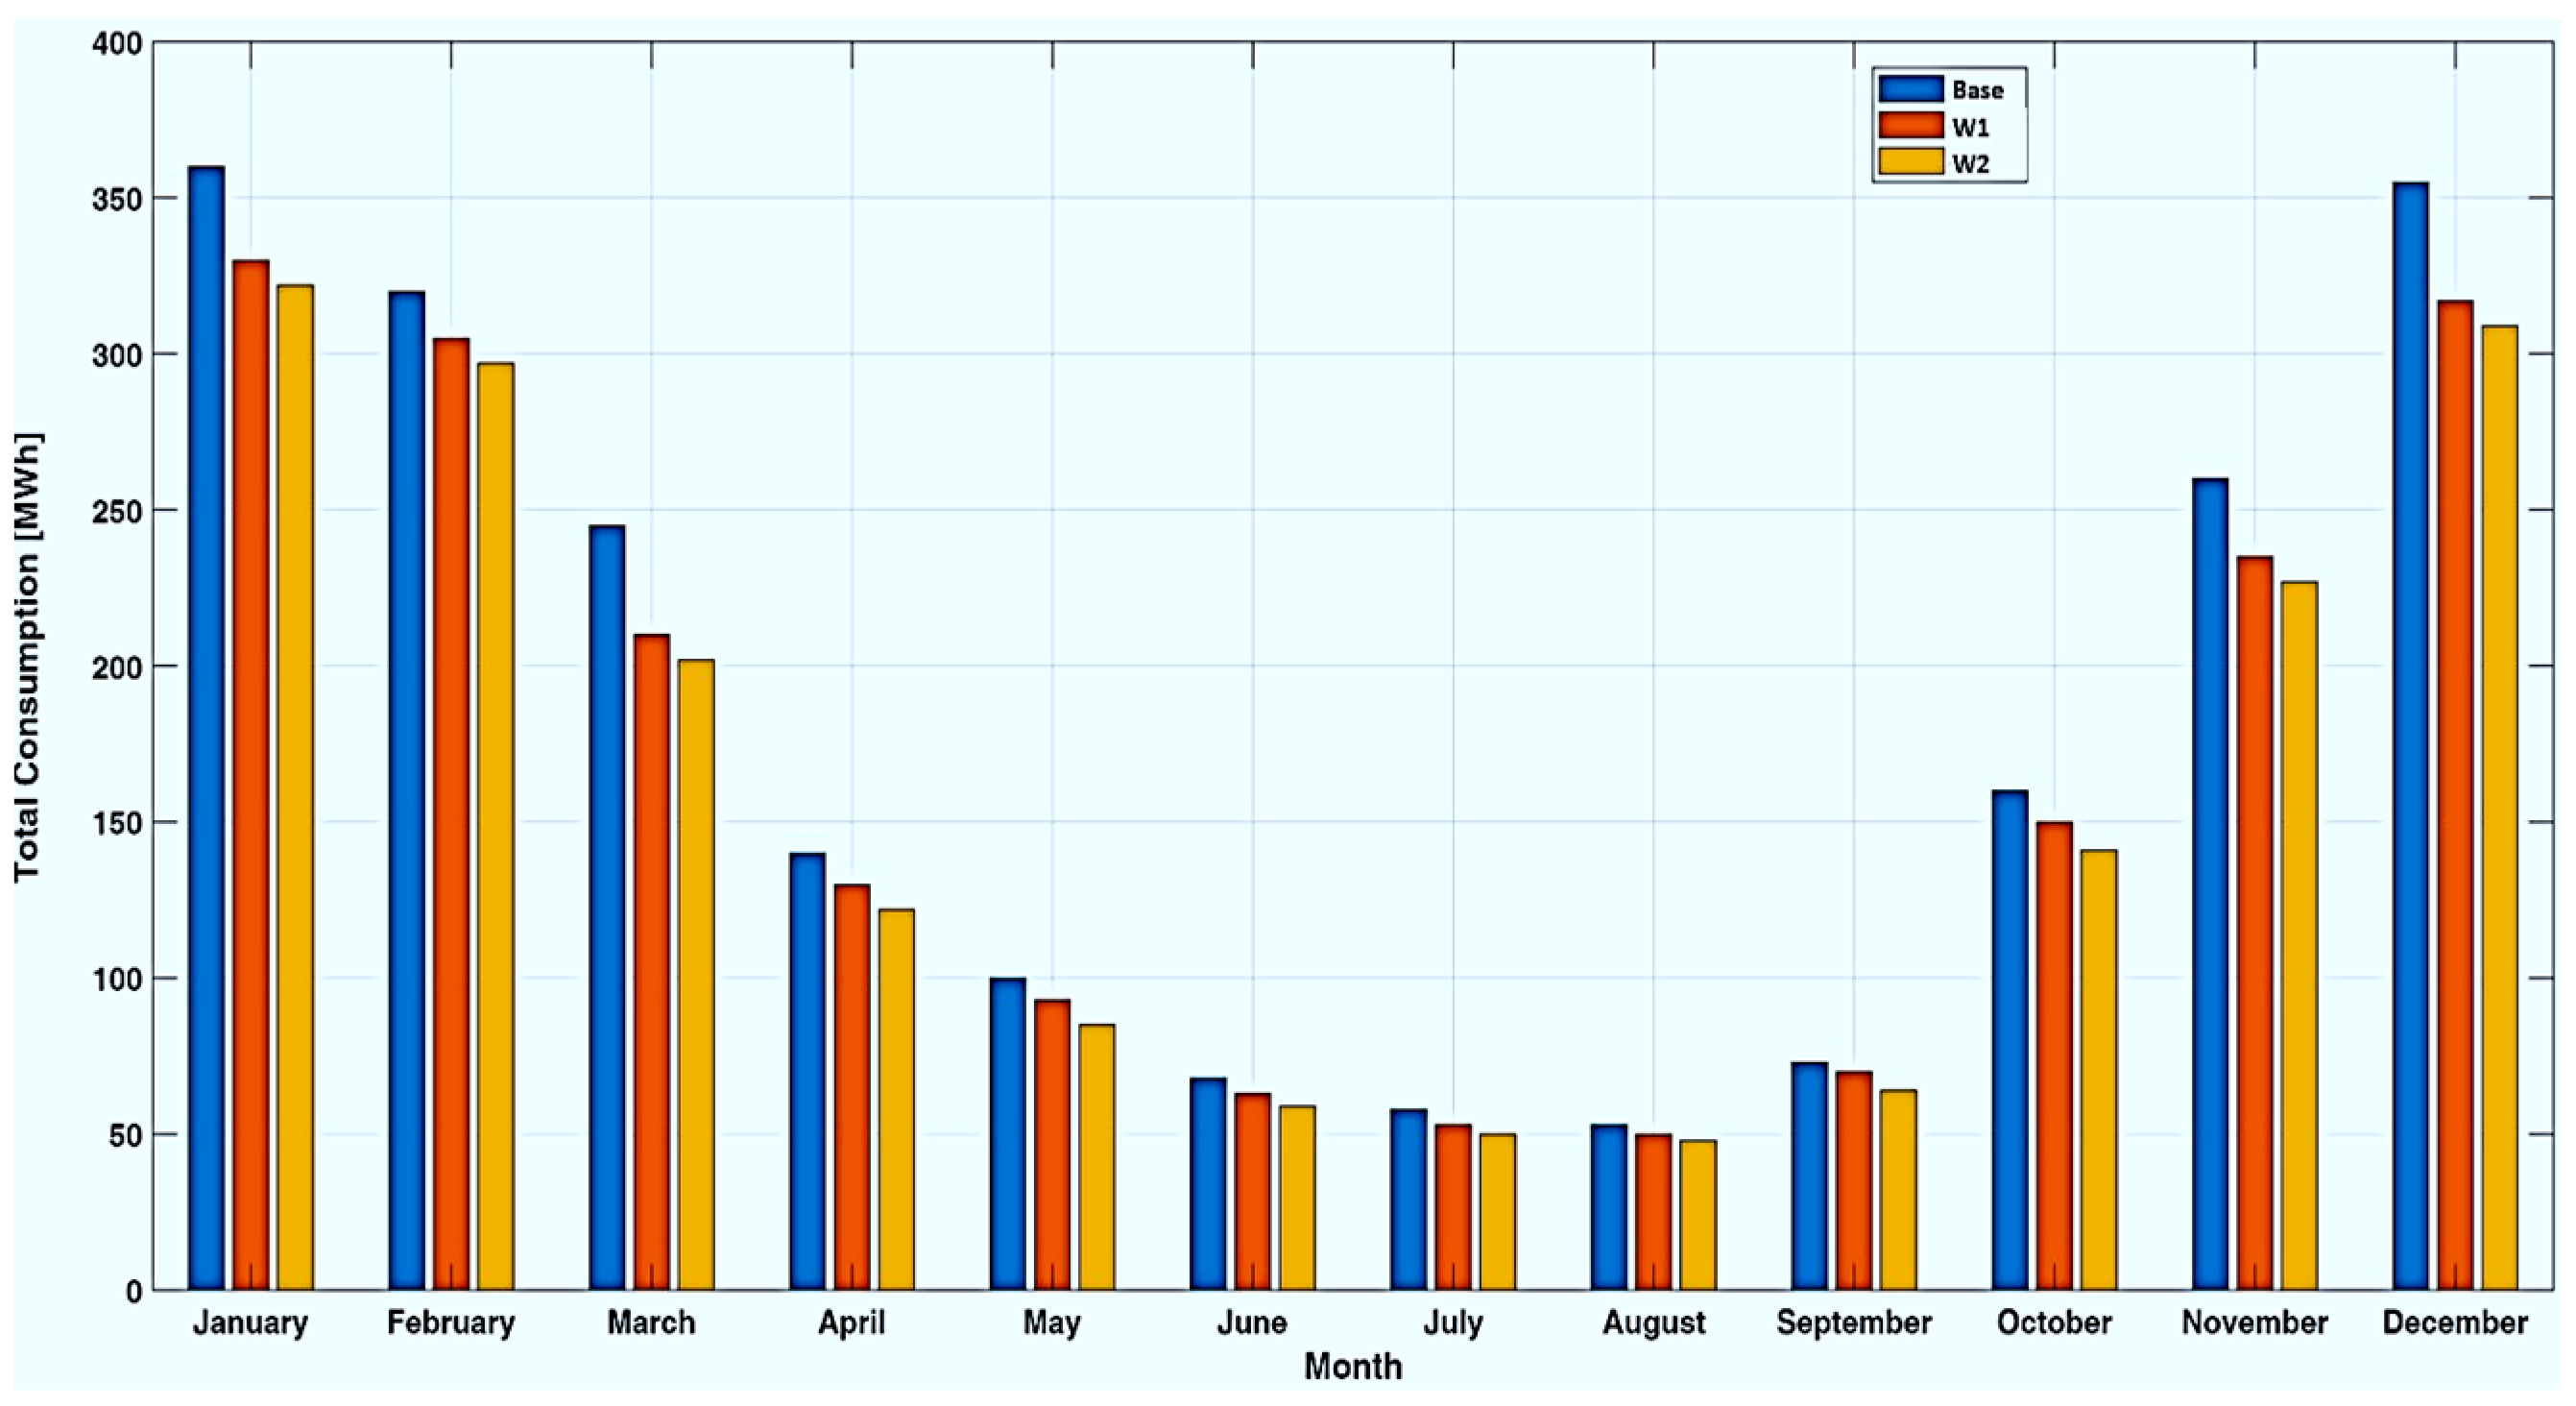
Table 5 displays the monthly energy consumption, using EC notation, and the energy savings identified through ΔEC notation. The baseline case, representing the situation without energy efficiency measures (results shown above), is labeled as W0. The first measure (upgrading window insulation) is marked as W1, and the second measure (LED lamps combined with upgrading window insulation) is marked as W2.
The mathematical relations used to calculate the energy efficiency are as follows:
E C i , m = E C W 0 , m E C i , m , i = 1 , , 12 , m W 1 , W 2 , i n   M W h
E C i , m = E C W 0 , m E C i , m E C W 0 , m · 100 , i = 1 , , 12 m W 1 , W 2 , i n   [ % ]
where ECW0,m represents the total energy consumption in the month m, with m = 1, …, 12, and m is the index used for the energy efficiency measures, m W 1 , W 2 .
In the absolute units (MWh), the highest energy savings have been recorded in December, March, and January (in decreasing order), exceeding 30 MWh, followed by November, February, October, and April, with savings between 10 and 25 MWh, for the measure W1. Energy savings below 10 MWh were observed during the warmer months. In percentage units, energy savings exceeded 10% in December and March; ranged between 5% and 10% in November, July, January, May, June, April, and October; and were below 5% in the remaining months.
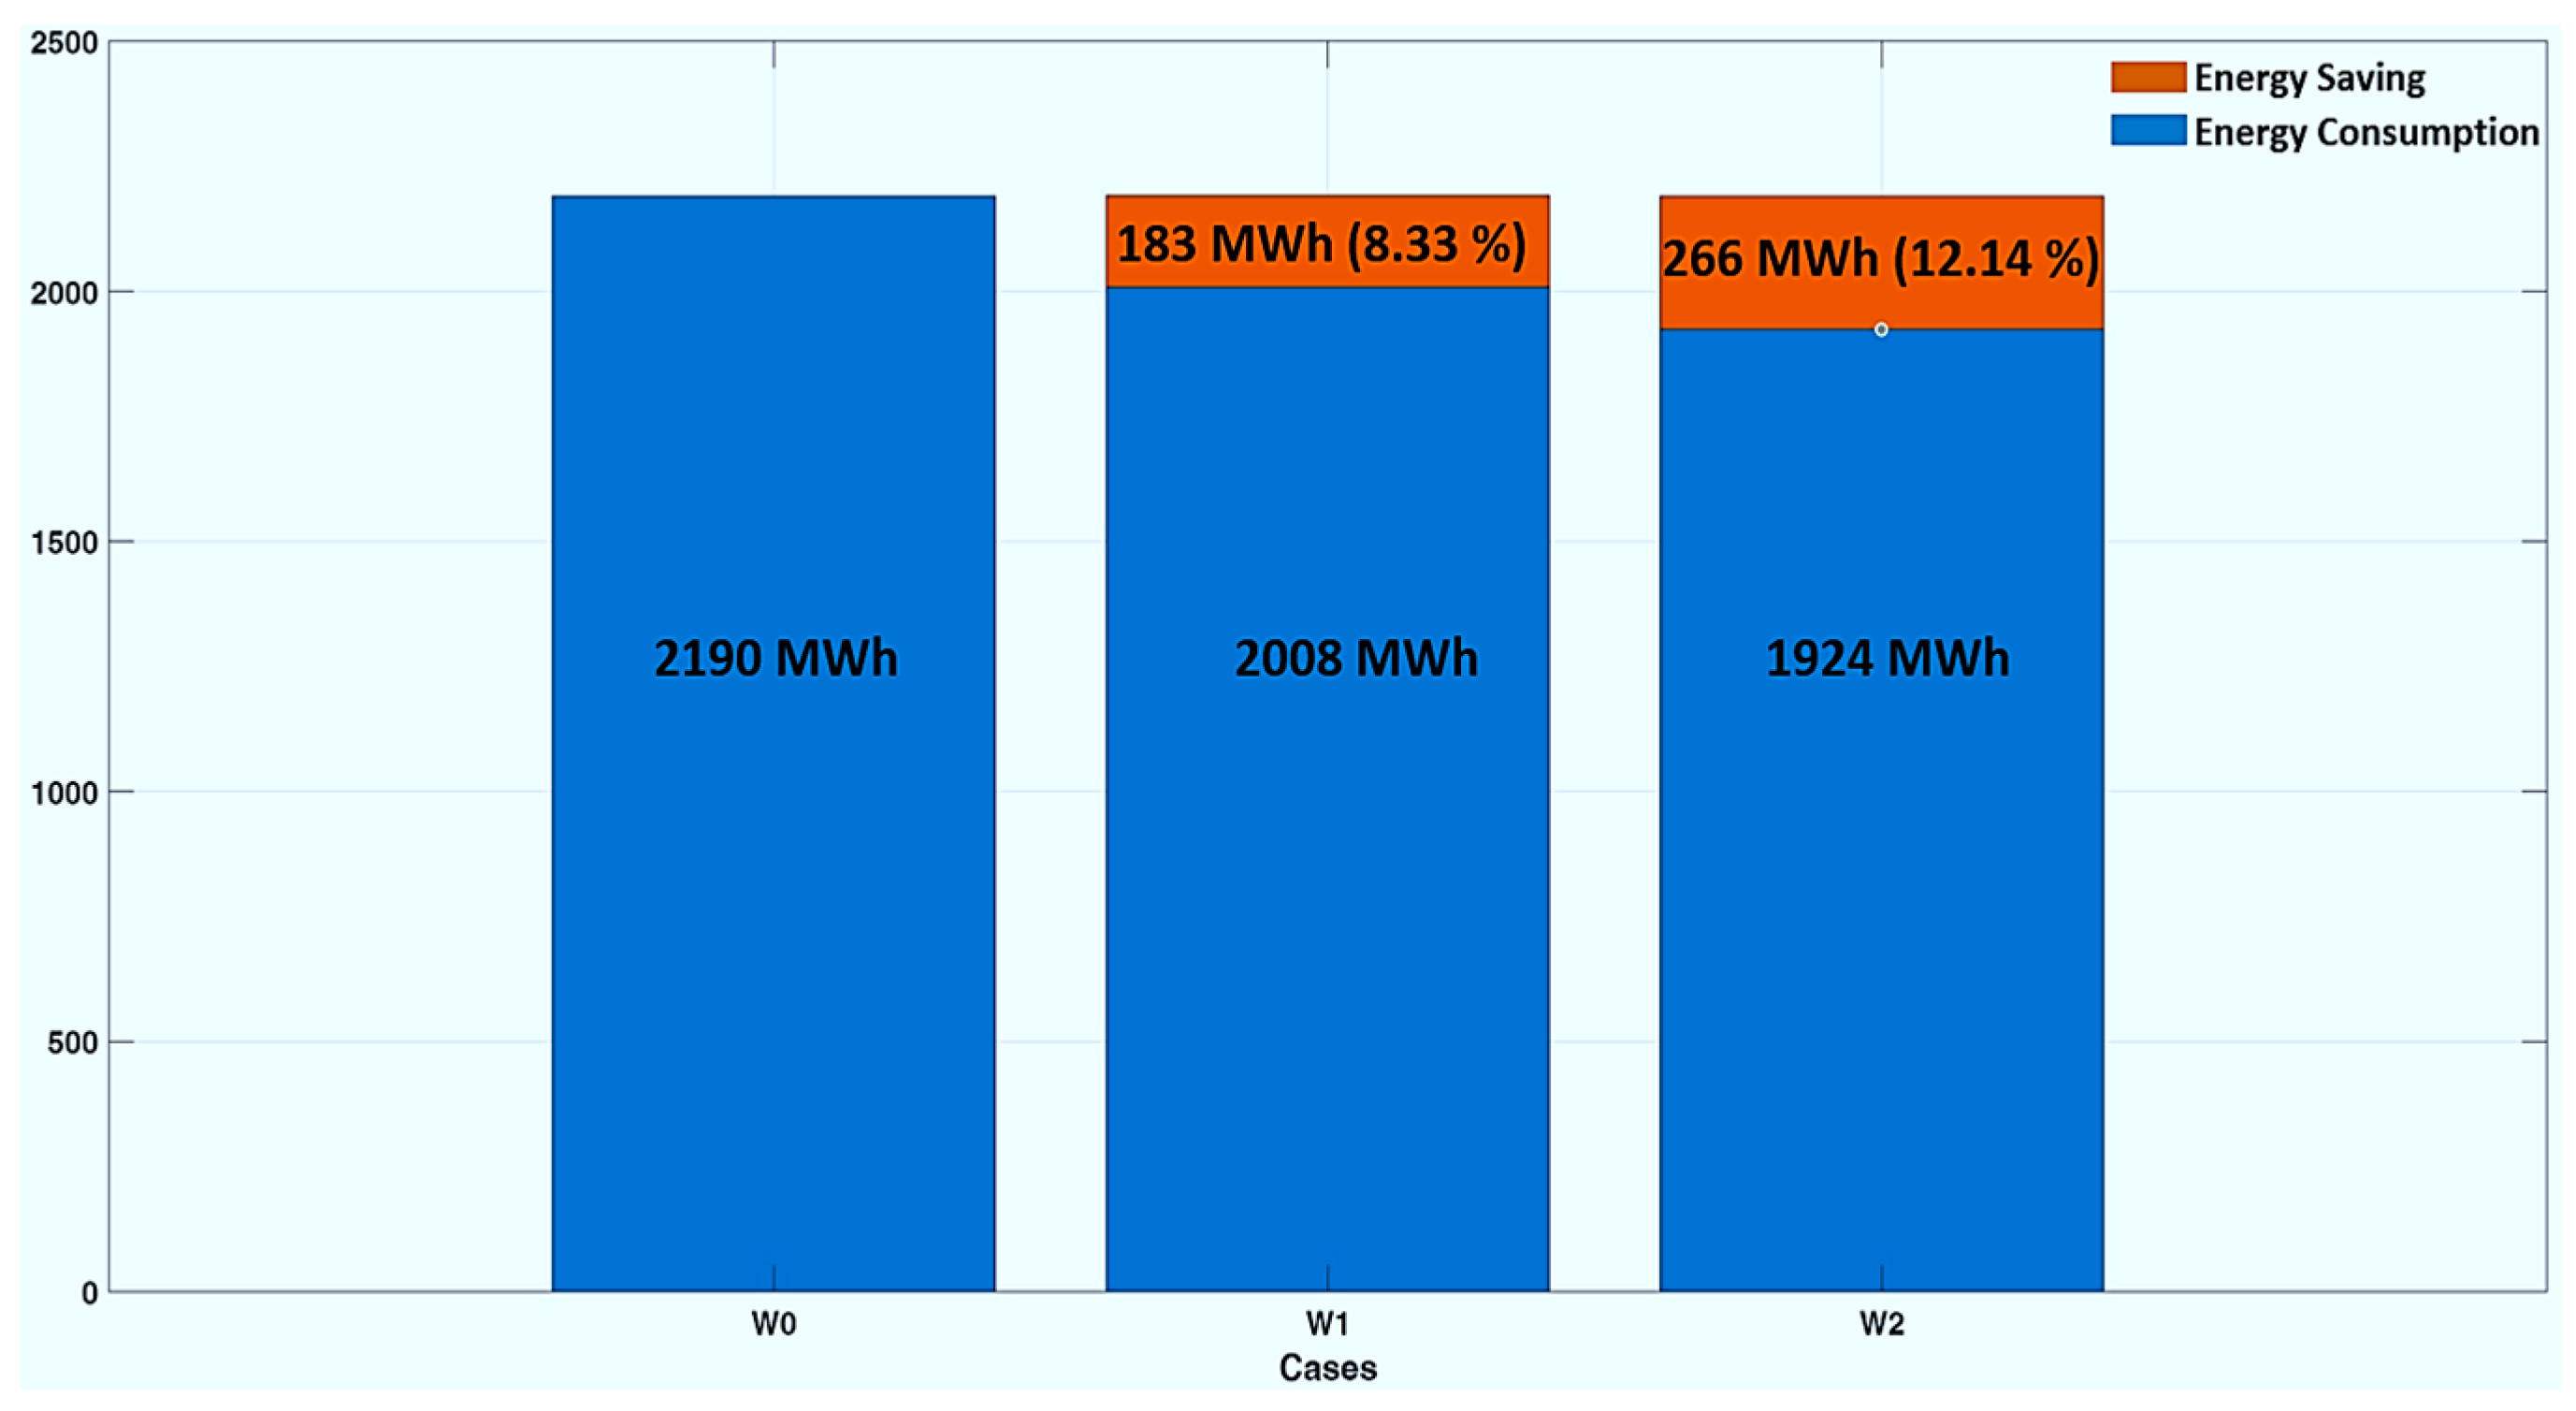
Table 6 shows the breakdown of energy consumption into its main components: heating, lighting, cooling, and DHW. The analysis of the results highlighted that the heating component decreased by 11.42% (168 MWh), the cooling by 11.55% (15 MWh), and the lighting by 16.6% following the implementation of measures W1 and W2. The annual energy savings amounted to 183 MWh (8.33%) with measure W1 and 266 MWh (12.14%) with measure W2.
Figure 31 and Figure 32 better illustrate the differences between the three cases: W0 (without energy efficiency measures) and W1 and W2 (with energy efficiency measures).
The results have been compared to those obtained from other energy management systems used in various higher education institutions worldwide, as shown in Table 7.
Regarding the first measure, the climate and the average annual temperature of the locations have been additionally introduced in the comparison to highlight that the measure implemented did not influence the energy saving expressed in [%]. For all locations, the same window type, with low-emissivity glass (low-E glass), has been used.
The second measure implemented shows different results, starting from the same baseline with the replaced lighting tubes: 16.7% versus 29.5% [46] and 25% [47]. This variation arises from factors such as the number of light tubes replaced, room types (seminar, laboratory, offices, storage, and hallways), working hours, and workdays, which were not specified precisely but were identified as relevant in the studies. On the other hand, the replaced lighting technology in the analyzed case studies included, in addition to fluorescent tubes, incandescent lamps, which have lower energy efficiency.
The third measure is the most effective way to reduce energy consumption. A project has been completed that involved installing a photovoltaic power plant near the building, featuring nine modules arranged in three rows. Each module has four polycrystalline panels, each with 60 cells. With a rated power of 1 W per panel, each module achieves a total of 1 kW. This solution can currently supply the building and can be integrated into our platform. This measure will support the goal of creating a zero-electric-energy building.

6. Discussion

At the application level in real environments, it remains essential to evaluate how SBEMS incorporating SBA technology performs. This technology is set for rapid expansion due to its numerous advantages, including enhanced energy efficiency, improved occupant comfort, and increased productivity. As a result, the increasing emphasis on sustainability and energy conservation will encourage broader adoption of SBA technology. By integrating IP-based communications, IoT sensors, data security, analytics, simulation tools, and recommended actions, new opportunities will emerge for developing building automation systems across commercial, residential, and industrial sectors soon.
BENEFIT has been developed to overcome the limitations found in other platforms, such as [16] and [17], related to the following: (i) The pre-defined control strategy, which is linked to a system following a fixed energy management plan. This means the system cannot adapt to environmental changes, such as weather or occupancy levels. Additionally, other customers with high energy demands are often managed solely according to rigid schedules. (ii) The lack of coordination between different energy sources within a building, such as electricity generation and energy consumption. These have been treated as separate entities and lack proper integration. (iii) The central control system cannot efficiently manage the various resources used in a building without strategies to enhance energy efficiency.
In this context, once BENEFIT architecture has been designed, the optimal placement of nodes has been prioritized to ensure seamless connectivity among devices, prevent congestion, and enable quick link restoration. To facilitate efficient information flow, the platform included functions for monitoring node status. Moreover, BENEFIT also addressed data security issues by defending against cyber threats, managing actions, and regulating user access levels to protect data. The main strengths of the BENEFIT platform are related to the following:
  • The multimodal user interface allows users to set their energy schedules and receive notifications, thereby enhancing energy efficiency. The integrated smart BMES identifies the most energy-efficient actions to maintain a comfortable environment within the building. Some of these actions will require user approval, such as delaying the operation of a programmable device for a specified period. Users can also specify their personal comfort preferences, such as preferred room temperatures. All these interactions involve building occupants. The management system provides various cooperation and awareness services through a multimodal interface, accessible via operating systems and mobile devices.
  • The forecast tool can utilize data related to renewable energy production units, including solar collectors, photovoltaic panels, and wind turbines. It provides accurate information on key influencing variables, such as temperature and the static properties of the building envelope, which are critical for calculating heat transfer through walls. This enables the estimation of the heat that needs to be generated or removed by the air conditioning system. Additionally, the smart BMES features a real-time consumption management algorithm that ensures optimal actions are taken to meet the needs of users within the building. The algorithm, which depends on performance indicators, plans the operation of controllable energy units like heat, electricity, or both, as well as storage systems. It also determines the electricity to purchase from the energy supplier and manages load flexibility. Inputs include projected energy requirements, expected consumption, and their related flexibility. The schedule is adjusted dynamically in real time to match actual energy demand and the generation and storage units. Various strategic algorithms are integrated to achieve different objectives by adjusting resource control and consumption patterns, optimizing overall resource usage.

7. Conclusions

In this paper, an energy management platform, called BENEFIT, has been designed, developed, implemented, and tested to demonstrate the SBEMS concept. Its goal is to optimize energy consumption customized for each building. The platform features an open-source architecture, facilitating rapid development of comprehensive solutions that cover all elements of the SBEMS concept. This design supports the management of various devices within the SBEMS, such as energy generation units, indoor lighting, environmental sensors, surveillance cameras, and more.
Its functionality has been demonstrated by implementing it in the building of the Faculty of Electrical Engineering at the “Gheorghe Asachi” Technical University of Iasi, Romania. The results, associated with a year, have been shared across days and months. Consequently, the daily, monthly, and yearly energy consumptions, heat gains, and temperature variations have been obtained. After one year of integrating the BENEFIT platform, the analysis led to a plan focused on reducing energy consumption and improving building performance. The first step involved upgrading window insulation by replacing existing windows, and the second aimed to improve lighting efficiency using LED tubes. The estimated results, based on the data collected so far and simulations performed with DesignBuilder software, indicated a 12.14% reduction in total energy consumption.
Future work will involve testing the platform in the context of integrating renewable energy systems, such as photovoltaic panels, to create a net-zero energy building. This testing will be conducted within the currently analyzed building, as long as a project involving a photovoltaic power plant is nearby, featuring nine modules arranged in three rows with a total installed power of 9 kWp. Thus, it will demonstrate the zero-electric-energy building concept.

Author Contributions

Conceptualization, R.-C.C., G.G. and M.A.; methodology, R.-C.C., C.M.S. and G.G.; software, R.-C.C., R.-P.L. and M.A.; validation, R.-C.C., C.M.S., M.A. and G.G.; formal analysis, G.G. and M.A.; investigation, R.-C.C., M.A., R.-P.L. and G.G.; resources, R.-C.C., C.M.S.; data curation, R.-C.C., M.A.; writing—original draft preparation, R.-C.C. and G.G.; writing—review and editing, R.-C.C. and C.M.S. and G.G.; visualization, G.G.; supervision, R.-C.C.; project administration, M.A. All authors have read and agreed to the published version of the manuscript.

Funding

This research was funded by the “NEEDS Repowered Project”, financed under the Driving Urban Transitions Partnership, which has been co-funded by the European Commission. Energies 18 04542 i001

Data Availability Statement

The original contributions presented in this study are included in the article. Further inquiries can be directed to the corresponding author.

Conflicts of Interest

The authors declare no conflict of interest.

Abbreviations

The following abbreviations are used in this manuscript:
BENEFITBuilding Energy Efficiency in Totality
SBEMSmart Building Energy Management
EUEuropean Union
ECEuropean Commission
GHGGreenhouse Gas
WSNWireless Sensor Network
AMIAdvanced Metering Infrastructure
IAArtificial Intelligence
MLMachine Learning
DTDigital Twins
IoTInternet of Things
CPSCyber-Physical Systems
ECCEdge and Cloud Computing
BIMBuilding Information Modeling
SBASmart Building Automation
HVACHeating, Ventilation, and Air Conditioning
DMDecision-Maker
RTURemote Terminal Units
DCData Concentrator
LSTMLong Short-Term Memory
RNNRecurrent Neural Network
GPRGaussian Process Regression
ANNArtificial Neural Network
DMDDynamic Mode Decomposition
RESRenewable Energy Sources
HEMSHome Energy Management System
PVPhotovoltaic
KPIKey Performance Indicator
DMSDemand-Side Management
PLCProgrammable Logic Controller
PACProgrammable Automation Controller
EMSEnergy Management System
OMTObject Modeling Technique
6LowPANIPv6 over Low-Power Wireless Personal Area Networks
RDAURemote Data Acquisition Units

References

  1. Dwivedi, Y.K.; Hughes, L.; Kar, A.K.; Baabdullah, A.M.; Grover, P.; Abbas, R.; Andreini, D.; Abumoghli, I.; Barlette, Y.; Bunker, D.; et al. Climate Change and COP26: Are Digital Technologies and Information Management Part of the Problem or the Solution? An Editorial Reflection and Call to Action. Int. J. Inf. Manag. 2022, 63, 102456. [Google Scholar] [CrossRef]
  2. Wang, Y. Exploring the Importance of Sustainability in the Construction Industry. Appl. Comput. Eng. 2023, 9, 312–318. [Google Scholar] [CrossRef]
  3. Firoozi, A.A.; Oyejobi, D.O.; Firoozi, A.A. Innovations in Energy-Efficient Construction: Pioneering Sustainable Building Practices. Clean. Eng. Technol. 2025, 26, 100957. [Google Scholar] [CrossRef]
  4. European Commission. Energy Performance of Buildings Directive. Available online: https://energy.ec.europa.eu/topics/energy-efficiency/energy-performance-buildings/energy-performance-buildings-directive_en (accessed on 17 July 2025).
  5. Delavar, T.; Borgentorp, E.; Junnila, S. The Smart Buildings Revolution: A Comprehensive Review of the Smart Readiness Indicator Literature. Appl. Sci. 2025, 15, 1808. [Google Scholar] [CrossRef]
  6. European Union. Directive 2010/31/EU of the European Parliament and the Council on the Energy Performance of Buildings. Available online: https://eur-lex.europa.eu/eli/dir/2010/31/oj/eng (accessed on 17 July 2025).
  7. European Union. Directive 2009/28/EC of the European Parliament and the Council on the Promotion of the Use of Energy from Renewable Sources and Amending and Subsequently Repealing Directives 2001/77/EC and 2003/30/EC. Available online: https://eur-lex.europa.eu/legal-content/EN/ALL/?uri=celex:32009L0028 (accessed on 17 July 2025).
  8. European Union. Directive 2012/27/EU of the European Parliament and the Council on Energy Efficiency, Amending Directives 2009/125/EC and 2010/30/EU and Repealing Directives 2004/8/EC and 2006/32/EC. Available online: https://eur-lex.europa.eu/eli/dir/2012/27/oj/eng (accessed on 17 July 2025).
  9. European Union. Directive 2023/1791 of the European Parliament and the Council on Energy Efficiency and Amending Regulation (EU) 2023/955. Available online: https://eur-lex.europa.eu/eli/dir/2023/1791/oj/eng (accessed on 17 July 2025).
  10. European Commission. The European Green Deal: Striving to Be the First Climate-Neutral Continent. Available online: https://commission.europa.eu/strategy-and-policy/priorities-2019-2024/european-green-deal_en (accessed on 17 July 2025).
  11. European Commission. REPowerEU: Affordable, Secure and Sustainable Energy for Europe. Available online: https://commission.europa.eu/topics/energy/repowereu_en (accessed on 17 July 2025).
  12. Resch, G.; Liebmann, L.; Geipel, J.; Hasengst, F.; Hendricks, D.; Vollmer, J.; Fouquet, D. Study on 2030 Renewable Energy and Energy Efficiency Targets in the European Union. Available online: https://www.bmwet.gv.at/dam/jcr:dcd262d6-9673-4d26-8131-c961a0b17e6a/Final-Report_Study-on-2030-RES-Energy-Efficiency-Targets_FINAL.pdf (accessed on 17 July 2025).
  13. Palley, B.; Poças, M.J.; Bernardo, H.; Rossetti, R. Integrating Machine Learning and Digital Twins for Enhanced Smart Building Operation and Energy Management: A Systematic Review. Urban Sci. 2025, 9, 202. [Google Scholar] [CrossRef]
  14. Billanes, J.D.; Ma, Z.G.; Jørgensen, B.N. Data-Driven Technologies for Energy Optimization in Smart Buildings: A Scoping Review. Energies 2025, 18, 290. [Google Scholar] [CrossRef]
  15. Building Automation System Industry. Available online: https://www.marketsandmarkets.com/PressReleases/building-automation.asp (accessed on 17 July 2025).
  16. Suciu, G.; Uşurelu, T.; Jiménez, C. Smart Energy Tools for Buildings Energy Management. In Proceedings of the 2019 IEEE PES Innovative Smart Grid Technologies Europe (ISGT-Europe), Bucharest, Romania, 29 September–2 October 2019. [Google Scholar]
  17. Hakawati, B.; Mousa, A.; Draidi, F. Smart Energy Management in Residential Buildings: The Impact of Knowledge and Behavior. Sci. Rep. 2024, 14, 1702. [Google Scholar] [CrossRef]
  18. Grigoraș, G.; Neagu, B.-C. An Advanced Decision Support Platform in Energy Management to Increase Energy Efficiency for Small and Medium Enterprises. Appl. Sci. 2020, 10, 3505. [Google Scholar] [CrossRef]
  19. Selvaraj, R.; Kuthadi, V.M.; Baskar, S. Smart Building Energy Management and Monitoring System Based on Artificial Intelligence in Smart City. Sustain. Energy Technol. Assess. 2023, 56, 103090. [Google Scholar] [CrossRef]
  20. Chatzikonstantinidis, K.; Afxentiou, N.; Giama, E.; Fokaides, P.A.; Papadopoulos, A.M. Energy Management of Smart Buildings During Crises and Digital Twins as an Optimisation Tool for Sustainable Urban Environment. Int. J. Sustain. Energy 2025, 44, 2455134. [Google Scholar] [CrossRef]
  21. Ebeed, M.; Hassan, S.; Kamel, S.; Nasrat, L.; Mohamed, A.W.; Youssef, A.R. Smart Building Energy Management with Renewables and Storage Systems Using a Modified Weighted Mean of Vectors Algorithm. Sci. Rep. 2025, 15, 4733. [Google Scholar] [CrossRef]
  22. Swetha, R.R.; Balamurthi, B.; Latha, R.; Golla, S.; Tilak Babu, S.B.G.; Krishna, R.V.V. Smart Energy Management in Buildings with Machine Learning Techniques. In Proceedings of the 2024 International Conference on Innovative Computing, Intelligent Communication and Smart Electrical Systems (ICSES), Chennai, India, 12–13 December 2024. [Google Scholar]
  23. Shukla, S.; Jayashree Nivedhitha, V.; Shankar, A.; Tejaswi, P.; Gnana Swathika, O.V. Energy Management System for Smart Buildings. In Integrated Green Energy Solutions; Dangate, M.S., Sampath, W.S., Swathika, O.V.G., Sanjeevikumar, P., Eds.; Wiley Press: Hoboken, NJ, USA, 2023; Volume 1, pp. 327–347. [Google Scholar]
  24. Zhu, Y. Application of Smart Energy Management Systems in Green Buildings. Highlights Sci. Eng. Technol. 2024, 95, 16–22. [Google Scholar] [CrossRef]
  25. Revati, G.; Hozefa, J.; Shadab, S.; Sheikh, A.; Wagh, S.R.; Singh, N.M. Smart Building Energy Management: Load Profile Prediction Using Machine Learning. In Proceedings of the 29th Mediterranean Conference on Control and Automation (MED), Puglia, Italy, 22–25 June 2021. [Google Scholar]
  26. Berbakov, L.; Batić, M.; Tomašević, N. Smart Energy Manager for Energy Efficient Buildings. In Proceedings of the IEEE EUROCON 2019—18th International Conference on Smart Technologies, Novi Sad, Serbia, 1–4 July 2019. [Google Scholar]
  27. Khezzane, K.; Doumbia, M.L.; Khoucha, F. Smart Buildings Energy Management Strategy Based on Consumer Budget: Experimental Implementation Perspective. In Proceedings of the Second International Conference on Sustainable Mobility Applications, Renewables and Technology (SMART), Cassino, Italy, 23–25 November 2022. [Google Scholar]
  28. Saluja, S.; Prochnow, C.; Couper, G.; Zivko, F.; Yu, X.; Gromov, M. Smart Multi-Building Energy Monitoring System. In Proceedings of the IEEE International Conference on Electro Information Technology (eIT), Eau Claire, WI, USA, 30 May 2024–1 June 2024. [Google Scholar]
  29. Einaggar, K.; Maher, R.; El-Zonkoly, A.; Amer, M. Modern Building Energy Management System Based on Artificial Intelligence. In Proceedings of the 15th International Renewable Energy Congress (IREC), Hammamet, Tunisia, 2–4 February 2025. [Google Scholar]
  30. Condon, F.; Martínez, J.M.; Eltamaly, A.M.; Kim, Y.C.; Ahmed, M.A. Design and Implementation of a Cloud-IoT-Based Home Energy Management System. Sensors 2022, 23, 176. [Google Scholar] [CrossRef] [PubMed]
  31. Khan, M.H.; Asar, A.U.; Ullah, N.; Albogamy, F.R.; Rafique, M.K. Modeling and Optimization of Smart Building Energy Management System Considering Both Electrical and Thermal Load. Energies 2022, 15, 574. [Google Scholar] [CrossRef]
  32. Piras, G.; Agostinelli, S.; Muzi, F. Smart Buildings and Digital Twin to Monitoring the Efficiency and Wellness of Working Environments: A Case Study on IoT Integration and Data-Driven Management. Appl. Sci. 2025, 15, 4939. [Google Scholar] [CrossRef]
  33. Saeed, M.A.; Eladl, A.A.; Alhasnawi, B.N.; Motahhir, S.; Nayyar, A.; Shah, M.A.; Sedhom, B.E. Energy Management System in Smart Buildings Based Coalition Game Theory with Fog Platform and Smart Meter Infrastructure. Sci. Rep. 2023, 13, 2023. [Google Scholar] [CrossRef]
  34. Mir, U.; Abbasi, U.; Mir, T.; Kanwal, S.; Alamri, S. Energy Management in Smart Buildings and Homes: Current Approaches, a Hypothetical Solution, and Open Issues and Challenges. IEEE Access 2021, 9, 94132–94148. [Google Scholar] [CrossRef]
  35. Parvin, K.; Hossain Lipu, M.S.; Hannan, M.A.; Abdullah, M.A.; Pin Jern, K.; Begumet, R.A. Intelligent Controllers and Optimization Algorithms for Building Energy Management Towards Achieving Sustainable Development: Challenges and Prospects. IEEE Access 2021, 9, 41577–41602. [Google Scholar] [CrossRef]
  36. Machine Design, What’s the Difference Between a PLC and PAC? Available online: https://www.machinedesign.com/mechanical-motion-systems/article/21835777/whats-the-difference-between-a-plc-and-pac (accessed on 17 June 2025).
  37. Al-Ghaili, A.M.; Kasim, H. Functions-focused Building Energy Management Systems: A Review. In Proceedings of the 8th International Conference on Information Technology and Multimedia (ICIMU), Selangor, Malaysia, 24–26 August 2020. [Google Scholar]
  38. Kozlovska, M.; Petkanic, S.; Vranay, F.; Vranay, D. Enhancing Energy Efficiency and Building Performance through BEMS-BIM Integration. Energies 2023, 16, 6327. [Google Scholar] [CrossRef]
  39. Ursu, I. Contributions on Smart Monitoring of Energy Consumption. Ph.D. Thesis, Gheorghe Asachi Technical University of Iasi, Iasi, Romania, 2022. [Google Scholar]
  40. Grigoraș, G. Impact of Smart Meter Implementation on Saving Electricity in Distribution Networks in Romania. In Application of Smart Grid Technologies; Lamont, L.A., Sayigh, A., Eds.; Academic Press: Oxford, UK, 2018. [Google Scholar]
  41. Meteobule, Simulated Historical Climate and Weather Data for Iasi. Available online: https://www.meteoblue.com/ro/vreme/historyclimate/climatemodelled/ia%C8%99i_rom%C3%A2nia_675810 (accessed on 17 July 2025).
  42. Siemens, SENTRON Power Monitoring Device PAC3200. Available online: https://support.industry.siemens.com/cs/document/26504150/manual-sentron-power-monitoring-device-pac3200?dti=0&lc=en-RO (accessed on 17 August 2025).
  43. Data Science Discovery, Quartiles and Box Plots. Available online: https://discovery.cs.illinois.edu/learn/Exploratory-Data-Analysis/Quartiles-and-Box-Plots/ (accessed on 17 August 2025).
  44. Sai, L.; Ghazali, F.M.; Yang, J.; Guo, Z.; Zeng, K.; Chen, Y. Retrofit Analysis of Exterior Windows for Large Office Buildings in Different Climate Zones of China. Buildings 2024, 14, 3904. [Google Scholar] [CrossRef]
  45. Irulegi, O.; Ruiz-Pardo, A.; Serra, A.; Salmerón, J.M.; Vega, R. Retrofit Strategies Towards Net Zero Energy Educational Buildings: A Case Study at the University of the Basque Country. Energy Build. 2017, 144, 387–400. [Google Scholar] [CrossRef]
  46. Laser, A Switch to LED Lighting Saw Cranfield University See an Average of 29.5% in Energy Saving. Available online: https://www.laserenergy.org.uk/case-studies/a-switch-to-led-lighting-saw-cranfield-university-see-an-average-of-29-5-in-energy-saving/ (accessed on 17 August 2025).
  47. Ali, M.Y.; Khan, I.; Hassan, M. Lighting—The Way to Reducing Electrical Energy Demand in University Buildings in Bangladesh. Facta Univ. 2022, 35, 333–348. [Google Scholar] [CrossRef]
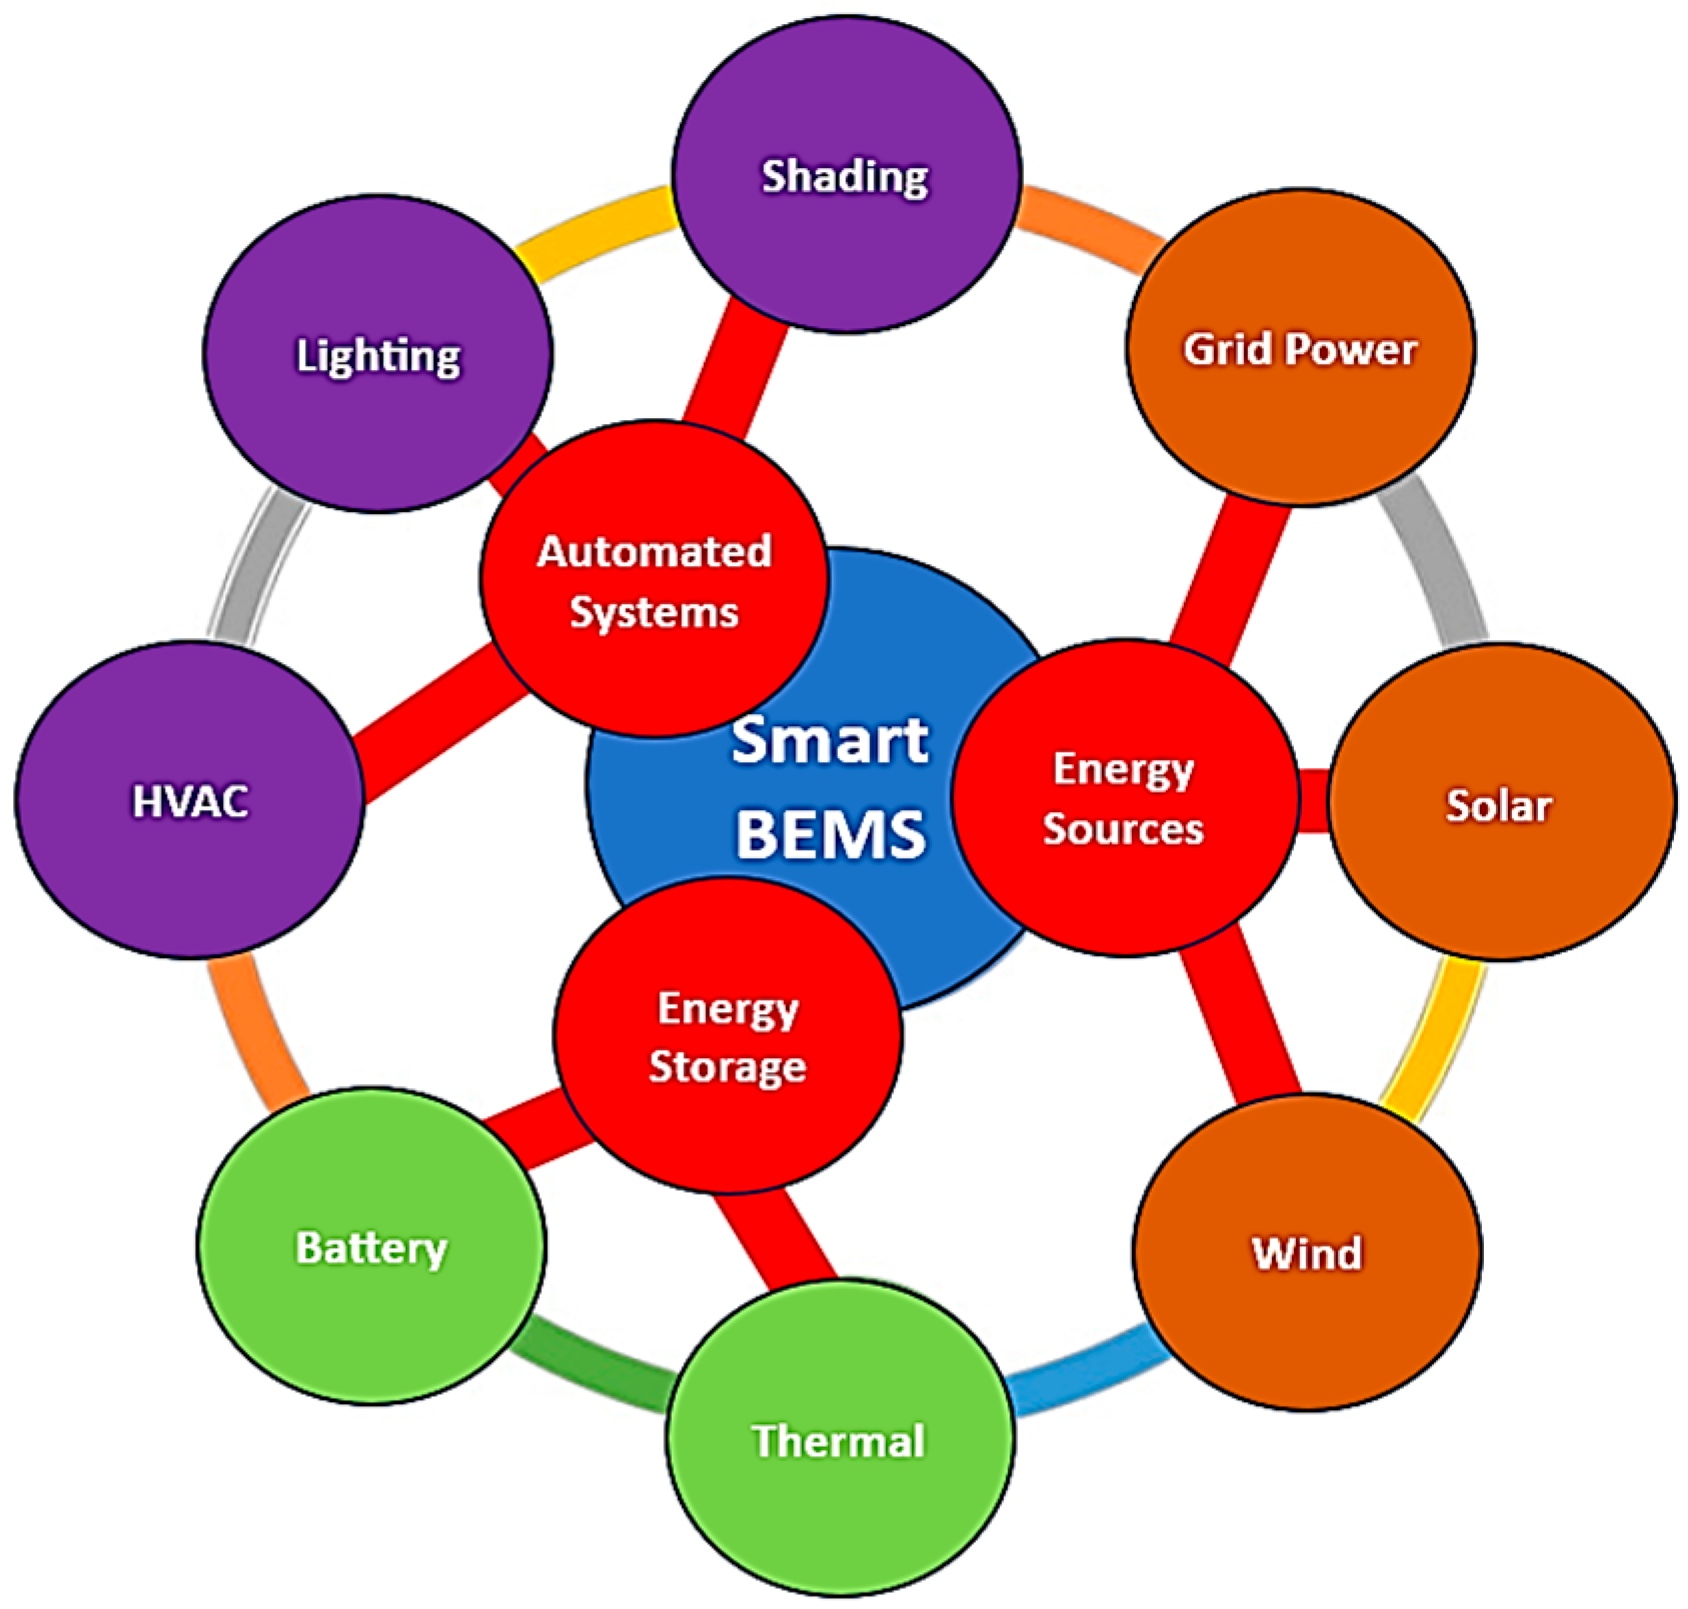
Figure 1. A simplified structure associated with a BEMS.
Energies 18 04542 g001
Figure 2. Differences between traditional PLC systems and various platforms that support PACs.
Energies 18 04542 g002
Figure 3. The main functions of an SBEMS.
Energies 18 04542 g003
Figure 4. The simplified architecture of the BENEFIT platform.
Energies 18 04542 g004
Figure 5. The multilayer structure of BENEFIT platform.
Energies 18 04542 g005
Figure 6. The architecture of the data collection system.
Energies 18 04542 g006
Figure 7. General KPIs derived from the report of BENEFIT.
Energies 18 04542 g007
Figure 8. General KPIs derived from the report of BENEFIT.
Energies 18 04542 g008
Figure 9. List of the sections with the implemented functions in the Smart User Interface Hub (SUI-HUB) menu of the BENEFIT platform.
Energies 18 04542 g009
Figure 10. Introduction of a device in the BENEFIT platform.
Energies 18 04542 g010
Figure 11. Introduction of a device in the BENEFIT platform.
Energies 18 04542 g011
Figure 12. Select a file with recorded data in *.csv format.
Energies 18 04542 g012
Figure 13. The visualization of the data from a voltage sensor of a device integrated in the BENEFIT platform.
Energies 18 04542 g013
Figure 14. Notifications, variables, and conditions setup section of the BENEFIT platform.
Energies 18 04542 g014
Figure 15. Geographical location of the studied building (a) and the Iasi area (b).
Energies 18 04542 g015
Figure 16. The specific weather data in Iasi: (a) temperature and precipitation; (b) cloud, sunshine, and precipitation days; (c) maximum temperature data shared by days; (d) wind speed data shared by days; (e) solar radiance.
Energies 18 04542 g016aEnergies 18 04542 g016b
Figure 17. The 3D representation of the building obtained with DesignBuilder: (a) front view and (b) back view.
Energies 18 04542 g017
Figure 18. SENTRON PAC3200 electricity monitoring device: (a) front view and (b) back view.
Energies 18 04542 g018
Figure 19. Davis Vantage Pro2 weather station.
Energies 18 04542 g019
Figure 20. The building’s daily energy consumption shared across lighting, heating, cooling, and DHW during a year, in [kW].
Energies 18 04542 g020
Figure 21. The temperature values inside and outside the building, during a year, in [°C].
Energies 18 04542 g021
Figure 22. The daily heat balance at the building’s level, during a year, in [kW].
Energies 18 04542 g022
Figure 23. The building’s monthly energy consumption shared across lighting, heating, cooling, and DHW during a year, in [MWh].
Energies 18 04542 g023
Figure 24. The average temperature values inside and outside the building in each month of the year, in [°C].
Energies 18 04542 g024
Figure 25. The monthly heat balance at the building’s level during a year, in [MWh].
Energies 18 04542 g025
Figure 26. The building’s yearly energy consumption shared across lighting, heating, cooling, and DHW, in [GWh].
Energies 18 04542 g026
Figure 27. The average yearly temperature value inside and outside the building, in [°C].
Energies 18 04542 g027
Figure 28. The yearly heat balance at the building’s level, in [MWh].
Energies 18 04542 g028
Figure 29. The box plot of the heating consumption, in [kW].
Energies 18 04542 g029
Figure 30. The box plot of the cooling consumption, in [kW].
Energies 18 04542 g030
Figure 31. Comparison between the monthly energy consumptions without (base) and with energy efficiency measures (W1 and W2).
Energies 18 04542 g031
Figure 32. Comparison between the yearly energy consumptions (without (W0) and with energy efficiency measures (W1 and W2), expressed in [MWh]) and the energy savings (expressed in [MWh] and [%]).
Energies 18 04542 g032
Table 1. The synthesis of the state-of-the-art references, including the significant characteristics associated with a SBEMS.
Ref./
Year
Study/TasksSensorsSmart Meter InfrastructureData
Security
Analytics
Techniques
Additional Simulation ToolEnergy Efficiency
Actions Based on KPIs
Buildings’ Type
[16]/
2019
Research/Data analysis and monitoringIoTNoNoYesGrafanaNoAll
[17]/
2024
Research/Data analysis IoTNoNoYesSmart PLSNoResidential
[18]/
2021
Research/Data analysis and monitoringNoNoNoYesNoYesIndustrial
[19]/
2023
Research/Data analysis and monitoringClassicalNoNoYesNoNoResidential
[20]/
2025
Research/Data analysis and monitoringIoTNoNoYesNoNoResidential
[21]/
2025
Research/Data analysis and monitoringClassicalYesNoYesNoNoResidential
[22]/
2024
Research/
Data analysis
IoTNoNoYesNoNoResidential
[23]/
2023
Research/
Data analysis
NoYesNoYesNoNoResidential
[24]/
2024
Review/Data analysis ClassicalYesNoNoNoNoAll
[25]/
2021
Research/Data analysis ClassicalNoNoYesNoNoCommercial
[26]/
2019
Research/Data analysis and monitoringIoTYesNoYesNoNoAll
[27]/
2022
Research/Data monitoring and analysisClassicalYesNoYesNoNoResidential
[28]/
2024
Research/Data monitoringIoTNoYesYesNoNoResidential
[29]/
2025
Research/Data analysis and monitoringNoYesNoYesNoNoAll
[30]/
2022
Research/Data monitoring and analysisYesYesNoNoNoNoResidential
[31]/
2022
Research/Data analysis and monitoringNoYesNoYesNoNoResidential
[32]/
2025
Research/Data analysis and monitoringYesYesNoYesNoYesAll
[33]/
2023
Research/Data analysis and monitoringClassicalYesNoYesNoNoAll
OurData analysis, monitoring, simulation, and proposal actionsYesYesYesYesYesYesAll
Table 2. Thermo-physical characteristics of the building.
Nr. Crt.ParameterValue
1Area of ground floor/Level 0, [m2]2010
2Area of the first floor/Level 1, [m2]2110
3Area of the second floor/Level 2, [m2]1720
4Area of the third floor/Level 3, [m2]830
5Area of the fourth floor/Level 4, [m2]830
6Area of the fifth floor/Level 5, [m2]540
7Total floor area, [m2]8040
8Shared area, [m2]8040
9Heat loss surface, [m2]8505
10Surface area of windows that can be opened, [m2]29.80
11Window/wall ratio, [%]28.00
12Roof area, [m2]2110
13Volume, [m3]29,440
14U-value of the ground floor, [W/m2K]2.06
15U-value of external facades, [W/m2K]1.71
16U-value of the roof, [W/m2K]2.05
17U-value of windows, [W/m2K]5.78
Table 3. The statistical parameters of the heating consumption, in [kW].
MonthQuartilesMeanStandard Deviation
Q0Q1Q2Q3Q4
January2927748311,32013,89217,17410,4204007
February43655811852711,21716,36888063292
March025455472756311,00051173009
April 081123003446498122121549
October0116026325525721431092352
November11365301768010,86013,14678443207
December16034816839211,24714,83482994013
Table 4. The statistical parameters of the cooling consumption, in [kW].
MonthQuartilesMeanStandard Deviation
Q0Q1Q2Q3Q4
May008419501274484152
June4579001349172821291334494
July7009721486184125011490578
August93613381580194124501626413
September201404590741966587233
Table 5. Monthly energy consumption and energy saving in the analyzed cases.
MonthECW0ECW1ECW2ΔECW1ΔECW2ΔECW1ΔECW2
[MWh][MWh][MWh][MWh][MWh][%][%]
January36033032230388.3310.56
February32030529715234.697.19
March245210202354314.2917.55
April 14013012210187.1412.86
May10093857157.5015.50
June686359597.4113.33
July585350588.7013.91
August535048354.769.52
September737064282.8711.15
October16015014110196.2511.88
November26023522725339.6212.69
December355317309384610.7012.96
Table 6. The yearly energy consumption components and energy savings in the analyzed cases.
CaseEnergy Consumption Components [MWh]Energy Saving
[%]
HeatingLightingCoolingDHWTotal
W014705001309021900.00
W113025001159020088.33
W2130241711590192412.14
Table 7. The comparison between the energy saving obtained through the adopted measures in various case studies associated with the higher education institutions, in [%].
Ref.Measure—Replacing Windows
LocationClimate/Average Annual TemperatureEnergy Savings
[43]Changsha Hunan University, ChinaHumid subtropical/17.8 °C10.9
[44]University of the Basque Country, SpainOceanic/15.2 °C11.0
BENEFITTechnical University of Iasi, RomaniaHumid continental/10.5 °C11.42
Measure—Using LED tubes
LocationReplaced Lighting TechnologyEnergy Savings
[45]Cranfield University, United KingdomIncandescent lamps/Fluorescent tubes29.5
[46]Jashore University of Science and Technology, Bangladesh Incandescent lamps/Fluorescent tubes25
BENEFITTechnical University of Iasi, RomaniaFluorescent tubes16.7
Disclaimer/Publisher’s Note: The statements, opinions and data contained in all publications are solely those of the individual author(s) and contributor(s) and not of MDPI and/or the editor(s). MDPI and/or the editor(s) disclaim responsibility for any injury to people or property resulting from any ideas, methods, instructions or products referred to in the content.