3.1. Pyrolysis Process
As it was initially commented, it is difficult to analyze and compare the pyrolysis processes conducted in semi-batch mode due to the need for parameter observation together with reaction time. The intrinsic dynamics of semi-batch pyrolysis means that an observed result has to take into consideration the reaction time where that event was observed. As an example, it can be considered the FFA content of the bio-oil (acid value) can be considered. While it is possible to obtain bio-oil with near zero acidity, this could be achieved only in later reaction stages, where most of the feed was already cracked and vaporized, meaning that overall acidity removal is low for the whole bio-oil. This was observed by Ferreira et al., who pyrolyzed waste animal fat in two-stage semi-batch catalytic cracking experiments and could obtain near-zero acidity bio-oil in the later stages of the reaction, where most of the feed already vaporized, presenting higher acidity and FFA content. Calculations revealed that the overall acid value of the pyrolysis oil was around 60 mg KOH/g of sample [
5]. This particularity needs to be considered in all evaluations of the influence of the process parameters in reaction products (yields and chemical composition), and this even changes how to interpret some defined aspects of pyrolysis in semi-batch mode. For instance, we can cite how temperature is connected to the extent of the reaction (as it will be detailed further) and the impossibility of effectively controlling residence time in semi-batch pyrolysis. Since vapors flow out of the reaction zone constantly, by removing the driving force behind the reaction (heat), the residence time is low for the formed vapors, and high residence times only for obtained bio-oil in later stages of the reaction, not all of the feed, are observed. For semi-batch mode, it is possible to increase the overall residence time for all of the feed when some form of reflux exists that is capable of recycling the undesired unconverted material back to the reaction zone or when a secondary cracking zone is included (vapor-phase cracking), as suggested by Chang and Wan [
14].
Even the analysis of product yields is further improved when considering reaction time. Lo and Tsai fractionated pyrolysis products of cottonseed oil pyrolysis according to reaction time and observed that most of the non-condensable gases are formed in the initial stages of the reaction. The gas fraction is rich in carbon dioxide, suggesting that decarboxylation and decarbonylation reactions occur at the beginning of the process [
14].
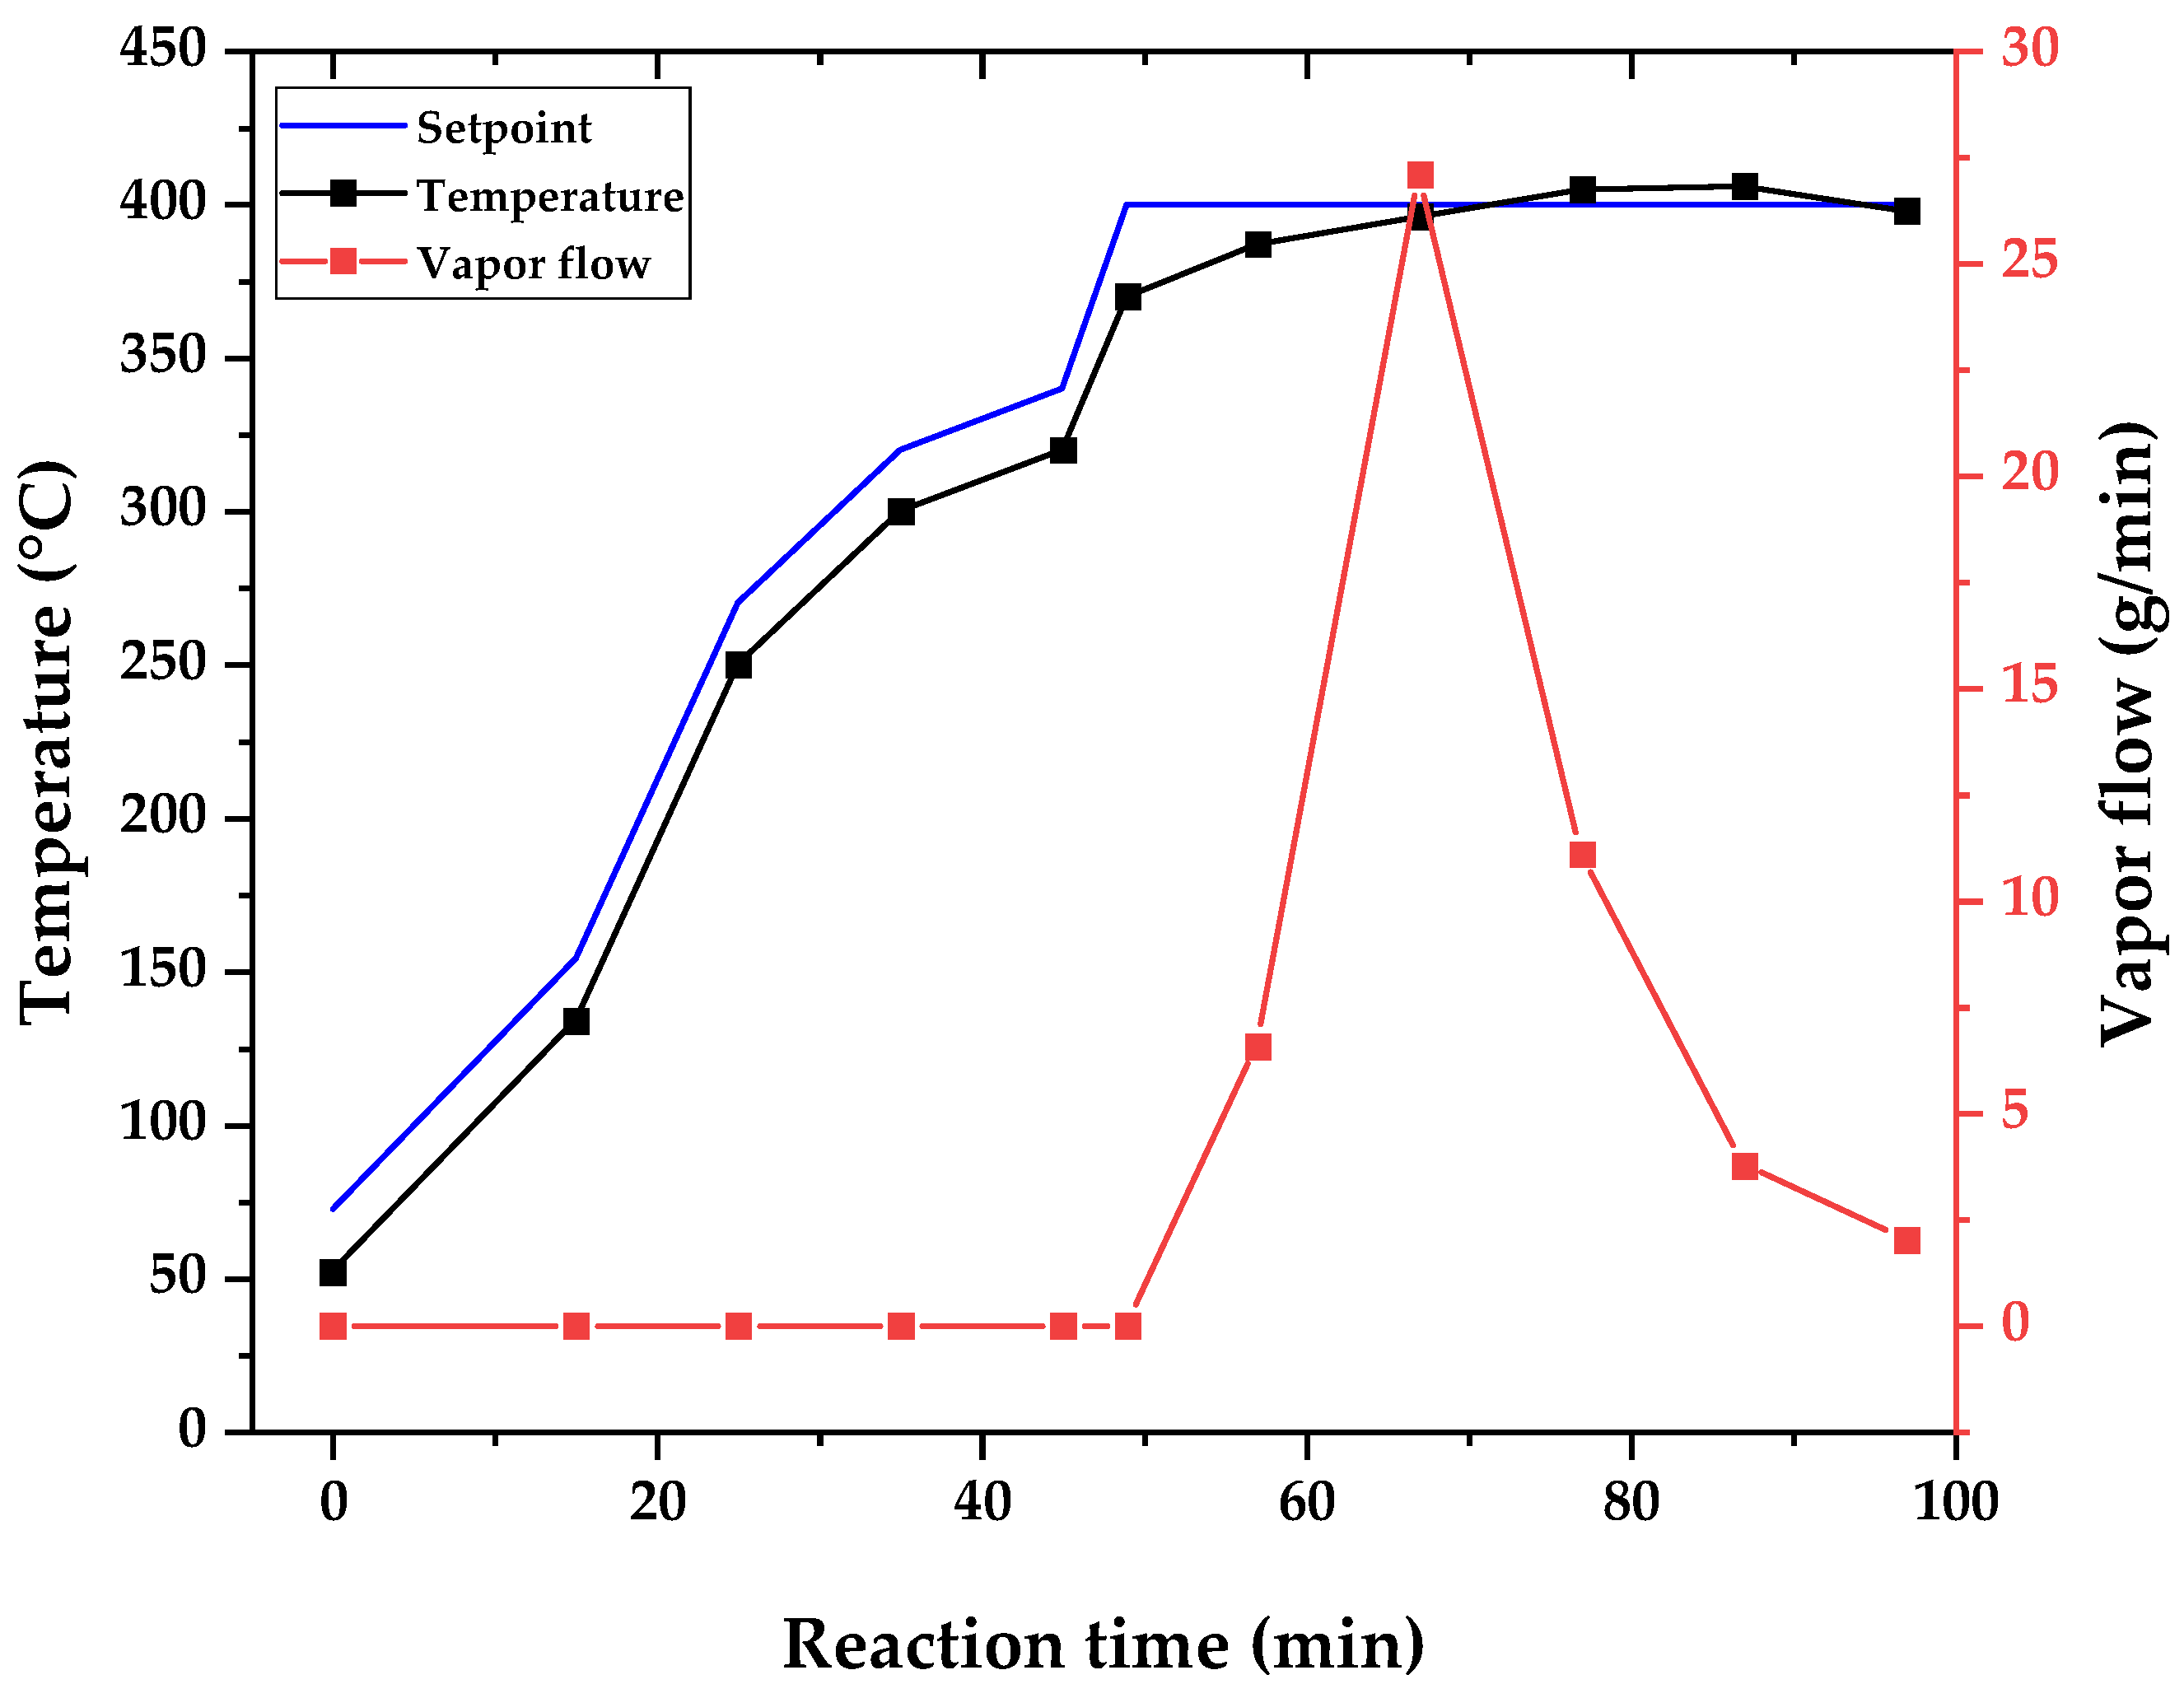
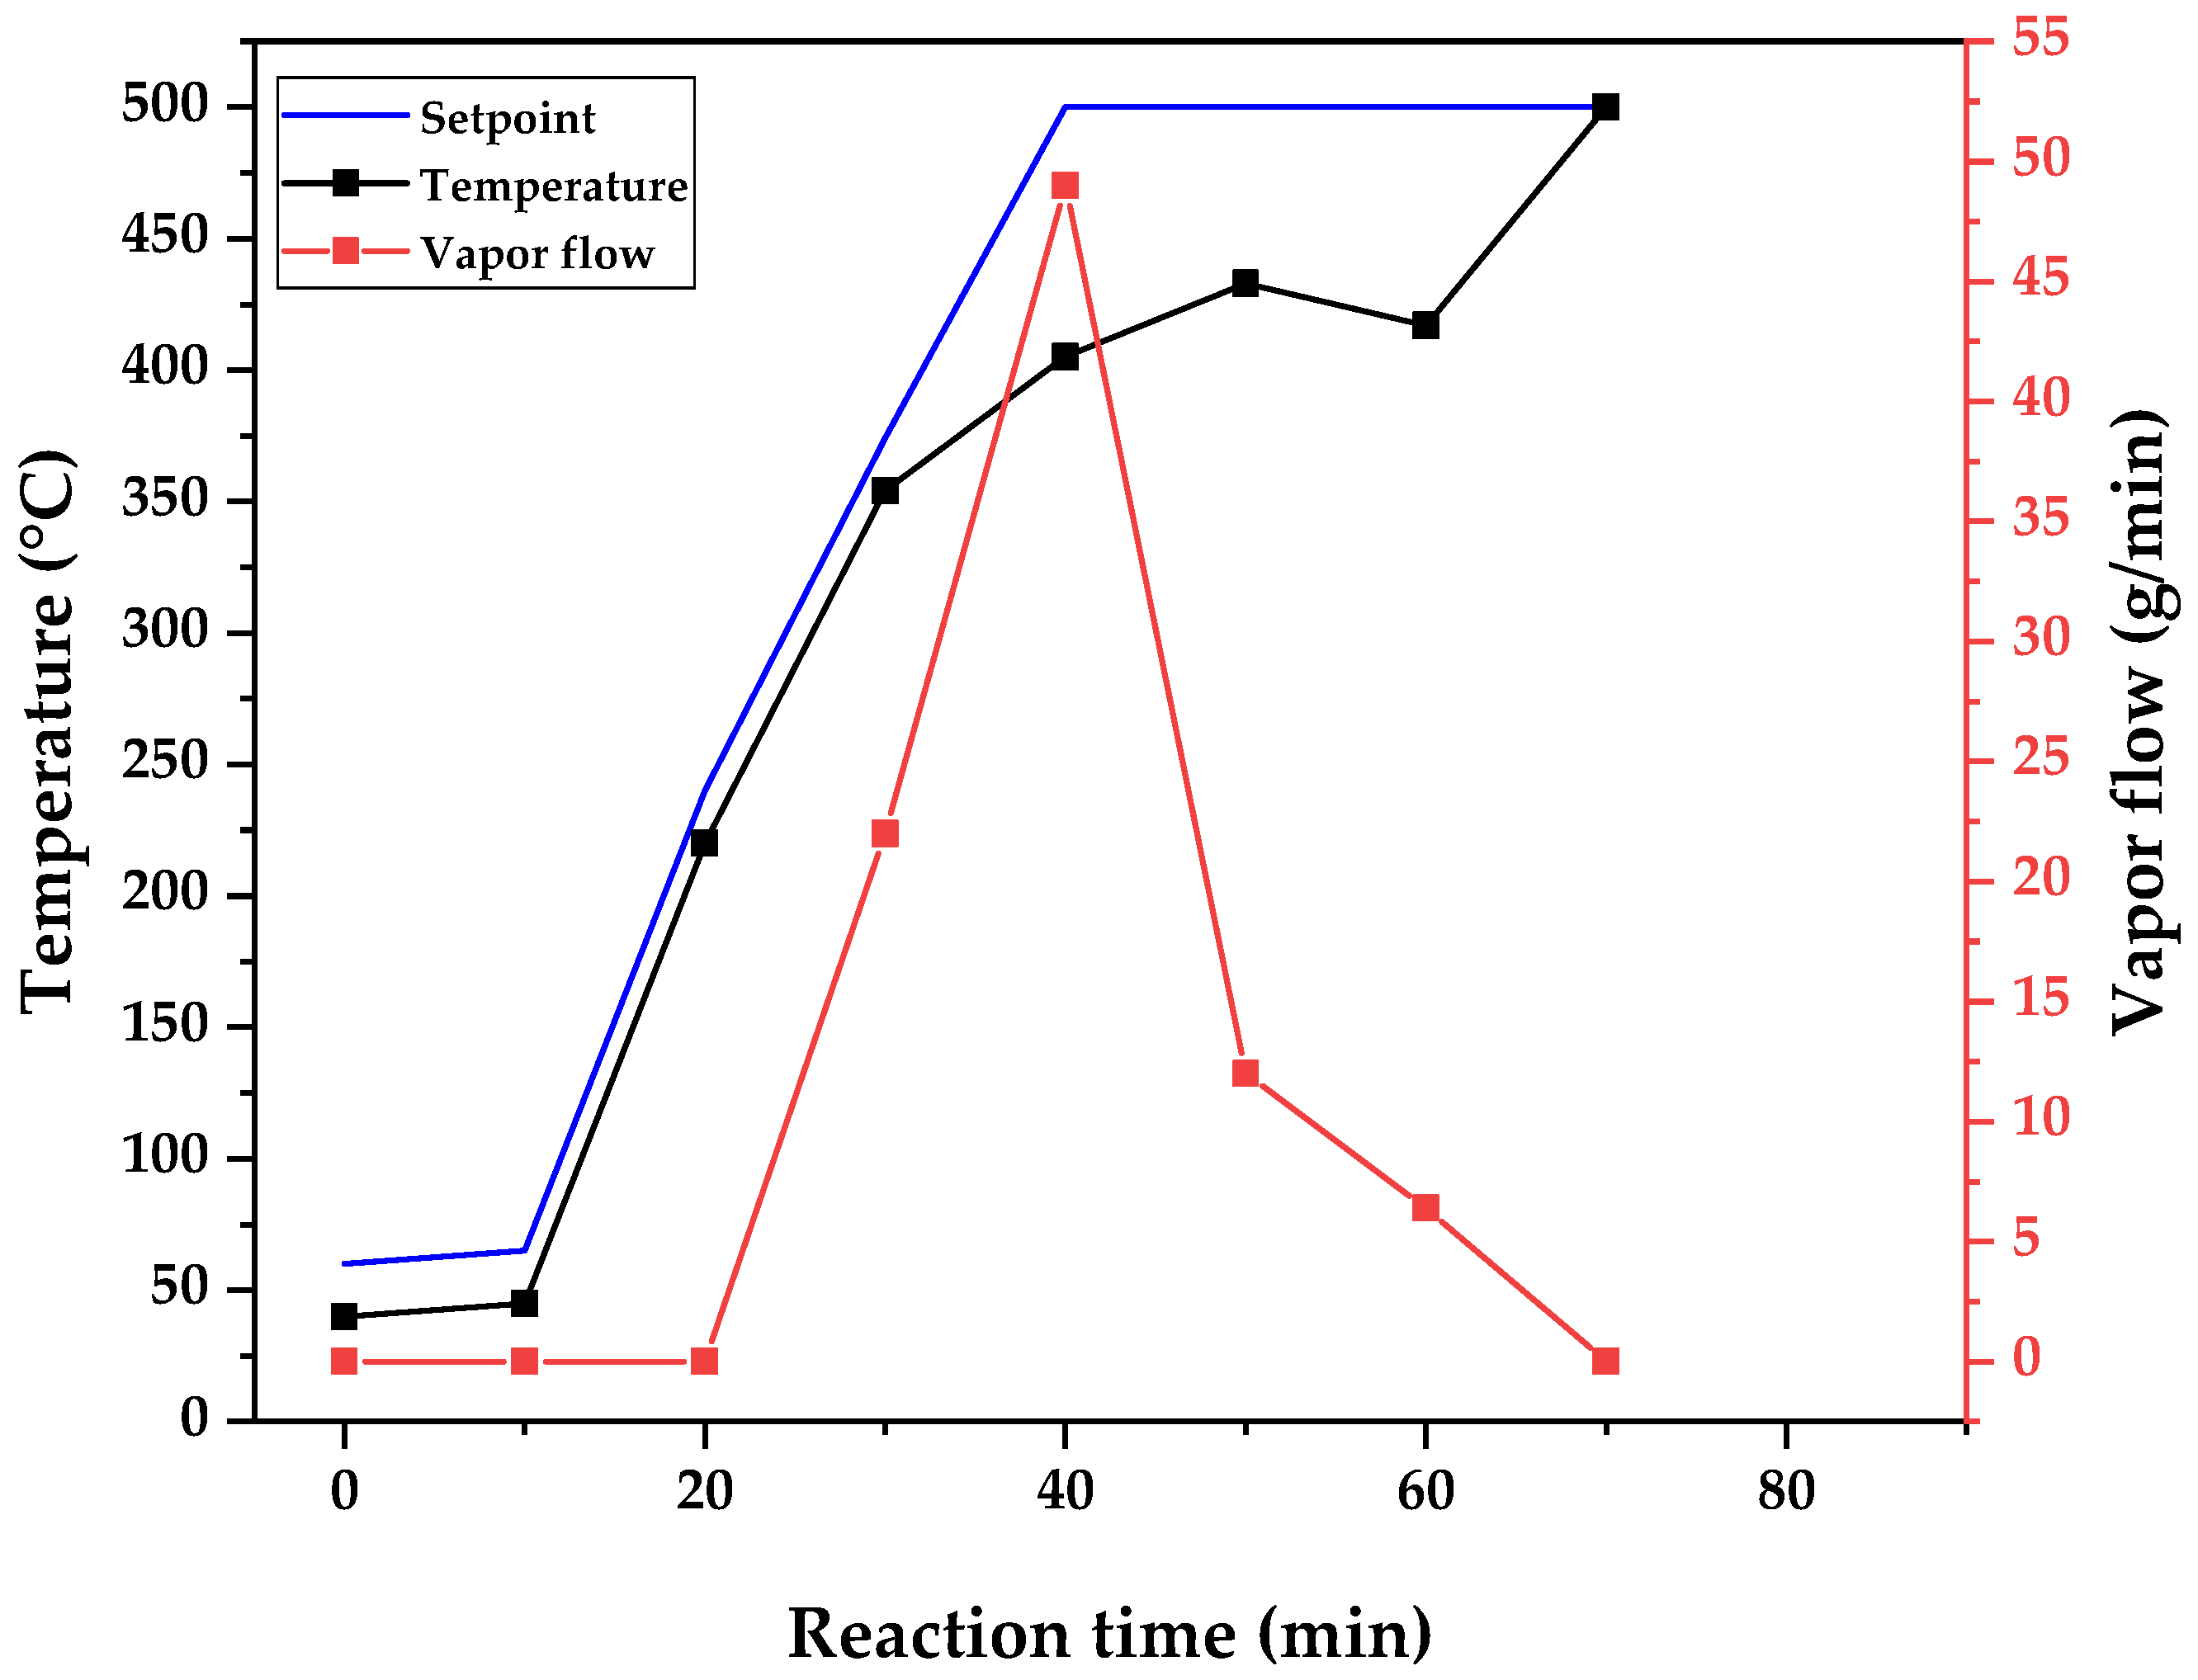
Table 7 and
Figure 7 present the obtained yield of reaction products (bio-oil, bio-char, and non-condensable gases) for the three different temperatures (400, 450, and 500 °C). Since it is not possible to measure the weight of feed at each sample collection, and the non-condensable gases yield is obtained by mass balance, the obtained weight of the liquid phase collected and the observed temperature of the reactor are presented for each experiment (400, 450, and 500 °C) versus reaction time in the graphs of
Figure 8,
Figure 9 and
Figure 10, respectively.
It can be observed that there are consistent data with other works concerning the pyrolysis of triglycerides and derivates, where bio-oil yields increase with higher temperatures [
16,
17,
18,
20,
21,
22]. As was mentioned, in semi-batch atmospheric pyrolysis with no inert gas flow, the heat applied (power) is the driving force behind the evolution of reaction and vaporization and the flowing of formed vapors. Since cracking reactions and vaporization are endothermic processes, and the reactions occur with no inert gas flow and atmospheric pressure, all the heat supplied is used to complete the reaction and vaporize the products of pyrolysis, and the temperature stalls until most of the reaction products are distillated out of the control volume of the reactor, as is shown in the graphs of
Figure 8,
Figure 9 and
Figure 10. For all process temperature curves, it is observed that there is a tendency to maintain a temperature constant until most of the bio-oil is collected in the flash drum.
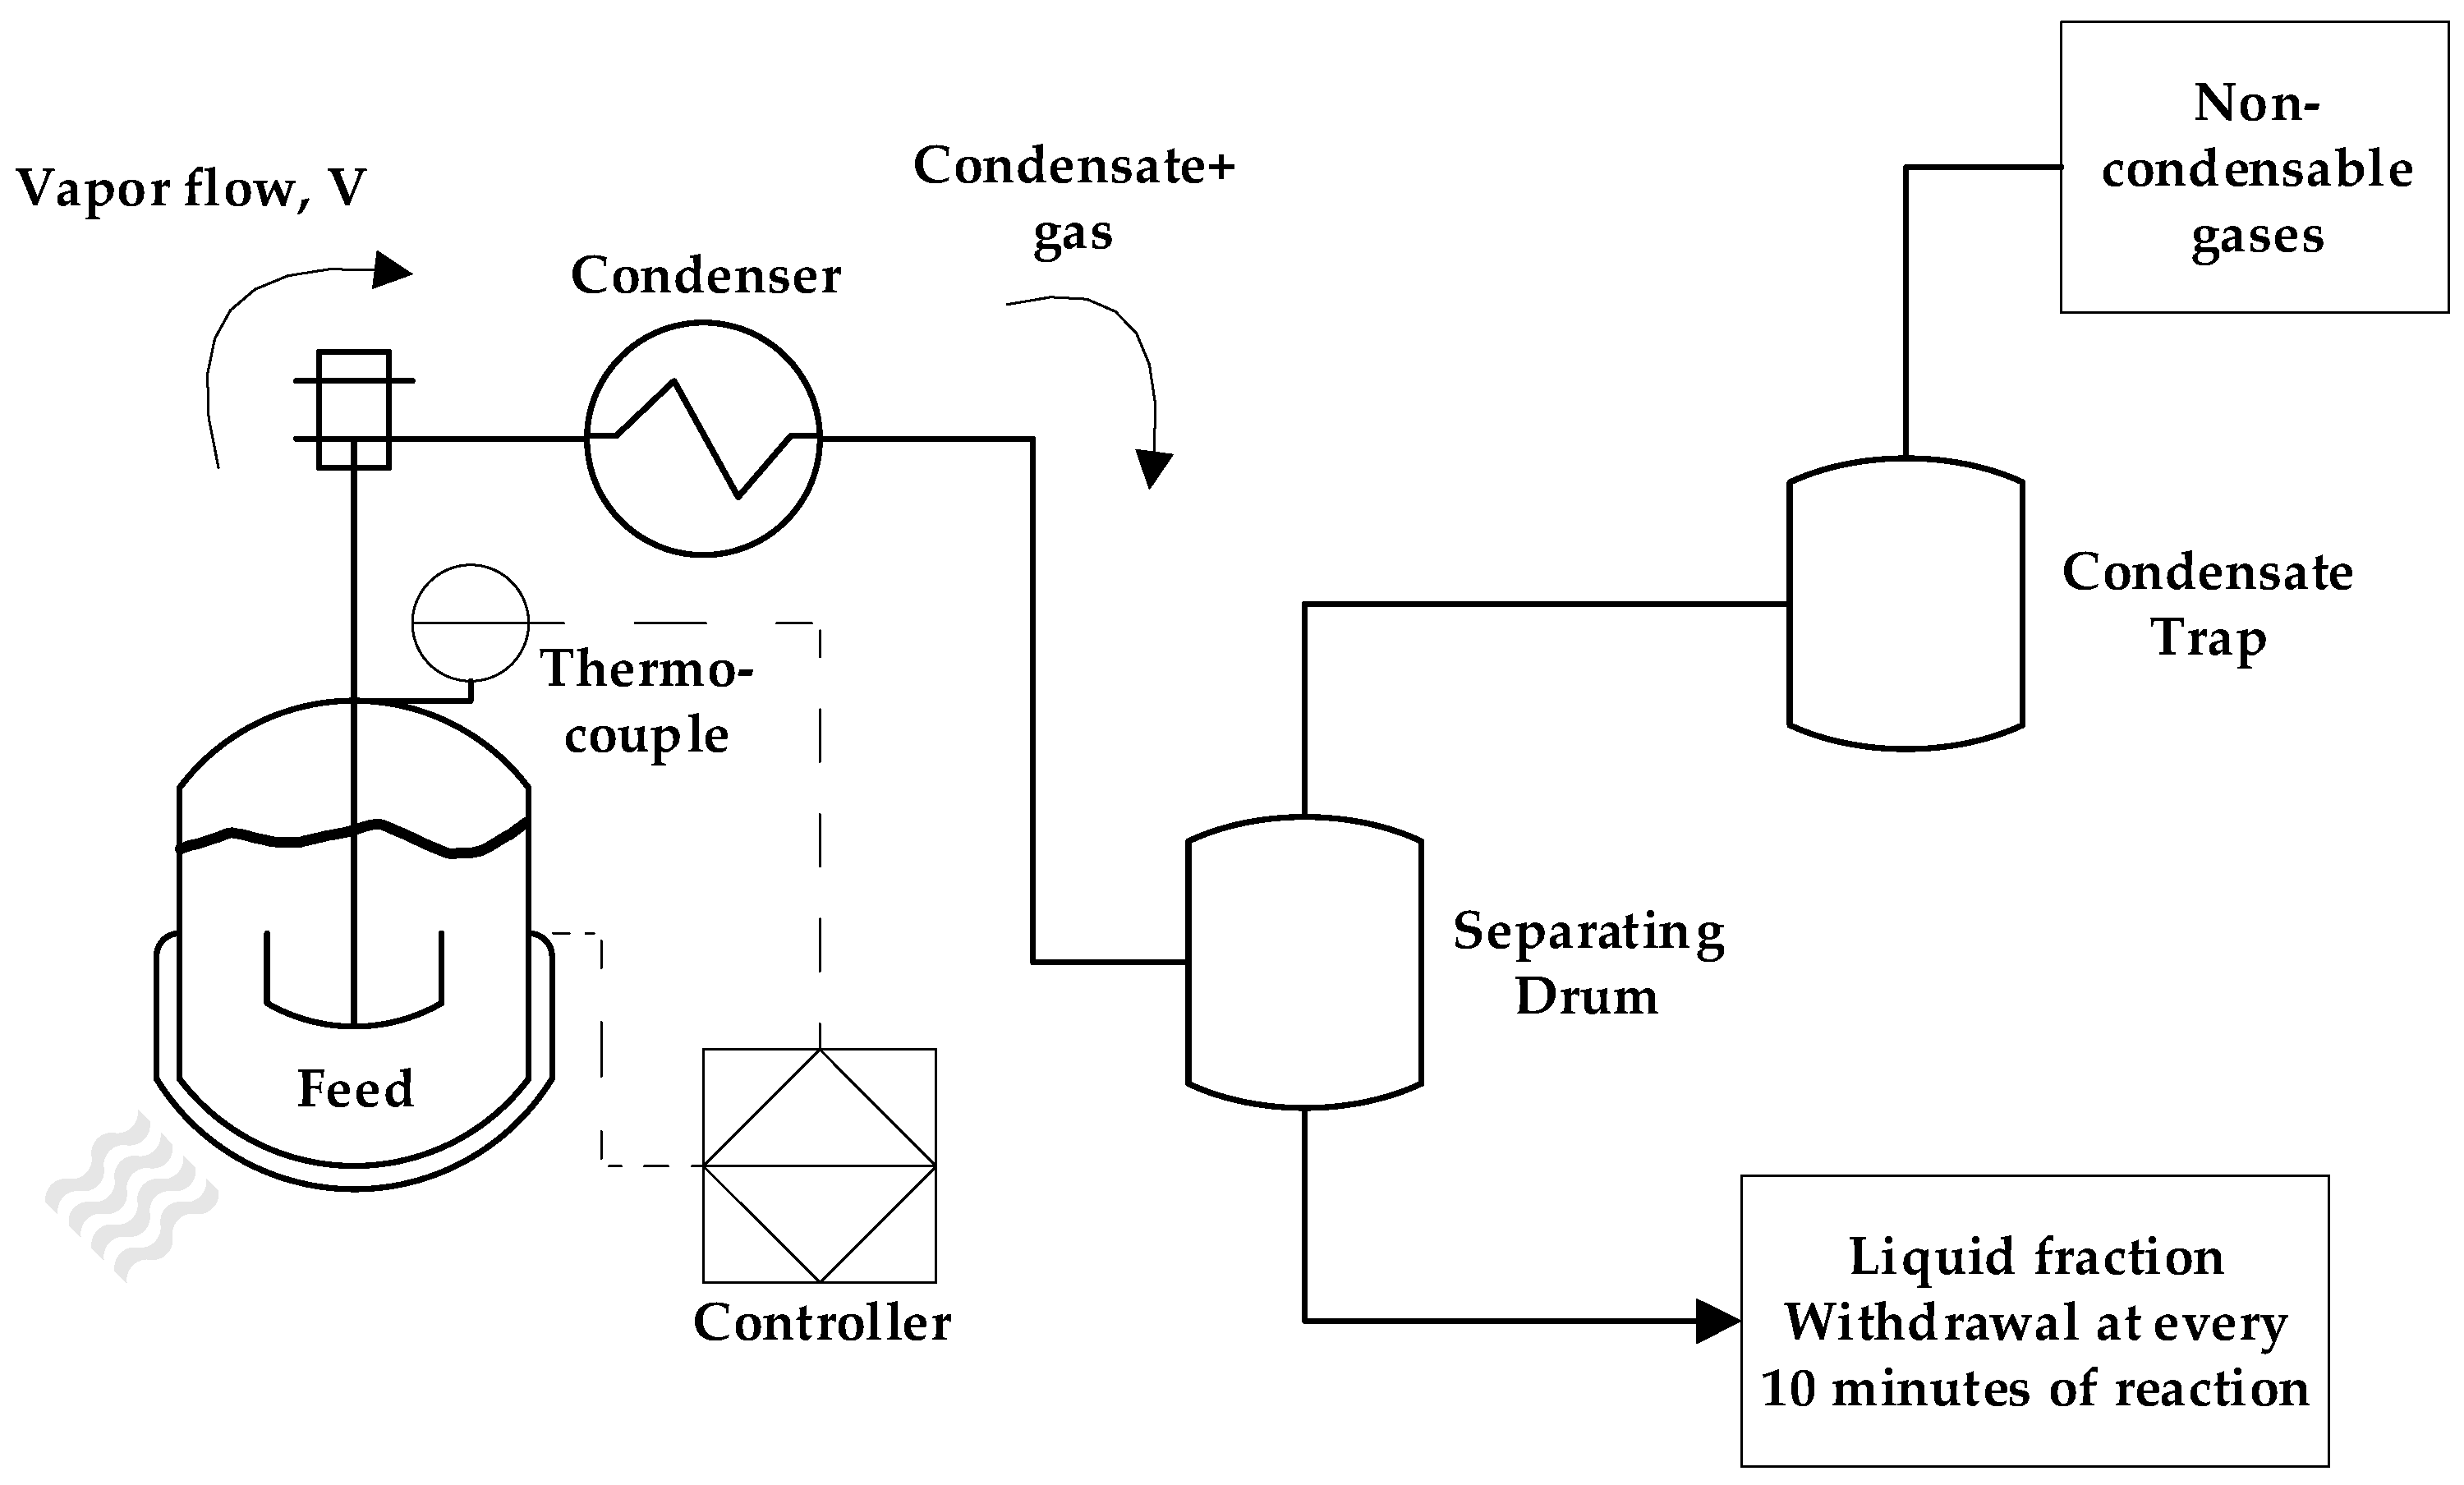
In order to make observations about the differences in conducting the pyrolysis of WAF at different temperatures, one might think that only the later stages of the reaction are different among different temperatures, but this is not the case. In order to avoid problems with temperature control due to the variability of research, the temperature is set manually at the control panel and no automatic control is conducted for the heating rate control. The heating rate is set indirectly by choosing the setpoint and comparing it with the current reactor temperature. The calculated difference generates the output of current to the electrical heater, as per any PID feedback control scheme [
54]. In order to heat the reactor effectively, we found out through experimentation that an adequate heating rate is obtained by choosing a setpoint 20 °C higher than the current temperature, and the established protocol for differentiating the experiments by temperature is when cracking starts to occur with vapor formation. The setpoint was chosen as the designed temperature for the experiment. This can be observed in the graphs of
Figure 8,
Figure 9 and
Figure 10, where the setpoint temperature is shown together with the reactor temperature and vapor flow. The greater the difference in temperature means a higher vapor flow out of the reactor, and
Figure 8,
Figure 9 and
Figure 10 show increased vapor flow with an increasing temperature.
That is why it is observed to increase the bio-oil yield with an increase in temperature, but a similar trend is not observed for bio-char, NCG, and water yields. It seems that maintaining the reaction temperature at 400 °C favors the formation of non-condensable gases, while maintenance of the temperature at 450 °C increases the water formed in the reaction, probably by decarbonylation reactions. A further increase in temperature reduces bio-char yield once it starts to crack into more liquid and vapors, as shown by yields of 500 °C. It is not clear why the experiment conducted at 500 °C produced less water than all the others. It seems that aqueous phase yields are largely influenced by the moisture content of the feed, and the variability of this parameter may be the cause of inconsistent results.
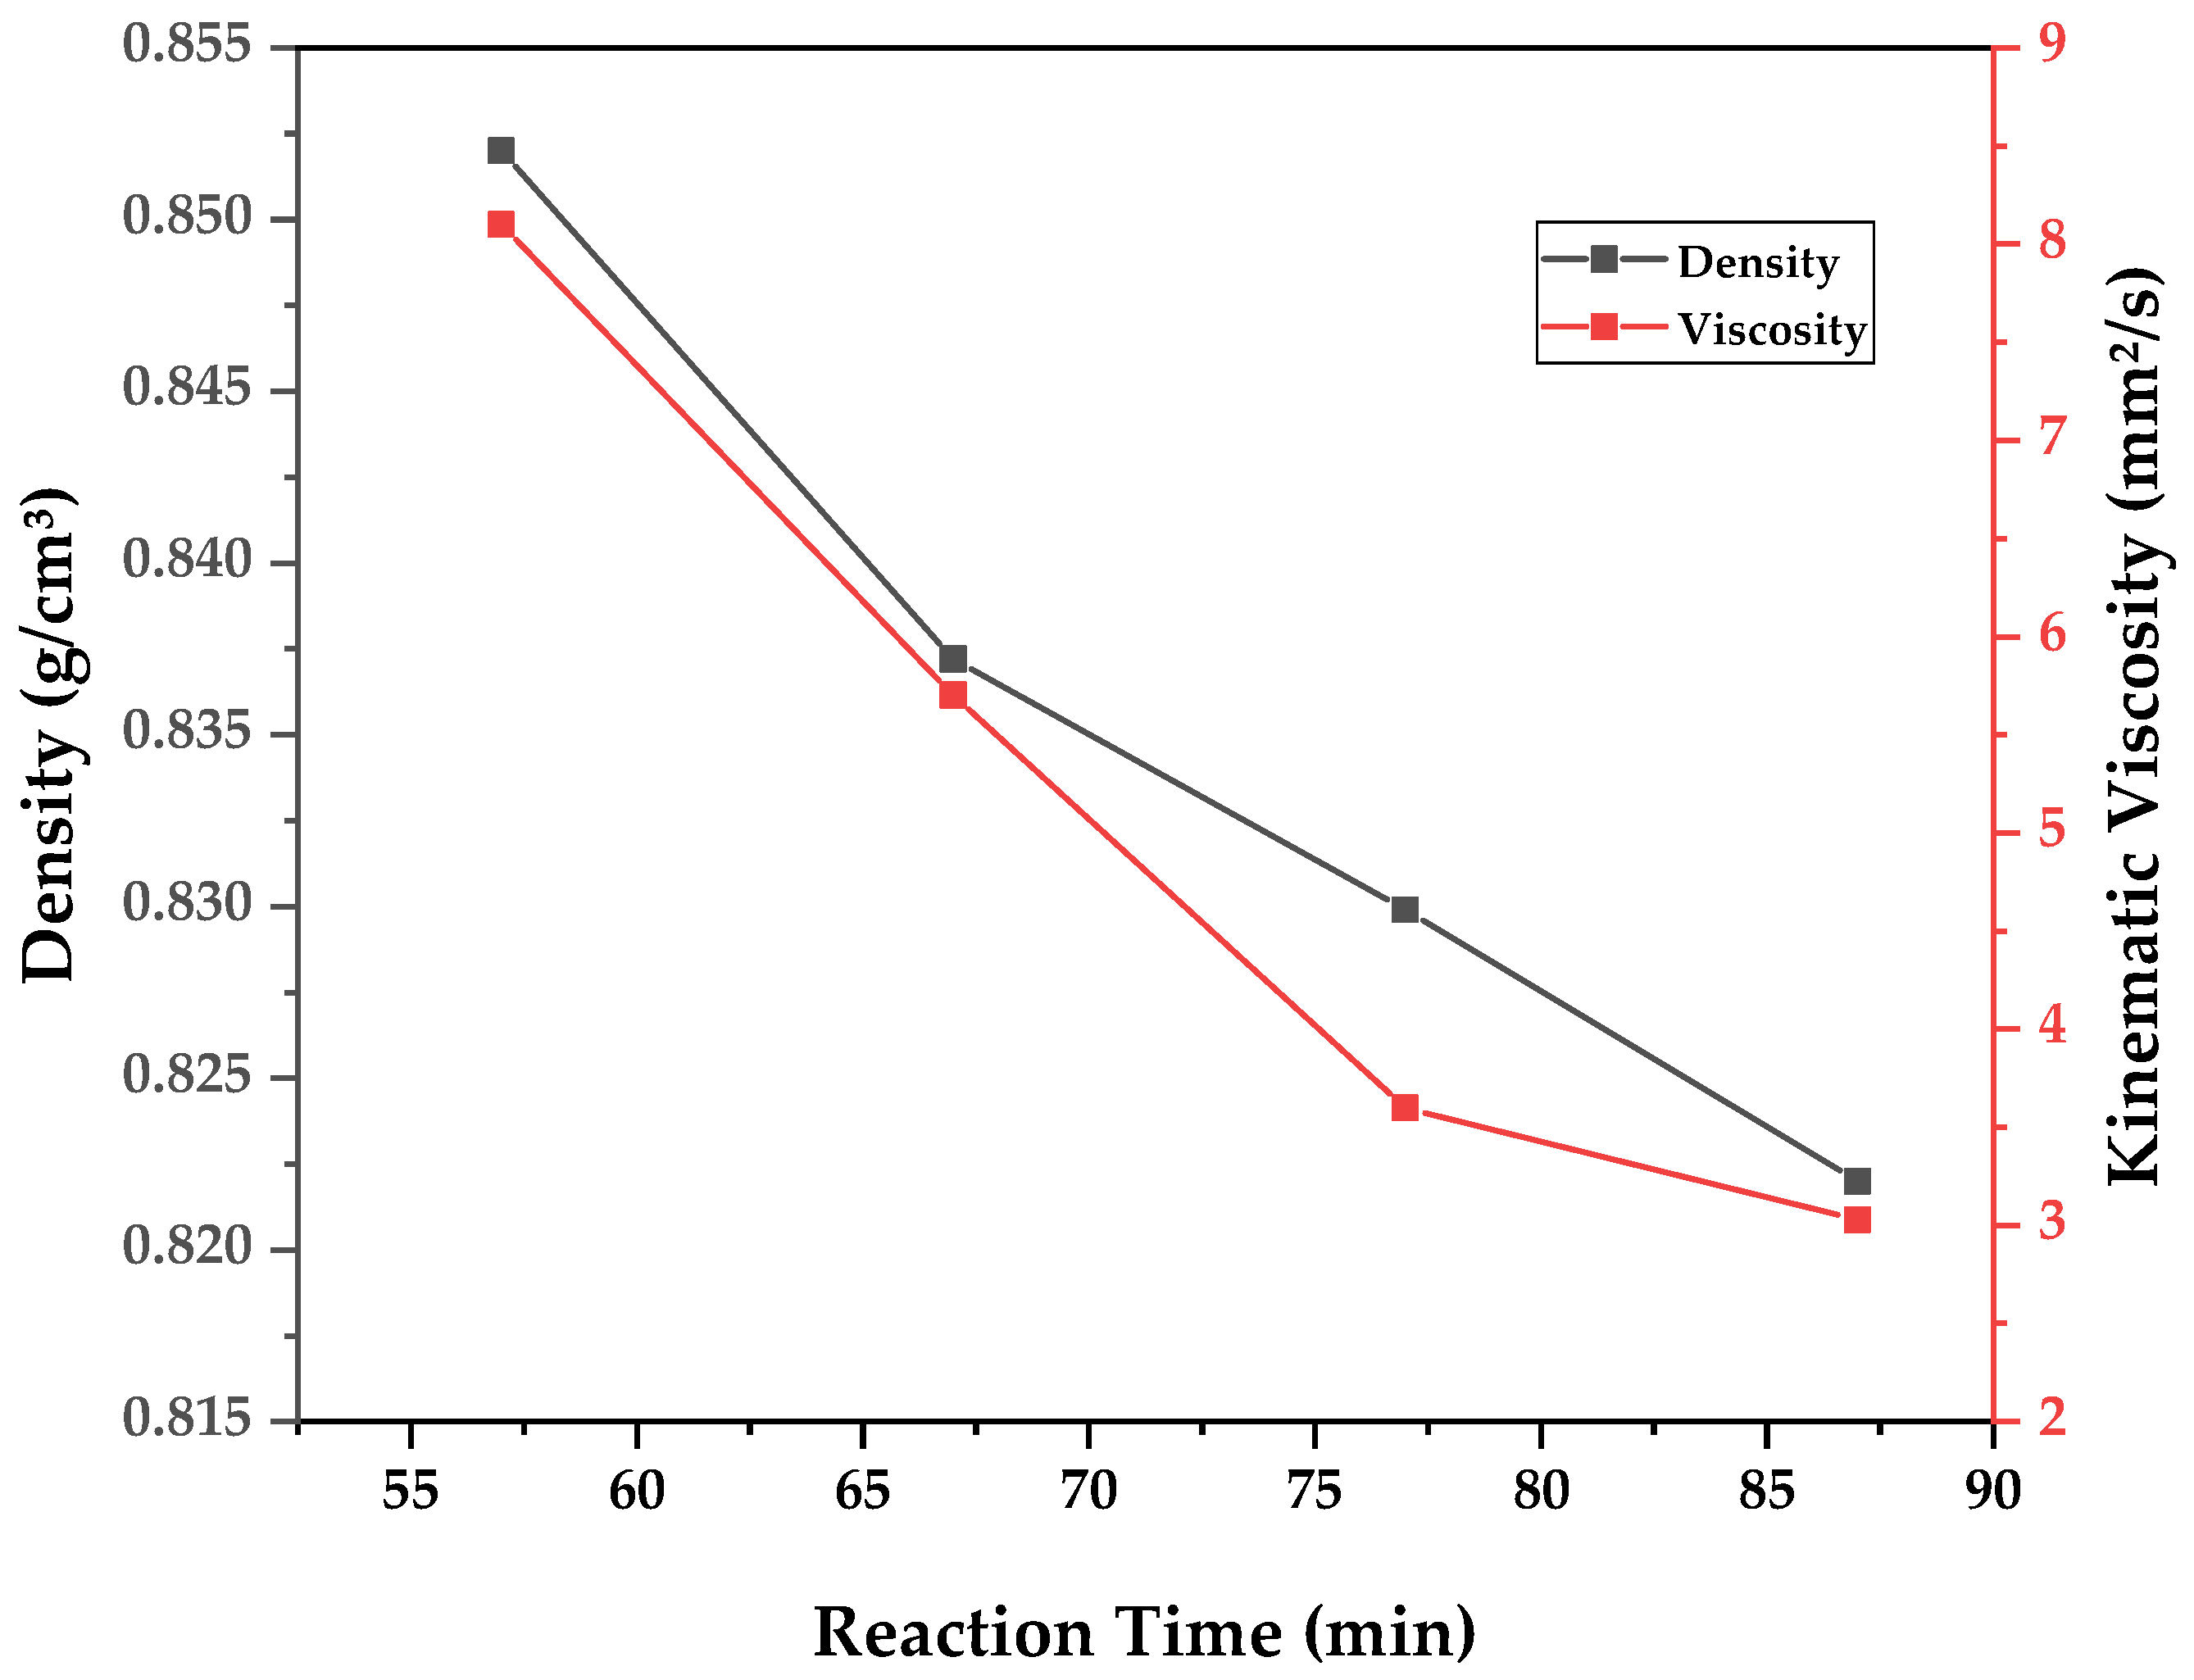
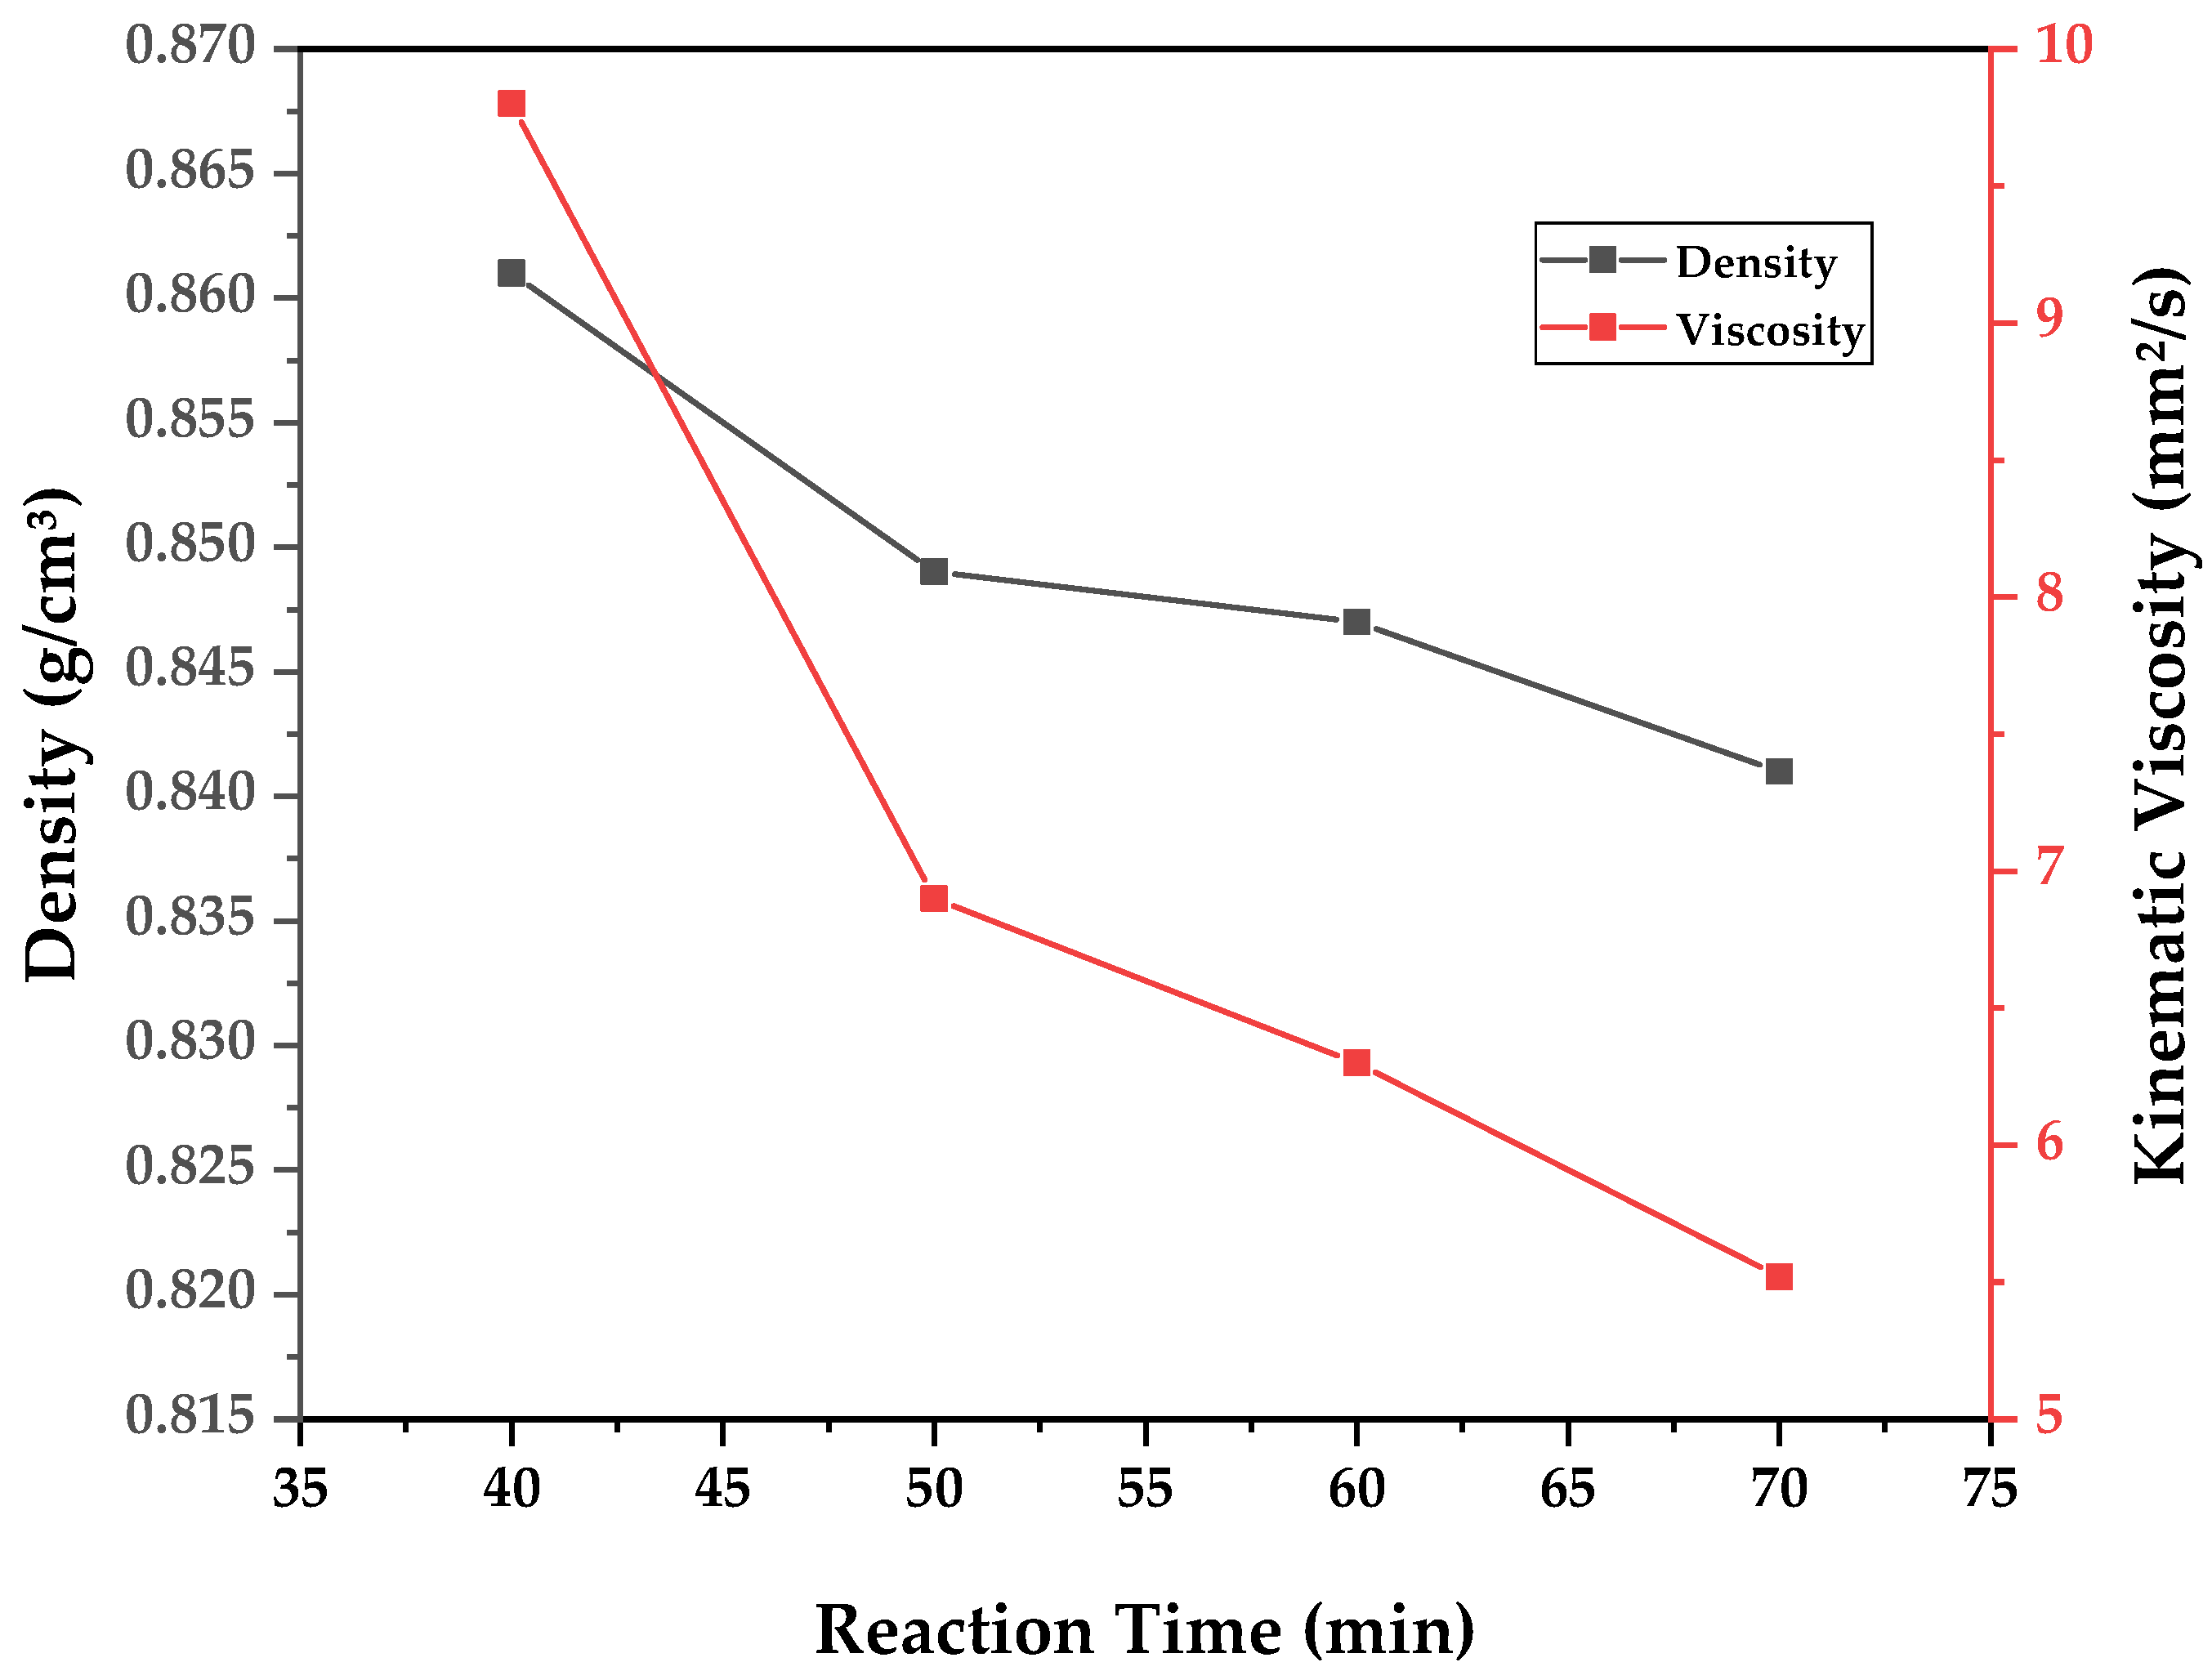
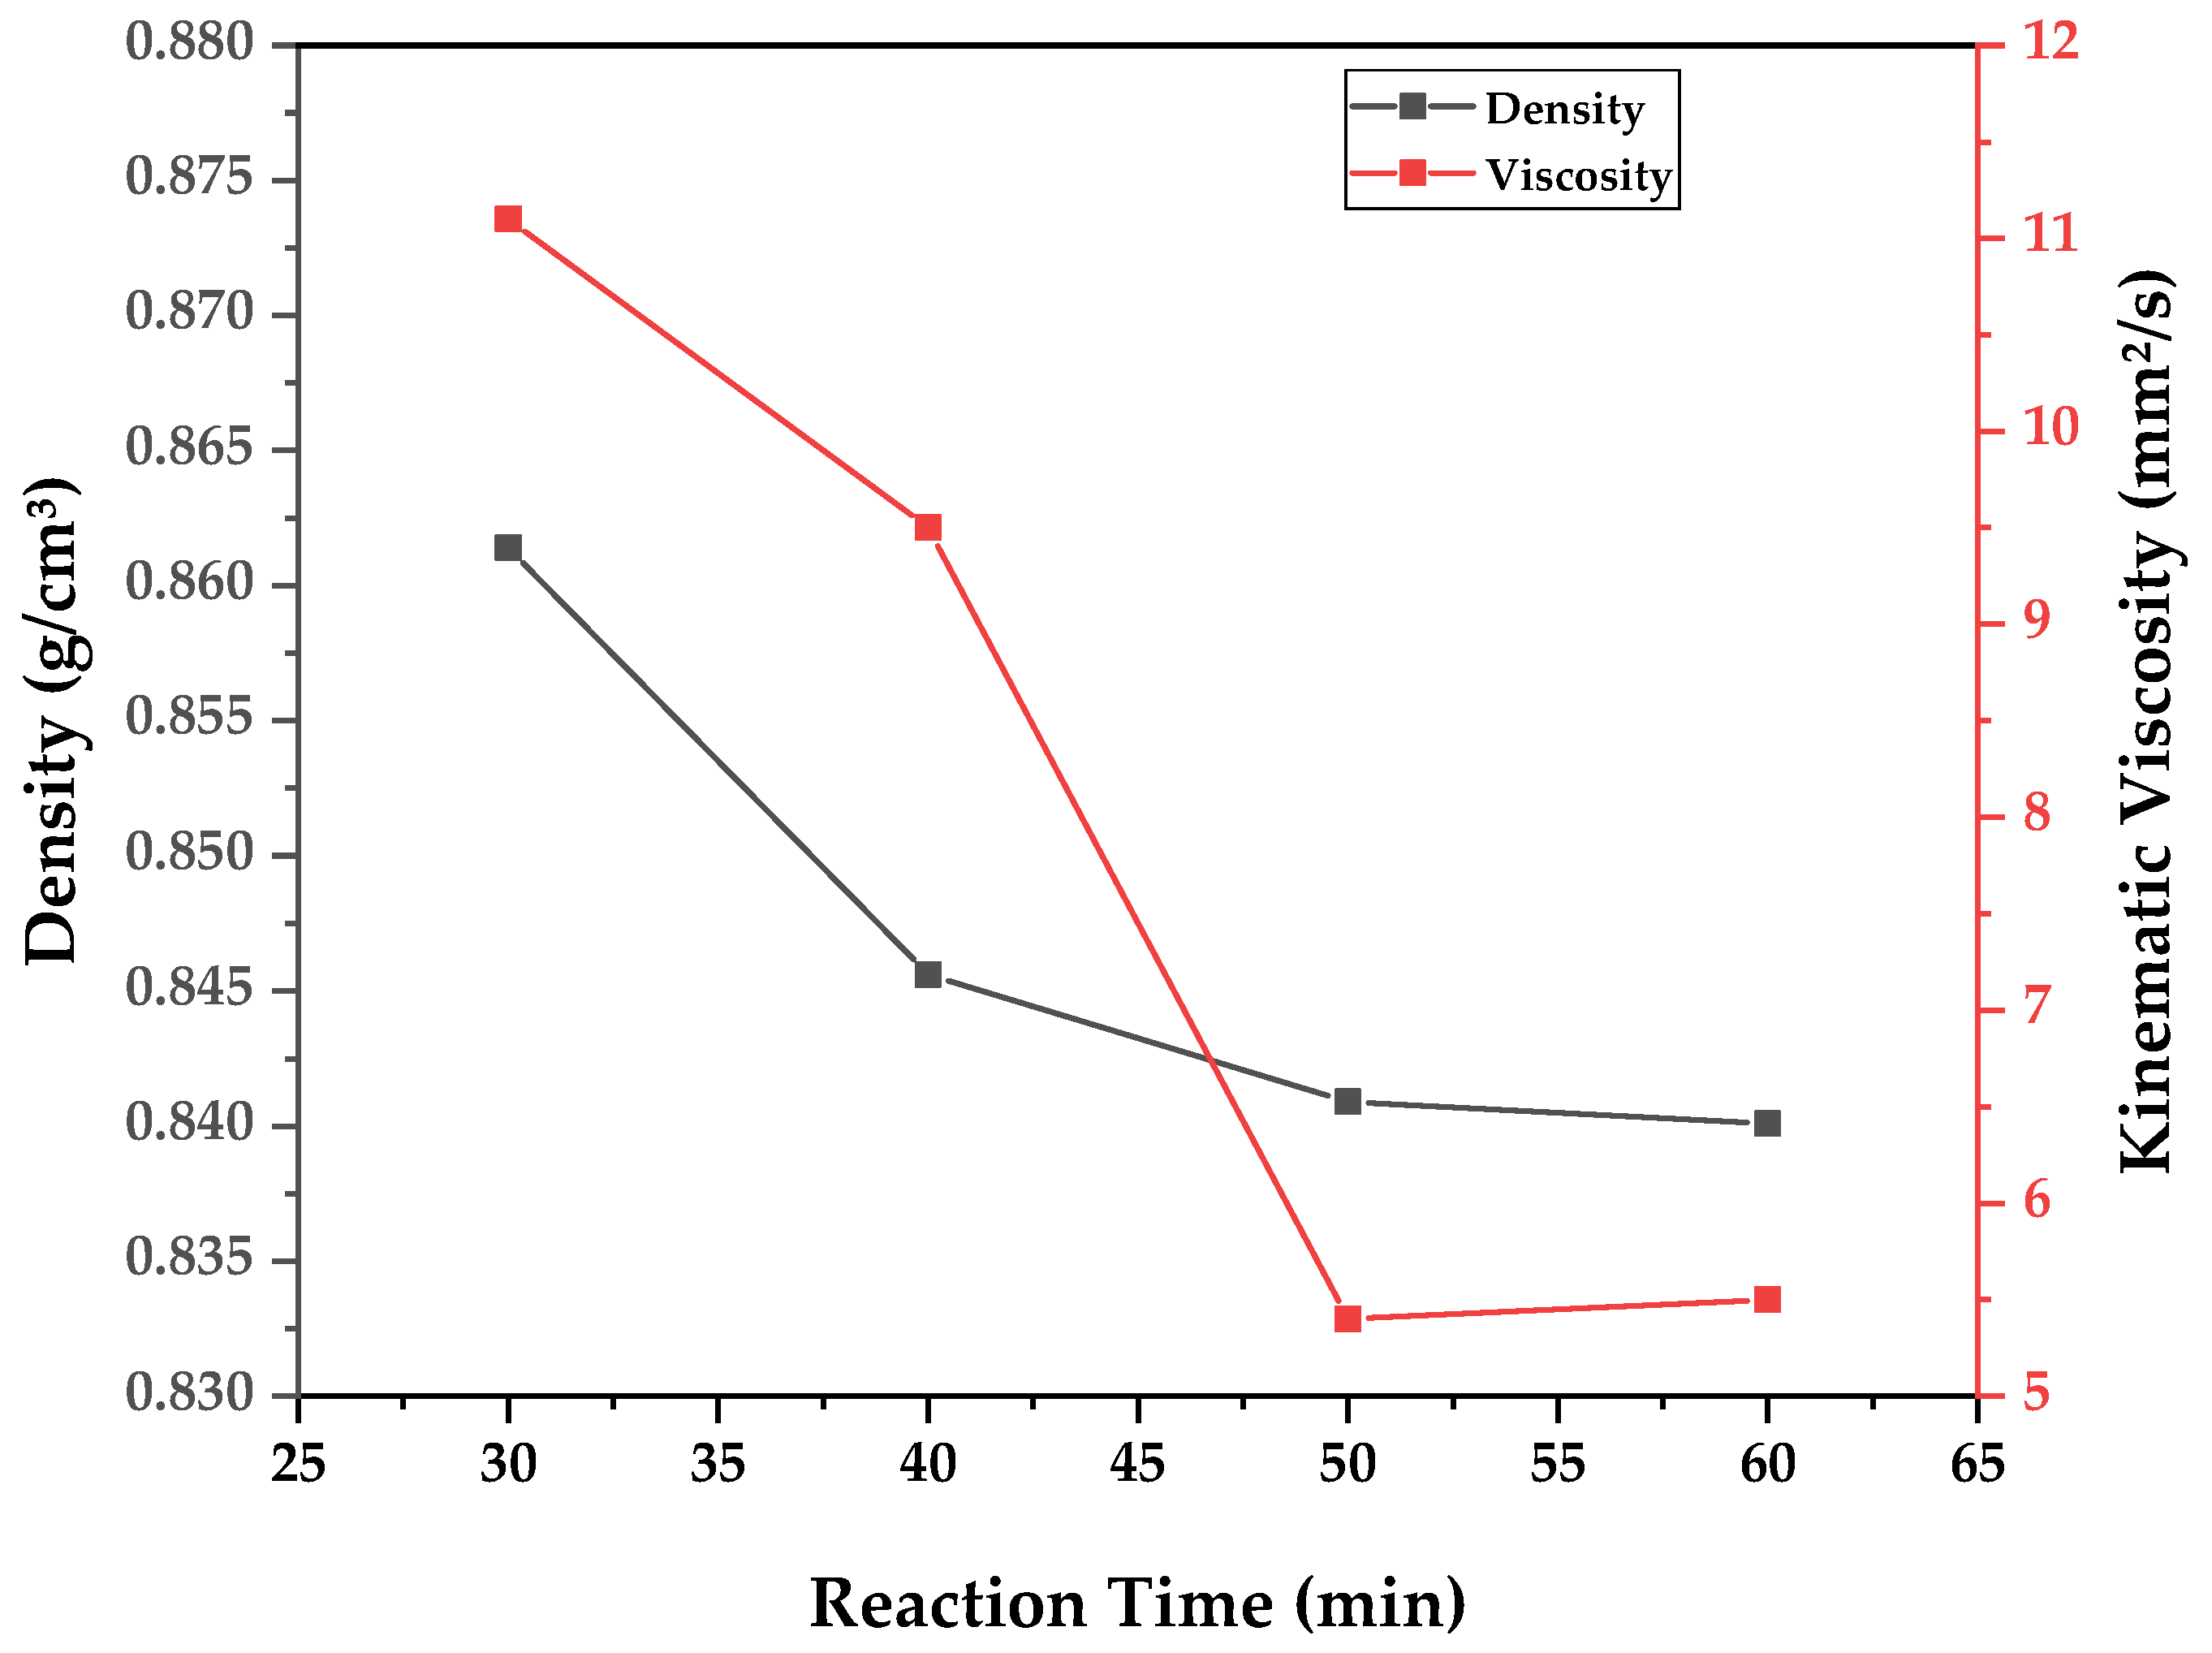
A similar analysis can be conducted for chemical composition and for determining the physical–chemical properties of the obtained bio-oil fractions. As the samples were fractionated according to reaction time, the data are presented in the form of graphs (
Figure 11,
Figure 12 and
Figure 13) of said physical–chemical parameter versus reaction time. In order to evaluate the overall influence of different pyrolysis temperatures, weighted averages of the measured properties are calculated based on the determined property of a time-fraction and its respective weight of bio-oil collected. The results of calculated density, kinematic viscosity, and acid value for each experiment are presented in
Table 8. The specific measurements of density, kinematic viscosity, and acid value for each time-fraction sample are presented in
Table 9, along with the collected liquid phase for that reaction time.
It can be observed in
Table 8 and
Figure 11,
Figure 12 and
Figure 13 that all physical–chemical parameters reduced with reaction time, since higher reaction times allow for the transformation of triglycerides and fatty acids into hydrocarbons, displaying reduced density, viscosity, and acid value. Furthermore, as was visualized in
Figure 8,
Figure 9 and
Figure 10, the experiments presented increased vapor flow, depending on the setpoint temperature, and consequently, there was less time for conversion of fatty acids to hydrocarbons [
4,
5]. The increased process temperature in semi-batch reactors affects negatively the residence time of vapors, which is of ultimate importance for the full conversion of fatty acids to hydrocarbons. In addition to the increased heat and vapor flow, this may allow for distillation of the original oil with no or only partial cracking, exhibiting a higher content of fatty acids, density, viscosity and acid value. It is observed from
Table 8 that density, viscosity, and acid value presented higher values with increased process temperature, and the reaction tended to complete itself faster, with increased vapor flow, indicating a lower residence time of vapors for increased temperature and affecting the total transformation of the WAF into hydrocarbons. For semi-batch pyrolysis, in order to increase conversion, what is needed is not only temperature and heating rate but a way of maintaining the necessary residence time for conversion. This may be attained by reflux or the correct geometry of the reactor. Wiggers et al. conducted the pyrolysis of soybean oil in a continuous plant where the heated zone consisted of a long electrically heated tube and observed the opposite effect displayed here, with a reduction in the yield of bio-oil with an increasing temperature. This was achieved by feeding the reactor continually into an evaporator, and pyrolysis only occurred in the vapor phase along the heated tube. Since the variation in temperature exists only in the tube, it does not affect residence time. It is governed by the heat supplied by the evaporator and maintained at a constant temperature. When the feed rate of the oil is increased, there is a reduction in residence time, and the same effects observed in this work are repeated [
23].
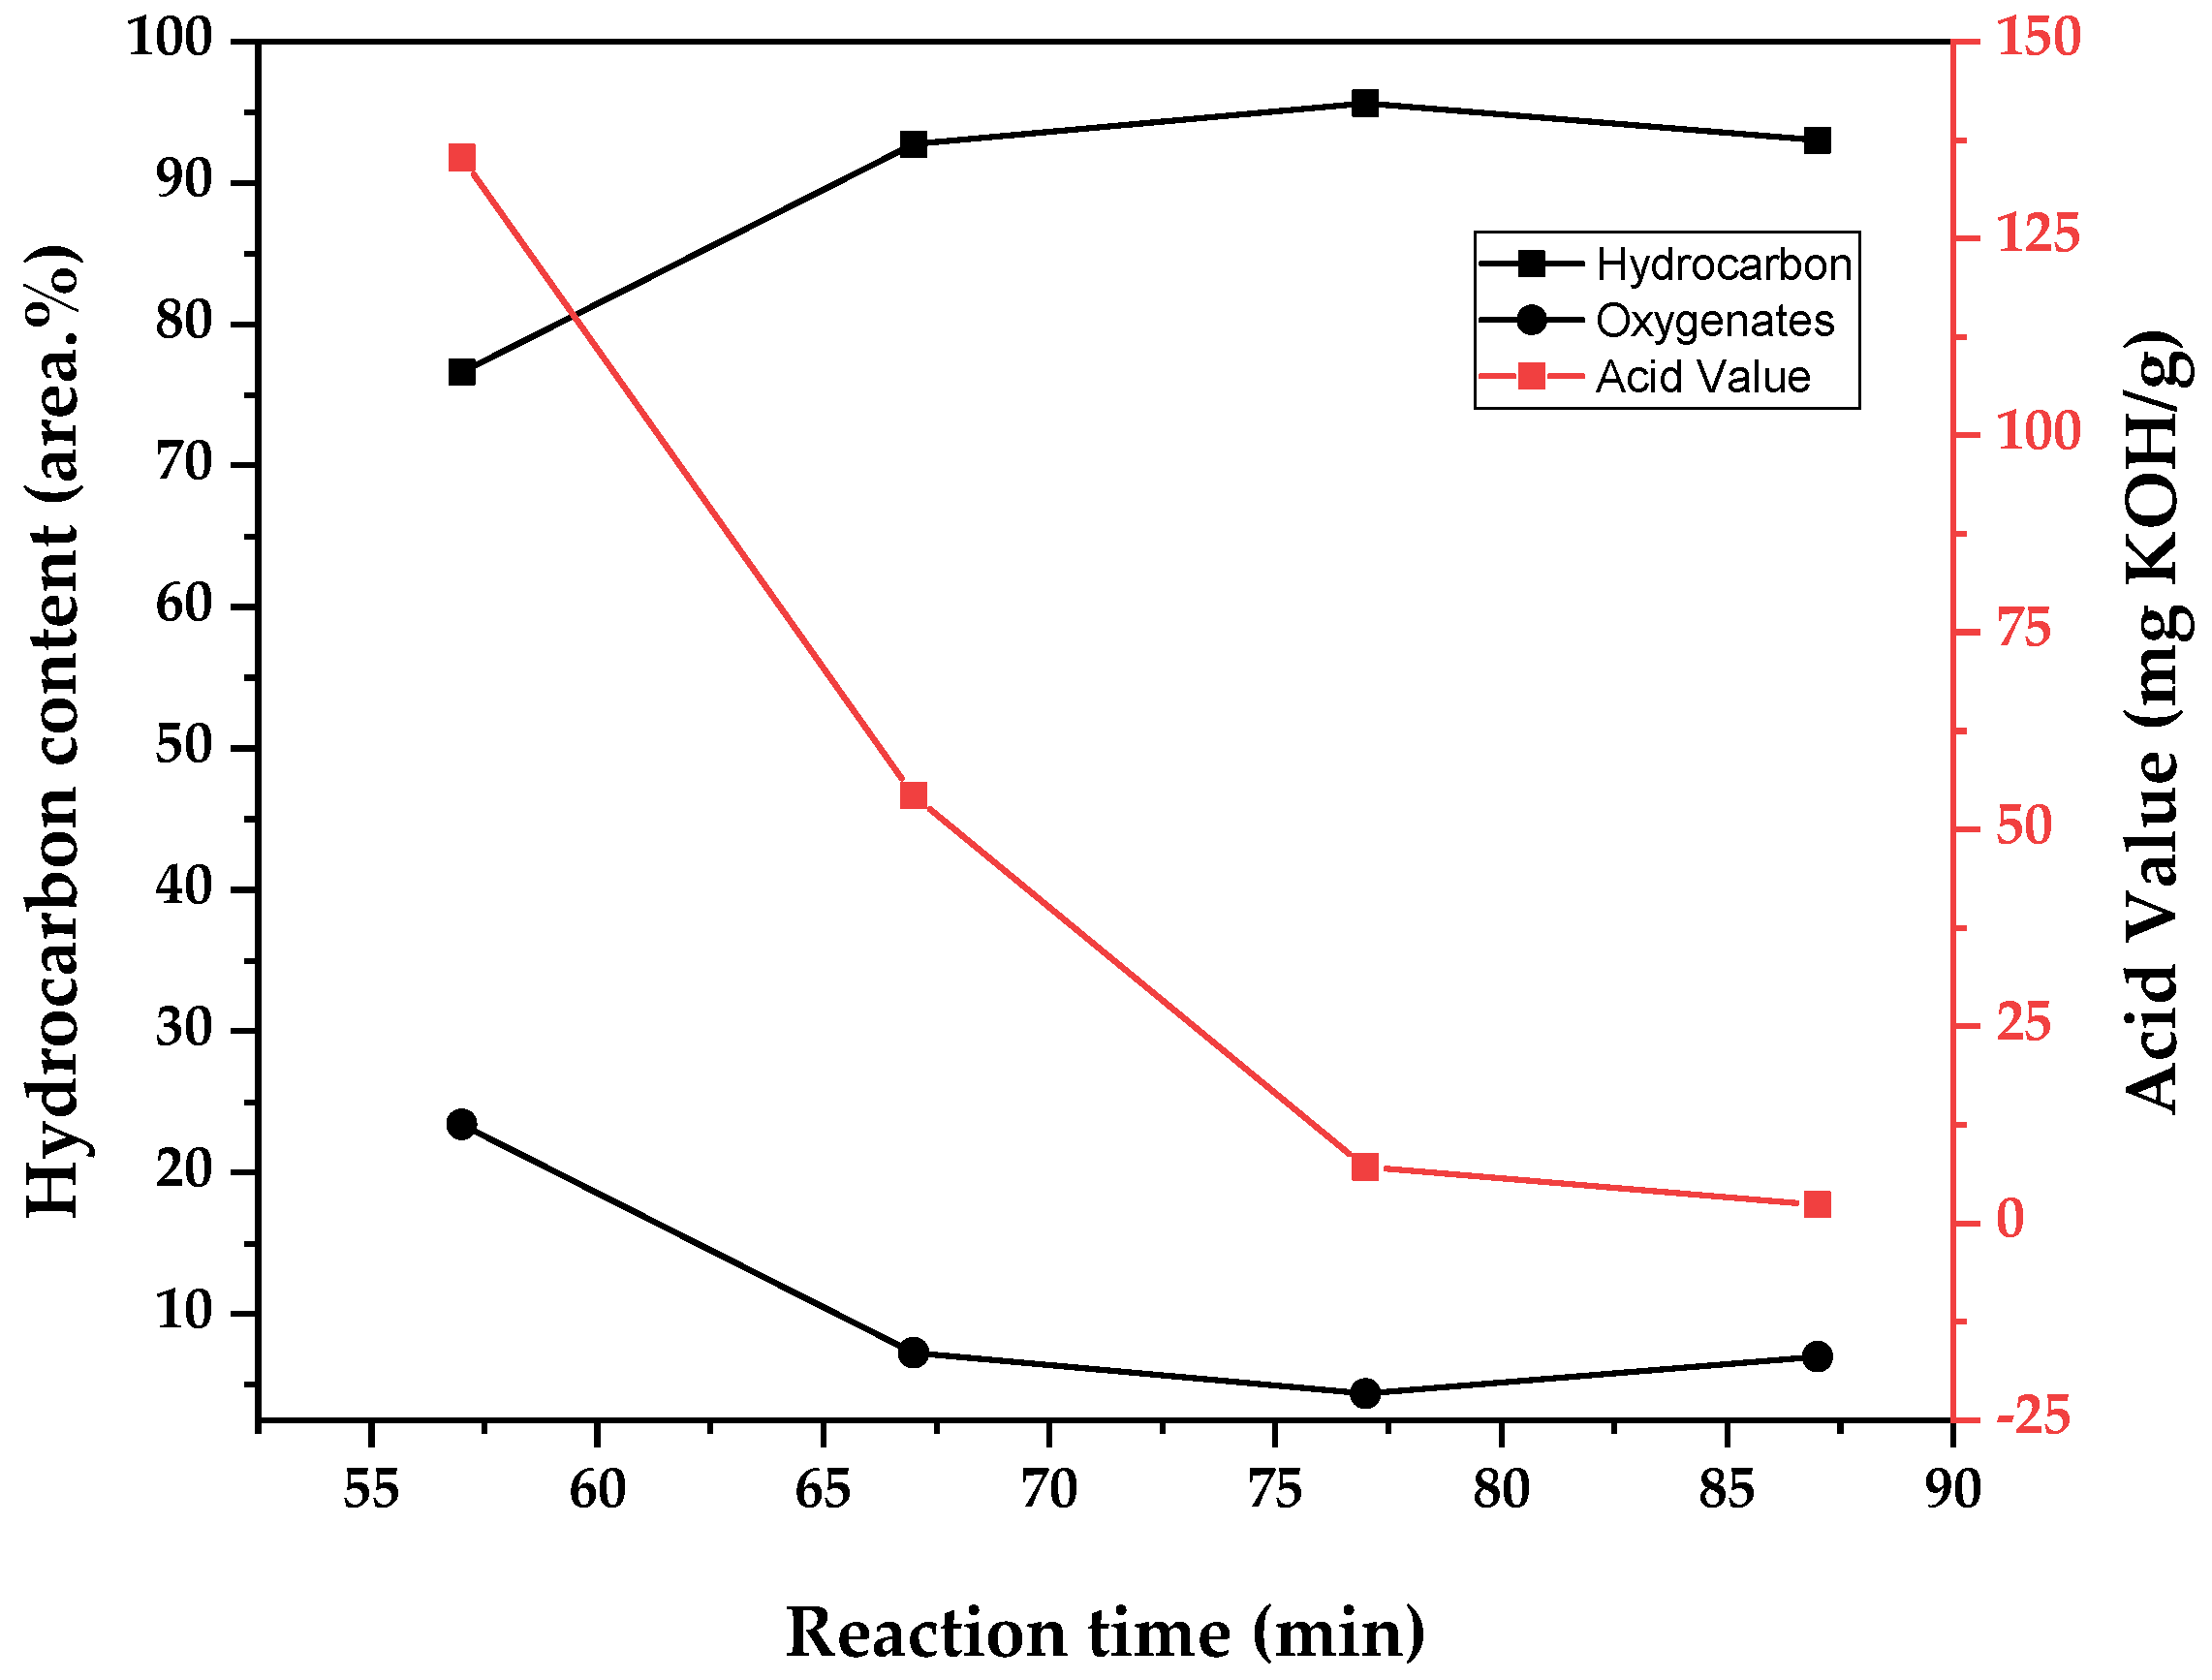
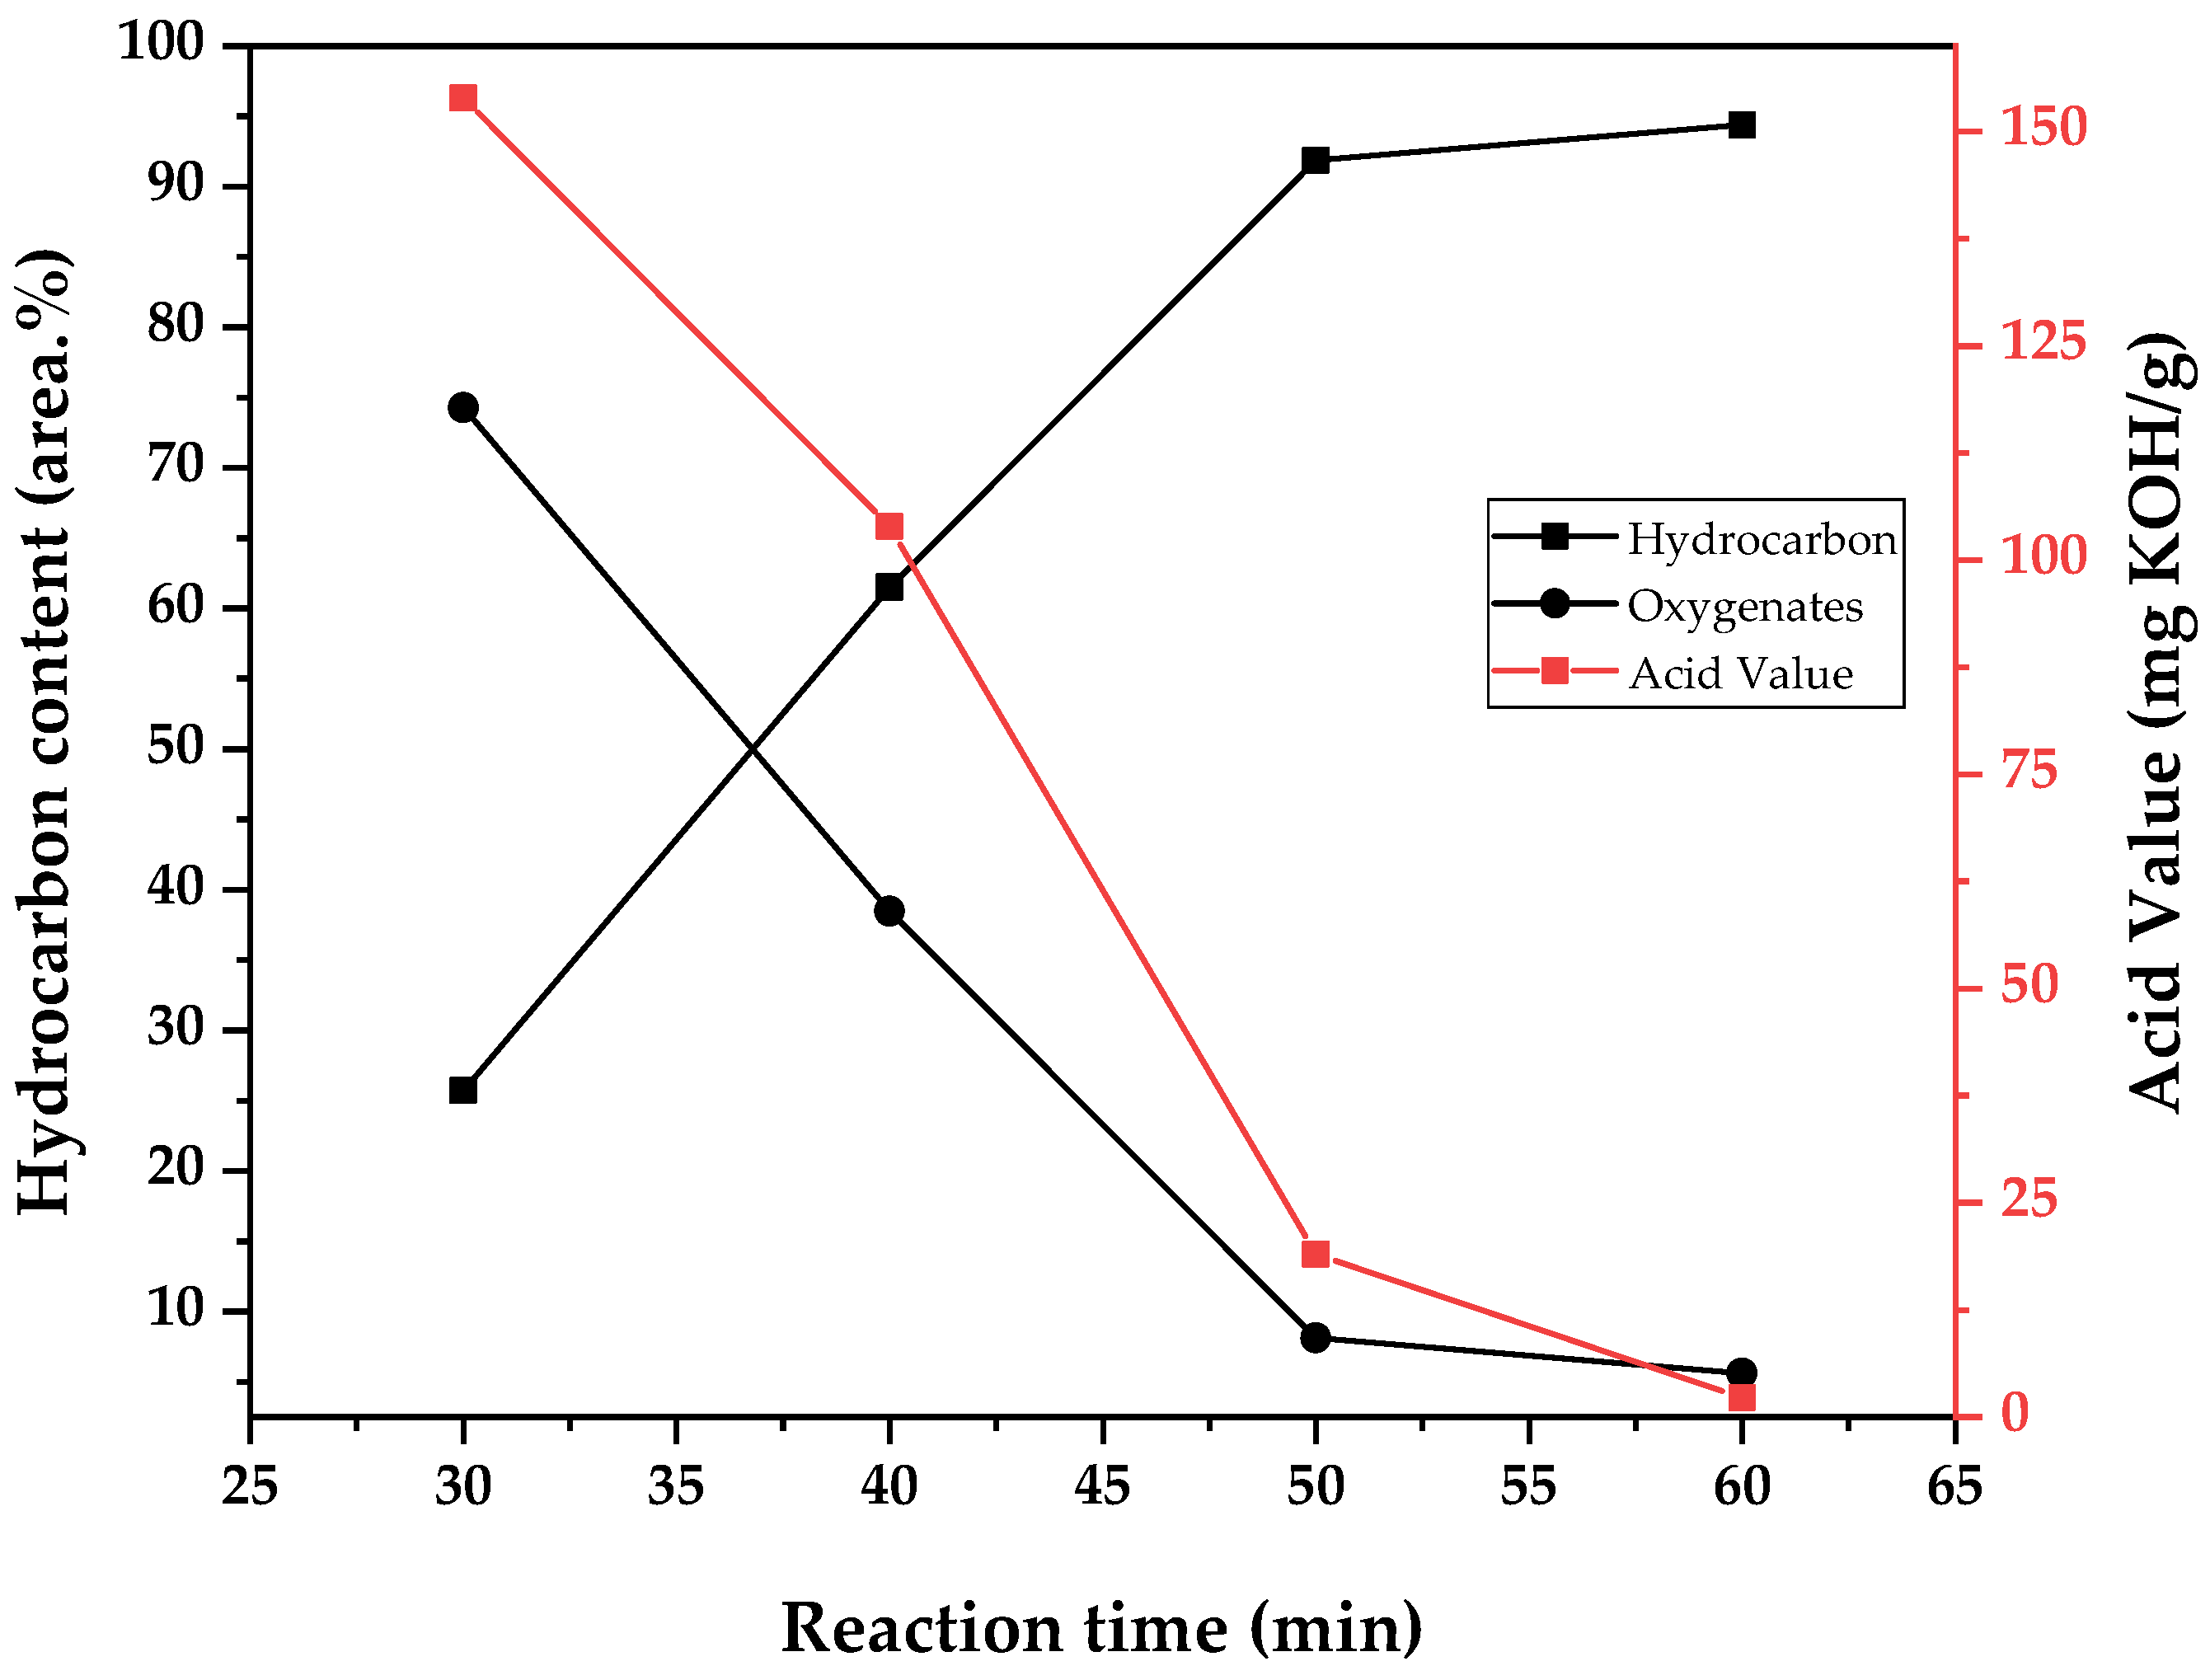
In the same manner, the chemical composition of obtained bio-oil is presented in two ways. Weighted averages of the area.% of the chemical functions observed in the chromatogram of each fraction (alkanes, alkenes, cyclic hydrocarbons, ketones, aldehydes, and fatty acids) are presented in
Table 10. The detailed chemical composition of bio-oil at different temperatures (400, 450, and 500 °C) and reaction times (10, 20, 30, and 40 min) are presented as
Supplementary Material in the form of
Tables S1–S11. The change in the chemical composition of bio-oil at different temperatures (400, 450, and 500 °C) is observed in
Figure 14,
Figure 15 and
Figure 16, respectively. For simplicity of analysis, data are presented as separating the compounds in bio-oil by hydrocarbons and oxygenates, and the variation of the acid values of the samples are observed in the other axis. The acidity of triglyceride pyrolysis oil is connected to the fatty acid content of the sample, and since fatty acids are intermediate in the conversion of triglycerides into hydrocarbons by pyrolysis [
14], it is a simple measure of the conversion, which serves as a good parameter to compare and validate the chemical composition change observed with the increase in reaction time.
As suggested by the tendency observed for density, viscosity, and acid value, it seems that by conducting pyrolysis under high temperature, in this case meaning under high energy transfer by heating and consequently high flow of vapors out of the reaction zone, there is a decrease in residence time in the heated zones and a reduction of the total conversion to hydrocarbons. The increase in liquid bio-oil yield is from distillated original material or only partially converted one, as shown in
Table 10 by the increase in fatty acid concentration from 7 to 35 area.% of the chromatogram by increasing the temperature from 400 to 500 °C. Indeed, the experiment conducted at 400 °C generated a higher yield of gases (12.9 wt.%), and deoxygenation of pyrolysis oil (conversion of fatty acids to hydrocarbons) is related to the production of carbon dioxide and carbon monoxide by decarboxylation and decarbonylation reactions, respectively. The observed chemical composition may also explain why the experiment conducted at 450 °C generated more aqueous phase, as it presented a higher concentration of alkenes. Its production is related to decarbonylation reactions, where water is also formed [
14].
Thermal decomposition of triglycerides and fatty acids occurs at mid-to-high temperatures (300–500 °C) and follows a complex reaction mechanism involving cracking reactions, deoxygenation, aromatization, and condensation reactions [
14,
55]. From a simplified perspective, the mechanism can be divided into three condensed steps: 1—initial cracking of triglycerides into ketenes, acrolein, and fatty acids; 2—fatty acids deoxygenation into hydrocarbons through decarboxylation and decarbonylation reactions; and 3—further reactions of aromatization and condensation of products [
4]. Another pathway involves cracking in the double bonds present in the hydrocarbon’s chains of both triglycerides and fatty acids, producing smaller, more volatile, compounds of the parent initial chemical function and gaseous hydrocarbons [
55]. It is not wrong to assume that both reaction pathways occur simultaneously, even if it is not to the same degree, so a wide distribution of chemical composition of the products is obtained for bio-oil, gas, and char fractions [
4].
The chemical composition of bio-oil produced at 400 °C and 10 min of reaction time is presented in
Table 11 in the form of the major compounds present, and it shows that bio-oil is majorly composed of 72 area.% of hydrocarbons (linear alkanes, alkenes, alkynes, and cyclic hydrocarbons), 23 area.% of fatty acids (deca-, tetra-, and hexadecanoic acids) and 4 area.% of ketones, alcohols, and aldehydes (heptadecanone, behenic alcohol, and a dimer of acrolein). Only a small fraction of compounds remained unidentified. It can be observed that a significant portion of the bio-oil is formed by linear compounds presenting 14 to 17 carbons with a high content of C15 and C17 hydrocarbons. Although vegetable oils and animal fats are different and present different physical properties, it can be argued that the majority of lipid-based materials are composed of triglycerides derived from palmitic (C16) and oleic (C18:1) acids, and their differences arise from the differences in the minority composition of other triglycerides and fatty acids. Even though animal fats display a higher content of stearic (C18) acid-based triglycerides, they still contain significant amounts of palmitic (27 wt.%) and oleic (48 wt.%) acids, corresponding to over 75 wt.% of their chemical composition [
41]. As detailed before, triglycerides submitted to thermal decomposition are first converted to fatty acids and then deoxygenated to hydrocarbons, releasing carbon dioxide or carbon monoxide depending on the mechanism of deoxygenation (decarboxylation or decarbonylation), losing one carbon atom and turning into C15 and C17 hydrocarbons. The presence of smaller-chain hydrocarbons can be related to an analogous mechanism, with the other triglycerides composing the starting material, and also due to the cracking of double bonds in the hydrocarbon chain of fatty acids, as suggested by Benson et al. [
55]. The presence of ketones can be explained by the mechanism of the decarboxylation of fatty acids. Although not fully explained, the academic literature suggests that ketones are intermediaries in the conversion of fatty acids to hydrocarbons through a mechanism of ketonic decarboxylation, as in the case of the conversion of adipic acid to cyclopentanone and cyclopentene [
56].
It is important to observe that the area of the total ion count (TIC) of the chromatogram does not reflect the actual wt.% of the detected compounds in the sample, since different organic functions can present different responses in determined methods. The use of certified internal standards can be conducted in order to convert the area.% into wt.%, but the high number of detected compounds in the sample allied with the high value of some certified standards restricts its actual use. Some distortions can be observed, for example in the actual acidity of the WAF bio-oil. Even though the chromatogram shows 23 area.% for fatty acids, the actual acidity of the sample is far higher, since it presents an acid value of 135 mg KOH/g. It is estimated that, for oleic acid-derived triglycerides and fatty acids (the case of the WAF and WAF bio-oil), the acid value represents double the wt.% of fatty acids in the sample [
41], so WAF bio-oil with an acid value of 135 mg KOH/g should contain approximately 60 wt.% of fatty acids. The obtained composition is in accord with other waste vegetable oil and animal fat pyrolysis results [
4,
16,
17,
57,
58]. Bernar et al. obtained a very similar composition for grease-trap pyrolysis in the semi-pilot reactor at 400 °C [
4], demonstrating that the initial wt.% of free fatty acids (FFA) of the feedstock only slightly influences the obtained FFA content of the pyrolysis oil due to the mechanism of conversion of triglycerides into hydrocarbons [
14,
55]. The waste fat used in this work has a much lower acid value of 2.6 mg KOH/g compared to the one used by Bernar et al. of 70 mg KOH/g. Indeed, the WAF used in this work is similar to beef tallow, largely composed of triglycerides and having low fatty acid concentration. Bernar et al. used waste fat from a kitchen grease trap, and even with characteristics defined as good for grease traps (the grease trap only collected effluent from meat cooking), it still suffers from biological (bacteria) and chemical degradation (hydrolysis), increasing its acid value [
4].
3.2. Fractional Distillation
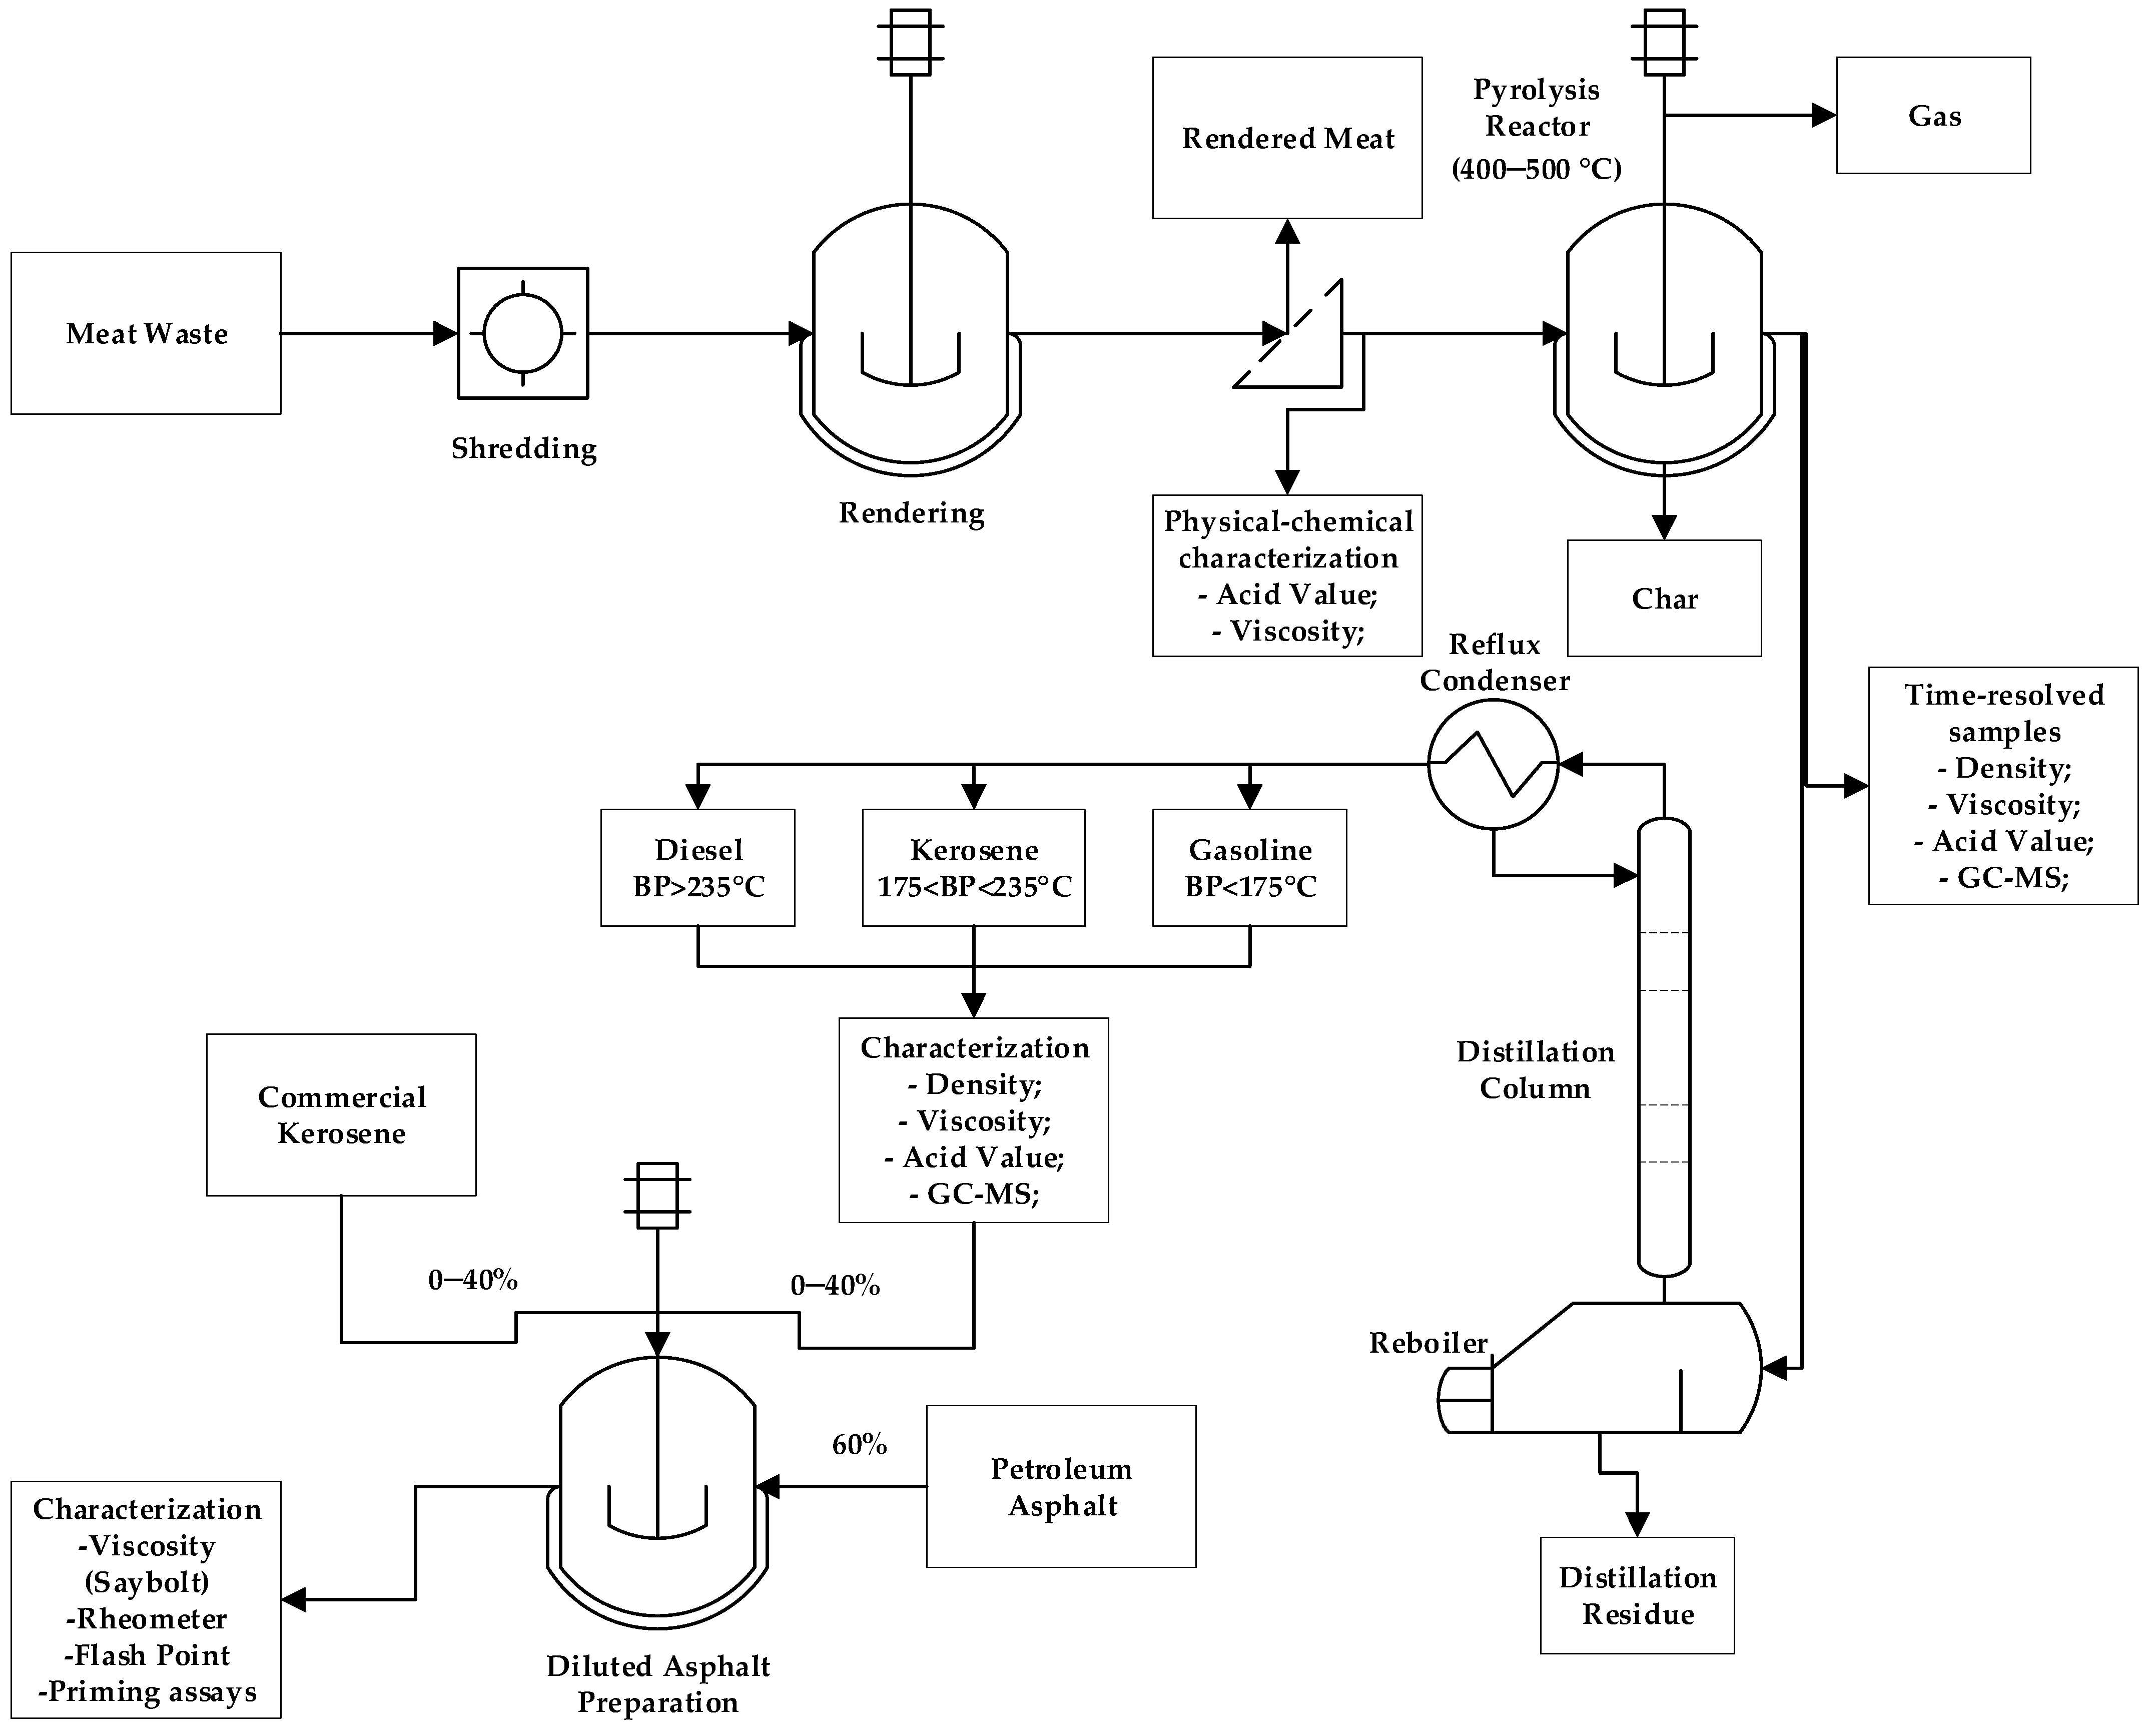
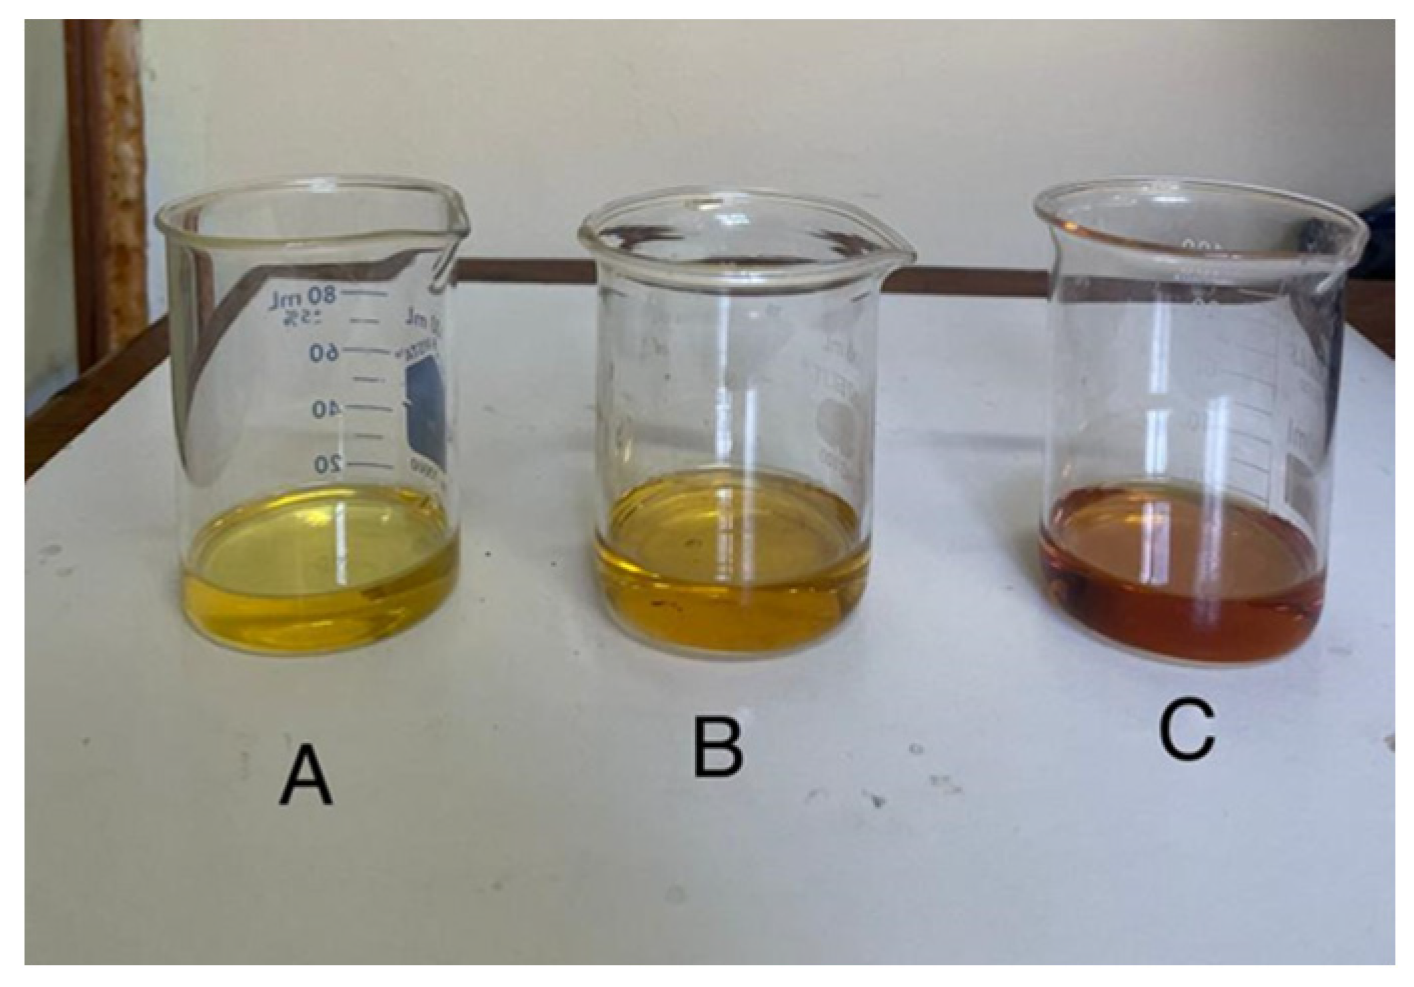
Batch fractional distillation of the WAF bio-oil produced was conducted in order to further purify the bio-oil into distilled fractions (
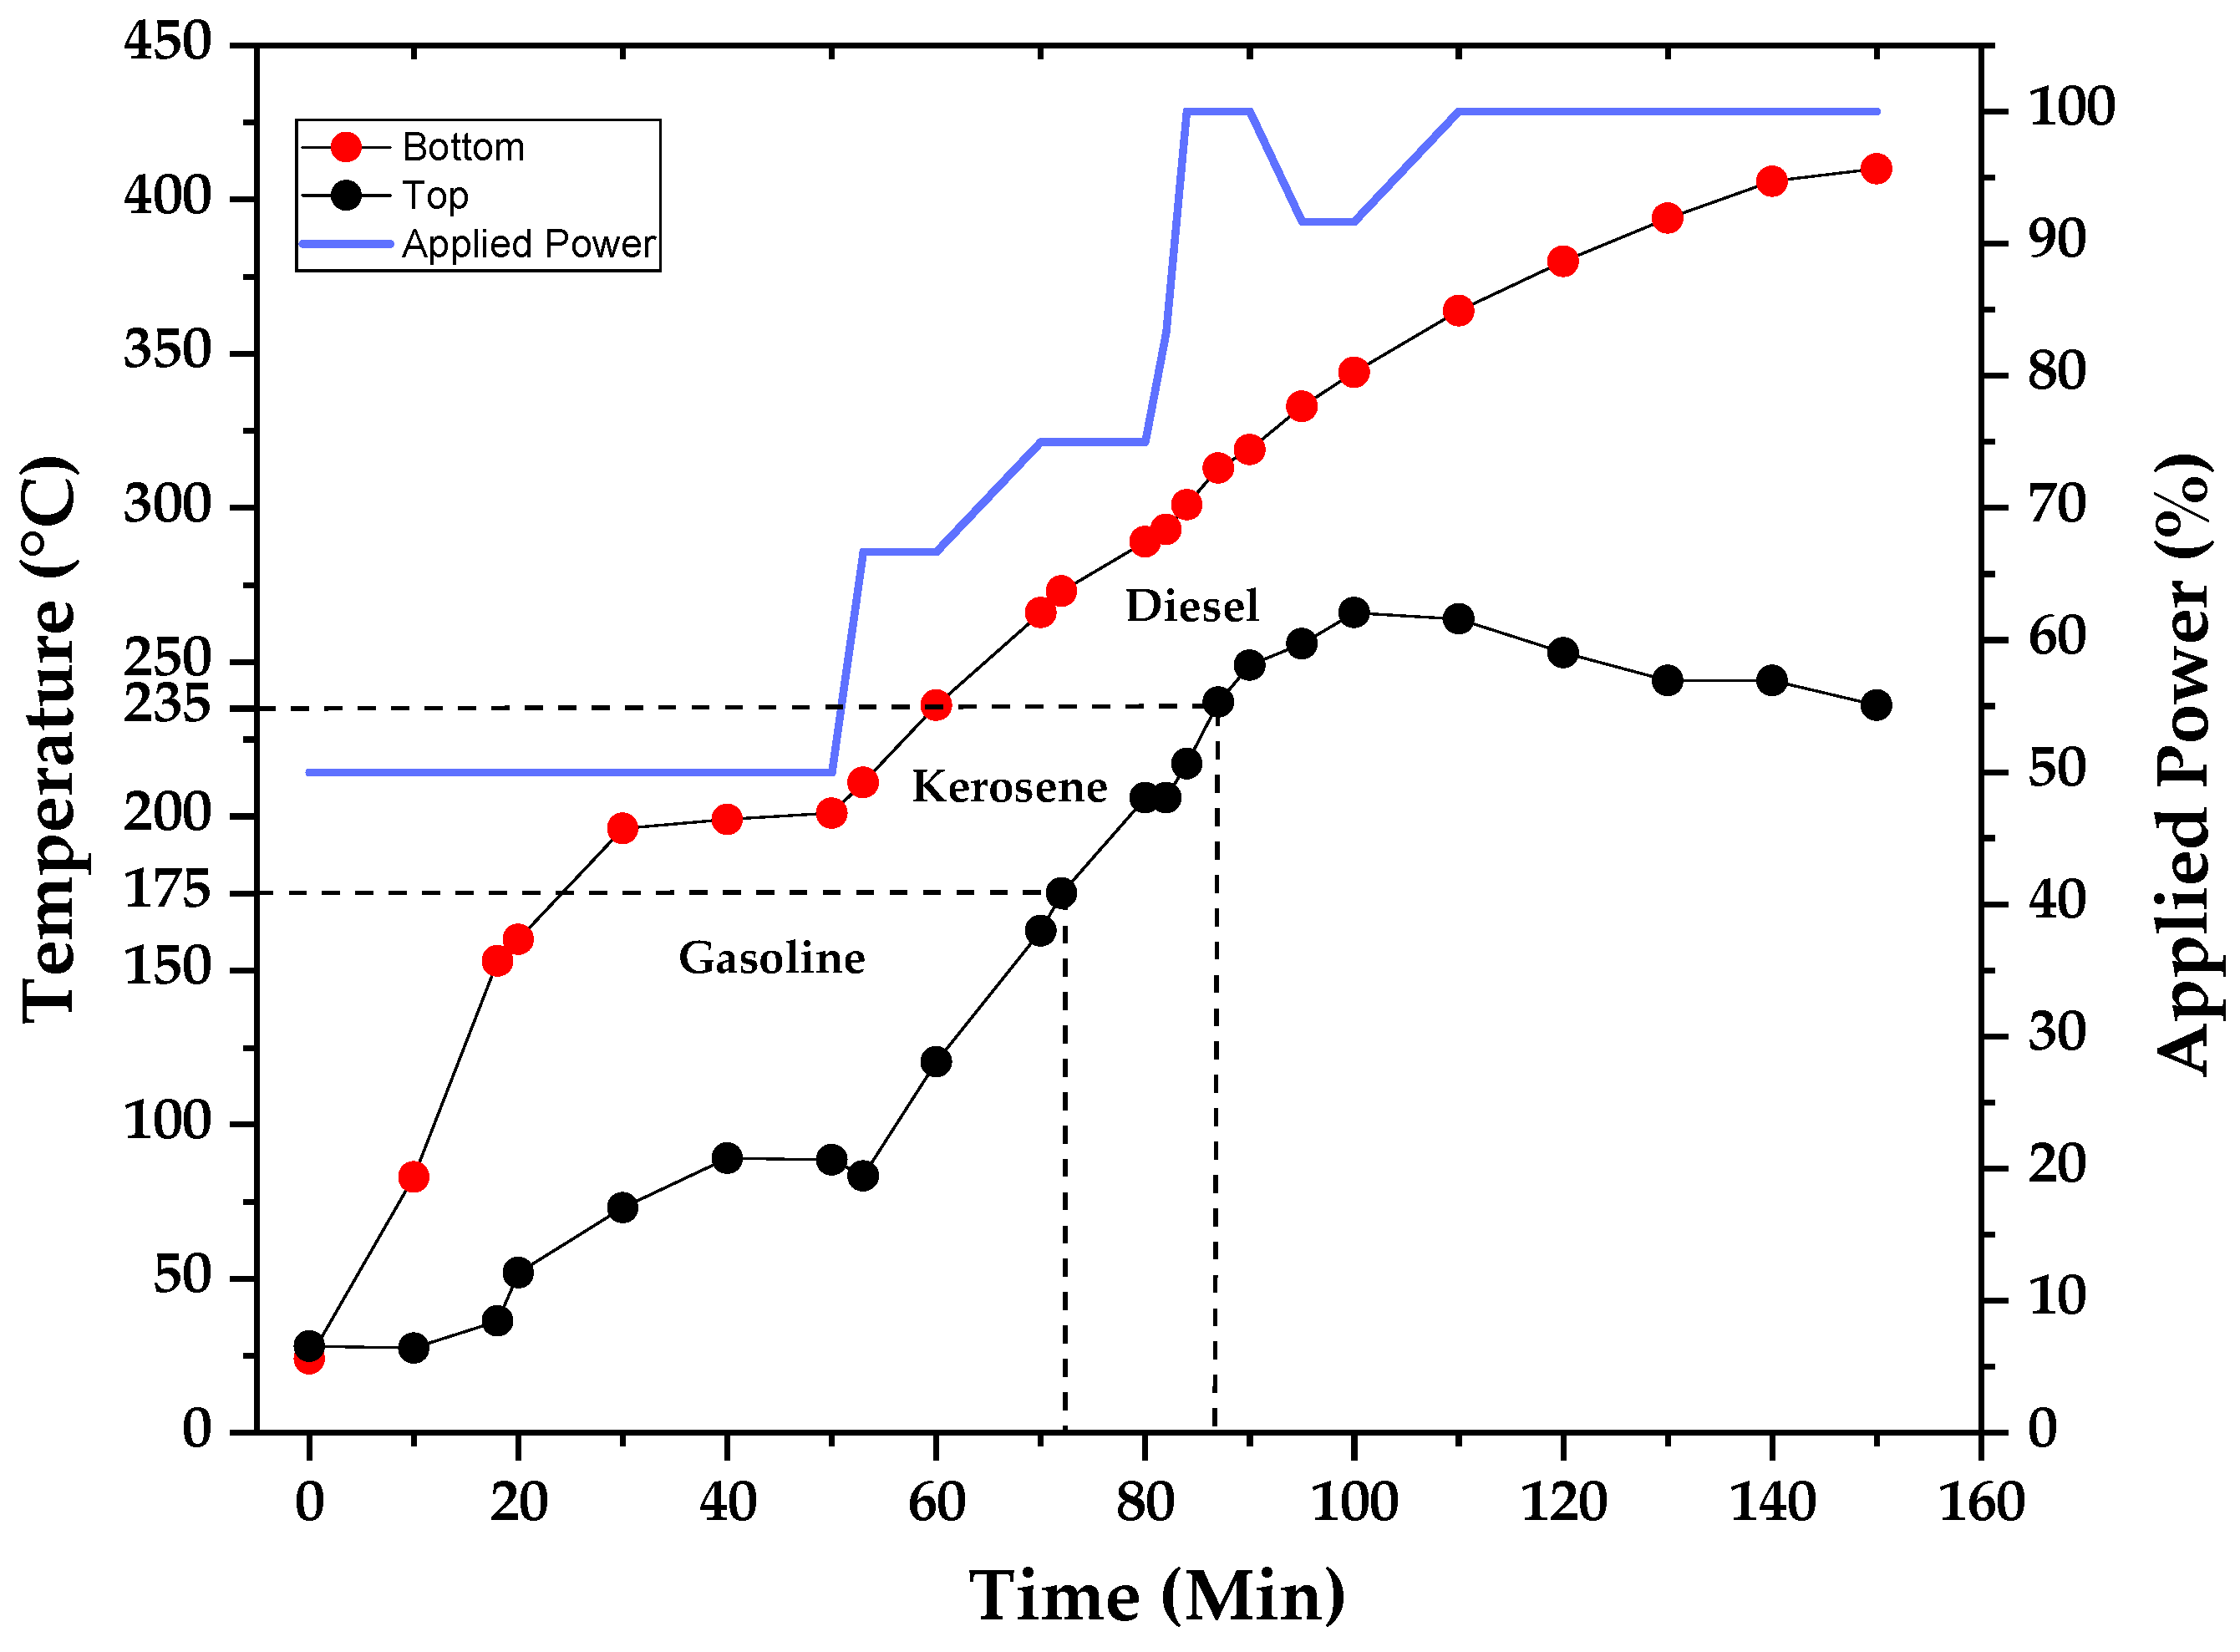
Figure 17), with physical–chemical properties such as viscosity in the range of the commercial kerosene normally used for the preparation of DPA. The distillation temperature profile and the applied power in the heating mantle are presented in the graph of
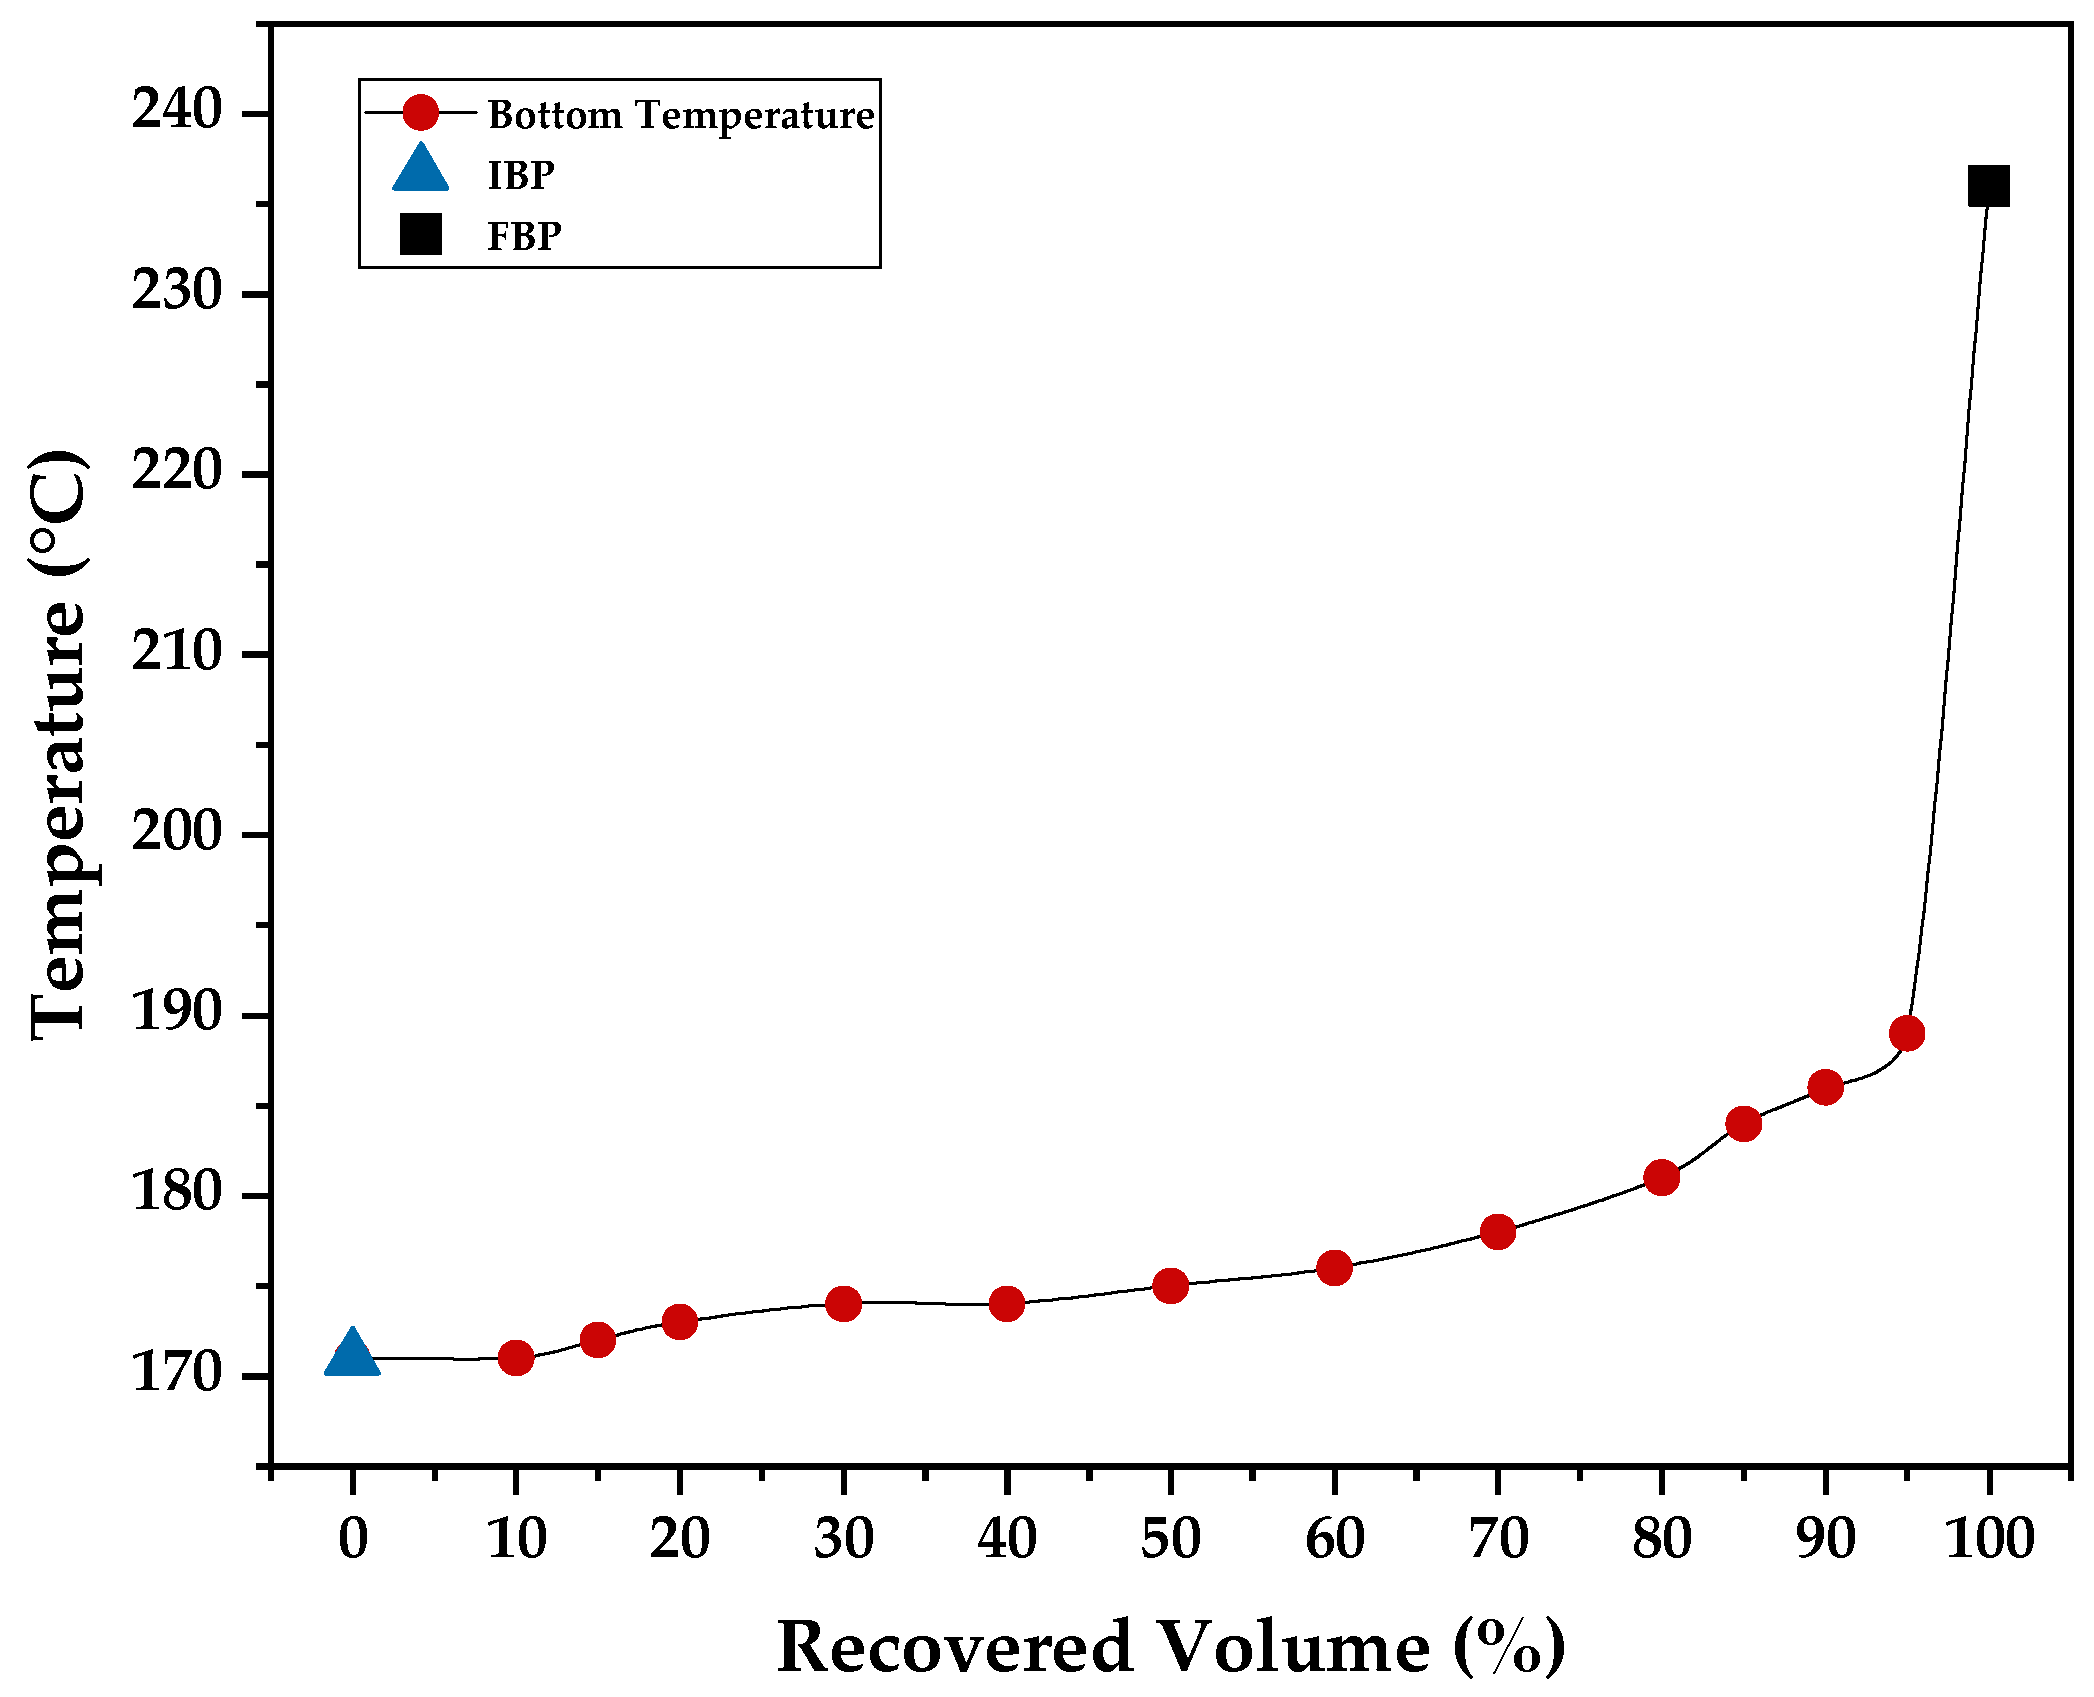
Figure 18, and it suggests the volatility of distilled fractions when compared to the distillation curve (
Figure 19) collected for commercial kerosene.
Distillation was carried out under partial reflux in order to obtain better purification of products and separated according to the top distillation column temperature. In a multi-component mixture, it is not possible to separate all the individual compounds present, especially when the boiling point of the compounds being separated is near each other (less than 20 °C) [
27]. As shown in
Table 11, WAF bio-oil is composed of more than 20 different compounds, and some of them present close boiling points. It is more feasible to separate the mixture into a boiling-point range in order to obtain lighter and purified fractions. Distillation of bio-oils from the pyrolysis of triglycerides can be achieved using different boiling-point ranges [
27,
28,
59,
60]. Lima et al. pyrolyzed vegetable oils in a stainless steel 5 L reactor and distilled its liquid fractions into four temperature ranges, namely BP < 80 °C; 80 °C < BP < 140 °C; and 140 °C < BP < 200 °C, and a heavy fraction (BP > 200 °C) [
59]. Anis et al. pyrolyzed waste cooking oil in a microwave-assisted reactor and distilled the bio-oil in a single-stage distillation, separating it into three fractions: gasoline (BP < 180 °C), kerosene (180 °C < BP < 230 °C), and diesel (230 °C < BP < 340 °C) [
60]. Suota et al. separated the bio-oil obtained from the pyrolysis of waste cooking oil into two fractions: light (BP < 220 °C) and heavy (BP > 220 °C) fractions [
28]. In a previous study, we pyrolyzed crude palm oil in a pilot plant and conducted fractional distillation of the bio-oil, separating it into three fractions, namely gasoline (BP < 175 °C), kerosene (175 °C < BP < 235 °C), and diesel (BP > 235 °C) [
27], so the same temperatures were used for separation of the fractions of this work’s bio-oil.
The applied power in the heating mantle was adjusted in order to obtain a smooth and continuous flow of distillates to the separating funnel. With the aid of the reflux valve, it is possible to regulate the flow of distillation, and an increase in the applied power only increases the reflux rate if the valve remains unchanged, obtaining better separation but increasing process time [
27]. High power in the heating mantle coupled with high reflux rates is not advisable though, since it can lead to temperature and vapor-flow increases in the condenser, possibly reducing liquid-fraction yields through losses in the vacuum adapter. With low applied power and a high reflux rate, better separation is achieved, and the temperature profile presented is a good indicator of the true boiling point of the compounds in bio-oil.
Table 12 compiles the physical–chemical properties of WAF, bio-oil, and distilled fractions at 400 °C and 10 min of reaction time. It can be observed that fractional distillation further reduces the density and viscosity of bio-oil in the distilled fractions by separating it from the heavy fraction.
Table 13 presents the yields of distilled fractions along non-condensable gases (NCG) and bottoms of distillation, representing the heavier fraction of bio-oil, corresponding to over 34 wt.%, and is probably responsible for a large part of the viscosity of 7.58 mm
2/s of the bio-oil. When compared with the values presented for commercial kerosene, it can be seen that the kerosene fraction presents similar viscosity to commercial kerosene, even though it presents higher values of density. From the acid values, it can be seen that distillation could reduce the acidity of gasoline fraction but not of kerosene and diesel, showing that acidic compounds have boiling points inside the range of kerosene and diesel, impeding the use of these distilled fractions for fuel without better or further purification.
Since WAF bio-oil is rich in C15 and C17 compounds, a high amount of diesel and bottom fractions of almost 70 wt.% were obtained, with NCG, gasoline, and kerosene corresponding to 30 wt.% of the bio-oil. Ferreira et al. conducted fractional distillation under partial reflux for crude palm-oil bio-oil and found yields of 5.8, 13.7, and 12.0 wt.% for the NCG, gasoline, and kerosene fractions, respectively, when using a distillation column of 30 cm [
27]. Even though crude palm oil is different than WAF and the pyrolysis was conducted in the presence of a catalyst (Na
2CO
3), both processes show similar fraction yields, since most oils and fats have similar composition. And, distillation yields are highly correlated to equipment and processing variables. Since similar conditions were used, like distillation column height and the use of partial reflux, similar yields were obtained. Similar physical properties were obtained for the different fractions. Ferreira et al. produced a gasoline fraction with 0.75 g/cm
3 and 1.25 mm
2/s, while the one produced in this work has a higher density of 0.77 g/cm
3 but a lower viscosity of 0.66 mm
2/s. Since WAF contains a higher proportion of saturated compounds, the differences in density and viscosity could be associated with the presence of a higher amount of saturated small volatile compounds in WAF gasoline than in palm bio-oil. The presence of small quantities of water in gasoline and kerosene fractions could also be related to higher densities when compared to the work of Ferreira et al., producing a systematic error in density measurement. Nevertheless, the kerosene and diesel fractions presented almost identical kinematic viscosity, and this parameter is important in the application of distillate fractions of waste oils and fats in the production of asphalt cutbacks. Kinematic viscosity is highly related to the capacity of the cutback to penetrate deeply into the base pavement layer and effectively create the prime coat and bind the asphalt cement layer [
61,
62]. When one is using waste as a feedstock of a determined chemical process, one should expect higher variability of composition and properties of the feed, and adequate characterization is paramount. Since crude palm bio-oil and WAF bio-oil can produce kerosene and diesel fractions of similar kinematic viscosity, reducing the variability of feedstock properties, it shows one advantage of upgrading waste oils to their bio-oils counterparts via pyrolysis process for this application.
The chemical composition of gasoline, kerosene, and diesel fractions of WAF bio-oil are presented in
Table 14,
Table 15 and
Table 16, respectively. As was commented on in
Section 2.4, these results are from bio-oil obtained at 400 °C and 10 min of reaction time. It is possible to observe that distilled fractions are enriched in hydrocarbons, and acid content is minimized when WAF bio-oil is distillated. Maybe more important is the reduction in high boiling-point compounds that are left in the boiling flask as a heavy oil. The area of the chromatogram of fatty acids went from 23% to 21, 31, and 13% for the gasoline, kerosene, and diesel fractions, respectively. Strangely enough, the acid value of the distilled fractions shows the opposite direction, with a lower acid value for gasoline and a higher for diesel. This difference can be explained by the nature of the fatty acids present for each fraction. Gasoline and kerosene are rich in lower molecular weight fatty acids (C5–C9 fatty acids), while diesel contains higher molecular weight fatty acids, such as decanoic and tetradecanoic acid. Nevertheless, all distilled fractions contain decanoic acid as the major fatty acid present.
The gasoline fraction presented an 83 area.% of hydrocarbons, and it is the only fraction containing cyclic hydrocarbons. Indeed, cyclic hydrocarbons usually present boiling points in the gasoline range, and fractional distillation was capable of separating all cyclic compounds formed in the gasoline fraction. It can be observed that the enrichment of lower boiling-point compounds, such as C8–C12 hydrocarbons, improves the volatility and reduces the viscosity of the WAF gasoline. Nevertheless, the compound with a higher area.% is pentadecane in all three distilled fractions.
The kerosene fraction presented a higher area.% of fatty acids, showing that a majority of the fatty acids present in WAF bio-oil are in the kerosene boiling-point range (175 < BP < 235 °C). Distilled fractions containing high amounts of fatty acids and high acid values should present an interesting solvent in the preparation of asphalt cutbacks. Moreover, conventional MC-30 asphalt cutbacks are usually prepared with petroleum kerosene [
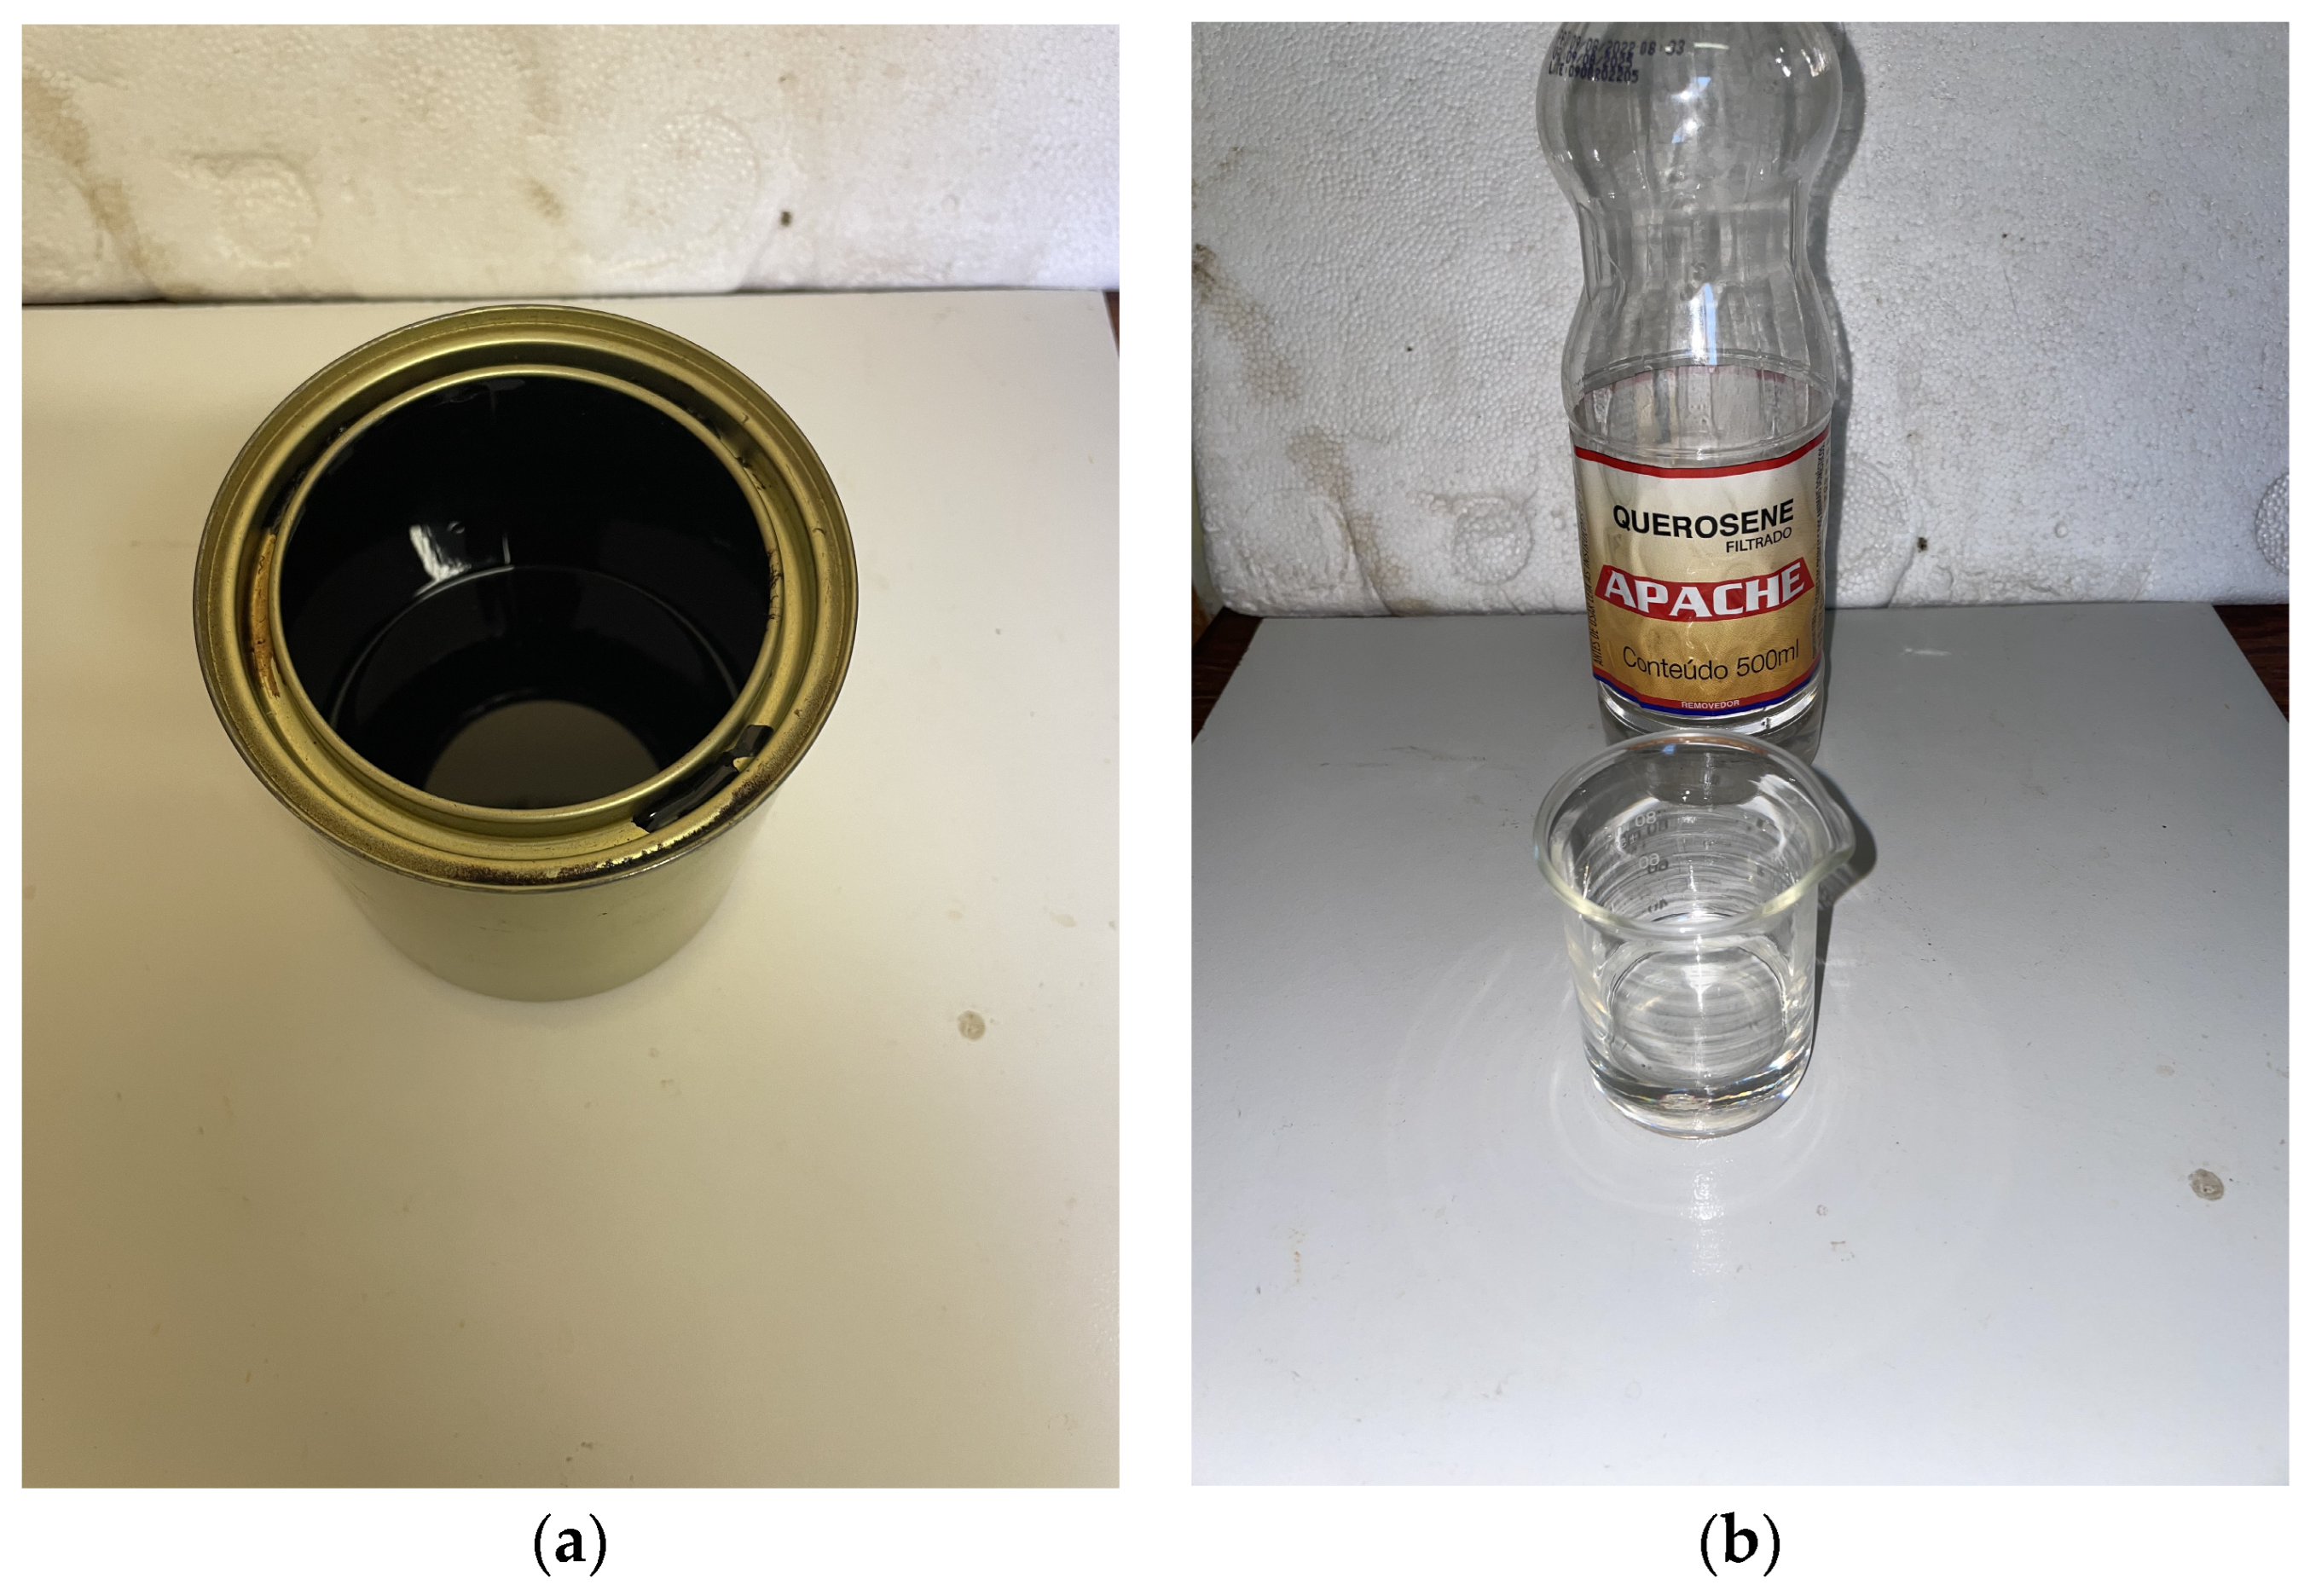
61], so a solvent with physical–chemical properties similar to petroleum kerosene should produce the best results with regard to penetrative ability and curing time. The obtention of a bio-solvent similar to kerosene but with a high acid value (rich in fatty acids) is an interesting way to check if the acidity of the solvent could improve or deteriorate the quality of the prime coat applied using the bio-solvent.
The diesel fraction is shown to contain the higher boiling-point compounds, and as was shown in
Table 13, it presents the majority of compounds produced in WAF pyrolysis, together with the bottom distillation fraction. It is the fraction with larger amounts of heptadecane and the only fraction containing octadecane. The physical–chemical properties of this diesel fraction and its chemical composition reveal that diesel presents similar properties to the kerosene fraction and is a light diesel fraction, rich in compounds near the beginning of the distillation cut (BP > 235 °C). Indeed, the distillation curve of fractional distillation shows that the majority of the diesel compounds were collected below 270 °C, and the diesel fraction is a good candidate for a diluent in the preparation of asphalt cutbacks. It was possible to separate 2-heptadecanone from the other fractions, and diesel was the only fraction where this compound was detected.
3.3. Application in Asphalt Cutback
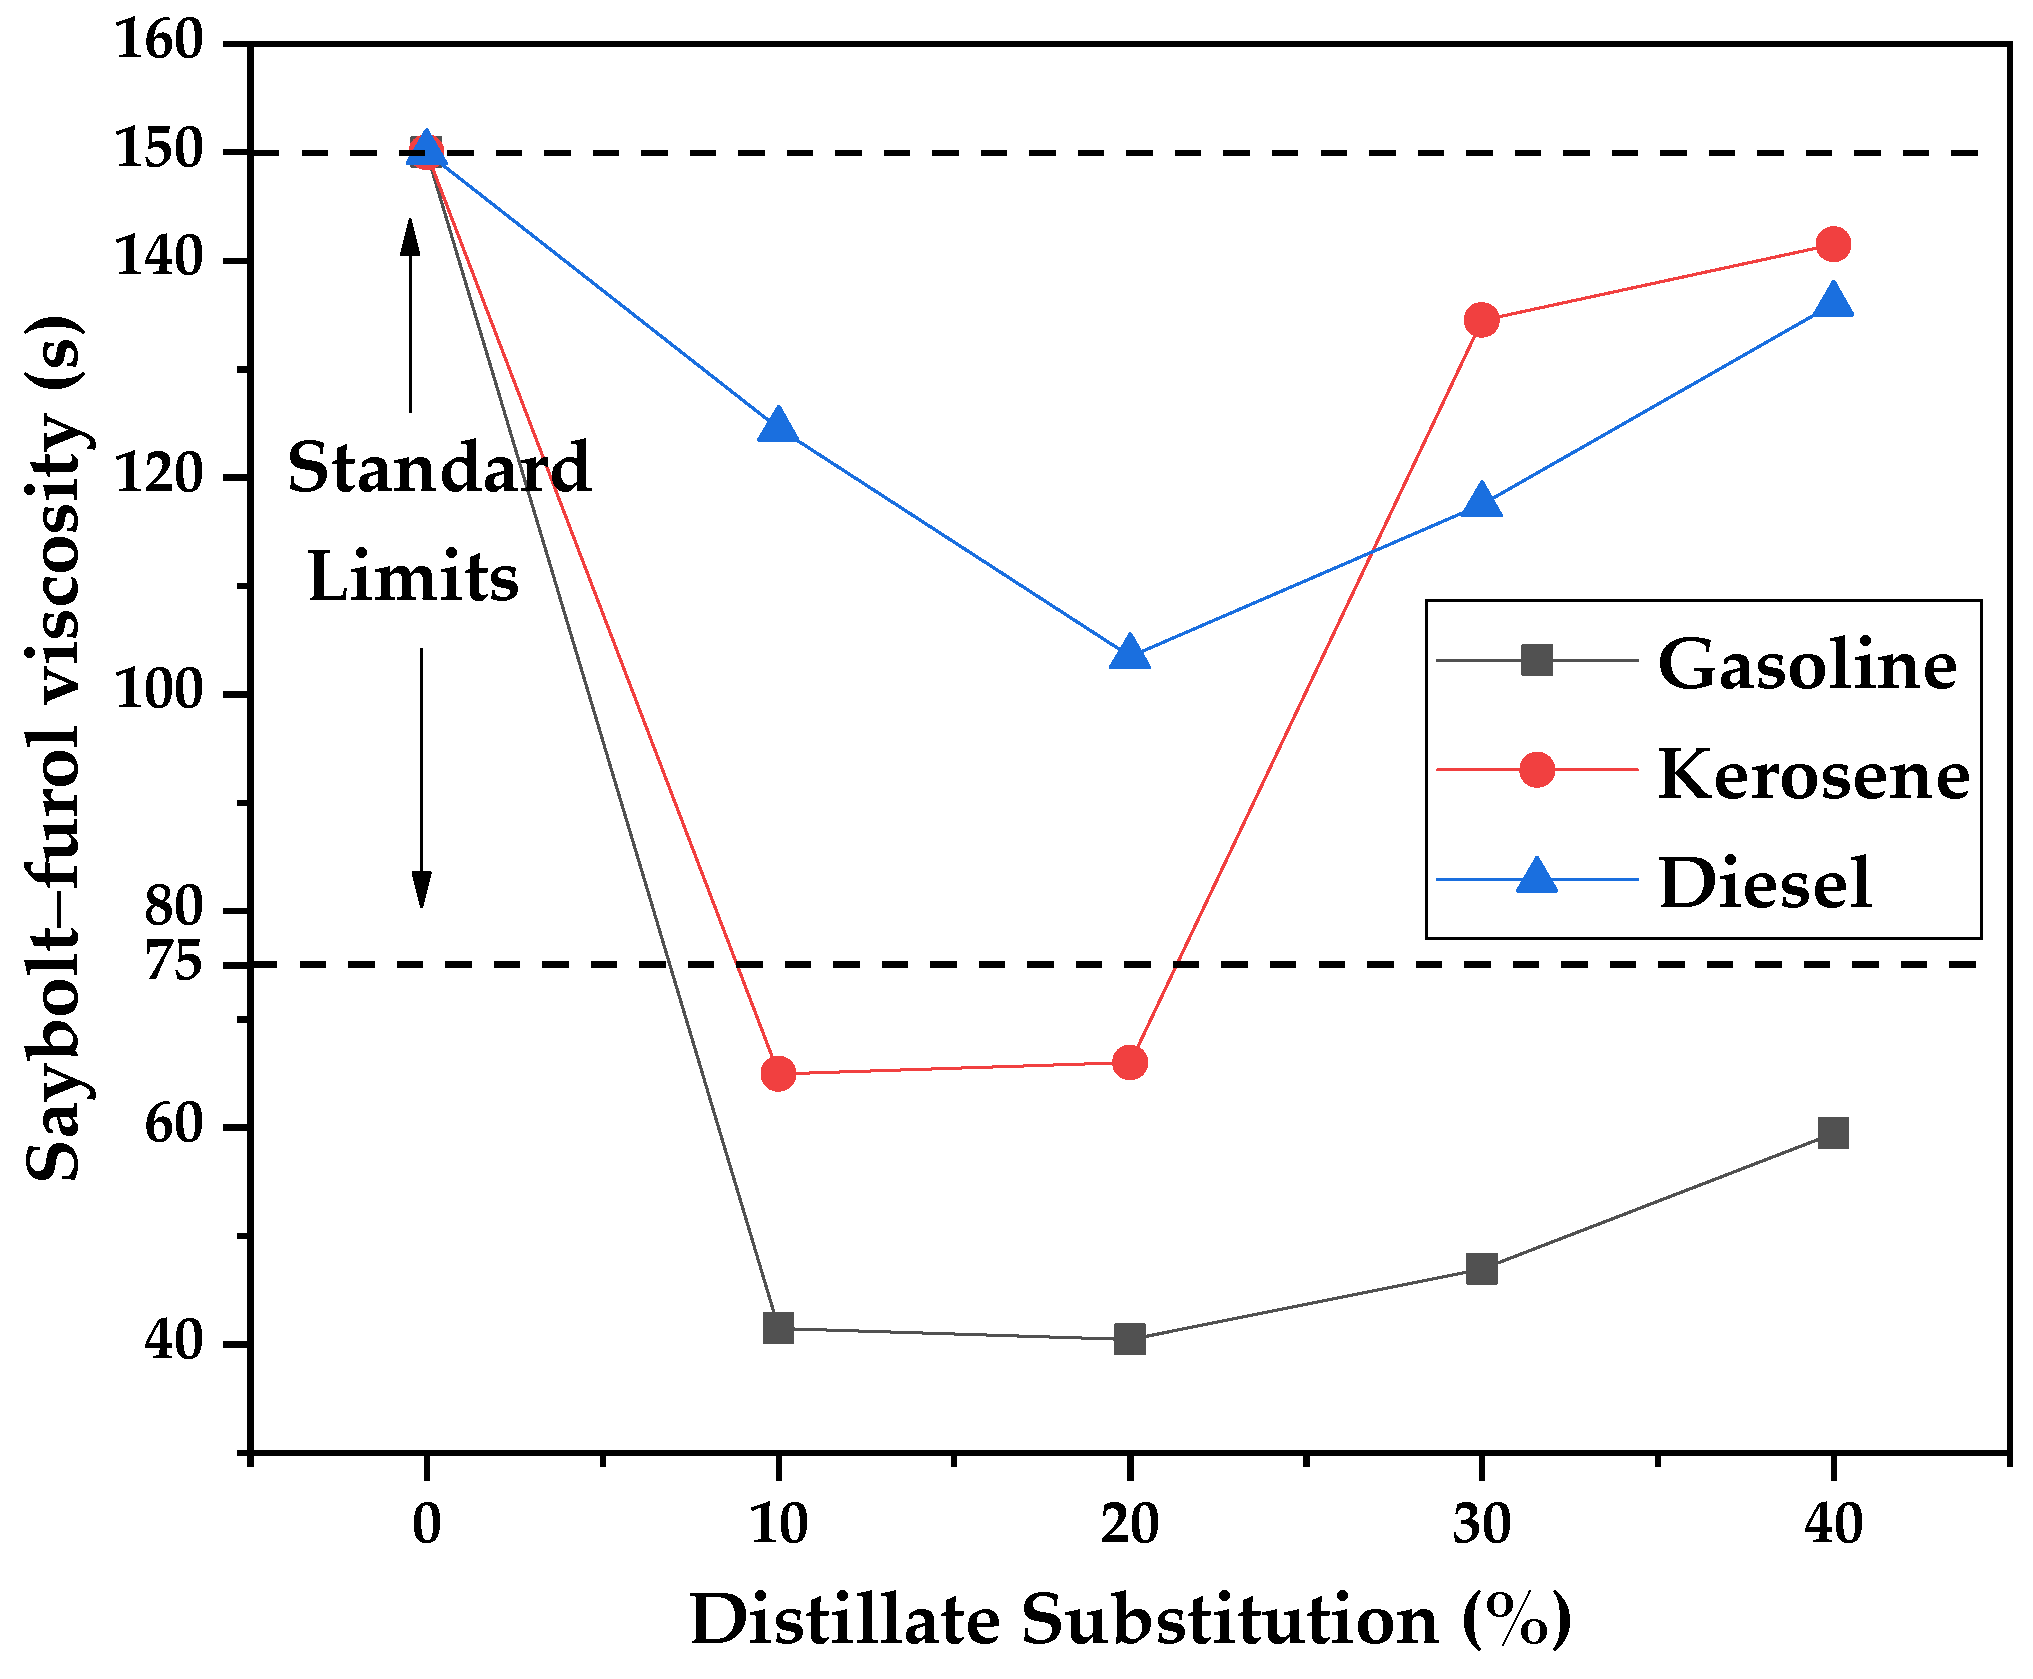
The prepared asphalt cutbacks were characterized according to Saybolt–Furol viscosity, dynamic viscosity, and flash points before conducting the priming assays. The Saybolt–Furol viscosities of commercial kerosene and their mixtures (10 to 40%) of distilled fractions are presented in the form of a graph in
Figure 20. Commercial kerosene presented a standard value of 150 s for its viscosity and 59.5, 141.5, and 136 for pure gasoline, kerosene, and diesel, respectively. Except for the gasoline fraction, kerosene and diesel presented viscosities inside the range of 75–150 s, as defined in the DNER standard for DPAs [
47,
48,
49,
50,
51,
52]. As for the mixtures, a synergic effect is observed, where the mixtures presented lower values than the pure DPAs. It was expected that mixtures would present values between the ones presented by commercial kerosene and the pure distilled fractions.
Analogous to the way Saybolt–Furol viscosities are presented, the kinematic viscosity determined from the dynamic viscosity obtained with the rheometer and calculated considering the average density of samples is presented in
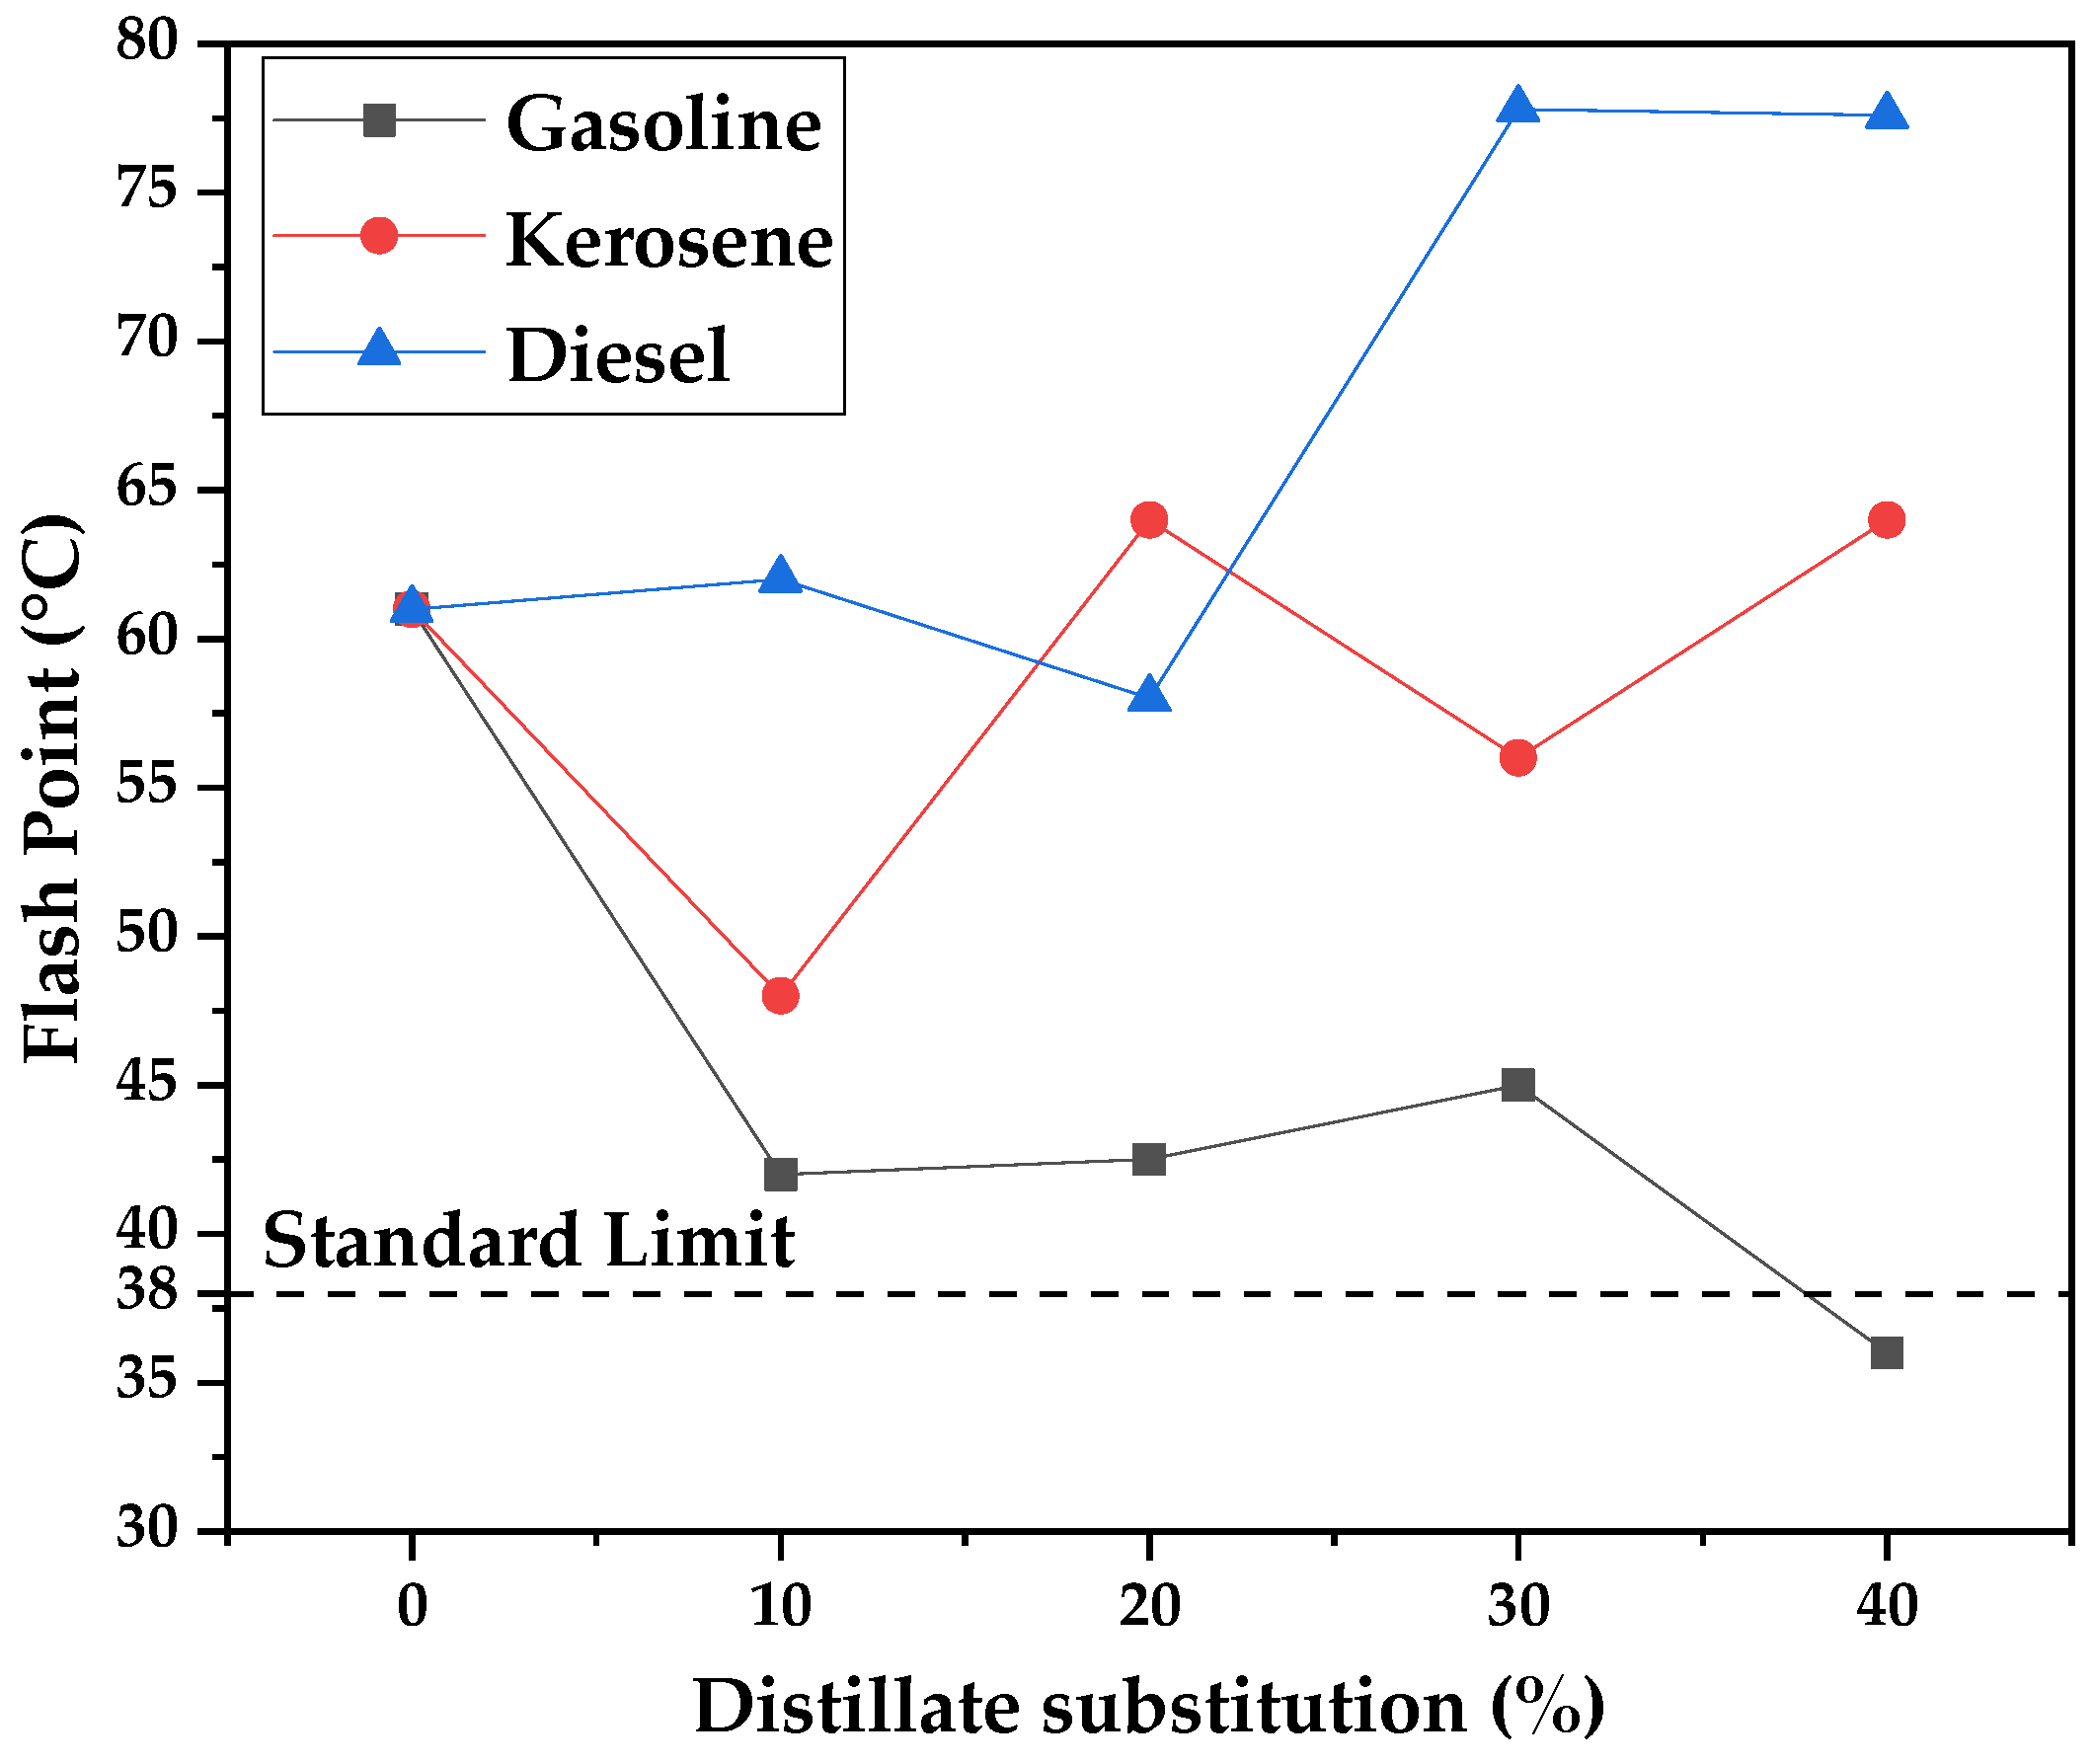
Figure 21, and the flash points are presented in
Figure 22. The same synergic effect was observed for the kinematic viscosity of the mixtures. The kinematic viscosity of standard DPA (prepared with commercial kerosene) was 45.6 mm
2/s, and except for diesel, only the mixtures prepared with pure or almost pure (30%) kerosene presented values inside the kinematic viscosity range of standard DPAs. The diesel mixtures all presented values inside the range, showing that they could be used as a full substitute for commercial kerosene in the preparation of DPAs. Indeed, the graph in
Figure 18 shows that the diesel fraction was obtained near boiling points of lighter fractions, from 235 to 260 °C, and it corresponds to a lighter fraction of diesel, similar to commercial kerosene. Pure gasoline presented a kinematic viscosity of 70 mm
2/s, and this could indicate that gasoline was not capable of adequately dissolving and diluting the petroleum asphalt.
Flash point is a measurement of the volatility and flammability of liquids, and a minimum value of 38 °C is necessary for the adequate evaporation of the DPA solvent when conducting the soil priming. Lower flash points could be dangerous when applying the mixtures due to fire hazards. Even though the standard does not establish a maximum value, high flash points mean that the diluent is of insufficient volatility, and priming could take longer or never happen. In order to avoid that distilled fractions DPAs with a similar volatility to the standard DPA (61 °C) should be used. It can be seen from
Figure 22 that an increase in the gasoline fraction tends to lower flash-point values, since a high degree of volatility is found for gasoline. Meanwhile, for kerosene and diesel, an increase in distillate substitution increases the flash points. Nevertheless, even with the use of pure kerosene and diesel fractions, the flash point is still near the flash point presented by the standard, of 64 and 77.6 °C, respectively.
3.4. Priming Assays
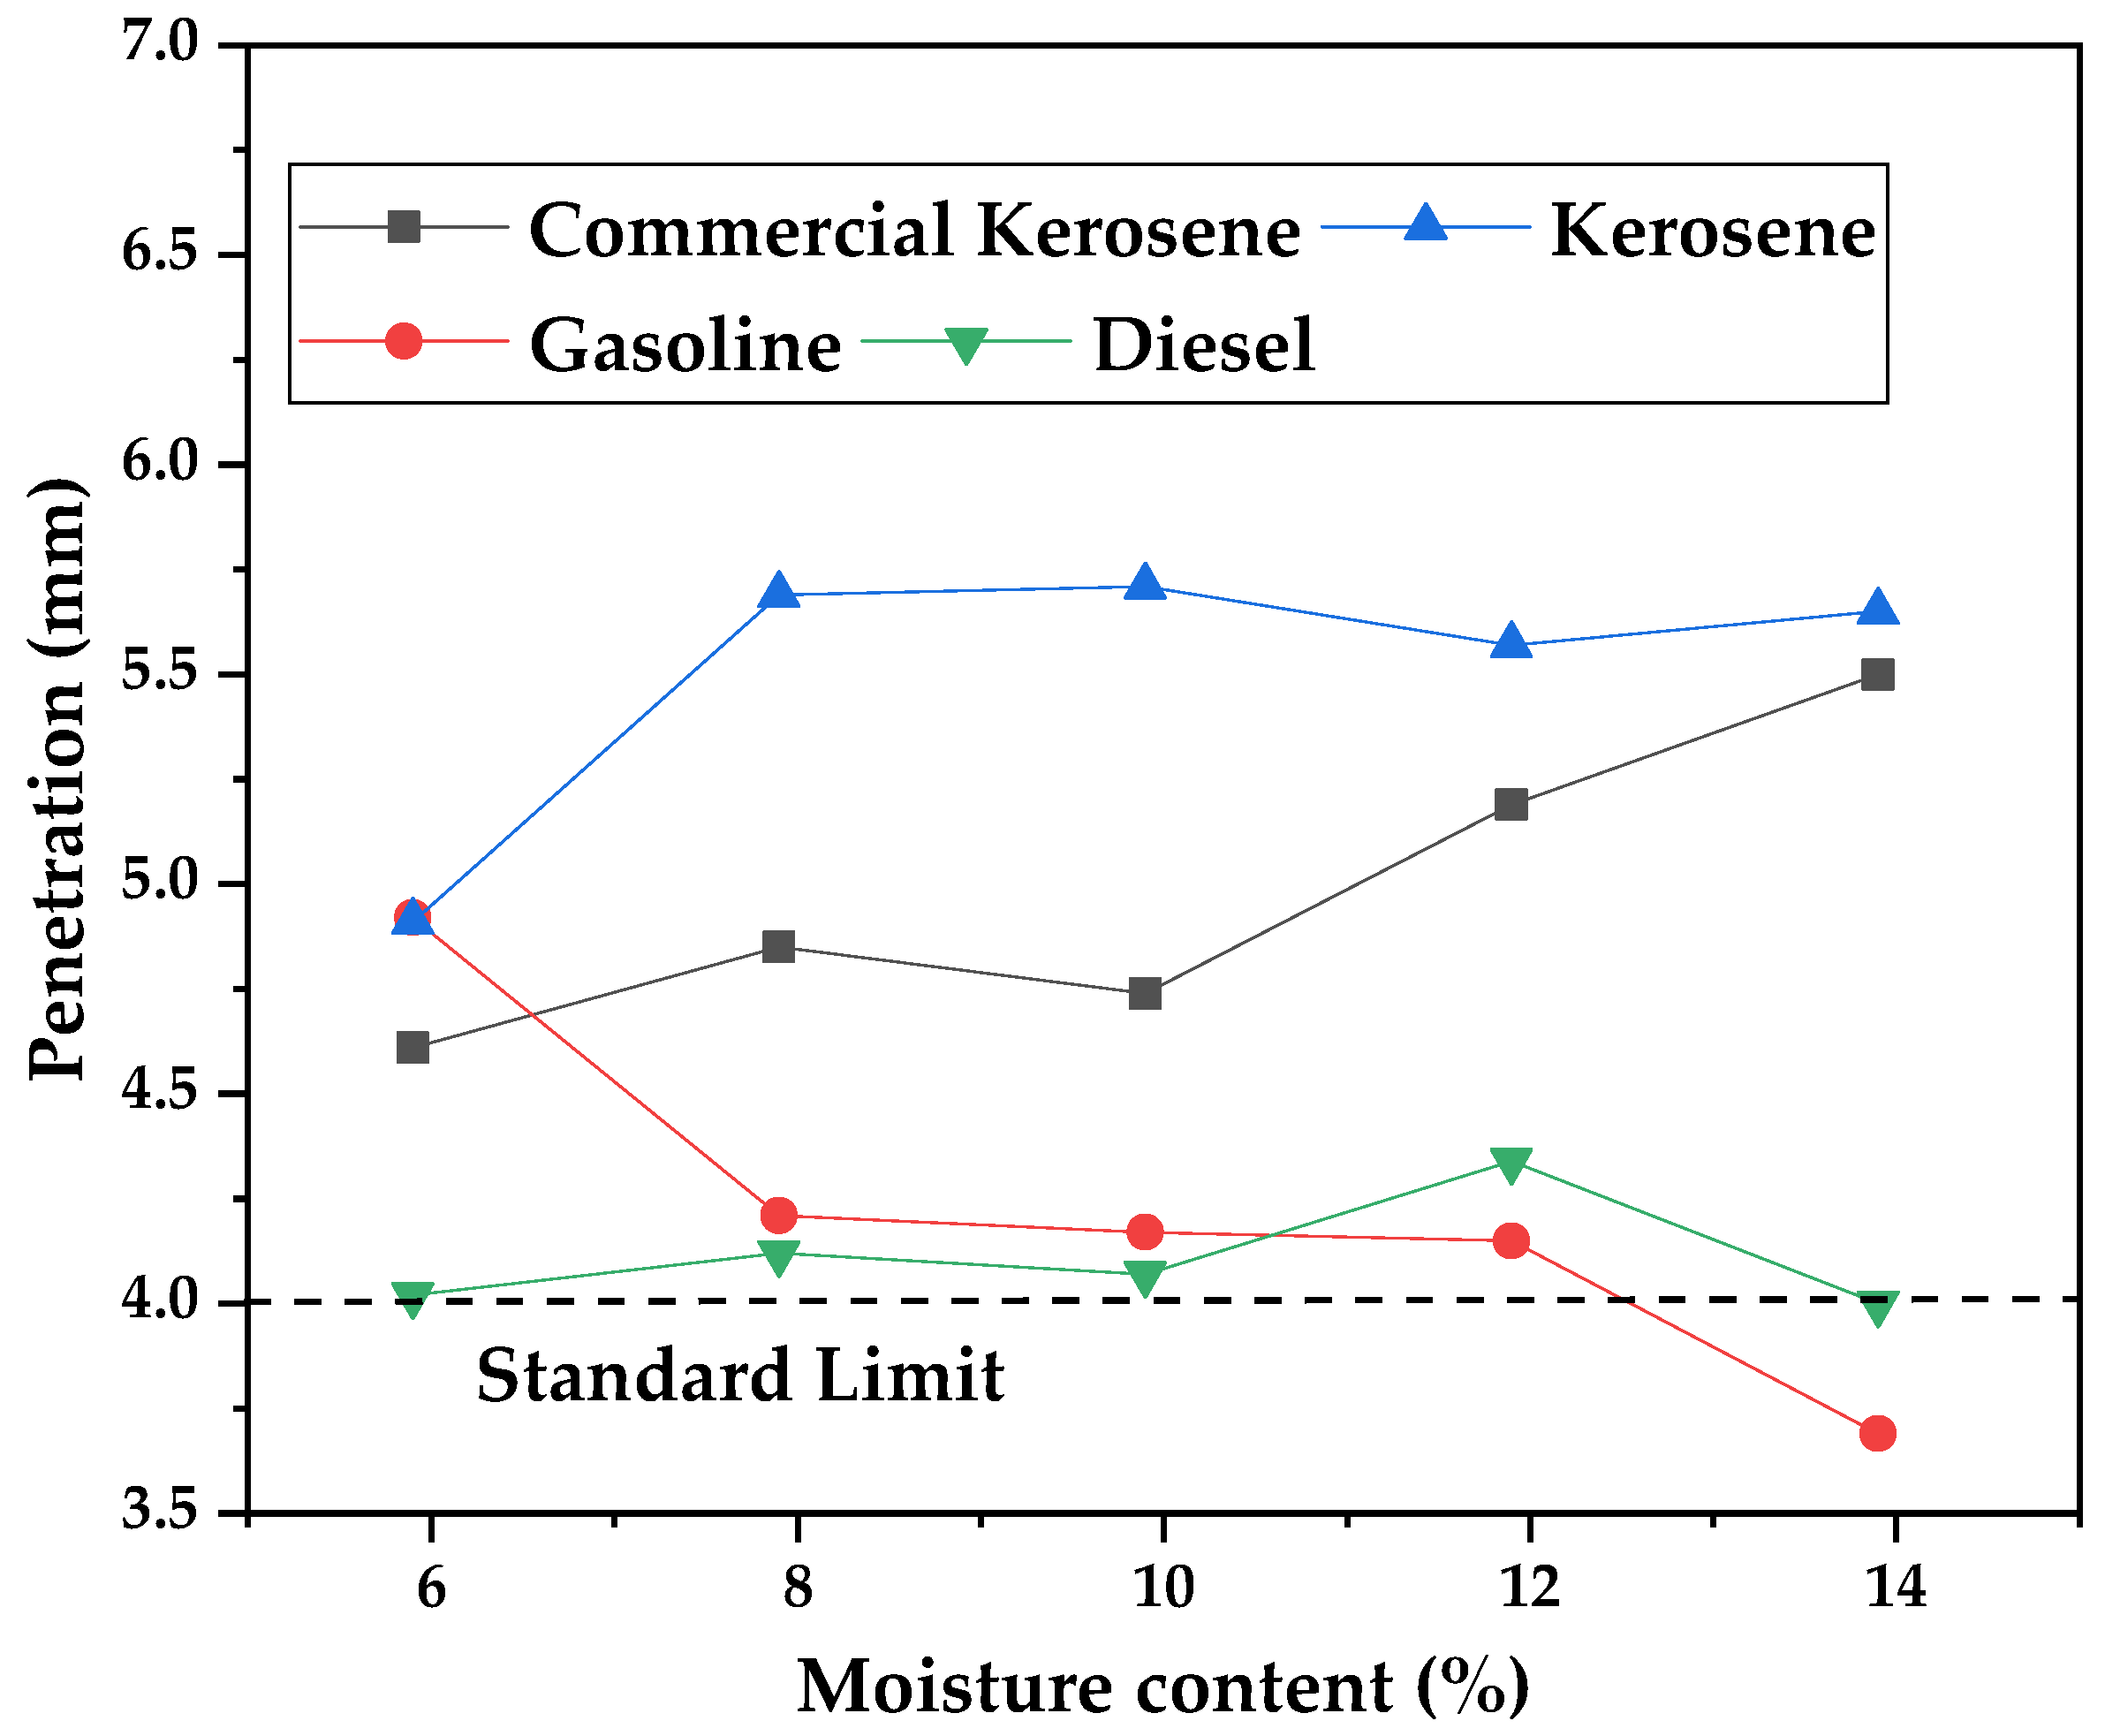
Since some mixtures of commercial kerosene and WAF bio-oil distillate fractions presented synergic effects for the measurements made and could not meet the standard of viscosity, it was decided that only the pure distillate fractions would be used in the priming assays. The results of the DPA’s penetration (mm) in the soil are presented in the graph of
Figure 23 as functions of the moisture content of the soil. The priming assays with different distillates were also used to evaluate the influence of the acid value of the samples at penetration depth. As shown in
Table 12, distillates have different acid values, with 12 for gasoline, 84 for kerosene, and 96 mg KOH/g for diesel distillates, against near-zero acidity in the case of commercial kerosene (5 mg KOH/g).
It can be observed that there are similar behaviors for commercial and pyrolysis kerosene and increasing penetration with the increase of moisture levels in the soil. For commercial kerosene, values between 4.61 and 5.50 mm were observed. It is important to note that penetration was higher for pyrolysis kerosene, indicating the superior performance of the application. As observed for gasoline and diesel, an inferior penetration is observed, probably due to the higher volatility of gasoline, curing the DPA in less time and, consequently, reducing soil penetration. The diesel samples showed lower penetration values due to the presence of long-chain compounds, exemplified by the higher boiling point of diesel and increased viscosity when compared with the other distillates. This increased viscosity should interfere with the penetration of petroleum asphalt into the soil, especially during curing time. It is important to note though that all distillates presented adequate penetration values when compared with the academic literature [
63,
64]. Zhang et al. evaluated the penetration of traditional emulsified asphalt and found a value of 4.2 mm after 72 h [
63]. Ouyang et al. evaluated the penetration in the soil of asphalt emulsions and found values in the range of 3.85–7.76 mm [
64]. These results show that all distillate fractions could be used as substitutes for commercial kerosene in the preparation of DPA when considering only the penetration depth in laterite soils.
When considering the acid value of the samples, no difference in curing time was observed, with all prime coats cured in the specified time of the method. At penetration depth, as was already discussed, the penetration depth of pyrolysis kerosene was higher than commercial kerosene, and the synergistic effect observed when mixing commercial kerosene with pyrolysis distillates could be related to the fatty acid content of pyrolysis oil. Elkadri et al. studied the influence of different emulsifiers in prime coat systems and showed that cationic emulsifiers produced better results for penetration depths due to superior mixing and the consequent reduction of the droplet sizes in the emulsion [
43]. While emulsion prime systems are different than cutbacks, a possible interaction of fatty acids and hydrocarbons present in kerosene could explain why mixtures of commercial kerosene and pyrolysis oil show reduced viscosity beyond even the separate mixtures. The penetration depths also show a different trend when compared to the work of Barroso et al., which showed a decreasing penetration depth with the increase in soil moisture [
65]. Meanwhile, for most samples containing pyrolysis oil, the penetration depth increased with the moisture levels. The penetration depths in the test specimens are related to water surface tension, which is related to the physical–chemical properties and composition of the tested soil. Different soils generate different dynamics of diffusion of the cutback into the base layer, generating different results of penetration depending on the moisture level. The work of Mantilla and Button, explaining the effect of moisture levels on the penetration depths of prime coat systems, shows practically no effect of moisture levels in the penetration of standard MC-30 cutback, pointing once more to the variability of this type of data [
61].
The asphalt cutback prepared with pyrolysis oil kerosene presented a higher penetration depth of between 8 and 14% of soil moisture when compared to commercial kerosene, its closest in kinematic viscosity and volatility. In
Table 12, the kinematic viscosity of pyrolysis kerosene is 1.78 mm
2/s, and for commercial kerosene, it is 1.43 mm
2/s. Meanwhile, the flash-point measurement (
Figure 19) shows flash points of around 60–65 °C for both solvents. The higher penetration in intermediate values of moisture could be related to the fatty acid content of pyrolysis kerosene. Fatty acids are known emulsifiers due to their mixed polar and non-polar nature [
41]. The carboxylic group of fatty acids may interact with water in the soil and change its surface tension, improving penetration. Even though they display acidity, gasoline and diesel produced prime coat systems with less penetration than commercial or pyrolysis kerosene. This could be related to the low acid value of gasoline and added volatility, reducing penetration once the cutback cures faster. In the case of diesel, it shows the highest acidity of all the solvents but also increased viscosity (3.77 mm
2/s), reducing penetration. Nevertheless, all solvents produced prime coats capable of penetrating 4–5 mm deep into the base layer, which is considered acceptable for the application of asphalt cutbacks.
