Article

Technoeconomic Assessment of Biogas Production from Organic Waste via Anaerobic Digestion in Subtropical Central Queensland, Australia

1
School of Engineering and Technology, Central Queensland University, Rockhampton, QLD 4701, Australia
2
Centre for Hydrogen and Renewable Energy, Central Queensland University, Rockhampton, QLD 4701, Australia
3
School of Business and Law, Central Queensland University, Rockhampton, QLD 4701, Australia
*
Author to whom correspondence should be addressed.
Energies 2025, 18(17), 4505; https://doi.org/10.3390/en18174505
Submission received: 29 May 2025 / Revised: 18 August 2025 / Accepted: 22 August 2025 / Published: 25 August 2025
(This article belongs to the Special Issue Biomass and Bio-Energy—2nd Edition)

Abstract

This study evaluates biogas production through the anaerobic digestion of food waste (FW), cow dung (CD), and green waste (GW), with the primary objective of determining the efficacy of co-digesting these organic wastes commonly generated by households and small farms in Central Queensland, Australia. The investigation focuses on both experimental and technoeconomic aspects to support the development of accessible and sustainable energy solutions. A batch anaerobic digestion process was employed using a 1 L jacketed glass digester, simulating small-scale conditions, while technoeconomic feasibility was projected onto a 500 L digester operated without temperature control, reflecting realistic constraints for decentralized rural or residential systems. Three feedstock mixtures (100% FW, 50:50 FW:CD, and 50:25:25 FW:CD:GW) were tested to determine their impact on biogas yield and methane concentration. Experiments were conducted over 14 days, during which biogas production and methane content were monitored. The results showed that FW alone produced the highest biogas volume, but with a low methane concentration of 25%. Co-digestion with CD and GW enhanced methane quality, achieving a methane yield of 48% while stabilizing the digestion process. A technoeconomic analysis was conducted based on the experimental results to estimate the viability of a 500 L biodigester for small-scale use. The evaluation considered costs, benefits, and financial metrics, including Net Present Value (NPV), Internal Rate of Return (IRR), and Dynamic Payback Period (DPP). The biodigester demonstrated strong economic potential, with an NPV of AUD 2834, an IRR of 13.5%, and a payback period of 3.2 years. This study highlights the significance of optimizing feedstock composition and integrating economic assessments with experimental findings to support the adoption of biogas systems as a sustainable energy solution for small-scale, off-grid, or rural applications.

1. Introduction

The rising demand for sustainable energy and the environmental impacts of fossil fuels have driven global interest in renewable alternatives [1]. Among these, biogas production via anaerobic digestion is particularly attractive because it simultaneously provides clean energy and manages organic waste [2]. In anaerobic digestion, microorganisms decompose organic matter in the absence of oxygen, generating a biogas mainly composed of methane (CH4) and carbon dioxide (CO2) [3]. This process not only reduces waste volume, but also captures methane that would otherwise escape into the atmosphere as a potent greenhouse gas.
Anaerobic digestion systems are especially valuable in decentralized settings, such as rural and peri-urban communities, where both waste management and energy access are limited. A wide range of feedstocks—including agricultural residues, municipal solid waste, food waste (FW), cow dung (CD), and green waste (GW)—have been explored for biogas generation. Each feedstock has distinct characteristics that affect digestion efficiency, nutrient balance, and methane yield [4].
Co-digestion, the simultaneous digestion of multiple feedstocks, has proven more effective than mono-digestion. By combining substrates with complementary properties, such as FW, CD, and GW, co-digestion enhances nutrient balance, stabilizes the digestion process, and improves methane production. For instance, the co-digestion of FW with agricultural residues, including cow dung, can improve methane yield by approximately 35% compared to mono-digestion [4]. This improvement is attributed to better nutrient balancing, enhanced microbial interactions, and increased overall stability in the anaerobic digestion process. Pilarska et al. [5] emphasized the role of the carbon-to-nitrogen (C:N) ratio in optimizing microbial activity, demonstrating that a C:N ratio of approximately 25:1 maximized methane production from food waste, a finding that directly informed feedstock ratio selection in the present study.
Despite these advantages, most previous studies have been conducted under tightly controlled laboratory environments or at larger digester scales with active temperature regulation. Such conditions do not reflect the realities of small-scale, low-cost digesters commonly used by rural households and small farms, where temperature control and infrastructure are limited. In addition, while many studies have examined the co-digestion of FW and livestock manure, fewer have considered the combined role of FW, CD, and GW, especially under passive, fluctuating ambient temperatures typical of subtropical regions. This creates uncertainty about how these substrates interact in small-scale digesters, how stable methane production can be achieved without external heating, and whether such systems are economically viable for households and smallholders.
Central Queensland, Australia, provides an ideal context to investigate this gap due to its subtropical climate (18–35 °C) and the common generation of FW, CD, and GW in households and on small farms. However, there is little empirical evidence on how these local feedstocks perform when co-digested under realistic, small-scale conditions without active control. Furthermore, technoeconomic evaluations of such systems in subtropical Australia remain limited, leaving questions about their affordability, payback, and scalability unanswered.
This study addresses these gaps by experimentally assessing the co-digestion of FW, CD, and GW in small-scale AD systems without temperature regulation. The objectives are to (i) determine suitable feedstock ratios for enhanced methane yield and digestion stability and (ii) evaluate the technoeconomic feasibility of scaling the system to a 500 L biodigester for decentralized applications in rural and peri-urban communities. The findings are intended to inform the design of practical and cost-effective biogas systems that improve both energy access and organic waste management in subtropical regions.

2. Materials and Methods

2.1. Sample Collection

FW was collected from various households in Rockhampton, Australia, located at the coordinates (−23.375000, 150.511673). Fresh household waste was initially deposited into a bin designed for food and kitchen waste. Contaminants such as large bones, plastic wrappers, glass, rubber, metals, and other non-biodegradable materials were carefully separated and discarded. From there, the FW was sorted to remove any large inorganic or hard contaminants. Once the waste was homogeneously mixed, samples were taken and stored in clean containers, which were then immediately placed in a laboratory refrigerator. The FW samples typically weighed around 2 kg per collection batch.
FW was co-digested with two different types of waste, cow dung waste (CW) and green waste (GW). CW was collected from local dairy cow barns in Rockhampton, specifically from pens housing lactating Holstein-Friesian cattle. Approximately 2 kg of fresh CW was collected in total. GW was collected through a colleague via personal communication. It primarily included grass clippings, tree leaves, and small pruned twigs from residential gardens, totaling about 1 kg.

2.2. Sample Preparation and Homogenization

Figure 1 shows the standard protocol used to homogenize and prepare the waste samples. The newly gathered FW sample was initially placed in a lab refrigerator at 4 °C for a day for preliminary homogenization. After that, it was warmed to room temperature. Prior to chopping, visible non-organic materials such as eggshell fragments, bones, and plastic residues were removed. The sample was finely chopped using a kitchen knife and then shredded into particles with a ~6 mm average size.
An empty beaker was pre-weighed and used to record sample mass before blending. The moisture content of FW was estimated at 90%, and volatile solids made up approximately 75% of the total solids.
Distilled water was added during blending to facilitate proper mixing. The amount of water added ensured vortex formation, but did not dilute the mixture beyond slurry consistency. CW and GW were processed using the same protocol as FW.
The final mixing ratios were as follows (based on wet weight before water dilution): 100% FW; 50:50 FW:CW; and 50:25:25 FW:CW:GW. These ratios were selected based on preliminary literature guidance and field-scale feasibility for small systems that generate limited volumes of waste per day [4,6]. The blended samples were stored in airtight sample bottles for either digestion or physicochemical analysis. This preparation method aligns with standard protocols for anaerobic digestion feedstock preprocessing, as recommended in the literature [7,8]
The composition of FW included vegetable and fruit scraps, rice, pasta, meat trimmings, dairy residues, stale grains, coffee grounds, and minimal processed food remains. This mix provided a balanced substrate rich in carbohydrates, proteins, and lipids suitable for AD.

2.3. Experimental Setup

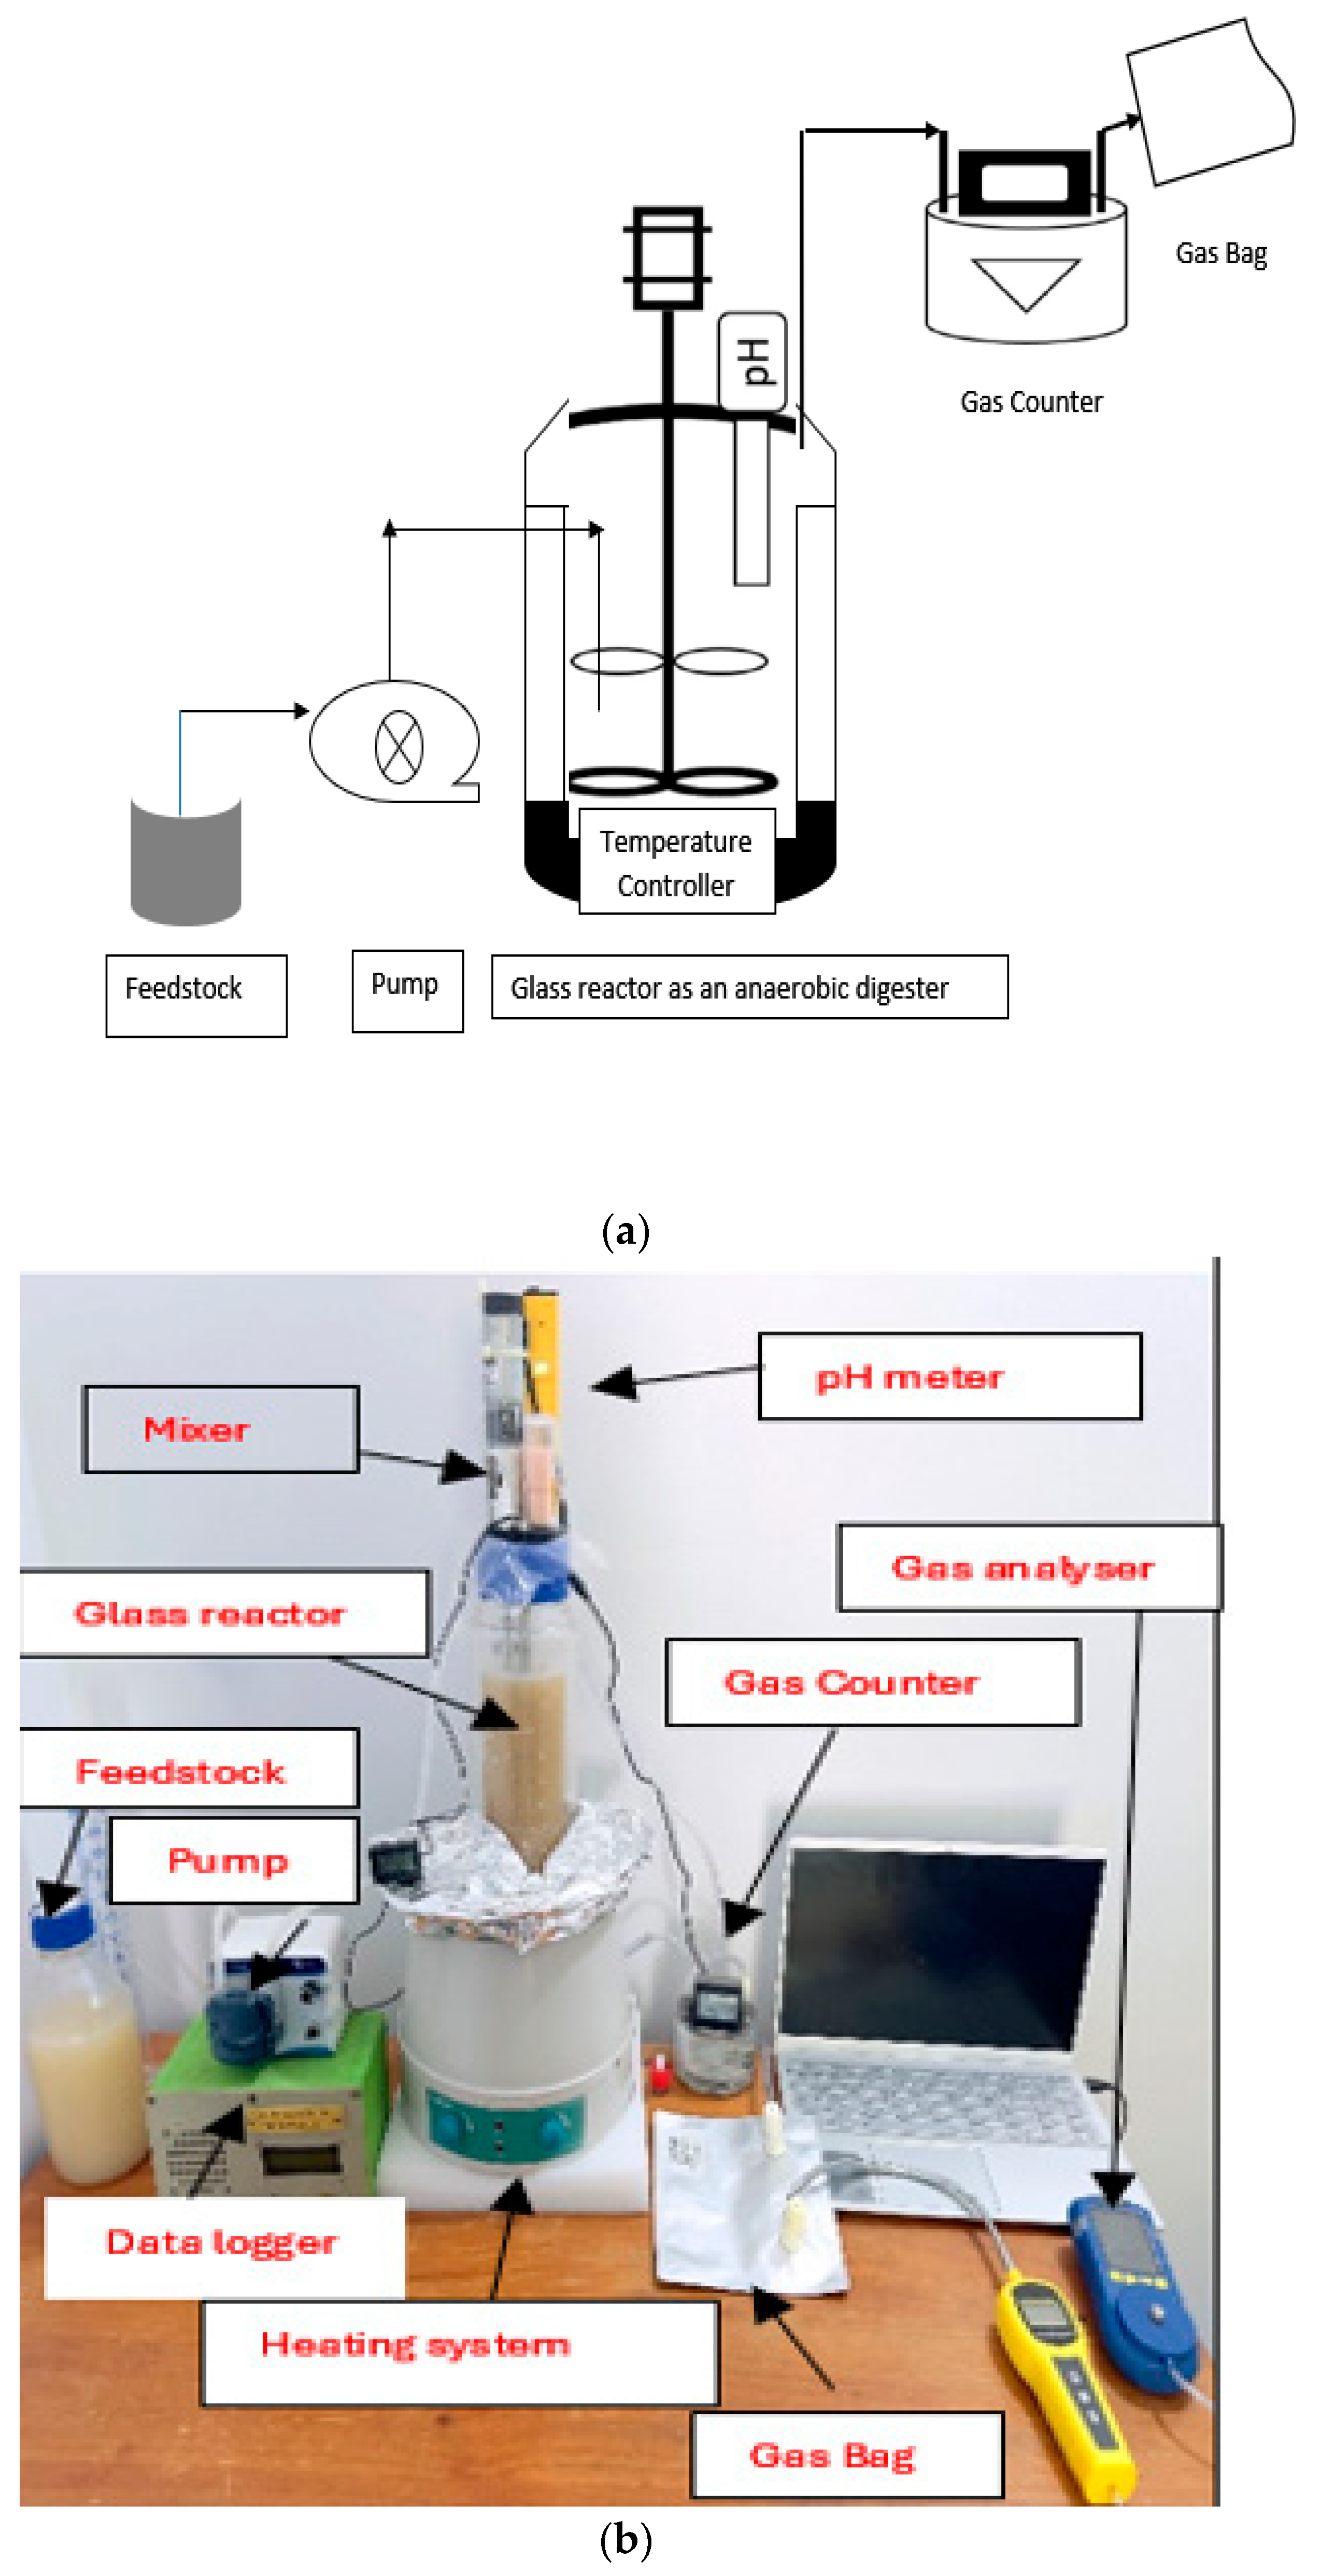
A 1 L jacketed glass reactor was used as the laboratory anaerobic digester. It was equipped with an intermittent mixing paddle operating at 100 rpm with 15 min on/off cycles to promote homogeneity and microbial activity while minimizing energy use (Figure 2). The reactor headplate had seven ports for sampling and probe insertion. The temperature control unit (Thermoline Scientific, Sydney, Australia) allowed for testing across temperatures, although no active temperature control was applied during the main experimental run, to simulate small-scale, low-cost digesters where external heating is not feasible.
Although this experiment was conducted in a 1 L digester, the setup was chosen to allow for precise monitoring and control in a laboratory setting. The aim was to investigate substrate synergy, methane trends, and digestion behavior under small-scale, passive conditions. While scale-dependent factors such as hydrodynamics and thermal inertia may differ in a 500 L system, the fundamental microbial and biochemical mechanisms of anaerobic digestion remain consistent. Insights from the batch-scale experiment served to guide the technoeconomic evaluation of the 500 L digester, while acknowledging that further pilot-scale studies would be needed to validate full-scale performance.
The process operated under ambient conditions (25–35 °C), with fluctuations depending on the room temperature. Although 37 °C is considered optimal for mesophilic digestion, this study intentionally omitted strict thermal regulation to reflect small-scale realities. Fluid movement was facilitated by a L/S peristaltic pump (Masterflex, Wayne, PA, USA). Biogas was collected via a 6 mm gas outlet into a Ritter drum-type gas flow meter, which measured cumulative gas volume. Gas composition was determined using a portable external sampling pump and multi-gas analyzer (CH4, CO2, H2S, and O2) [9,10].
The digester had a working volume of 600 mL. Feeding was performed daily by replacing 60 mL of digestate with fresh slurry, maintaining a 10-day HRT/SRT. The inoculum-to-substrate ratio was maintained at 2:1 on a volatile solids (VS) basis, following standard batch digestion protocols to ensure microbial stability and minimize initial acidification. Temperature, pH, ORP, and gas volume were recorded daily. Intermittent agitation between 80 and 120 rpm was used to preserve the integrity of microbial granules [11].

2.4. Analytical Methods

Digestate samples were analyzed weekly (Monday and Thursday) for total solids (TS), volatile solids (VS), and chemical oxygen demand (COD). TS and VS were measured following Standard Method 1684, while COD was analyzed using Hach vials and a Hach DR3900 spectrophotometer (US-EPA Standard Method 5220D). pH and ORP were monitored using a Hach portable probe and meter.

2.5. Technoeconomic Analysis

A technoeconomic analysis was performed to evaluate the viability of a 500 L small-scale digester designed for use in rural households or on small farms. The evaluation considered capital costs, operational expenses, and annual returns from biogas, thermal energy, and fertilizer production. Key financial metrics such as Net Present Value (NPV), Internal Rate of Return (IRR), and Dynamic Payback Period (DPP) were calculated.
NPV measures the profitability of the investment by comparing the present value of the benefits generated by the biodigester against the costs incurred over its lifespan [12,13]. A positive NPV indicates that the system’s future cash flows exceed its initial and operational costs, while a negative NPV suggests a financial loss. The formula for NPV utilized in the technoeconomic evaluation is as follows:
N P V = t = 0 n ( B C ) t   ( 1 + i c ) t I 0
In Equation (1), B represents benefits, which include savings from biogas replacing conventional fuel, thermal energy savings from solar heating, and reduced reliance on chemical fertilizers. C denotes costs, encompassing both the initial setup expenses and annual operational costs. The discount rate, i c , is based on prevailing loan interest rates, which is 4.9% in this study. I 0 is the initial investment, while t refers to the year of operation and n is the total lifespan of the system, set at 15 years for this analysis. This calculation provides a comprehensive understanding of the biodigester’s financial performance over time.
Benefits (B) were calculated by summing three benefits, including biogas benefit (Bb), thermal benefit (Bh), and fertilizer benefit (Bf). This can be expressed as Equation (2).
B = B b + B h + B f
Bb was determined by comparing the energy output of biogas to that of a standard fuel, such as coal, considering differences in heating values and efficiencies. In this analysis, coal was used as the reference energy source because it is still commonly used in many rural and peri-urban areas where access to piped natural gas is limited or non-existent. While natural gas is available in urban centers, coal remains a more realistic comparator for small-scale off-grid systems in regional settings such as Central Queensland and low- and middle-income countries.
Similarly, Bh was derived from the savings achieved by using the system’s solar heater instead of conventional heating sources. Bf was calculated by the cost savings and productivity gains from using biogas digestate as a fertilizer.
The values of Bb and Bh are typically equivalent to the costs of conventional energy sources required to produce an equivalent amount of energy as biogas and hot water. In this analysis, standard coal was used as the reference energy source [14,15]. The formulas for these calculations are as follows:
B b = V C o q b η b q s c η s c B s c
B h = Q q s c η s c B s c
Here, V represents the volume of biogas produced and Co is the methane content in the biogas. The lower heating value of methane, qb, was taken as 36.0 MJ/m3. The term Bsc indicates the cost of standard coal, while ηb and ηsc are the combustion efficiencies of biogas and a coal stove, respectively, set at 60% and 35% [16]. The lower heating value of standard coal, qsc, is 29.3 MJ/kg. Q refers to the thermal energy provided to the user through a solar water heater during warmer weather.
Costs (C) were broken down into the initial investment (Cinv) and annual operational and maintenance costs (Co&m). The initial investment included expenses for components like the solar water heater, temperature controls, insulation, and circulating pumps. The operational costs were calculated annually, based on real maintenance expenses. The costs (C) can be expressed as follows:
C =   C i n v +   C o & m
For the small-scale applications targeted in this study, labor for substrate collection, feedstock preparation, reactor feeding, and digestate handling is generally provided by household members or farm workers as part of their daily routine. As such, this labor was treated as unpaid and excluded from monetary costing in the base model. However, the value of this labor input is acknowledged and discussed in the limitations section. For scaling up or replication in a commercial context, explicit labor cost modeling would be necessary.
DPP is another important measure of economic feasibility [12]. It estimates the time required to recover the initial investment, adjusted for discounted cash flows. Its formula is as follows:
D P P = T 1 + N P V T 1 B C T ( 1 + i c ) T
Here, T is the year when the NPV first becomes positive. This calculation indicates how long it would take for the biodigester to generate sufficient financial benefits to cover its initial costs.

3. Results and Discussion

3.1. Characterization of Samples

Table 1 presents the analytical results for three different feedstocks. Feedstock 1 has a slightly acidic pH, high chemical oxygen demand (COD), and total organic carbon (TOC), indicating significant organic content, which is also reflected in its high biological oxygen demand (BOD) and total solids (TS). Feedstock 2 is more acidic, with the highest COD, suggesting a higher potential for chemical oxidation, but has lower TOC and BOD than Feedstock 1, indicating less readily biodegradable organic material. Feedstock 3 shows the least acidic pH and lowest COD, BOD, and TOC, suggesting that it has the least organic content among the three. The carbon, hydrogen, nitrogen, and sulfur percentages provide further insights into the chemical composition of each feedstock, with variations indicating differences in organic and inorganic material content.

3.2. Temporal Dynamics of Biogas Production Through Anaerobic Digestion (24 h Time Intervals)

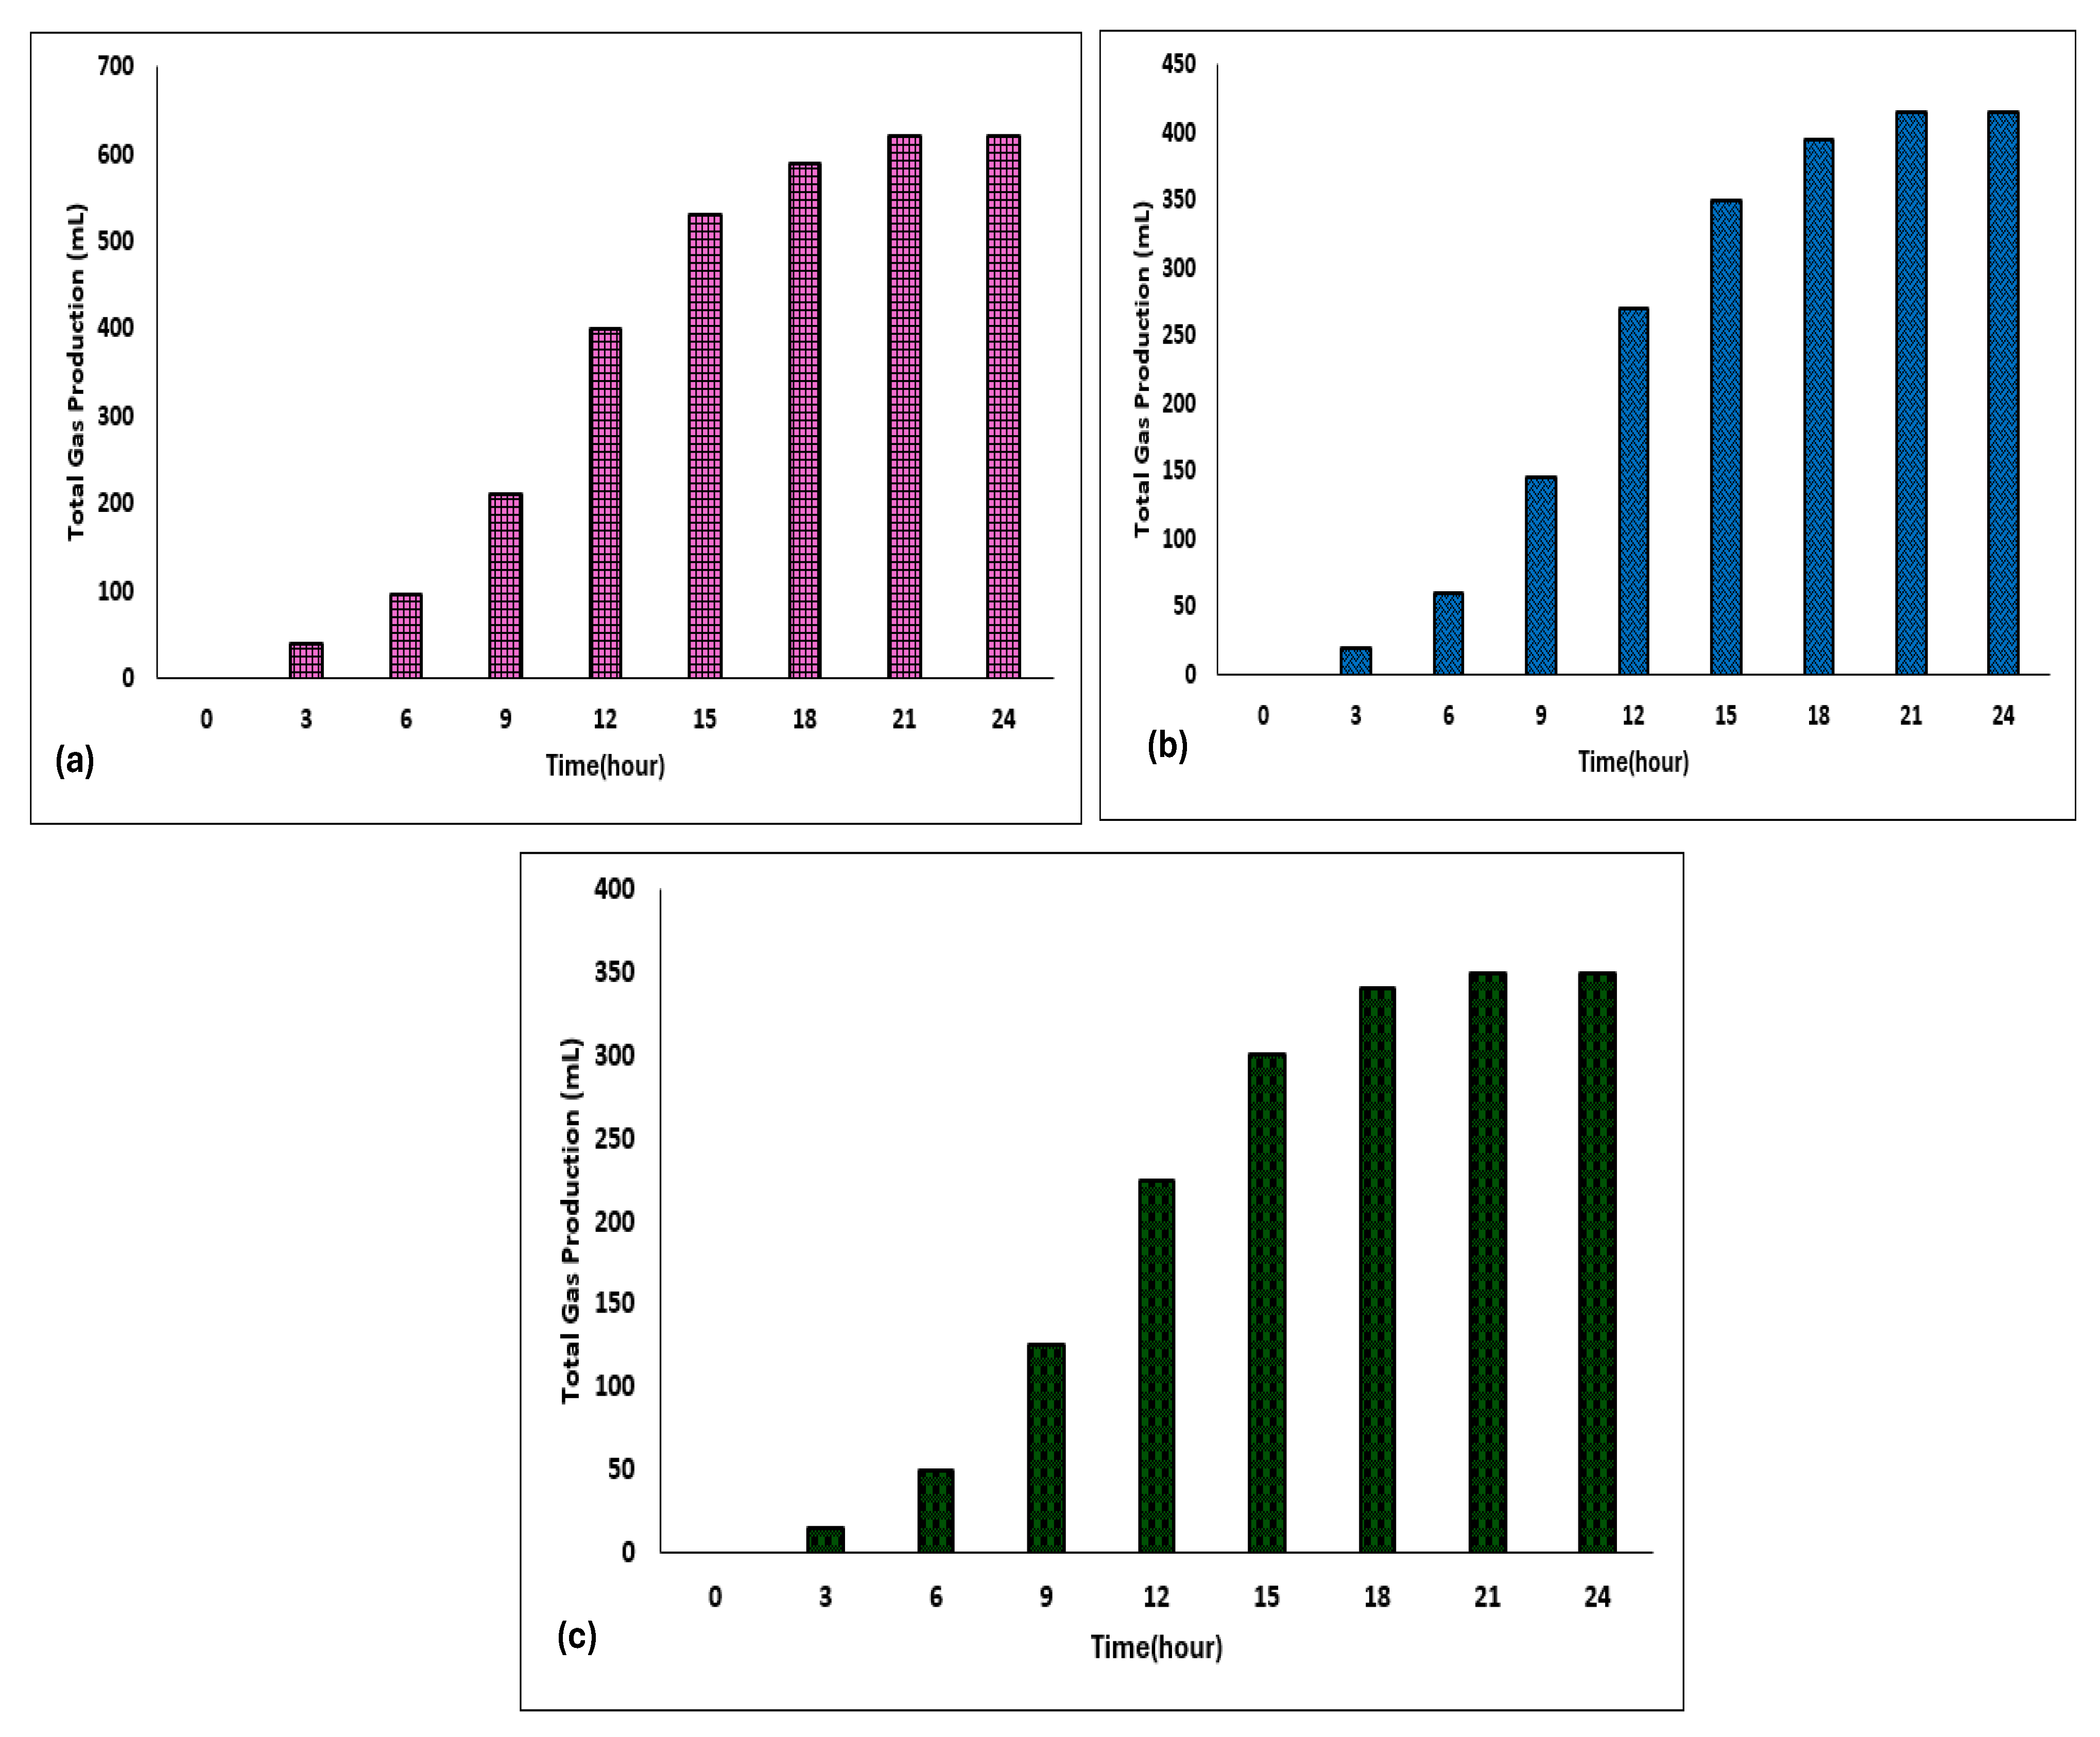
Figure 3a–c present a clear temporal progression in biogas production from all substrates, with production increasing over time. At the initial time point (0 h), no biogas production is observed, indicating a starting point prior to microbial action. For FW alone, biogas production starts off and increases rapidly, with the most significant jump between 6 and 12 h, reaching 404 units. The production curve begins to plateau after 15 h, suggesting that the easily degradable components of FW may have been exhausted, leaving less fermentable material for biogas production [17]. By the end of the 24 h period, there is a slight increase from 621 to 624 units, indicating that the fermentation process has largely stabilized.
When cow dung is added to FW, the biogas production starts slower but shows a consistent increase over time. This slower initial production rate may be due to the microbial lag phase, where microbes adapt to new substrates [18]. However, after 15 h, the production rate also begins to plateau, similar to FW alone, suggesting that the process might be approaching the limits of biogas potential in the given mixture. The mixture of FW with cow dung and green waste shows the lowest biogas production at all time points. The incremental increase is steadier than that of the other mixtures, which could be due to the slower degradation of the more complex material present in green waste, like lignin and cellulose, which are known to be more resistant to microbial digestion [7]. Despite this, the upward trend indicates that biogas production is still active over the 24 h.
The comparison across different substrates reveals that the addition of cow dung and especially green waste to FW appears to decrease the overall biogas production. This could be due to the reasons mentioned before, such as substrate competition, altered microbial populations, or the presence of more complex materials that are difficult to break down anaerobically. From an application perspective, this data can help optimize biogas production processes. For maximum biogas production in a short timeframe (within 24 h), FW appears to be the best substrate. However, for more sustained biogas production over time, mixtures could be beneficial. The addition of cow dung and green waste, despite lowering total biogas production, might help in the stabilization of the process and potentially reduce the need for additional nutrient supplements or pH adjustments. This temporal analysis is consistent with findings from several studies, which suggest that biogas production rate and final yield are heavily dependent on substrate composition and the progression of the AD process [19]. Such insights are crucial for the design of biogas plants and the development of strategies for waste management and renewable energy production.

3.3. Cumulative Gas Production and Methane Concentration Profile (24 h Time Intervals)

Figure 4 shows the cumulative biogas production profiles for the following three substrate combinations: 100% food waste (FW), a 50:50 mix of food waste and cow dung (FW+CD), and a 50:25:25 mix of food waste, cow dung, and green waste (FW+CD+GW) over a 24 h interval. The FW treatment exhibited a rapid initial rise in biogas production, suggesting an immediate microbial response to the easily degradable carbohydrates and proteins present in food waste. This was followed by a tapering trend as labile compounds were exhausted.
The FW+CD mixture demonstrated a more consistent biogas production rate, likely due to the stabilizing effect of cow dung, which provides a diverse microbial population and improved buffering capacity. FW+CD+GW initially lagged behind in biogas production, attributed to the complex lignocellulosic structure of green waste, but gradually increased as microbial consortia adapted and hydrolytic activity progressed. These observations align with previous reports on the benefits of co-digestion for balancing nutrient profiles and enhancing microbial efficiency [20,21].
The methane concentration within the biogas was monitored over time and is shown in Figure 4. The results indicate that methane content reached approximately 25% for FW, 44% for FW+CD, and 48% for FW+CD+GW, with minor fluctuations observed during the digestion period. These fluctuations can be attributed to microbial community dynamics, pH shifts, and substrate degradation variability as new feed was introduced and intermediate metabolites accumulated or were consumed [9].
The relatively low methane concentration of 25% in the FW-only treatment was likely due to the absence of active pH control and temperature regulation. Without buffering agents, food waste digestion may lead to the accumulation of volatile fatty acids (VFAs), causing the pH inhibition of methanogens. Furthermore, the inoculum used was not pre-adapted to food waste mono-digestion, which may have limited methanogenic activity under these conditions.
The higher methane yield in the FW+CD and FW+CD+GW combinations highlights the beneficial effect of co-digestion, as cow dung and green waste not only enriched microbial diversity, but also balanced the carbon-to-nitrogen (C/N) ratio, improving methanogenesis [22,23].
These findings underscore the importance of co-digestion strategies to optimize both the quantity and quality of biogas. While the mono-digestion of FW yields quick gas production, co-digestion improves methane quality and process stability. The trade-off between volume and methane concentration must be carefully balanced when designing small-scale anaerobic digesters for household or farm use.
Future work should explore longer retention times and the pretreatment of lignocellulosic components to further improve methane yield and conversion efficiency.

3.4. Cumulative Gas Production and Methane Concentration Profile (14-Day Time Intervals)

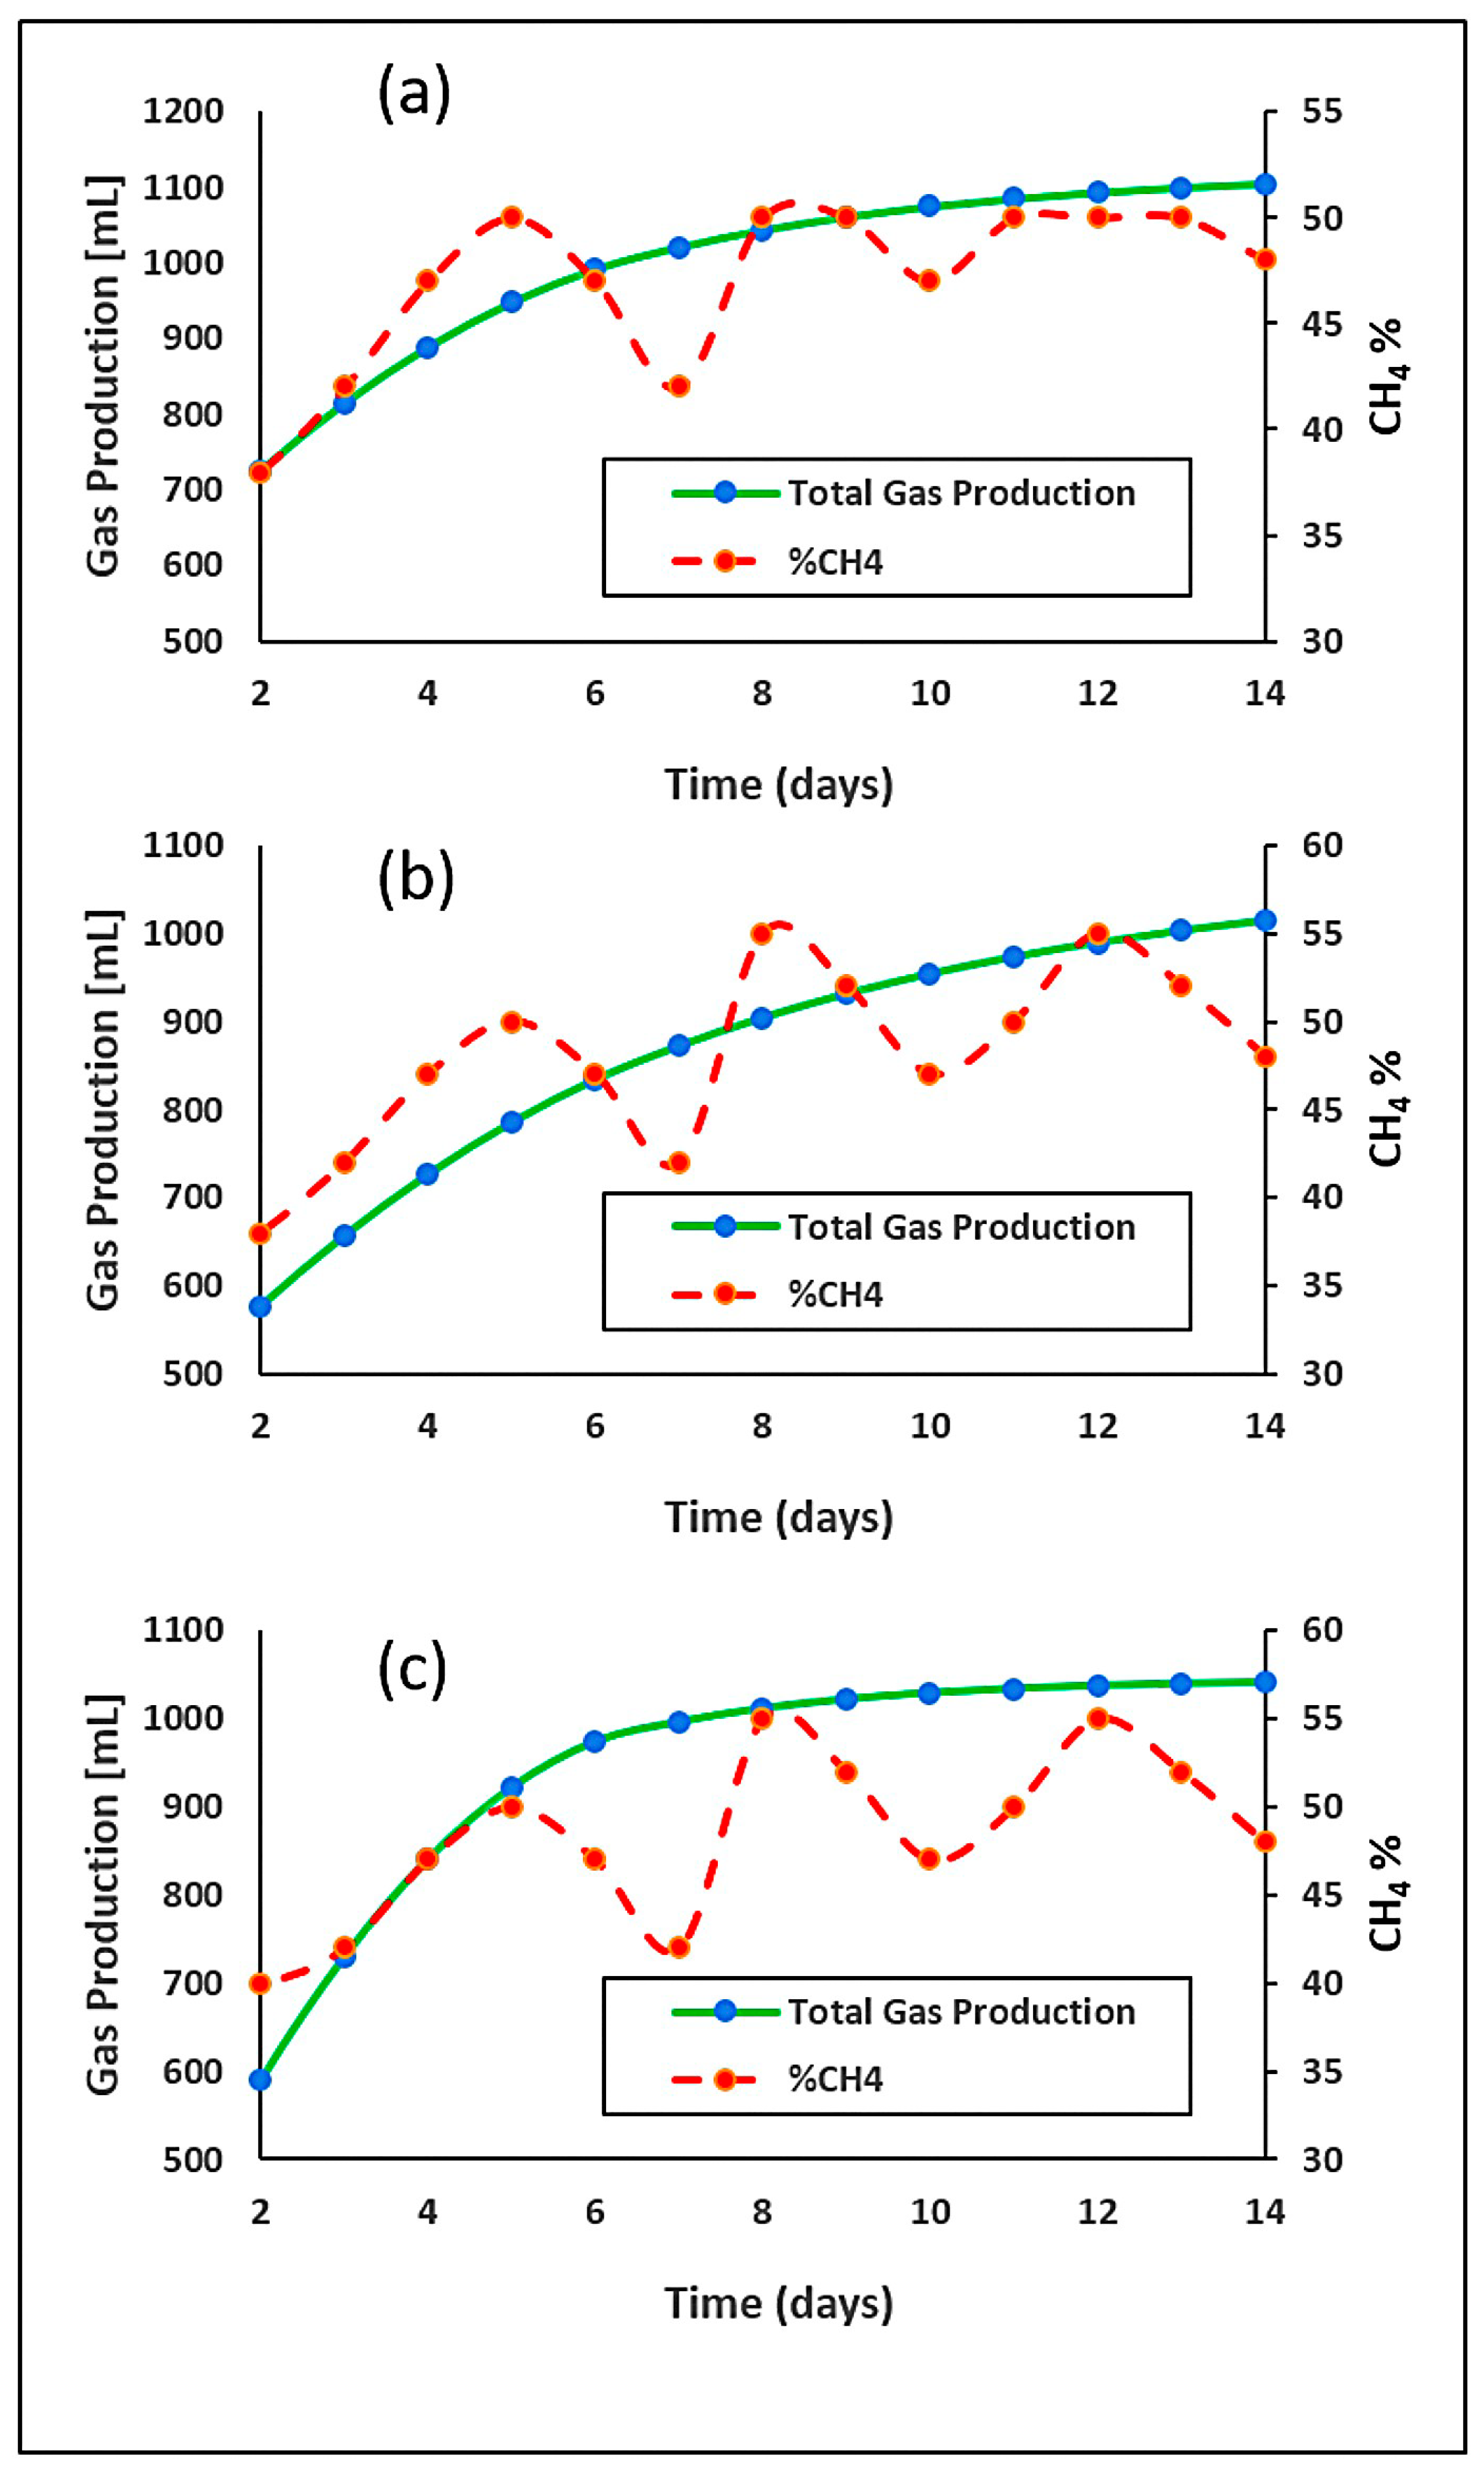
Figure 5 shows the progression of total gas production and the methane (CH4) concentration percentage of different substrate compositions over a 14-day period. The data indicates that all mixtures exhibited a progressive increase in total biogas production over the 14 days, with the FW+CD mixture initiating at 487 units and reaching 1014 units, and the FW+CD+GW mixture starting at 419 units, culminating in 1041 units. Notably, the FW+CD+GW mixture consistently demonstrated a higher methane percentage compared to the FW+CD mixture, starting at 40% and maintaining a level of 48% by day 14, which could signify a more methanogen-friendly environment or a higher degree of degradable organic material present in the green waste. Furthermore, the methane concentration for the FW+CD mixture peaked at 55% on days 8 and 12, which could reflect optimal microbial activity or favorable digestion conditions. It is also noteworthy that after day 6, the methane percentage fluctuated, suggesting a dynamic microbial response to the substrate composition.
These observations highlight the influence of substrate complexity on both the volume of biogas generated and its methane content. While the FW+CD+GW mixture produced less total biogas, its higher percentage of methane suggests an enhanced conversion efficiency, which is highly desirable for energy recovery purposes. In contrast, the FW+CD mixture, despite yielding more biogas, did so with a generally lower methane concentration, indicating that not all produced biogas is equally valuable in terms of energy content. These results underscore the need for strategic substrate selection to optimize both biogas production and methane concentration, catering to the specific requirements of AD facilities. The addition of green waste to FW and cow dung seemed to favor methane concentration, presenting a compelling case for integrating diverse organic streams to enhance the quality of biogas. Future research could explore the mechanistic aspects of these findings, potentially investigating the microbial community dynamics and physicochemical parameters influencing these outcomes.
These results highlight the impact of substrate composition on both total gas production and methane yield. For operations focused on maximizing total gas output, pure FW appears the most suitable. However, for processes aiming for a higher methane concentration, the addition of cow dung, and particularly green waste, may be beneficial. This can be important for biogas plants seeking to optimize their methane output for energy production, as methane is the primary component of interest [24]. This study also underscores the dynamic nature of the AD process and suggests that a balance between substrate complexity and biogas yield is crucial for efficient biogas production.
Figure 6 shows the daily biogas production rate over a 14-day period, which presents a marked decrease in production rates after initial peaks. Initially, the biogas output is significantly high, suggesting the effective initiation of AD processes. However, there is a steep decline in production as the days progress, stabilizing at much lower levels towards the end of the period. This trend is consistent with the findings of [25], who observed a rapid onset of microbial activity leading to an initial surge in biogas production, followed by a decline as substrate availability decreased and microbial activity stabilized [25].
The observed pattern can be attributed to several factors, including substrate exhaustion, microbial population dynamics, and possible inhibitory effects due to accumulating metabolites. This aligns with research by [26], which highlighted that the rate of biogas production can be significantly affected by the balance of nutrients, the presence of inhibitors, and the physical conditions within the digester [26]. The gradual decrease observed after the initial days may also indicate the onset of maintenance or endogenous phases of microbial metabolism, where microbes consume their own biomass in the absence of new substrate, as detailed in the studies by Karakashev et al. [27] on the microbial ecology of anaerobic digesters.

4. Technoeconomic Analysis

This study selected a 500 L small-scale biodigester based on its practical applicability to rural households and small-scale farms that generate limited but consistent volumes of organic waste. This scale represents a balance between affordability, ease of operation, and sufficient throughput to offset household energy and fertilizer costs. While larger digesters are viable for community clusters or cooperatives, the 500 L system serves as a realistic proxy for single-user or household-scale biogas applications in Central Queensland and similar subtropical settings.
The technoeconomic evaluation combined experimental methane yield data with a detailed financial model over a 15-year lifespan. It assessed capital investment, annual operating and maintenance (O&M) costs, labor inputs, and recurring benefits from fuel substitution, thermal energy savings, and fertilizer use. Additionally, a multi-scenario sensitivity analysis was conducted to account for variations in energy and fertilizer prices, labor availability, and feedstock supply.

4.1. Cost Estimation

The initial investment, including materials and installation, was AUD 1800. This covered the digester tank, valves, solar water heater integration, and skilled labor. Operating expenses were estimated at AUD 180 per year for maintenance, water, and miscellaneous repairs. These figures are detailed in Table 2.

4.2. Benefit Estimation

The system generated benefits through biogas energy savings, thermal energy replacement, and digestate fertilizer production (as shown in Table 3). The biogas output of 1.8 m3/day substituted LPG costs at AUD 1.00 per m3, yielding annual fuel savings of AUD 657. Solar heating reduced electricity costs for water heating, adding another AUD 250 in savings. Finally, the digester produced 400 kg of digestate annually, valued at AUD 0.60 per kg, providing a fertilizer benefit of AUD 240.

4.3. Financial Indicators

Using a 4.9% discount rate and a 15-year period, the following financial indicators were calculated (as presented in Table 4).

4.4. Sensitivity Analysis

The positive NPV of AUD 2834 demonstrates the financial attractiveness of the biogas digester system. The IRR of 13.5% exceeds the typical discount rates used for small-scale projects in Australia, indicating robust returns. The DPP of 3.2 years further highlights the system’s capacity to quickly recover its initial investment. These findings are consistent with similar studies in the literature. Studies by Feng et al. [12] reported an NPV of around AUD 1650 for comparable biogas systems under favorable conditions. The higher NPV in this study can be attributed to increased biogas output, integrated solar heating, and optimized fertilizer value. The DPP is shorter than the 4 years reported in similar systems by Moreno et al. [13], primarily due to reduced operational costs and enhanced benefits.
The economic viability of the system is sensitive to energy prices. A sensitivity analysis revealed that a 10% increase in LPG prices improved the NPV to AUD 3214 and shortened the DPP to 2.9 years. Conversely, a 10% decrease in energy prices reduced the NPV to AUD 2389. This demonstrates the system’s dependence on local energy costs.
This analysis aligns with previous findings by Feng et al. [12] and Moreno et al. [13], who reported similar economic potentials for small-scale digesters, albeit under differing regional assumptions. The inclusion of thermal energy and fertilizer benefits, often overlooked in prior models, strengthens the financial justification for such systems in subtropical and semi-rural Australian contexts.

5. Conclusions

This study demonstrates the effectiveness of co-digesting food waste (FW), cow dung (CD), and green waste (GW) for biogas production, especially in the context of small-scale applications in subtropical regions such as Central Queensland, Australia. The experimental results show that the mono-digestion of FW yielded the highest cumulative biogas (1014 mL over 14 days), but with a low methane concentration of 25%. Co-digestion with CD improved methane content to 44%, while the inclusion of GW further enhanced methane quality to 48%, attributed to improved buffering and microbial diversity.
The technoeconomic assessment of a 500 L digester based on these findings confirms financial viability. Annual benefits reached AUD 1147 through LPG substitution, thermal energy savings, and fertilizer value. The biodigester achieved a Net Present Value (NPV) of AUD 2834, an Internal Rate of Return (IRR) of 13.5%, and a Dynamic Payback Period (DPP) of 3.2 years. Sensitivity analysis reveals that the digester’s performance was highly responsive to local energy prices, with a 10% increase in LPG price improving the NPV to AUD 3214.
These findings illustrate the complexity of biogas production systems and the need for the careful optimization of feedstock mixtures. While FW alone might be favorable for higher biogas production, diversifying the substrate mixture can influence methane content and overall yield. The balance between total output and methane concentration must be considered when designing effective biogas systems. Future research should focus on optimizing substrate ratios, the pretreatment of lignocellulosic biomass, and reactor configurations to enhance both methane yield and process stability, thereby improving economic and environmental sustainability in decentralized biogas applications.

Author Contributions

Methodology, H.M.M.; Validation, M.M.H.; Formal analysis, H.M.M.; Writing—original draft, H.M.M. and M.M.H.; Writing—review & editing, M.G.R., R.N. and D.A.; Supervision, M.G.R. All authors have read and agreed to the published version of the manuscript.

Funding

The authors would like to thank Central Queensland University, Australia for the financial support to H. M. Mahmudul in the form of a Research Training Program (RTP) Scholarship. The authors also acknowledge the Fuel and Energy Research Group of Central Queensland University for providing experimental facilities.

Data Availability Statement

The original contributions presented in this study are included in the article. Further inquiries can be directed to the corresponding author.

Conflicts of Interest

The authors declare no conflict of interest.

References

  1. Belousov, A.; Lushpeev, V.; Sokolov, A.; Sultanbekov, R.; Tyan, Y.; Ovchinnikov, E.; Shvets, A.; Bushuev, V.; Islamov, S. Experimental Research of the Possibility of Applying the Hartmann–Sprenger Effect to Regulate the Pressure of Natural Gas in Non-Stationary Conditions. Processes 2025, 13, 1189. [Google Scholar] [CrossRef]
  2. Obaideen, K.; Abdelkareem, M.A.; Wilberforce, T.; Elsaid, K.; Sayed, E.T.; Maghrabie, H.M.; Olabi, A. Biogas role in achievement of the sustainable development goals: Evaluation, Challenges, and Guidelines. J. Taiwan Inst. Chem. Eng. 2022, 131, 104207. [Google Scholar] [CrossRef]
  3. Cazaudehore, G.; Guyoneaud, R.; Evon, P.; Martin-Closas, L.; Pelacho, A.; Raynaud, C.; Monlau, F. Can anaerobic digestion be a suitable end-of-life scenario for biodegradable plastics? A critical review of the current situation, hurdles, and challenges. Biotechnol. Adv. 2022, 56, 107916. [Google Scholar] [CrossRef] [PubMed]
  4. Rowan, M.; Umenweke, G.C.; Epelle, E.I.; Afolabi, I.C.; Okoye, P.U.; Gunes, B.; Okolie, J.A. Anaerobic co-digestion of food waste and agricultural residues: An overview of feedstock properties and the impact of biochar addition. Digit. Chem. Eng. 2022, 4, 100046. [Google Scholar] [CrossRef]
  5. Pilarska, A.A.; Kulupa, T.; Kubiak, A.; Wolna-Maruwka, A.; Pilarski, K.; Niewiadomska, A. Anaerobic Digestion of Food Waste—A Short Review. Energies 2023, 16, 5742. [Google Scholar] [CrossRef]
  6. Singh, K.; Senapati, K.; Sarma, K. Synthesis of superparamagnetic Fe3O4 nanoparticles coated with green tea polyphenols and their use for removal of dye pollutant from aqueous solution. J. Environ. Chem. Eng. 2017, 5, 2214–2221. [Google Scholar] [CrossRef]
  7. Feng, Y.; Zhang, Y.; Quan, X.; Chen, S. Enhanced anaerobic digestion of waste activated sludge digestion by the addition of zero valent iron. Water Res. 2014, 52, 242–250. [Google Scholar] [CrossRef]
  8. Bridgewater, L.L. Standard Methods for the Examination of Water and Wastewater; American Public Health Association: Washington, DC, USA, 2017. [Google Scholar]
  9. García, A.-R.F.; Guez, J.-S.; Dussap, C.G.; Fontanille, P.; Christophe, G. Effect of redox potential on biohydrogen production during dark fermentation of food wastes in bioreactor. Int. J. Hydrogen Energy 2025, 141, 1199–1210. [Google Scholar] [CrossRef]
  10. Wu, J.; Zhang, H.; Zhao, Y.; Yuan, X.; Cui, Z. Effect of Temperature on the Inocula Preservation, Mesophilic Anaerobic Digestion Start-Up, and Microbial Community Dynamics. Agronomy 2024, 14, 2991. [Google Scholar] [CrossRef]
  11. Panigrahi, S.; Sharma, H.B.; Dubey, B.K. Anaerobic co-digestion of food waste with pretreated yard waste: A comparative study of methane production, kinetic modeling and energy balance. J. Clean. Prod. 2020, 243, 118480. [Google Scholar] [CrossRef]
  12. Feng, R.; Li, J.; Dong, T.; Li, X. Performance of a novel household solar heating thermostatic biogas system. Appl. Therm. Eng. 2016, 96, 519–526. [Google Scholar] [CrossRef]
  13. Moreno, L.; González, A.; Cuadros-Salcedo, F.; Cuadros-Blázquez, F. Feasibility of a novel use for agroindustrial biogas. J. Clean. Prod. 2017, 144, 48–56. [Google Scholar] [CrossRef]
  14. Chen, Y.J.; Haung, T.M. Planar-oriented ripple based greedy search algorithm for vector quantization. In Proceedings of the 2012 Computing, Communications and Applications Conference, Dindigul, India, 11–13 January 2012; pp. 227–230. [Google Scholar]
  15. Xianrong, H.; Fengju, S. Evaluation on the composite benefit of household biogas digesters. Renew. Energy 2006, 2, 4–6. [Google Scholar]
  16. Kurchania, A.K.; Panwar, N.L.; Pagar, S.D. Development of domestic biogas stove. Biomass Convers. Biorefinery 2011, 1, 99–103. [Google Scholar] [CrossRef]
  17. He, K.; Liu, Y.; Tian, L.; He, W.; Cheng, Q. Review in anaerobic digestion of food waste. Heliyon 2024, 10, e28200. [Google Scholar] [CrossRef]
  18. Brown, D.; Li, Y. Solid state anaerobic co-digestion of yard waste and food waste for biogas production. Bioresour. Technol. 2013, 127, 275–280. [Google Scholar] [CrossRef]
  19. Dhull, P.; Kumar, S.; Yadav, N.; Lohchab, R.K. A comprehensive review on anaerobic digestion with focus on potential feedstocks, limitations associated and recent advances for biogas production. Environ. Sci. Pollut. Res. 2024, 31, 1–36. [Google Scholar] [CrossRef] [PubMed]
  20. Ait Oubba, Z.; Ounini, K.; Cherroud, S.; Ainane, A.; Ainane, T. From computational thinking to computational action: Case of waste treatment processes by composting. J. Anal. Sci. Appl. Biotechnol. 2024, 6, 92–99. [Google Scholar]
  21. Ainane, T.; Abdoul-Latif, F.M.; Ainane, A.; Kornaros, M.; Abbi, R.; Achira, M.; Brulé, M. Optimization by design of experiments of the preparation of biochar from olive pomace and its physicochemical characterizations. J. Anal. Sci. Appl. Biotechnol. 2023, 5, 39156. [Google Scholar]
  22. Lee, W.; Kim, Y.; Kim, H.; Kim, M. Comparison of Anaerobic Co-Digestion of Food Waste and Livestock Manure at Various Mixing Ratios under Mesophilic and Thermophilic Temperatures. Sustainability 2024, 16, 7653. [Google Scholar] [CrossRef]
  23. Czekała, W.; Nowak, M.; Bojarski, W. Characteristics of substrates used for biogas production in terms of water content. Fermentation 2023, 9, 449. [Google Scholar] [CrossRef]
  24. Czekała, W.; Jasiński, T.; Grzelak, M.; Witaszek, K.; Dach, J. Biogas plant operation: Digestate as the valuable product. Energies 2022, 15, 8275. [Google Scholar] [CrossRef]
  25. Møller, H.B.; Sommer, S.G.; Ahring, B.K. Methane productivity of manure, straw and solid fractions of manure. Biomass Bioenergy 2004, 26, 485–495. [Google Scholar] [CrossRef]
  26. Angelidaki, I.; Ellegaard, L. Codigestion of manure and organic wastes in centralized biogas plants: Status and future trends. Appl. Biochem. Biotechnol. 2003, 109, 95–105. [Google Scholar] [CrossRef] [PubMed]
  27. Karakashev, D.; Batstone, D.J.; Angelidaki, I. Influence of environmental conditions on methanogenic compositions in anaerobic biogas reactors. Appl. Environ. Microbiol. 2005, 71, 331–338. [Google Scholar] [CrossRef] [PubMed]
Figure 1. Procedure for sampling and preparing different types of waste: (A) collection, (B) processing, and (C) final samples.
Energies 18 04505 g001
Figure 2. (a) Schematic diagram and (b) actual photograph of the anaerobic digester setup used in this study.
Energies 18 04505 g002
Figure 3. The gas production profiles for (a) FW, (b) cow dung and FW, and (c) green waste, cow dung, and FW over 24 h time interval.
Energies 18 04505 g003
Figure 4. The (a) cumulative gas production and (b) average methane concentration profiles for FW, cow dung and FW, and green waste, cow dung, and FW over 24 h time interval.
Energies 18 04505 g004
Figure 5. The cumulative gas production and average methane concentration profiles for (a) FW, (b) cow dung and FW, and (c) green waste, cow dung, and FW over 14-day time interval.
Energies 18 04505 g005
Figure 6. Daily biogas production rate over 14-day time interval.
Energies 18 04505 g006
Table 1. Characteristics of samples used in this study.
ParameterFeedstock 1 (FW)Feedstock 2 (FW+CD)Feedstock 3 (FW+CD+GW)UnitTest Method
PH5.704.876.60-pH meter
COD89,00098,50040,000mg/LCENLAB/WI/CHEM-TM/006
(In House Method based on APHA 5220 D)
BOD202017101070mg/LCENLAB/WI/CHEM-TM/005
(In-House method based on APHA 5210B)
TOC45,40032,70024,100mg/LIn-House Method based on APHA 5310
TS147,41099,880107,634mg/LAPHA 2540
Carbon4.671.422.99%In-House Method using CHNS Analyzer
Hydrogen10.6012.3311.28%In-House Method using CHNS Analyzer
Nitrogen0.330.170.26%In-House Method using CHNS Analyzer
Sulphur0.790.080.06%In-House Method using CHNS Analyzer
Table 2. The estimations of capital and operating costs in AUD.
Cost ComponentAmount (AUD)Remarks
Digester Tank (500 L)800Durable material, fabricated locally
Piping and Valves400High-quality PVC materials
Installation and Labor300Skilled labor for setup
Solar Heating Integration300Reduces thermal energy costs
Total Initial Investment1800
Annual Operational Costs180Includes maintenance and utility expenses
Table 3. The total annual benefit generated by 500 L biodigester system.
Benefit ComponentAnnual Amount (AUD)Remarks
Biogas Savings657Based on LPG replacement at 1.8 m3/day
Thermal Energy Savings250Solar water heating integration
Fertilizer Savings240Digestate at 400 kg/year
Total Annual Benefits1147
Table 4. The financial performance of the 500 L biodigester system.
MetricValueInterpretation
Net Present Value (NPV)AUD 2834Positive, indicating profitability
Internal Rate of Return (IRR)13.5%Higher than average small-scale investment returns
Dynamic Payback Period (DPP)3.2 yearsShort recovery time for initial investment
Disclaimer/Publisher’s Note: The statements, opinions and data contained in all publications are solely those of the individual author(s) and contributor(s) and not of MDPI and/or the editor(s). MDPI and/or the editor(s) disclaim responsibility for any injury to people or property resulting from any ideas, methods, instructions or products referred to in the content.