Article

Attention Mechanism-Based Micro-Terrain Recognition for High-Voltage Transmission Lines

1
Xuefeng Mountain Energy Equipment Safety National Observation and Research Station, Chongqing University, Chongqing 400044, China
2
Guangdong Key Laboratory of Electric Power Equipment Reliability, Electric Power Research Institute of Guangdong Power Grid Co., Ltd., Guangzhou 510080, China
*
Authors to whom correspondence should be addressed.
Energies 2025, 18(17), 4495; https://doi.org/10.3390/en18174495
Submission received: 26 June 2025 / Revised: 30 July 2025 / Accepted: 20 August 2025 / Published: 24 August 2025

Abstract

With the continuous expansion of power grids and the advancement of ultra-high voltage (UHV) projects, transmission lines are increasingly traversing areas characterized by micro-terrain. These localized topographic features can intensify meteorological effects, thereby increasing the risks of hazards such as conductor icing and galloping, directly threatening operational stability. Enhancing the disaster resilience of transmission lines in such environments requires accurate and efficient terrain identification. However, conventional recognition methods often neglect the spatial alignment of the transmission lines, limiting their effectiveness. This paper proposes a deep learning-based recognition framework that incorporates a dual-branch network architecture and a cross-branch spatial attention mechanism to address this limitation. The model explicitly captures the spatial correlation between transmission lines and surrounding terrain by utilizing line alignment information to guide attention along the line corridor. A semi-synthetic dataset, comprising 6495 simulated samples and 130 real-world samples, was constructed to facilitate model training and evaluation. Experimental results show that the proposed model achieves classification accuracies of 94.6% on the validation set and 92.8% on real-world test cases, significantly outperforming conventional baseline methods. These findings demonstrate that explicitly modeling the spatial relationship between transmission lines and terrain features substantially improves recognition accuracy, offering important support for hazard prevention and resilience enhancement in UHV transmission systems.

1. Introduction

To achieve its dual carbon goals [1], China is accelerating the construction of clean energy bases in the western region. It has planned over 50,000 km of ultra-high-voltage (UHV) transmission lines to enable long-distance, cross-regional power delivery. Given the country’s complex topography, these transmission corridors inevitably traverse areas characterized by micro-terrain—localized topographic features, often involving steep slopes greater than 30 degrees, which are known to intensify local meteorological effects such as wind speed, temperature, and humidity. This intensification increases the risk of galloping (a type of wind-induced conductor oscillation), conductor offset, and insulator flashover caused by icing [2,3,4,5]. Accurate identification of these “dual-micro” (micro-terrain and microclimate) regions has become a fundamental prerequisite for effective ice disaster prevention in power grids [6].
Therefore, developing a robust and accurate method to identify micro-terrain zones along transmission corridors is essential for improving the disaster resilience of UHV systems and ensuring their safe and reliable operation. Traditionally, micro-terrain identification relied on inefficient and labor-intensive manual field surveys. The advent of Geographic Information Systems (GIS) and the availability of ten-meter scale, high-resolution Digital Elevation Models (DEMs) provided a powerful alternative, enabling large-scale and automated analysis. While these GIS-based methods can calculate individual geomorphometric parameters (e.g., slope, aspect, curvature), they are insufficient for the high-level task of recognizing the complex spatial patterns inherent in micro-terrains. Algorithms such as decision trees, random forests [7,8], K-means clustering [9], and convolutional neural networks [10,11,12,13] have been employed for large-scale data analysis and classification. However, a significant gap persists, as existing methods for micro-terrain recognition tend to focus exclusively on topographical factors, failing to genuinely incorporate the spatial position of transmission lines within the recognition framework [14,15,16].
The impact of micro-terrain on transmission lines is closely related to their alignment. For example, lines crossing a saddle may experience increased wind speed due to the Venturi effect, causing conductor oscillations [17]. In contrast, transmission lines running along a ridge are more likely to experience vertical winds that generate lift [18]. Some lines pass through micro-terrain areas but are situated on gentle slopes, posing no disaster risk. Therefore, ignoring the alignment of transmission lines in micro-terrain recognition may lead to unnecessary losses and risks.
Standard neural network models often struggle to capture complex spatial relationships, primarily because they rely on single-scale feature extraction and lack dedicated mechanisms to focus on critical regions [10,13,19]. Furthermore, the effective integration of multi-modal data remains a significant challenge, often resulting in diminished classification accuracy in complex scenarios [14]. To overcome these limitations, various deep learning-based geospatial optimization algorithms have shown considerable potential. Reference [20] combines the Inception module with a non-local attention mechanism within a 2D-3D hybrid CNN to extract spatial features using multi-scale convolutional kernels. Reference [21] designed a dual-branch network to separately extract spectral and spatial features, thereby reducing feature interference and improving classification performance. Further innovations include combining 3D CNNs with a Pyramid Squeeze-Attention (PSA) module to capture multi-scale spatial information and cross-channel attention [22]. A multi-scale dual-attention network has also been proposed, utilizing a Multi-scale Spectral Residual Self-Attention (MSeRA) module to extract high-dimensional spectral information and address the problem of limited and imbalanced samples [23]. However, these advanced methods are ill-suited for this task, as they were developed predominantly for hyperspectral image classification, not for the unique data structure of Digital Elevation Models (DEMs). More importantly, their attention mechanisms are unguided by external vector information, making them unable to analyze the specific spatial relationship between the transmission line’s alignment and the surrounding terrain.
In summary, current studies on micro-terrain identification mainly focus on topographical features, with limited attention to the spatial alignment of transmission lines. Furthermore, there has been comparatively little research dedicated to specifically tailoring these advanced models for scenarios involving Digital Elevation Model (DEM) data. Therefore, this paper aims to address these gaps by developing an intelligent recognition method for micro-terrain regions that explicitly incorporates trans-mission line alignment. To support this objective, a micro-terrain dataset tailored for power grid applications was constructed through simulated transmission routing and the collection of real-world disaster cases. The proposed dual-branch network is de-signed to independently encode transmission line alignment and terrain features. Their interaction is explicitly modeled through a cross-branch spatial attention, which leverages directional cues from the line branch to guide the terrain branch’s focus on key areas, enabling effective fusion of the two modalities.
The remainder of this paper is organized as follows. Section 2 details the proposed deep learning methodology, including the dual-branch architecture and the attention mechanisms. Section 3 describes the experimental setup, including the datasets created and the evaluation metrics used. Section 4 presents and discusses the experimental results, including ablation studies and comparisons with other models. Finally, Section 5 concludes the paper and suggests directions for future work.

2. Methodology

Conventional Convolutional Neural Networks (CNNs) encounter two primary technical bottlenecks in the recognition of transmission line micro-topography. First, their single-scale feature extraction mechanisms fail to capture both local details and global terrain patterns simultaneously. Second, they struggle to effectively fuse heterogeneous data, such as geographical elevation (Geo-Inf) and line-aligned (Line-Inf) information.
To address these limitations, we propose a dual-branch, multi-scale CNN architecture. This architecture employs multi-scale modules to extract a rich hierarchy of spatial features in parallel. Furthermore, it leverages an attention mechanism to achieve adaptive feature weighting and effective fusion of cross-branch information. As illustrated in Figure 1, this design enables the model to perform more comprehensive contextual inference from the two data modalities, thereby improving the accuracy and robustness of micro-topography recognition.
The overall workflow of this study is illustrated in Figure 2. It comprises two main stages: (1) the construction of the micro-terrain dataset based on DEM data and simulated line alignments, and (2) the training and evaluation of the proposed dual-branch attention network.

2.1. Input Data Formulation and Dual-Branch Structure

The proposed dual-branch network processes two distinct, heterogeneous inputs simultaneously. The first, designed for the geographic elevation (Geo Inf) branch, is a 227 × 227 × 7 composite feature map engineered to provide a comprehensive topographical representation. This input originates from a foundational Digital Elevation Model (DEM) and is augmented with six additional terrain factors to capture nuanced geographic characteristics often lost in preprocessing. The factors of slope, aspect, plan curvature, profile curvature, aspect variation, and slope variation were systematically selected through correlation analysis and Jensen-Shannon (JS) divergence to ensure minimal linear correlation and spatial similarity, thereby maximizing the unique information contributed by each channel. The second input, processed by the transmission line (Line Inf) branch, is a 227 × 227 × 1 single-channel map that explicitly encodes the spatial trajectory and orientation of the transmission line corridor.
Initially, data in each branch passes through two feature extraction layers. The core interaction occurs via the Cross-branch Spatial Attention mechanism, which applies spatial attention weights derived from the Line-Inf branch to the Geo-Inf branch, yielding a weighted feature map, Fcs. This map is then concatenated with the original feature map, passed through an additional extraction layer, and refined by a CBAM. Subsequently, a multi-scale feature extraction block, comprising two Inception layers, captures features at different depths. Finally, the fused features are fed into two fully connected (FC) layers to produce the classification result.

2.2. Multi-Scale Module

The multi-scale module comprises two sub-modules: input multi-scale and feature multi-scale.
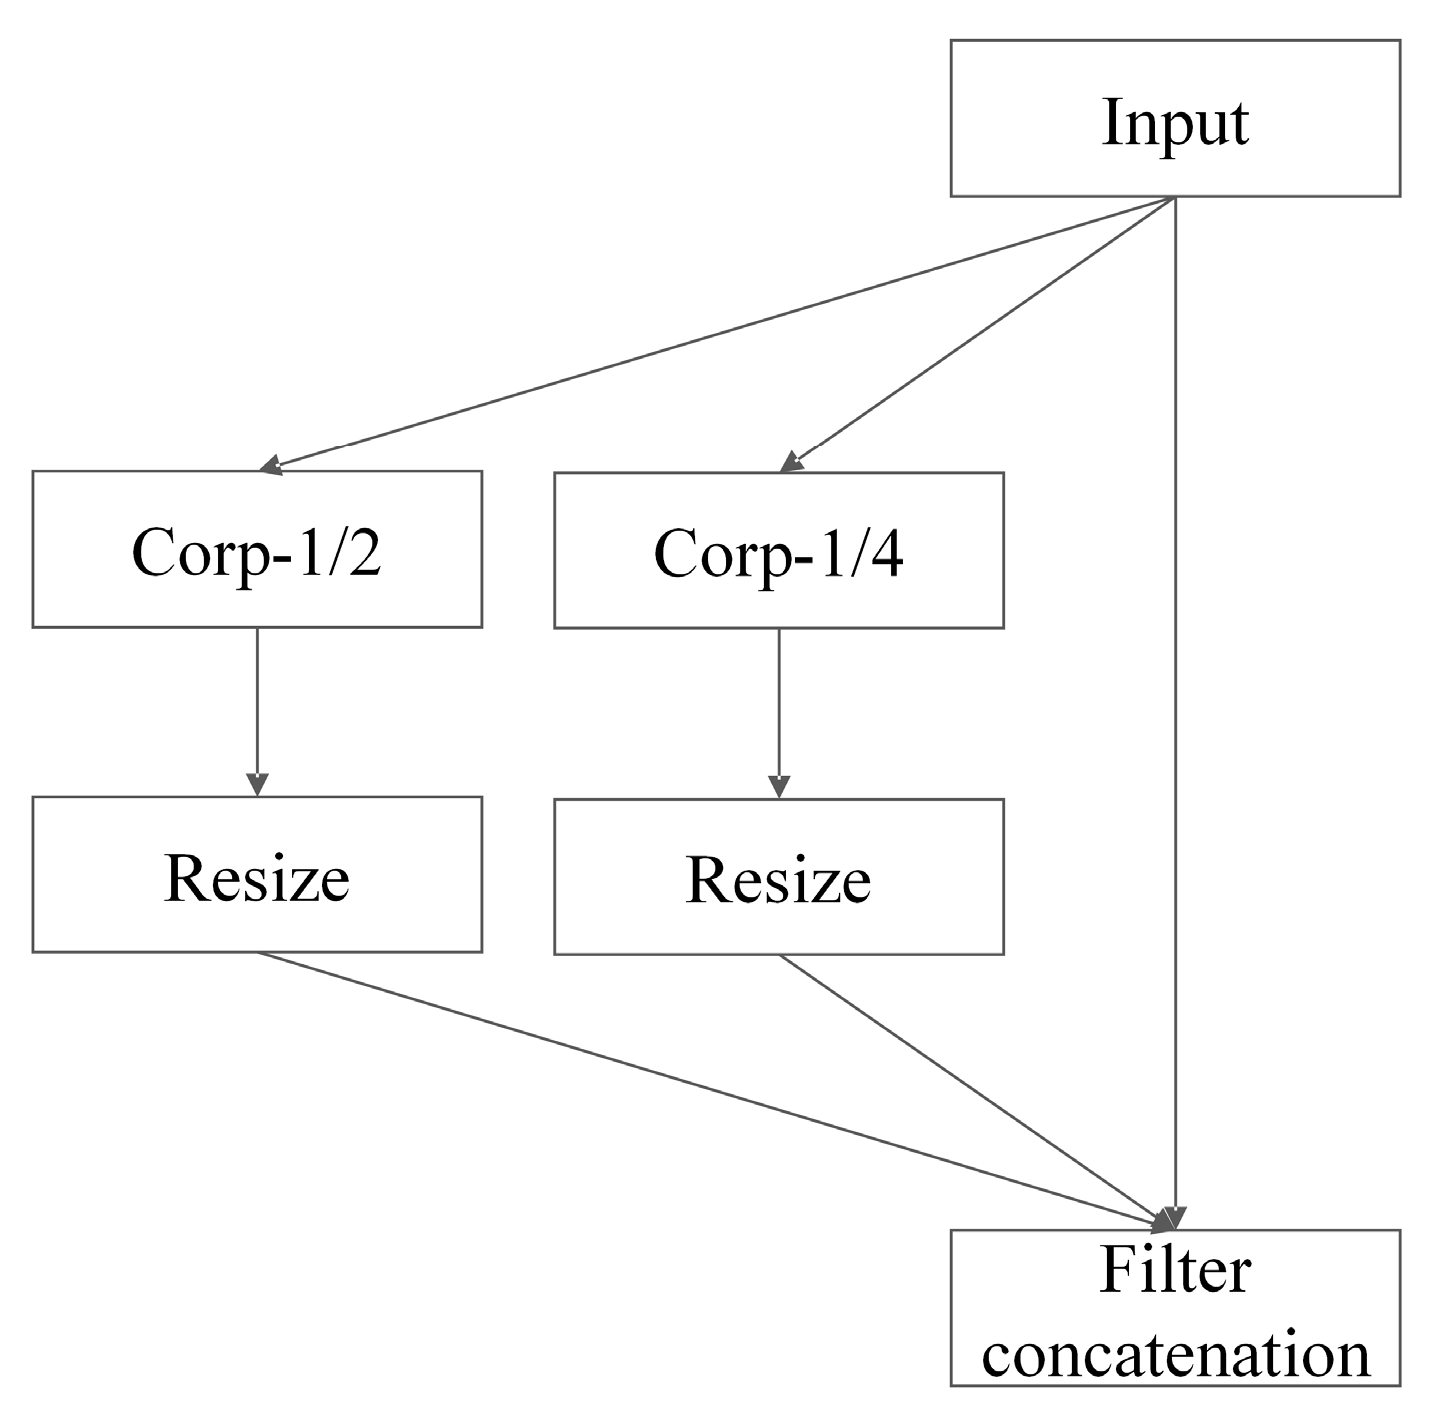
The Input Multi-Scale Module, as shown in Figure 3, simulates various visual heights by feeding feature maps of different sizes into the network. The input feature map is center-cropped to half and a quarter of its original size, then resized back to the original dimensions. It is then concatenated with the original feature map and fed into the next layer.
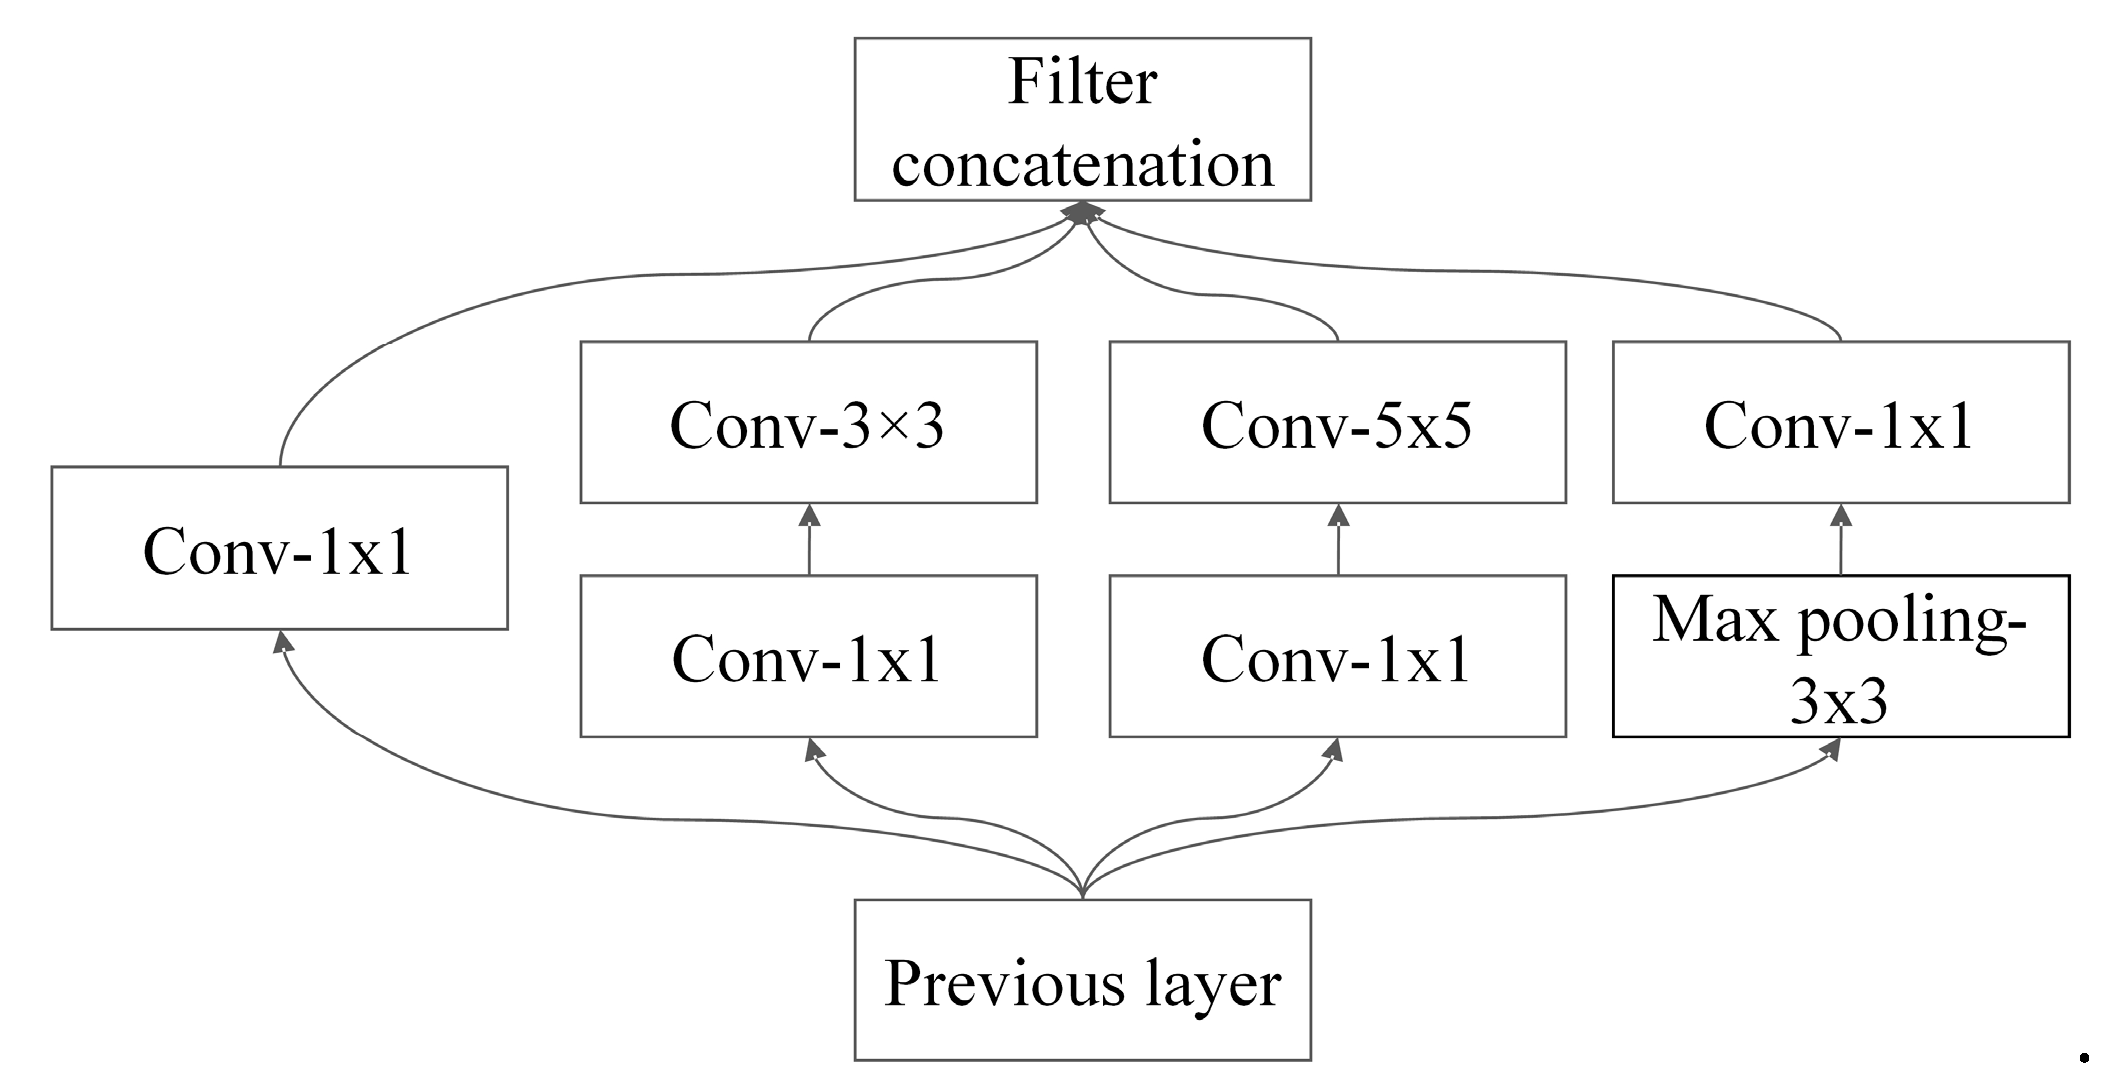
This study uses multiple Inception structures in series as the multi-scale feature extraction module, as shown in Figure 4. By using parallel convolutional kernels and pooling operations of different sizes within the same layer, the module extracts features at various scales and concatenates them together. Each branch uses 1 × 1 convolution for dimensionality reduction, preventing a significant increase in network parameters and minimizing the impact on training time.

2.3. Attention Mechanisms

To enhance feature representation and fusion, the model leverages two key attention mechanisms. The first is the established Convolutional Block Attention Module (CBAM) for intra-branch feature refinement. The second is the Cross-branch Spatial Attention module, which is specifically designed for inter-branch information fusion.

2.3.1. Convolutional Block Attention Module (CBAM)

To address the challenge of classifying subtle topographical variations, our architecture incorporates the Convolutional Block Attention Module (CBAM) [24] to perform feature refinement within the Geo-Inf branch. Strategically placed after our proposed cross-branch fusion, CBAM excels at adaptively selecting the most salient channel and spatial information, thereby enhancing the features critical for classification.
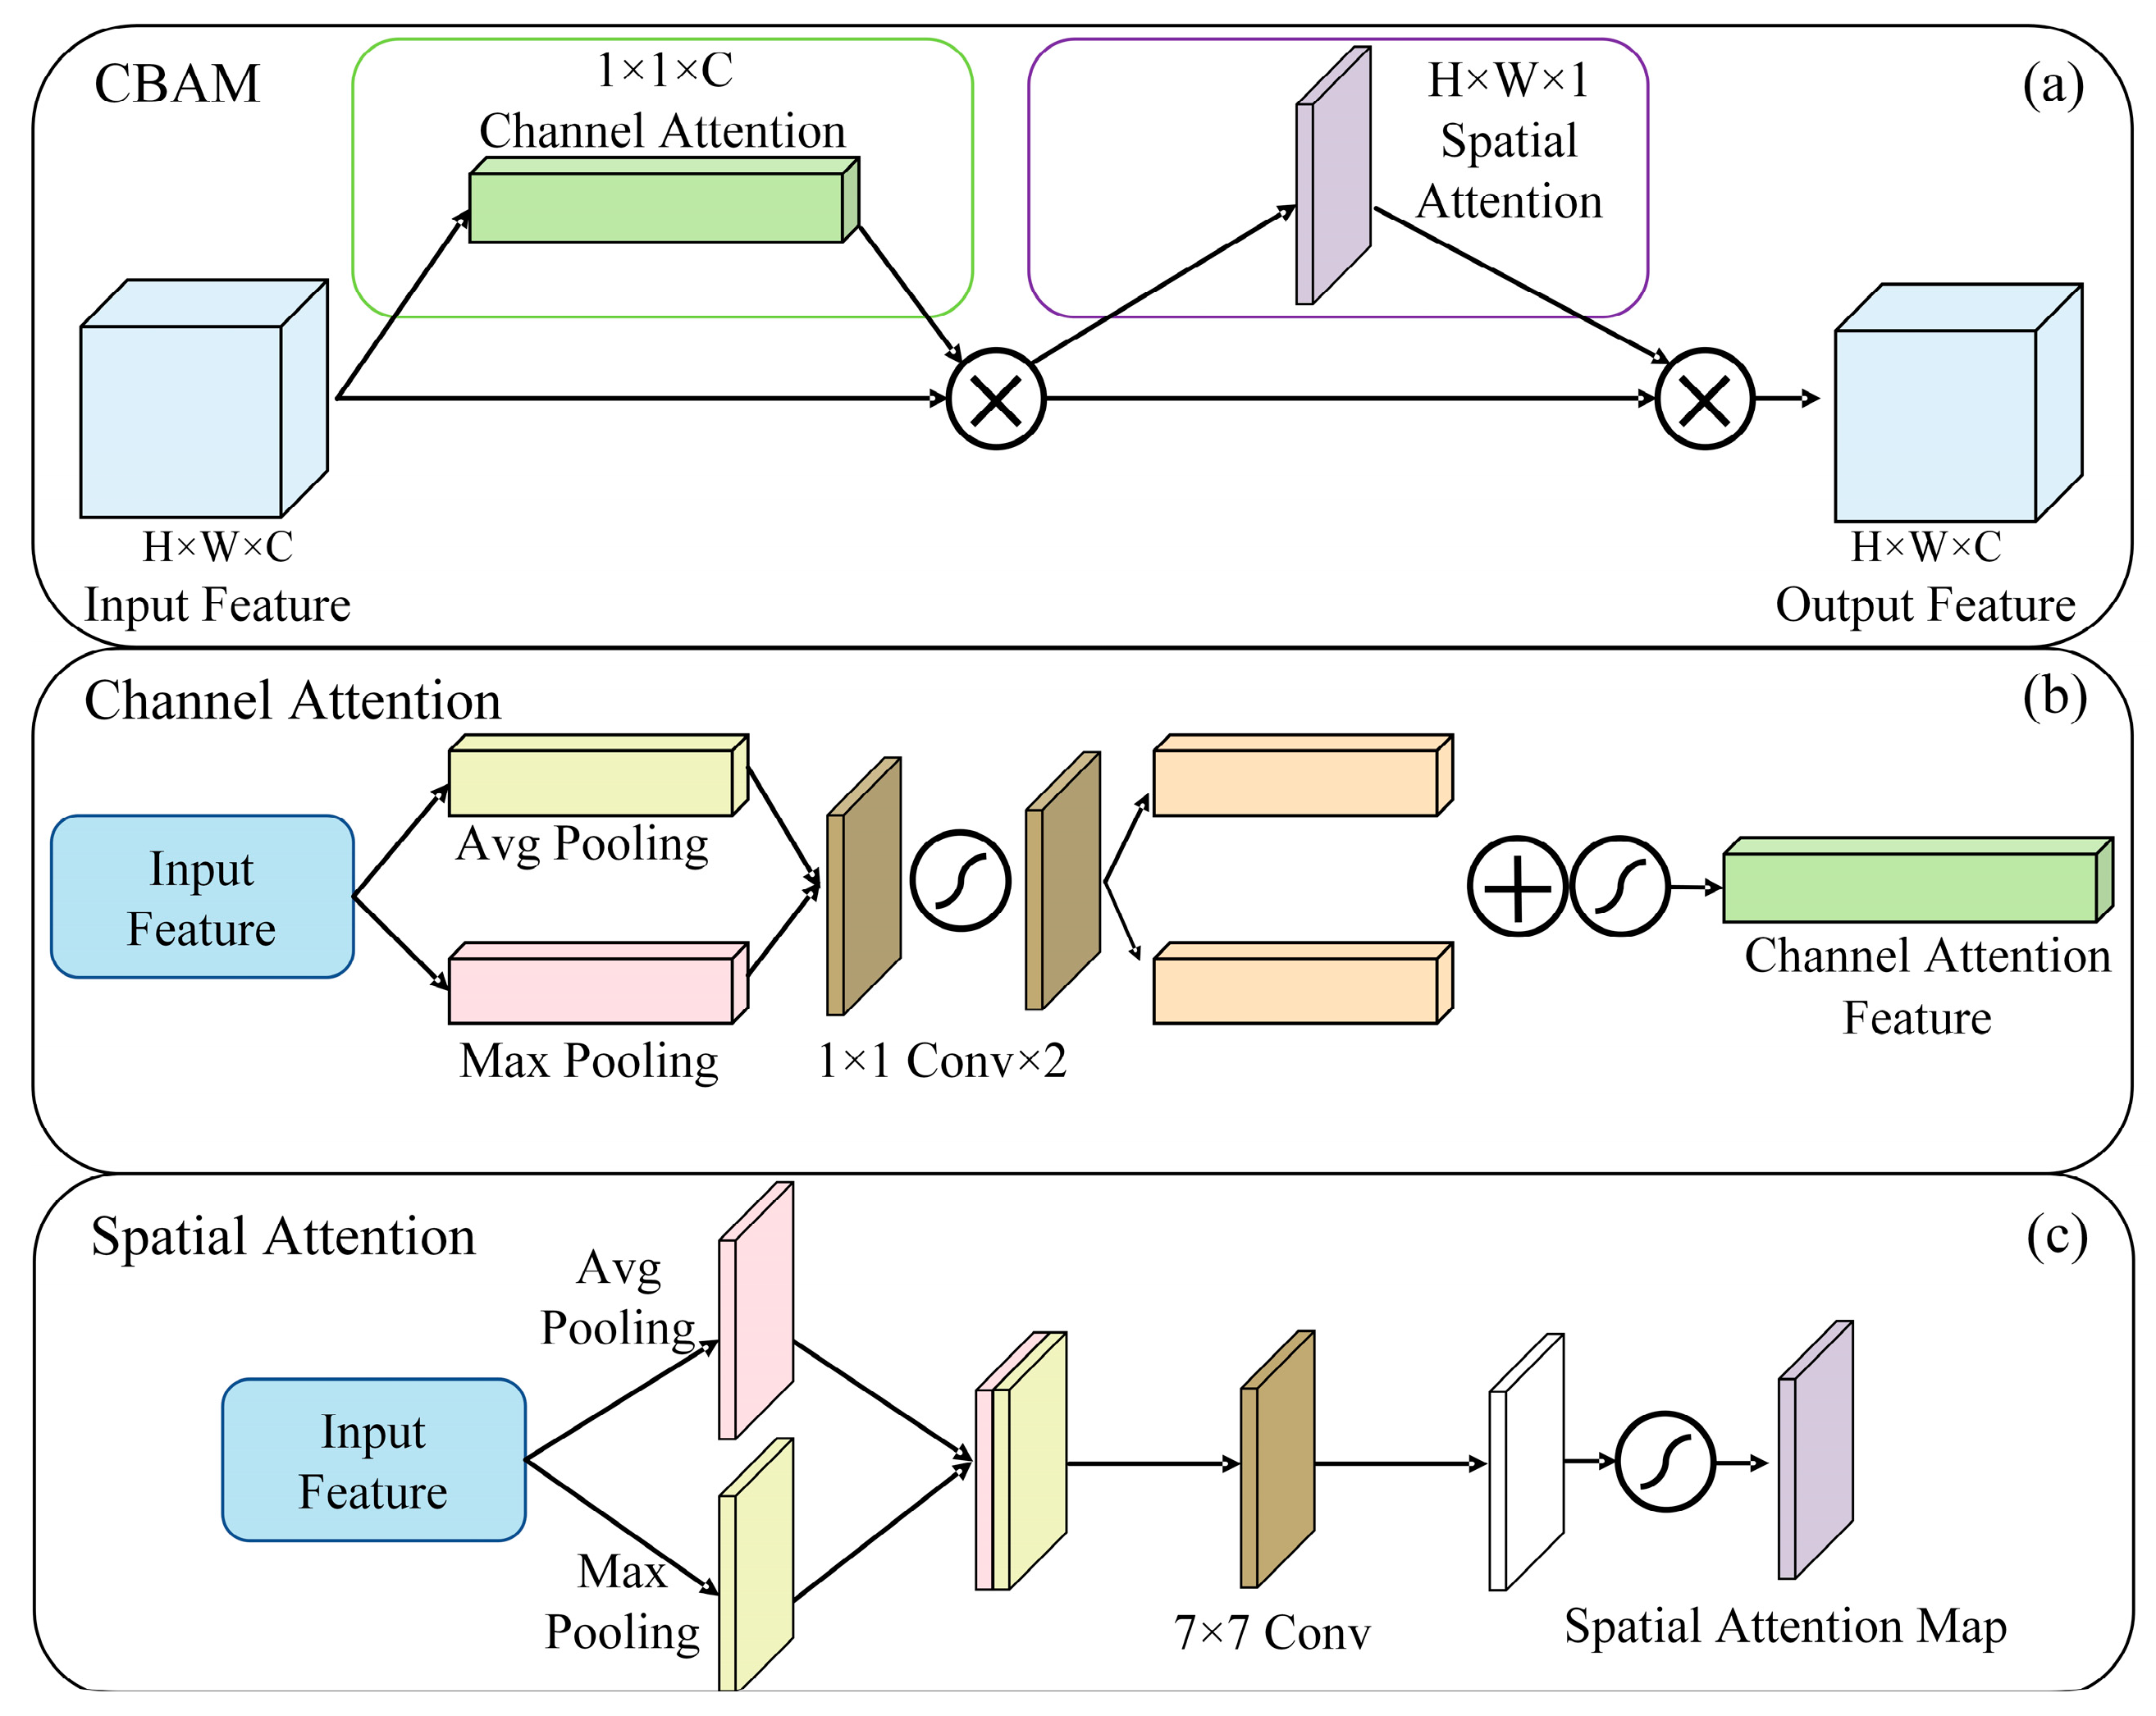
As illustrated in Figure 5a, the CBAM architecture achieves this refinement through two sequential sub-modules. This map is first passed through the Channel Attention module, detailed in Figure 5b, to determine ‘what’ features are important. Subsequently, the Spatial Attention module, shown in Figure 5c, processes this output to identify ‘where those features are relevant.
The input feature map undergoes both global average and max pooling. These outputs are fed into a shared multi-layer perceptron (MLP) composed of two 1 × 1 convolutional layers to produce channel attention coefficients. The final channel attention weight M c is obtained after element-wise summation and a Sigmoid activation.
The channel attention module M c ( F ) and the spatial attention module M s ( F ) can be calculated based on Equations (1) and (2):
M c ( F ) = σ ( M L P ( A v g P o o l ( F ) ) + M L P ( M a x P o o l ( F ) ) )                     = σ W 1 W 0 F A v g + σ W 1 W 0 F M a x
M s ( F ) = σ ( f 7   ×   7 ( [ A v g P o o l ( F ) ; M a x P o o l ( F ) ] ) ) = σ f 7   ×   7 F A v g ; F M ax                  
where F represents the input feature map; A v g P o o l and M a x P o o l represent global average pooling and global max pooling, respectively. σ represents the sigmoid activation function, and M L P refers to a shared network composed of two convolutional layers. W 1 and W 0 denote the functions for the two convolution operations. F a v g and F max represent the results of global average pooling and global max pooling, respectively. f 7   ×   7 denotes the convolution operation with a 7 × 7 kernel; [ ] represents concatenation along the channel dimension axis.

2.3.2. Cross-Branch Spatial Attention Module

The cross-branch spatial attention module is a key component designed to explicitly model the interaction between the transmission line’s path and the surrounding terrain. As illustrated in Figure 6, this module leverages the directional information from the Line Inf branch to guide the feature selection in the Geo Inf branch.
The module processes the feature map FA (from the Line Inf branch) to obtain spatial attention weights M S . These weights, which encode the location and orientation of the transmission line, are then multiplied element-wise with the feature map F B (from the Geo Inf branch). This operation effectively acts as a spatial filter, amplifying terrain features that are spatially aligned with the transmission line while suppressing irrelevant background information. The entire process is summarized as follows:
F B S = σ ( f 7   ×   7 ( [ A v g P o o l ( F A ) ; M a x P o o l ( F A ) ] ) ) F B = σ ( f 7   ×   7 ( [ F A A v e ; F A M a x ] ) ) F B                                        
where f 7   ×   7 denotes the convolution operation with a 7 × 7 kernel; [ ] represents channel concatenation; σ stands for the activation function. F A A v e and F A M a x are the two feature maps of size H × W × 1 obtained after global average pooling and global max pooling, respectively. denotes element-wise multiplication, and other terms are consistent with previous definitions. This mechanism provides a more direct and interpretable way to fuse the two data modalities compared to simple concatenation, directly addressing the core requirement of the research problem.

3. Experiment

3.1. The National DEM Data Source

The elevation dataset was generated from maps with a 12.5 m resolution, acquired from the Alaska Satellite Facility (ASF) Data Search platform [25]. The maps were processed through format conversion, stitching, filtering and clipping. In accordance with established survey specifications [26], DEM search radius of 2 km was adopted for the transmission lines, a distance equivalent to approximately four to five spans. Consequently, an input image size of 227 × 227 pixels was selected to ensure the neural network could adequately encompass this area. This dimension is also a standard input for many prominent CNN architectures, which facilitates straightforward model implementation and comparison.

3.2. Micro-Terrain Elevation Dataset

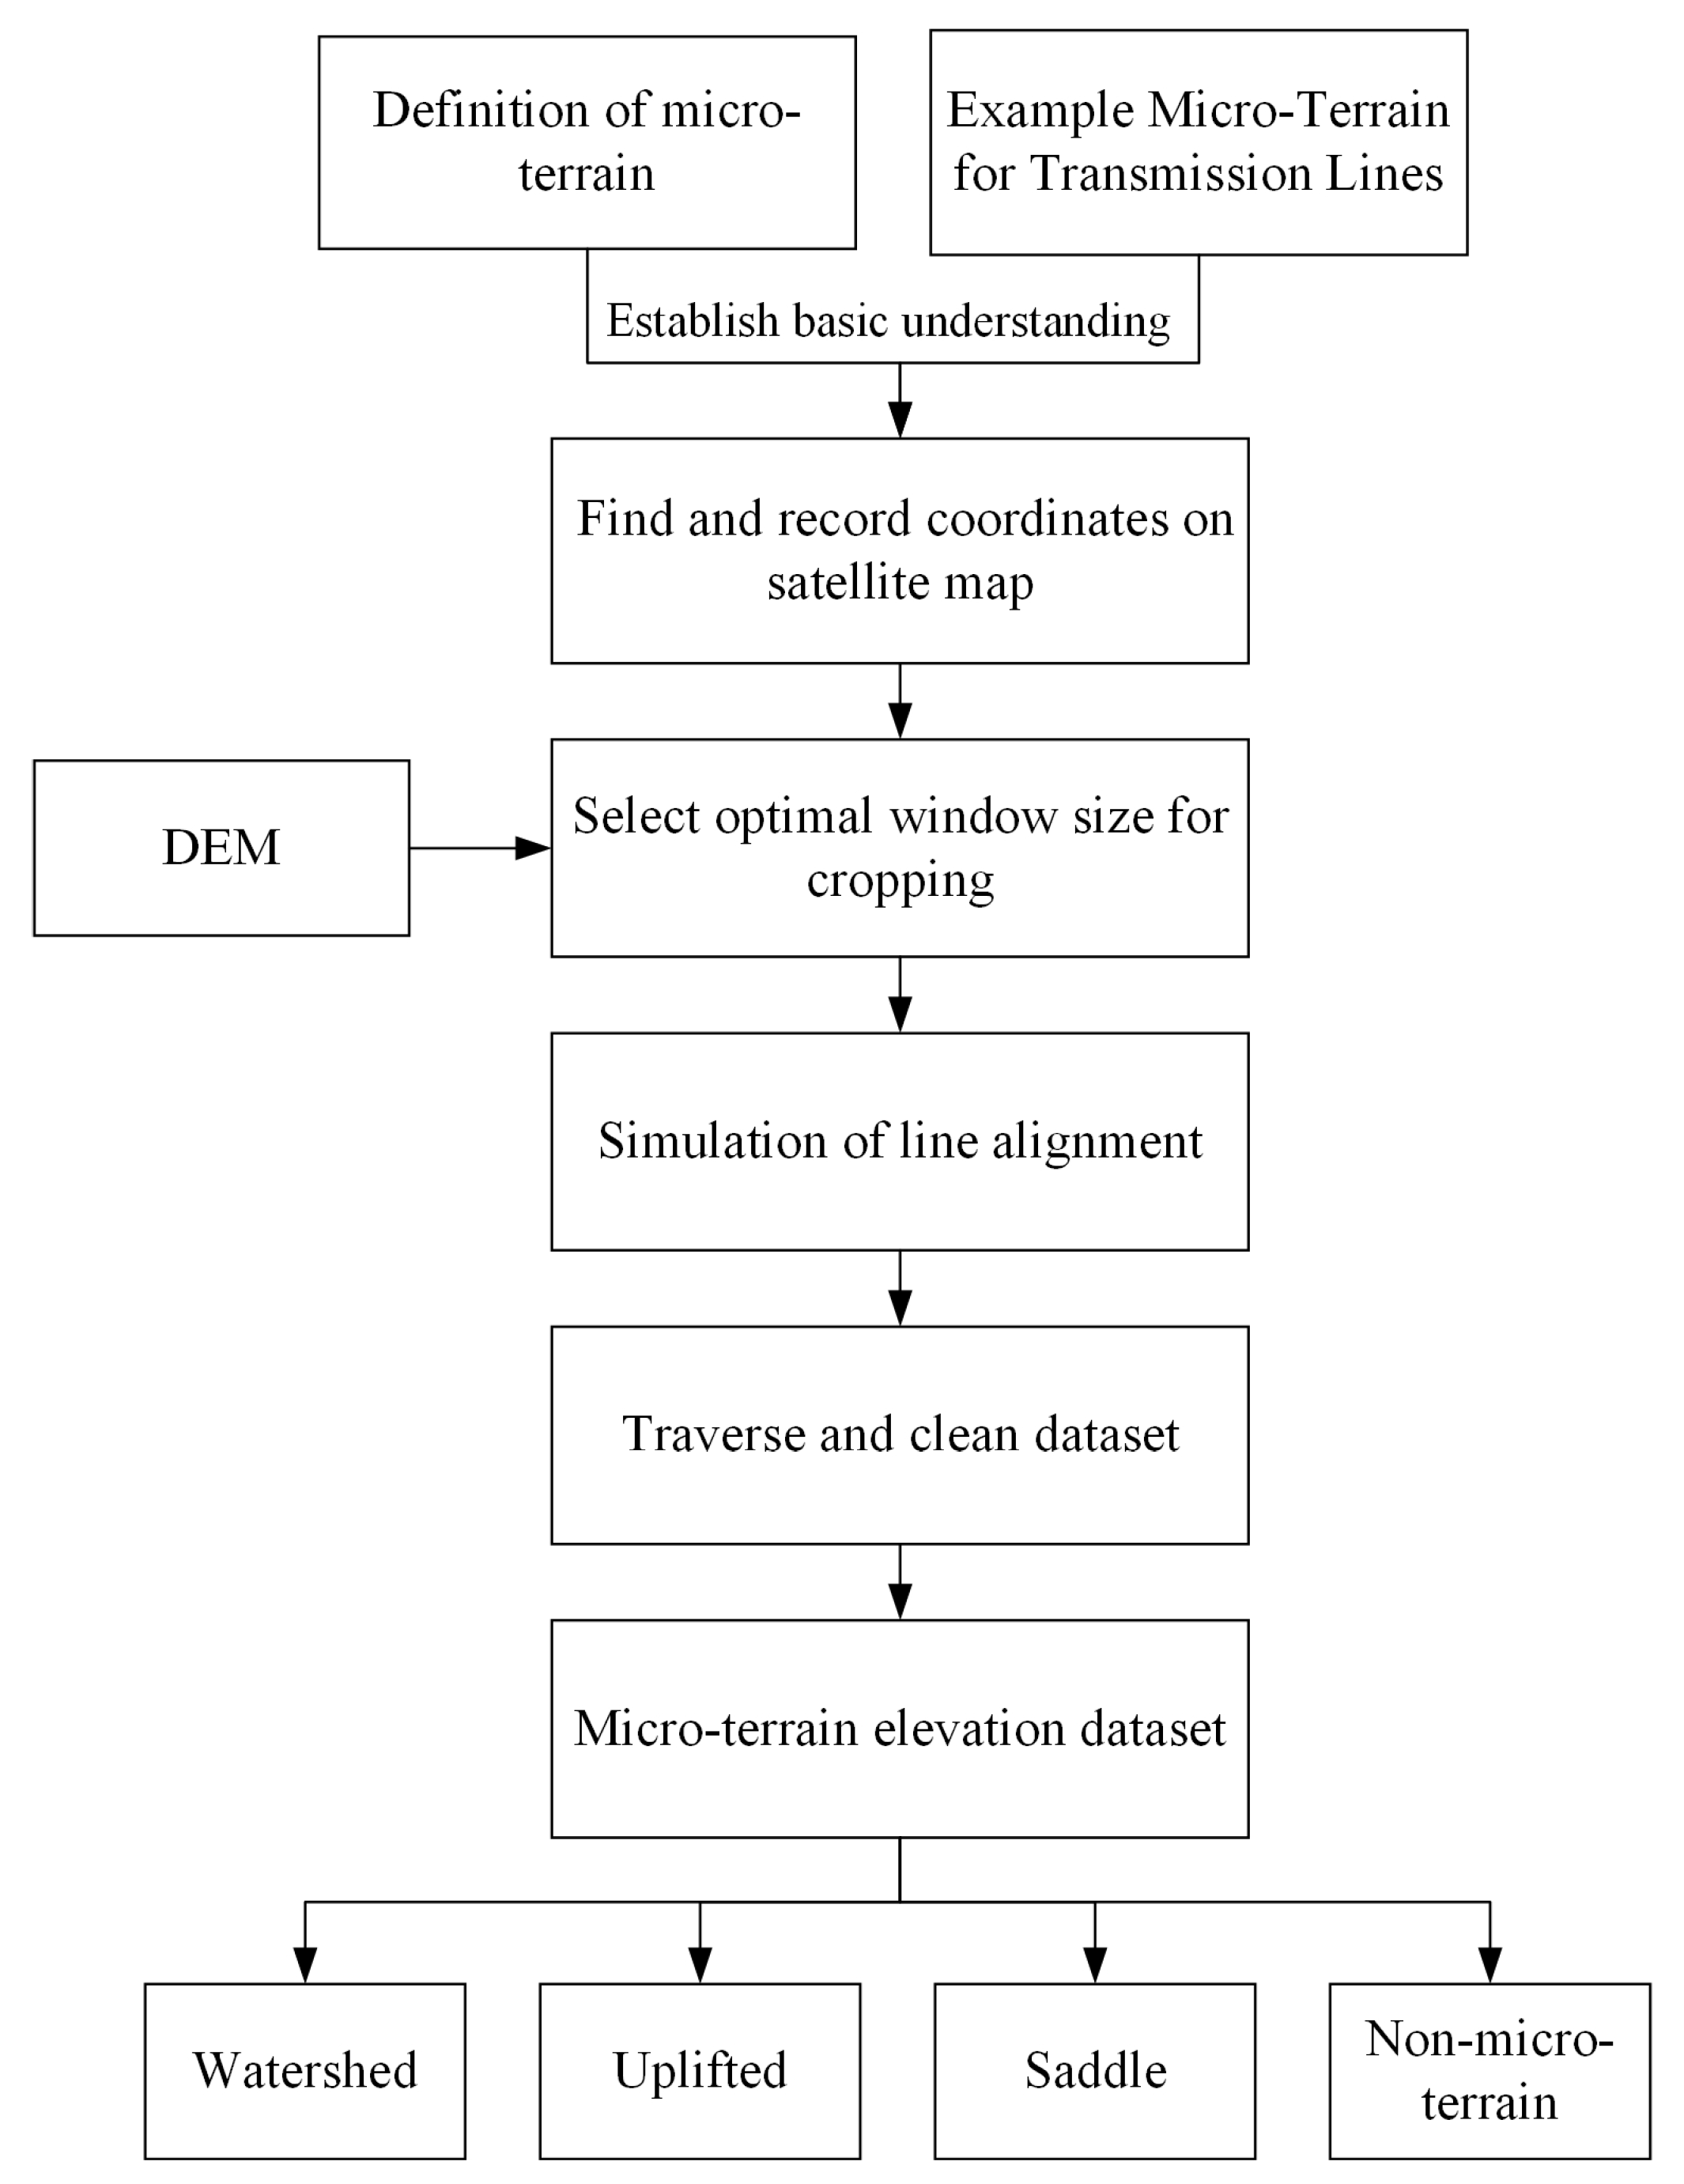
For the construction of the micro-terrain training dataset, micro-terrain regions were first identified and their coordinates recorded using satellite imagery. An optimal window containing only one type of typical micro-terrain was then manually selected from each region’s elevation map. Following selection, the windows were resampled to a uniform size. The dataset was finalized by incorporating the transmission line trajectory. A detailed illustration of this process is provided in Figure 7.
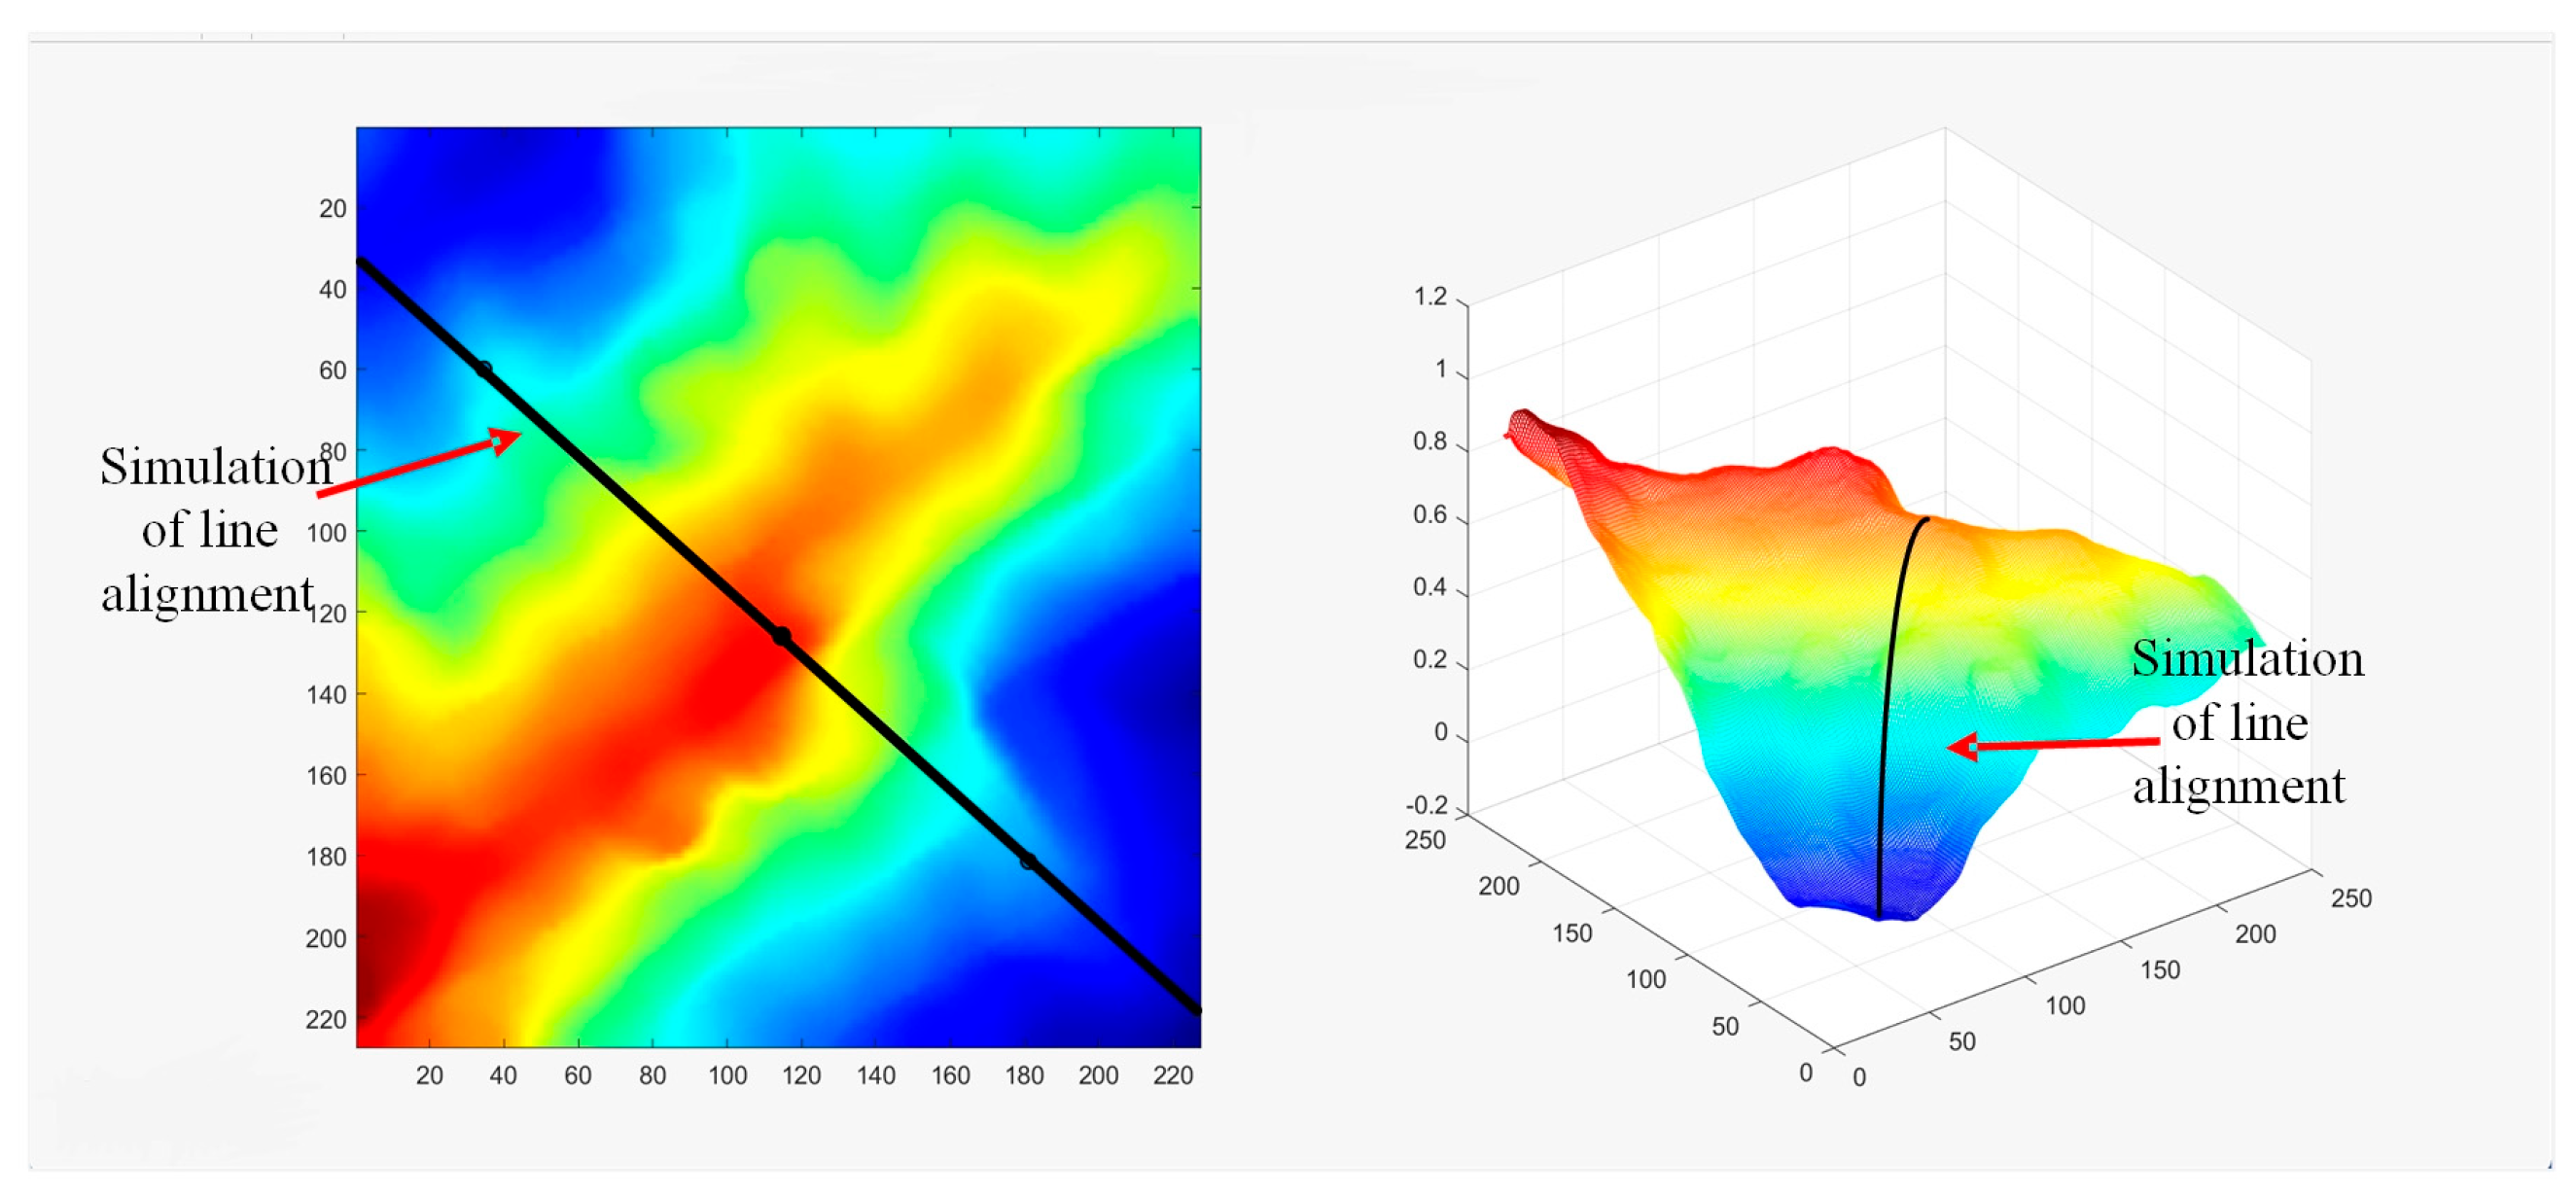
As illustrated in Figure 8, we designated the center of the local elevation map as the tower’s position and simplified the route alignment to a straight line through this point. Each micro-terrain region was subjected to simulations of approximately eight different transmission line alignments. This number was chosen to ensure a comprehensive sampling of all meaningful crossing angles. For symmetrical terrains, we simulated eight alignments at 45-degree intervals to cover a full 360-degree rotation. For non-symmetrical terrains, the number of simulated alignments was adjusted to best capture the unique topographical features. The simulation approach varied depending on the micro-terrain category, with the specific methods outlined below:
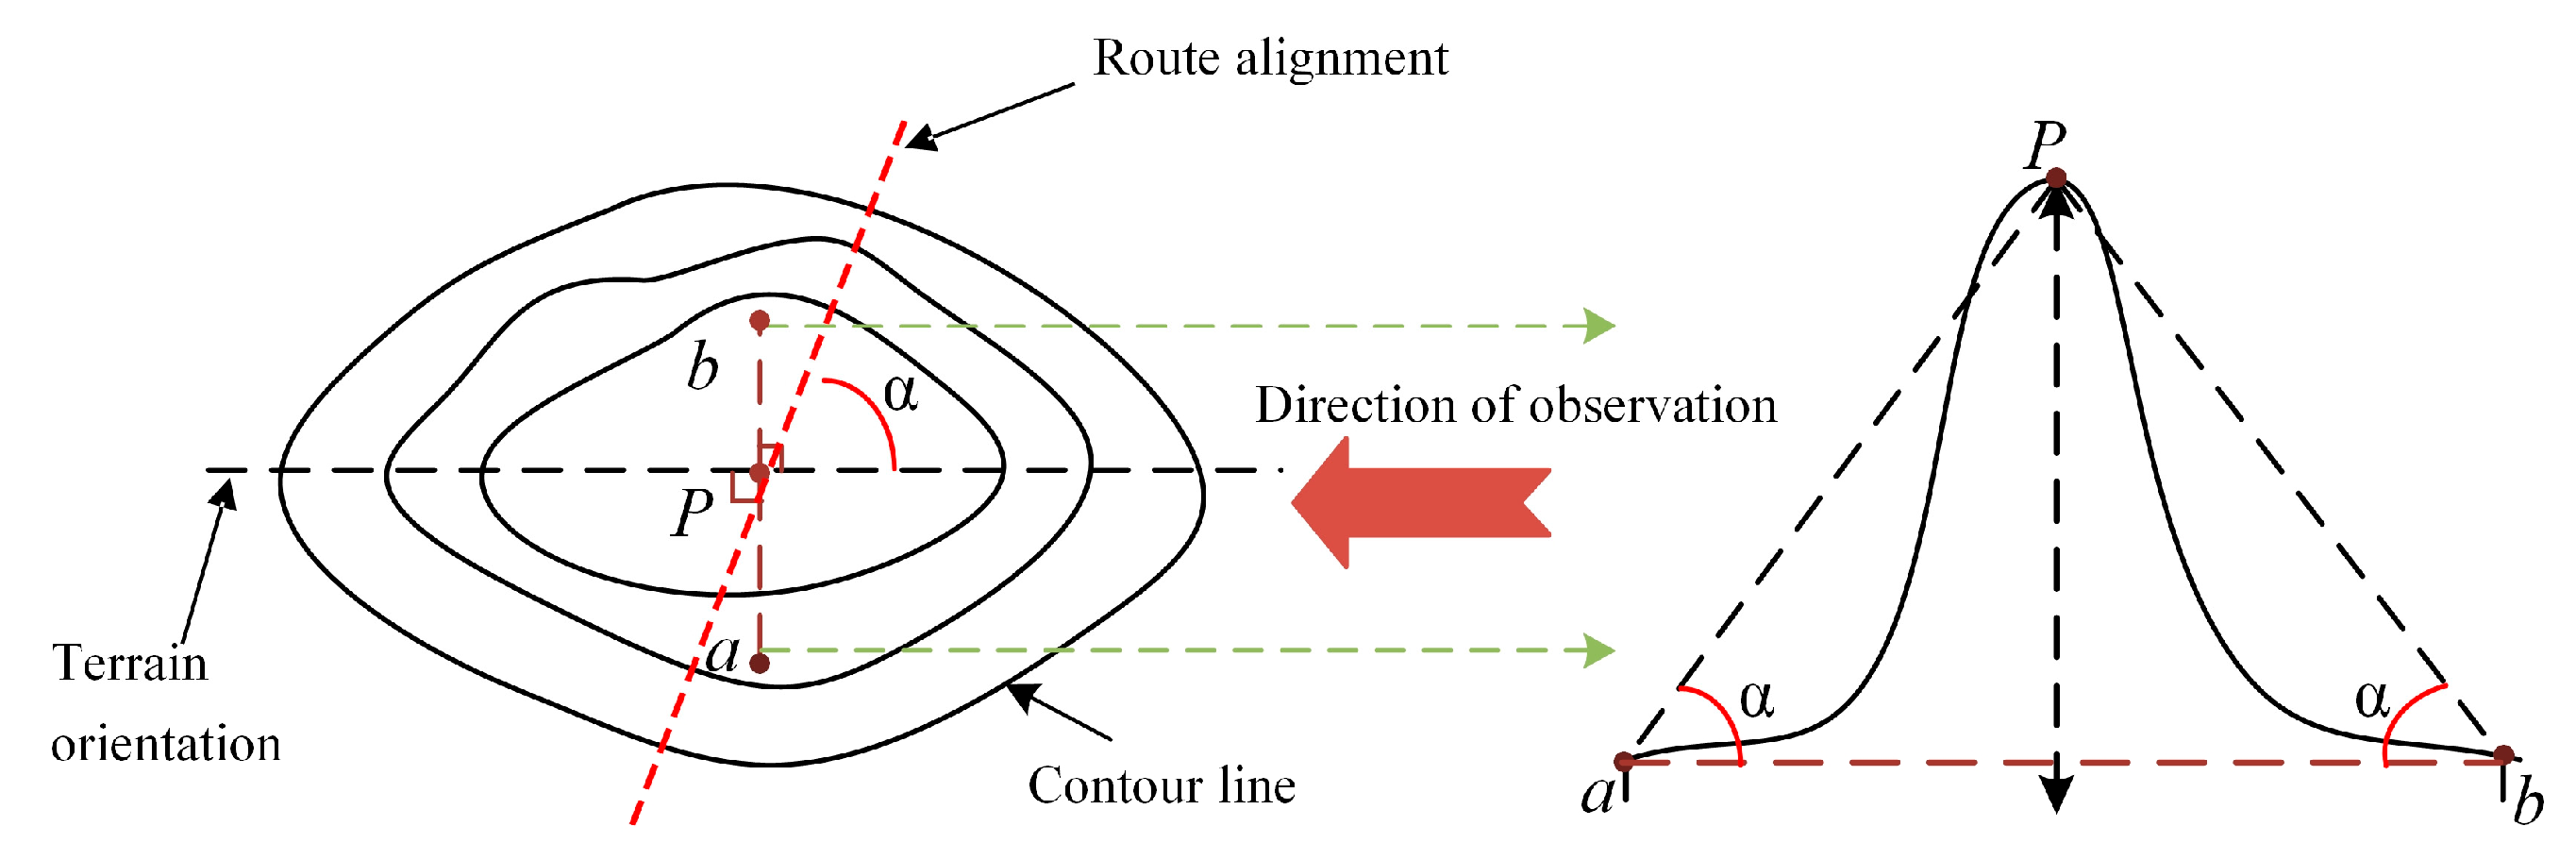
(1) Watershed. This micro-terrain category is characterized by a transmission line traversing a mountain summit. The principal environmental impacts are attributed to the significant elevation gain, which results in decreased ambient temperature, elevated moisture levels, and increased wind speeds. Since these effects are present when the line is in proximity to the summit, any simulated line alignment passing near the summit is classified as the watershed type, irrespective of its crossing angle. A diagram of this classification is provided in Figure 9.
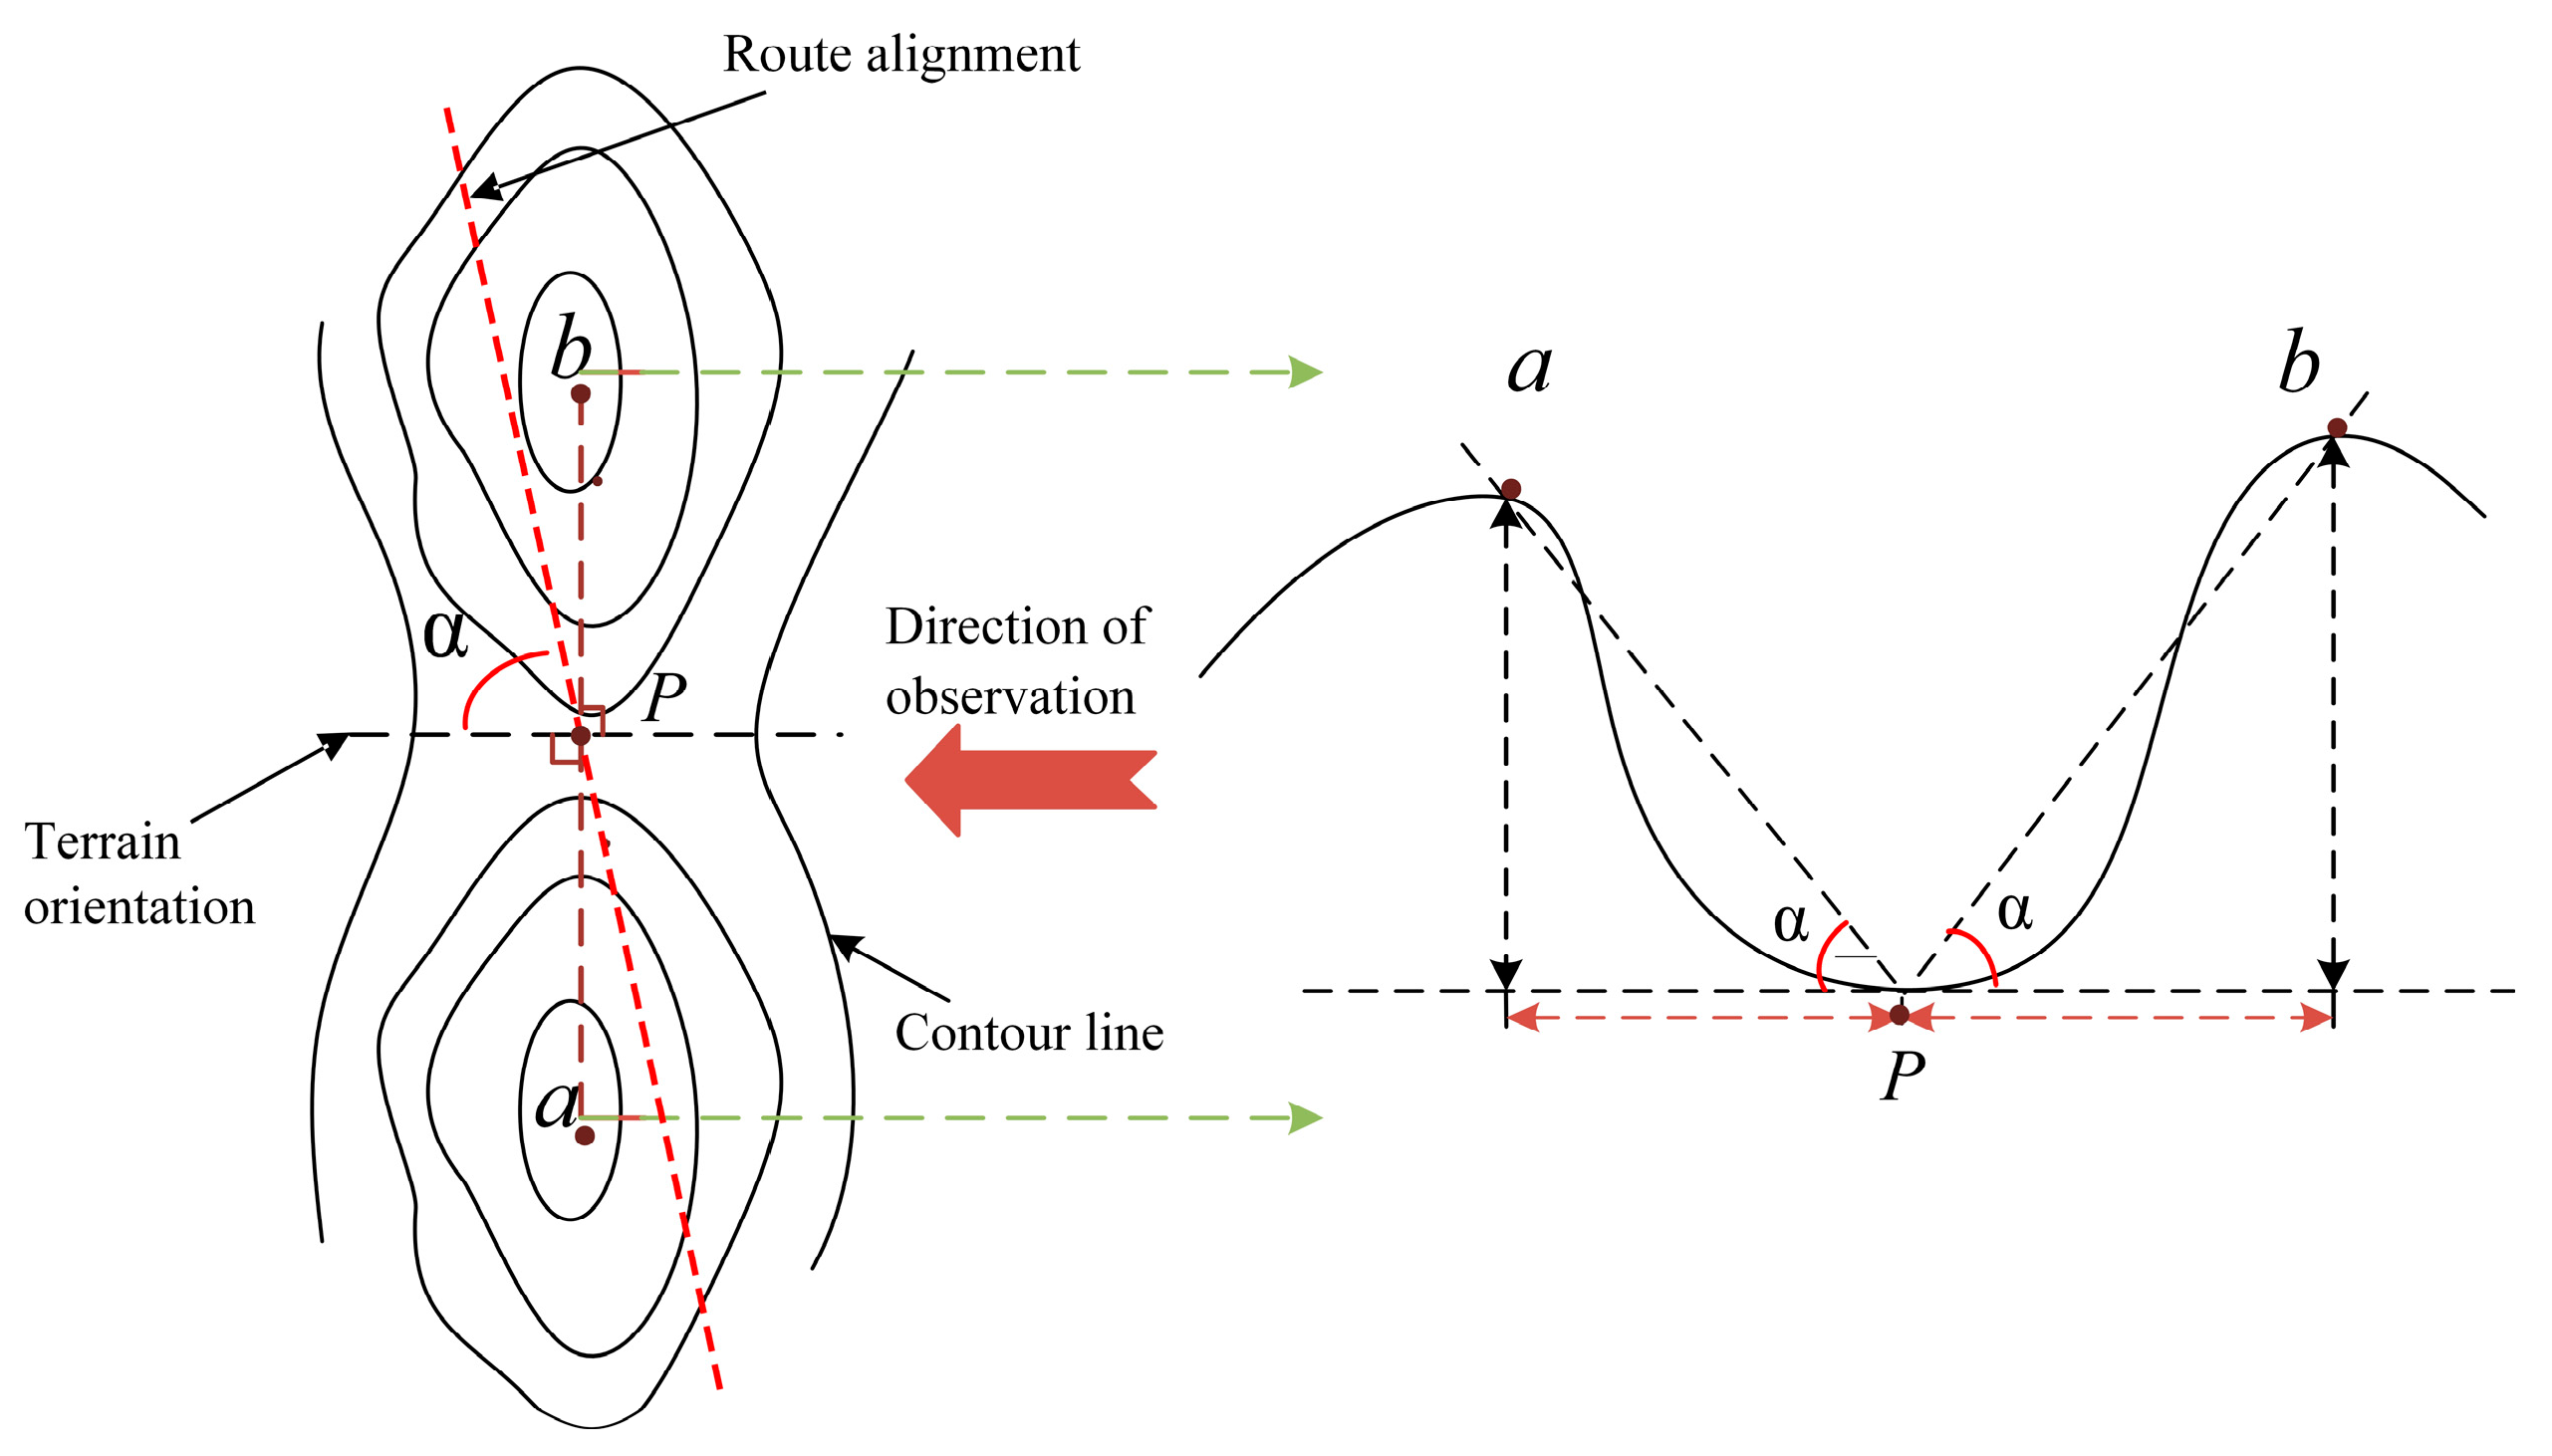
(2) Saddle. This category is defined as a transmission line that crosses a distinct depression on a single ridge or traverses a valley between two mountain ranges. A 30-degree angular threshold is utilized for classification. According to relevant industry specifications [27] and literature [28], a slope exceeding 30 degrees is classified as steep and is susceptible to geological hazards during heavy rainfall or seismic events, thus necessitating enhanced protective measures. Therefore, if the angle between the transmission line alignment and the principal direction of the saddle is greater than 30 degrees, it is classified as a saddle. Otherwise, it is designated as non-micro terrain, as illustrated in Figure 10.
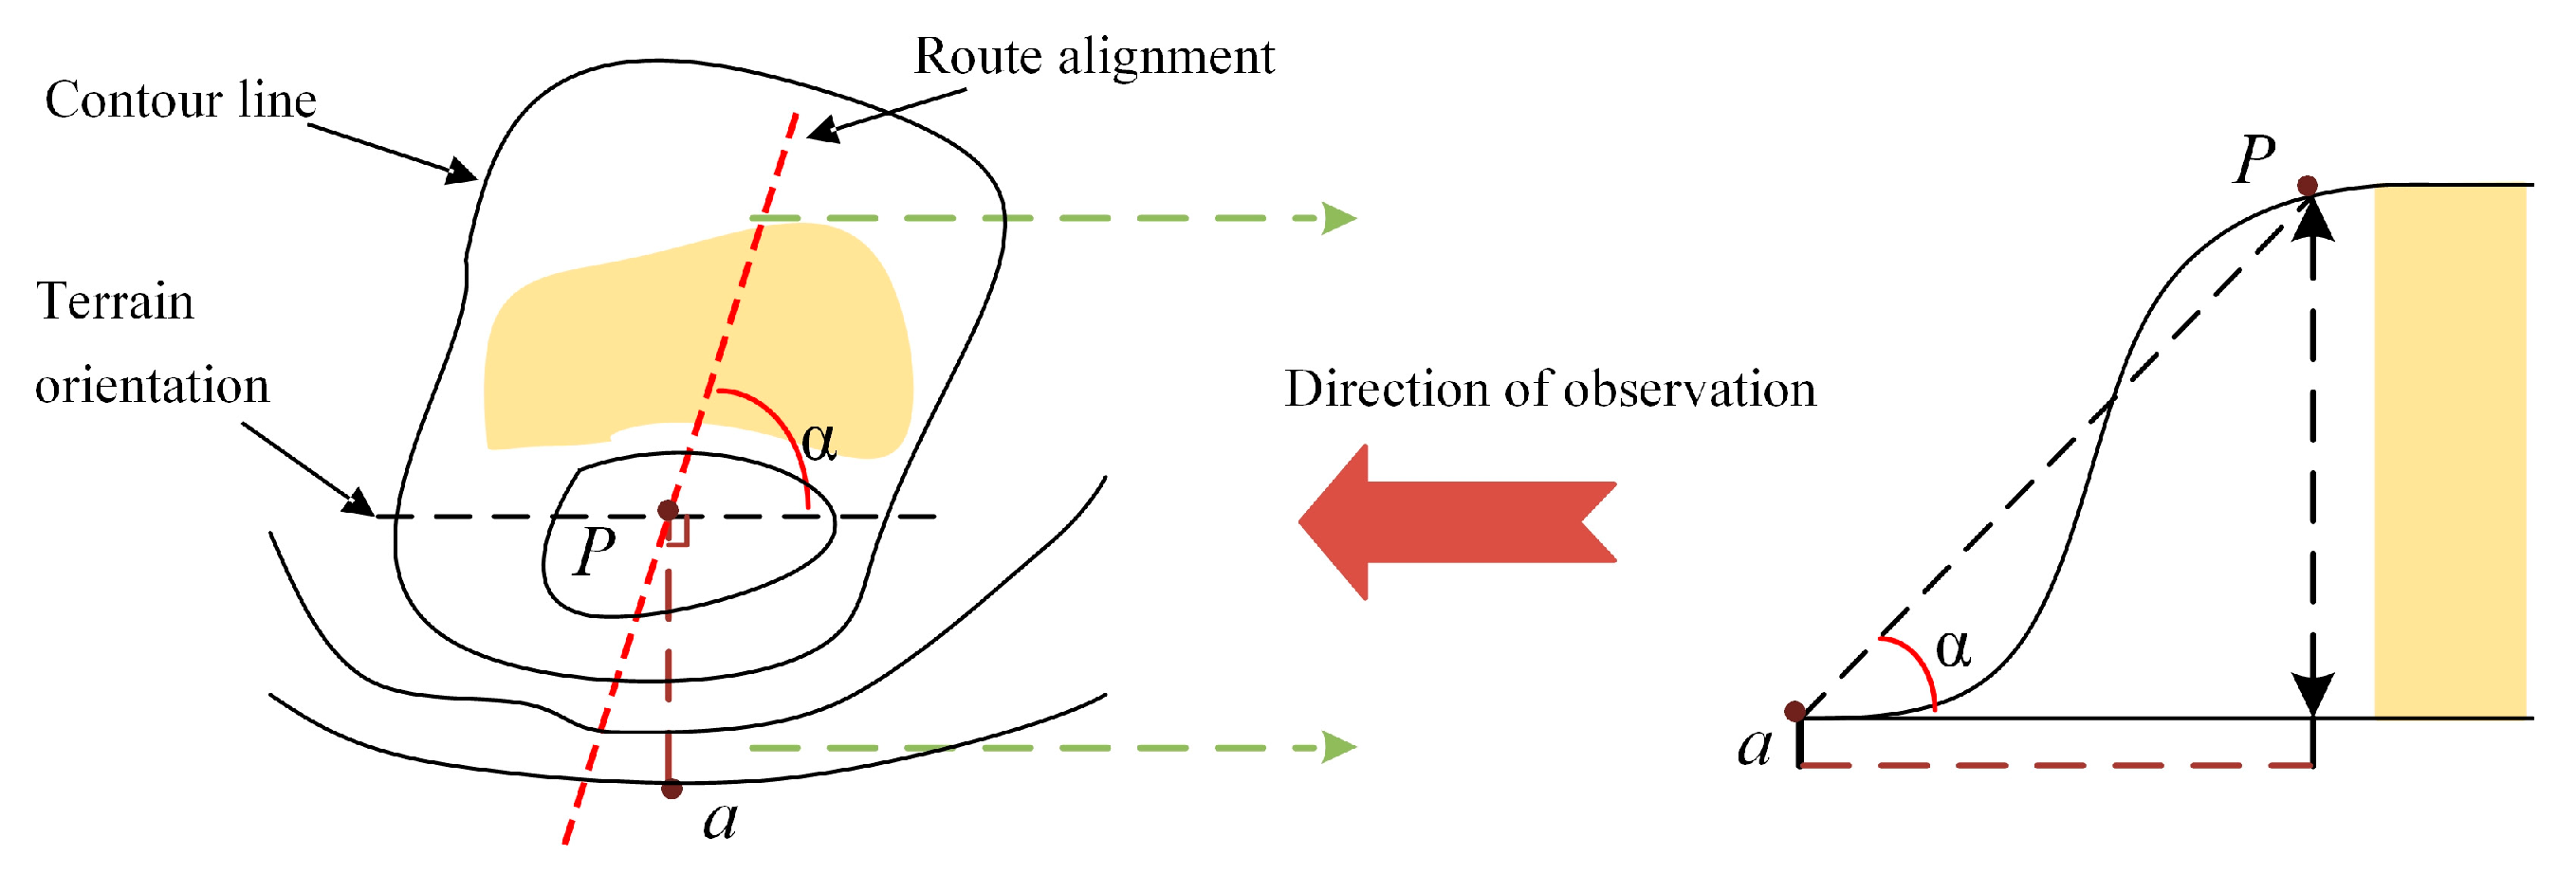
(3) Uplifted: This classification is assigned to a transmission line that crosses a peak rising abruptly from a plain. The classification criterion is identical to that used for the saddle type. Specifically, the line is categorized as uplifted if the angle between its alignment and the principal direction of the mountain exceeds 30 degrees, as illustrated in Figure 11.
Manual routing simulations were performed on 1068 representative local elevation maps of micro-terrain that lacked existing transmission lines. Following each simulation, the corresponding micro-terrain type was annotated. To prepare the data for the dual-branch network, the simulated line information was formatted into a two-channel image and then paired with its corresponding multi-channel elevation map to form a complete data sample. This procedure generated a dataset of 6495 samples, encompassing both positive (micro-terrain) and negative (non-micro-terrain) instances.
The dataset is divided into a training sample set and a validation sample set in an 8:2 ratio, with the distribution detailed in Table 1.

3.3. Micro-Terrain Instance Test Dataset

A validation dataset was developed by analyzing nationwide meteorological disaster data for transmission lines. For each case, the micro-terrain was manually identified according to pre-defined criteria, with the distribution detailed in Table 2. This dataset includes tower coordinates (latitude and longitude) and is used to validate the model’s performance and for case studies.

3.4. Evaluation Metrics

This study uses Overall Accuracy (OA), Average Accuracy (AA), and the kappa coefficient as evaluation metrics for micro-terrain classification model. These metrics are defined based on the confusion matrix, as shown in Equation (4).
n 11 n 12 n 1 C n 21 n 22 n 2 C n C 1 n C 2 n C C
where denotes C the number of target classes; n i j represents the number of samples of class i predicted as class j. i = 1 C n i j is the total number of samples in class i, and j = 1 C n i j is the total number of samples in class j. The diagonal elements of the confusion matrix indicate correctly classified samples, while off-diagonal elements represent misclassified samples.
OA represents the ratio of correctly classified samples to the total number of samples. The expression is given by Equation (5).
O A = i = 1 C n i i i = 1 C j = 1 C n i j
AA represents the average classification accuracy across all classes, also known as average accuracy. Its expression is given by Equation (6).
A A = i = 1 C n i j j = 1 C n i j C
The kappa coefficient is a metric used for assessing consistency. Its formula is given in Equation (7).
K a p p a = N i = 1 C n i i i = 1 C j = 1 C n i j × i = 1 C n i j N 2 i = 1 C j = 1 C n i j × i = 1 C n i j
where N = i = 1 C j = 1 C n i j represents the total number of samples.

3.5. Model Parameter Configuration

All convolutional neural network models in this study were implemented using the MATLAB (version R2022b) programming language and development environment and trained on a Windows 10 workstation equipped with a GeForce RTX 3090 GPU (24 GB memory). To comprehensively evaluate the proposed model, two primary sets of experiments were conducted: an ablation study to validate the contribution of each architectural component, and a comparative experiment to benchmark performance against established pre-trained models.
The ablation study was designed to systematically quantify the contribution of each architectural innovation. This involved comparing the full model against several ablated versions: a baseline CNN, the dual-branch CNN model without other enhancements, and models where either the attention or the multi-scale module was individually ablated.
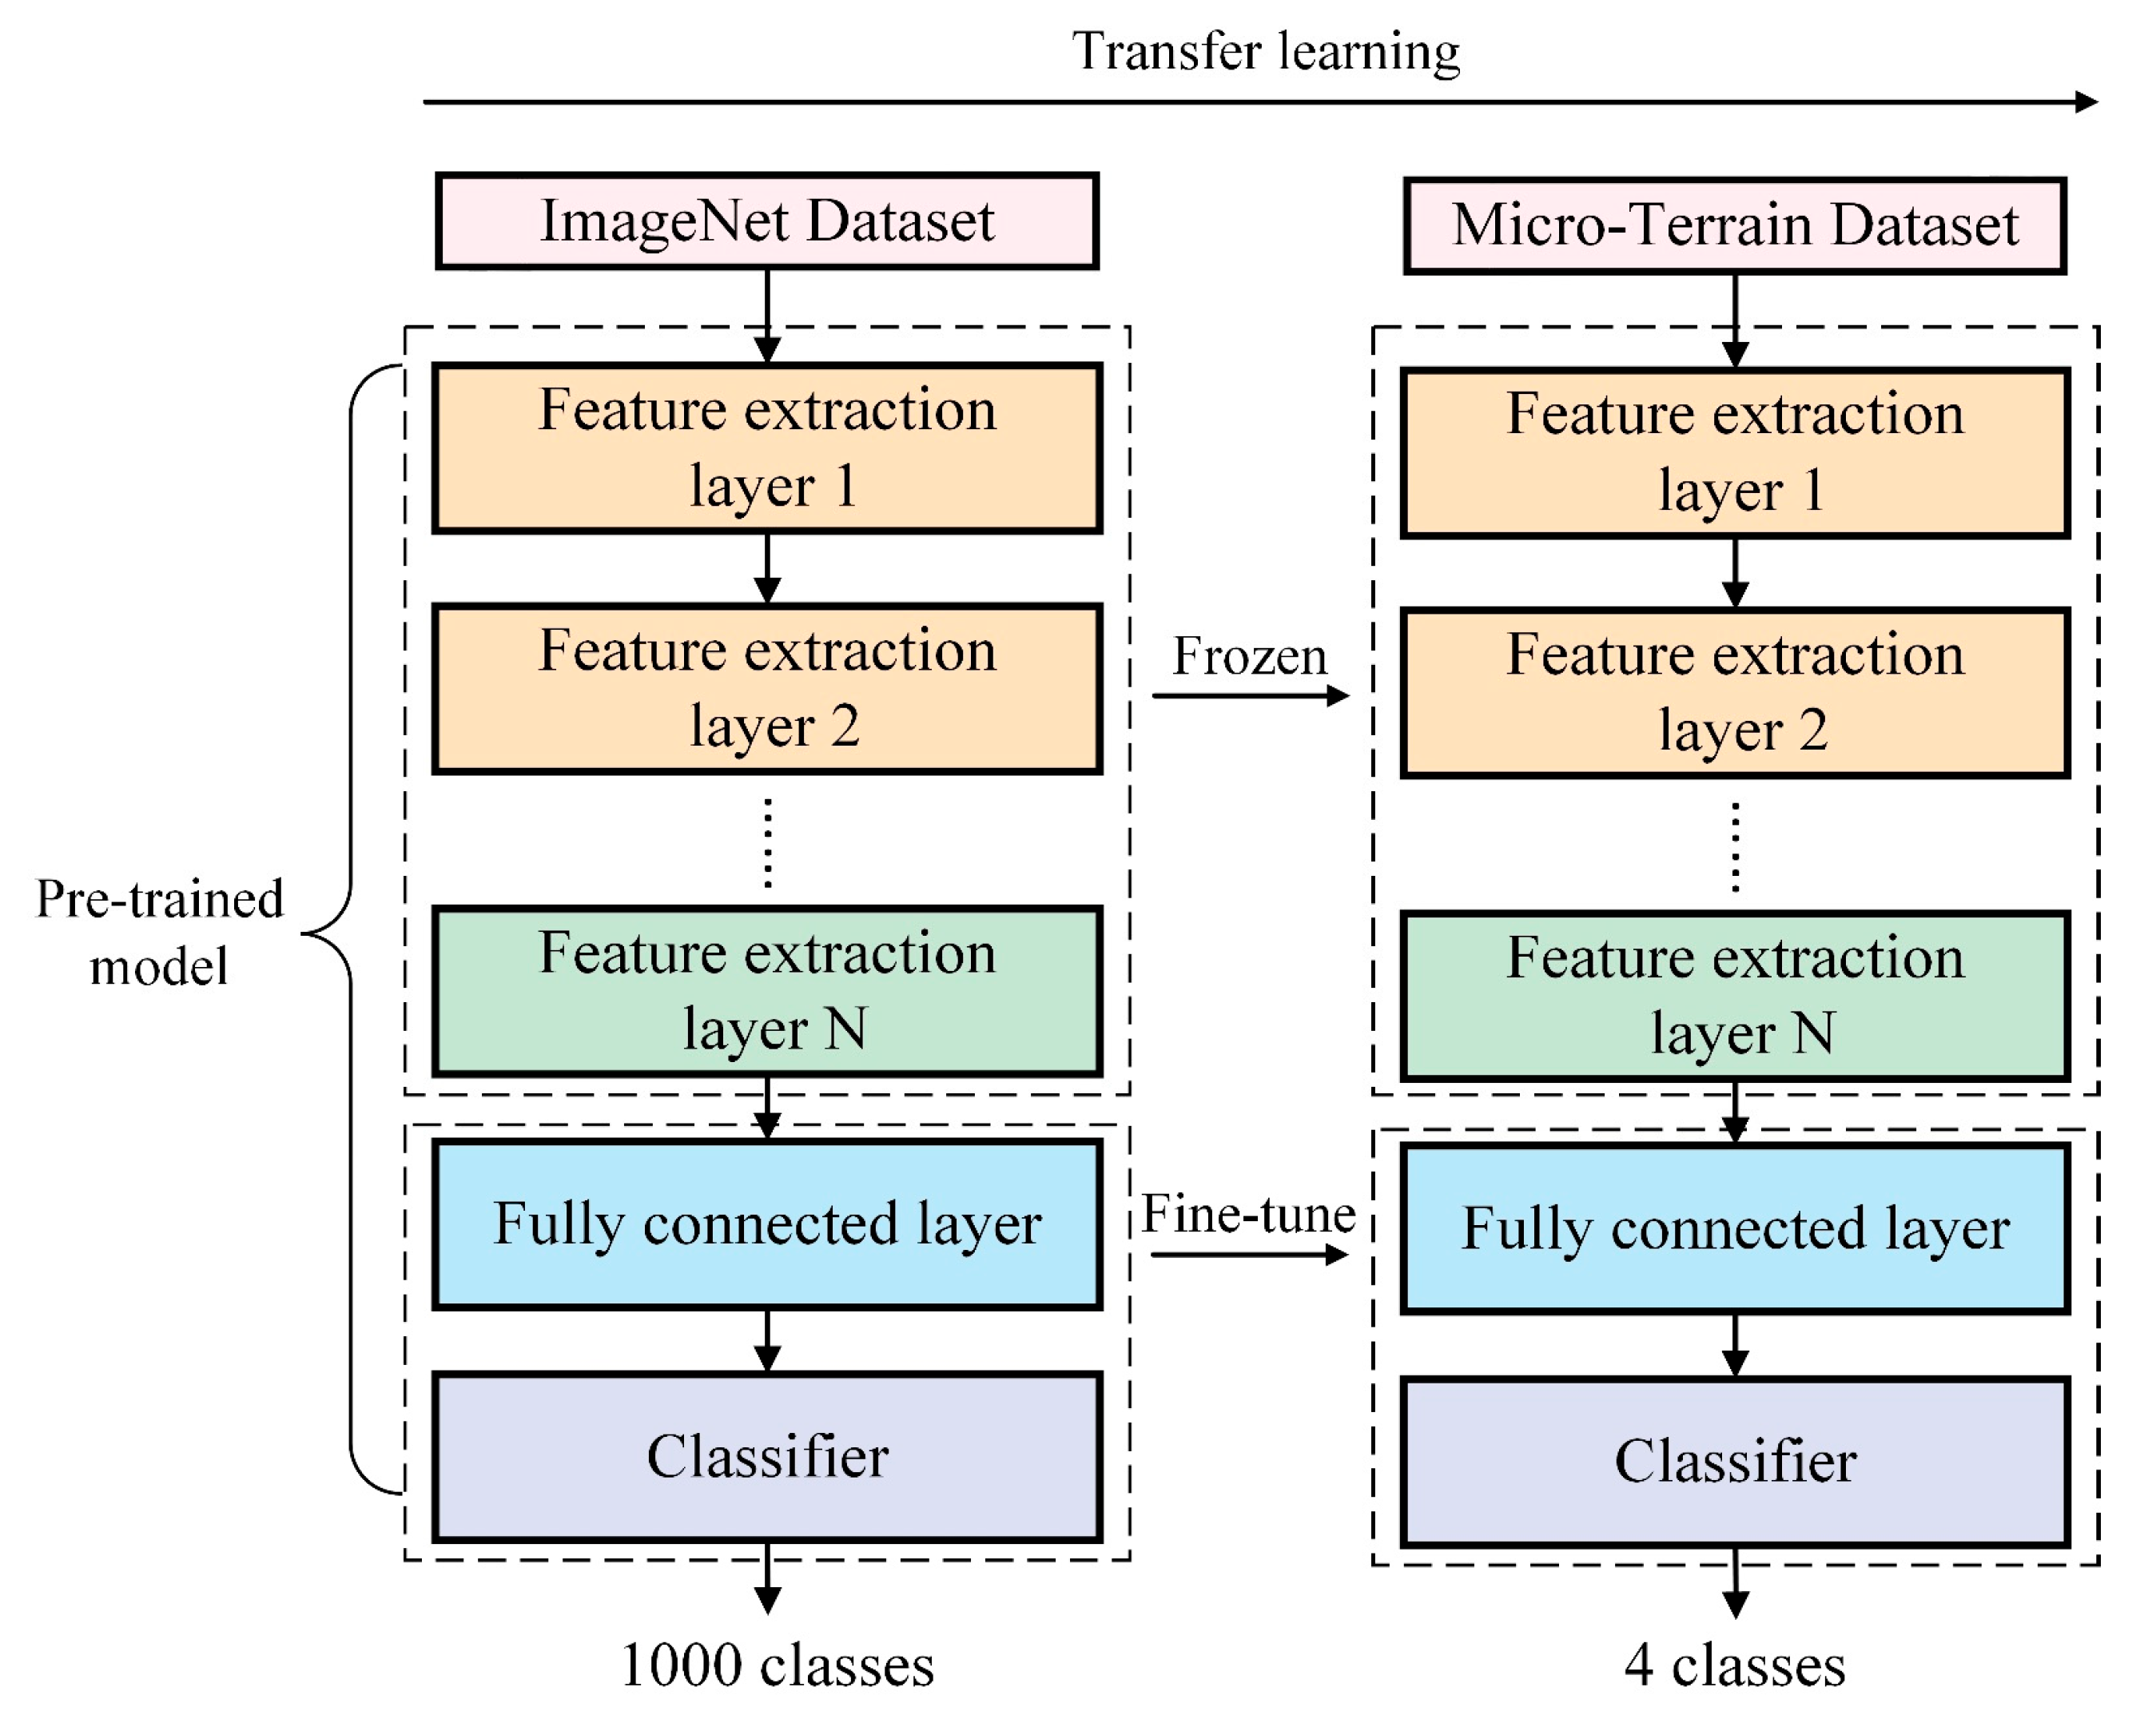
For the comparative experiment, the proposed Improved CNN is benchmarked against five established architectures: ResNet50, GoogLeNet, AlexNet, MobileNet-v2 and VGG-16. As these standard models are designed for 3-channel inputs, an adaptation step was necessary to accommodate the multimodal data. To achieve this, the 7-channel composite feature map was concatenated with the 1-channel transmission line orientation map, resulting in a 7-channel feature input. A 1 × 1 convolutional layer was then employed to fuse these channels and map the features to a 3-channel space. Subsequently, fine-tuning was performed using a transfer learning approach, where the feature extraction layers were frozen while only the final classification layers were updated, a process illustrated in Figure 12.
To increase data diversity and prevent overfitting during training, data augmentation techniques, including random flipping and rotation, were applied to the training set for all experiments. The key hyperparameters used for training our proposed model and for fine-tuning the transfer learning models are detailed in Table 3. Based on a training set of 5196 samples and a batch size of 128, each epoch consists of approximately 41 iterations.

4. Results

4.1. Ablation Study

The effectiveness of each proposed architectural innovation is systematically validated by the ablation study, with results presented in Table 4. The proposed model demonstrates clear superiority, achieving the highest accuracy on both the validation set (95.6%) and the instance test set (94.8%). This quantitative advantage is mirrored in the training dynamics (Figure 13), where the proposed model exhibits a more stable and efficient convergence compared to the higher, more volatile loss of the baseline model. The synergistic contribution of the components is confirmed by the fact that the proposed model surpasses the partially enhanced models by a margin of 1.1 to 3.4 percentage points on the instance test set, underscoring that each architectural innovation is integral to the final design’s success.

4.2. Comparative Experiment

The proposed model outperformed the five established pre-trained models in the comparative benchmark. As detailed in Table 5 and Table 6, the model achieved the highest Overall Accuracy (OA) on both the validation dataset (94.6%) and the instance test dataset (92.8%), representing a performance advantage of 1.0% to 8.1% on the test set.
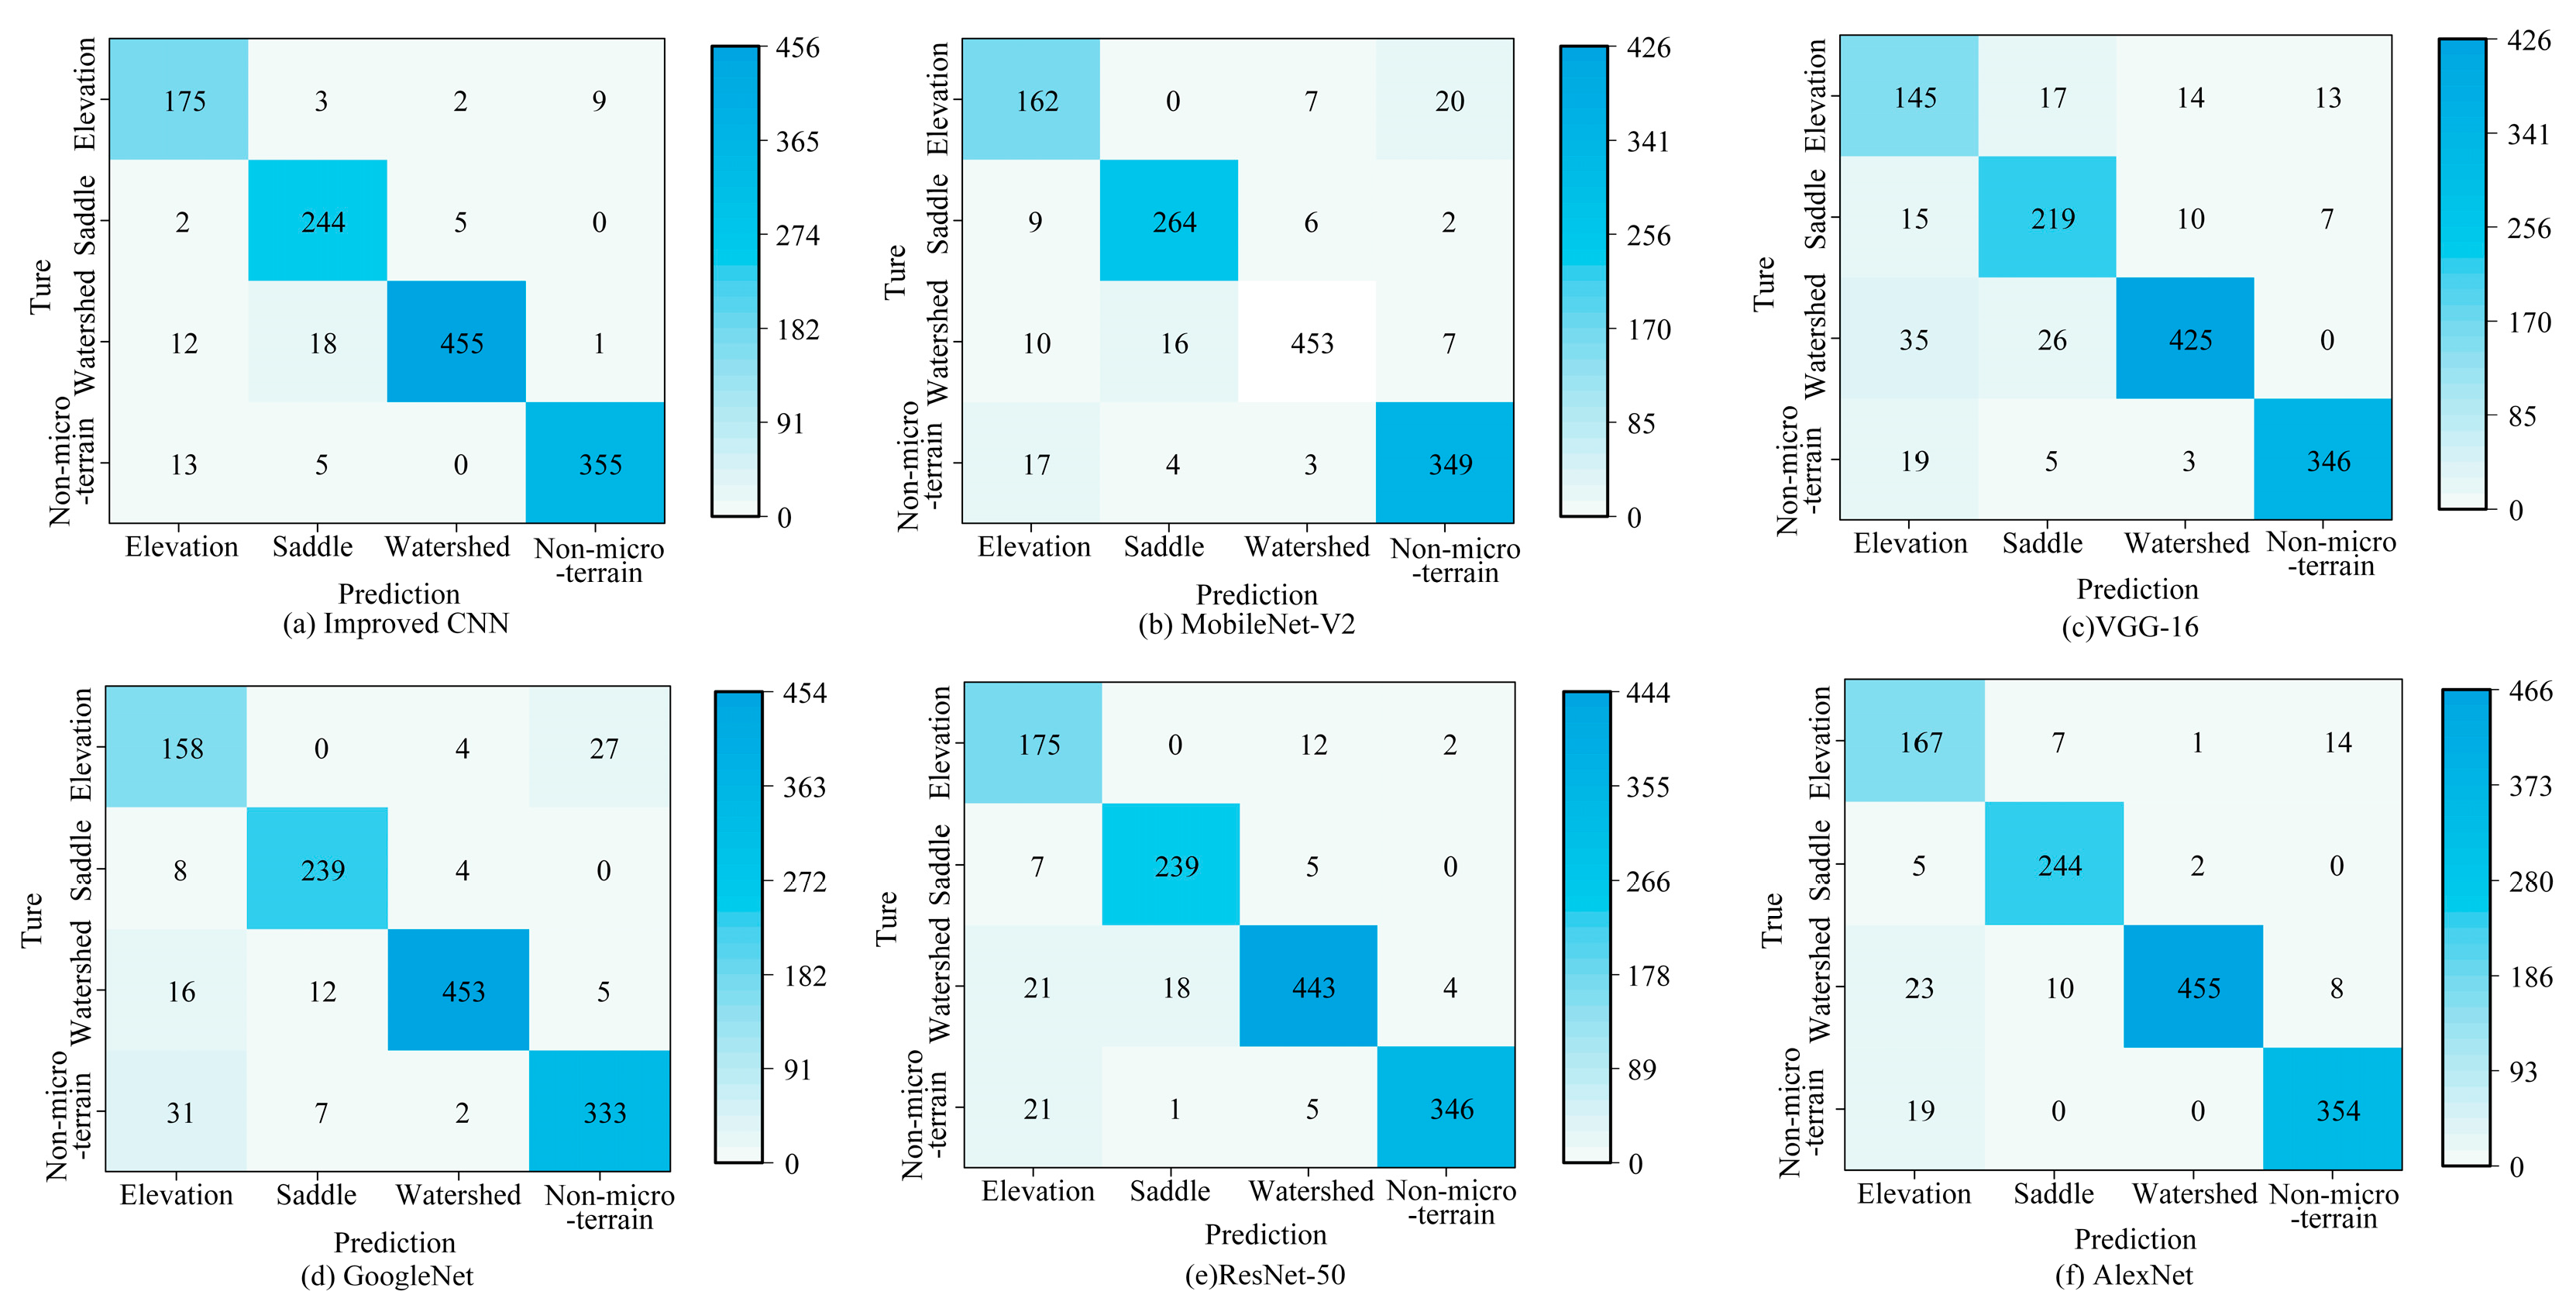
To provide deeper insight, we focus the analysis on our proposed model against its most competitive baseline, ResNet-50, which achieved the second-highest Overall Accuracy (91.8%) on the instance test dataset (Table 6). A class-by-class breakdown reveals a critical distinction: while ResNet-50 performed perfectly on ‘Watershed’ terrain, our model’s decisive advantage stems from the ‘Uplifted’ category. Here, our model achieves 90.2% accuracy, significantly outperforming ResNet-50’s 82.9%. This suggests that our proposed cross-branch spatial attention mechanism is particularly effective at capturing the complex spatial relationships inherent in ‘Uplifted’ terrain, a task where standard architectures may struggle. This robust performance is also reflected in the training dynamics (Figure 14), where our model’s loss curve converges more efficiently and remains more stable than that of ResNet-50 and other counterparts. Furthermore, the confusion matrix for the proposed model (Figure 15a) demonstrates a more balanced predictive capability, particularly when compared to the matrix for ResNet-50 (Figure 15e), corroborating its superior performance on challenging classes.

4.3. Visualization of the Spatial Attention Mechanism

To demonstrate the model’s effectiveness in micro-terrain recognition with transmission line alignment, Towers No. 1–20 of an actual 220 kV transmission line were selected for analysis. The satellite image of the line is shown in Figure 16. The line runs along a valley without crossing it, which does not match typical micro-terrain features. Without considering the alignment, this section could be misidentified as saddle-shaped terrain.
The micro-terrain identification results obtained using the improved CNN model are presented in Table 7. The model identified most towers as having no micro-terrain, which largely met expectations. However, due to small-scale local terrain variations, towers No. 4 and 5, as well as towers No. 13 and 14, were identified as saddle-shaped terrain. This also demonstrates the model’s ability to capture small-scale features.
To provide insight into the model’s decision-making process, we visualized the output of the cross-branch spatial attention module for the case study instances (towers No. 3–4 and No. 13–14), as presented in Figure 17 and Figure 18. These visualizations demonstrate that the model effectively learns to concentrate its focus along the transmission line’s trajectory, selectively amplifying spatially relevant terrain features. This targeted analysis validates that our dual-branch attention mechanism functions as intended and provides a clear qualitative rationale for the model’s superior quantitative performance.

5. Conclusions

This study proposes an artificial intelligence framework incorporating the spatial alignment of transmission lines to identify micro-terrain regions accurately. The method is built upon an enhanced convolutional neural network (CNN) architecture featuring a dual-branch structure, multi-scale feature extraction, and a cross-branch spatial attention mechanism. By introducing the directional information of transmission corridors, the framework effectively guides terrain feature extraction and overcomes the limitations of conventional approaches that rely solely on geographic morphology. Owing to the lack of publicly available datasets suitable for training such models, we constructed a comprehensive dataset consisting of large-scale simulation samples for training and real-world disaster cases for final validation, thereby supporting both model training and performance evaluation.
We prioritized a deep learning approach over conventional machine learning techniques (e.g., Random Forest, SVM) because of the inherently spatial nature of the recognition task. Conventional methods require hand-crafted features, a process that inevitably discards critical spatial context when converting 2D terrain maps into 1D feature vectors. In contrast, our proposed CNN-based framework automatically learns hierarchical spatial features directly from the multi-channel input maps. Thus, our comparative experiments benchmarked our model against other leading deep learning architectures to validate its specific architectural innovations—such as the dual-branch design and attention mechanism—rather than to reconfirm the established superiority of deep learning for spatial tasks.
Experimental results demonstrate that the proposed model achieves high recognition accuracies of 94.6% on the validation set and 92.8% on the separate, real-world instance test set, significantly outperforming conventional CNNs and five widely used pre-trained architectures. These improvements stem from the coordinated interplay between the dual-branch architecture and the spatial attention mechanism, as evidenced by ablation studies and attention maps.
This study provides a novel, data-driven tool for the planning and risk assessment of high-voltage transmission lines, particularly in accurately identifying potentially high-risk terrain features. Moreover, the core principle of the framework—leveraging key structural information to guide complex data analysis—shows potential for adaptation to other spatially dependent diagnostic tasks within power systems. Future work can build upon the research results of this study by further integrating real-time meteorological data. This will help construct a more spatially accurate online early-warning system, as it can dynamically assess disaster risks such as icing and galloping caused by local microclimates, based on the identified specific terrain.

Author Contributions

Conceptualization, H.Z. and K.M.; methodology, H.Z. and K.M.; software, K.M.; validation, Z.Z. and X.J.; formal analysis, K.M.; investigation, R.W.; resources, R.W.; data curation, K.M.; writing—original draft preparation, K.M.; writing—review and editing, H.Z.; visualization, K.M.; supervision, R.W.; project administration, Z.Z.; funding acquisition, X.J. All authors have read and agreed to the published version of the manuscript.

Funding

This research was supported by Project GDDKY2024KF06, supported by the Key Laboratory Fund of Guangdong Province for Power Equipment Reliability, and Project No. 2024CDJCGJ-004 supported by the Fundamental Research Funds for the Central Universities.

Data Availability Statement

The data are not publicly available as they contain sensitive internal information from the collaborating power grid company and are subject to confidentiality agreements.

Conflicts of Interest

Author Ruizeng Wei was employed by the company Guangdong Electric Power Design Institute Co., Ltd. The remaining authors declare that the research was conducted in the absence of any commercial or financial relationships that could be construed as a potential conflict of interest.

References

  1. Xi, J. Statement at the General Debate of the 75th Session of the United Nations General Assembly; United Nations: New York, NY, USA, 2020; Available online: https://news.un.org/zh/story/2020/09/1067222 (accessed on 25 July 2025).
  2. Chen, Y.; Yan, B.; Yu, M.; Huang, G.; Qian, G.; Yang, Q.; Zhang, K.; Mo, R. Wind tunnel study of wind turbine wake characteristics over two-dimensional hill considering the effects of terrain slope and turbine position. Appl. Energy 2025, 380, 125044. [Google Scholar] [CrossRef]
  3. Zheng, H.; Wang, Y.; Xie, D.; Zhang, Z.; Jiang, X. Analysis of solar radiation differences for High-Voltage transmission lines on Micro-Terrain Areas. Energies 2024, 17, 1684. [Google Scholar] [CrossRef]
  4. Yin, H.; Zhang, H.; Liu, C.Q.; Zhang, Q.; Li, Y.; Xu, J. Predicting Ice Thickness of Transmission Lines Using Gaussian Regression Process and Micrometeorological Parameters: A Machine Learning Approach. In Proceedings of the 2023 IEEE International Workshop on Electromagn: Applications and Student Innovation Competition (iWEM), Harbin, China, 15–18 July 2023; pp. 263–265. [Google Scholar]
  5. Guo, J.; Feng, T.; Cai, Z.; Lian, X.; Tang, W. Vulnerability Assessment for Power Transmission Lines under Typhoon Weather Based on a Cascading Failure State Transition Diagram. Energies 2020, 13, 3681. [Google Scholar] [CrossRef]
  6. Jiang, X.; Zhang, Z.; Hu, Q.; Hu, J.; Shu, L. Thinkings on the Restrike of Ice and Snow Disaster to the Power Grid. High Volt. Eng. 2018, 44, 463–469. [Google Scholar]
  7. Tabas, D.; Fang, J.; Porte-Agel, F. Wind Energy Prediction in Highly Complex Terrain by Computational Fluid Dynamics. Energies 2019, 12, 1311. [Google Scholar] [CrossRef]
  8. Yi, F.; Hu, C. An optimized detection model for micro-terrain around transmission lines. Sci. Rep. 2025, 15, 5086. [Google Scholar] [CrossRef] [PubMed]
  9. El-Magd, S.A.A.; Ali, S.A.; Pham, Q.B. Spatial modeling and susceptibility zonation of landslides using random forest, naïve bayes and K-nearest neighbor in a complicated terrain. Earth Sci. Inform. 2021, 14, 1227–1243. [Google Scholar] [CrossRef]
  10. Kang, W.; Huang, F.; Du, Y.; Liu, D.; Cao, Z. Regional terrain complexity evaluation based on GIS and K-means clustering model: A case study of Ningdu County, China. IOP Conf. Ser. Earth Environ. Sci. 2019, 300, 022025. [Google Scholar] [CrossRef]
  11. Siddiqui, Z.A.; Park, U. A Drone Based Transmission Line Components Inspection System with Deep Learning Technique. Energies 2020, 13, 3348. [Google Scholar] [CrossRef]
  12. Xing, M.; Du, Q.; Bi, Z. Research on DEM geomorphic factor terrain recognition algorithm using probabilistic neural networks based on tactile systems. Trans. Inst. Meas. Control. 2024, 46, 2174–2185. [Google Scholar] [CrossRef]
  13. Lin, S.; Wang, X.; Chen, N.; Shen, R. Directed Positive Negative Terrain Structure Graph Attention Network for Genetic Landform Recognition. IEEE Trans. Geosci. Remote Sens. 2023, 62, 4501915. [Google Scholar] [CrossRef]
  14. Suneetha, M.; Sujitha, A.V.S.P.; Shameera, M.; Kalyan, M.R. Object Based Terrain Classification Using Deep Learning Techniques. In Proceedings of the 2024 15th International Conference on Computing Communication and Networking Technologies (ICCCNT), Kamand, India, 24–28 June 2024; pp. 1–5. [Google Scholar]
  15. Tang, Z.; Fang, Z.; Sun, Y.; Ouyang, Y.; Zhang, H. Transmission Line Geological Hazard Detection Based on UAV LiDAR DEM and InSAR. In Proceedings of the 2023 International Conference on Smart Electrical Grid and Renewable Energy (SEGRE), Changsha, China, 16–19 June 2023; pp. 470–475. [Google Scholar]
  16. Huang, J.; Zhou, X. Study on transmission line icing prediction based on micro-topographic correction. AIP Adv. 2022, 12, 085103. [Google Scholar] [CrossRef]
  17. Jimenez, V.; Montaña, J.; Candelo, J.; Quintero, C. Estimation of the shielding performance of transmission lines considering effects of landform, lightning polarity and stroke angle. Electr. Eng. 2017, 100, 425–434. [Google Scholar] [CrossRef]
  18. Kumaraperumal, R.; Raj, M.N.; Pazhanivelan, S.; Jagadesh, M.; Selvi, D.; Muthumanickam, D.; Jagadeeswaran, R.; Karthikkumar, A.; Kanna, S.K. Data mining techniques for LULC analysis using sparse labels and multisource data integration for the hilly terrain of Nilgiris district, Tamil Nadu, India. Earth Sci. Inform. 2025, 18, 13. [Google Scholar] [CrossRef]
  19. Jha, S.B.; Babiceanu, R.F. Deep CNN-based visual defect detection: Survey of current literature. Comput. Ind. 2023, 148, 103911. [Google Scholar] [CrossRef]
  20. Li, M.; Lu, Y.; Cao, S.; Wang, X.; Xie, S. A hyperspectral image classification method based on the nonlocal attention mechanism of a multiscale convolutional neural network. Sensors 2023, 23, 3190. [Google Scholar] [CrossRef] [PubMed]
  21. Zang, C.; Song, G.; Li, L.; Zhao, G.; Lu, W.; Jiang, G.; Sun, Q. DB-MFENet: A Dual-Branch Multi-Frequency Feature Enhancement Network for Hyperspectral Image Classification. Remote Sens. 2025, 17, 1458. [Google Scholar] [CrossRef]
  22. Li, R.; Zheng, S.; Duan, C.; Yang, Y.; Wang, X. Classification of hyperspectral image based on double-branch dual-attention mechanism network. Remote Sens. 2020, 12, 582. [Google Scholar] [CrossRef]
  23. Zhang, H.; Liu, H.; Yang, R.; Wang, W.; Luo, Q.; Tu, C. Hyperspectral image classification based on double-branch multi-scale dual-attention network. Remote Sens. 2024, 16, 2051. [Google Scholar] [CrossRef]
  24. Woo, S.; Park, J.; Lee, J.-Y.; Kweon, I.S. CBAM: Convolutional block attention module. In Proceedings of the 2018 15th European Conference on Computer Vision (ECCV), Munich, Germany, 8–14 September 2018; pp. 3–19. [Google Scholar]
  25. ASF DAAC. ASF Data Search. Available online: https://search.asf.alaska.edu/ (accessed on 26 July 2025).
  26. GB/T 50548-2018; Survey Specification for 330 kV~750 kV Overhead Transmission Lines. Ministry of Housing and Urban-Rural Development and State Administration for Market Regulation: Beijing, China, 2018. Available online: https://ebook.chinabuilding.com.cn/zbooklib/bookpdf/probation?SiteID=1&bookID=111990 (accessed on 23 June 2025).
  27. DL/T 741-2019; Operating Code for Overhead Transmission Line. National Energy Administration: Beijing, China, 2019. Available online: https://www.doc88.com/p-74959496509292.html (accessed on 23 June 2025).
  28. Huang, C.; Yin, K.; Liang, X.; Gui, L.; Zhao, B.; Liu, Y. Study of direct and indirect risk assessment of landslide impacts on ultrahigh-voltage electricity transmission lines. Sci. Rep. 2024, 14, 25719. [Google Scholar] [CrossRef] [PubMed]
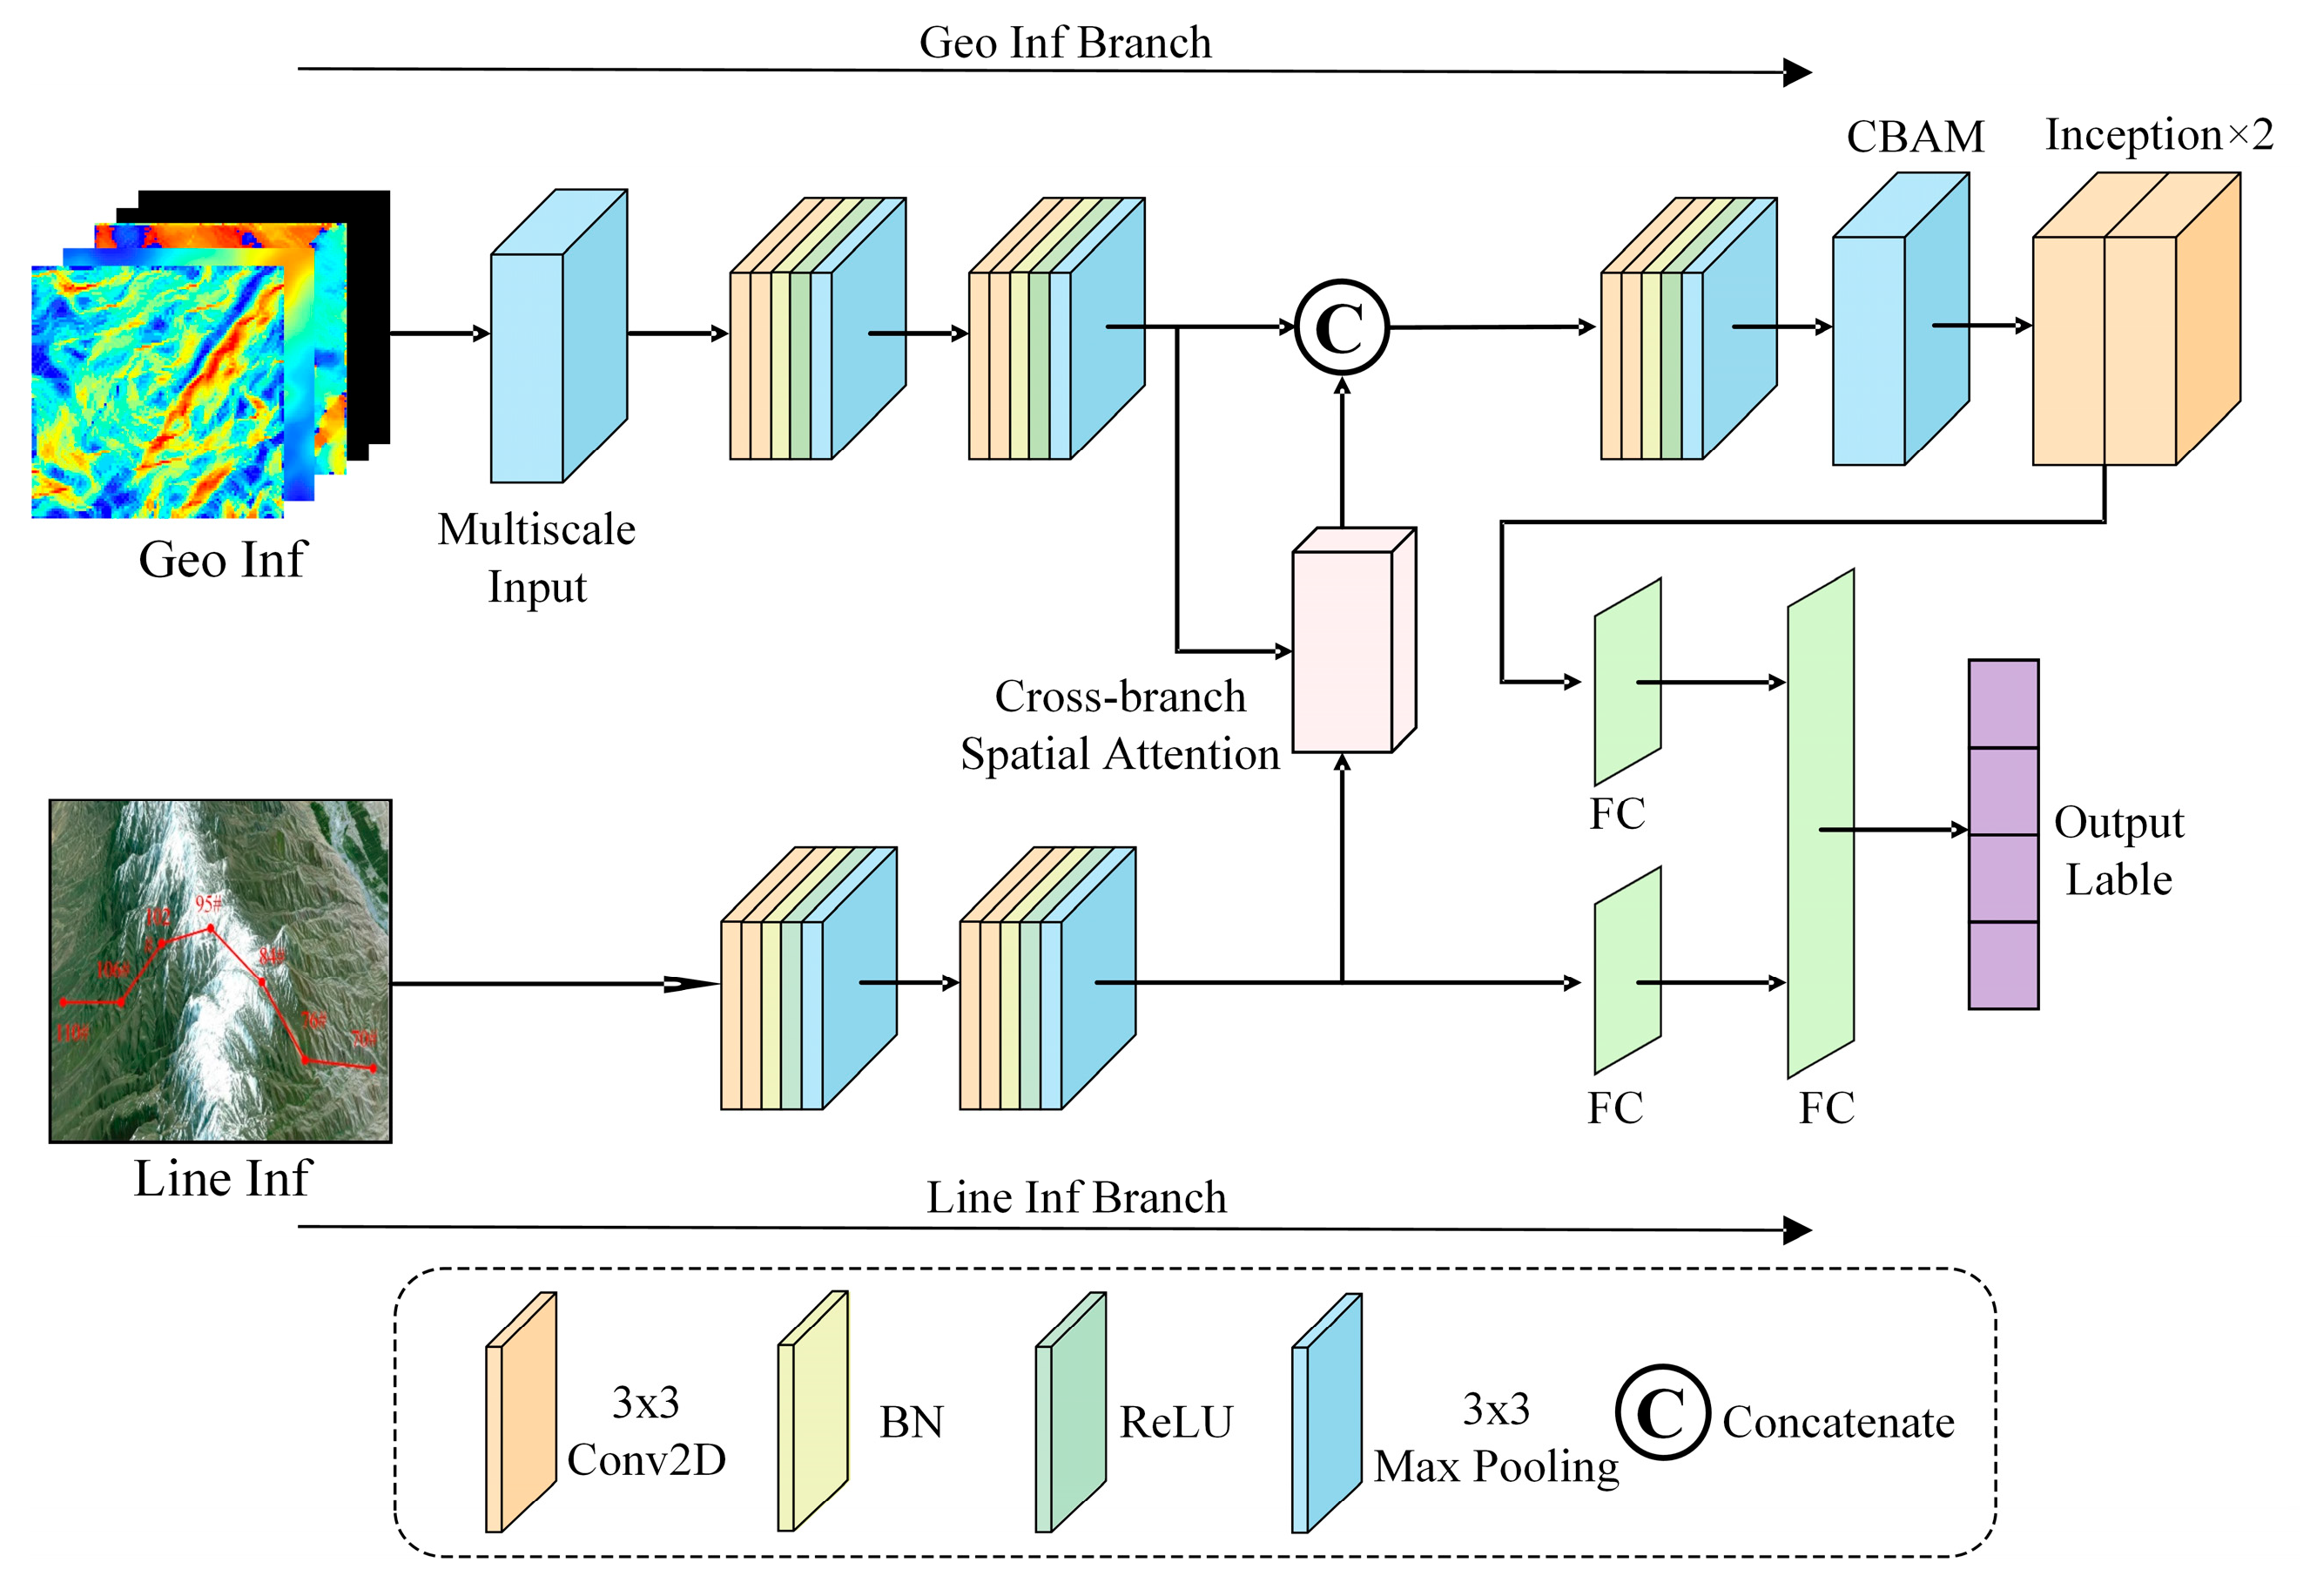
Figure 1. Micro-terrain recognition model structure based on multi-scale and attention module.
Energies 18 04495 g001
Figure 2. Flow chart corresponding to the program.
Energies 18 04495 g002
Figure 3. Input multi-scale module structure.
Energies 18 04495 g003
Figure 4. Inception architecture.
Energies 18 04495 g004
Figure 5. CBAM structure.(a) Convolutional Block Attention Module (CBAM); (b) Channel Attention module; (c) Spatial Attention module.
Energies 18 04495 g005
Figure 6. Cross-branch spatial attention module structure.
Energies 18 04495 g006
Figure 7. Micro-terrain training dataset construction process.
Energies 18 04495 g007
Figure 8. Schematic diagram of simulated line alignment.
Energies 18 04495 g008
Figure 9. Watershed transmission line simulation.
Energies 18 04495 g009
Figure 10. Saddle transmission line simulation.
Energies 18 04495 g010
Figure 11. Uplifted transmission line simulation.
Energies 18 04495 g011
Figure 12. Schematic diagram of the Transfer Learning Principle.
Energies 18 04495 g012
Figure 13. Different network training accuracy and loss curves.
Energies 18 04495 g013
Figure 14. Pre-trained network training accuracy and loss curves.
Energies 18 04495 g014
Figure 15. Improved CNN and other models’ confusion matrix.
Energies 18 04495 g015
Figure 16. Line transmission route map.
Energies 18 04495 g016
Figure 17. Visualization of the spatial attention mechanism for the region of towers No. 3–4.
Energies 18 04495 g017
Figure 18. Visualization of the spatial attention mechanism for the region of towers No. 13–14.
Energies 18 04495 g018
Table 1. Micro-terrain elevation dataset.
Micro-Terrain TypeTraining Dataset (80%)Validation Dataset (20%)Total Sample Count
Watershed19444862430
Saddle100002511251
Uplifted158189947
Non-micro-terrain14943731867
Total519612996495
Table 2. Micro-terrain instance test dataset.
Category NumberMicro-Terrain TypeSample Count
1Watershed28
2Saddle61
3Uplifted41
Total3130
Table 3. Comparison of training hyperparameters.
HyperparameterImproved CNN ModelTransfer Learning Models
OptimizerAdamAdam
β 1 0.90.9
β 2 0.9990.999
ε 10−810−8
α 10−310−3
Batch Size128128
Training Epochs1008
Table 4. Improved CNN ablation results.
DatasetCNNDual-BranchAttention
Module
Multi-ScaleAccuracy
Micro-terrain elevation validation dataset 90.6
93.2
94.4
93.5
95.6
Micro-terrain instance test dataset 89.3
91.4
93.7
92.6
94.8
Table 5. Classification results on micro-terrain uplifted validation dataset.
WatershedSaddleUpliftedNonOAAAKappa
CNN9394.888.991.492.2920.8963
Improve CNN95.297.292.693.694.694.50.9289
VGG-1692.887.376.787.587.486.10.8331
GoogleNet89.395.283.693.291.190.30.8221
MobileNet-V293.693.285.793.292.391.40.8975
ResNet-509395.292.691.292.7930.9064
AlexNet94.997.288.491.693.2930.9095
Table 6. Classification results on micro-terrain instance test dataset.
WatershedSaddleUpliftedOA
CNN89.393.482.989.3
Improve CNN96.493.490.292.8
VGG-1685.788.57884.7
GoogleNet82.191.880.586.3
MobileNet-v296.490.287.890.8
ResNet-5010093.482.991.8
AlexNet92.990.287.890.1
Table 7. Micro-terrain identification results.
TowerMicro-TerrainTowerMicro-Terrain
1 No11No
2 No12No
3 No13Saddle
4 Saddle14Saddle
5 Saddle15No
6No16No
7No17No
8No18No
9 No19No
10No20No
Disclaimer/Publisher’s Note: The statements, opinions and data contained in all publications are solely those of the individual author(s) and contributor(s) and not of MDPI and/or the editor(s). MDPI and/or the editor(s) disclaim responsibility for any injury to people or property resulting from any ideas, methods, instructions or products referred to in the content.