1. Introduction
The urgent decarbonization of electricity grids requires an increased share of renewable energy sources [
1], with concentrating solar power (CSP) plants offering promising solutions for large-scale, dispatchable generation [
2]. Modern CSP technologies often use molten salt mixtures as high-temperature heat transfer fluids (HTFs) and thermal energy storage media (TES) [
3]. Among CSP systems, parabolic trough collectors (PTCs) are widely adopted for medium-to-high temperature operation and commonly use a binary molten salt (solar salt, 60–40 wt.% NaNO
3-KNO
3) operating between ~270 °C and 565 °C [
4], valued for its thermophysical properties and cost-effectiveness [
5]. However, molten salts solidify near 240 °C, risking blockages and equipment malfunction [
6]. To prevent solidification, conventional Joule-effect electric heating systems are typically used as freeze protection in both piping and receiver tubes [
7], and also serve TES applications for storing surplus electricity [
8]. While alternative heating technologies such as microwave-based systems are being explored [
9], they are not feasible for PTC pipes and receiver tubes, highlighting the need for detailed studies of salt phase-change dynamics in these components. Such investigations are essential for optimizing the design and placement of Joule-effect heaters to ensure reliability and cost-effectiveness in CSP plants [
10]. Despite their importance, experimental data on in-tube freezing and melting, especially under varying vacuum conditions, remain scarce as most studies focus on corrosion or tank heat loss rather than phase-change dynamics within receiver tubes [
6,
11,
12].
Matino and Maccari [
13] experimentally evaluated ASE receiver tubes in both a demonstration plant and on an indoor test bench, analyzing their operating temperatures and heat loss characteristics. Their results demonstrated no degradation of heat loss properties after operation in the solar collectors and confirmed excellent long-term stability following extensive aging and cycling tests. Prieto et al. [
14]. developed a comprehensive modeling study to evaluate two freeze recovery methods in molten salt CSP plants: heat tracing applied to pipes and components and impedance (Joule) heating in the solar field. Their simulations assessed the parasitic energy consumption of each method under realistic freezing conditions for three molten salt mixtures (solar salt, HiTec
®, and HiTec XL
®), confirming the technical feasibility and effectiveness of both methods for freeze recovery. Imponenti et al. [
15] employed computational fluid dynamics (CFD) to study solidification and melting in PTC receivers, demonstrating that concentrated solar radiation significantly reduces the melting time of frozen salt (to 5.6 h) compared to impedance heating (8.8 h at 300 W m
−1). However, they also highlighted that uneven solar flux could induce substantial thermal stresses in receiver tubes. In another study [
16], the authors developed detailed thermal–fluid and finite element models to analyze the thawing of solar salt frozen in parabolic trough collectors using solar flux and combined heating methods. Their results show that with only solar flux and 120 or 60 s off-sun pauses, melting salt from 10 °C takes 18.5 h and 11.9 h, respectively, with maximum thermal stresses of 48.2 MPa and 53.5 MPa. The presence of non-illuminated sections slows melting, but adding 150 W/m electric heating reduces both melt times and thermal stresses. These findings highlight the benefit of combining solar and electric heating, supporting a combined approach for efficient and safe freeze recovery in molten salt PTC systems. Herruzo et al. [
17] presented a validated three-dimensional model investigating the freeze recovery process in parabolic trough collectors using solar salts. Their fully coupled model addressed both thermal and fluid phenomena, including detailed thermo-mechanical evaluations of tube deformation and thermal stress during freeze–thaw cycles.
Although valuable, previous studies have typically focused on individual aspects, such as thawing after freeze events, heat tracing effectiveness, or receiver tube performance. Common limitations include the lack of:
Direct comparisons between evacuated and non-evacuated receiver tubes;
Quantitative analyses of phase-change timing under equivalent power input;
Detailed mapping of radial freeze/melt front progression.
To overcome these gaps, the present study reports controlled laboratory experiments investigating solidification and melting dynamics of NaNO3–KNO3 mixtures within evacuated and non-evacuated receiver tubes. Experimental measurements compare the power requirements and time needed for complete phase transitions under identical conditions, along with detailed characterization of radial phase front progression. Additionally, the impact of vacuum insulation on thermal performance and the feasibility of freeze recovery are analyzed. Through addressing these critical aspects, the study aims to provide practical data for improving CSP design guidelines related to heat tracing sizing, emergency operation protocols, and freeze-avoidance strategies applicable to both evacuated and non-evacuated receiver configurations.
The paper is organized as follows:
Section 2 describes the methodology used to conduct the tests and presents the test bench.
Section 3 contains the description of the test results.
Section 4 provides a discussion and comparison between the cases of evacuated and non-evacuated tubes.
Section 5 presents the conclusions and suggests future work.
2. Materials and Methods
Solar salt mixtures have a freezing point of approximately 240 °C, which poses a significant challenge for the reliable operation of CSP systems. To mitigate the risk of salt solidification within receiver tubes and throughout the entire piping network, auxiliary electric heating systems are commonly employed. For pipeline heating, electric tracing cables are installed along the pipes; the passage of electrical current through these cables raises their temperature, effectively transferring heat to the pipe walls and thereby maintaining the temperature of the salt mixture within the piping system above its freezing point. In contrast, direct installation of electric tracing cables is not feasible for receiver tubes due to the presence of an external glass envelope. In the present work, impedance heating is used, whereby a dedicated voltage is applied to the steel tube of each receiver loop through a specific generator, inducing a current that elevates the temperature along the entire receiver line.
During the design phase of a CSP plant it is necessary to accurately estimate both the electrical energy required for preheating and maintaining the temperature of the salt mixture throughout the piping system, as well as the energy needed to remelt any solidified salt within the receivers under emergency conditions. Operational experience has also highlighted the importance of evaluating the time required for salt to freeze within receiver tubes during unexpected plant shutdowns. This assessment is important for determining the necessary power and number of generators for receiver heating, as well as for defining optimal drainage procedures to avoid blockages and damage to the piping due to salt solidification.
To address these challenges a dedicated laboratory setup was developed to investigate the dynamics of solidification and melting processes of the binary solar salt mixture within receiver tubes under both evacuated and non-evacuated conditions. The goal of these experimental studies is to provide practical data to inform the design and operation of freeze protection systems in CSP plants. For the construction of the test bench, two receiver tubes were welded together, with bends installed at each end. Each bend was equipped with a specially designed flanged system to facilitate salt loading and unloading operations. The use of molten salt mixtures as HTFs in PTC plants requires that the temperature throughout the system is maintained, with an adequate safety margin, above the solidification point. The salt mixture employed—60% NaNO
3 and 40% KNO
3—has a total mass of 50.5 kg and a latent heat of fusion of 96 J/g. It solidifies in the range of 220 °C to 238 °C. Therefore, a safety margin of approximately 30 °C was considered, and the system was operated above 270 °C at all times. The primary aim of the laboratory experiments was to assess the solidification times of the salt mixture, starting from an initial temperature of 270 °C. In particular, the study considered emergency scenarios such as night-time operation, where the fluid is at the minimum operating temperature (270 °C) and a power failure results in a sudden stop in salt circulation. Under these conditions, it becomes crucial to determine the available time to drain the system completely in order to prevent partial or total solidification of the salt within the pipes. As previously mentioned, an impedance heating system was adopted to maintain the solar salt at the desired temperature, using the receiver tube itself as the heating element. By applying a voltage across the tube, a constant current determined by the electrical resistance of the pipe was established along its entire length, resulting in uniform heating via the Joule effect as the tube’s cross-section remains constant throughout. A total of 26 certified type K thermocouples, each with an uncertainty of ±1.5 K, were installed on the test section. Of these, 18 were positioned inside the tube, while the remaining 8 were placed on the external surface, as illustrated in
Figure 1.
During salt melting the primary objective was to prevent any potential damage to the system. Therefore, it was essential to ensure that all sections of the piping system were adequately heated and insulated, as the natural expansion of the salt during the phase change could otherwise result in localized overpressure. For system heating, a 10 kW power supply unit (0–10 V, 1000 A) was used. A variable voltage (0 to 10 V) was applied across the tube, with the corresponding current ranging from 0 to 1000 A. Two additional thermocouples were installed at the clamps of the electric heating system (Terminal-C and Terminal-D) to monitor and prevent any potential overheating of the power supply connection cables. The entire system was designed for complete remote operation and monitoring. To ensure the repeatability of the experimental results, each test was conducted following identical procedures and operating conditions, with careful monitoring of all key parameters. The consistency of the measured temperatures and power values across different runs, as reported in
Table 1 and
Table 3 and illustrated in
Figure 3 and
Figure 13, further confirmed the reliability of the experimental setup.
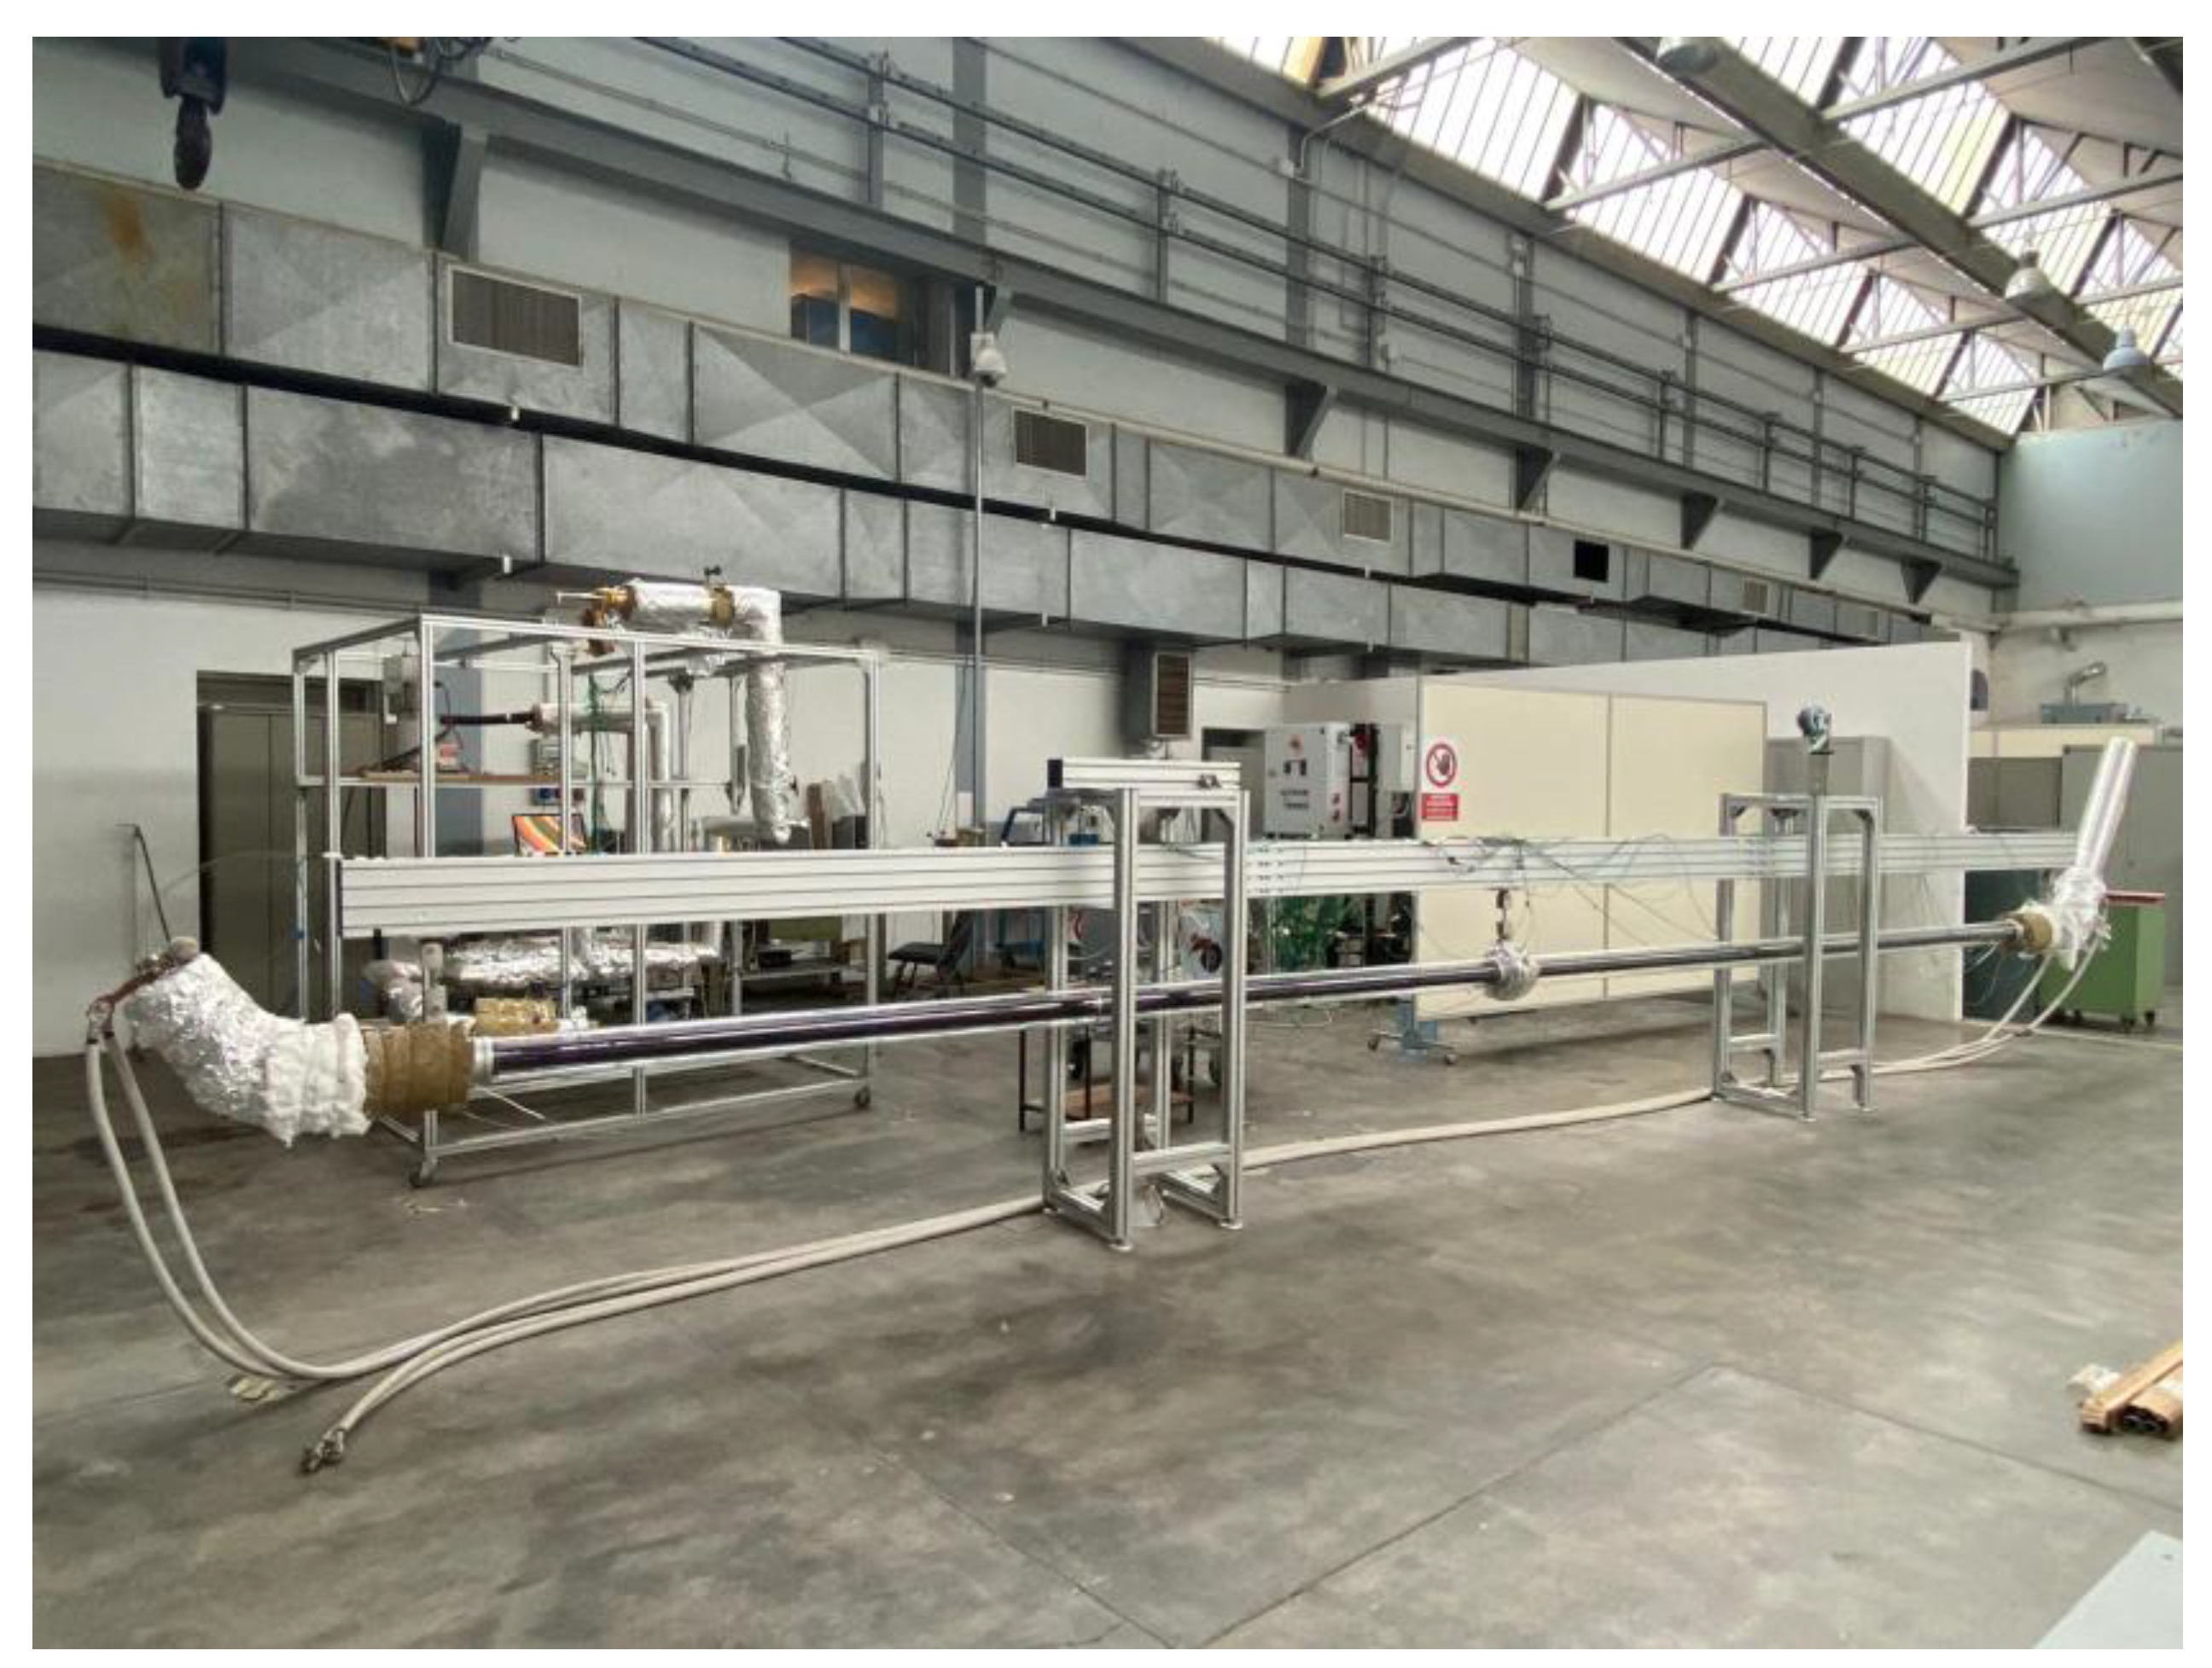
Figure 2 provides an overview of the test bench used in this study. The experimental setup comprises two receiver tubes supported by a modular aluminum frame, which ensures structural rigidity. A pulley-based system allows precise alignment of the tubes. The salt charging and discharging sections are located at the left and right ends of the bench, respectively. Both inlet and outlet piping systems are equipped with thermally insulated terminals and bends to minimize heat loss. Additionally, the junction between the two tubes is insulated to further reduce heat losses and prevent localized salt solidification.
Figure 3.
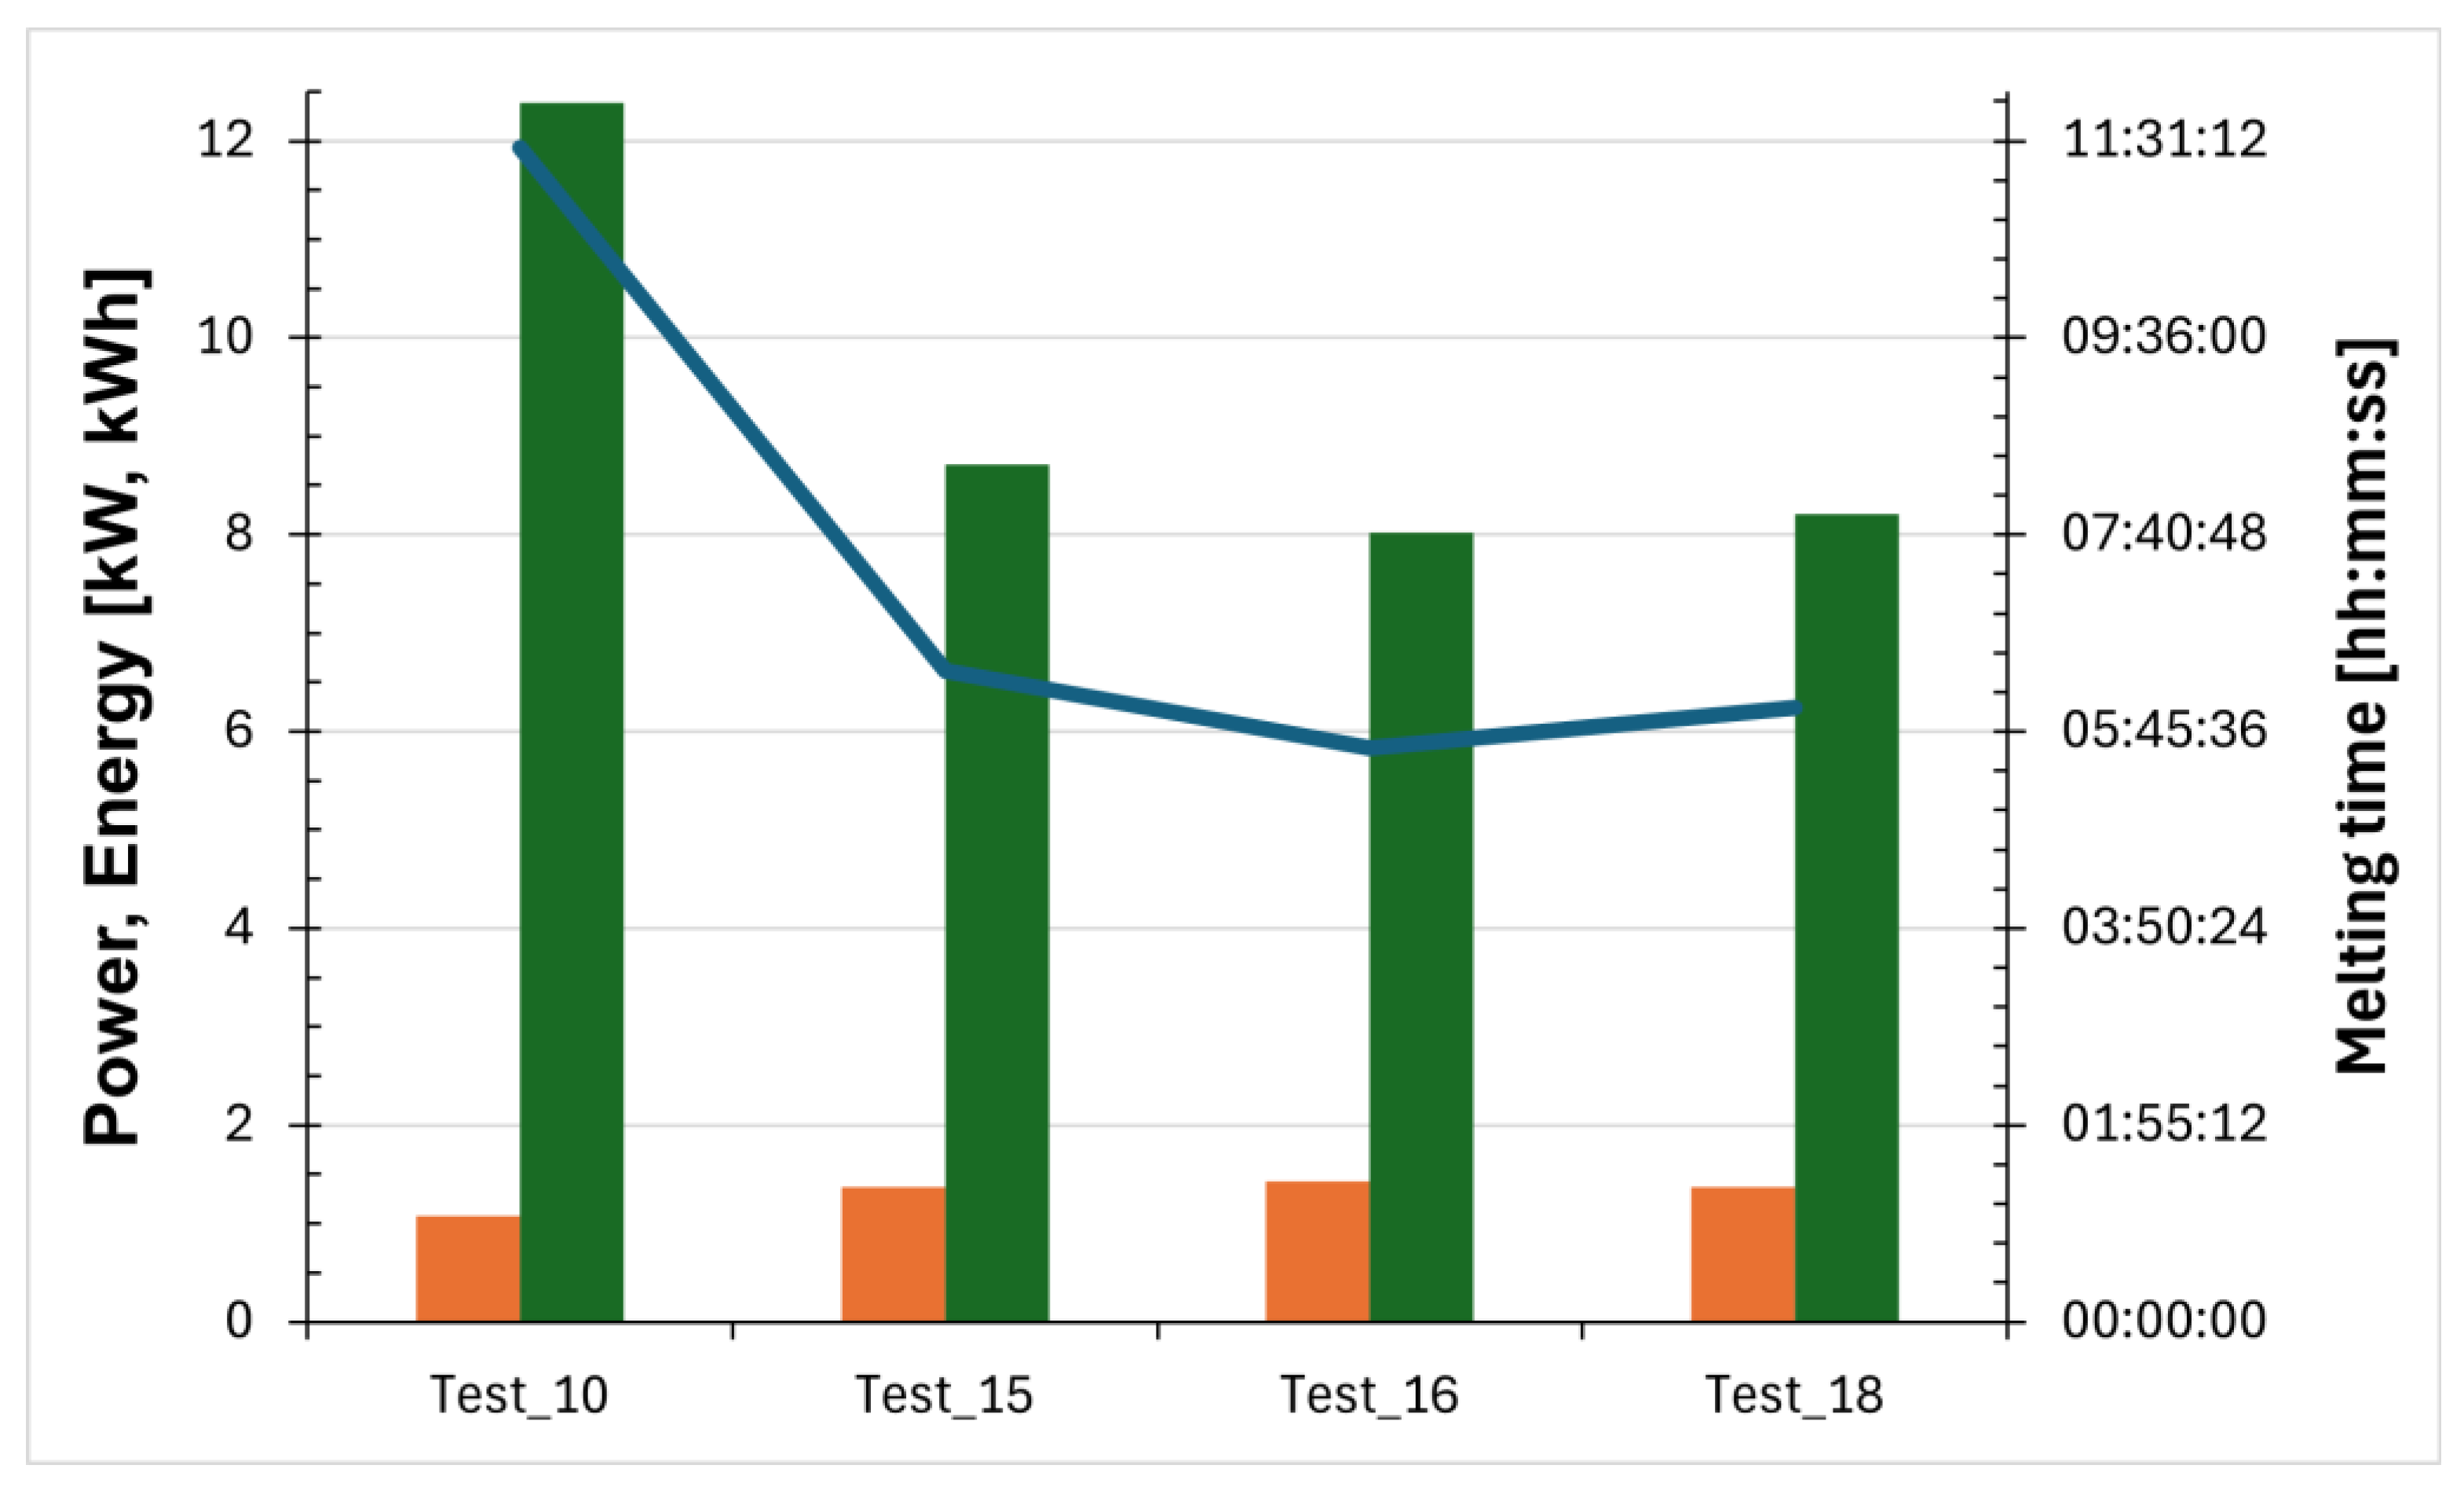
Power (orange bars) and energy (green bars) required for salt melting, and the time taken (blue line).
Figure 3.
Power (orange bars) and energy (green bars) required for salt melting, and the time taken (blue line).
Testing Procedure
The main objectives of the solidification and melting tests of the molten salts were to assess the time required for the complete phase change in the mixture and to analyze the behavior of the receiver under non-conventional operating conditions that could lead to blockage of salt circulation.
For the solidification tests, the system was initially heated to a uniform and constant temperature of 270 °C along its entire length. This condition simulated an emergency scenario that may occur in an industrial plant, where the solar field is operating in night-time circulation mode. In this case, the salt circulates at the minimum safety temperature of 270 °C and a power outage causes the circulation pump to stop, leaving the fluid stationery. This is the most critical condition regarding the solidification of the salt mixture, and it allows for the evaluation of the time available for plant operators to drain the entire solar field before salt solidification begins.
For the melting tests, the system started at ambient temperature and the electric heating system was activated to induce Joule heating until all the salt inside the receiver was fully liquefied. This procedure allowed us to evaluate the proper sizing of the Joule heating system. Moreover, another piece of information that could be obtained from these tests was the ability to assess whether the receivers have lost their vacuum.
The selection of the applied voltages was guided by the goal of replicating melting times consistent with those observed in real-scale plants equipped with evacuated receiver tubes. Preliminary tests indicated that, at voltages below 4.0 V, complete melting of the salt could not be achieved under realistic conditions. Therefore, voltages of 4.5 V and 7.0 V were chosen as they produced melting times similar to those measured in evacuated tubes, thereby ensuring the practical relevance of the results. The 7.4 V setting was included to provide a reference case for non-evacuated conditions, where the melting time exhibited greater variability. This rationale has been clarified in the revised manuscript. Once the minimum power required for melting was identified, the heating period was adjusted accordingly.
3. Results
3.1. Receiver Test with Vacuum—Salt Melting Process
Four salt melting tests were carried out in order to evaluate the relationship between the applied voltage and the time required for the complete phase transition of the salt.
Table 1 provides a summary of the main results of vacuum tube melting tests. In particular, for each test the applied voltage, the time required for melting, the applied power, and the absorbed energy are reported. The same data are provided for the preheating phase.
An initial test was carried out by applying a voltage of 4 V across the two receivers. In this case, the salt melting process took more than 11 h and was still unable to bring the system to the target temperature of 270 °C. Since this time was deemed incompatible with the operational requirements of a real industrial plant, it was decided to apply a voltage of 4.5 V so that the phase-change process would take approximately 6 h and the entire system could reach the safety temperature of 270 °C. Three tests were conducted at this applied voltage in order to better assess the process.
Figure 3 illustrates, for the tests conducted, the power and energy required for salt melting as well as the time needed to complete the phase-change process.
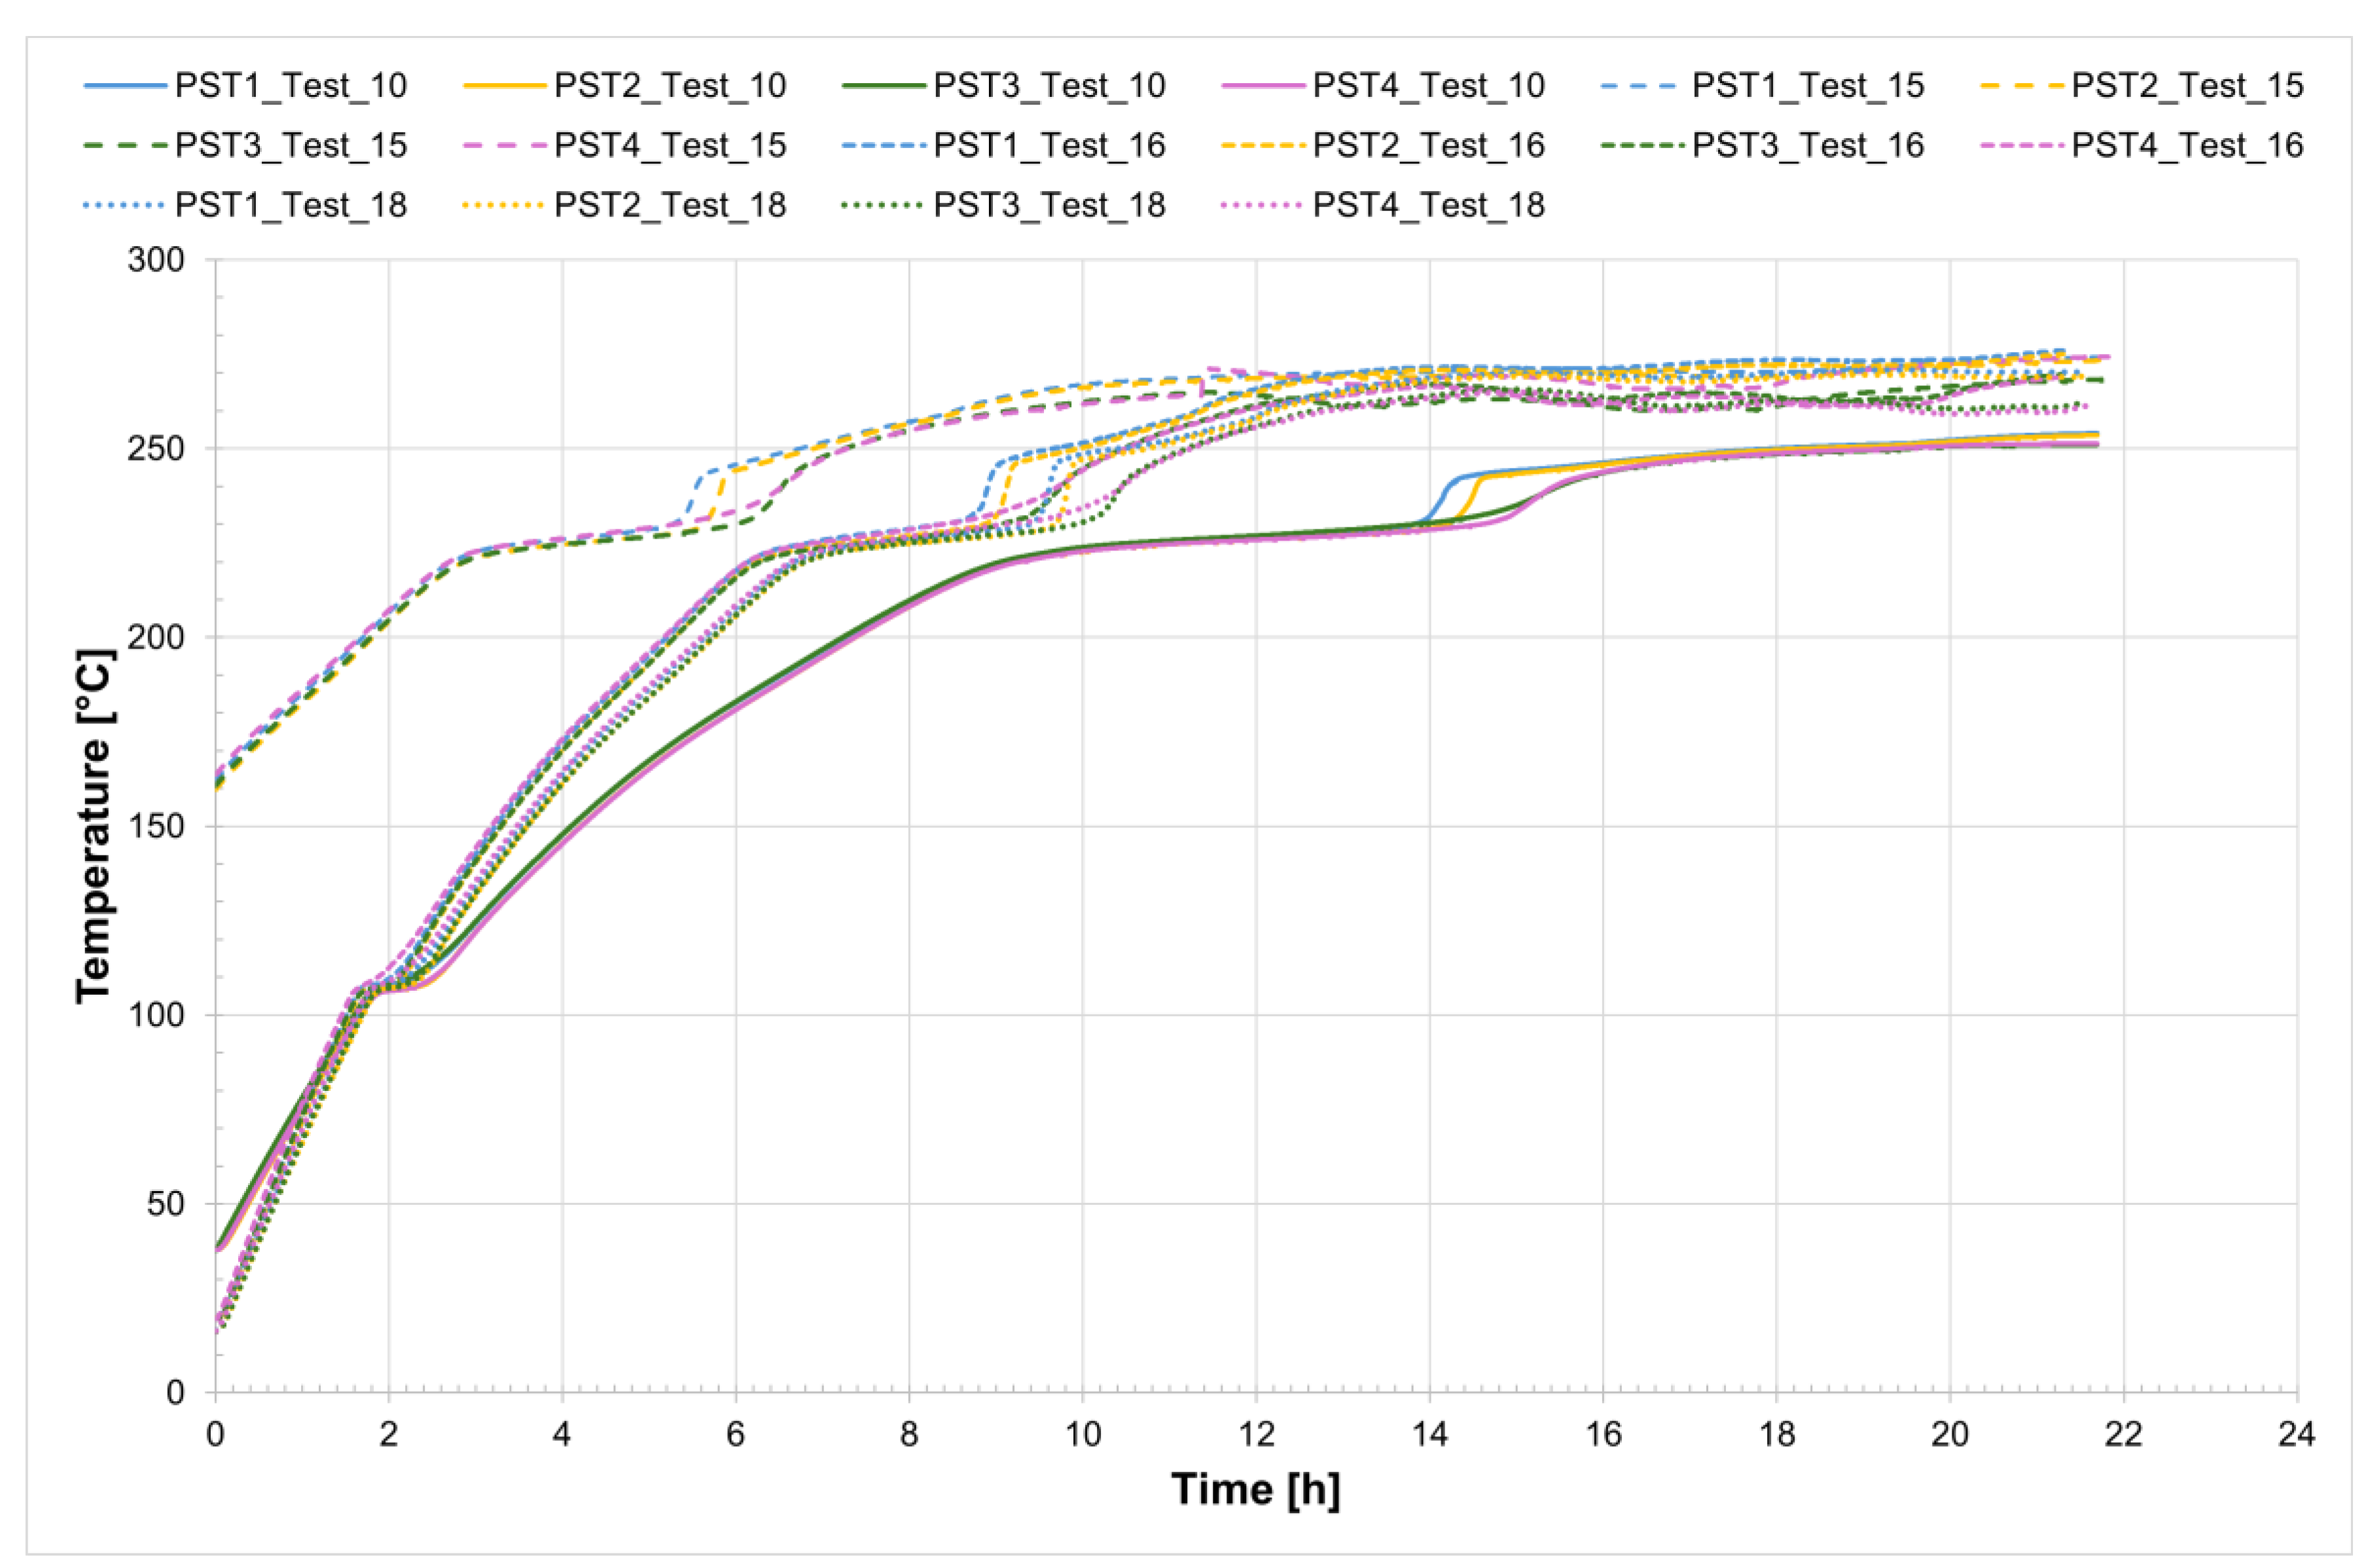
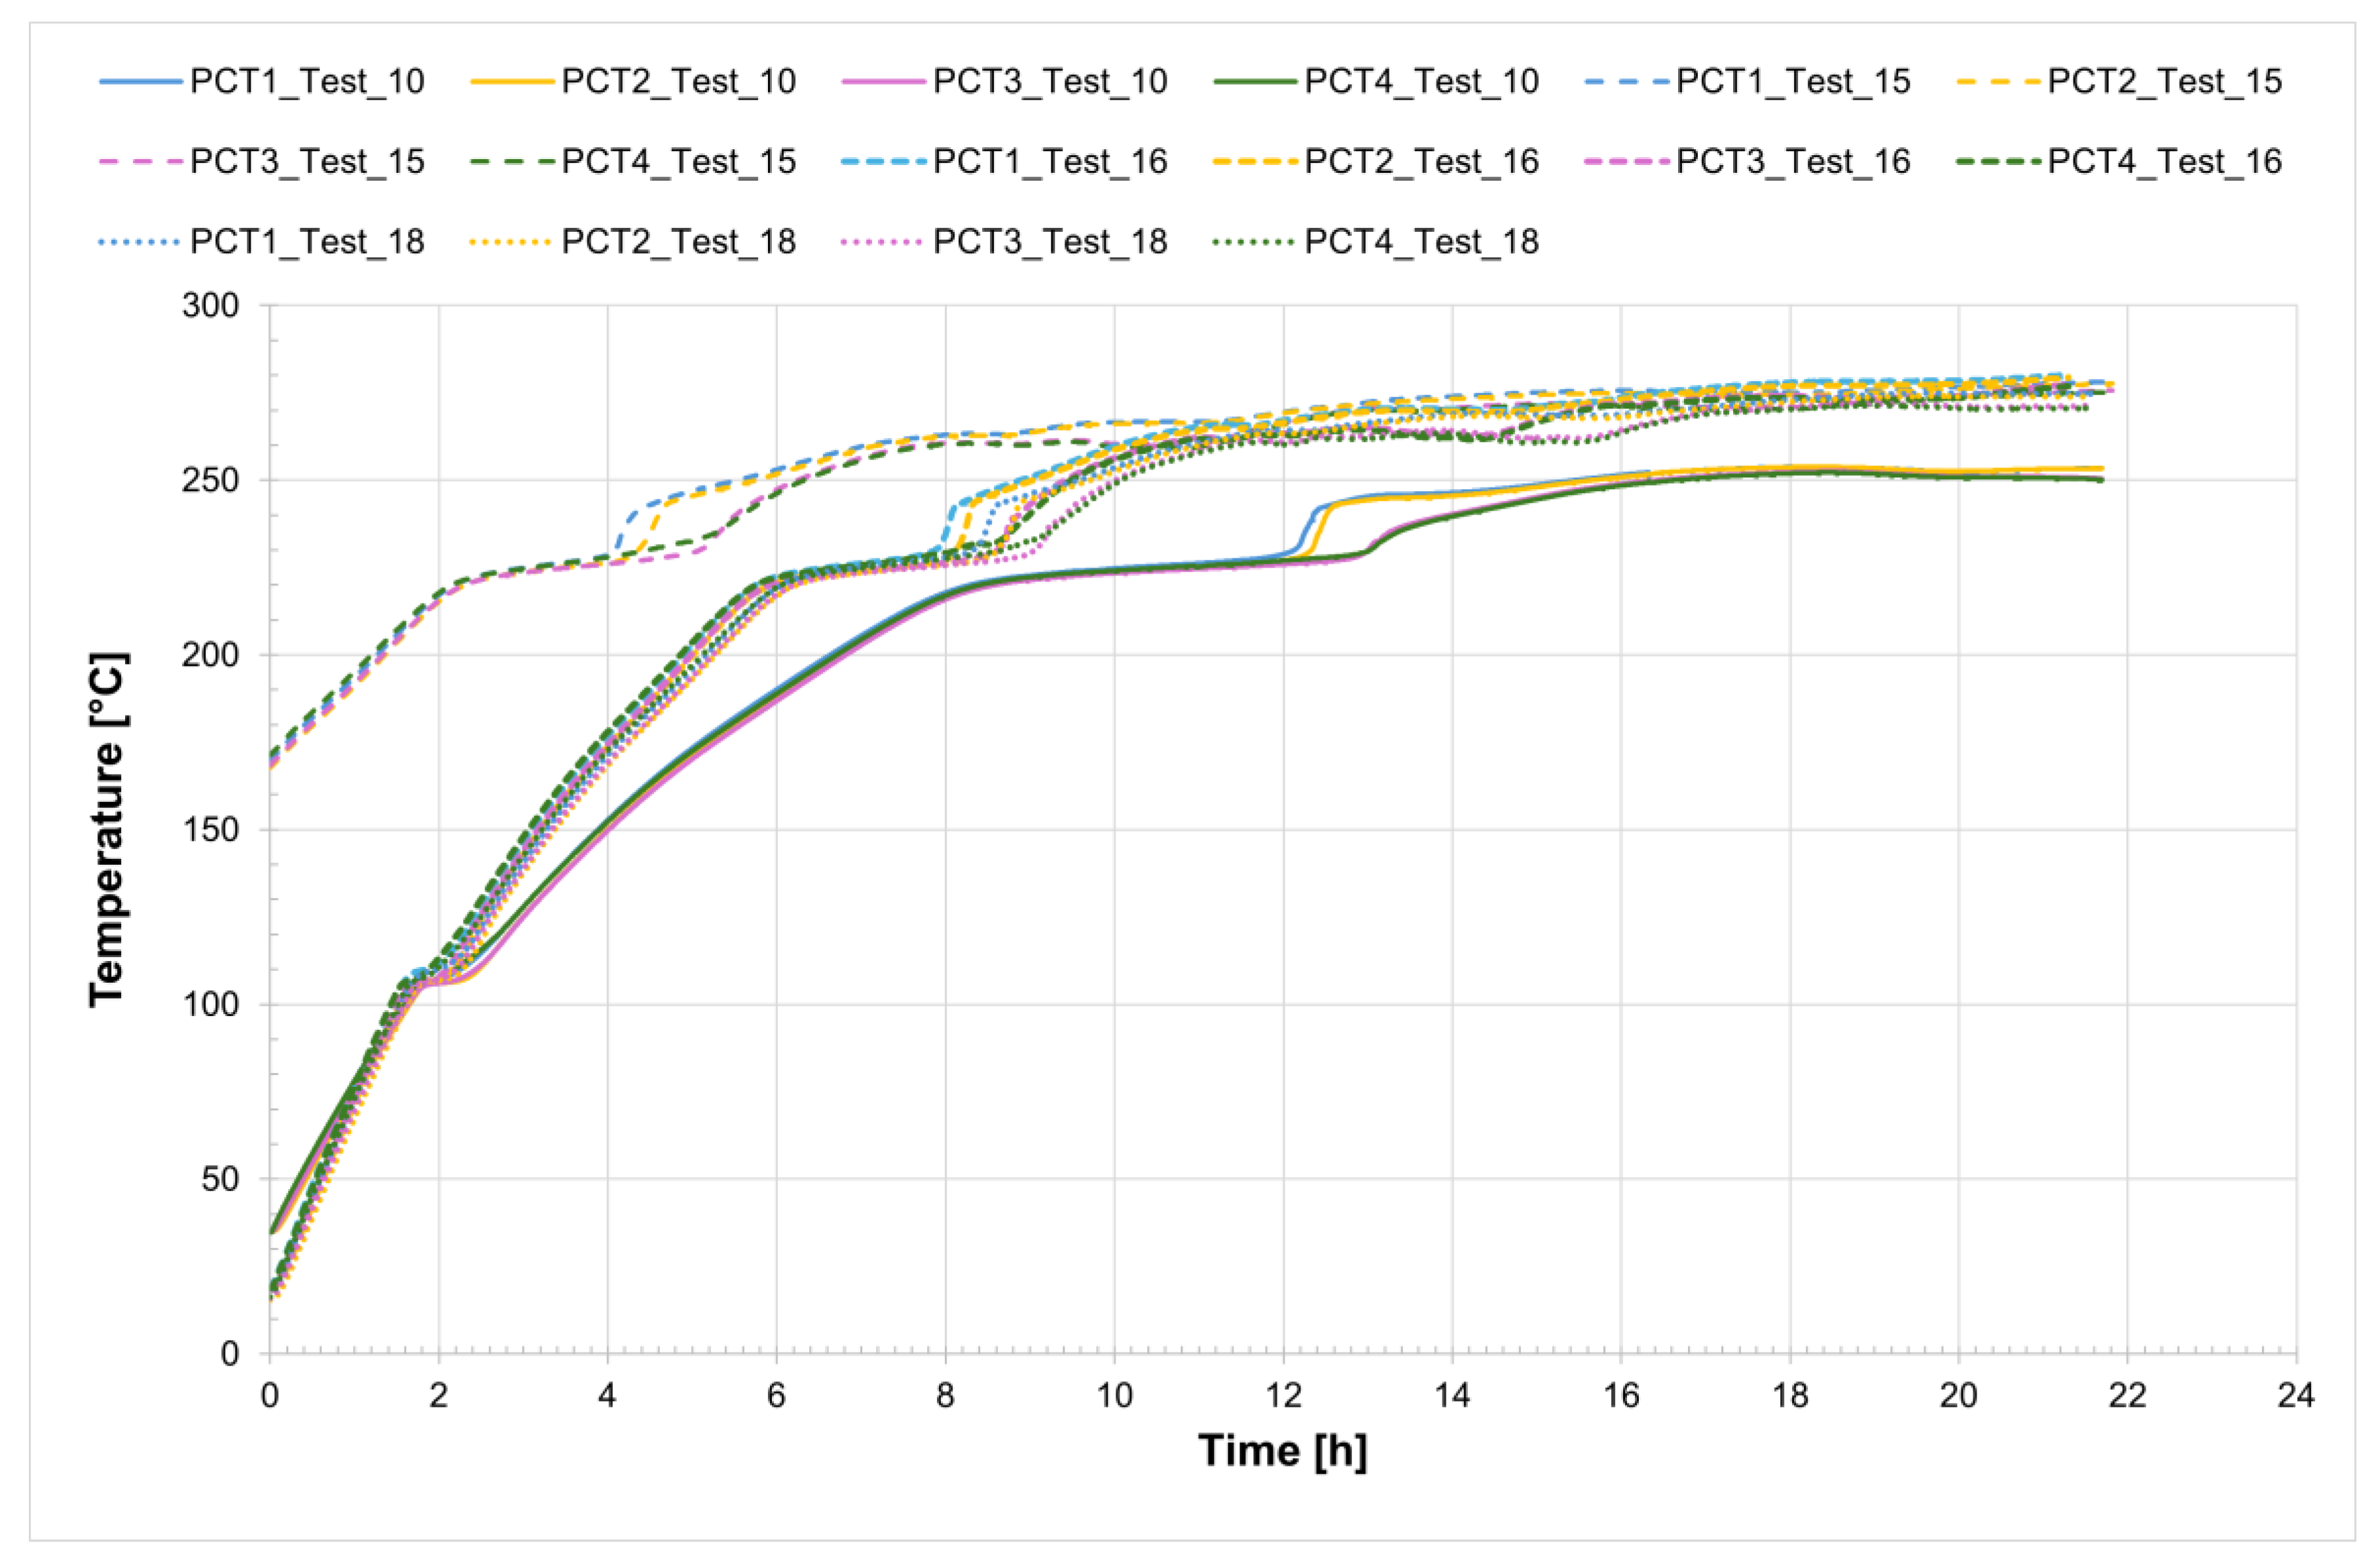
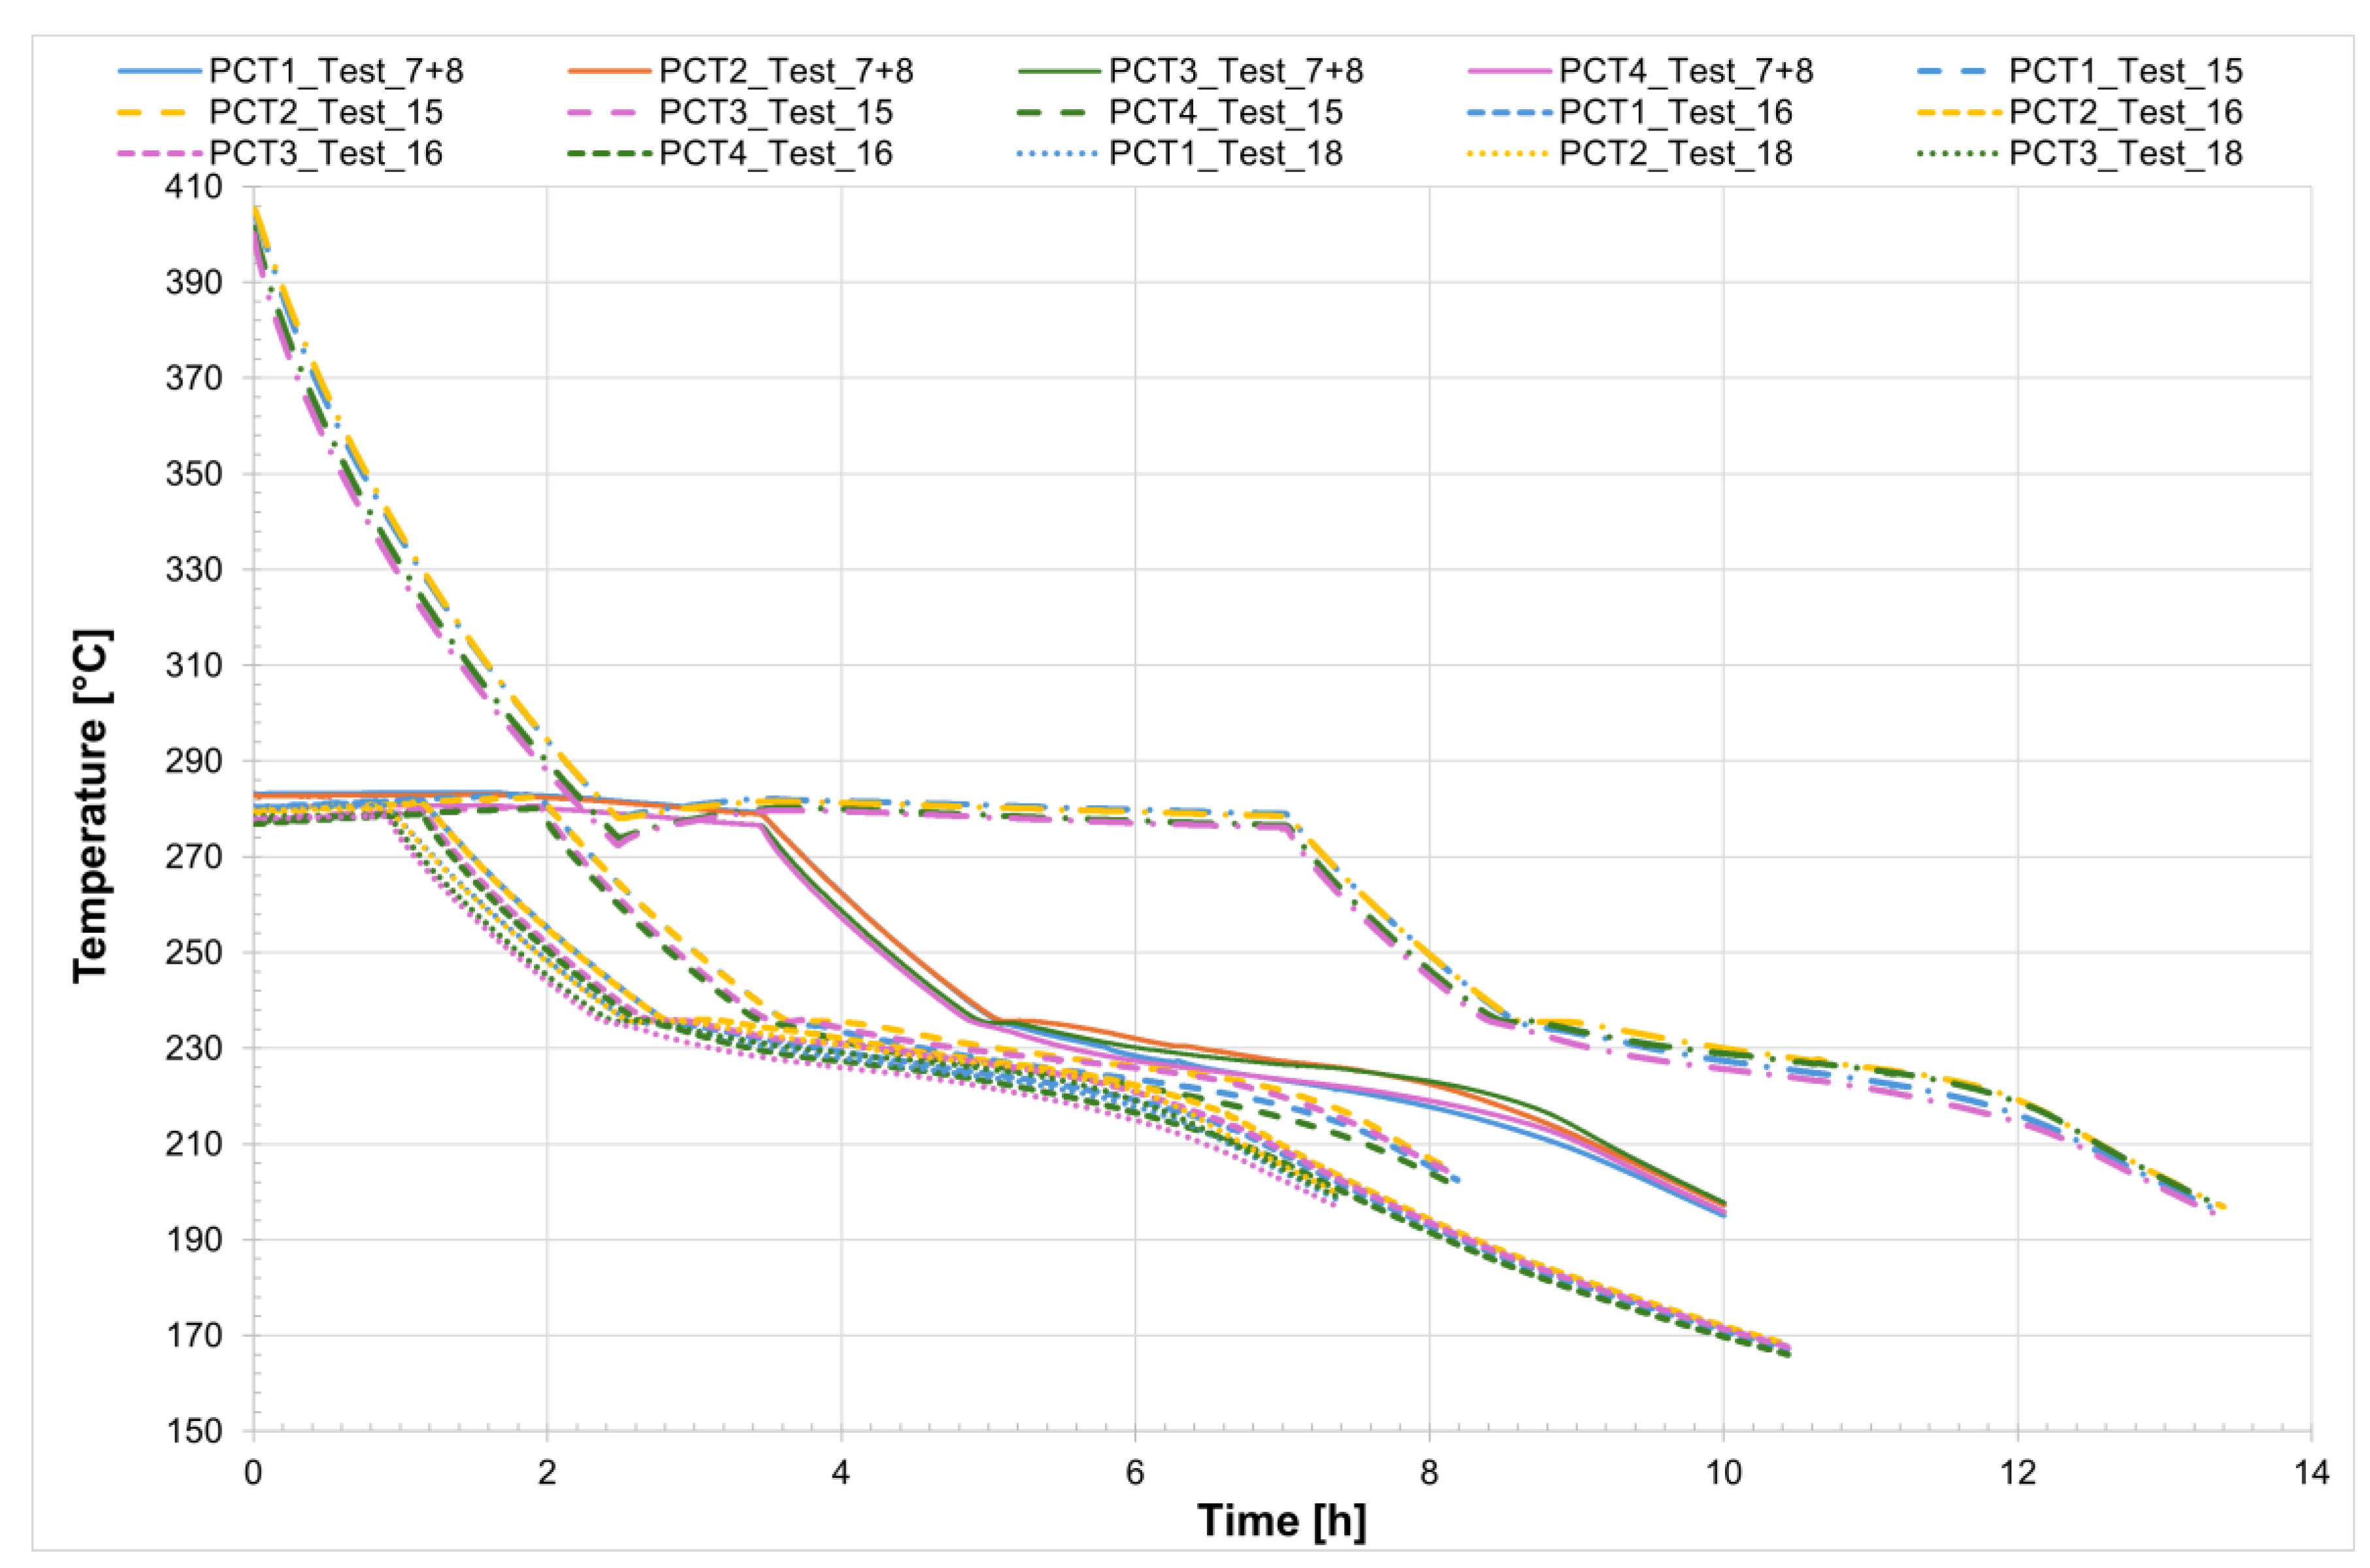
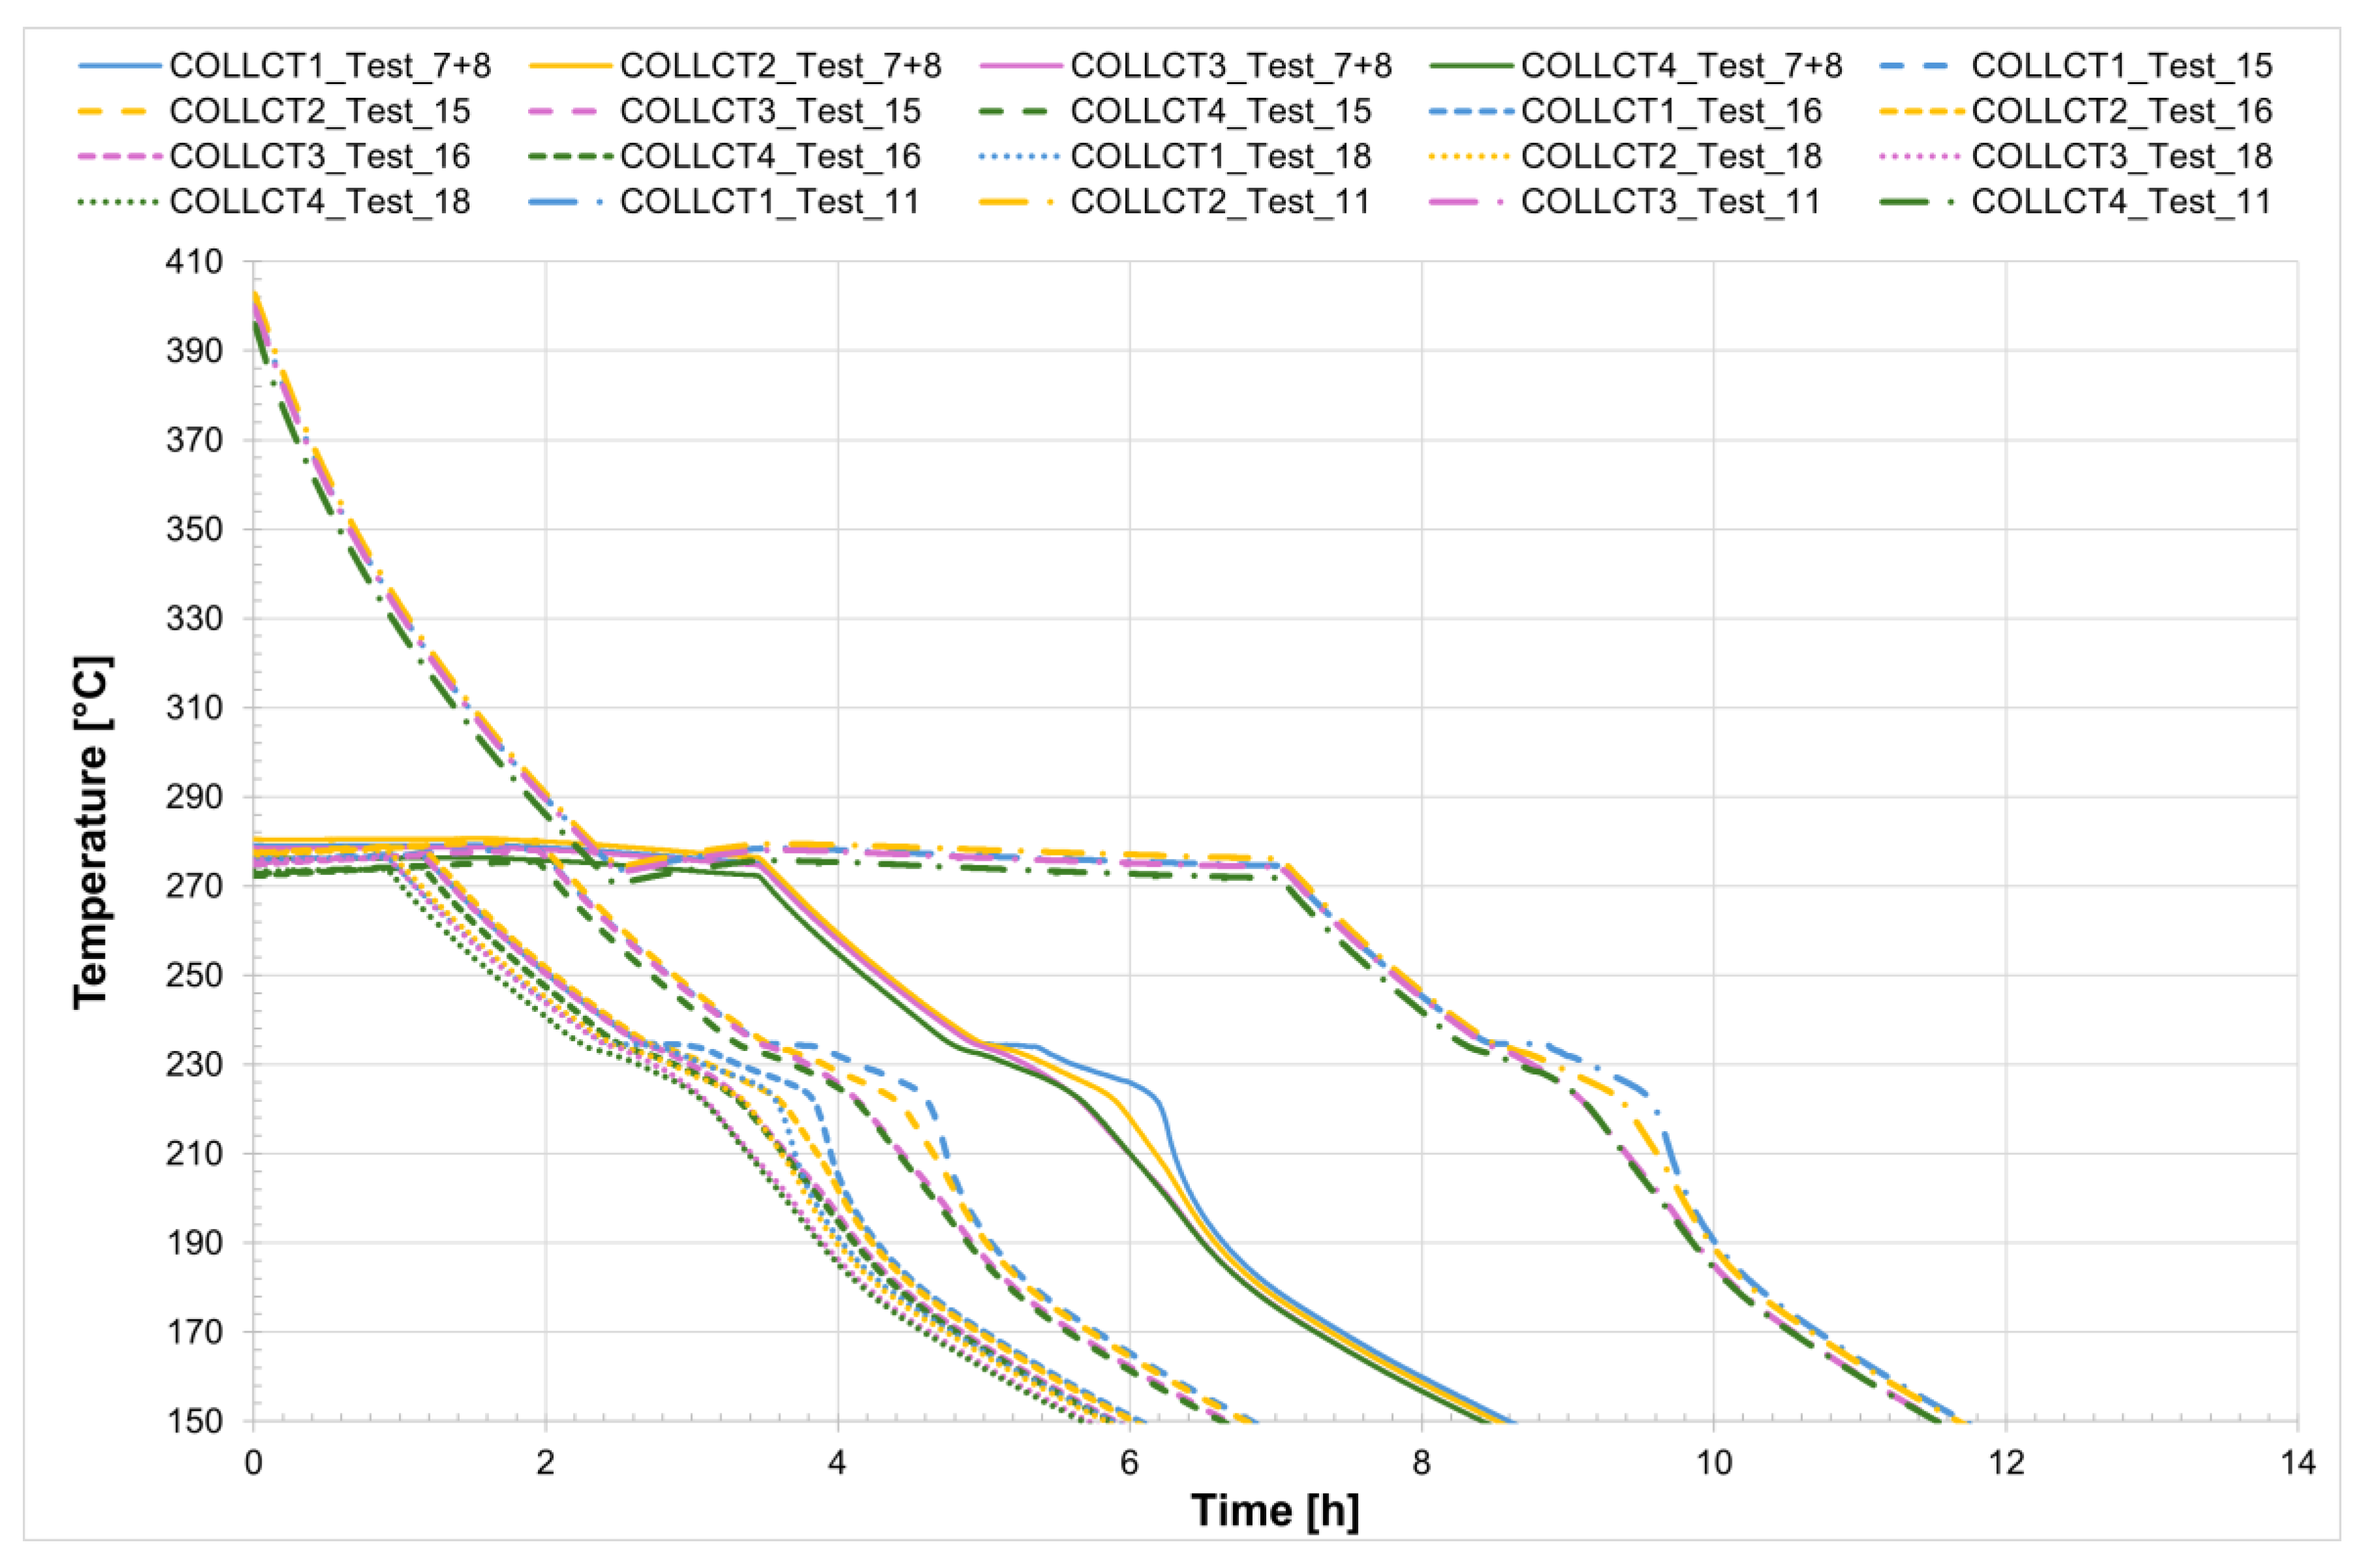
The temperature profiles recorded by the internal comb sensors (thermocouples PCT1, PCT2, PCT3, and PCT4 on the charging side and PST1, PST2, PST3, and PST4 on the discharging side, as shown in
Figure 1) in both tubes for all four tests are shown in
Figure 4 and
Figure 5, while
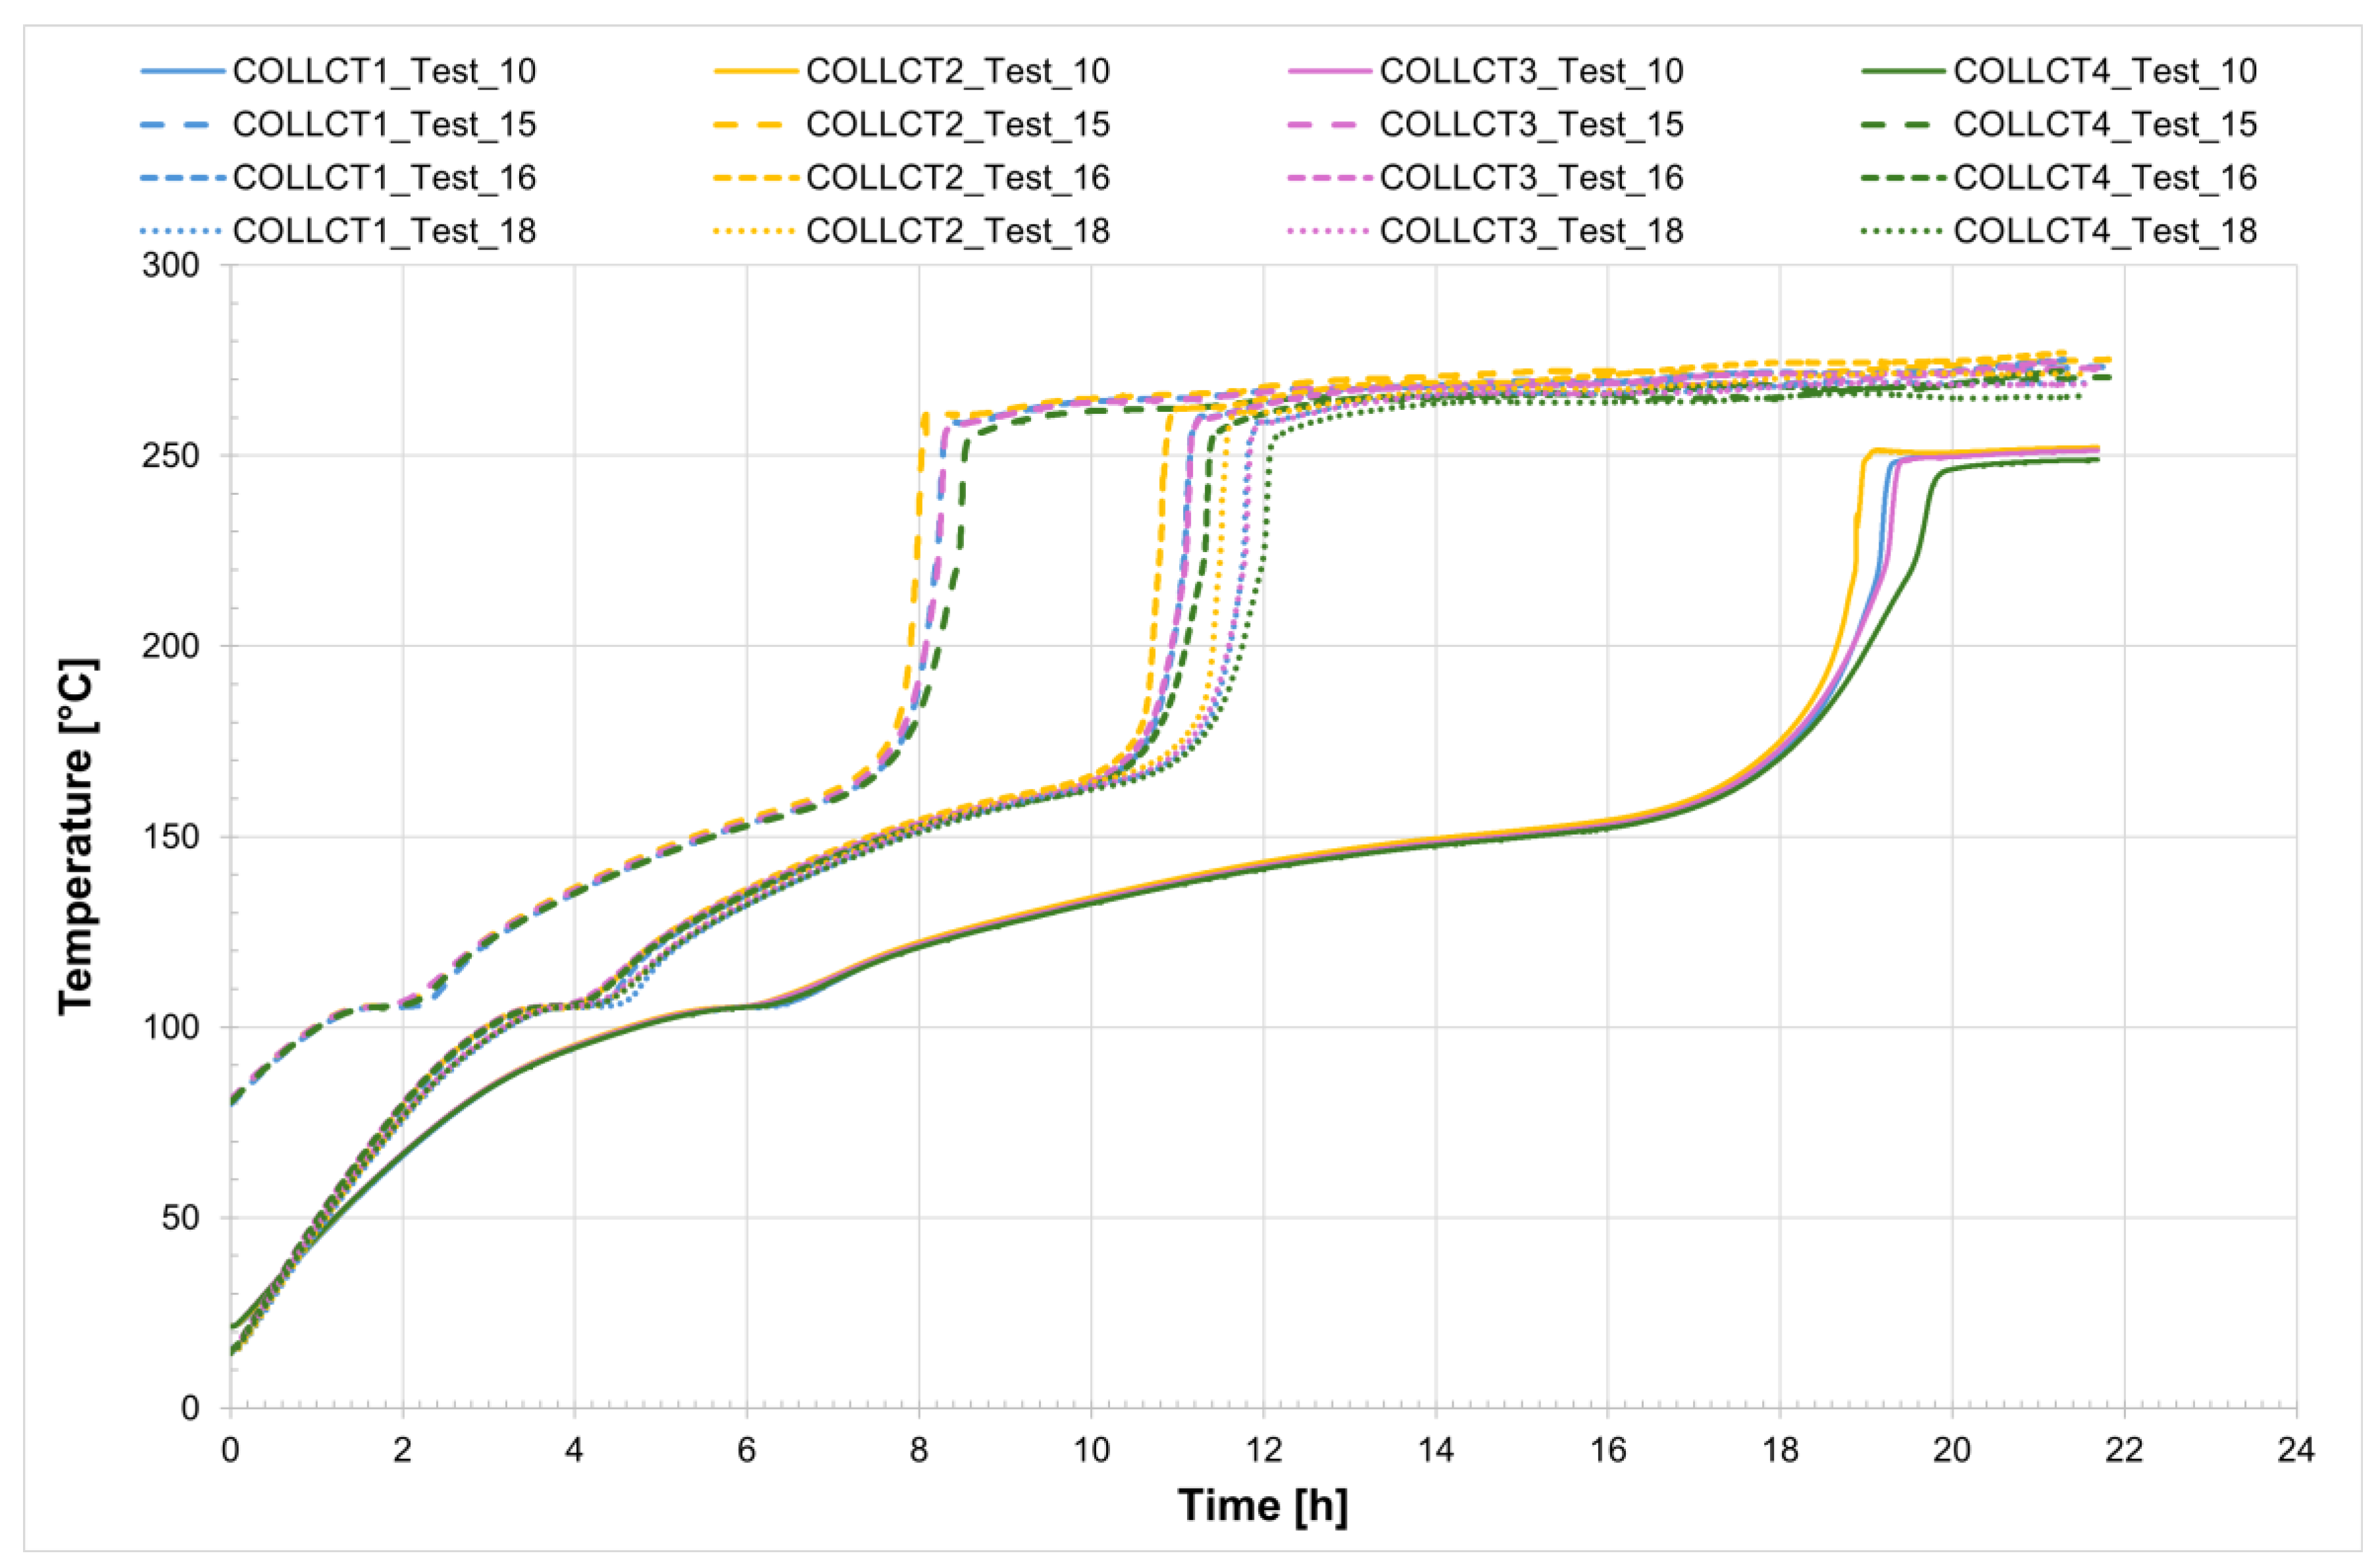
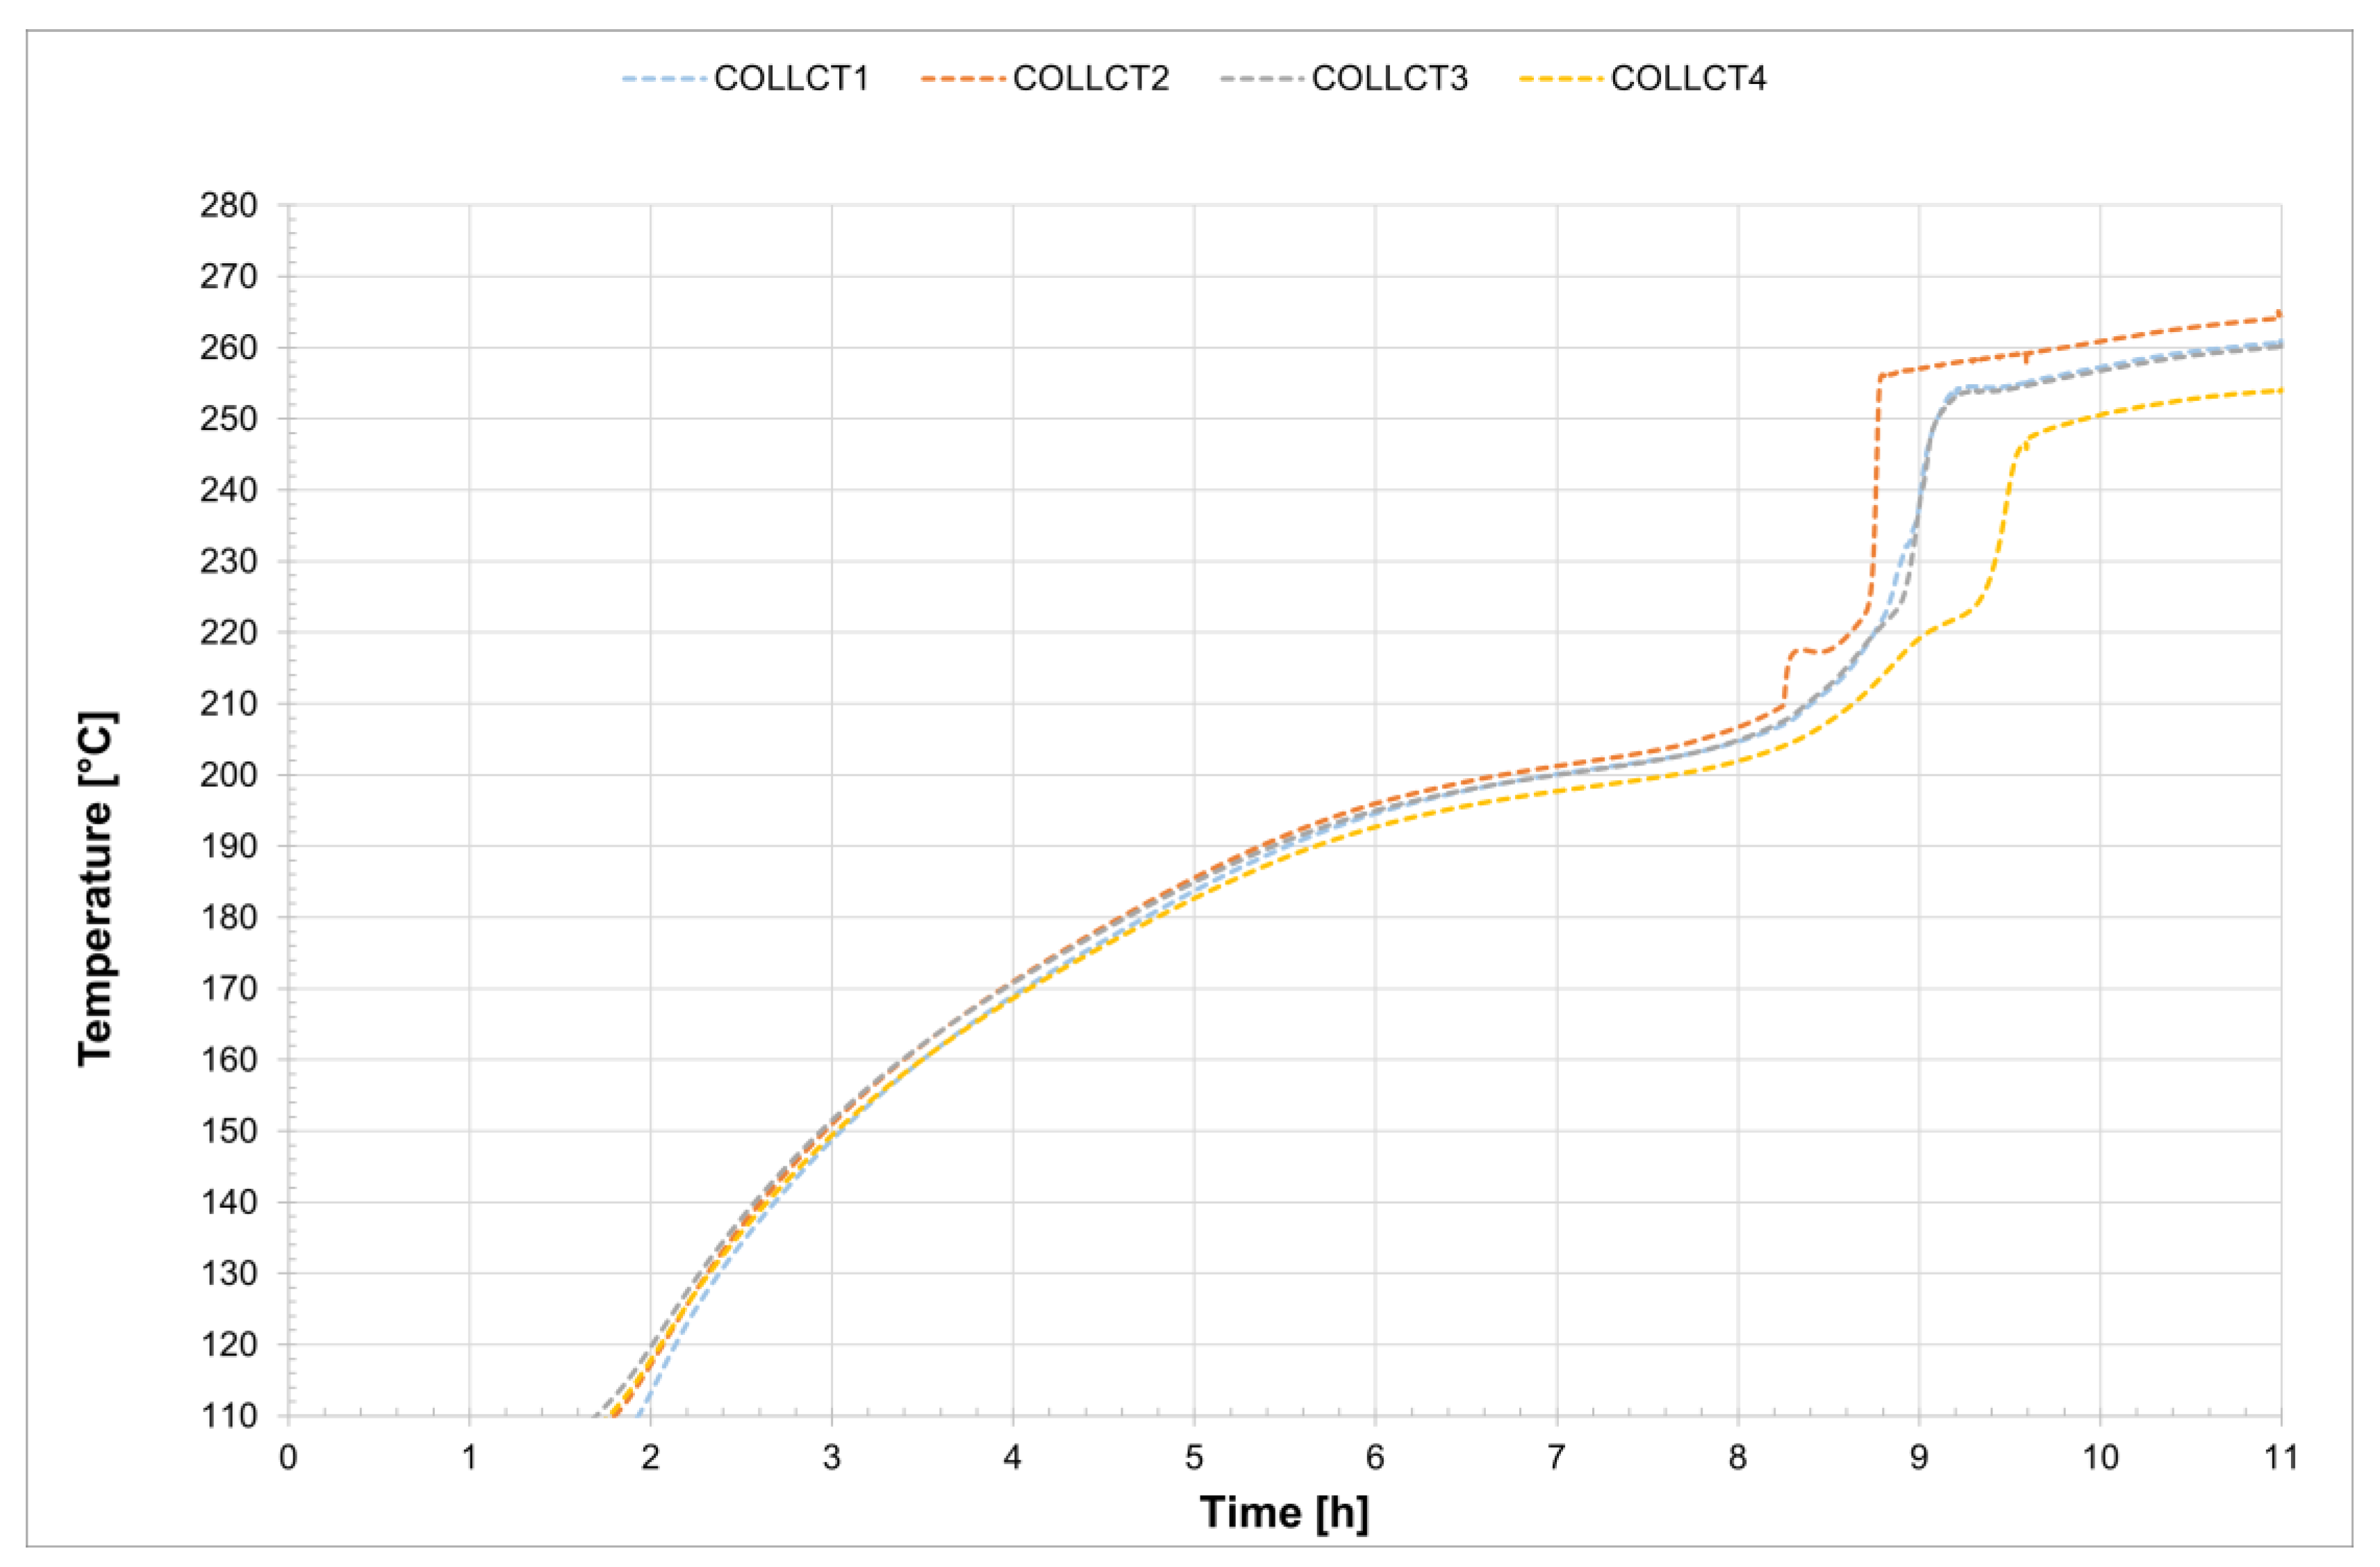
Figure 6 presents the temperature trends at the central collar between the two receivers.
Furthermore,
Figure 7 shows the start and end points of the melting process for all four tests. The solid line indicates the first thermocouple to reach the onset melting temperature (T = 220 °C), while the dashed line represents the last thermocouple to reach the completion temperature of the phase change (T = 240 °C). In this way, the duration of the melting process can be compared across the different tests, and it is immediately apparent that the melting time is longer in the case where a voltage of 4 V was applied.
Considering Test_16 as an example, the time interval during which complete melting of the salt occurs ranges from the onset melting temperature of approximately 221 °C to the complete melting temperature of about 240 °C. The entire process takes approximately 5.5 h.
Analyzing the melting process as recorded by the comb sensors placed inside the two tubes, it can be clearly observed that melting in the two sections occurs with a delay of approximately 20 min between them. Specifically, melting begins first in the so-called charging section and subsequently in the discharge one. This is likely due in part to the configuration of the test section and partly to the inclination of the tubes themselves. In the charging section, it takes about 3 h for all the salt to become fully liquid. During the initial heating phase, the temperature increases very slowly, remaining nearly flat between 220 °C and 230 °C as the energy input is primarily absorbed as latent heat for the melting process. This slow temperature rise clearly reflects the progression of the phase change, with the latent heat of fusion (96 J/g) being absorbed by the salt mixture (total mass: 50.5 kg). Once most of the salt in a given section has melted, a sharp temperature increase is observed, indicating the completion of the phase transition and the full absorption of latent heat. This phenomenon is especially evident in the receiver tubes, where the thermocouples capture the solid-to-liquid transition with high accuracy. Notably, thermocouples positioned in the upper half of the section consistently record slightly higher temperatures compared to those in the lower half, highlighting the effects of natural convection and density differences during melting. Similar trends are also observed at the central comb sensor on the discharge side. At the central collar welded between the two receiver tubes, however, the melting process appears less distinct. Here, the salt remains solid until a sudden temperature increase occurs, but only after the salt in the adjacent receiver tubes has become fully liquefied. This delayed melting is primarily attributed to significant heat losses at the collar—mainly due to the presence of the supporting structure—which causes the temperature in this region to rise more slowly than in the internal sections. As a result, the salt at the collar remains solid until the surrounding melted salt accelerates the local phase change.
3.2. Receiver Test with Vacuum—Salt Solidification Process
After the complete melting of the salt within the test section, Joule heating of the receiver tubes was continued to bring the entire system to a steady-state temperature of 270 °C. This temperature was maintained for at least one hour before switching off the Joule heating system to initiate the salt solidification test.
The initial condition of 270 °C throughout the system was selected to closely replicate real field operating scenarios. During night-time circulation in the solar field—when solar radiation is absent—the salt typically enters the solar field at 290 °C and exits at 270 °C. In these experimental tests, the lowest temperature condition (270 °C) was adopted to ensure a conservative analysis of the results. The results of the tests carried out are summarized in
Table 2.
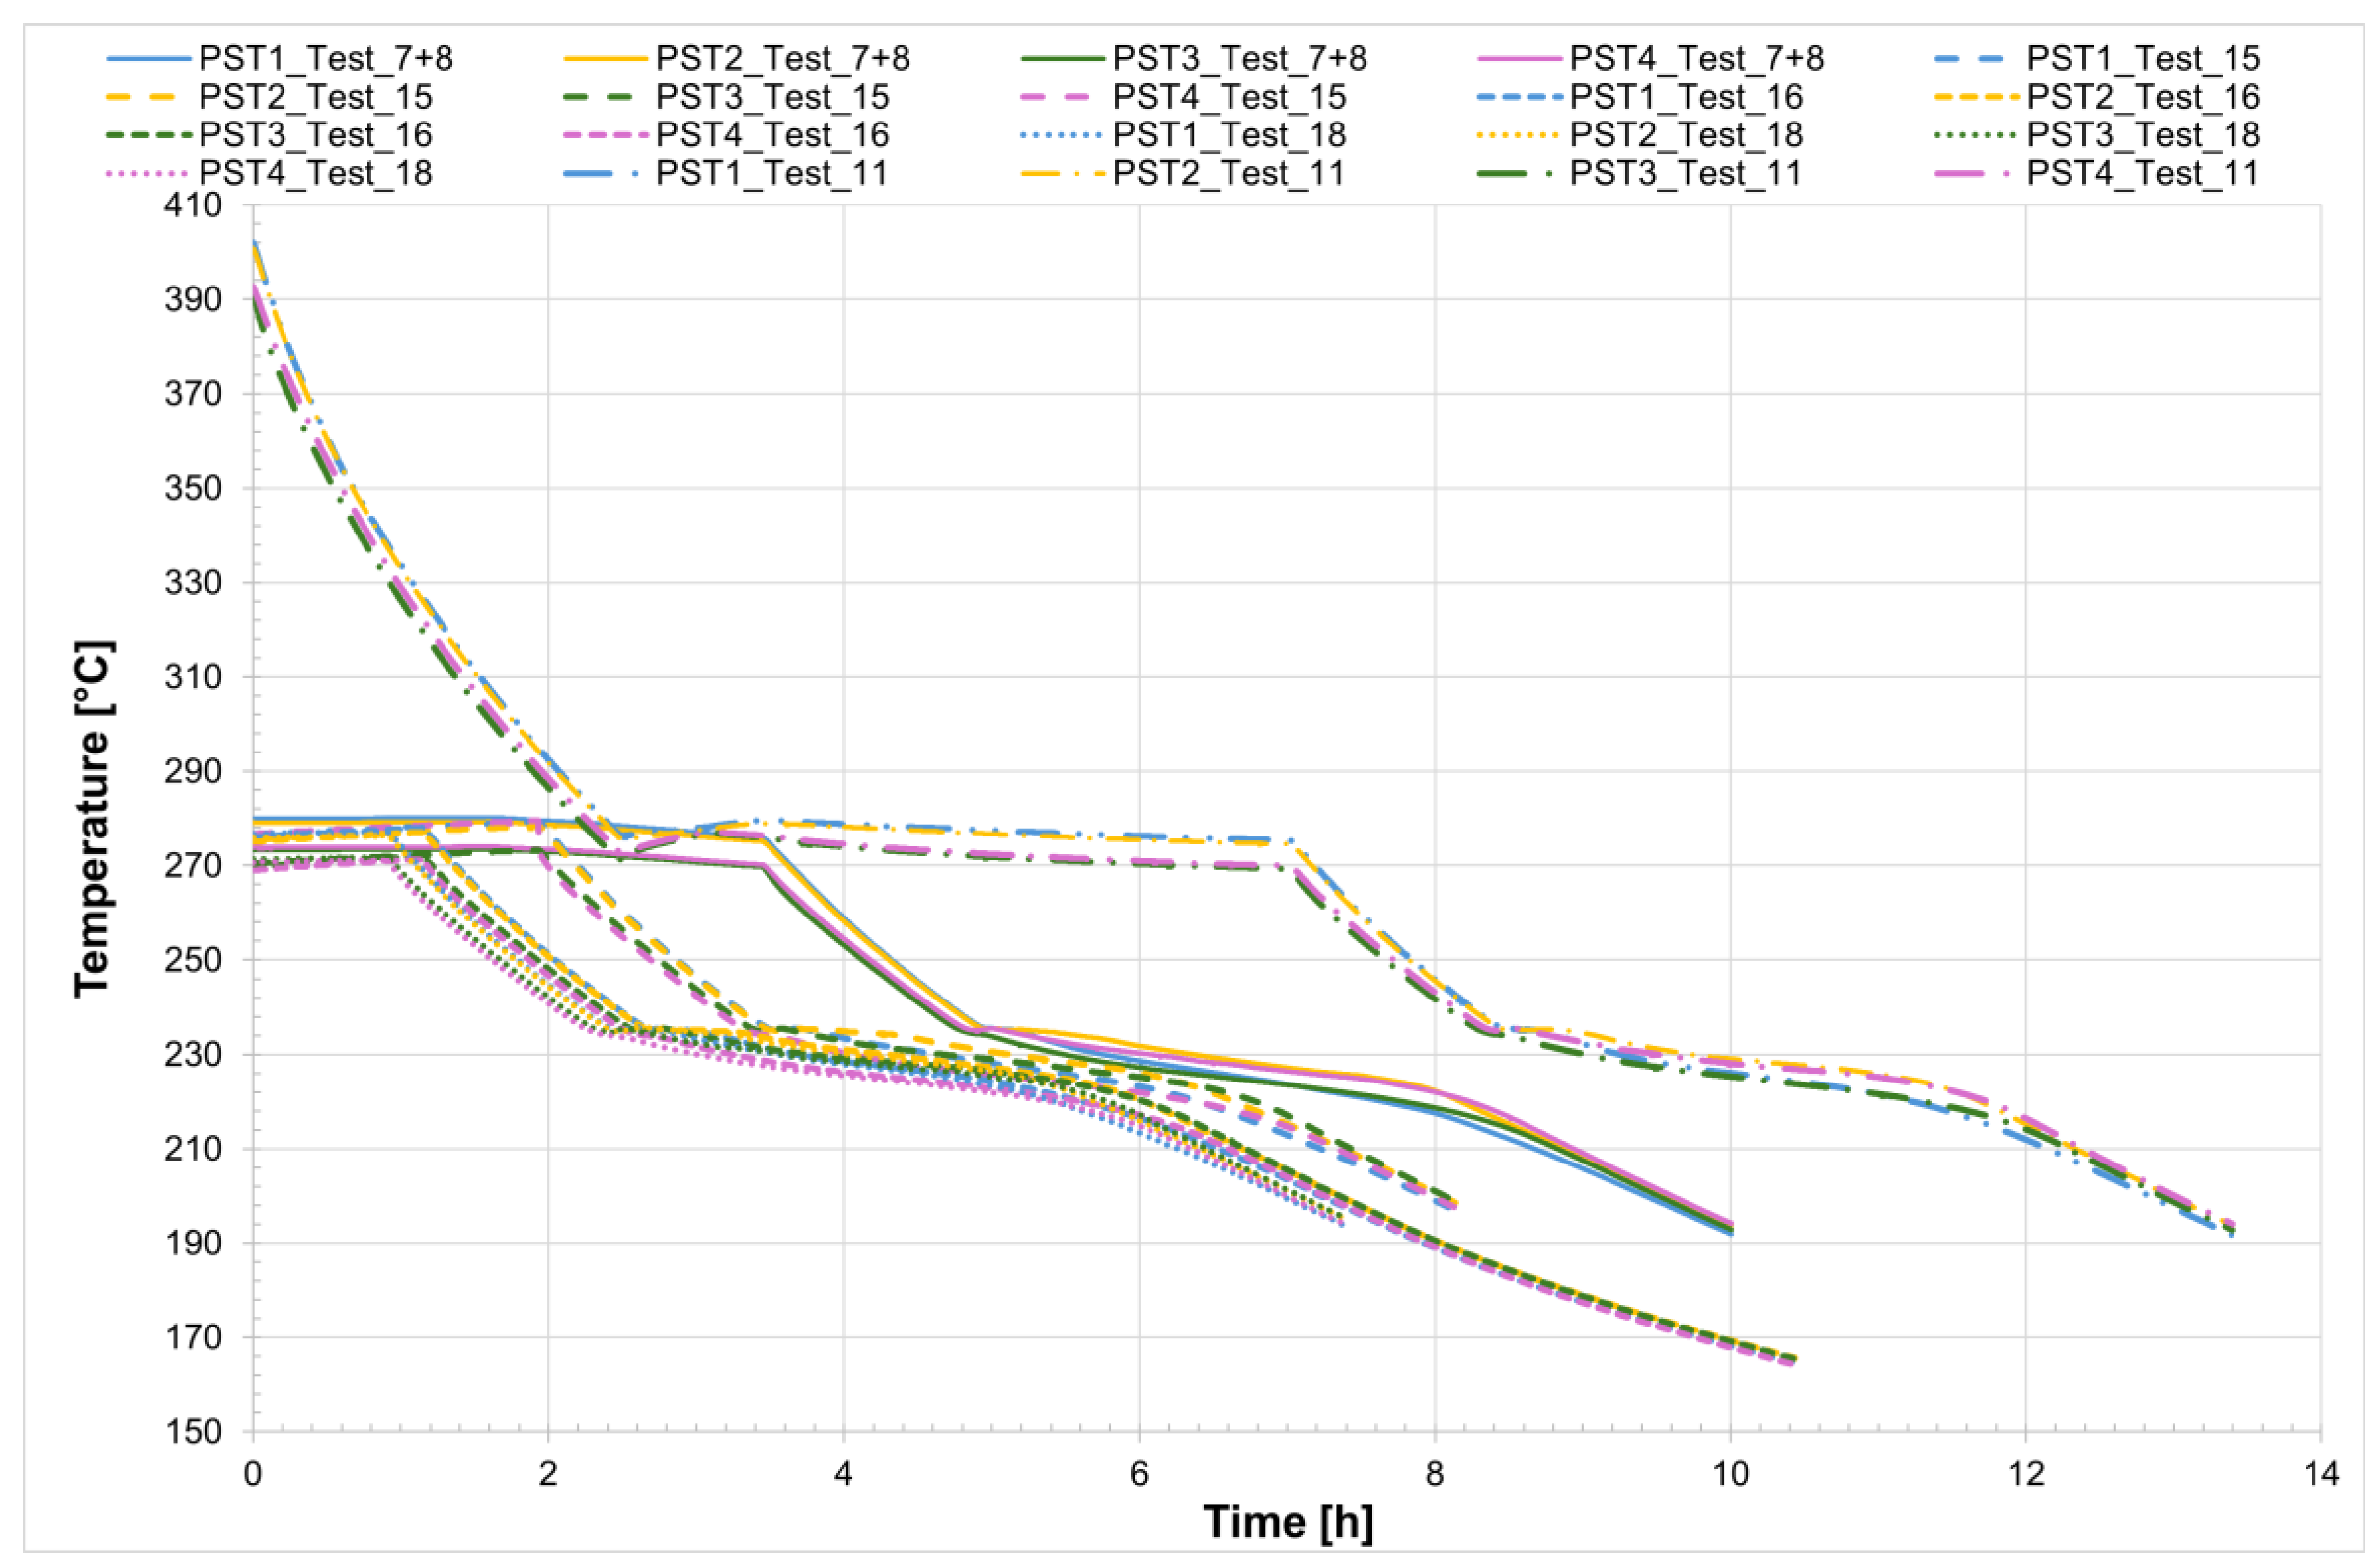
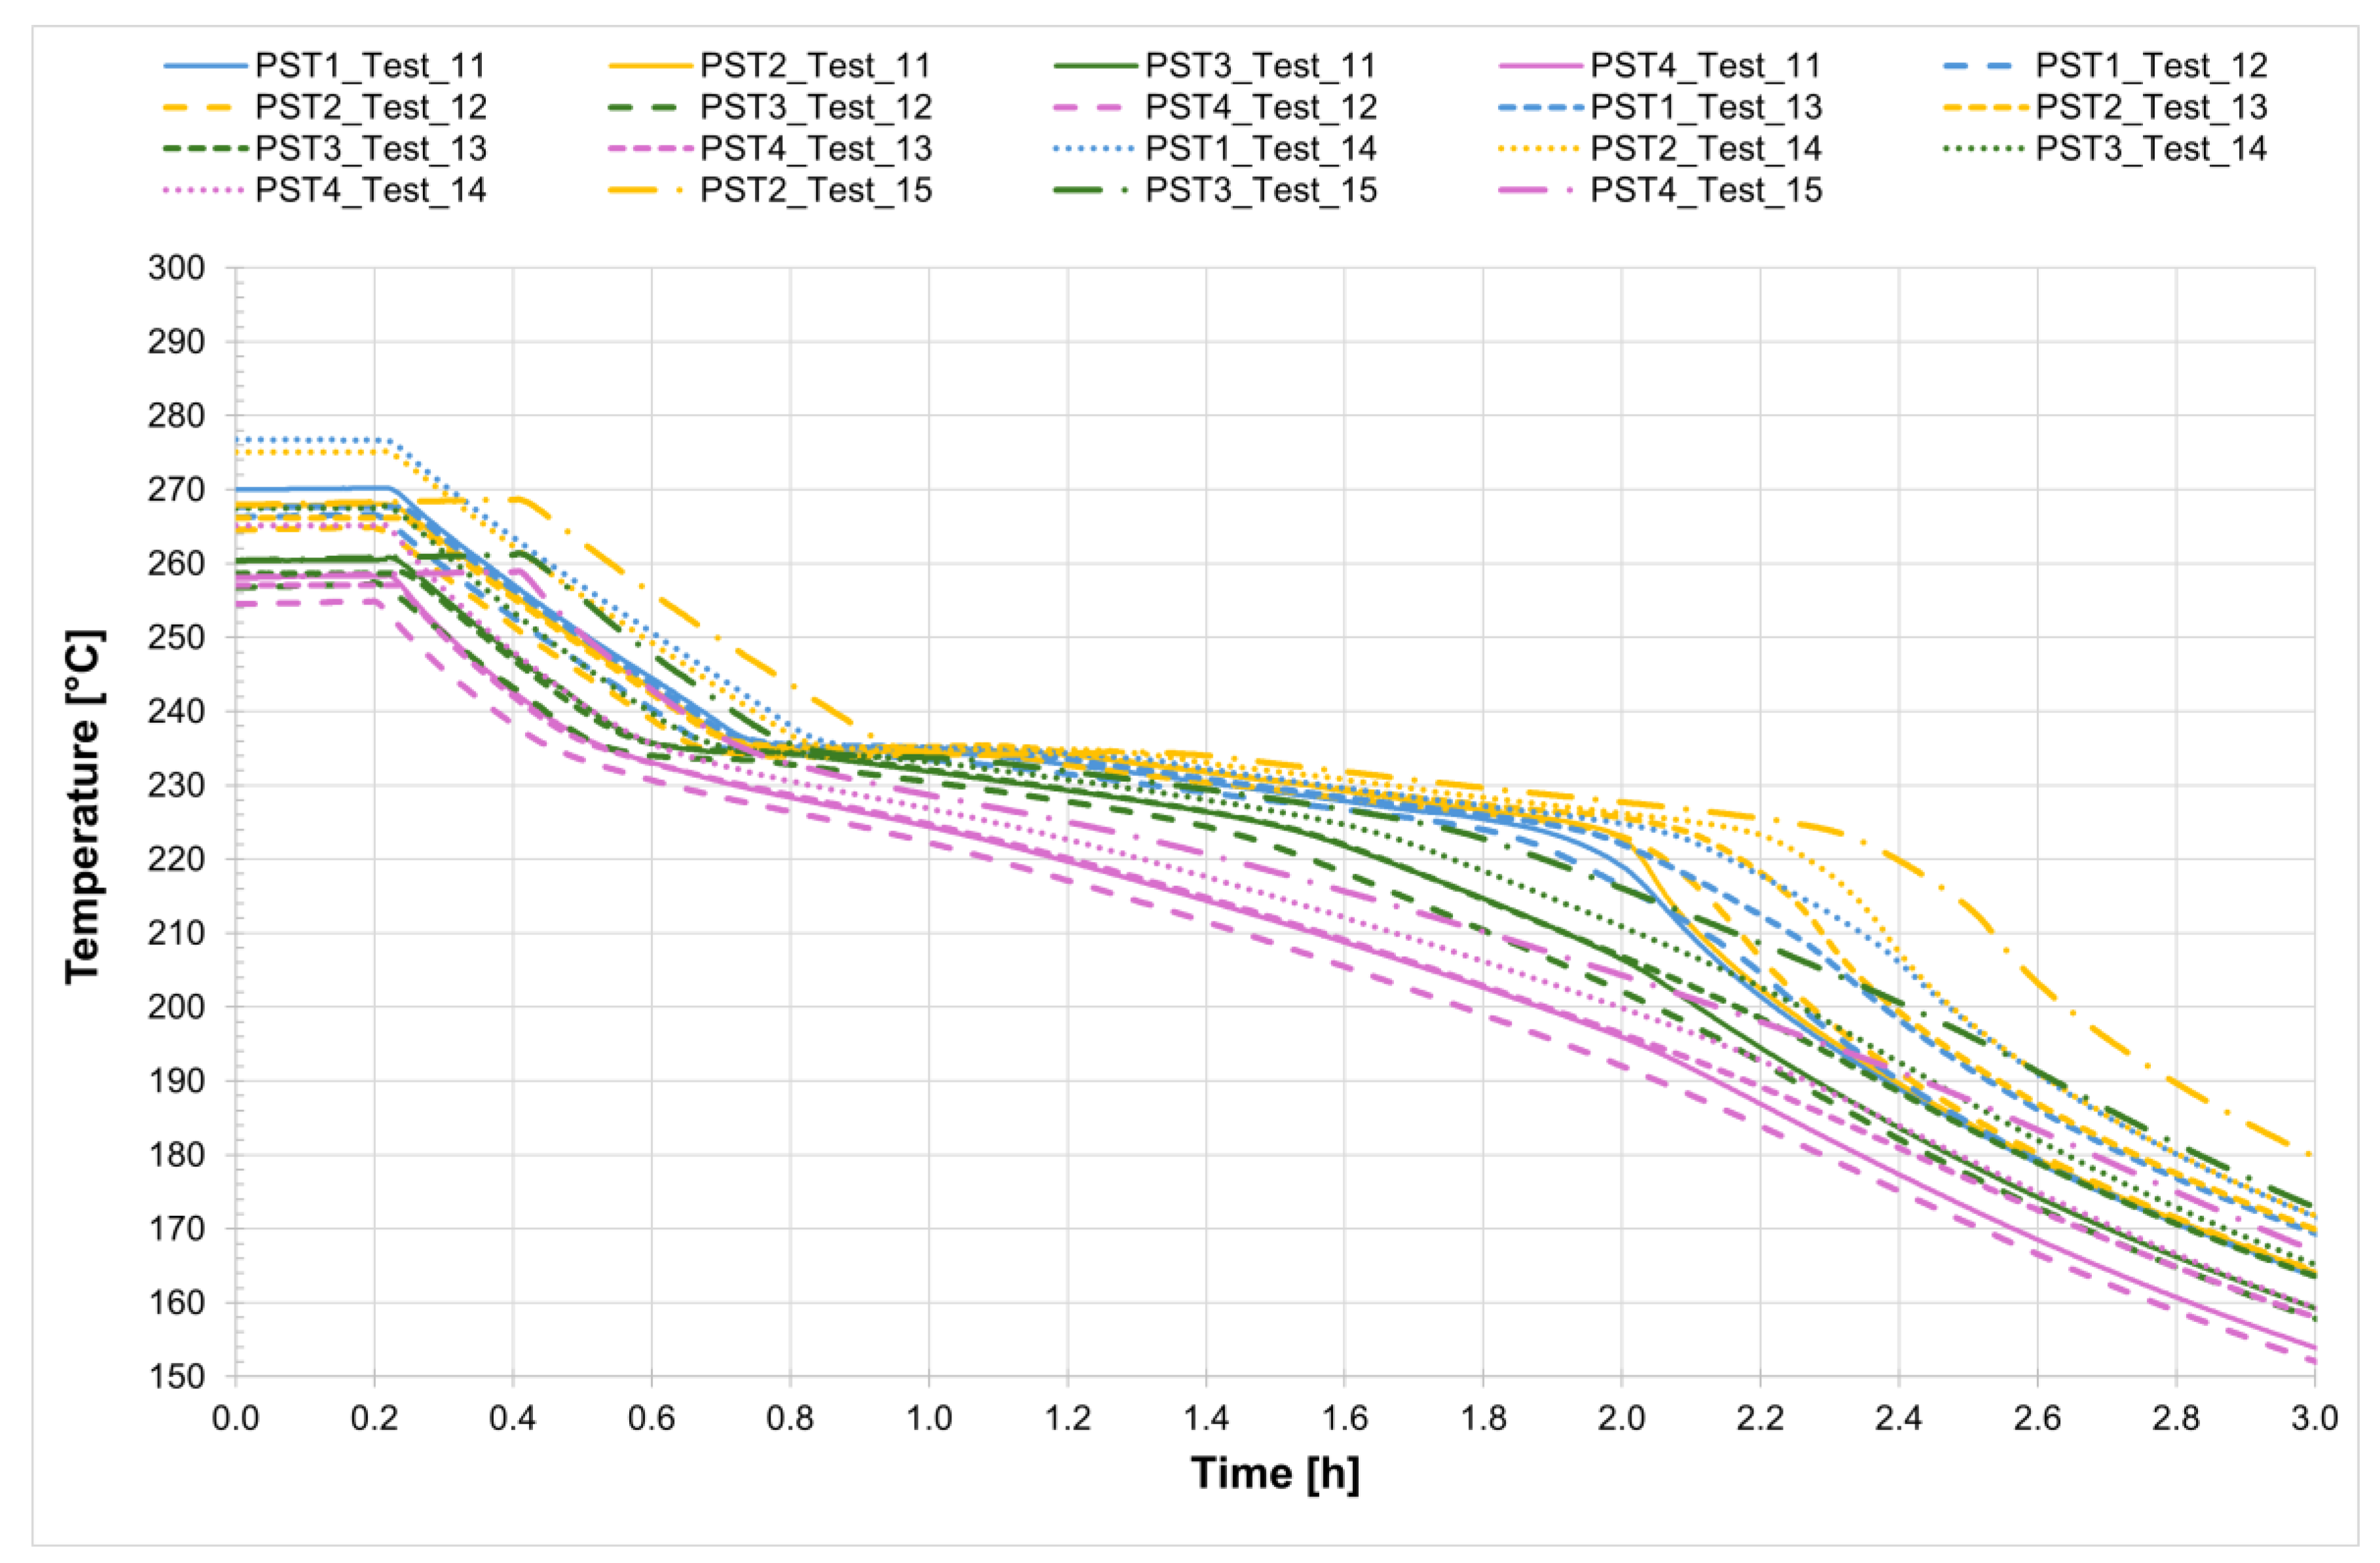
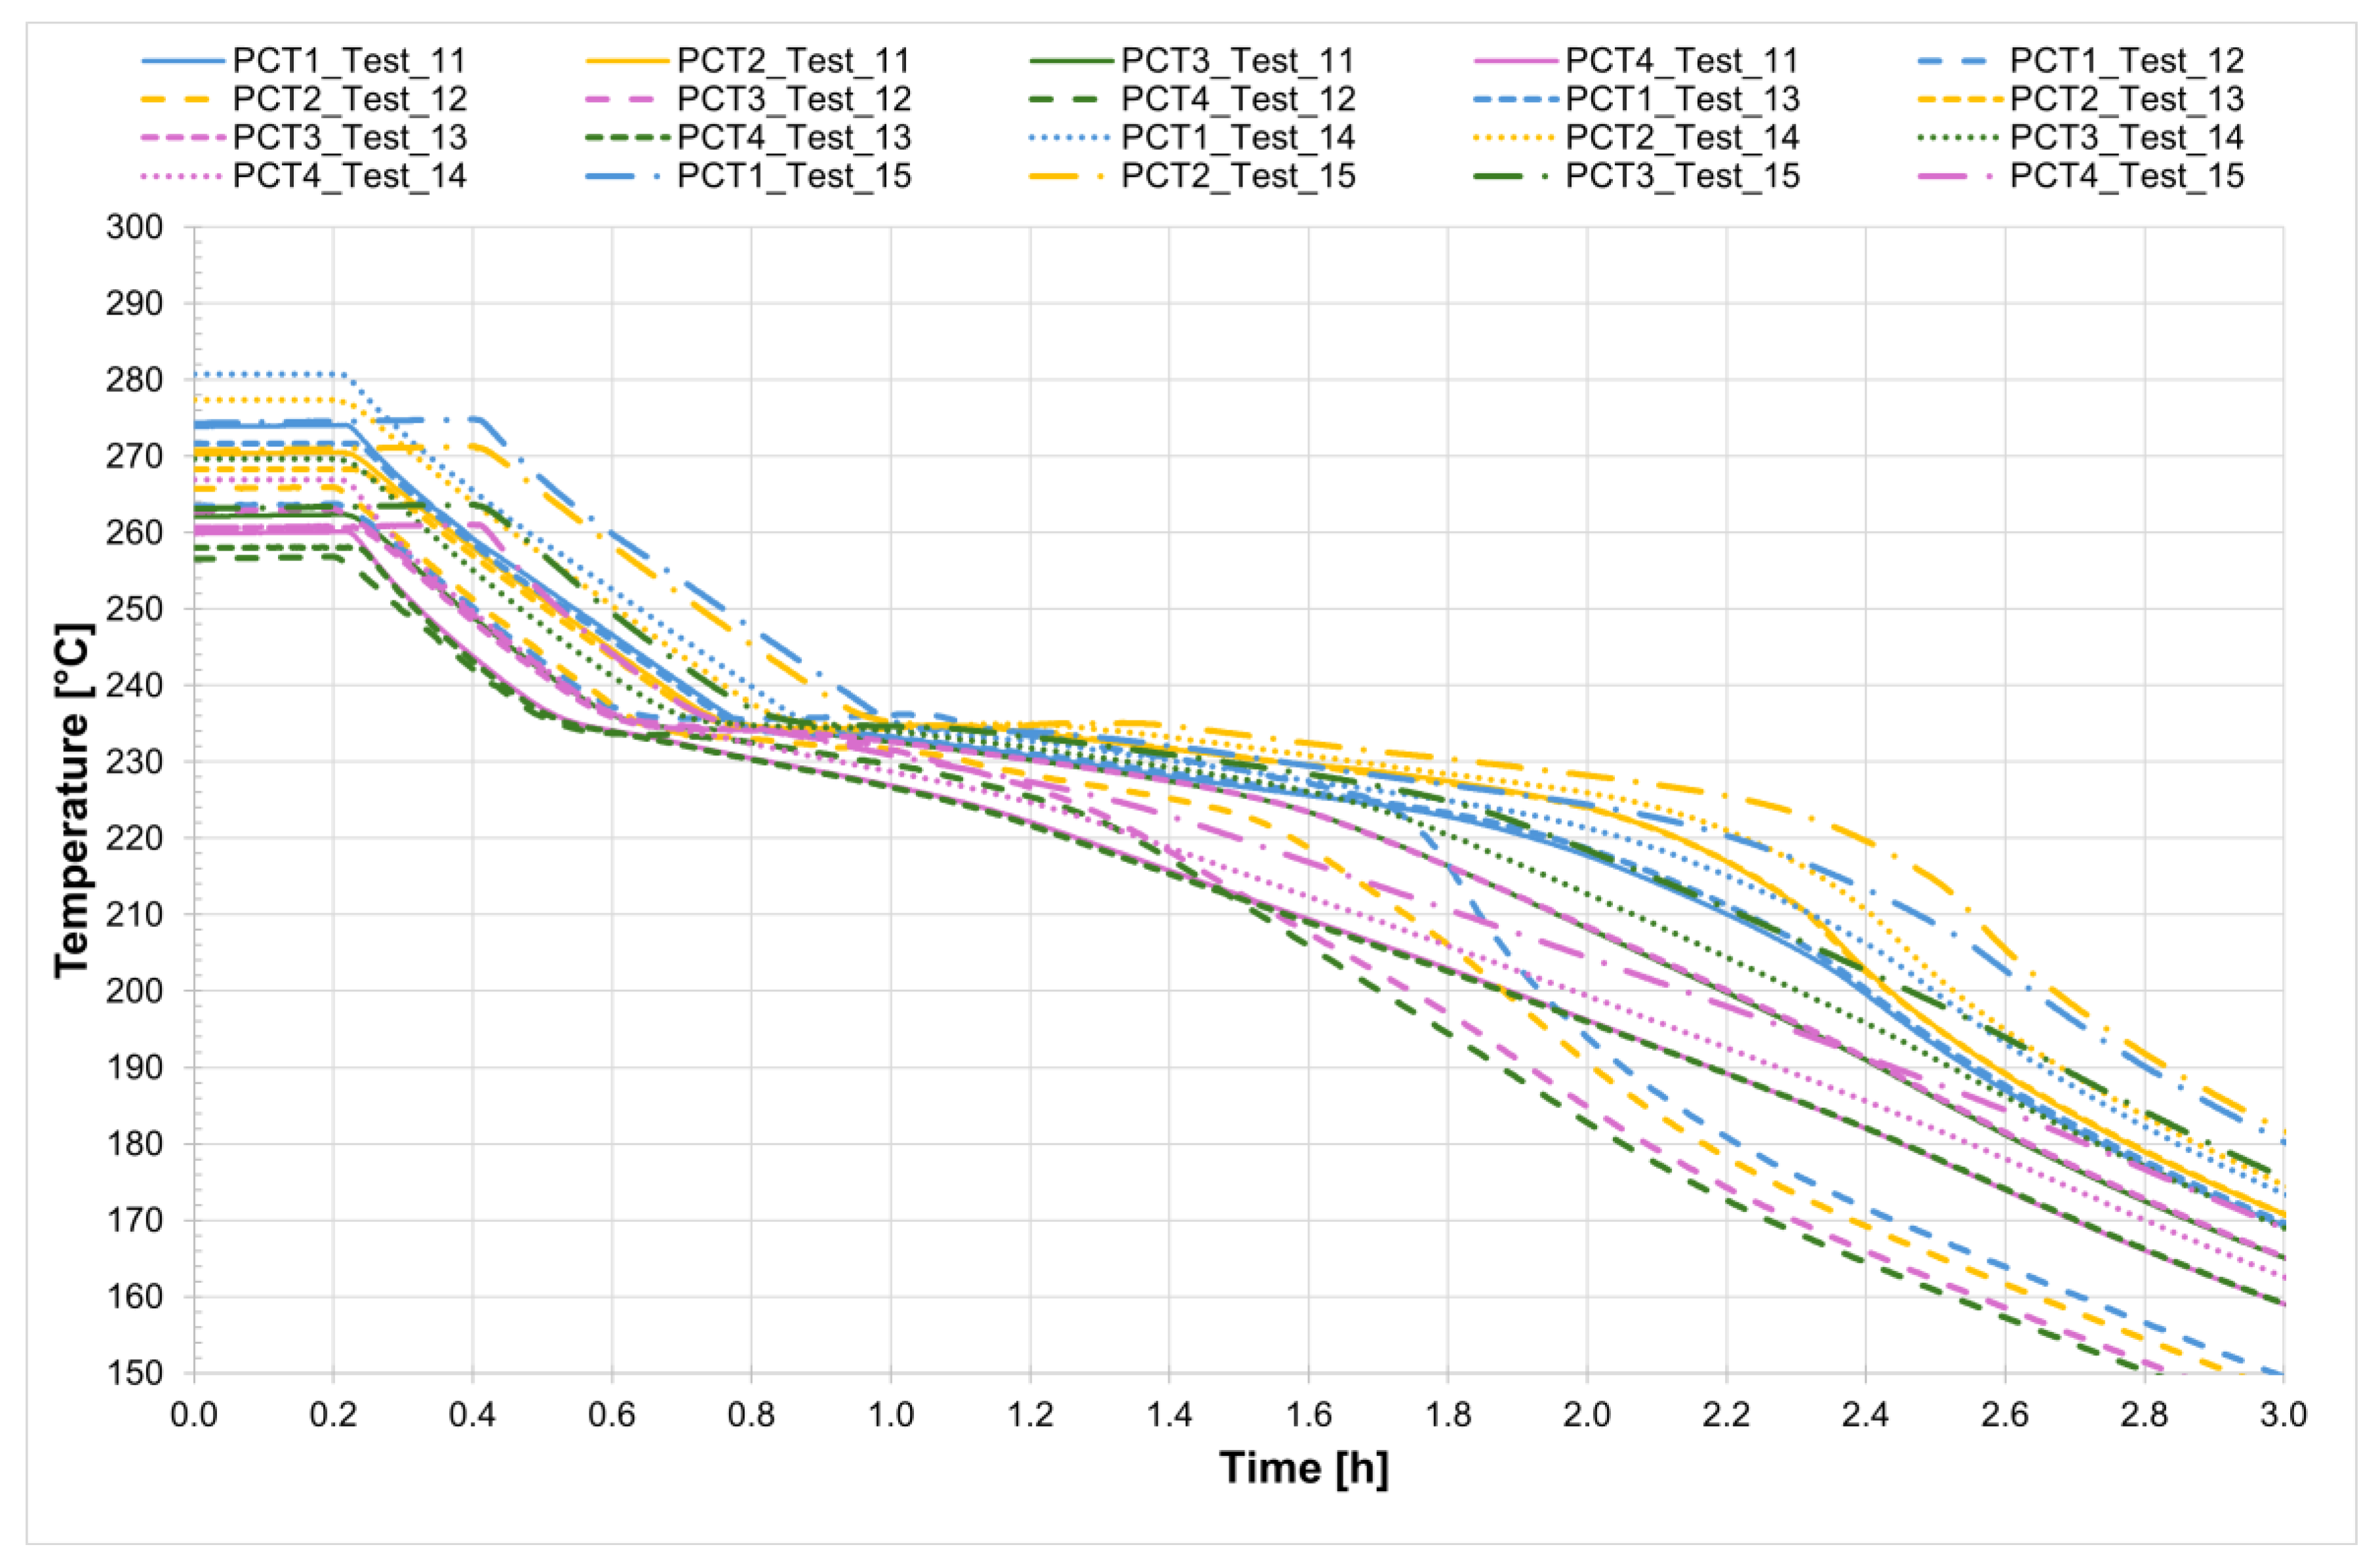
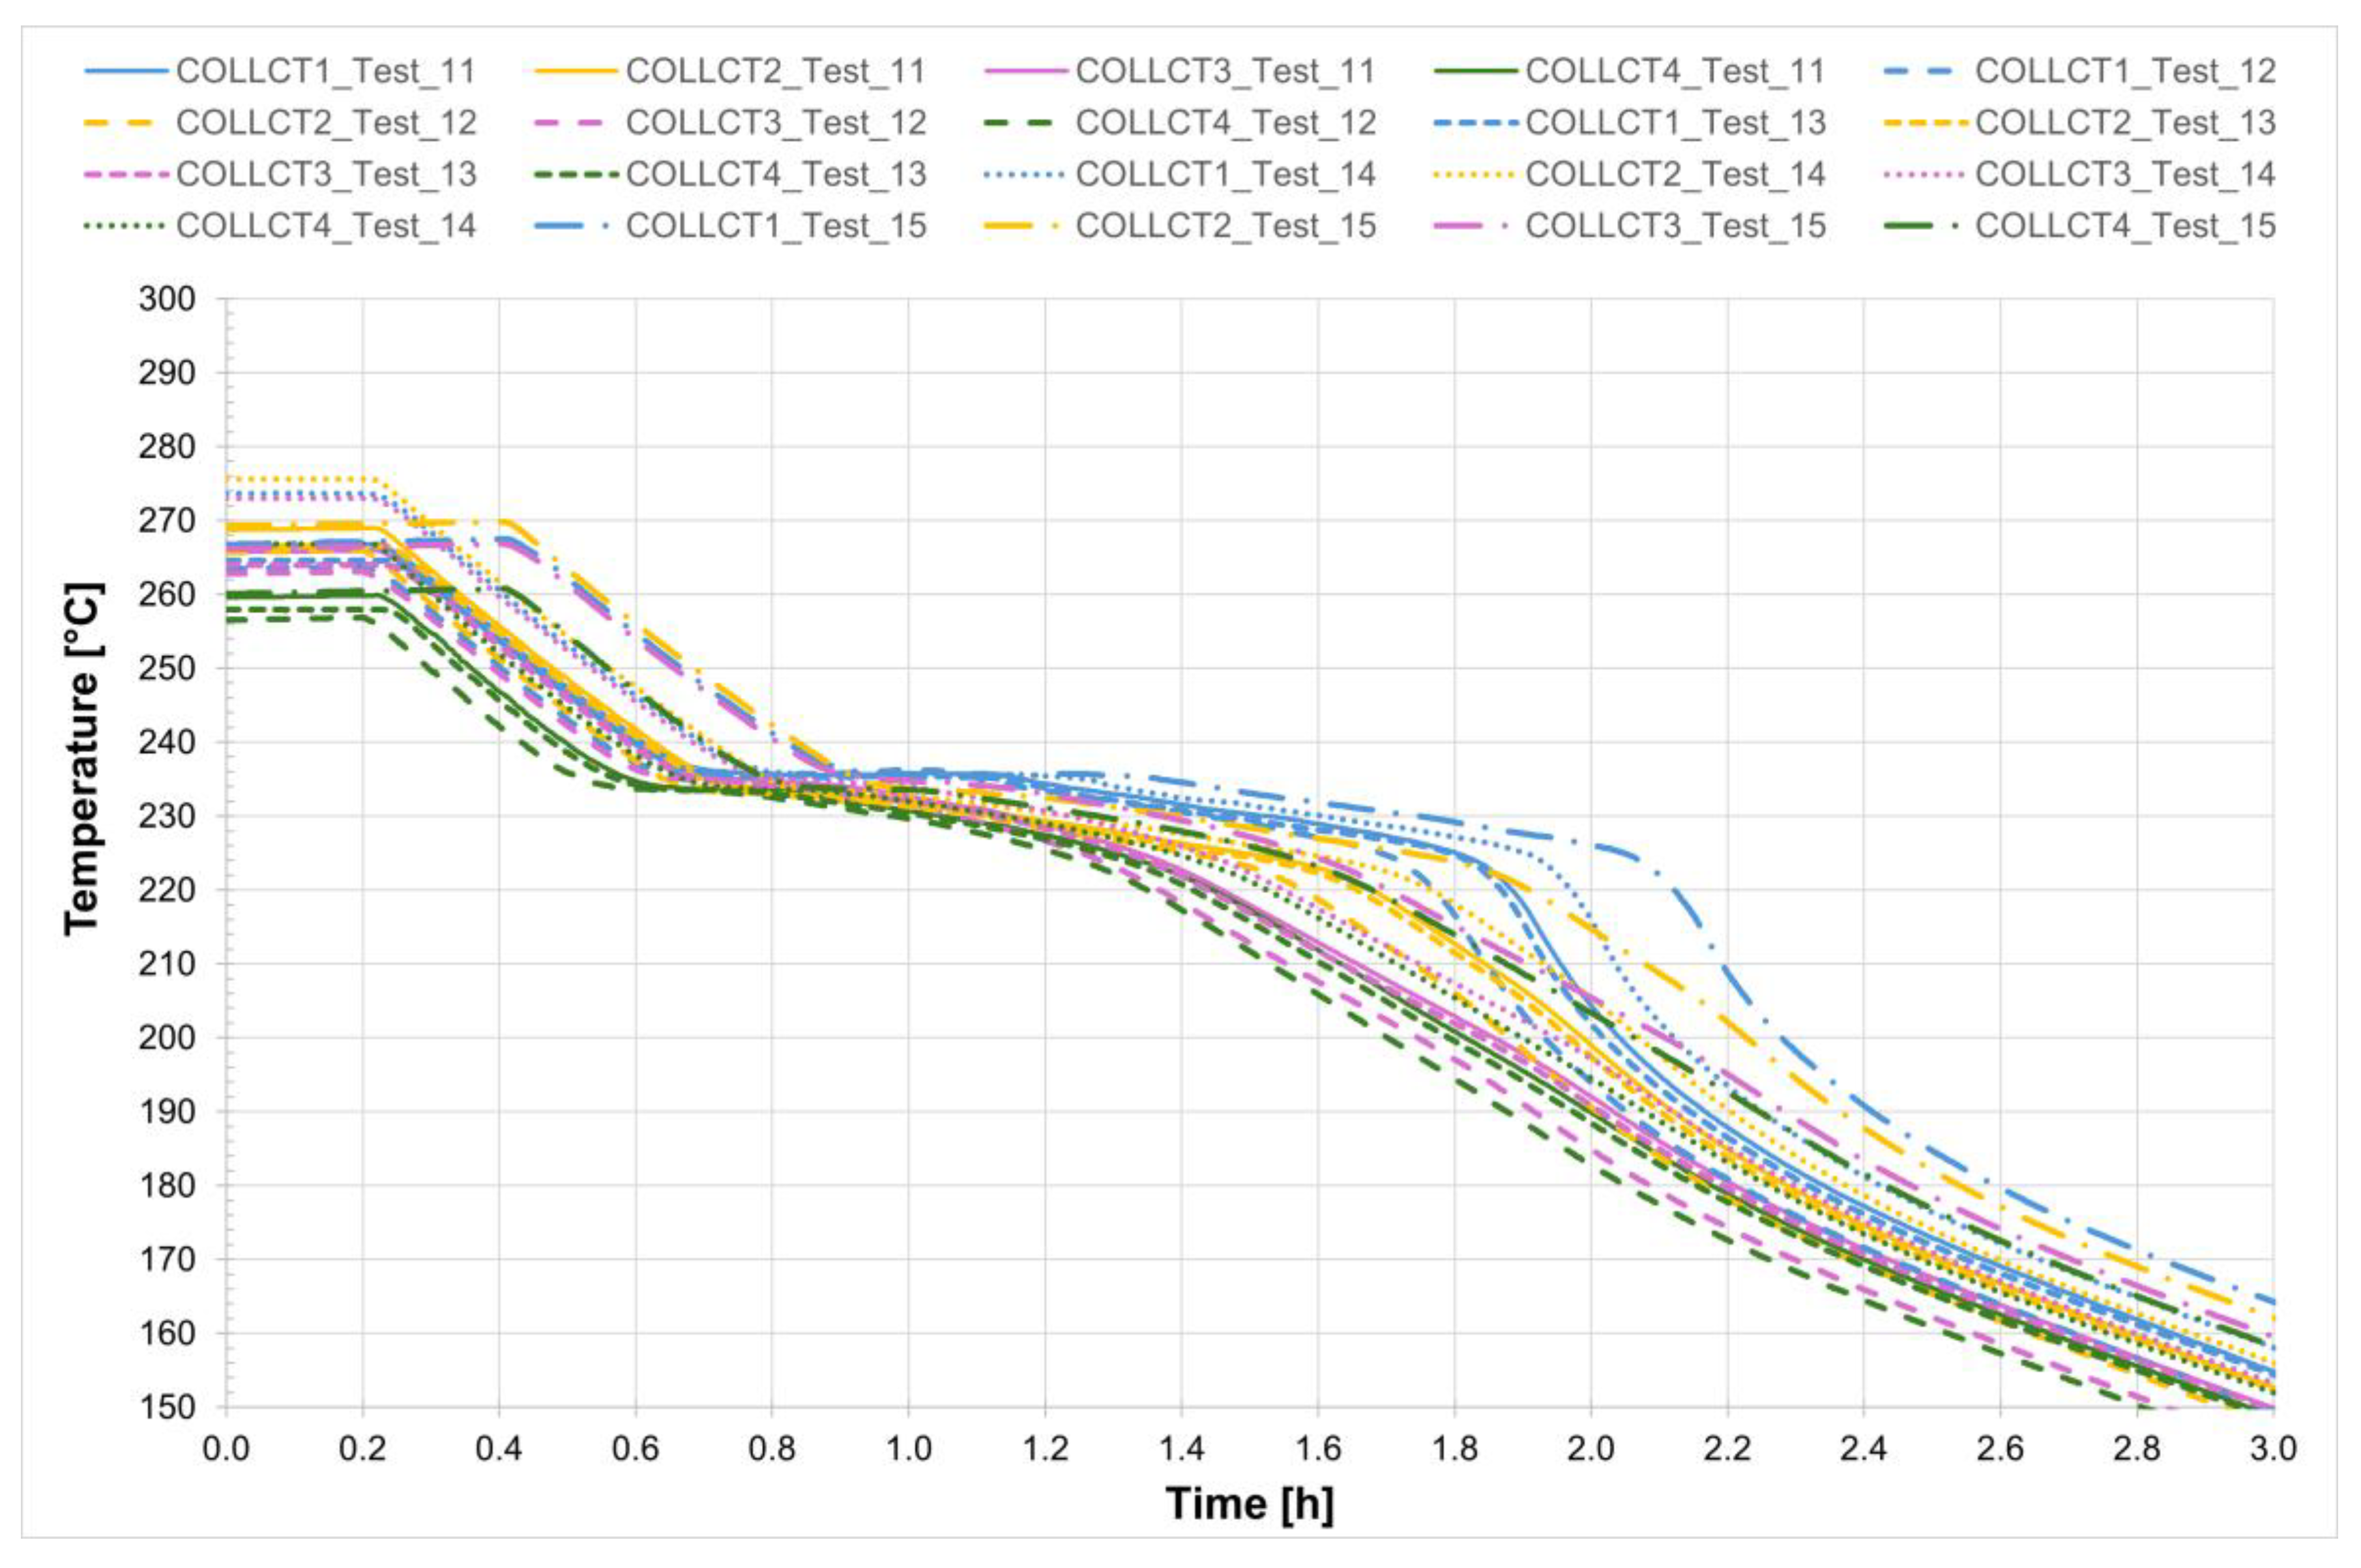
For all five tests conducted, the temperature profiles recorded by the internal comb sensors in both tubes are shown in
Figure 8 and
Figure 9, while
Figure 10 presents the temperature trends at the central collar between the two receivers.
Also in this case, for a more detailed analysis of the salt mixture solidification process, Test_16 was considered. It can be observed that the temperature evolution was tracked from just before the heating system was turned off until the salt was completely solidified, a process that takes just under 4 h. The three figures clearly show that the area which cools first corresponds to the collar welded between the two receiver tubes. As previously noted, this salt portion is characterized by the highest heat dissipation rate and is therefore the last to melt and the first to freeze. A closer examination reveals that the solidification process begins almost simultaneously in both the collar and the central sections of the tubes but progresses much more rapidly in the collar, where it is completed in just over an hour. A detailed analysis of the temperatures measured by the two combs of thermocouples placed at the central section of each tube shows that solidification begins at the tube walls and proceeds toward the center. The thermocouples labeled PCT1 and PCT4, as well as PST1 and PST4—located on the charging side and discharge side, respectively—are positioned near the inner wall of the tube (with 1 at the top and 4 at the bottom, symmetrically, see
Figure 1). These thermocouples record lower temperatures compared to positions 2 and 3, which are located closer to the center of the tube.
The time interval corresponding to the phase change of the salt can be easily identified by the change in the slope of the temperature curve.
Finally, it was observed that the salt contained within the two receiver tubes, under steady-state conditions at approximately 270 °C and without circulation, takes just under 4 h to solidify. As expected, the onset of the phase change occurs at the coldest points with the greatest heat loss—and then progresses radially from the tube surface toward the interior.
3.3. Receiver Test Without Vacuum—Salt Melting Process
The same types of tests, using the same experimental methodology, were conducted on the same two receivers but in the absence of a vacuum between the steel tube and the glass envelope. Small holes were made at the glass-to-metal joint—without damaging the receiver itself—solely to allow air to enter.
Starting from the melting test, as in the previous case, the binary salt mixture inside the receivers was heated using the power supply unit. The maximum temperature reached was approximately 290 °C, with the power supply output voltage set between 4.5 and 7.4 V.
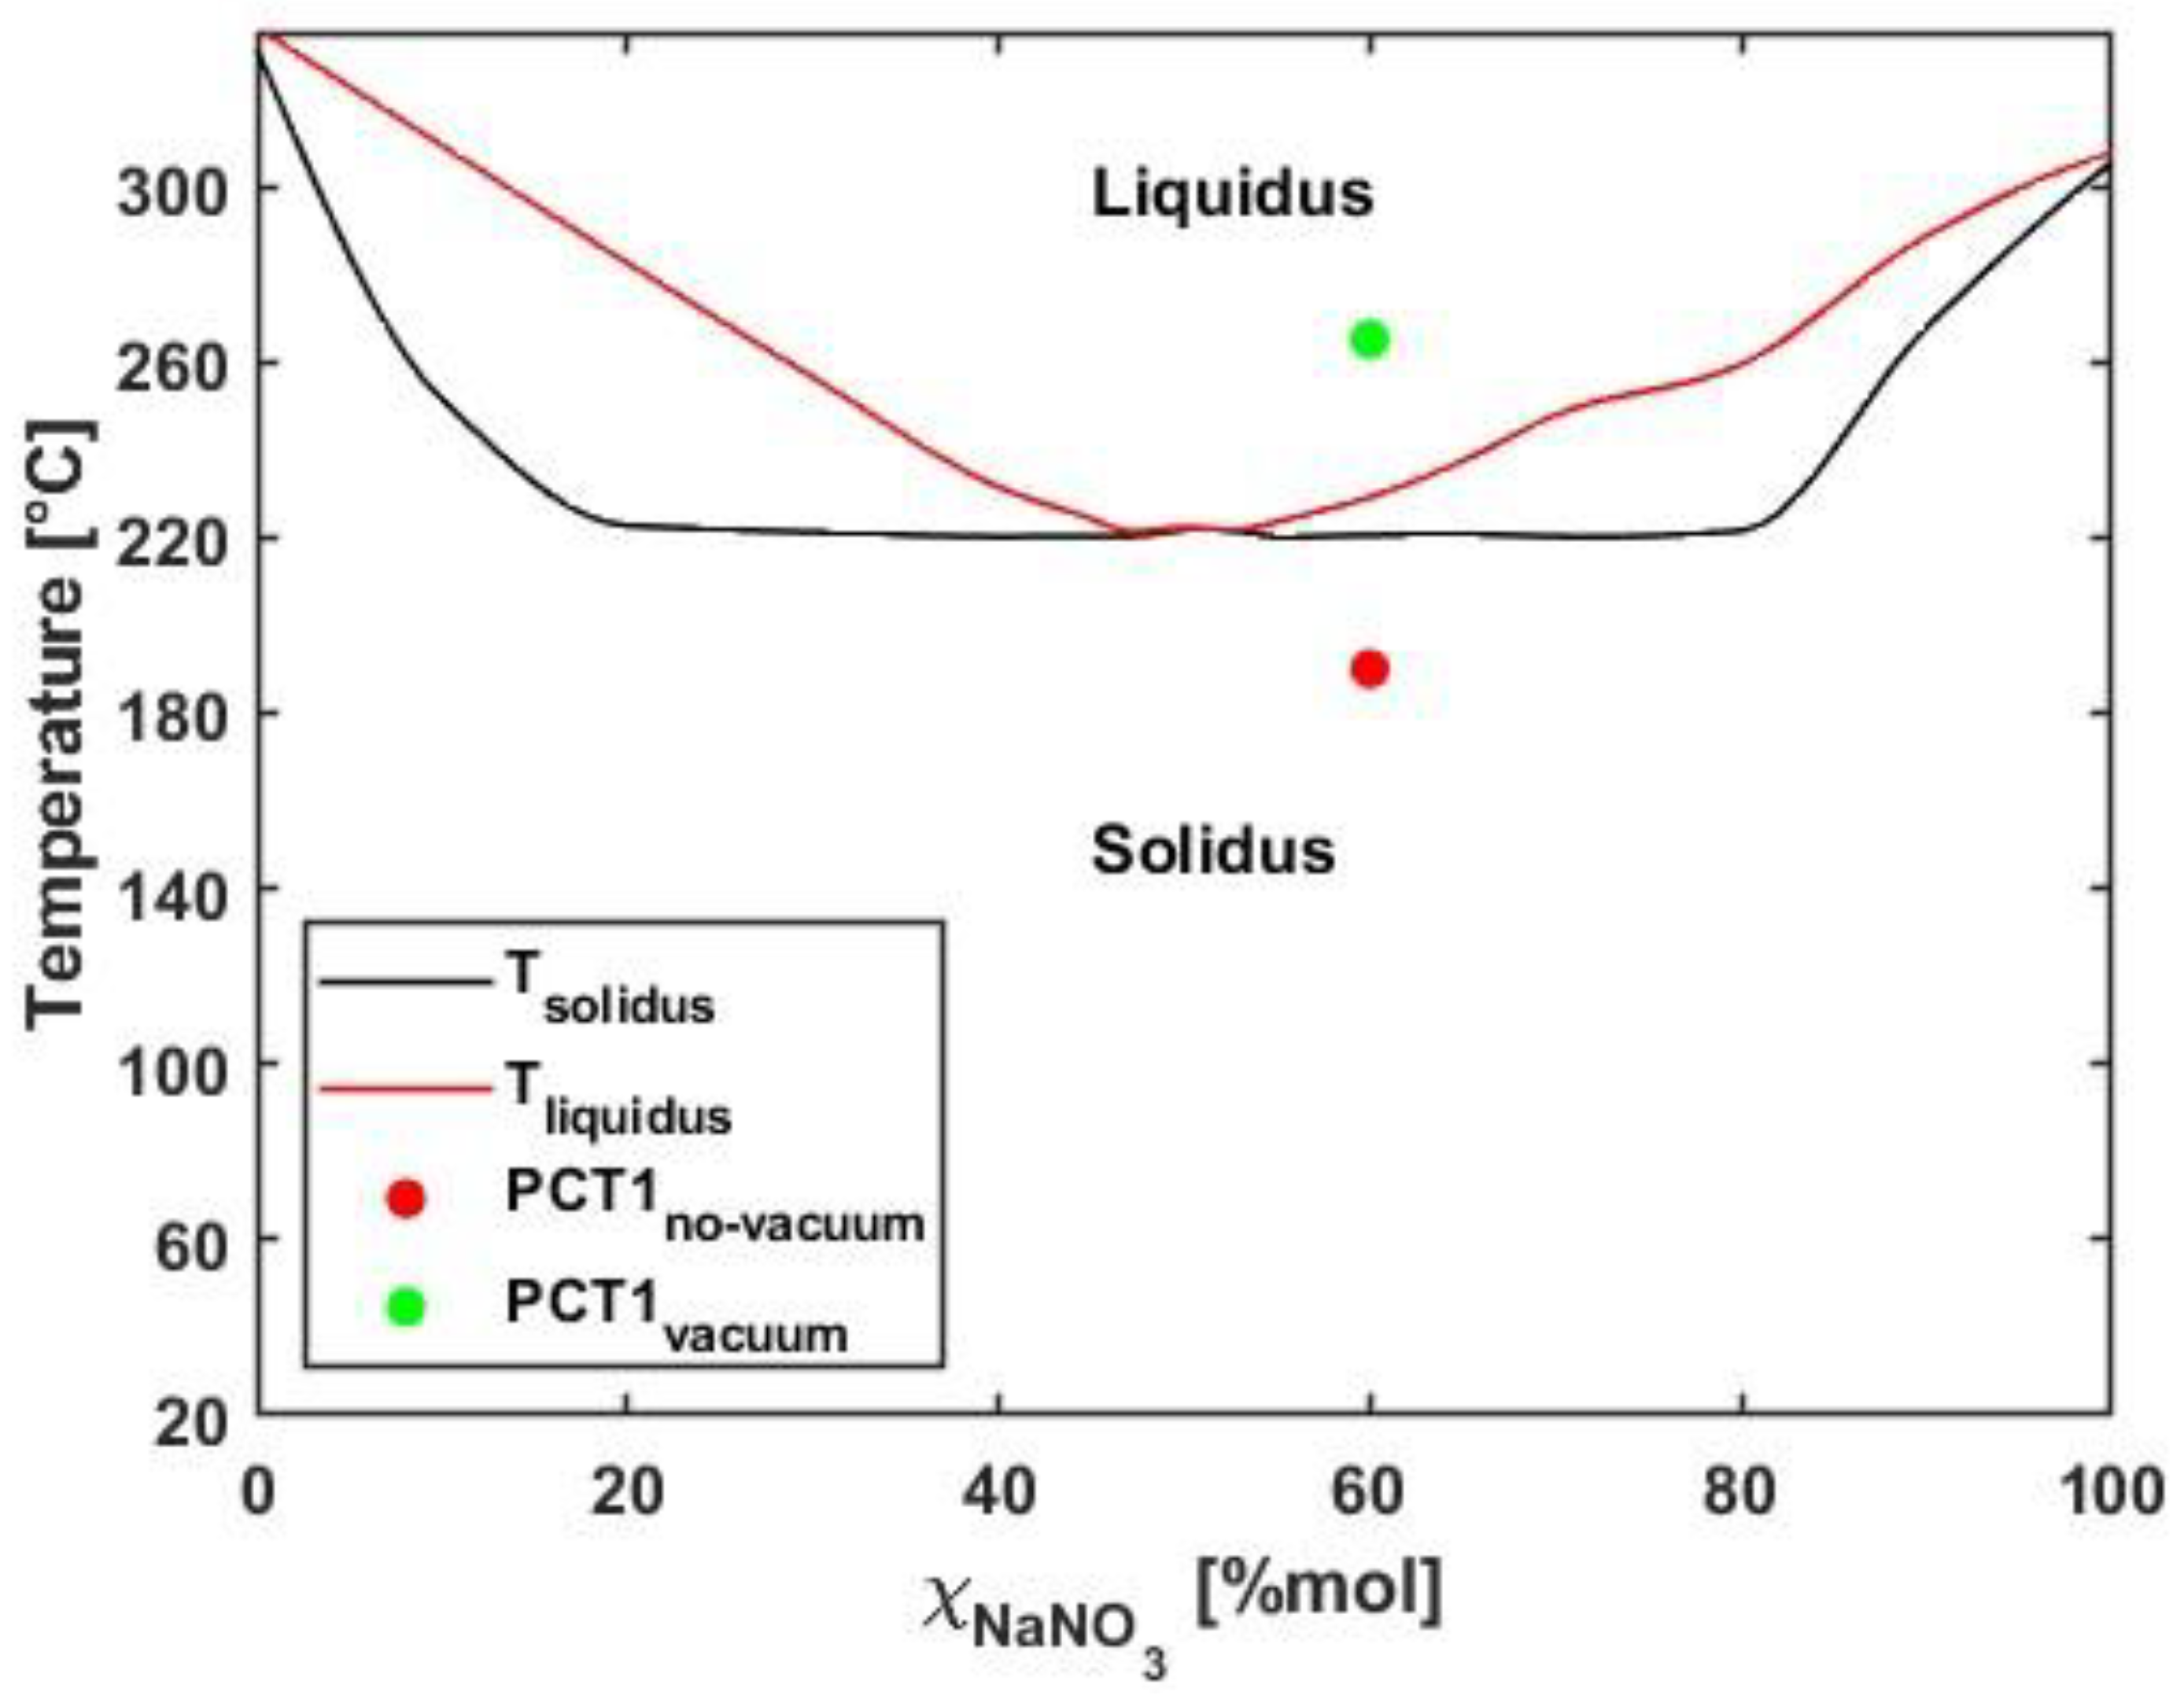
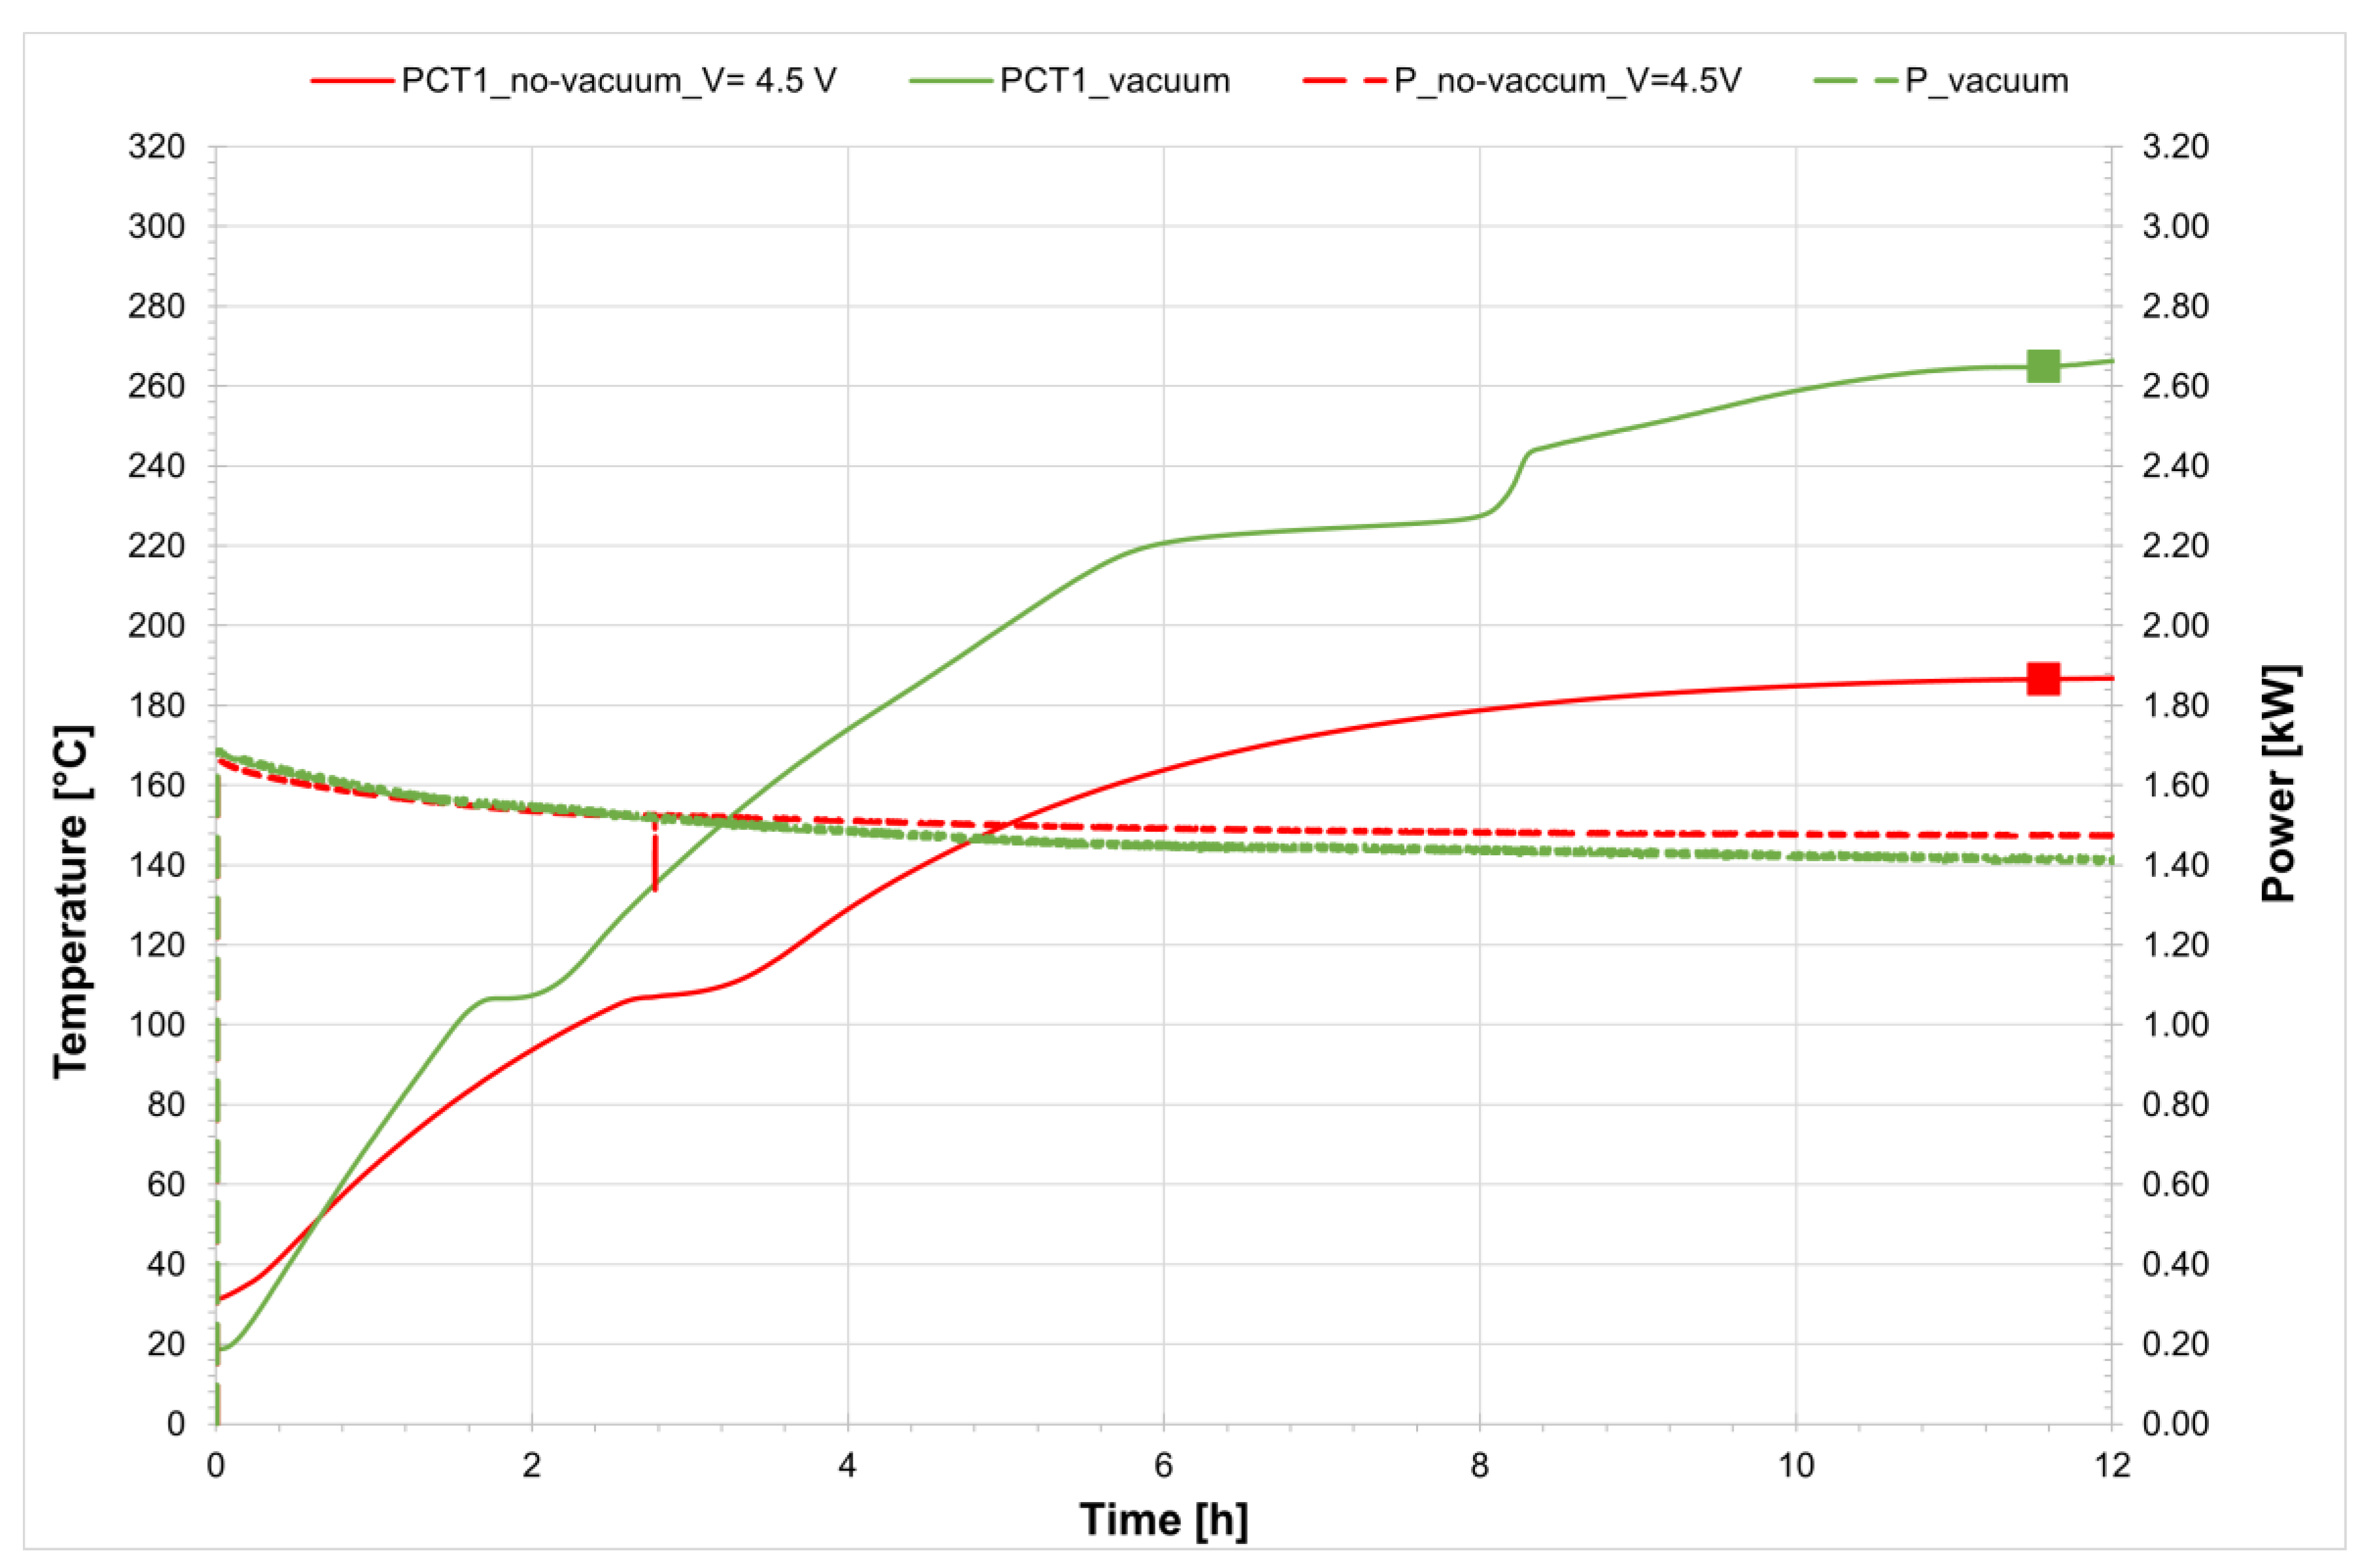
As in the previous case, the melting tests for the salt mixture were initiated by applying a voltage of 4.5 V to the receiver system, identical to the setup with vacuum insulation. After a certain period, the temperature reached a steady-state value and did not increase further. However, comparison with the phase diagram of the salt mixture shows that this equilibrium temperature still lies within the solid region (
Figure 12).
Figure 11 presents a comparison of the temperature profiles inside the receiver on the filling side for both configurations, with and without a vacuum. The figure highlights the two points where the temperature can be considered constant, which are used to verify the phase state of the mixture. These same points are plotted on the solidus/liquidus diagram (
Figure 12), clearly showing that in the absence of a vacuum the mixture remains in the solid phase; thus, the applied voltage is insufficient for melting. In summary, when operating with a non-evacuated receiver a higher voltage must be applied, as thermal losses between the steel tube and the glass envelope are significantly higher due to the presence of air.
Figure 12.
Solidus/liquidus diagram of the salt mixture.
Figure 12.
Solidus/liquidus diagram of the salt mixture.
Four tests were carried out by increasing the voltage applied across the receivers until complete melting of the mixture was achieved.
Table 3 below summarizes the main conditions and results of the tests performed.
Table 3.
Main results of non-evacuated tube melting tests.
Table 3.
Main results of non-evacuated tube melting tests.
| Test | Voltage
[V] | Dtmelting
[hh:mm:ss] | Pmelting
[kW] | Emelting
[kWh] | Dtpreheating
[hh:mm:ss] | Ppreheating
[kW] | Epreheating
[kWh] |
|---|
| Test_13 | 6.9 | 06:23:04 | 3.092 | 19.745 | 04:05:16 | 3.269 | 13.348 |
| Test_11 | 7 | 05:52:15 | 3.195 | 18.765 | 03:37:22 | 3.391 | 12.264 |
| Test_12 | 7 | 06:23:43 | 3.195 | 20.437 | 03:53:04 | 3.396 | 13.157 |
| Test_15 | 7 | 05:36:55 | 3.169 | 17.798 | 03:51:26 | 3.348 | 12.885 |
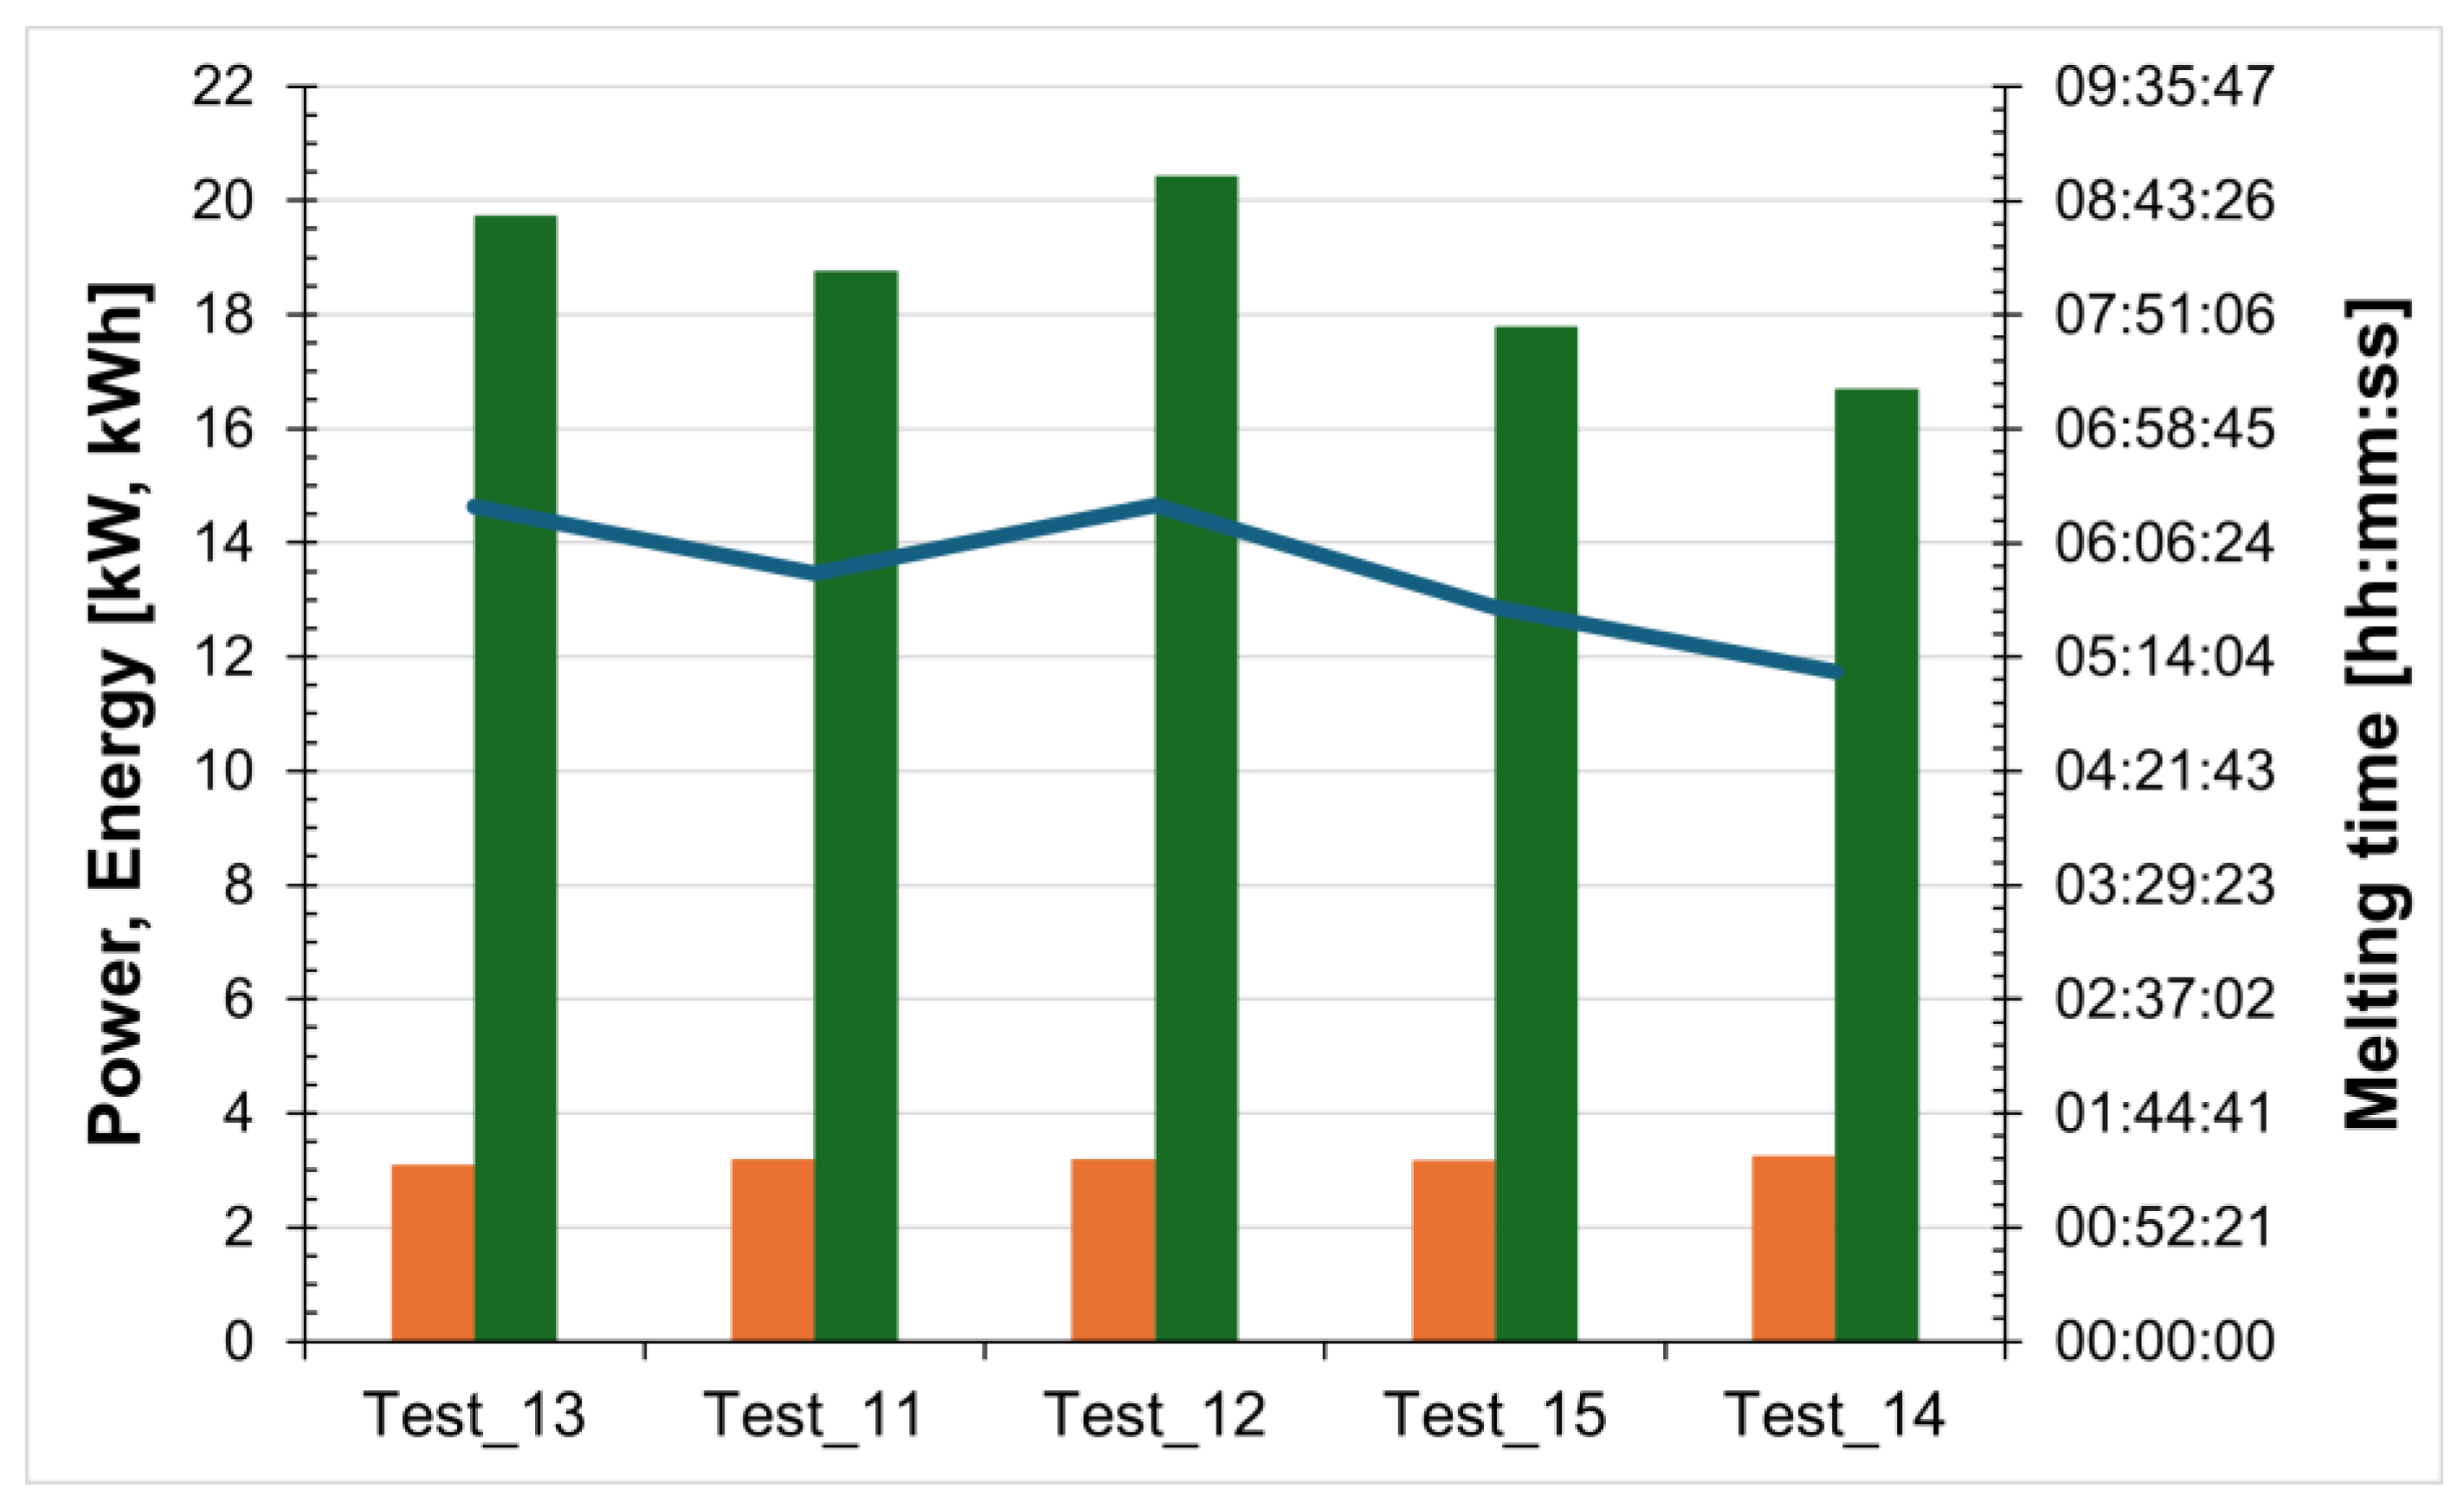
Figure 13 summarizes for the tests conducted the power and energy required for salt melting, as well as the time needed to complete the phase-change process.
Figure 13.
Power (orange bars) and energy (green bars) required for salt melting, and the time taken (blue line) for the non-evacuated receiver.
Figure 13.
Power (orange bars) and energy (green bars) required for salt melting, and the time taken (blue line) for the non-evacuated receiver.
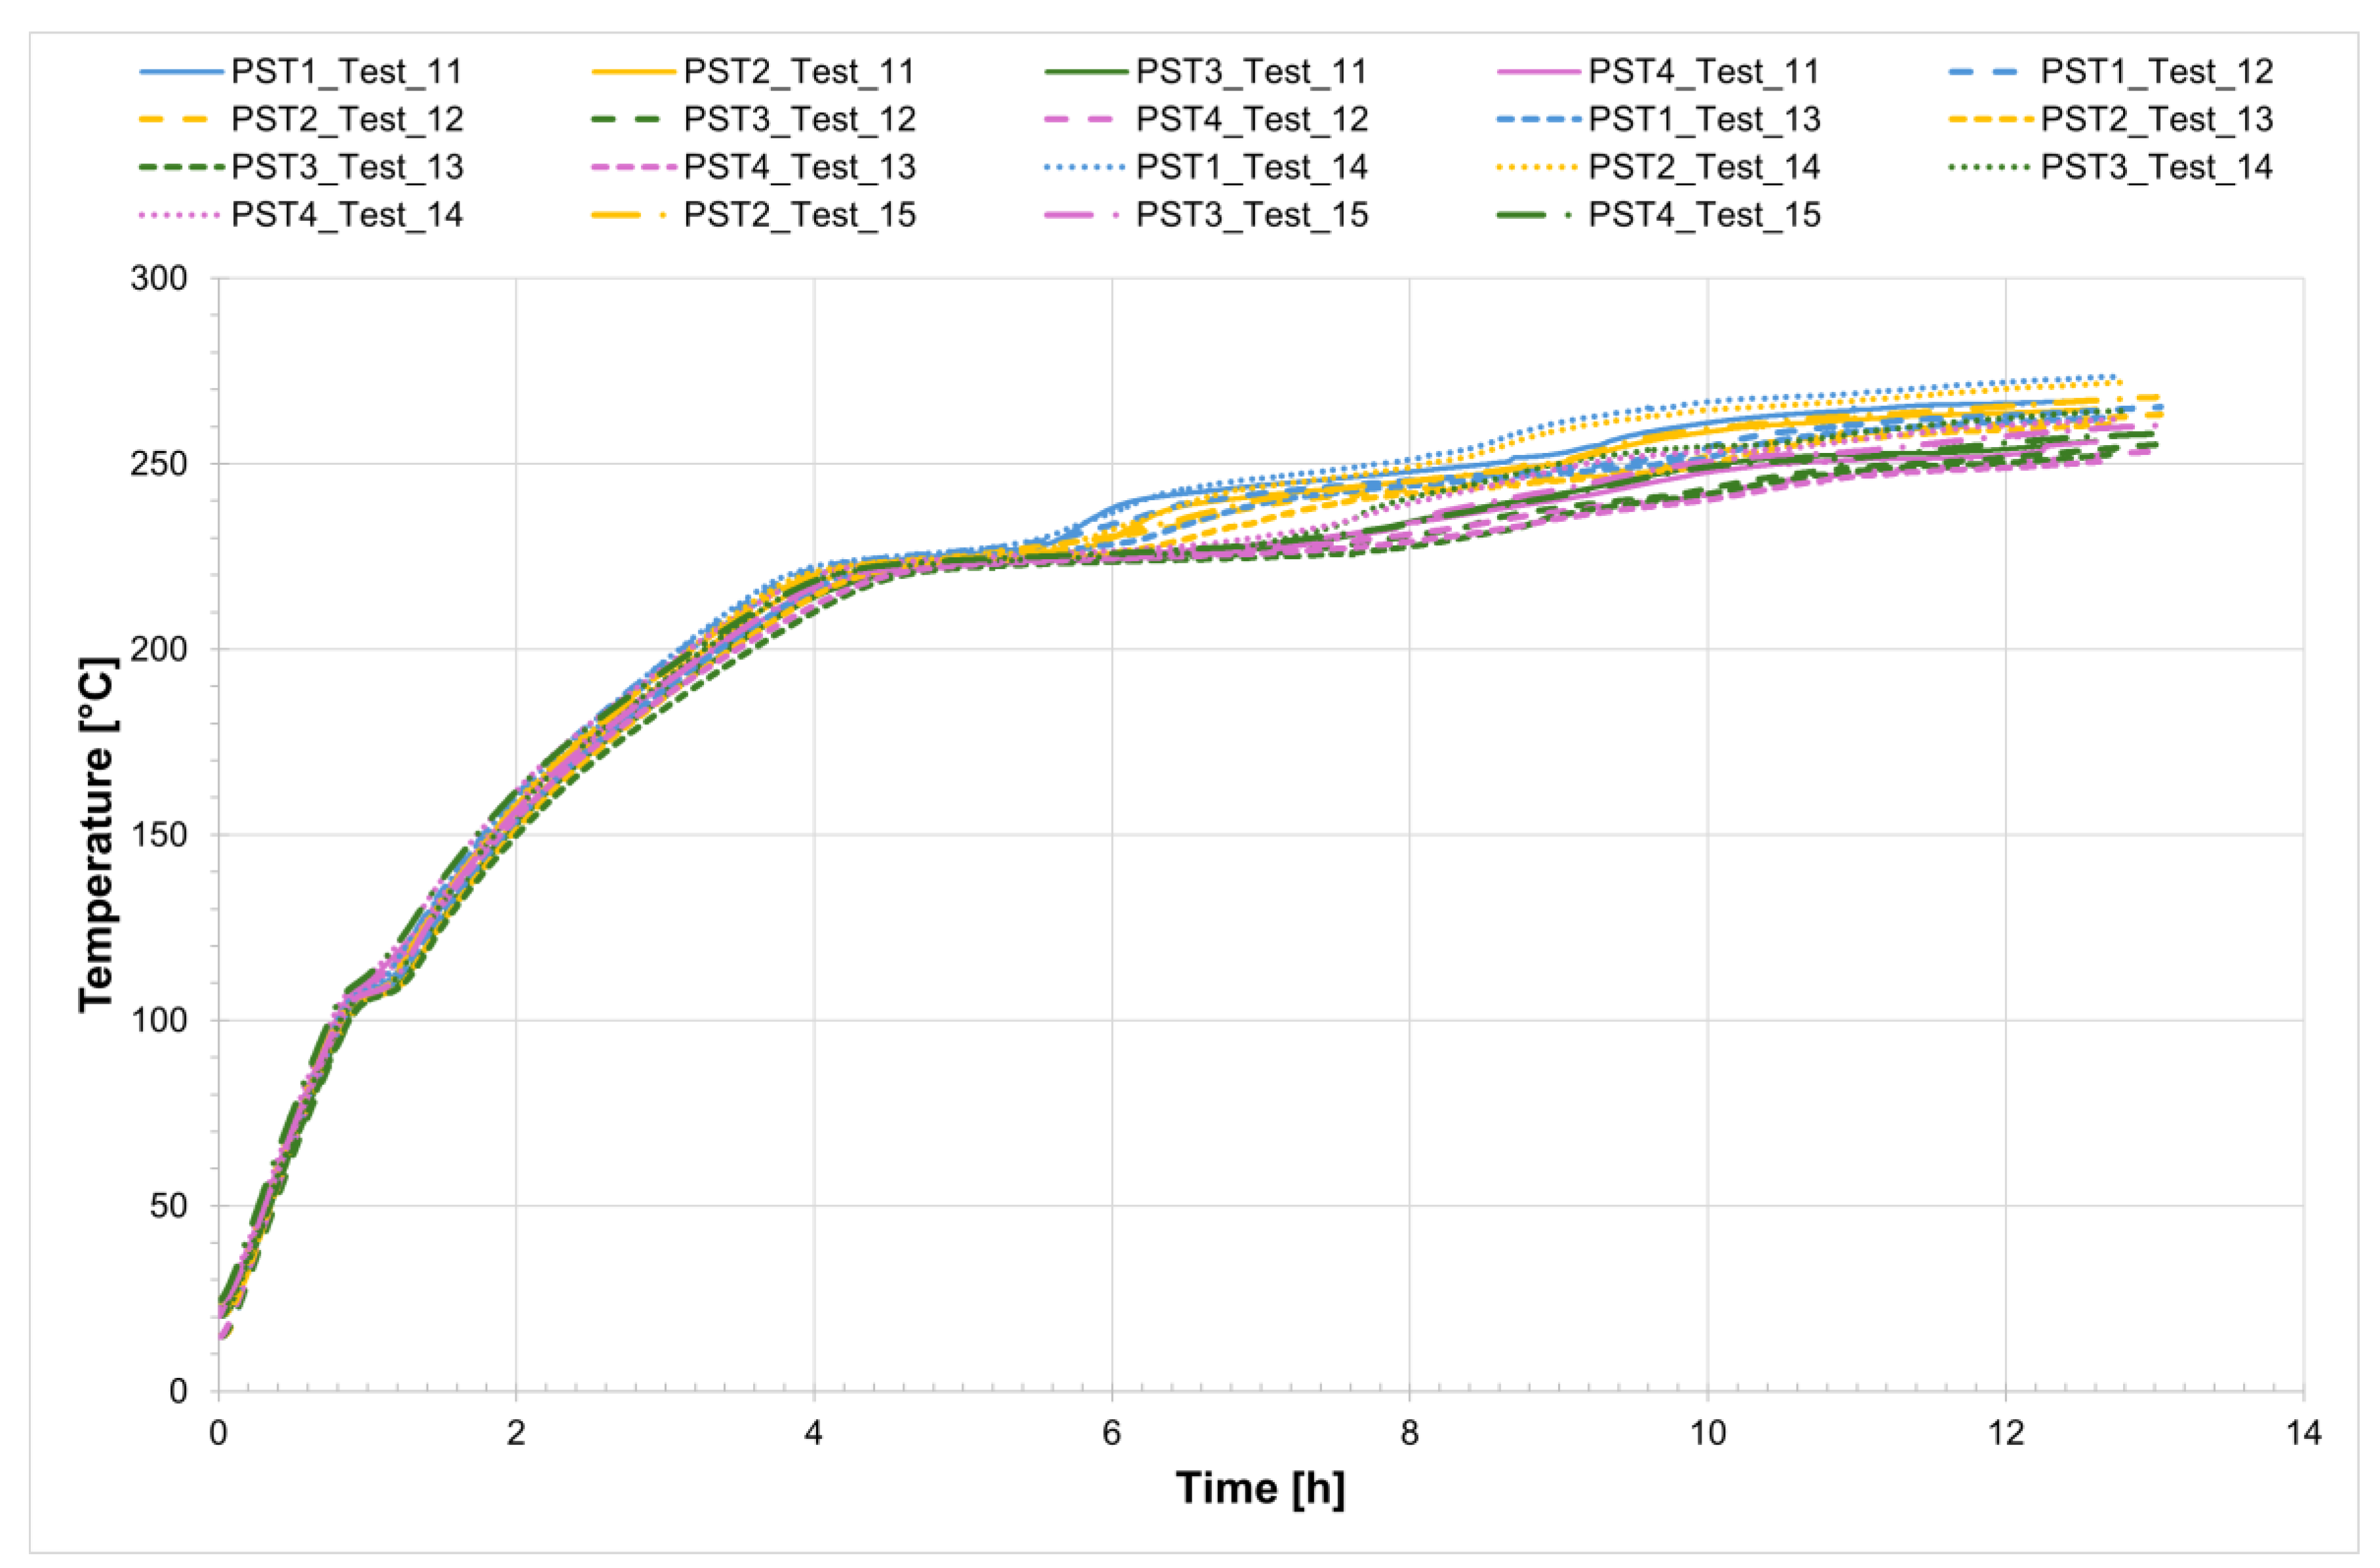
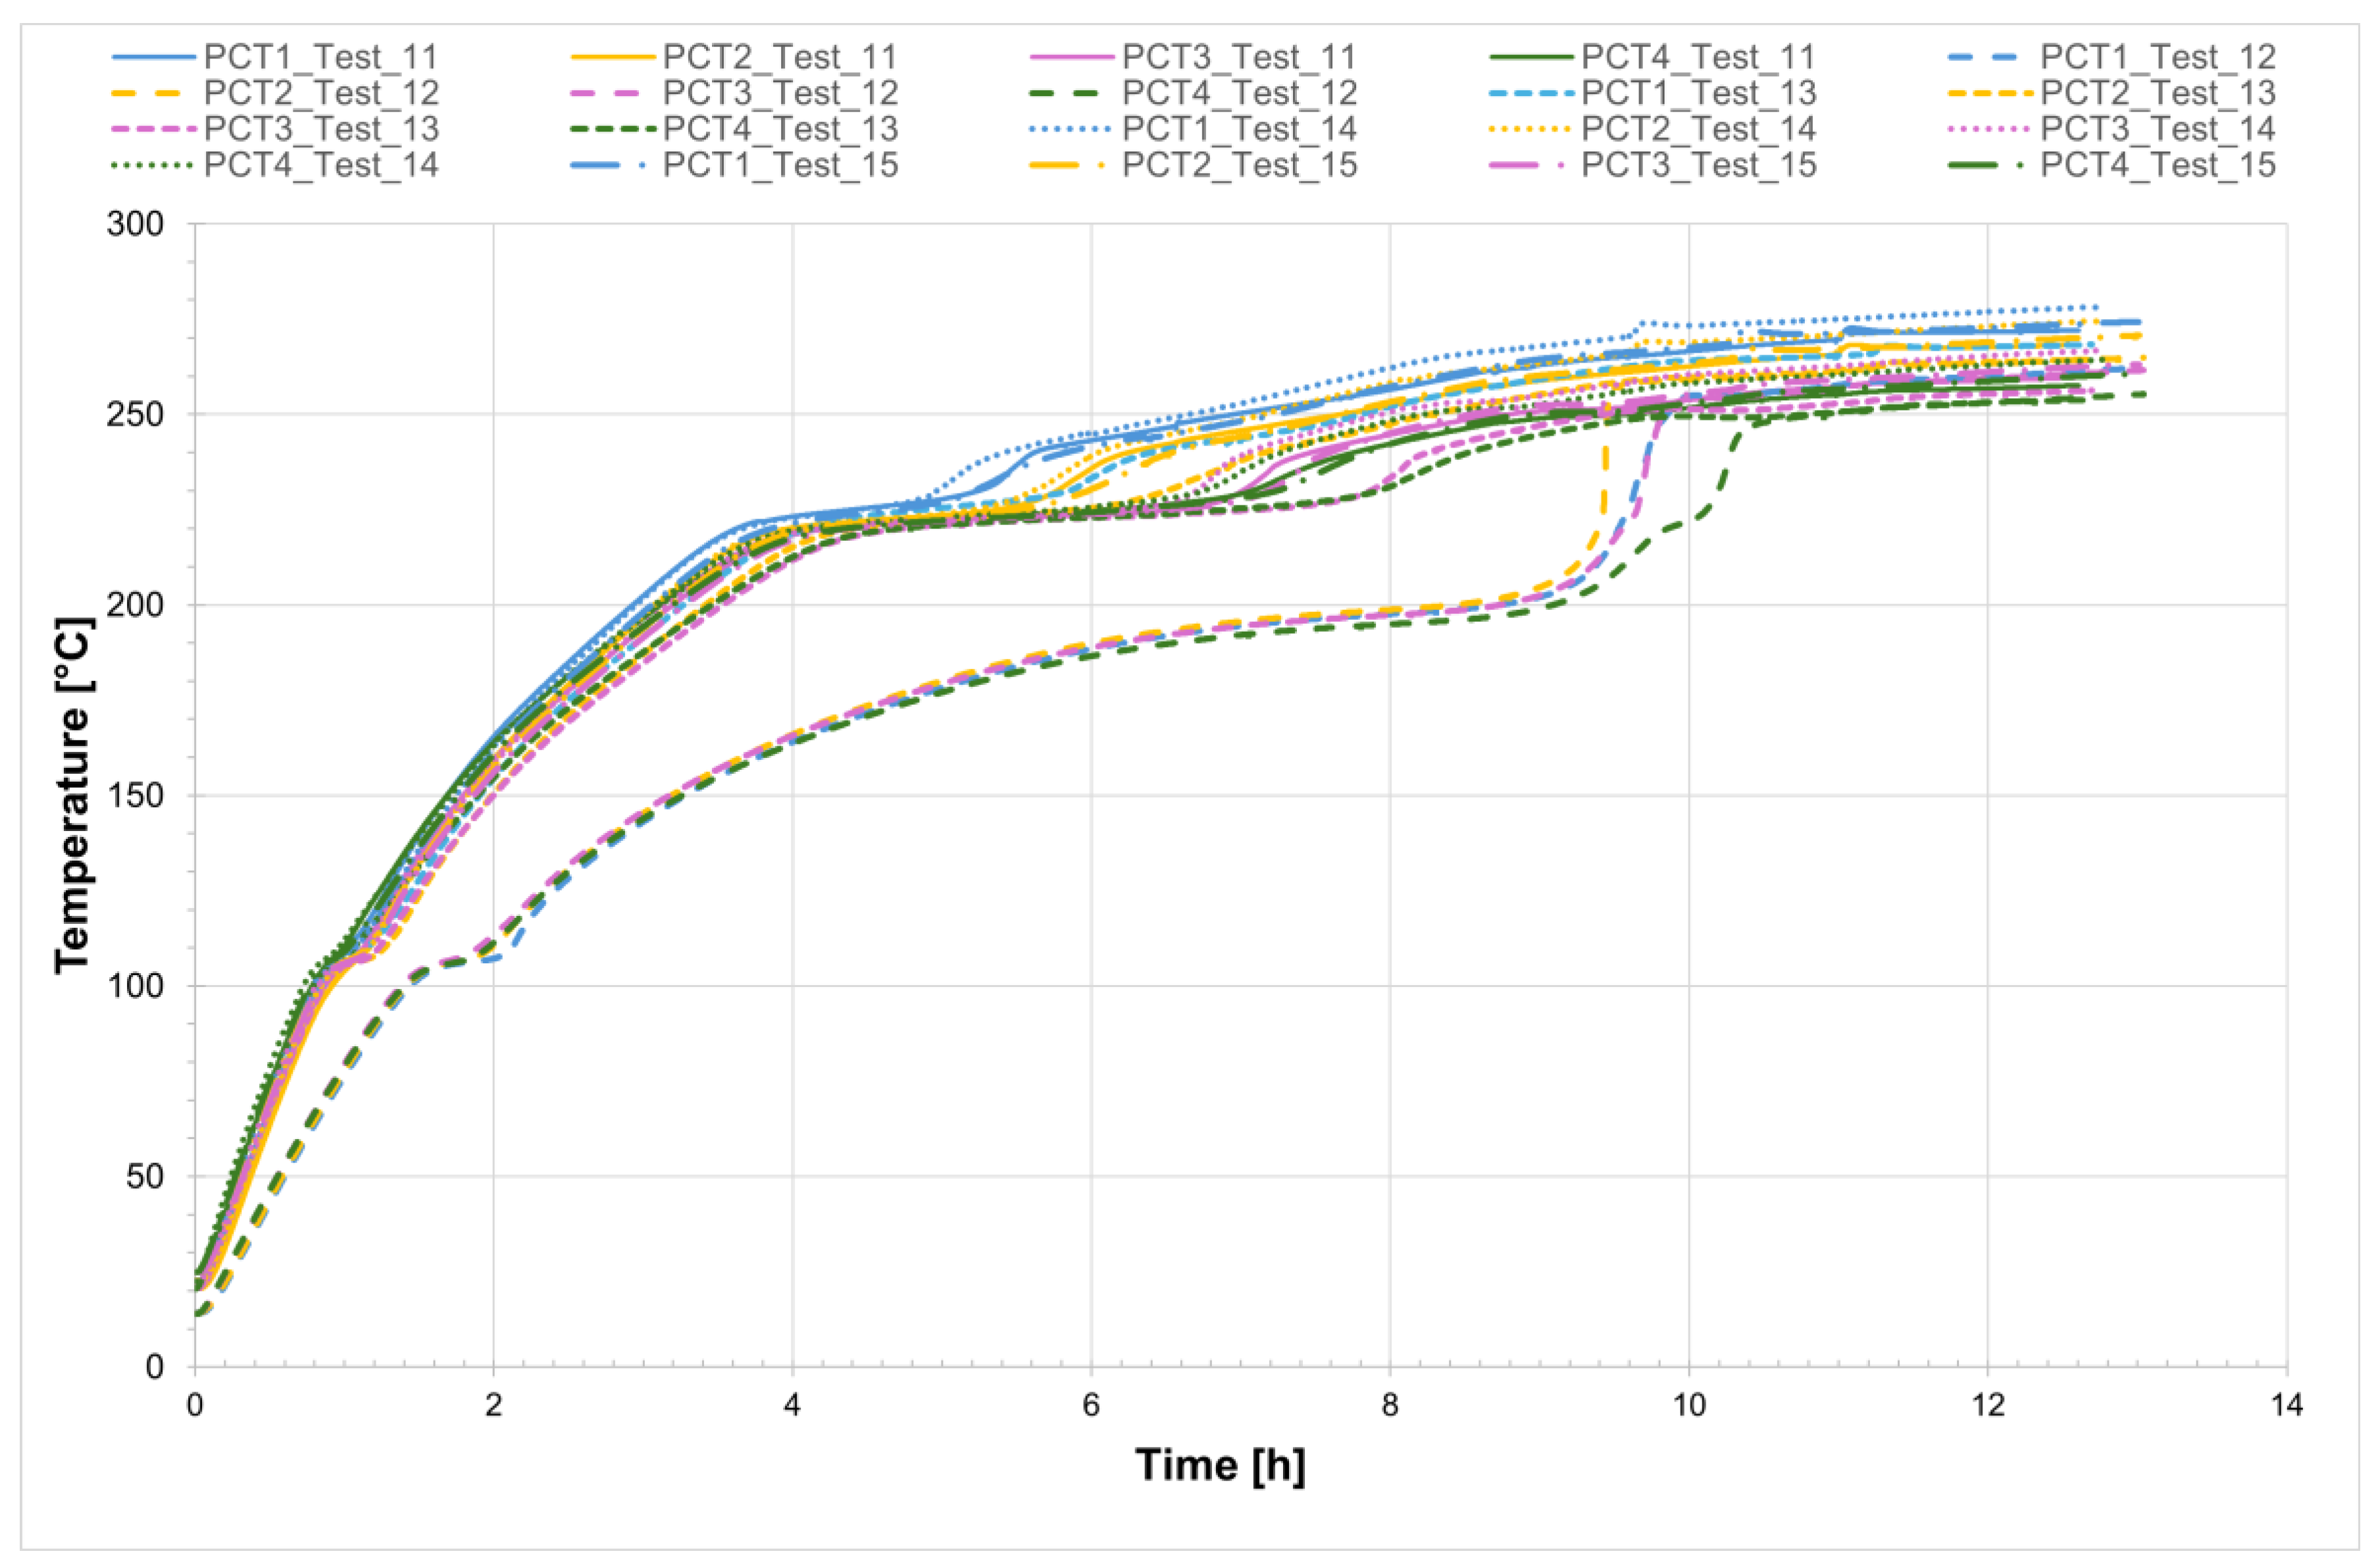
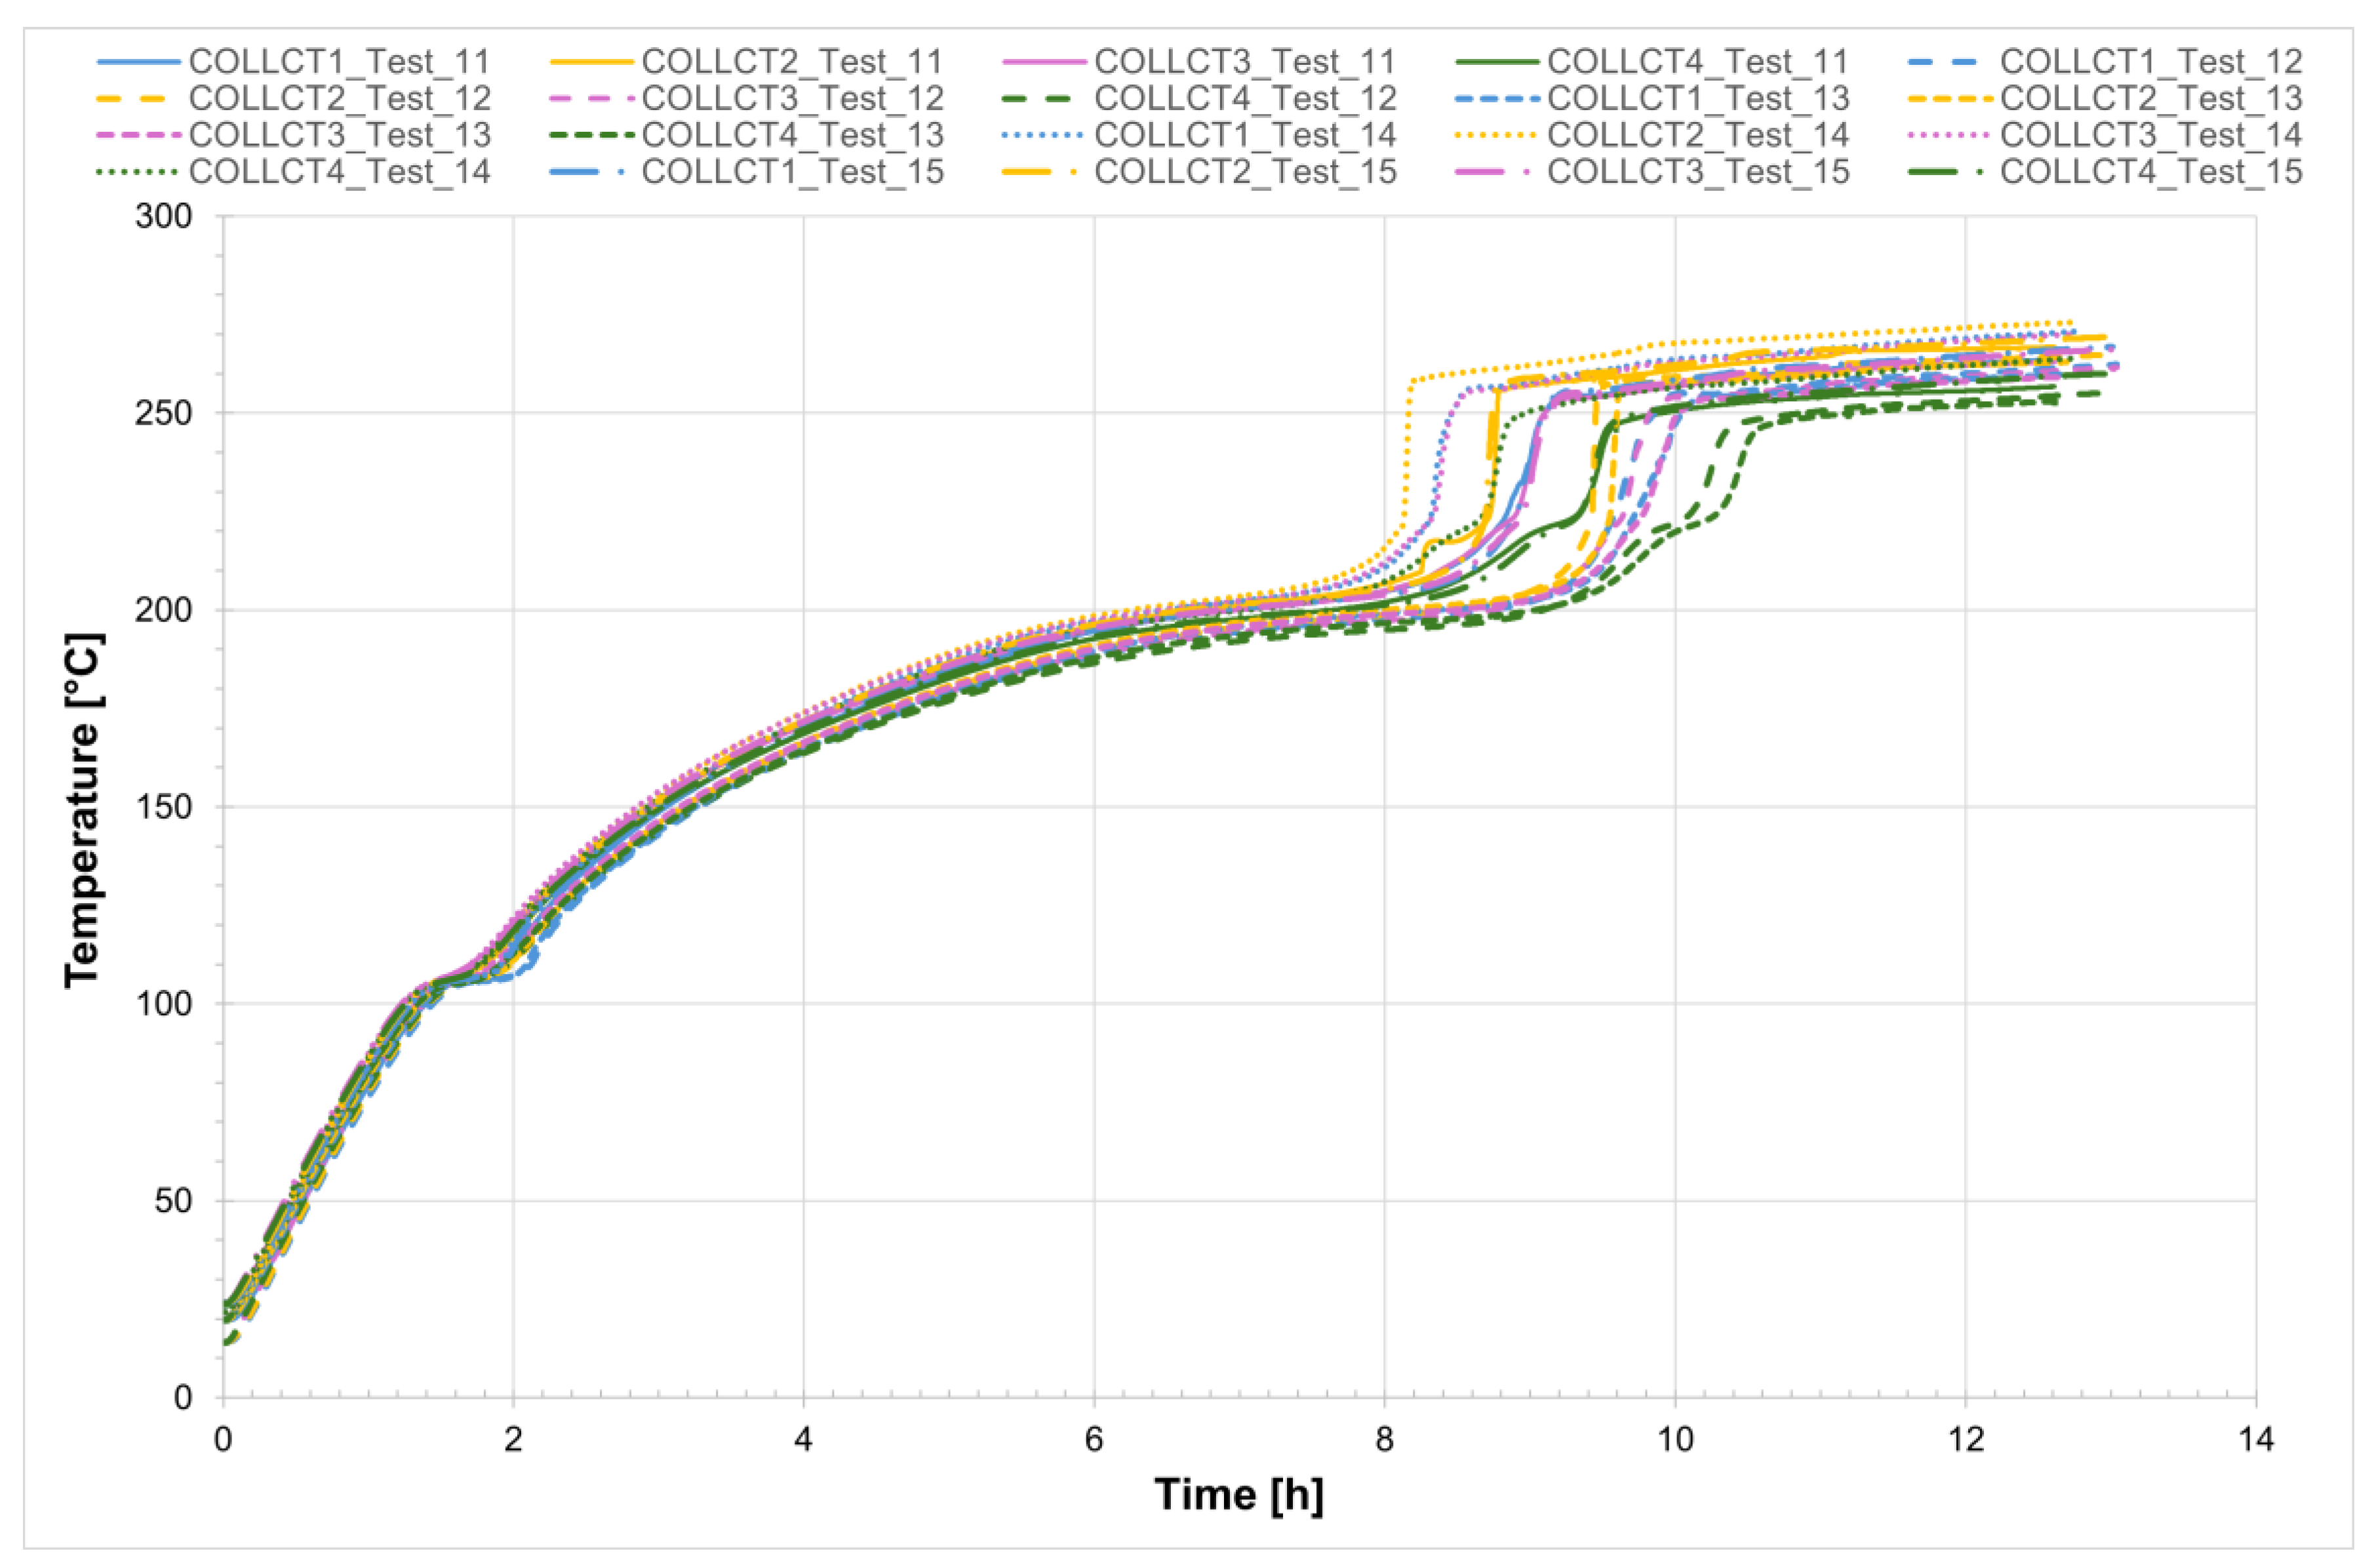
For all five tests conducted, the temperature profiles recorded by the internal comb sensors in both tubes are shown in
Figure 14 and
Figure 15, while
Figure 16 presents the temperature trends at the central collar between the two receivers.
Furthermore,
Figure 17 shows the start and end points of the melting process for all five tests. The solid line indicates the first thermocouple to reach the onset melting temperature (T = 220 °C), while the dashed line represents the last thermocouple to reach the completion temperature of the phase change (T = 240 °C). In this way, the timing of the process can be compared across the different tests.
To provide a detailed analysis of the phenomenon for non-evacuated receivers, Test_11 was selected.
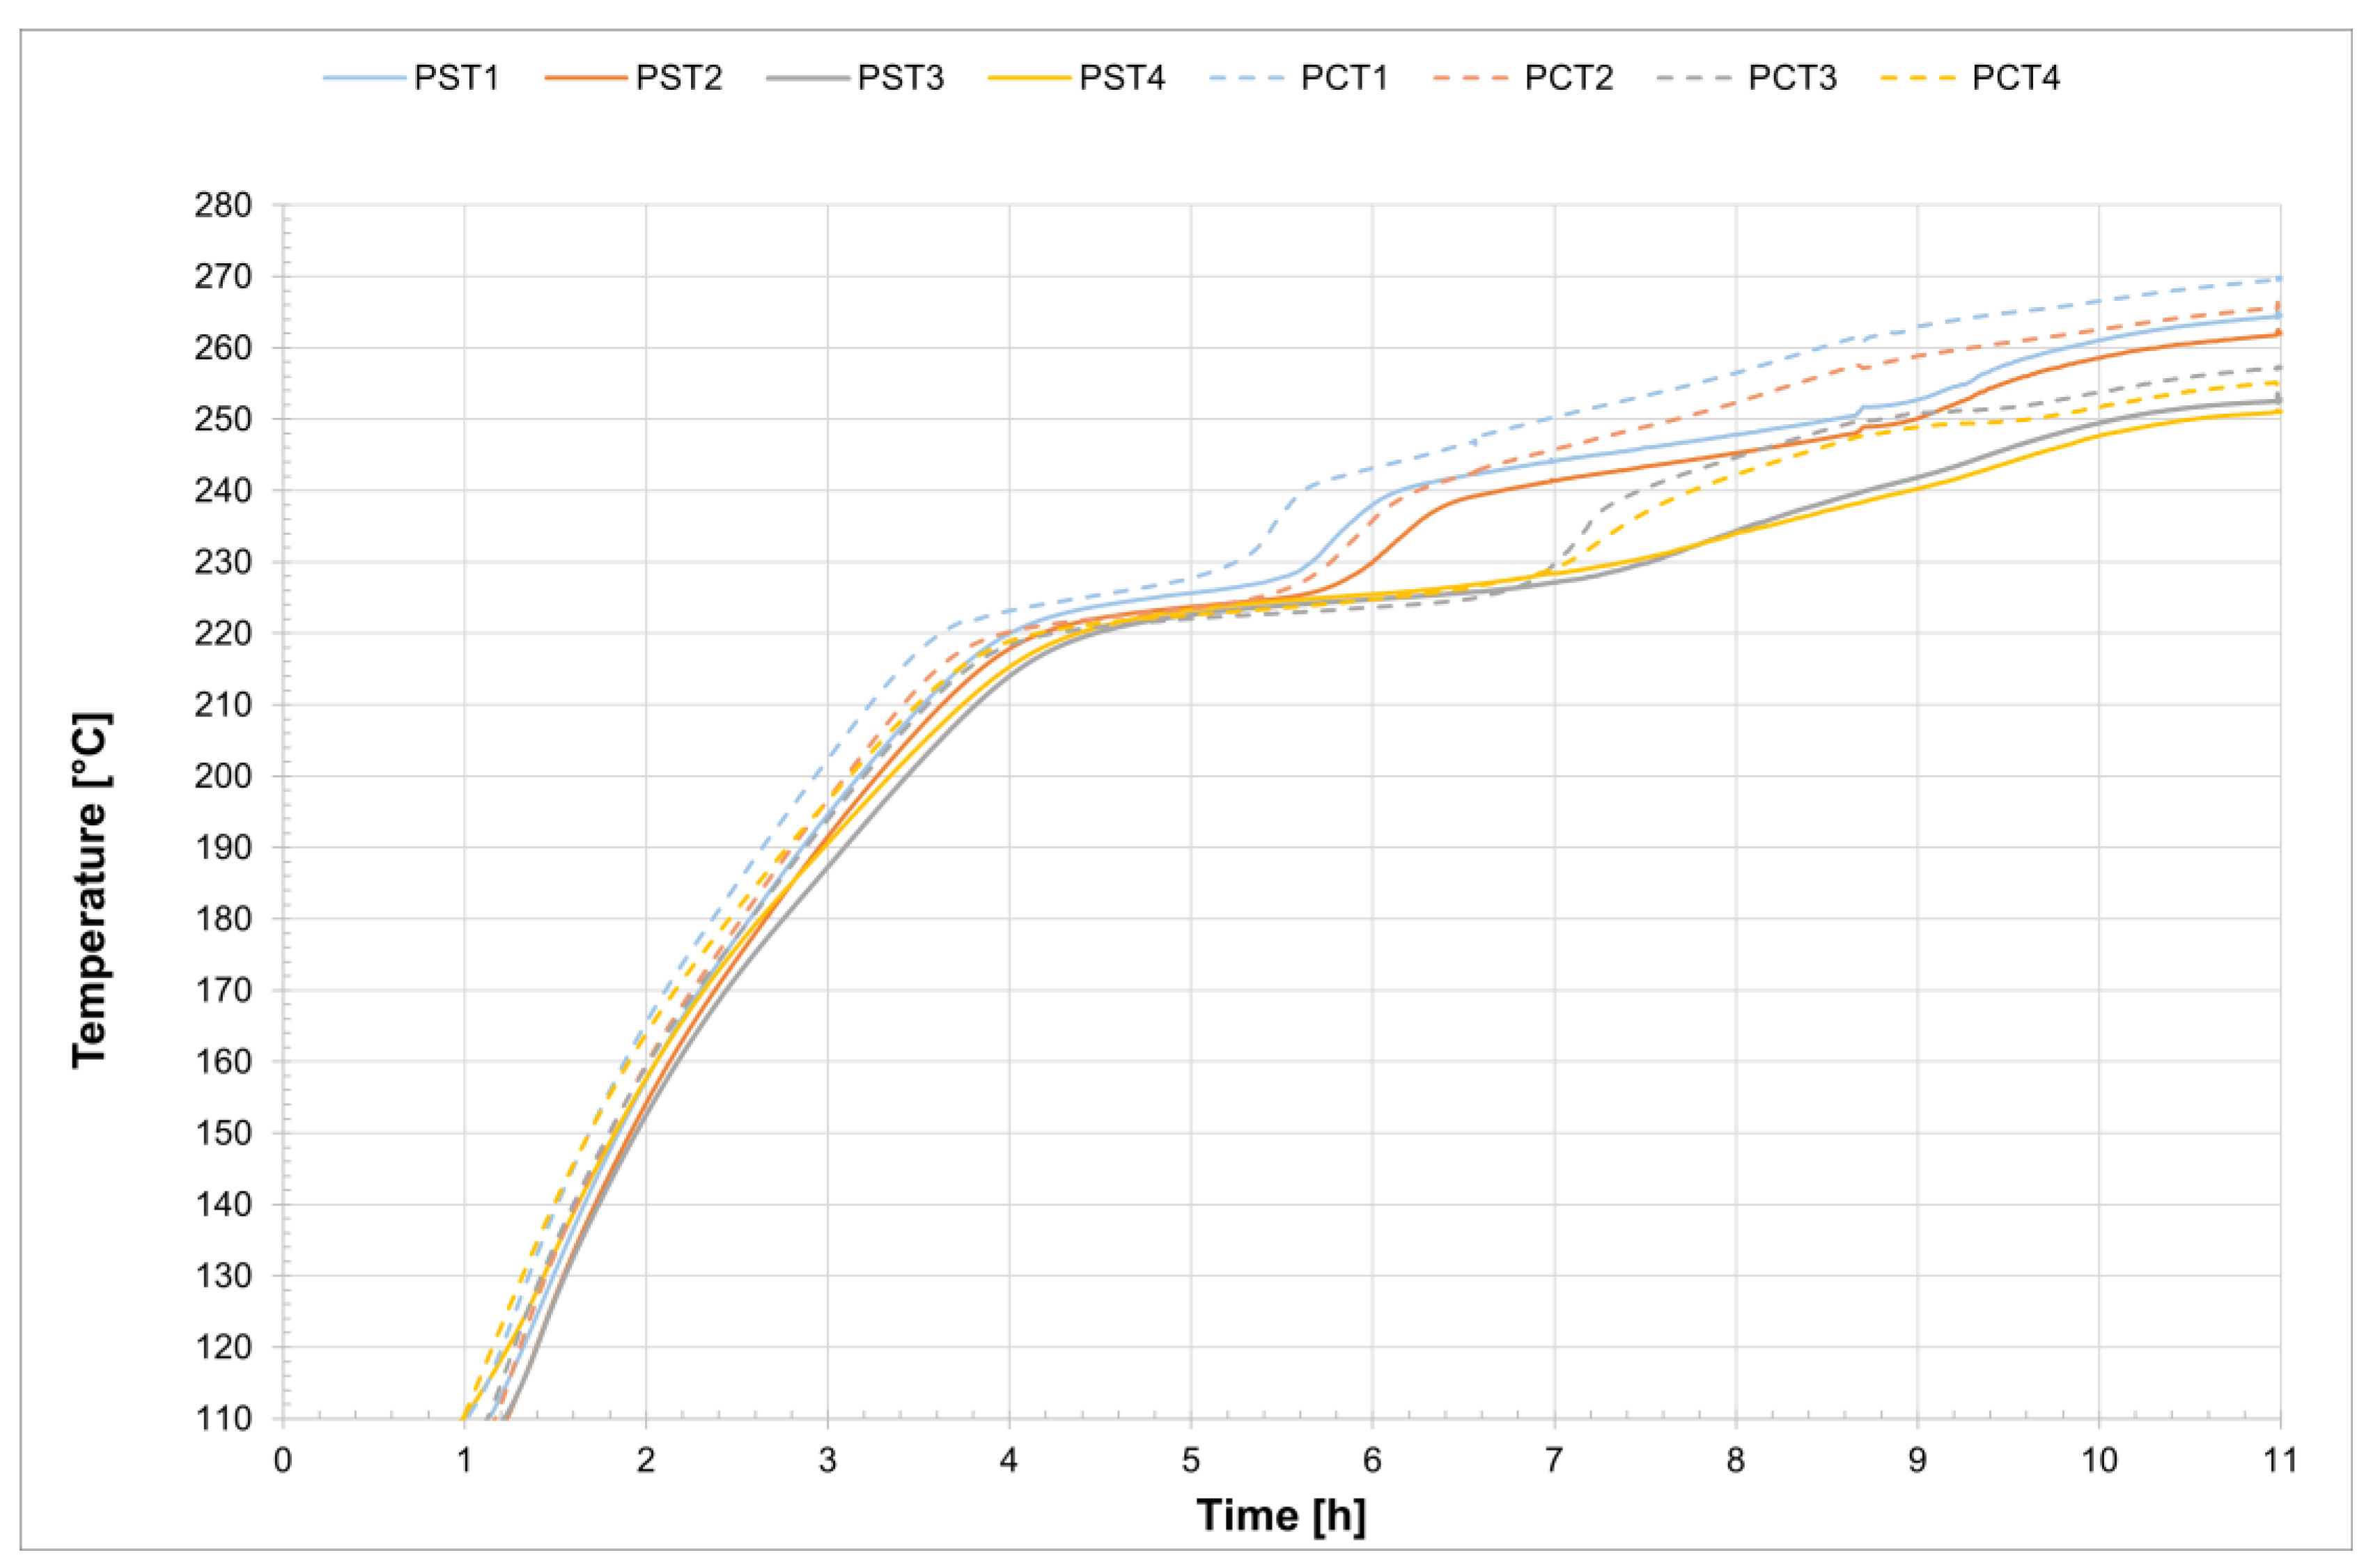
Figure 18 allows us to evaluate the time interval required for the complete melting of the salt mixture within the line consisting of two non-evacuated receivers. The melting process starts at approximately 221 °C and is complete at around 240 °C, with the entire process taking just under 6 h.
Figure 19 shows a detailed view of the temperature profiles recorded by the comb sensors in the central section of the two receiver tubes. In the case of evacuated receivers, the melting process occurs with a delay of about 20 min between the two tubes. In contrast, for the non-evacuated tubes the process starts at approximately the same time in both tubes and takes about 6 h to complete. Once again, an initial stage can be observed during which the temperature increases very slowly, up to around 230 °C. This is followed by a sharp temperature rise, likely caused by the fact that most of the salt inside the two tubes has already melted, thereby accelerating the melting of the remaining solid portion of the mixture. The thermocouples positioned at the top of the section record higher temperatures than those placed at the bottom of the same vertical section. A similar trend is observed in the central section of the second receiver.
Figure 20 shows the temperature at the central collar welded between the two receivers. In this location, the melting process is not as clearly visible as in the other sections; in fact, it occurs very rapidly and only after the mixture inside the two receivers has completely melted. At the central collar, there are some heat losses due to the receiver supports. As a result the temperature increases very slowly until the salt, already liquefied in the receivers, accelerates the process, causing a sharp rise in temperature and rapid melting of the salt in this area.
In order to achieve complete melting of the salt it is necessary to apply a voltage of approximately 7 V across the line, corresponding to a power input of 3.2 kW. Under these conditions the entire process takes just under 6 h.
3.4. Receiver Test Without Vacuum—Salt Solidification Process
As in the case of the evacuated receivers, the solidification tests for the non-evacuated receivers were performed under realistic night-time operating conditions in the absence of solar radiation. Under these conditions, the temperature of the salt entering the solar field is 290 °C, while the outlet temperature is 270 °C. Following the completion of the melting tests, the salt inside the receivers was fully melted and the system was then brought to a uniform and steady-state temperature of 270 °C. This temperature was maintained for approximately one hour to ensure thermal equilibrium throughout the system. Subsequently, the electric heating system was switched off and the time required for complete solidification of the salts within the system was recorded. The results of these tests are summarized in
Table 4.
For all five tests conducted, the temperature profiles recorded by the internal comb sensors in both tubes are shown in
Figure 21 and
Figure 22, while
Figure 23 presents the temperature trends at the central collar between the two receivers.
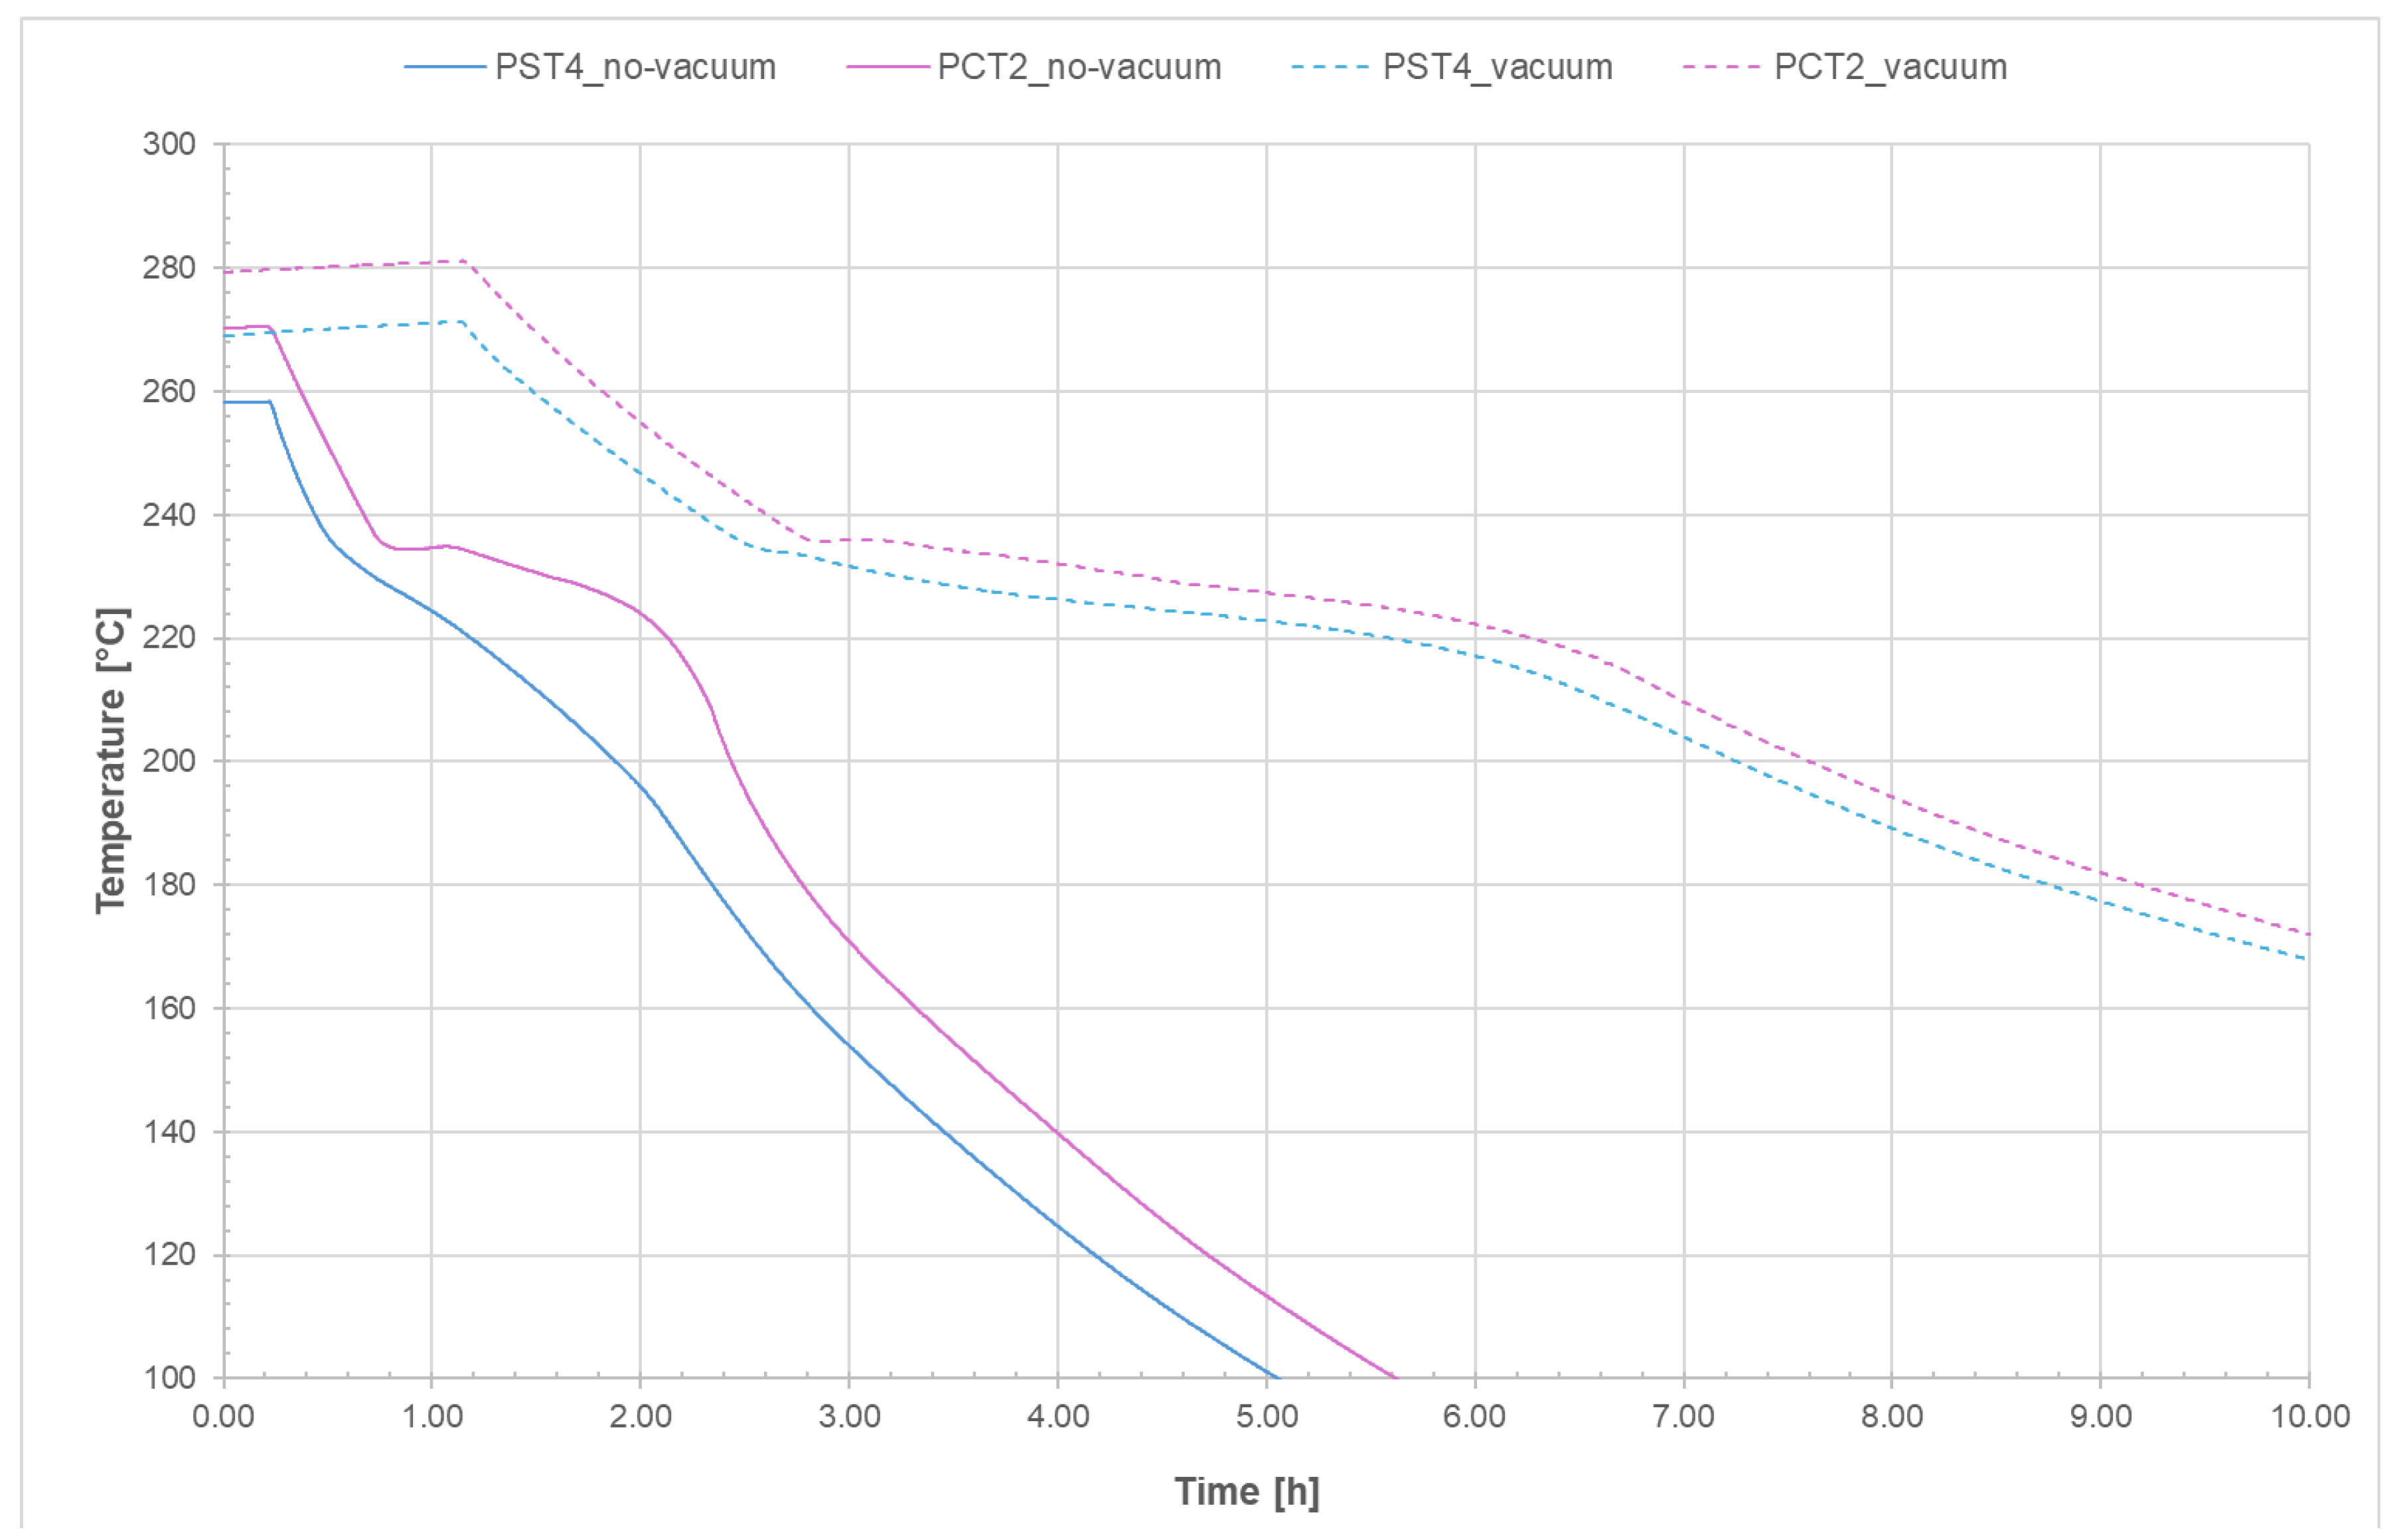
Also in this case, for a more detailed analysis of the solidification process of the salt mixture inside the non-evacuated tubes Test_11 was considered. The temperature trend was monitored from the moment the heating system was turned off until the salts were completely solidified—a process that takes about 1 h and 45 min. It can be observed that, unlike the case with evacuated receivers, the temperature decreases uniformly along the entire length of the receivers. Confirming that heat losses increase in the absence of a vacuum, in non-evacuated receivers the time required for complete solidification of the salts is reduced by about half compared to evacuated receivers. In detail, it can be seen that the solidification process of the salt begins almost simultaneously in both the collar and the two receivers but it then proceeds more rapidly in the collar, requiring less than one hour for complete solidification. Analyzing the temperature trend in the central section of the two non-evacuated receivers, it is easy to observe that the solidification process starts at the outer wall and continues radially toward the center of the section. In fact, thermocouples PCT1 and PCT4, as well as PST1 and PST4 (for the inlet and outlet tubes, respectively), are positioned near the inner wall of the tube—one at the top and one at the bottom, symmetrically (see
Figure 1)—and record a lower temperature compared to thermocouples 2 and 4, which are placed closer to the center of the section.
4. Discussions
A comparison was carried out between the phase-change processes in the two cases: evacuated receiver and non-evacuated receiver.
Regarding the melting process, Test_16 was considered for the evacuated tube, while for the non-evacuated tube three different tests with different applied power levels—Test_11, Test_13, and Test_14—were considered.
Table 5 lists the main characteristics and results of the tests.
From
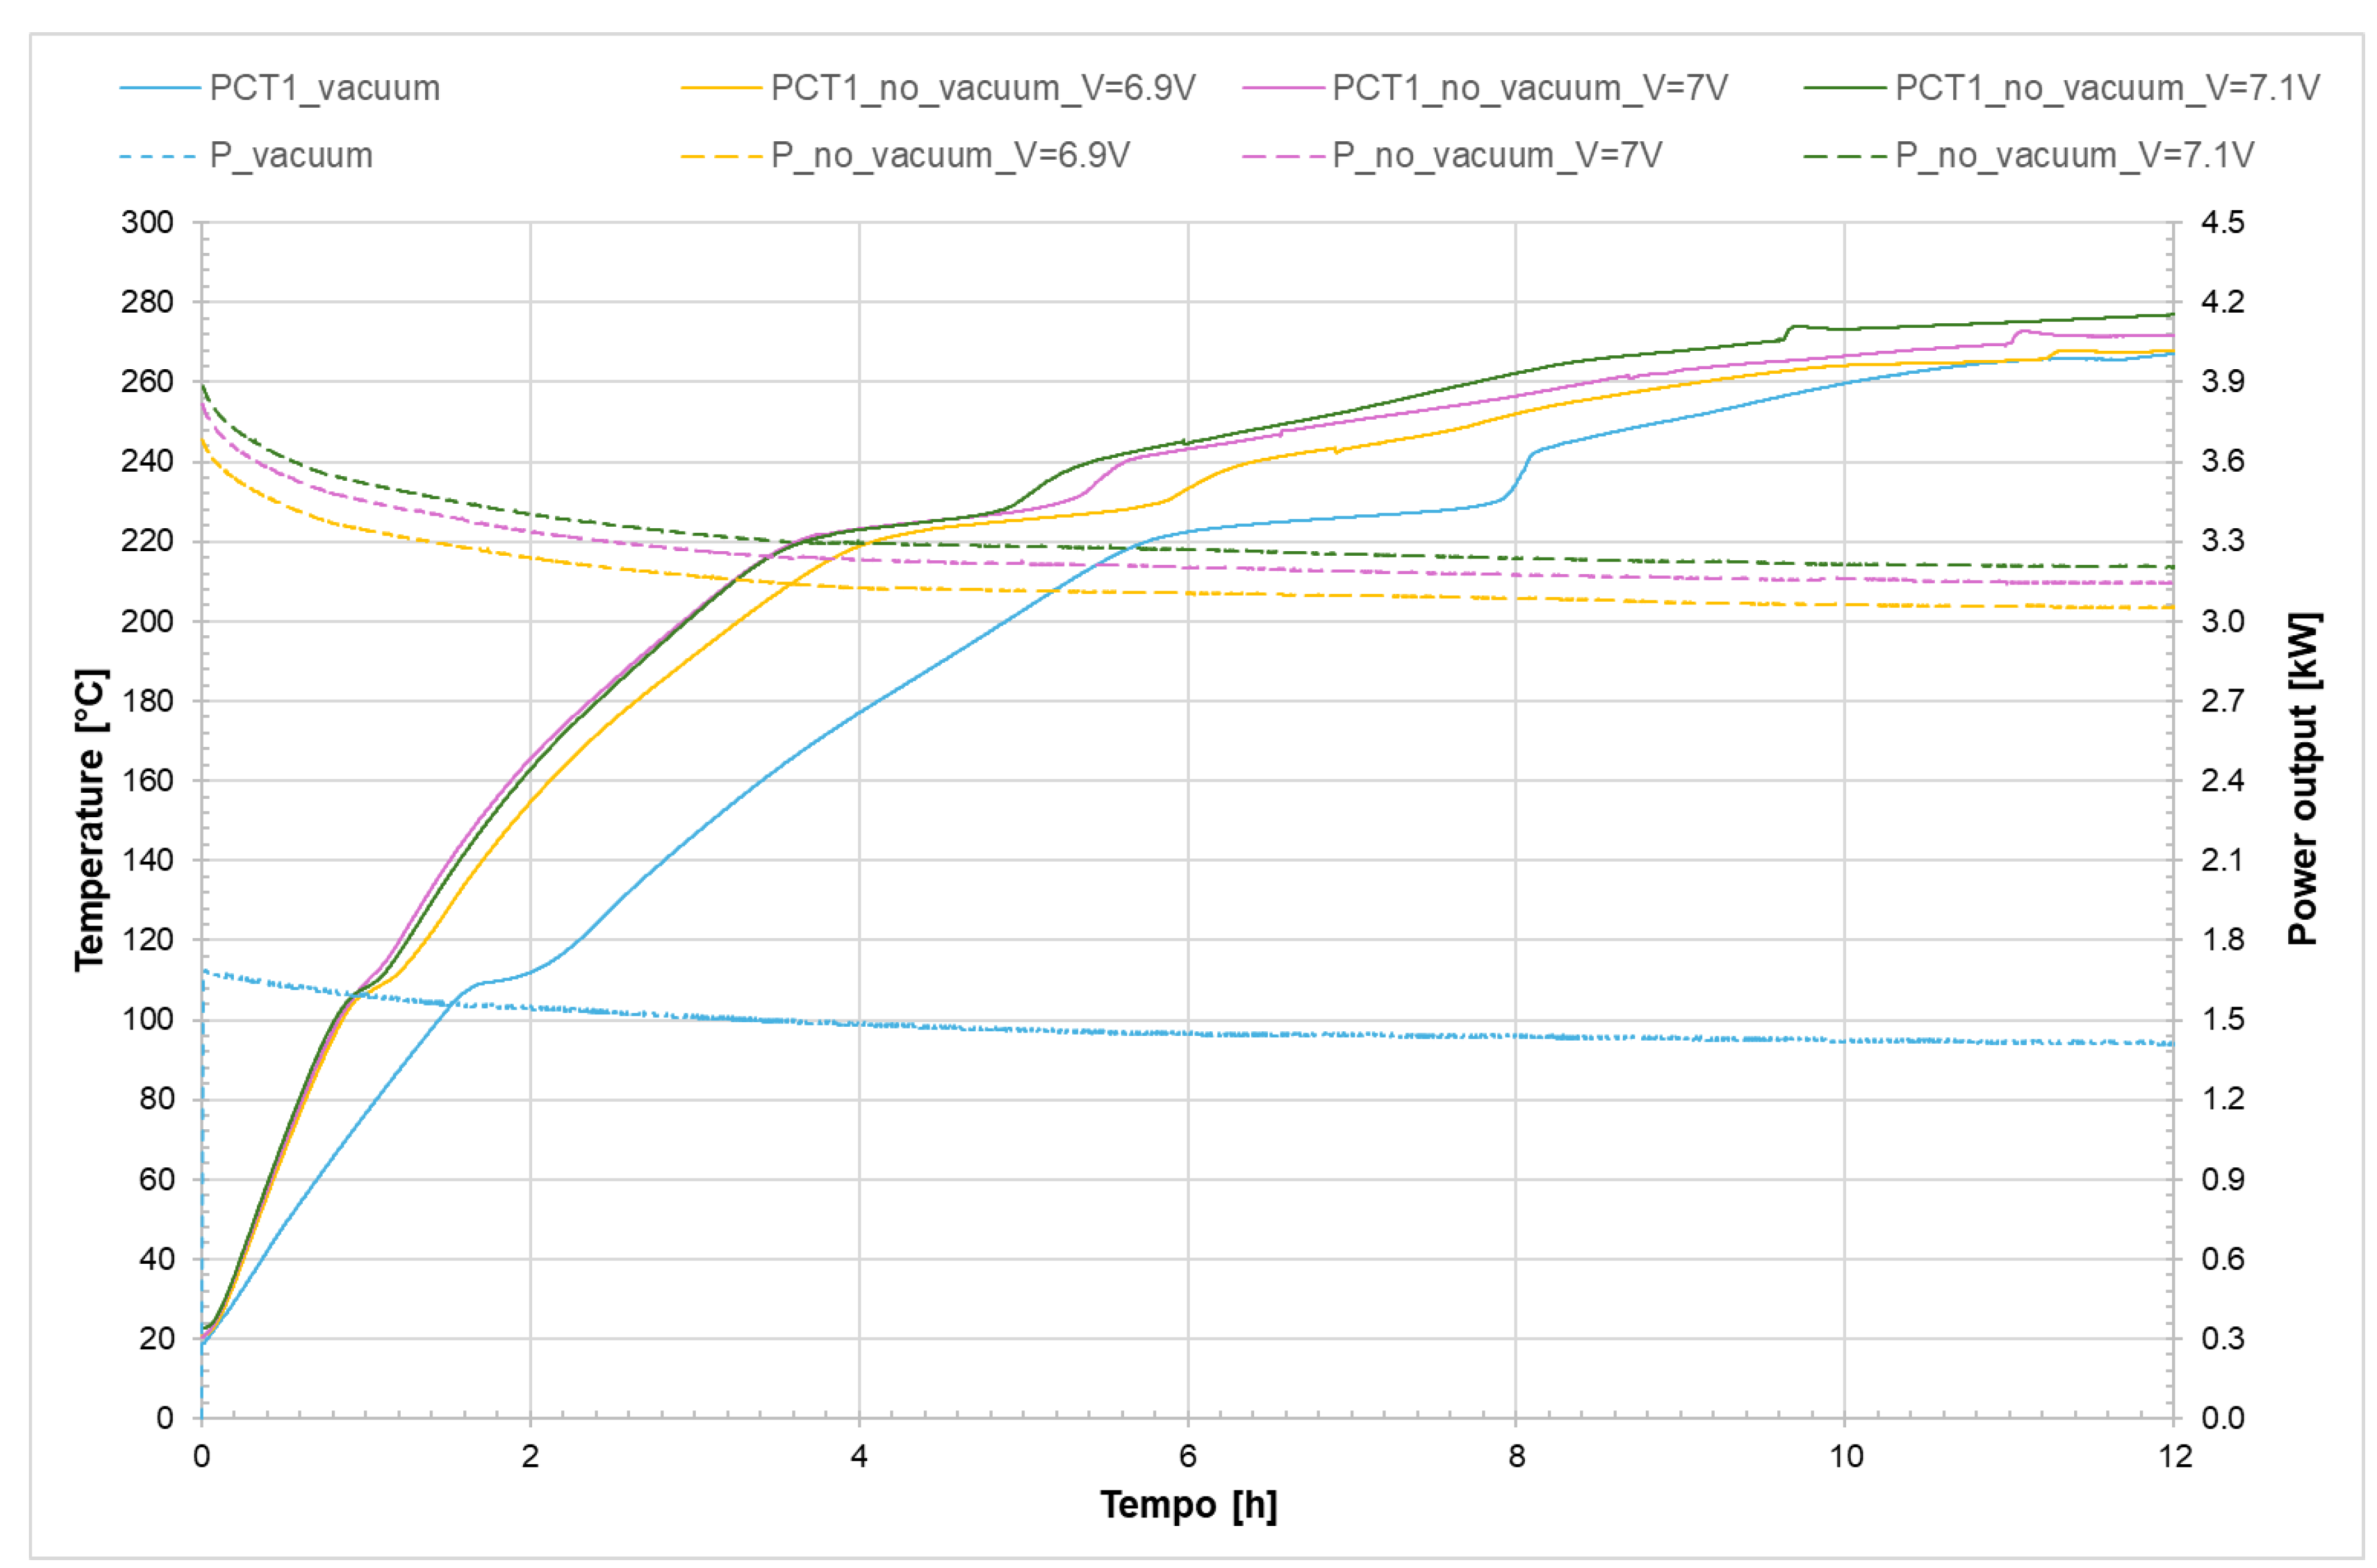
Figure 24, it can be seen that in the case of the non-evacuated receiver, increasing the power applied to the system results in an almost linear decrease in the melting time (blue trend).
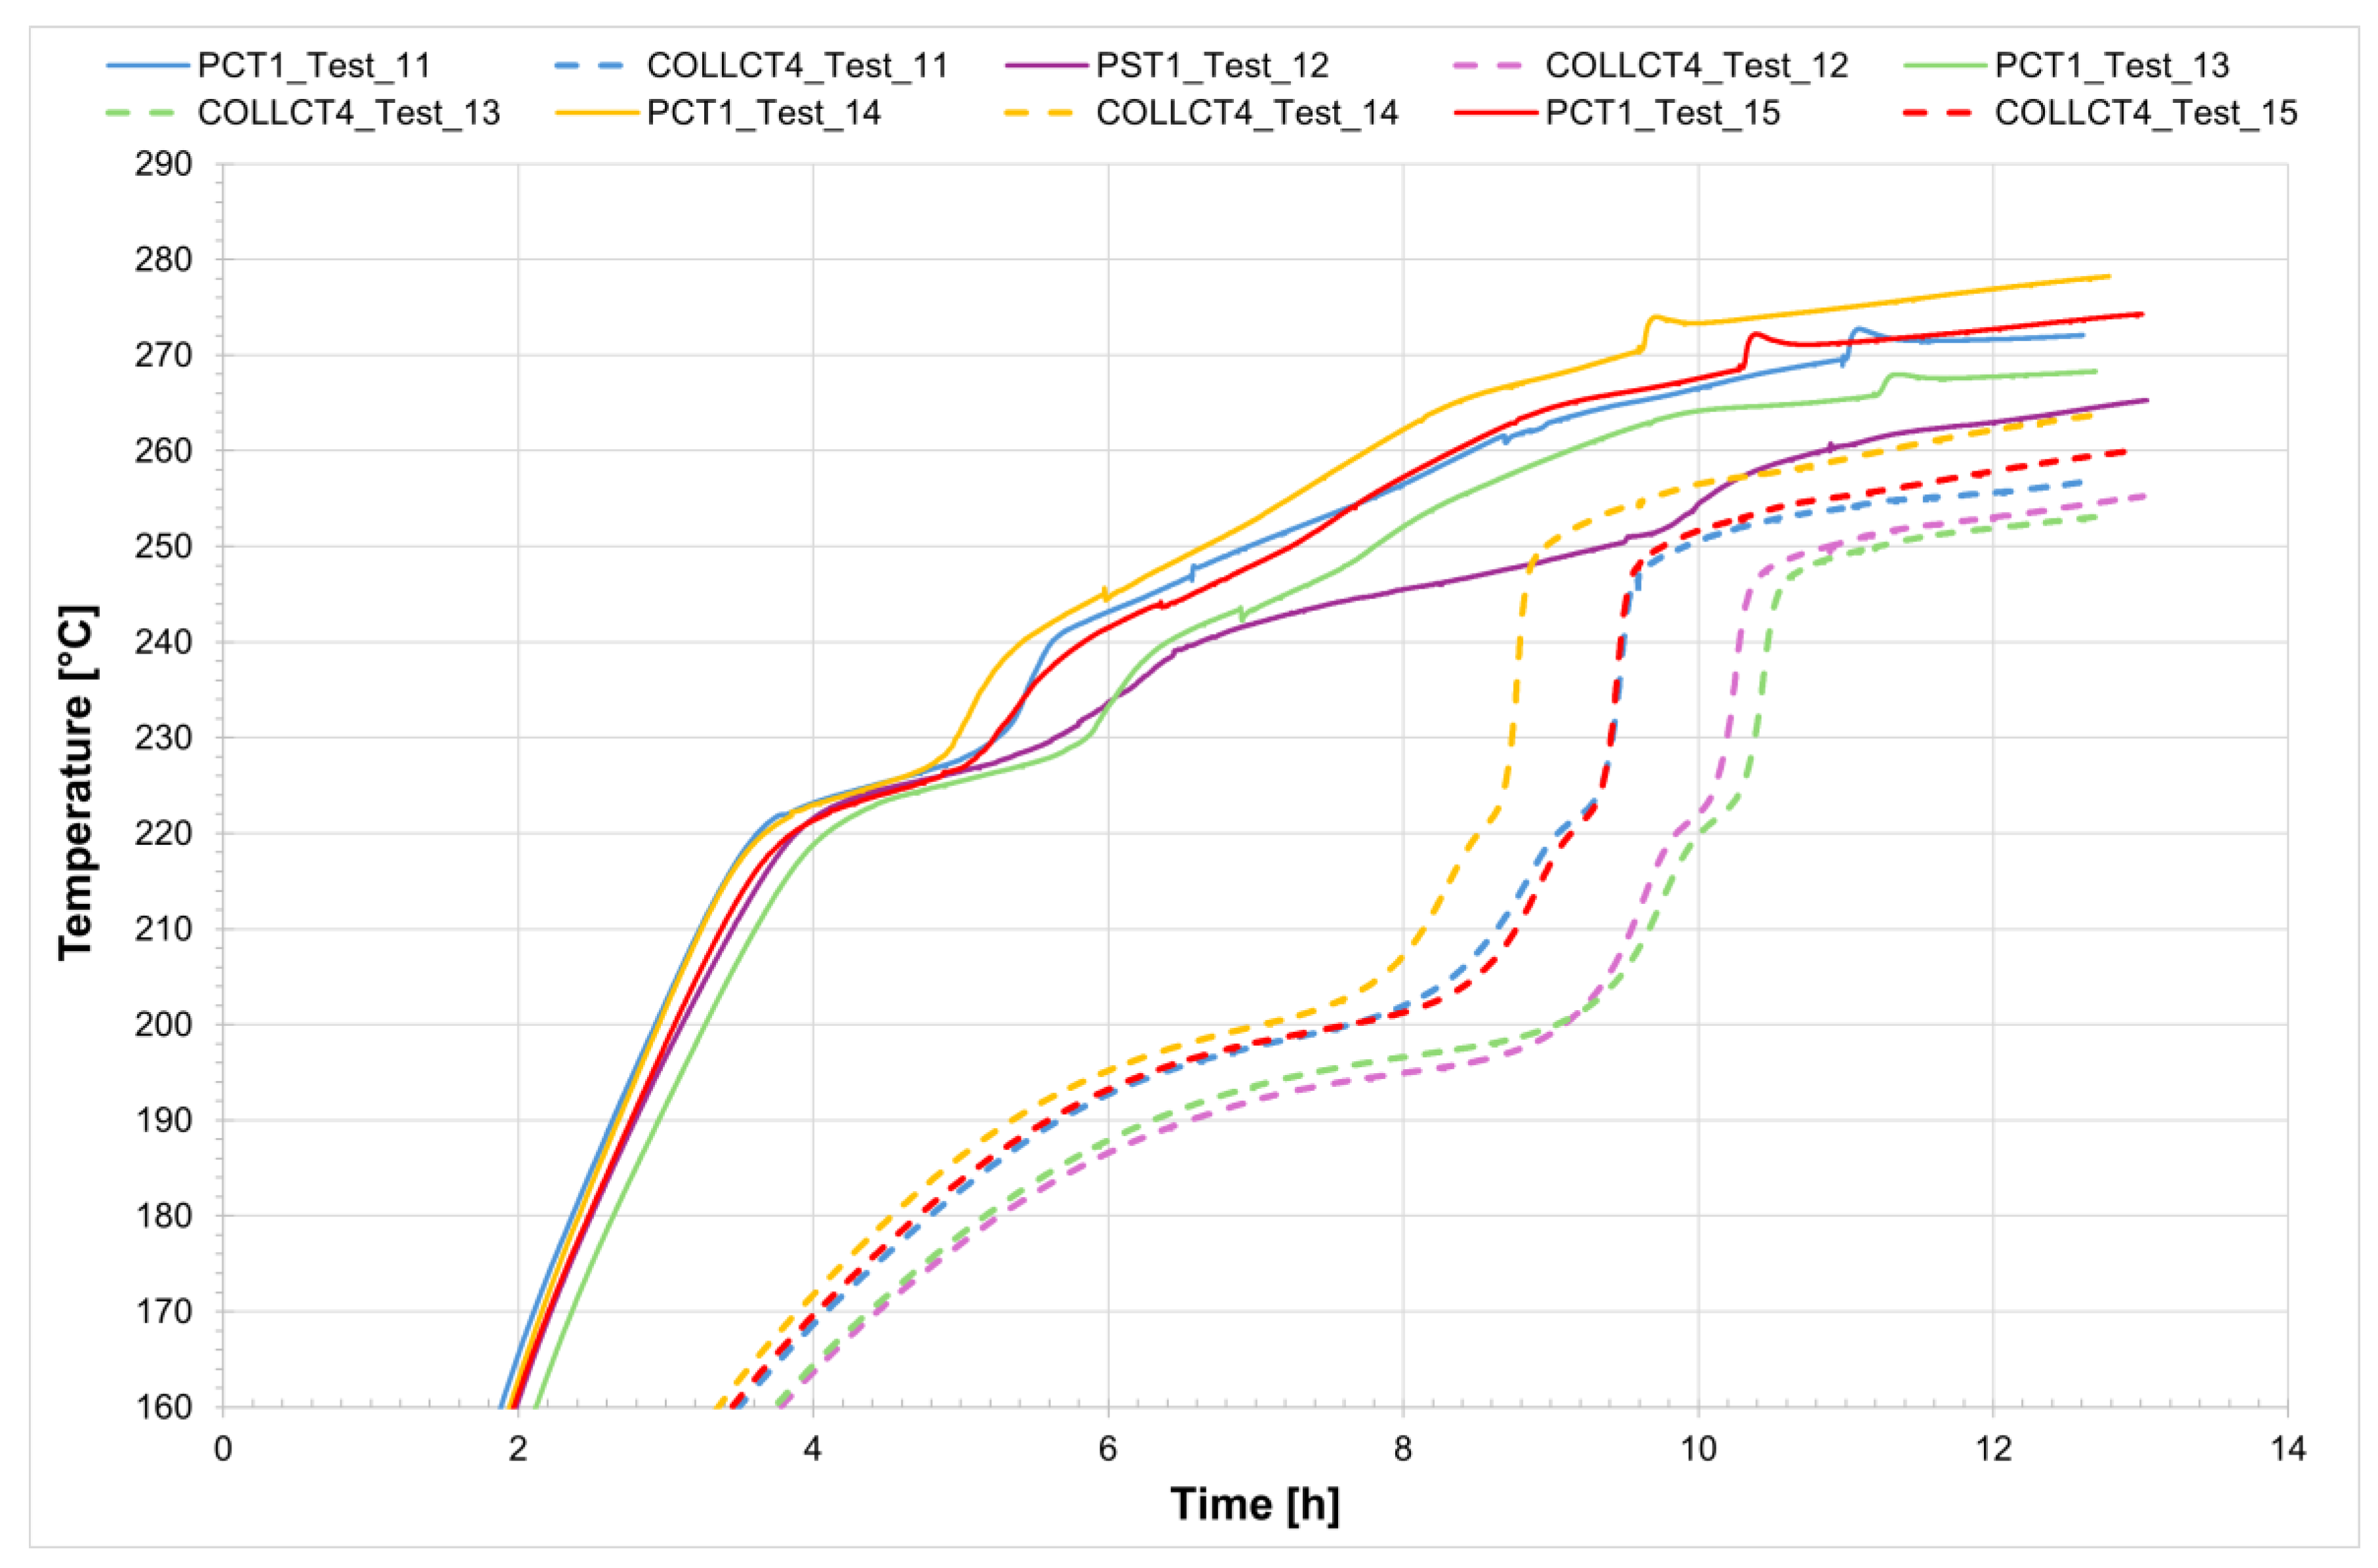
Figure 25 shows the temperature trend inside the receiver on the discharging side (PCT1, see
Figure 1) for both the evacuated and non-evacuated receivers, as well as the power required for the phase change.
It can be observed that in the case of the non-evacuated receiver the initial heating phase is faster because the power applied by the generator is greater compared to the evacuated tube, and also because the difference in terms of heat losses between the evacuated and non-evacuated cases is clearly more pronounced at high temperatures even though the time required for complete melting of the salt is the same.
Regarding the solidification process, the same tests were considered and
Table 6 provides a summary of the main characteristics and results of the tests.
Finally,
Figure 26 shows the start and end of the melting process for the evacuated receiver (solid line) and the non-evacuated receiver (dashed line); for the latter, the results from Test_11 were considered. It can be stated that, in the case of the evacuated receiver, the solidification time of the salt is more than twice that of the non-evacuated tube.
These preliminary outcomes show that, for evacuated receiver tubes, an applied voltage of 4.5 V corresponds to a power input of 1.43 kW and a melting time of approximately 5.5 h, while solidification from 270 °C occurs over roughly 4 h. In contrast, non-evacuated receivers require a higher voltage of 7 V, resulting in a power input of 3.2 kW for a comparable melting time of about 5.6 h; however, they have a much faster solidification process, taking only around 1.45 h. The observation that non-evacuated tubes demand nearly twice the power and exhibit a 2.8-fold increase in heat loss rate provides quantitative guidance for the detection of vacuum loss in parabolic trough collector systems. Furthermore, the detailed analysis of the radial progression of solidification—from the tube walls inward—and the identification of critical zones, such as collar connections acting as thermal bridges, offer valuable engineering insights for the design of CSP plants. However, the main limitations of this study are primarily related to the specific geometry of the test tube and the particular salt mixture employed. While our experimental setup enabled precise control over the thermal and physical conditions, it may not fully capture the complexities encountered in systems with different geometries or salt compositions. The results presented here are therefore most directly applicable to setups with similar tube diameters and material properties. However, the methodology and general trends observed in our work could potentially be extended to other configurations by accounting for changes in the surface-to-volume ratio, heat transfer characteristics, and chemical interactions associated with different salts. Future research should focus on investigating the influence of alternative tube geometries, diameters, and salt mixtures in order to validate and generalize our findings across a broader range of applications.
5. Conclusions
In this study, a series of solidification and melting tests were conducted on a binary salt mixture commonly used as a heat transfer fluid and/or thermal storage medium in CSP plants. The primary objective was to investigate the phase-change behavior, with particular focus on the timing that governs the solidification and melting processes.
The proper design and operation of a PTC plant require a thorough assessment of the power needed for preheating the solar field and for any necessary salt melting procedures. In cases of accidental solidification or emergency conditions, it is necessary to estimate the time available for operators to drain parts of the solar field before salt solidifies within the receiver tubes. Additionally, the experimental results can provide insights into potential vacuum loss in the receiver, which can be deduced from the power required for melting or the time needed for solidification.
The experimental findings indicate that, for an evacuated receiver, a voltage of 4.5 V and a power input of 1.43 kW were required to achieve complete melting of the salt, with the process taking approximately 5.5 h. Starting from a steady-state temperature of 270 °C, complete solidification occurred over about 4 h without fluid circulation. Temperature profiles revealed that solidification begins at the coldest points—typically between two receivers—and progresses radially from the tube’s outer surface toward its center.
In contrast, for a non-evacuated receiver a higher voltage of 7 V and a power input of approximately 3.2 kW were necessary to achieve full melting within a similar timeframe (about 5.6 h). Under these conditions, solidification following the interruption of electrical supply at 270 °C was completed in about 1.45 h. Here, the phase-change process commenced simultaneously along the entire length of the test section.
These findings indicate that non-evacuated tubes exhibit nearly double the power requirement and a 2.8-fold increase in heat loss rate compared to evacuated tubes, providing clear quantitative guidance for the detection of vacuum loss in parabolic trough collector systems.
As a future development, numerical simulations will be performed to reproduce the phenomena investigated in these experiments. The simulation results will be validated against the data presented in this work. This combined approach is expected to provide a deeper understanding of the underlying mechanisms and serve as a valuable tool for predicting system behavior under various operating conditions.
Author Contributions
Conceptualization, V.R., C.C., G.C. and W.G.; methodology, V.R., C.C., G.C., G.N. and G.G.; software, G.N. and L.M.; validation, G.N., L.M., P.D.A. and G.G.; formal analysis, V.R., G.N., P.D.A. and F.R.; investigation, V.R. and G.N.; resources, V.R., G.N. and G.C.; data curation, V.R., F.R., G.N. and P.D.A.; writing—original draft preparation, V.R. and F.R.; writing—review and editing, V.R., F.R. and W.G.; visualization V.R., F.R. and W.G.; supervision, V.R., G.N., C.C. and L.M.; project administration, V.R. and W.G.; funding acquisition, V.R. and W.G. All authors have read and agreed to the published version of the manuscript.
Funding
This project has received funding from the Italian Ministry of the Environment and Energy Security under the grant “Progetto 1.9 Solare Termodinamico/PTR 2022–2024”.
Data Availability Statement
Dataset available on request from the authors.
Conflicts of Interest
The authors declare no conflicts of interest.
Abbreviations
| CFD | Computational Fluid Dynamic |
| CSP | Concentrating Solar Power |
| HTF | Heat Transfer Fluid |
| PTC | Parabolic Trough Collector |
References
- IEA. Executive Summary—Electricity Grids and Secure Energy Transitions. Available online: https://www.iea.org/reports/electricity-grids-and-secure-energy-transitions/executive-summary?utm_source=chatgpt.com (accessed on 17 June 2025).
- Lilliestam, J.; Barradi, T.; Caldés, N.; Gomez, M.; Hanger, S.; Kern, J.; Komendantova, N.; Mehos, M.; Hong, W.M.; Wang, Z.; et al. Policies to Keep and Expand the Option of Concentrating Solar Power for Dispatchable Renewable Electricity. Energy Policy 2018, 116, 193–197. [Google Scholar] [CrossRef]
- Boretti, A.; Castelletto, S. High-Temperature Molten-Salt Thermal Energy Storage and Advanced-Ultra-Supercritical Power Cycles. J. Energy Storage 2021, 42, 103143. [Google Scholar] [CrossRef]
- Durth, M.; Prieto, C.; Rodríguez-Sánchez, A.; Patiño-Rodríguez, D.; Cabeza, L.F. Effects of Sodium Nitrate Concentration on Thermophysical Properties of Solar Salts and on the Thermal Energy Storage Cost. Sol. Energy 2019, 182, 57–63. [Google Scholar] [CrossRef]
- D’Auria, M.; Tizzoni, A.C.; Rovense, F.; Sau, S.; Turchetti, L.; Canavarro, D.; Marchã, J.; Horta, P.; Lanchi, M. Molten Salt Mixtures as an Energy Carrier for Thermochemical Processes of Renewable Gas Production: Review and Perspectives. Appl. Sci. 2025, 15, 6916. [Google Scholar] [CrossRef]
- Prieto, C.; Blindu, A.; Cabeza, L.F.; Valverde, J.; García, G. Molten Salts Tanks Thermal Energy Storage: Aspects to Consider during Design. Energies 2024, 17, 22. [Google Scholar] [CrossRef]
- Russo, V.; Petroni, G.; Rovense, F.; Giorgetti, M.; Napoli, G.; Giorgi, G.; Gaggioli, W. Experimental Testing Results on Critical Components for Molten Salt-Based CSP Systems. Energies 2025, 18, 198. [Google Scholar] [CrossRef]
- Elkhatat, A.; Al-Muhtaseb, S.A. Combined “Renewable Energy—Thermal Energy Storage (RE–TES)” Systems: A Review. Energies 2023, 16, 4471. [Google Scholar] [CrossRef]
- Grena, R.; Cagnoli, M.; Zanino, R.; Lanchi, M. Overcoming Power Limitations of Electric Heating in a Solar Salt Thermal Storage by Microwave Heating. Energies 2025, 18, 2059. [Google Scholar] [CrossRef]
- Gaggioli, W.; Fabrizi, F.; Rinaldi, L.; Di Ascenzi, P. Experimental Tests about the Cooling/Freezing of the Molten Salts in the Receiver Tubes of a Solar Power Plant with Parabolic Trough. AIP Conf. Proc. 2017, 1850, 20005. [Google Scholar] [CrossRef]
- Prieto, C.; Ruiz-Cabañas, J.; Madina, V.; Fernández, A.I.; Cabeza, L.F. Lessons Learned from Corrosion of Materials with Molten Salts during Molten Salt Tank Preheating. Sol. Energy Mater. Sol. Cells 2022, 247, 111943. [Google Scholar] [CrossRef]
- Prieto, C.; Miró, L.; Peiró, G.; Oró, E.; Gil, A.; Cabeza, L.F. Temperature Distribution and Heat Losses in Molten Salts Tanks for CSP Plants. Sol. Energy 2016, 135, 518–526. [Google Scholar] [CrossRef]
- Matino, F.; Maccari, A. Molten Salt Receivers Operated on Parabolic Trough Demo Plant and in Laboratory Conditions. Energy Procedia 2015, 69, 481–486. [Google Scholar] [CrossRef]
- Prieto, C.; Rodríguez-Sánchez, A.; Ruiz-Cabañas, F.J.; Cabeza, L.F. Feasibility Study of Freeze Recovery Options in Parabolic Trough Collector Plants Working with Molten Salt as Heat Transfer Fluid. Energies 2019, 12, 2340. [Google Scholar] [CrossRef]
- Imponenti, L.; Shininger, R.; Gawlik, K.; Price, H.; Zhu, G. Controllable Solar Flux Heating for Freeze Recovery in Molten Salt Parabolic Trough Collectors. J. Energy Resour. Technol. Trans. ASME 2020, 142, 121301-1. [Google Scholar] [CrossRef]
- Imponenti, L.; Herruzo, J.C.; Shininger, R.; Price, H.; Valverde, J. Development and Testing of a Solar Flux Heating Freeze Recovery System for Molten Salt Parabolic Troughs. AIP Conf. Proc. 2022, 2445, 100002. [Google Scholar] [CrossRef]
- Herruzo, J.C.; Imponenti, L.; Valverde, J.; Shininger, R.; Price, H. A Coupled Fluid-Thermo-Mechanical Evaluation of Various Freeze Recovery Strategies for Molten Salt Parabolic Trough Collectors. Sol. Energy 2024, 267, 112250. [Google Scholar] [CrossRef]
Figure 1.
Test bench including the two welded receiver tubes and the points where temperatures were measured.
Figure 1.
Test bench including the two welded receiver tubes and the points where temperatures were measured.
Figure 2.
View of the test bench used to perform the tests.
Figure 2.
View of the test bench used to perform the tests.
Figure 4.
Temperature profiles at the comb sensors on the salt charging side of the tube.
Figure 4.
Temperature profiles at the comb sensors on the salt charging side of the tube.
Figure 5.
Temperature profiles at the comb sensors on the tube’s salt charging side.
Figure 5.
Temperature profiles at the comb sensors on the tube’s salt charging side.
Figure 6.
Temperature profile at the central collar between the two receivers during the salt melting process.
Figure 6.
Temperature profile at the central collar between the two receivers during the salt melting process.
Figure 7.
Onset and completion of the melting process.
Figure 7.
Onset and completion of the melting process.
Figure 8.
Temperature profiles at the comb sensors on the tube discharge side.
Figure 8.
Temperature profiles at the comb sensors on the tube discharge side.
Figure 9.
Temperature profiles at the comb sensors on the tube charging side.
Figure 9.
Temperature profiles at the comb sensors on the tube charging side.
Figure 10.
Temperature profile at the central collar between the two receivers during the salt solidification process.
Figure 10.
Temperature profile at the central collar between the two receivers during the salt solidification process.
Figure 11.
Comparison of comb sensor temperature on the filling side between receivers with and without a vacuum.
Figure 11.
Comparison of comb sensor temperature on the filling side between receivers with and without a vacuum.
Figure 14.
Temperature profiles at the comb sensors on the tube discharge side, non-evacuated case.
Figure 14.
Temperature profiles at the comb sensors on the tube discharge side, non-evacuated case.
Figure 15.
Temperature profiles at the comb sensors on the tube filling side, non-evacuated case.
Figure 15.
Temperature profiles at the comb sensors on the tube filling side, non-evacuated case.
Figure 16.
Temperature profile at the central collar between the two receivers, non-evacuated case.
Figure 16.
Temperature profile at the central collar between the two receivers, non-evacuated case.
Figure 17.
Start and end of the melting process.
Figure 17.
Start and end of the melting process.
Figure 18.
Temperatures inside the two non-evacuated tubes during the salt melting phase.
Figure 18.
Temperatures inside the two non-evacuated tubes during the salt melting phase.
Figure 19.
Temperatures in the central section of the two non-evacuated tubes during the salt melting phase.
Figure 19.
Temperatures in the central section of the two non-evacuated tubes during the salt melting phase.
Figure 20.
Temperatures in the central section between the two non-evacuated tubes during the salt melting phase.
Figure 20.
Temperatures in the central section between the two non-evacuated tubes during the salt melting phase.
Figure 21.
Temperature trend of the tube bundle on the exhaust side.
Figure 21.
Temperature trend of the tube bundle on the exhaust side.
Figure 22.
Temperature trend of the tube bundle on the inlet side.
Figure 22.
Temperature trend of the tube bundle on the inlet side.
Figure 23.
Temperature trend in the central collar between the two receivers.
Figure 23.
Temperature trend in the central collar between the two receivers.
Figure 24.
Power (orange bars) and energy (green bars) required for salt melting, and time taken (blue line) for evacuated and non-evacuated receivers.
Figure 24.
Power (orange bars) and energy (green bars) required for salt melting, and time taken (blue line) for evacuated and non-evacuated receivers.
Figure 25.
Temperature trend at the center of both evacuated and non-evacuated receivers during the melting phase on the discharging side.
Figure 25.
Temperature trend at the center of both evacuated and non-evacuated receivers during the melting phase on the discharging side.
Figure 26.
Start and end of the melting process in evacuated and non-evacuated receivers.
Figure 26.
Start and end of the melting process in evacuated and non-evacuated receivers.
Table 1.
Main results of vacuum tube melting tests.
Table 1.
Main results of vacuum tube melting tests.
| Test | Voltage
[V] | Dtmelting
[hh:mm:ss] | Pmelting
[kW] | Emelting
[kWh] | Dtpreheating
[hh:mm:ss] | Ppreheating
[kW] | Epreheating
[kWh] |
|---|
| Test_10 | 4 | 11:27:20 | 1.082 | 12.390 | 08:17:18 | 1.147 | 9.506 |
| Test_15 | 4.5 | 06:21:01 | 1.372 | 8.716 | 02:09:06 | 1.413 | 3.042 |
| Test_16 | 4.5 | 05:35:53 | 1.432 | 8.018 | 05:45:08 | 1.525 | 8.773 |
| Test_18 | 4.5 | 05:59:16 | 1.371 | 8.211 | 06:03:26 | 1.460 | 8.845 |
Table 2.
Main results of the solidification tests with the evacuated tube.
Table 2.
Main results of the solidification tests with the evacuated tube.
| Test | Tstart
[°C] | Dtsolid
[hh:mm:ss] | Dtpresolid
[hh:mm:ss] |
|---|
| Test_7 + 8 | 280 | 03:46:54 | 01:03:09 |
| Test_11 | 400 | 03:48:45 | 08:01:53 |
| Test_15 | 280 | 03:57:11 | 01:07:26 |
| Test_16 | 280 | 03:55:25 | 01:05:51 |
| Test_18 | 280 | 04:01:13 | 01:05:12 |
Table 4.
Main results of the solidification tests with the non-evacuated tube.
Table 4.
Main results of the solidification tests with the non-evacuated tube.
| Test | Tstart
[°C] | Dtsolid
[hh:mm:ss] | Dtpresolid
[hh:mm:ss] |
|---|
| Test_11 | 260–270 | 01:42:23 | 00:12:23 |
| Test_12 | 255–270 | 01:42:08 | 00:09:50 |
| Test_13 | 255–270 | 01:45:22 | 00:10:51 |
| Test_14 | 265–280 | 01:45:04 | 00:18:18 |
| Test_15 | 260–270 | 01:45:16 | 00:14:10 |
Table 5.
Comparison of the melting process in evacuated and non-evacuated receivers.
Table 5.
Comparison of the melting process in evacuated and non-evacuated receivers.
| Test | Voltage
[V] | Dtmelting
[hh:mm:ss] | Pmelting
[kW] | Emelting
[kWh] | Dtpreheating
[hh:mm:ss] | Ppreheating
[kW] | Epreheating
[kWh] |
|---|
| No vacuum Test_13 | 6.9 | 06:23:04 | 3.092 | 19.745 | 04:05:16 | 3.269 | 13.348 |
| No vacuum Test_11 | 7 | 05:52:15 | 3.195 | 18.765 | 03:37:22 | 3.391 | 12.264 |
| No vacuum Test_14 | 7.1 | 05:07:05 | 3.263 | 16.708 | 03:40:23 | 3.453 | 12.646 |
| Vacuum Test_16 | 4.5 | 05:35:53 | 1.432 | 8.018 | 05:45:08 | 1.525 | 8.773 |
Table 6.
Comparison of the solidification process in evacuated and non-evacuated receivers.
Table 6.
Comparison of the solidification process in evacuated and non-evacuated receivers.
| Test | Tstart
[°C] | Dtsolid
[hh:mm:ss] | Dtpresolid
[hh:mm:ss] |
|---|
| No vacuum Test_13 | 260–270 | 01:42:23 | 00:12:23 |
| No vacuum Test_11 | 255–270 | 01:45:22 | 00:10:51 |
| No vacuum Test_14 | 265–280 | 01:45:04 | 00:18:18 |
| Vacuum Test_16 | 280 | 03:55:25 | 01:05:51 |
| No vacuum Test_13 | 260–270 | 01:42:23 | 00:12:23 |
| Disclaimer/Publisher’s Note: The statements, opinions and data contained in all publications are solely those of the individual author(s) and contributor(s) and not of MDPI and/or the editor(s). MDPI and/or the editor(s) disclaim responsibility for any injury to people or property resulting from any ideas, methods, instructions or products referred to in the content. |
© 2025 by the authors. Licensee MDPI, Basel, Switzerland. This article is an open access article distributed under the terms and conditions of the Creative Commons Attribution (CC BY) license (https://creativecommons.org/licenses/by/4.0/).
