Article

The Impact of Selected Market Factors on the Prices of Wood Industry By-Products in Poland in the Context of Climate Policy Changes

by
Anna Kożuch
1,*,
Dominika Cywicka
1,2,3,
Marek Wieruszewski
4,
Miloš Gejdoš
5,6 and
Krzysztof Adamowicz
7
1
Department of Forest Resources Management, Faculty of Forestry, University of Agriculture in Krakow, Avenue 29-Listopada 46, 31-425 Krakow, Poland
2
Faculty of Computer Science and Telecommunications, Cracow University of Technology, Warszawska St. 24, 31-155 Kraków, Poland
3
Interdisciplinary Center for Circular Economy, Cracow University of Technology, ul. Warszawska St. 24, 31-155 Kraków, Poland
4
Department of Mechanical Wood Technology, Faculty of Forestry and Wood Technology, Poznan University of Life Sciences, Wojska Polskiego 28, 60-637 Poznan, Poland
5
Department of Forest Harvesting Logistics and Ameliorations, Technical University in Zvolen, T. G. Masaryka 24, 960 01 Zvolen, Slovakia
6
National Forest Centre, Forest Research Institute, T. G. Masaryka 22, 960 01 Zvolen, Slovakia
7
Department of Forestry Economics and Technology, Faculty of Forestry and Wood Technology, Poznan University of Life Sciences, Wojska Polskiego 28, 60-637 Poznan, Poland
*
Author to whom correspondence should be addressed.
Energies 2025, 18(16), 4418; https://doi.org/10.3390/en18164418
Submission received: 30 June 2025 / Revised: 31 July 2025 / Accepted: 16 August 2025 / Published: 19 August 2025

Abstract

The objective of this study was to analyze price variability and the factors influencing the formation of monthly prices of by-products of the wood industry in Poland between October 2017 and January 2025. The analysis considered the impact of economic variables, including energy commodity prices (natural gas and coal) and industrial wood prices, on the pricing of wood industry by-products. The adopted approach enabled the identification of key determinants shaping the prices of these by-products. The effectiveness of two tree-based regression models—Random Forest (RF) and CatBoost (CB)—was compared in the analysis. Although RF offers greater interpretability and lower computational requirements, CB proved more effective in modeling dynamic, time-dependent phenomena. The results indicate that industrial wood prices exerted a weaker influence on by-product prices than natural gas prices, suggesting that the energy sector plays a leading role in shaping biomass prices. Coal prices had only a marginal impact on the biomass market, implying that changes in coal availability and pricing did not directly translate into changes in the prices of wood industry by-products. The growing role of renewable energy sources derived from natural gas and wood biomass is contributing to the emergence of a distinct market, increasingly independent of the traditional coal market. In Poland, due to limited access to alternative energy sources, biomass plays a critical role in the decarbonization of the energy sector.

1. Introduction

The growing challenges posed by climate change, the depletion of natural resources, and the urgent need for a transition toward sustainable development have significantly increased the relevance of the circular economy (CE) concept across many countries worldwide [1,2,3,4]. The circular economy can be defined as “a regenerative system in which resource input and waste, emissions, and energy leakage are minimized by slowing, closing, and narrowing material and energy loops” [5,6]. The fundamental objective is to minimize the consumption of primary raw materials through the repeated use of products and materials within the economic cycle.
The increasing pressure on environmental resources renders the forest sector critical in facilitating the transition to a circular economy. Specifically, the wood processing industry generates by-products beyond the core output, many of which can be reused after appropriate treatment. By-products generated during wood processing—such as sawdust, wood chips, and shavings—should be regarded as valuable secondary raw materials that can be reintegrated into the production cycle. Their use for bioenergy should be considered only at the final stage of the value chain.
Nonetheless, the use of biomass as an energy source constitutes a vital component of energy policy in many countries. It contributes to decarbonizing the energy sector, enhances energy security, and supports climate protection. Between 2010 and 2022, bioenergy consumption grew by an average of approximately 3% annually and continues to trend upward. Economic analyses have demonstrated that bioenergy production yields positive socioeconomic outcomes, including enhanced social welfare and reduced environmental degradation [7,8].
Climate protection and the deployment of renewable energy sources (RESs) gained formal legal significance with the signing of the Kyoto Protocol [9] and the Paris Agreement [10]. The European Union (EU) has committed to promoting the use of RES. Wood has been classified as a renewable energy source since the adoption of Directive 2009/28/EC of the European Parliament and of the Council of 23 April 2009 (Directive, 2009). These goals have been reinforced through EU Directive 2018/2001 (RED II) and the more recent Directive 2023/2413 (RED III), which emphasize the necessity of increasing the share of RESs in gross final energy consumption to 42.5% by 2030 [11,12,13]. Both RED II and RED III call for a coherent and unified approach to the use of renewable energy sources.
Modern bioenergy currently represents the largest renewable energy source globally, accounting for 55% of renewable energy consumption and over 6% of global energy supply. The Net Zero Emissions by 2050 (NZE) scenario anticipates a rapid increase in bioenergy use to replace fossil fuels by 2030. Substantial efforts are required to accelerate the deployment of modern bioenergy in alignment with NZE targets. This entails an annual implementation growth rate of 8% between 2022 and 2030, while ensuring that bioenergy production does not result in adverse social or environmental impacts [14].
Bioenergy has a positive impact on sustainable development. The effect of per capita biomass energy consumption on sustainability is both positive and statistically significant, whereas the influence of non-renewable energy consumption is negative [15]. It has been shown that biomass energy can improve environmental quality in high-income countries, while it tends to have adverse environmental effects in middle- and low-income countries [16,17]. In 2017, forest biomass accounted for approximately 69% of the total biomass used for energy production [18].
Forest biomass is considered one of the renewable and sustainable energy sources that can be utilized for the generation of electricity, heat, and biofuels [19]. Furthermore, the use of forest biomass and by-products from the wood processing sector for renewable energy production offers several advantages: energy can be produced at both small and large scales, and biomass energy can provide a more stable and consistent supply to the power grid compared to intermittent sources such as solar or wind energy [20,21,22].
Currently, wood industry enterprises and energy sector actors compete for access to wood and its processing by-products. It remains difficult to accurately quantify the share of wood in Poland—particularly wood industry by-products—that is allocated to material uses and further processing (i.e., cascading use of wood) versus the share used for energy purposes (i.e., bioenergy production) [23,24]. The end use of wood residues is largely determined by market conditions (supply and demand), and the market mechanism significantly influences the pricing of wood biomass. Wood industry enterprises, depending on their network of business relationships, storage and logistics capacities, and—above all—economic considerations (i.e., achieving optimal sales prices), sell by-products of wood processing in accordance with economic rationality.
According to Munis et al. [25], price modeling represents one of the most critical and sensitive challenges, as it influences future revenues, which are typically dependent on price behavior over time. It also provides statistical insights into the dynamics of the analyzed market [26]. Price reflects product interest and indicates market development directions. It results from the interaction between supply and demand and serves as the best available predictor for future trends [27].
Multifaceted analyses of wood and wood-based product prices have long been a prominent subject of academic inquiry [28,29,30,31,32,33,34,35]. Numerous models, including hybrid models, have been tested for their effectiveness in forecasting wood prices, analyzing market integration, and evaluating price convergence [36,37,38]. In recent decades, several forecasting methods have been proposed, including ordinary least squares regression (OLS), vector autoregression (VAR), autoregressive integrated moving average (ARIMA), and artificial neural networks [39,40,41]. Most wood price forecasting studies have been based on traditional statistical or econometric models [42,43,44].
In price modeling, the identification of factors that significantly influence price formation is of critical importance. In the case of wood industry by-products, such factors may include energy carriers and industrial roundwood. Real-time price forecasting and the identification of inter-variable dependencies can assist enterprises in mitigating risk and making informed market decisions regarding the sale or purchase of biomass for operational needs.
In our study, we applied advanced machine learning algorithms—Random Forest (RF) and Gradient Boosting (GB)—to model the relationships between energy commodity prices, industrial wood prices, and the prices of wood processing residues. Although RF and GB are not classical time series models and do not inherently learn temporal dependencies (such as seasonality or autoregression), they can be effectively used in time series analysis provided that the input data is appropriately structured—for example, by introducing lag features. In our case, we incorporated such transformations, which enabled the models to capture time dynamics within a nonlinear framework.
RF and GB models are well suited for identifying complex, nonlinear relationships and variable interactions, making them powerful tools for exploratory analysis in commodity markets. Additionally, we employed interpretability metrics—such as feature importance analysis in RF and SHAP (SHapley Additive exPlanations) values in GB—which allowed us to identify the key determinants shaping the prices of wood industry by-products. Notably, SHAP values offer both global and local model interpretability, enabling the assessment of variable influence not only in general terms but also at specific time points or under particular market scenarios.
The Random Forest algorithm has been widely used in various applications, including estimating poverty levels or wheat biomass yield [45,46]. RF has also been successfully applied in forecasting precious metal prices [47] and Japan’s gross domestic product (GDP) [48]. Within the RF framework, careful tuning of the number of decision trees and split functions can reduce model complexity and enhance computational efficiency, resulting in an improved integrated classifier.
Classical XGBoost models have been used to forecast crude oil prices [49] and corporate sales performance [50]. Classification and regression trees (CARTs) have been applied to predict exchange rate movements [51]. To evaluate seasonal effects, trends, and autocorrelation in price series, classical time series models such as ARIMA, SARIMA, and Prophet are also commonly employed.
The prices of wood industry by-products are shaped by the interaction of numerous variables, most notably the prices of complementary and substitute goods. They are also influenced by global market trends, EU regulatory frameworks promoting renewable energy sources (RESs)—including subsidy and incentive systems—geopolitical factors (such as the war in Ukraine), local production conditions, and other externalities. In recent years, prices of energy carriers, particularly fossil fuels, have experienced significant volatility and upward pressure, largely due to decarbonization policies and rising carbon emission allowance prices under the EU Emissions Trading System (EU ETS). These price shifts have been further exacerbated by geopolitical tensions and supply chain disruptions caused by the COVID-19 pandemic and the war in Ukraine. There is evidence that the prices of wood industry by-products have been subject to competing pressures from both the wood processing and energy sectors, which vie for access to these resources.
In Poland, research on by-products of the wood processing industry has primarily focused on production potential, supply, end-use directions, and supply chains [52,53,54]. Few studies have addressed the economic analysis of these by-products. Economic and technical issues related to the use of biomass in co-firing processes within the energy sector were examined by Piwowar et al. [55]. Wanat et al. [56] presented a valuation method for sawmill residues, considering their processing into briquettes, pellets, or energy. This approach enables a multidimensional profitability assessment of different wood waste utilization strategies. Izdebski et al. [57] analyzed the economic viability of ethanol production strategies in Poland based on various lignocellulosic sources. The prices of wood by-products (wood chips) were studied by Čermák et al. [58], who, in their 2013–2019 analysis, demonstrated a significant correlation between moisture content, calorific value, and chip prices. The authors found that lower moisture content was associated with a higher calorific value and unit price. Górna et al. [59] conducted price forecasting for wood processing by-products in Poland. Their study applied the ARIMA model and the multiplicative Winters–Holt model to forecast prices of sawdust, wood chips, and bark, and used the Diebold–Mariano test to evaluate forecasting accuracy. It was shown that ARIMA was more effective for “stable” products, while the WH model yielded better results for products with fluctuating prices.
To date, studies conducted in Poland have not explicitly focused on seasonality analysis or on identifying the causal factors driving price variability in wood industry by-products, leaving a notable gap in the literature. An important question that remains unexplored is the extent to which these prices are influenced by macroeconomic factors such as roundwood prices (for industrial processing) versus fossil fuel prices (coal and natural gas), which remain the dominant energy carriers in Poland. A novel aspect of the present study is the application of machine learning models based on decision trees—Random Forest (RF) and Gradient Boosting (GB)—with particular emphasis on interpretability metrics, such as variable importance analysis in RF and SHAP values, to identify the key determinants shaping the prices of wood industry by-products in Poland. These relationships have been underexplored in prior research.
The objective of this study was to analyze selected factors influencing the price formation of wood industry by-products in Poland. The study comprised (1) an analysis of price levels and their seasonality, and (2) an assessment of the significance of economic variables—such as energy commodity prices (natural gas and coal) and industrial wood prices—for the formation of wood by-product prices. The applied methodology enabled the identification of key biomass price determinants and allowed for an evaluation of the extent to which fluctuations in fossil fuel and industrial wood prices may have driven increased interest in biomass as an alternative energy source.

Potential Sources of Energy and Bioenergy in Poland

Poland’s heat production is the most coal-dependent among European countries. Thermal energy for heating and industrial purposes is primarily generated from conventional energy sources, including hard coal, lignite (14.5 million tons), heating oil (mazut), natural gas, biomass, and municipal waste. Renewable energy sources (RESs)—such as heat pumps, solar panels, and geothermal systems—currently play only a marginal role.
In Poland, district heating is commonly provided by combined heat and power (CHP) plants or heating plants that supply large urban populations. Poland ranks as the second-largest district heating market in the European Union, with a total district heating network length of 21,701 km, accounting for one-fourth of the country’s total heat supply.
Fuel consumption for heat production in cogeneration in 2022 was as follows: hard coal (186,548,701 GJ) and lignite (4,047,859.81 GJ), together accounting for approximately 61% of the fuel mix. Biomass also played a significant role (47,837,825.05 GJ; 15.2%), followed by natural gas (27,598,345.08 GJ; 8.76%). Other fuels, including heating oil, accounted for 8.56%, with the remainder attributed to miscellaneous sources [60].
The cost of heat offered by district heating companies in Poland is closely linked to the type of fuel used in the production process. In 2022, heat prices increased by 34.4% compared to 2021. The largest increases were observed for heat produced from natural gas (38%) and coal (35%), while heat from biomass increased by 23%. At the same time, the unit cost of fuels used for heat production rose sharply: coal prices increased by 83%, natural gas by 164%, biomass by 189%, and other fuels by 236% compared to the previous year [60].
In recent years, Poland has processed approximately 40 million m3 of wood annually [61], with the primary supplier being the State Forests National Forest Holding (SF NFH) (Figure 1).
The species composition of Polish forests is dominated by coniferous trees, with pine being the most common and widely processed species, accounting for over 61% of the total wood volume. Other significant species include spruce (5.6%), fir (4.4%), beech (6.9%), oak (6.6%), and birch (4.7%), while all other species collectively represent 10.8% of the total volume [61]. On the primary timber market, several assortments are available that may be allocated for energy purposes [62]. These include the following: S2 AP—medium-sized general-purpose firewood, M2 ZE—wood residues in chip form, M2 BE—wood residues in bale form, M2—small-diameter fuelwood, and S4—firewood. In 2023, the assortments M2 ZE, S2 AP, M2, and S4 jointly accounted for approximately 20% of the total wood volume sold by the State Forests National Forest Holding (approx. 40 million m3), with S4 being the dominant category, mostly directed toward the retail market.
In addition to domestic supply, Poland also imports wood. In 2023, 4.2 million m3 of wood was imported, of which 43% was firewood and 57% was roundwood, while exports amounted to 2.2 million m3. Biomass, particularly wood pellets, is also imported from international markets, including the United States, Canada, and Belarus. In 2023, the European Union imported a total of 4.89 million metric tons (MMTs) of wood pellets, valued at USD 1.32 billion, with more than 50% originating from the United States [63].
The significant volume of annually generated wood residues, combined with the classification of wood as a strategic resource in Poland [24], underscores the importance of rational resource management. It is estimated that around 8.0 million m3 of industrial wood residues is generated annually. Approximately 40% of the wood processed in Poland each year is potentially suitable for energy use [64]. The sawmilling industry processes roughly 25 million m3 of wood annually, with by-products accounting for about 30% of the volume, including approximately 18% in the form of wood chips, 8% sawdust, and 8% bark [64].
Forest and industrial wood residues—including sawdust, chips, offcuts, and trimmings—referred to as “clean” wood waste, are widely used in European countries (including Poland) as a feedstock for engineered wood products, primarily particleboard and fiberboard [23]. It is estimated that about 6.4 million m3, or 87% of total clean industrial residues in Poland, is utilized for material and energy purposes, primarily by wood processing plants [23].
The supply of post-consumer recovered wood is estimated at approximately 5.3 million m3. Additionally, residues from forestry operations (non-industrial) and agricultural plantations amount to around 3.8 million m3 and 0.4 million m3, respectively. Consequently, Poland generates approximately 18 million m3 of wood waste annually, varying in origin, form, and physical properties. A growing trend has emerged in Europe toward both material use (39%) and energy recovery (34%) of post-consumer wood waste. Material recycling is primarily applied to so-called “clean” residues [65].

2. Materials and Methods

2.1. Data Sources

The dataset comprised monthly price data for the following categories:
Fossil fuels—hard coal (for the heating sector): This reflects the PSCMI2 index for energy-grade coal fines (class 23-26/08) sold to industrial and municipal heating plants, other industrial consumers, and domestic buyers. The price is reported on a “loco mine” basis—i.e., prior to transport from the mine and excluding excise tax, insurance, and delivery costs. It represents the volume-weighted average of all transactions invoiced on the Polish thermal coal market within a given calendar month [66].
Fossil fuels—natural gas: This is based on the PPEgasDA index, which reflects the volume-weighted average price of all gas delivery transactions concluded for the following gas day. The transactions are executed on the Day-Ahead Gas Market (Next Day Market (NDMg)) of the Polish Power Exchange (The Polish Power Exchange (PPE)) [66].
Prices of roundwood (W0) and firewood (S4) were obtained from the Forest Data Information System (FDIS) of the State Forests National Forest Holding (SF NFH).
Prices of wood industry by-products (wood chips, including pulpwood chips, sawmill chips, sawdust, and bark) were compiled from multiple sources, including the trade journal Biomasa [67], market research conducted among wood industry enterprises in Poland, and publications from the Central Statistical Office of Poland and SF NFH [68,69,70,71,72,73,74,75,76]. The data obtained from industry journals were compared with information derived from other literature sources [59] as well as confidential data provided by leading enterprises in the Polish wood industry. This triangulation enabled the identification of data consistent with the aggregated values reported by the Central Statistical Office of Poland and the State Forests National Forest Holding (SF NFH). The classification of product structure was considered the most reliable reference and served as the basis for determining the prices of by-products (wood chips, including pulpwood chips, sawmill chips, sawdust, and bark).
The study utilized arithmetically averaged prices derived from data published in an industry journal, supplemented by mean values confirmed through interviews—conducted under confidentiality agreements with representatives of the ten largest wood industry enterprises in Poland (these companies account for approximately 20% of the national timber processing volume, making them a significant and representative sample for modeling macroeconomic relationships). The market analysis was conducted through direct interviews mainly with representatives of sawmills in Poland, accounting for approximately 20% of the domestic demand for wood processing [77]. The resulting data were compared with statistical information recognized in the literature as a validated and valuable reference for the pricing of wood by-products.

2.2. Methods

Monthly price data of wood industry by-products for the period of October 2017–January 2025 were analyzed. The dataset was divided into two distinct periods: (1) a phase of moderate price dynamics (October 2017–August 2021), and (2) a phase of intense price increases (September 2021–January 2025). This temporal decomposition was based on a noticeable shift in price levels following the third quarter of 2021. To analyze seasonality and price volatility, spiral plots (i.e., polar diagrams) were employed, which enable the visualization of recurring monthly patterns and their intensity over time. The conducted analysis revealed significant differences between the identified periods in terms of average price levels.
The analysis compared the performance of two tree-based regression models—Random Forest (RF) and CatBoost (CB)—in forecasting the dependent variable, which was the price of wood industry by-products (biomass).
The dependent variable was defined as the average price of three types of wood-based residues: pulpwood chips, sawmill chips, and sawdust/shavings. Despite observable differences in price levels and volatility among these materials, the averaging approach was considered justified due to their shared industrial and energy-related applications, as well as the need to stabilize the time series in light of the limited number of observations. The use of a synthetic price indicator also enables a clearer assessment of the influence of global macroeconomic and energy-related variables on the wood by-product markets. Data sources were harmonized and shared a common monthly frequency, consistent with the observation interval of the dependent variable (biomass price). Data transformed into a tabular format, in which each month was assigned the corresponding values of the relevant eco-nomic indicators. The dataset was then processed into a unified time series structure with monthly resolution, with the following layout: one observation = one month = one vector of input features.

2.2.1. CatBoost and Random Forest for Time Series Forecasting

Both algorithms belong to the family of decision tree methods and are primarily used for regression and classification tasks. The key difference between them lies in their structure and learning strategies. Random Forest is based on the principle of bagging (bootstrap aggregating), in which multiple independent decision trees are constructed using random subsets of data and features, and their predictions are aggregated (via averaging or majority voting). This approach reduces model variance and enhances resistance to overfitting. In contrast, CatBoost implements gradient boosting, in which trees are built sequentially, with each new tree trained to correct the errors of its predecessors by minimizing a loss function using gradient information. A distinctive feature of CatBoost is the application of so-called ordered boosting, which mitigates overfitting, particularly in the case of small datasets.
To analyze the temporal influence of explanatory variables on biomass prices, both previously described models—CatBoost (CB) and Random Forest (RF)—were applied, incorporating the specific characteristics of time series data [78,79,80]. This approach enabled not only accurate forecasting of biomass prices, but also laid the foundation for subsequent feature importance analysis using SHAP (SHapley Additive exPlanations) values, which allow for the interpretation of each variable’s contribution to model predictions [81,82].
To account for delayed effects of energy-related variables, different lag values—1, 3, and 6 months—were tested for each input variable. Based on model performance metrics, the lag configurations yielding the highest predictive accuracy were selected. The dependent variable was the price of wood industry by-products in Poland, calculated as the average price of sawmill and pulpwood chips and sawdust/shavings (bark prices were excluded due to their predominant use in the horticultural sector).
To capture the delayed macroeconomic and energy-related effects on biomass prices, the regression models included lagged values of the explanatory variables at 1-, 3-, and 6-month intervals. The selection of these specific lag periods was informed by both substantive reasoning and empirical testing.
From a market dynamics perspective, the response of biomass prices to changes in economic conditions (e.g., natural gas, oil, and electricity prices, as well as inflation) is not immediate. Processes such as adjustments in the energy mix, contract renegotiations, and shifts in demand from the energy sector typically unfold gradually and with some inertia. Therefore, it was assumed that relevant predictive signals may emerge with a temporal delay of several months. A 1-month lag captures short-term market reactions, the 3-month lag reflects typical quarterly economic cycles, and the 6-month lag was introduced as potentially indicative of medium-term trends in energy policy and bulk procurement decisions.
The lag structure was further supported by preliminary correlation and partial autocorrelation (PACF) analyses, which indicated statistically significant dependencies within these time intervals. This approach enabled more accurate modeling of delayed causal relationships and improved the predictive performance of the regression models. The independent variables included the following: the price of coal for heating purposes, the price of natural gas, and the price of industrial roundwood. The variable “S4 wood price” was found to have no significant impact on model performance and was therefore excluded from the dataset. The input data were structured as a time series, in which explanatory variables incorporated experimentally selected lags: coal prices (6-month lag), natural gas prices (6-month lag), and industrial roundwood prices (3-month lag). These selected lags effectively captured temporal dependencies between the predictors and the target variable (biomass price).

2.2.2. General Form of the Model

Let ( y t ^ ) denote the predicted value of the dependent variable (biomass price) at time t, and let X(1) represent i-th explanatory variable (e.g., the price of coal, natural gas, or industrial roundwood). The general form of the time series regression model can be expressed as follows:
y t ^ = f X t l 1 1 , X t l 2 2 , , X t l n n
where:
  • y t ^ —the predicted value of the dependent variable at time t;
  • X t l j j —the value of the j j-th explanatory variable with a time lag of lj;
  • N—the number of explanatory variables;
  • lj N —the selected time lag for variable Xn, determined empirically.
In the context of our model, the tested lag values were lj 1 , 3 , 6 .

2.2.3. Model Performance Metrics

Stratified 10-fold cross-validation was used to validate the models.
To evaluate the predictive accuracy of the models, four key error and goodness-of-fit metrics were used:
Mean Absolute Error (MAE):
MAE = (1/n) ∑ᵢ |yᵢ − ŷᵢ|
Root Mean Squared Error (RMSE):
RMSE   =   ( 1 / n ) i ( y ŷ ) 2
Mean Absolute Percentage Error (MAPE):
MAPE = (100%/n) ∑ᵢ|(yᵢ − ŷᵢ)/yᵢ|
Coefficient of Determination (R2):
R2 = 1 − [∑ᵢ (yᵢ − ŷᵢ)2/∑ᵢ (yᵢ − ȳ)2]
where:
  • n—number of observations;
  • yᵢ—observed value;
  • ŷᵢ—value predicted by the model.

2.2.4. CatBoost Model—Hyperparameters

The CatBoost model was optimized using the following set of hyperparameters, selected to balance predictive accuracy and computational efficiency:
  • Number of trees: 100;
  • Learning rate: 0.3;
  • Maximum tree depth: 6;
  • Regularization strength: 3;
  • Feature fraction: 1 (all features used for each tree);
  • Training reproducibility: Enabled—a fixed random seed or deterministic settings were applied.
The hyperparameters of the CatBoost model were selected empirically based on preliminary test runs aimed at optimizing predictive performance while avoiding overfitting. The relatively high learning rate (0.3), combined with a modest number of trees (100), ensured rapid convergence and stable performance in terms of MAE and R2. Although no full grid search or Bayesian optimization was conducted due to the limited sample size, the chosen configuration consistently provided the best results among the tested alternatives. To further control model complexity, the maximum tree depth was restricted to 6, allowing the model to capture relevant nonlinear relationships without excessive risk of overfitting. Additionally, a regularization strength of 3 was applied to penalize overly complex tree structures, further enhancing generalization [77,78]. The small differences between training and validation errors and the stability of residual distributions confirm the robustness of this parameter setup.

2.2.5. Random Forest Model—Hyperparameters

In the configuration used in this study, the Random Forest model consisted of 10 decision trees. No restrictions were imposed on the maximum depth of the trees or the number of features considered at each split. This setup allowed each tree to freely develop a structure tailored to the data, increasing model flexibility at the cost of a potential risk of overfitting. Additionally, a minimum of 5 samples per leaf node was enforced to prevent overly granular splits, introducing a form of regularization [80].

2.2.6. Analysis of Feature Contributions Using SHAP

To evaluate the influence of individual explanatory variables on the decisions made by the regression models, a method based on Shapley values from cooperative game theory was employed. This approach enables the interpretability of “black-box” models such as CatBoost (CB) and Random Forest (RF) by attributing to each input variable its contribution to the final prediction value for each observed instance.
SHAP values were computed for all instances in the dataset, allowing for the assessment of both the average impact of each feature on the model’s output and the variability of that impact depending on the feature’s value. Visualization of the results through SHAP summary plots (in terms of R2 and MAE) and dependence plots further enabled the identification of the direction of influence—i.e., whether an increase in a given variable resulted in a higher or lower predicted biomass price [81,82].
Insights obtained from the SHAP-based interpretation were subsequently used to better understand the nature of the modeled relationships and to evaluate the model’s consistency with expert knowledge of the energy commodities market.
The SHAP value for feature j is defined as follows:
φ j = S     N \ j S !   p S 1 ! p !   f S     j     f S
where:
  • φⱼ—SHAP value for feature j;
  • N—the set of all features;
  • S—a subset of features not including feature j;
  • p—the total number of features;
  • f(S)—the model prediction using only the features in subset S;
  • f(S ∪ {j})—the model prediction after adding feature j to subset S.

3. Results

3.1. Analysis of Volatility and Price Seasonality Wood Industry By-Products

In the period under review, the highest prices were those of pulpwood chips (223 PLN/m3) and sawdust, with an average value of 199 PLN/m3. The highest maximum prices were those of sawdust (550 PLN/m3). Within biomass, the highest variability was observed in sawdust prices (51%) throughout the period under review (Table 1).

3.1.1. Seasonality of Pulpwood Chips’ Prices

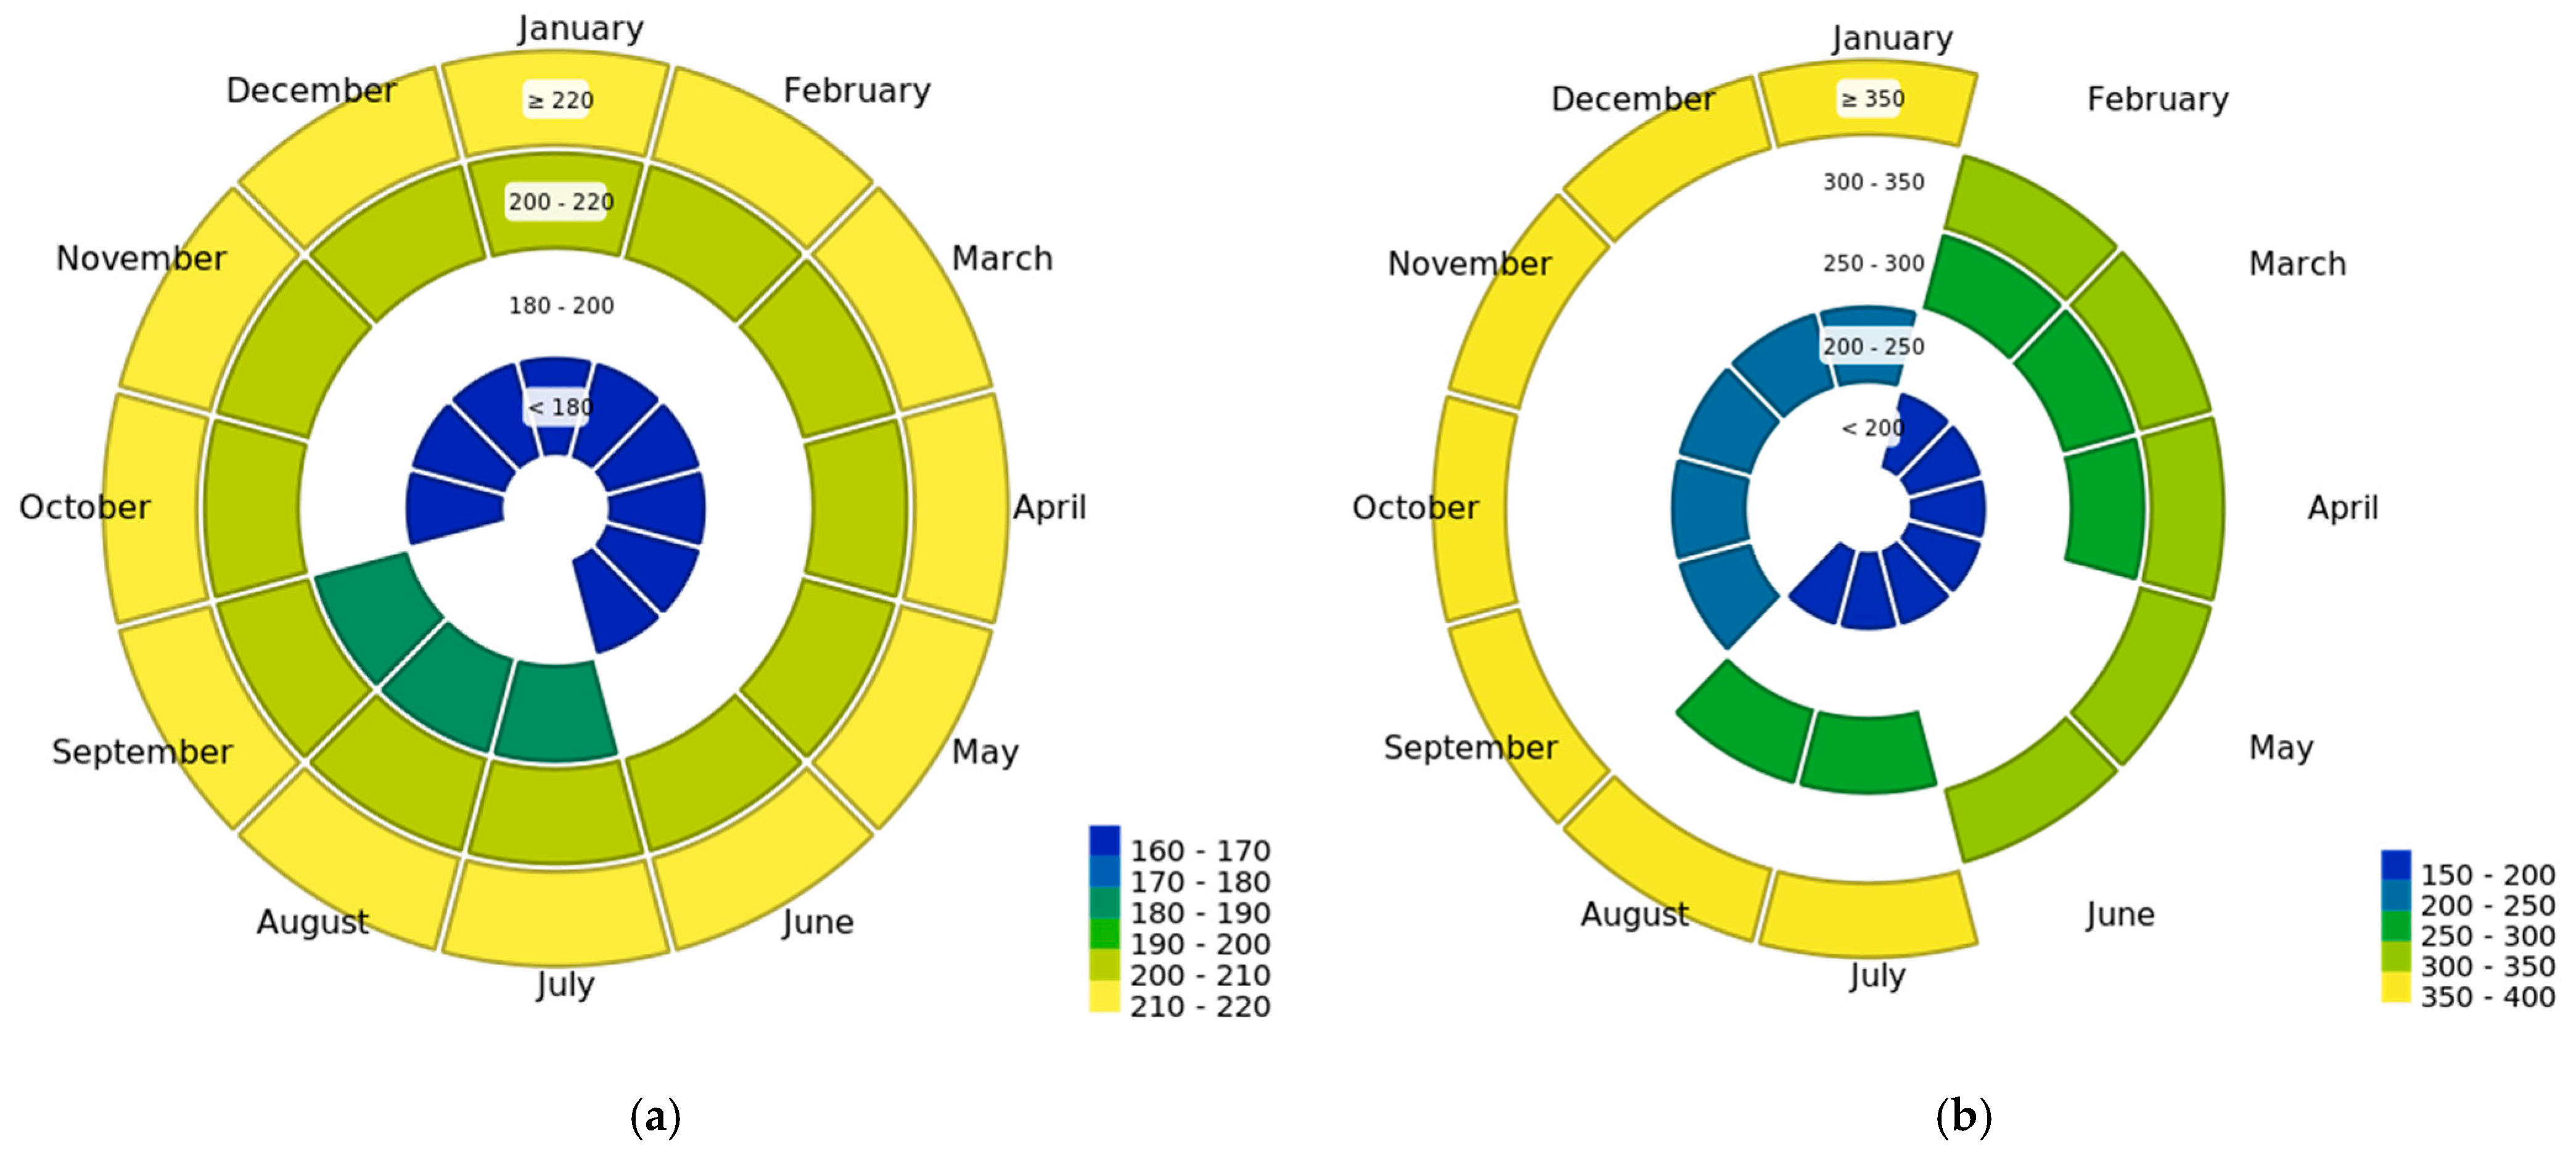
During the period from October 2017 to August 2021, the lowest prices (PLN 160–170) for the sale of pulpwood chips were recorded in January, February, and March (indicated by blue segments). The color scale—from blue (lowest prices) to yellow (highest prices)—visualizes seasonal changes and the gradual increase in prices throughout the annual cycle. A steady price rise was observed from March to May, followed by peak values in June, July, and August (210–220 PLN/m3). In September, the prices began to decline, stabilizing in November and December within the range of 200–210 PLN/m3. The second period (September 2021–January 2025) was characterized by greater price volatility. The lowest prices (150–200 PLN/m3) were again observed in January through March (blue segments). However, from March onward, the price increase was more pronounced compared to the first period. A sharp rise occurred in the summer months (June to August), with prices reaching 350–400 PLN/m3. After the summer, prices remained at higher levels than in the first period (250–300 PLN/m3), without returning to previous lows. This second period demonstrated both a substantial price increase (up to 400 PLN/m3) and greater volatility. Notably, during the autumn and winter months, prices did not return to the low levels observed in the earlier period, indicating a sustained upward trend in pulpwood chip prices in Poland (Figure 2).

3.1.2. Seasonality of Sawmill Chips’ Prices

During the first period, the lowest prices for sawmill chips (130–145 PLN/m3) were recorded in January, February, March, and October (marked in blue segments). A gradual price rise was observed from March through May, with peak values reached in June, July, and August (165–170 PLN/m3). From September onward, the prices declined and stabilized in November and December at PLN 155–165. In the second period, the lowest prices (150–200 PLN/m3) were again observed in January–March (blue segments). During June–August, the prices surged to PLN 350–400 and afterwards remained at elevated levels of PLN 250–300. Overall, the second period showed a significant increase: the maximum price reached 165–170 PLN/m3 in the first period versus 350–400 PLN/m3 in the second. Moreover, after the summer peak, prices stayed higher (250–300 PLN/m3), suggesting a continued upward trend (Figure 3).

3.1.3. Seasonality of Sawdust Prices

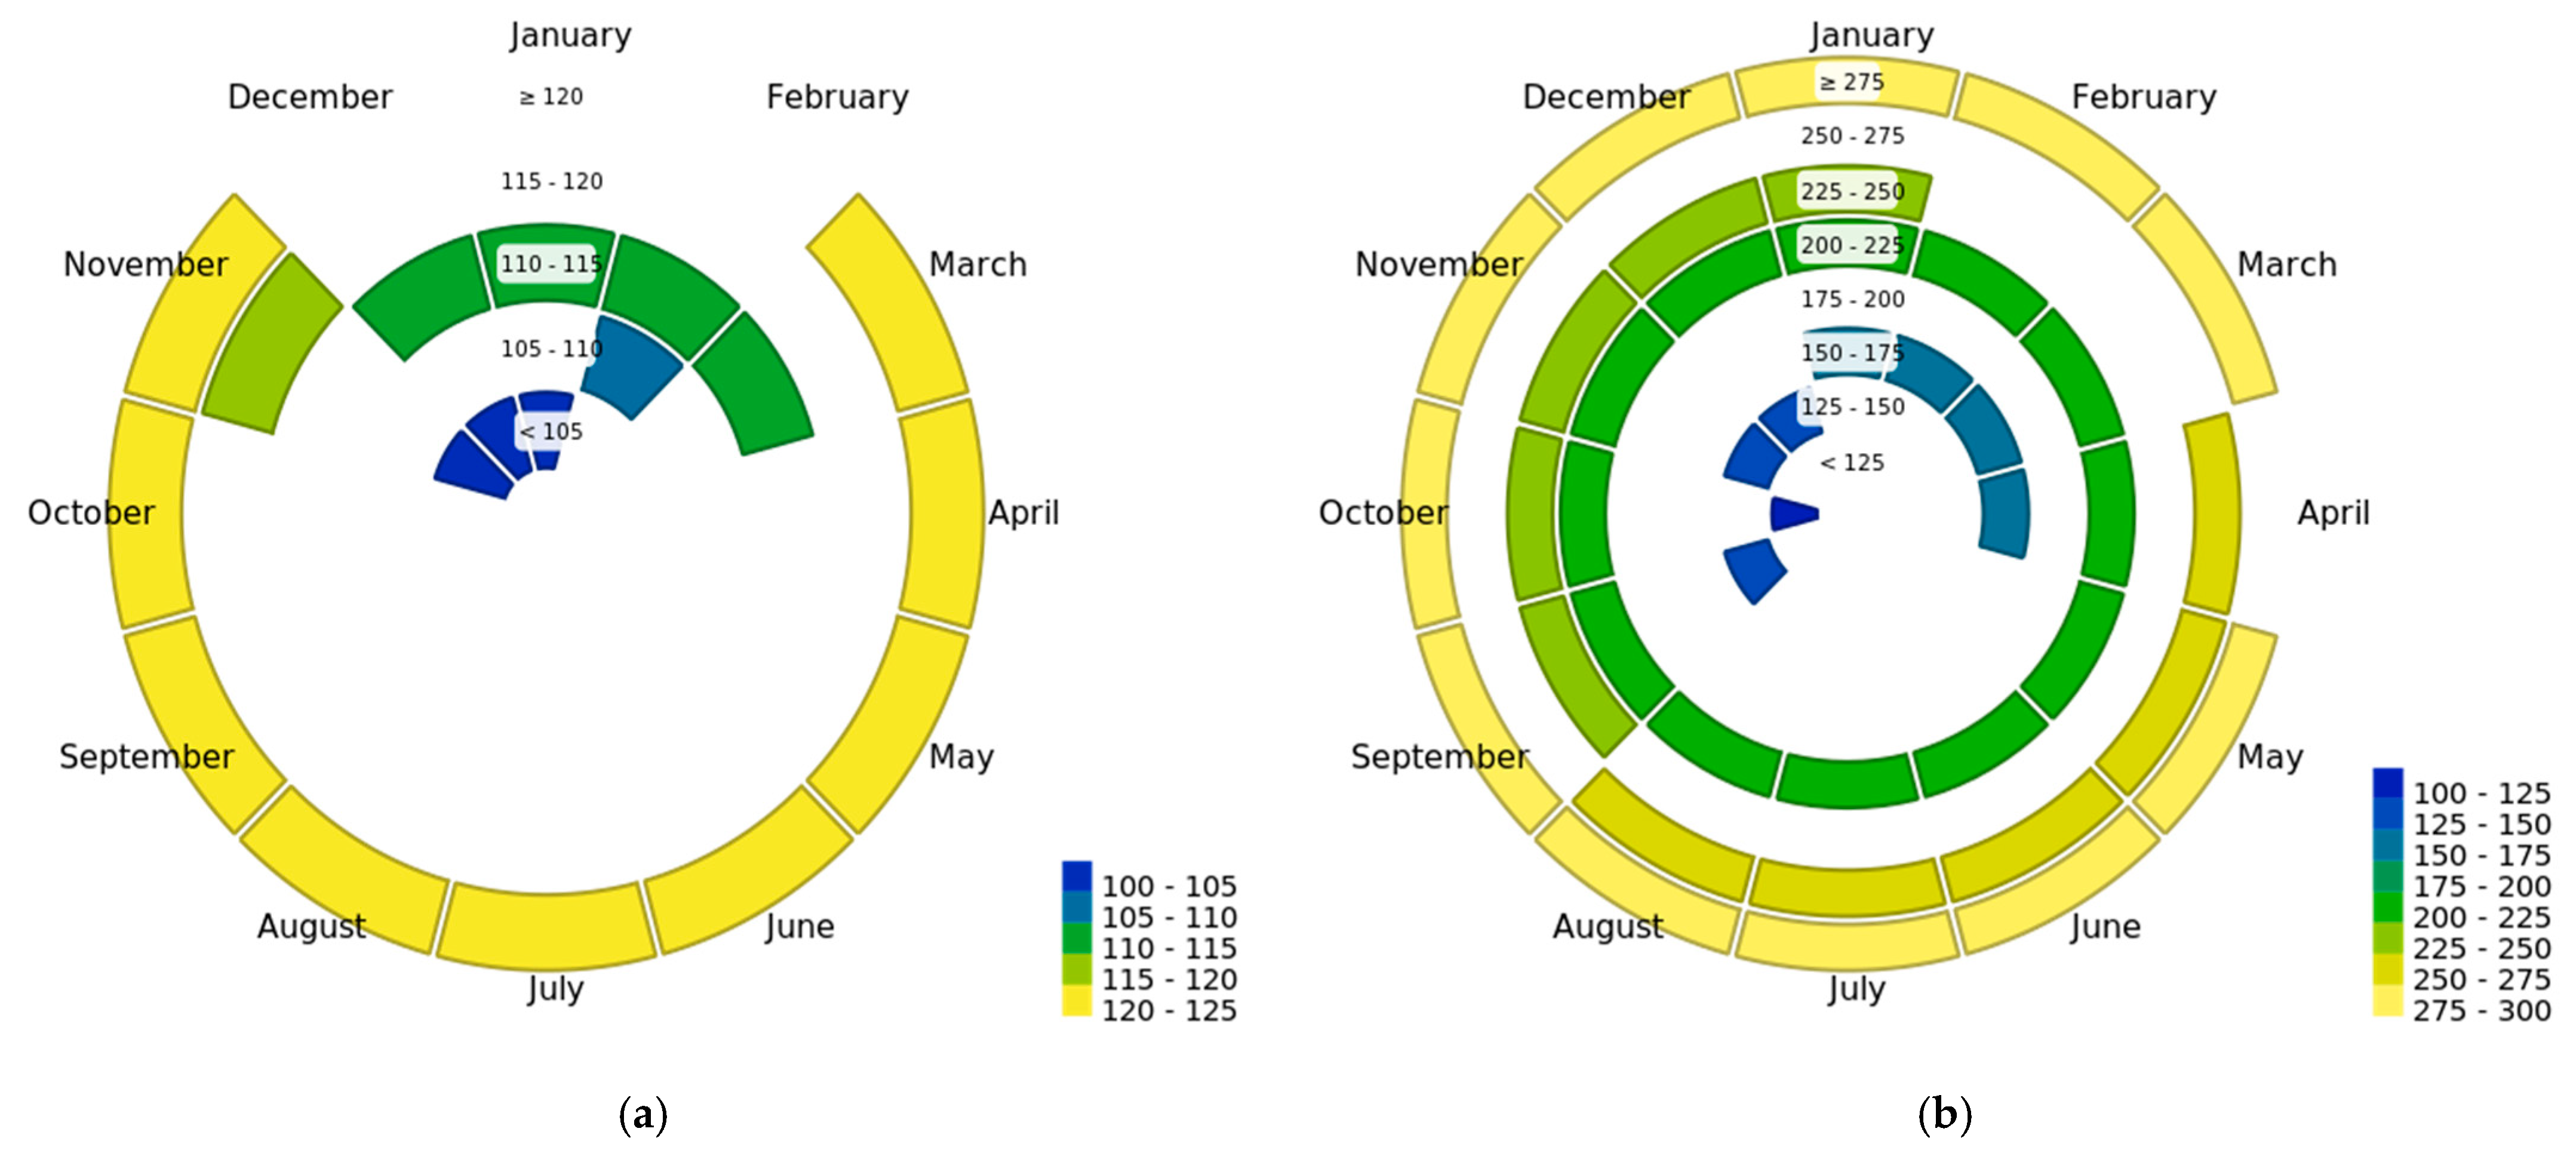
During the first period, the lowest sawdust prices (100–110 PLN/m3) were observed in January, February, and March (blue segments). A gradual price increase followed from March through May, with peak levels of 150–160 PLN/m3 achieved in June–August. Prices then declined and stabilized from September to November. In the second period, prices were significantly higher, reaching 150–200 PLN/m3 in January–March, and exhibited greater price volatility than in the first period. June through August saw prices surge to 500–550 PLN/m3, after which they declined to the 300–400 PLN/m3 range, without reverting to previous lows—remaining nearly double the earlier levels. Price fluctuations during the second period were considerably more pronounced (a maximum difference of 400 PLN/m3), indicating a highly volatile market (Figure 4).

3.1.4. Seasonality of Bark Prices

In both observed periods, the seasonality of bark prices followed a similar annual cycle, with the lowest prices occurring during the winter months (January–February and February–March), and the highest during the summer months (June–August). In the second period, prices were higher overall (ranging from 105 to 295 PLN/m3), particularly in the summer—approximately 170 PLN/m3 higher on average compared to the first period. Additionally, the second period displayed larger price amplitudes and greater fluctuations during the spring and summer months (March–May), indicating heightened market volatility relative to the first period (Figure 5).

3.2. Analysis of the Relationship Between Prices of Wood-Industry By-Products and the Prices of Fossil Fuels and Industrial Processing Timber

The impact of fossil fuel prices (coal and natural gas), as well as industrial timber prices, on wood biomass (wood industry by-product) prices was assessed. To this end, regression-based machine learning models—CatBoost (CB) and Random Forest (RF)—were employed. These models were used to forecast the average biomass price (biomass_av) based on historical input data: coal, natural gas, and industrial timber prices with time lags of 3 and 6 months. This approach enabled the estimation of nonlinear dependencies and the identification of delayed effects of energy-related variables on the biomass market.
To enhance the interpretability of the results, the SHAP (SHapley Additive exPlanations) method was applied, allowing for an evaluation of the contribution of individual features to each prediction. The analysis of SHAP values enabled the identification of the most influential variables in shaping biomass prices from a global perspective (i.e., across the entire dataset).
In the context of time series modeling, the CB model better captured nonlinear and lagged relationships among variables. This resulted in a higher coefficient of determination (R2) and lower prediction errors (MAE, MAPE, and RMSE) compared to the RF model (Table 2). The models for biomass pricing included the following: coal for heating (6-month lag), natural gas (6-month lag), and industrial timber (3-month lag). The CB model achieved an R2 of 0.901, explaining 90.1% of the variance in the data. In contrast, the RF model reached an R2 of 0.813—a weaker yet still robust result. The CB model also exhibited superior predictive performance with lower RMSE (23.648) and MAE (13.826) values (Table 2).
Overall, the CB model demonstrated a better fit and served as the basis for subsequent variable impact analysis. Although RF offers greater interpretability and a lower computational cost, CB proved more effective in modeling dynamic, time-dependent phenomena.
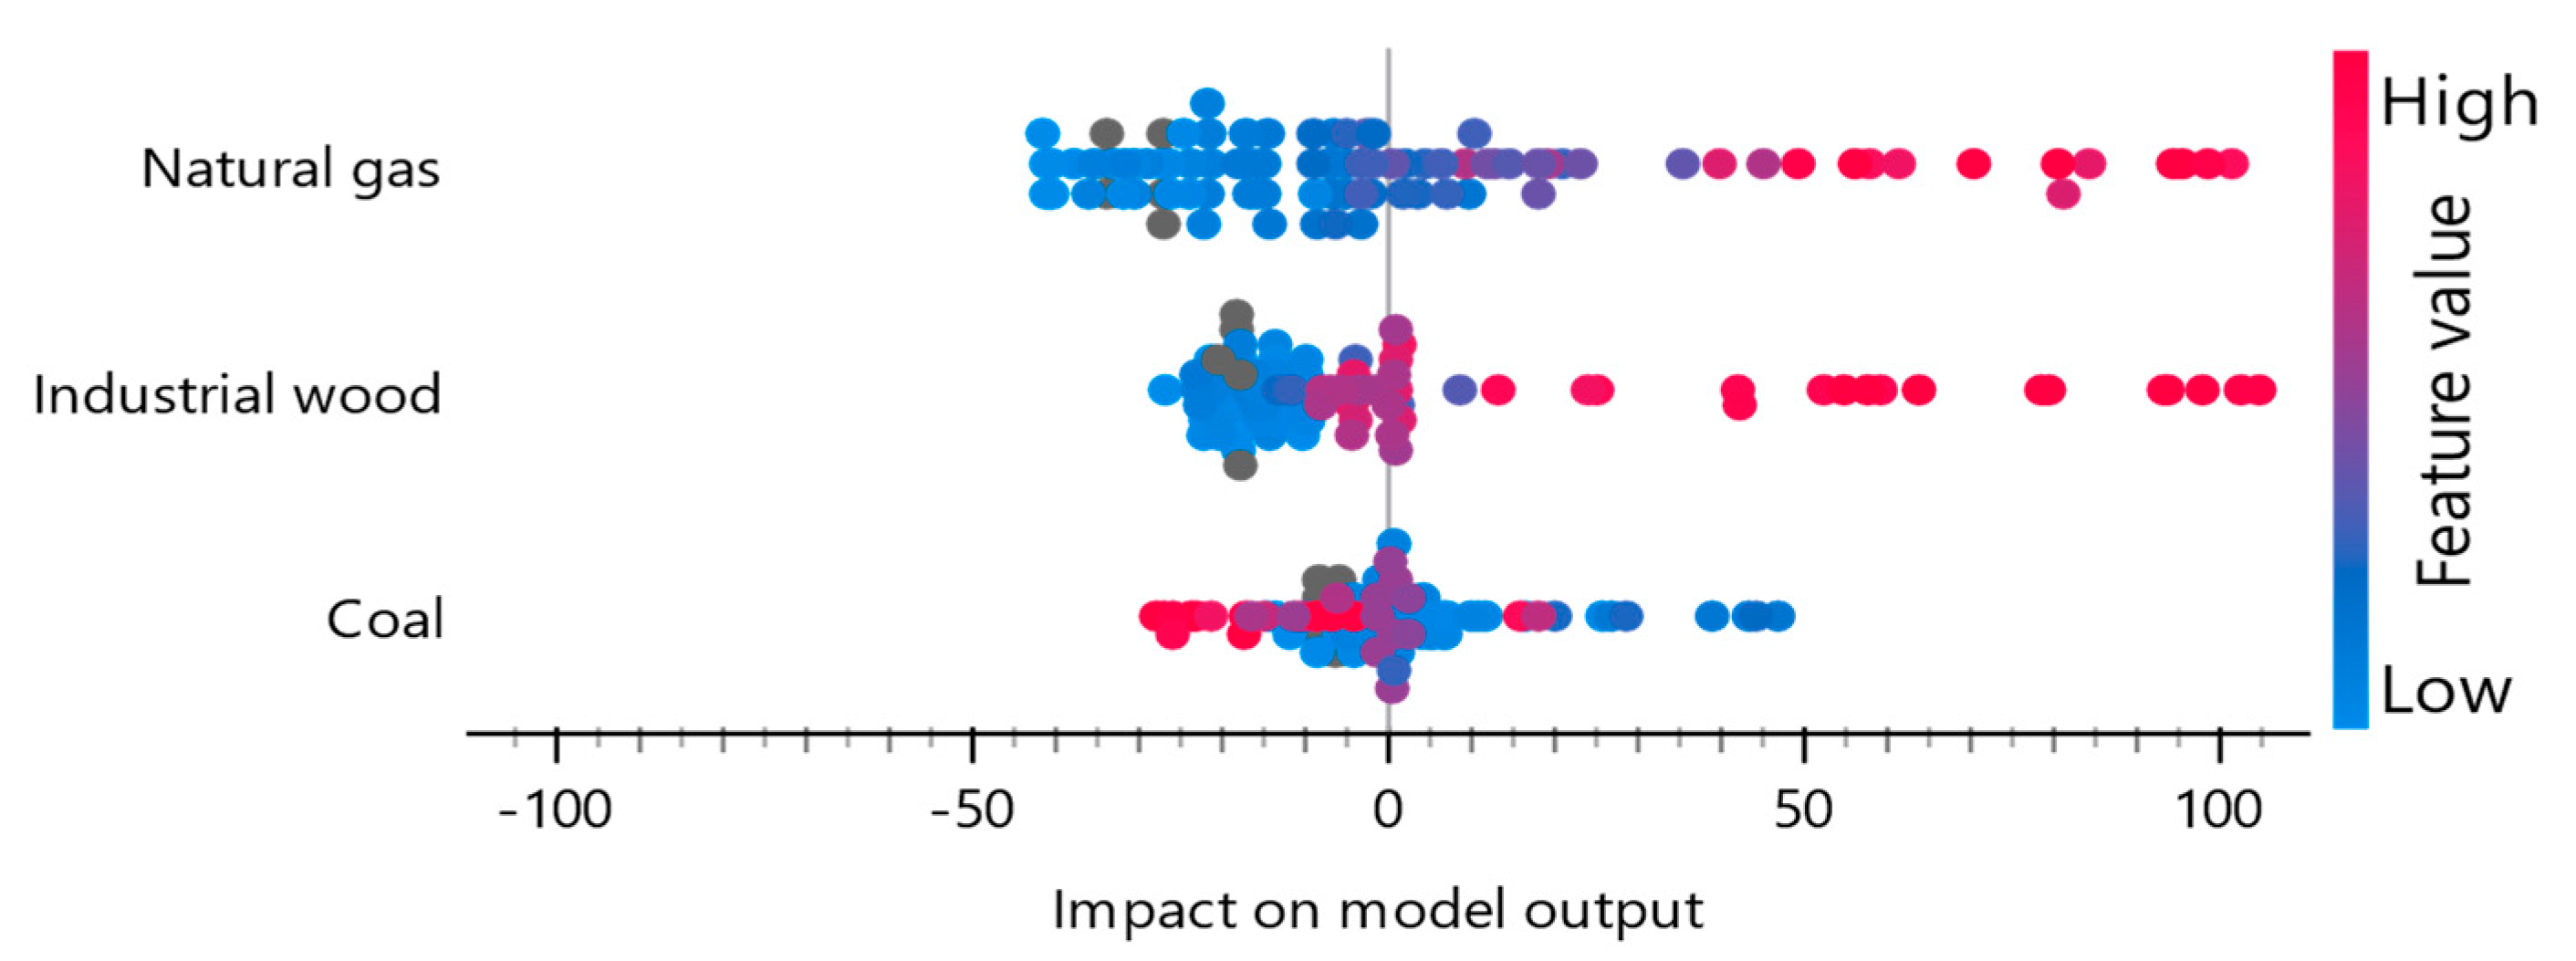
The feature importance analysis indicates that the natural gas price with a 6-month lag (Gas 6) has the most significant impact on the model’s performance, as evidenced by the largest decrease in R2 (approximately 0.75) upon its removal. This suggests that Gas 6 is the most influential variable. The price of industrial timber with a 3-month lag (Wood 3) is the second most important variable, with an R2 decrease of about 0.45. Conversely, the price of coal for heating with a 6-month lag (Coal 6) has a relatively minor effect, causing an R2 decrease of approximately 0.15. An SHAP (SHapley Additive exPlanations) analysis was employed to assess the contribution of each feature to the model’s predictions. The SHAP summary plot illustrates the influence of each feature on the model’s output across all observations. In this plot, the color of each point corresponds to the feature value (red indicating high values and blue indicating low values), and the horizontal axis represents the SHAP value, indicating the direction and magnitude of the feature’s impact on the prediction.
The analysis revealed that Gas 6 has a predominantly positive influence on biomass price predictions, with higher gas prices (indicated by the red points) often associated with higher predicted biomass prices. Wood 3 exhibited a more balanced effect, with both positive and negative SHAP values observed, although positive impacts were more prevalent. Coal 6 showed the least influence, primarily negative, with occasional positive effects (Figure 6).
These findings underscore the critical role of energy-related variables, particularly natural gas prices, in forecasting biomass prices. The application of an SHAP analysis provides a transparent and interpretable approach to understanding the model’s decision-making process, highlighting the importance of specific features in the predictive model.
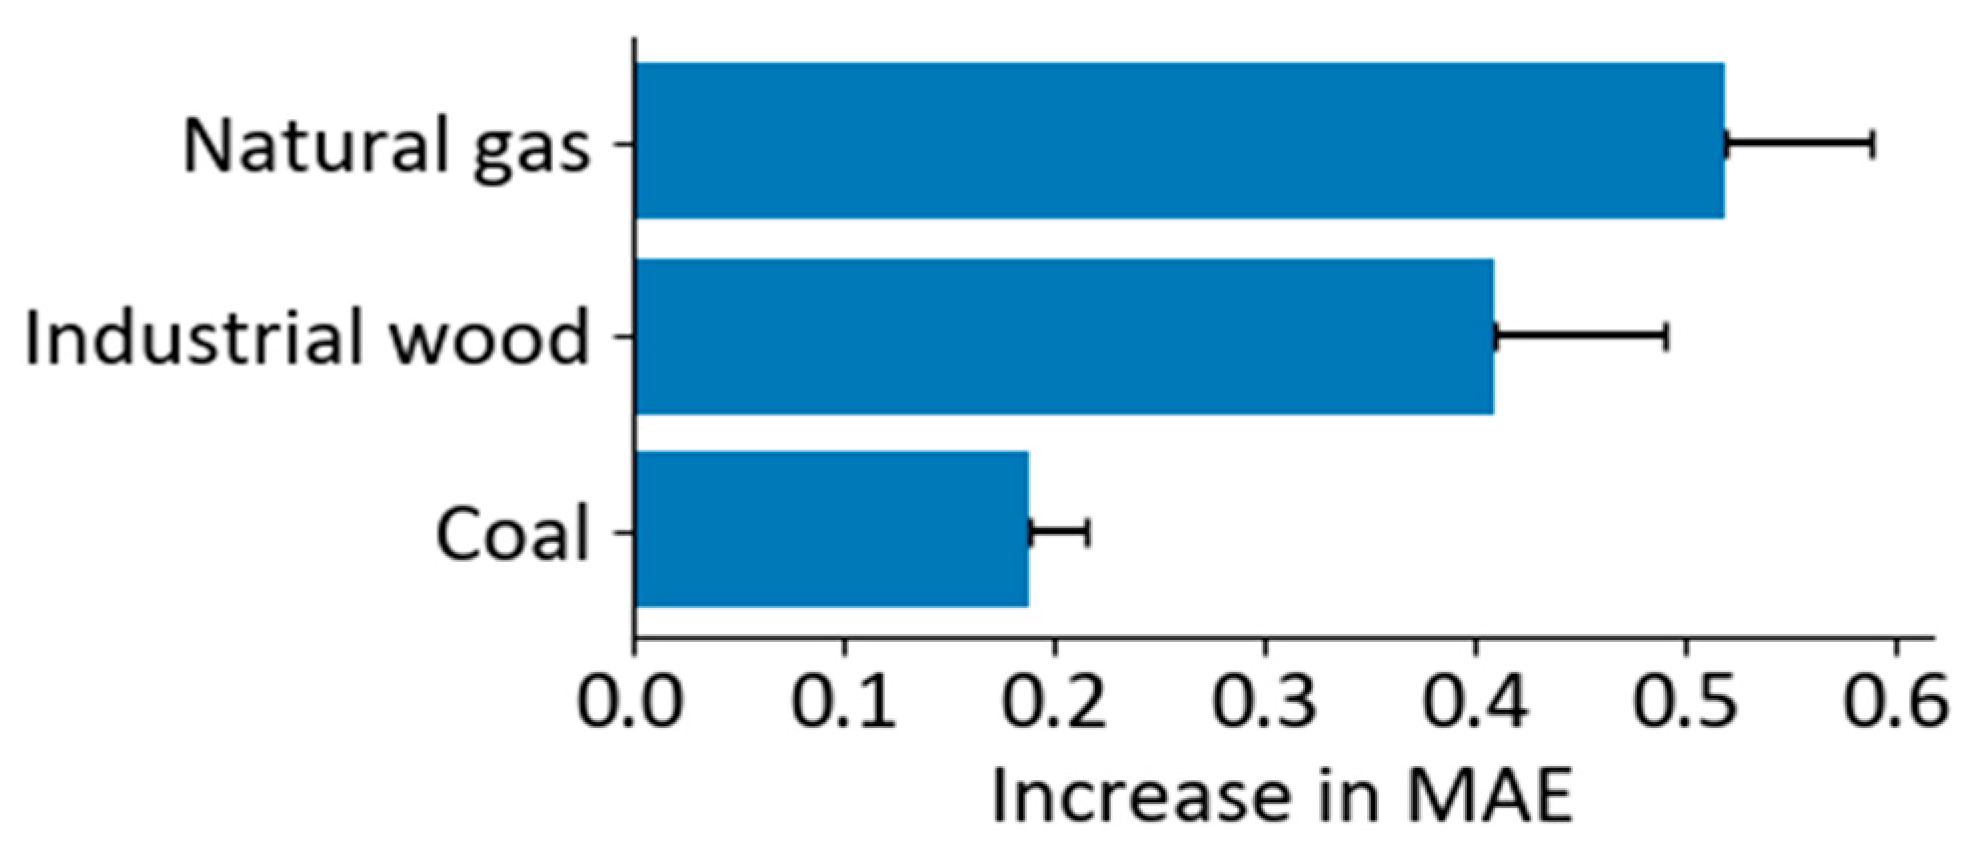
The figure illustrates the influence of individual variables on the predictive accuracy of the model, quantified by the increase in mean absolute error (MAE) upon the exclusion of each feature (Figure 7). The most critical variable identified was the natural gas price with a 6-month lag (Gas 6), whose removal led to the most substantial rise in MAE, underscoring its pivotal role in model accuracy. The industrial timber price with a 3-month lag (Wood 3) also significantly contributed to the model, though its impact was less pronounced than that of Gas 6. In contrast, the coal price for heating with a 6-month lag (Coal 6) exhibited the lowest effect on prediction error, indicating its marginal informational value within the dataset.
The feature importance analysis, based on the decrease in the coefficient of determination (R2), revealed that the removal of the variable “natural gas price (lag 6)” resulted in the most significant decline in R2, indicating its critical role in explaining biomass price variability (Figure 8). Conversely, the variable “coal price for heating (lag 6)” exhibited the lowest impact on R2, suggesting that six-month lagged coal prices provide limited information useful for analyzing and forecasting wood industry by-products.
Notably, the results obtained through various approaches—the SHAP analysis, MAE error change, and R2 decrease—were consistent, unequivocally highlighting the dominant role of natural gas price (lag 6) in the predictive model. This consistency across independent interpretative methods enhances the reliability of the conclusions regarding the significance of this variable.

4. Discussion

The global estimated annual potential of post-consumer forest residues amounts to 371 million dry tons, compared to 406 million dry tons of post-industrial residues from the wood industry [22]. From the total global wood biomass production, firewood (for energy purposes) constitutes approximately 23% [83]. In Poland, the potential supply level of post-industrial wood residues for processing and energy use can be estimated based on the volume of processed wood raw material (approximately 40 million m3 of wood is processed), but it is difficult to determine precisely due to their potentially multifaceted applications. Until recently, by-products of the wood industry (post-industrial biomass) were often treated as waste and made available free of charge to interested parties. Currently, within the context of the circular economy (CE) trend and shifting priorities over recent decades towards the sustainable management of wood industry by-products (sawdust, bark, and wood chips), these materials have become sought-after resources competing across various industrial sectors.
In recent years, new energy vehicles (NEVs) have played an increasingly important role in the transformation of the transport sector and in the growing demand for renewable energy sources [84,85]. Biomass, as a highly accessible energy source with strong integration potential into local energy systems, can serve a stabilizing function in this context. Studies indicate that the development of NEVs not only reshapes energy consumption profiles but also fosters the use of locally available renewable resources, including biomass particularly within circular economy frameworks and distributed energy systems [86,87,88]. Also, the integration of wood industry residues into biorefinery supply chains is gaining momentum across Europe [89]. The increasing demand for high-quality woody residues suitable for biochemical conversion is expected to raise their market value, reduce their availability for energy purposes, and contribute to greater price volatility—particularly in regions with limited biomass supply. Moreover, logistics and the mobilization of geographically dispersed feedstocks are likely to significantly influence biomass price dynamics [90,91].
Therefore, the analysis of supply and pricing of wood industry by-products, as well as their forecasting, holds significant importance, especially for producers and potential buyers in the pulp and paper, panel, and energy industries.
Prices reflect the annual demand for wood residues and their market value. The COVID-19 pandemic and subsequent recovery caused strong turbulence in the biomass market and beyond [92]. In Poland, significant fluctuations in biomass prices were observed from the second half of 2021 onwards, particularly between September 2021 and January 2025. All analyzed biomass types exhibited price increases during this period, with sawdust experiencing the most pronounced surge (a peak of 550 PLN/m3 compared to 160 PLN/m3 in the initial period). A distinctive feature of the prices of analyzed industrial residues is their strong seasonality, reflecting periodic price fluctuations depending on the season [93]. The lowest prices for wood industry by-products were recorded in winter (January–March), and the highest in the summer months (June–August). The most stable prices were noted for pine bark, which showed moderate price growth. Paper and sawmill wood chips followed similar trends, reaching peaks during summer. All biomass types displayed a similar seasonal pattern: low prices in the winter that increased in the spring, peaked in the summer (June–August), and declined in the autumn. Between September 2021 and January 2025, biomass price increases occurred earlier than prior to 2021 (April–May). Sawdust exhibited the most volatile price pattern, with the strongest increases during the second period and no return to lower price levels after the spring–summer peak, suggesting lasting market changes (rising biomass demand regardless of season).
It can be reasonably concluded that the seasonality of prices results from biomass availability, which increases during the processing season, and higher supply volumes stimulate price growth. Changes in the perception of wood industry by-products and growing demand from the energy sector stimulate prices. Therefore, both demand and supply sides strive for rational resource management, influenced by raw material storage capacities and the development of efficient supply chains. The results of wood industry by-product price studies can be utilized at the decision-making stage in purchasing and sales. They enable better inventory and warehouse space management within economic entities and maximize sales profit through supply chain optimization.
We verified the impact of the most popular fossil fuel prices in Poland, as well as industrial wood prices, on biomass prices. Using CatBoost (CB) and Random Forest (RF) regression models, the influence of fossil fuel prices and wood for industrial processing was assessed. The analyses demonstrated the higher effectiveness of the CB model, which more accurately captures nonlinear relationships between variables (R2 = 0.901). Additionally, the MAE, MAPE, and RMSE error metrics were more favorable (lower) compared to those obtained by the RF model. According to Friedman [94], Gradient Boosting Machine (GBM) algorithms, based on boosting principles, effectively reduce bias and variance in predictive models. These GBM characteristics are considered useful for addressing bias and variance issues in predictive modeling results, especially when machine learning algorithms are applied to small datasets [95].
Cha et al. [96] (2021) utilized RF and GBM in waste management and demolition waste generation forecasting. The applied models showed varying performance across different product types. GBM exhibited excellent predictive performance for roofing tiles and slates, whereas RF methods were superior for predictive models of bricks, glass, and ceramics. In our study, prices of wood industry by-products were averaged; future research should detail analyses for specific biomass types using larger datasets and longer time horizons.
Among the variables included in the CB model, natural gas prices lagged by six months (lag 6) were the most significant determinant of biomass price levels. An SHAP value analysis indicated that natural gas prices critically influenced the model’s ability to explain price variability in biomass. This suggests a dominant role of the energy sector in biomass demand and pricing. The high SHAP value for this variable is interpreted in light of a few interconnected phenomena. The prices of by-products from the wood processing industry, such as sawdust and wood chips, are influenced not only by seasonal fluctuations in energy demand but also by the instruments of the European Union’s climate policy. Abrell et al. [97] demonstrated that a carbon tax can serve as an effective regulatory tool for reducing CO2 emissions. Specifically, the rising prices of CO2 emission allowances (EUAs) within the EU Emissions Trading System (EU ETS) have contributed to increased demand for natural gas (a trend further reinforced by the post-COVID rebound in industrial production). However, the energy crisis in the EU triggered by the war in Ukraine, along with shifts in national strategies regarding natural gas import sources, led to a significant rise in gas prices. This, in turn, intensified interest in biomass as an alternative feedstock to natural gas, resulting in the substitution of fossil fuels in both the district heating and combined heat and power (CHP) sectors. The surge in fossil fuel prices, particularly those of natural gas, has stimulated the development of biomass-based CHP installations, thereby increasing demand for wood industry by-products. Furthermore, in industrial sectors, particularly within CHP plants, the response to changes in natural gas prices appears to be delayed, most likely due to contractual cycles and procurement procedures. This is consistent with the observed lag of approximately six months in price responsiveness.
Currently, natural gas in Europe is considered an alternative and transitional renewable energy source. Its significant share in the total gross available energy clearly indicates its importance for energy security in EU countries, including Poland [98]. It was established that between the first half of 2021 and the first half of 2022, EU gas prices rose on average by over 34%, with peaks up to 150%. Bohdan et al. [98] noted that Polish natural gas prices were significantly affected by purchase prices of energy commodities on the Polish Power Exchange (TGE) and foreign market prices. According to Guotao et al. [99], with the promotion of renewable energy, the dominance of natural gas is limited due to its high price volatility. The results indicate that high natural gas prices are more likely to promote the development of cheap, non-renewable energy production than renewable energy under low-emission tax policies. Research by Zych et al. [100] suggests that from Poland’s perspective, considering international events impacting gas prices, gas investments are economically unjustified under current conditions (NPV −891 million EUR) and unlikely to be justified under predicted changes (NPV −691 million EUR), with justification only in unlikely global scenarios (NPV 2.37 billion EUR). Presently, natural gas remains a necessary transitional energy source for Poland’s energy structure transformation despite high prices. Its role in the energy mix is expected to decline over decades under current EU climate policy assumptions.
Although the study focuses on the Polish market, its findings may have broader applicability in countries with similar energy structures and a comparable role of biomass in the energy mix. Due to limited access to alternative energy sources and the growing importance of wood biomass in the decarbonization process, Poland serves as a representative example of an economy undergoing an energy transition. The strong influence of natural gas prices on the prices of wood industry by-products, identified in the analysis, may also be relevant for other Central European countries where the energy sector is partially based on biomass [101]. The use of both primary and secondary biomass is critical to low-emission strategies, particularly in regions with substantial forest resources. Given the considerable variation in national energy strategies, natural resource availability, and market structures, further research is needed at both the regional and national levels.
Apart from gas prices, industrial wood prices lagged by three months also influenced the market for wood industry by-products (biomass), confirming assumptions about relationships between the primary wood market and processing residues, attributable to resource substitution.
Analyses revealed a surprisingly low impact of coal prices on prediction accuracy—coal is not a significant predictor of wood industry by-product (biomass) prices. In addition to energy carrier prices, environmental factors such as prolonged droughts, forest fires, pest outbreaks (e.g., bark beetle infestations), or storm damage can significantly affect both the availability and quality of biomass resources [102,103]. These disturbances may disrupt local and global supply chains, reduce harvested timber volumes, alter future tree species composition, and consequently influence the wood market and the pricing of wood industry by-products.
Currently, EU countries are moving away from fossil fuels, particularly phasing out coal due to high energy production costs (ETS 2). The need to limit global warming to 2 °C will likely result in the complete phase-out of coal-fired electricity production without carbon capture and storage (CCS) [104]. Decarbonization and the energy transition in Poland, heavily dependent on coal, have economic consequences, including rising energy and heat prices. Due to Poland’s limited natural conditions for wind and solar renewable energy sources (and lack of nuclear power plants), the role of biomass as an alternative energy source is expected to grow.
Moreover, in comparison to other renewable energy sources, biomass and by-products of the timber industry represent a relatively stable form of energy supply, which can be utilized independently of weather conditions. In the face of extreme meteorological conditions, this feature becomes critically important for ensuring the continuity of energy provision. Under such circumstances, a key role is played by distributed restoration strategies within integrated multi-energy distribution systems (MDSs), which enable the coordinated recovery of both electricity and thermal energy at the local level [105]. However, the effectiveness of these strategies depends not only on the availability of local energy sources but also on the resilience of transmission infrastructure to systemic failures. In this context, advanced technical protection systems such as extended pole differential current-based relaying for bipolar line-commutated converter high-voltage direct current (LCC-HVDC) transmission lines are gaining increasing importance [106]. The implementation of such protection mechanisms allows for rapid fault localization and isolation, which are essential for maintaining large-scale energy transmission stability under system disturbances. This has further implications for local energy markets, including the biomass sector, which is increasingly regarded as a strategic energy security buffer during disruptions in the supply of other primary energy sources.

5. Conclusions

Prices of wood industry by-products exhibited both volatility and seasonality. The highest average prices during October 2017–January 2025 were recorded for pulpwood chips (223 PLN/m3) and sawdust (199 PLN/m3). The prices of wood industry by-products, primarily pulpwood chips, were approximately 10% lower than those of industrial (large-dimension) timber. A high degree of price variability was observed for wood industry by-products, ranging between 28% and 51%.
The price analysis was based on monthly data, which underscores the importance of long-term observations. During the period from October 2017 to August 2021, the prices of by-products from the wood industry exhibited greater stability and predictability compared to the period from September 2021 to January 2025, which was characterized by significant volatility and a consistent upward trend. Among the analyzed by-products, sawdust prices displayed the highest variability. In the first period, prices ranged from 100 to 160 PLN/m3, while in the second period, they fluctuated widely between 150 and 550 PLN/m3. During the summer months (June–August) in the first period, sawdust prices reached values of 150–160 PLN/m3, whereas in the second period, they peaked at 500–550 PLN/m3. Overall, the prices of wood industry by-products demonstrated seasonal variation. The prices of wood chips intended for pulp and sawmill use, as well as sawdust, tended to reach their highest levels between June and August and their lowest levels between January and March.
The Gradient Boosting and Random Forest models demonstrated high effectiveness in forecasting biomass prices, achieving R2 values of 0.901 and 0.813, respectively. The corresponding MAE values were 13.83 PLN/m3 for Gradient Boosting and 21.44 PLN/m3 for Random Forest, indicating a solid level of predictive accuracy given the volatility of the target variable. The inclusion of lagged explanatory variables (1, 3, and 6 months) significantly improved the prediction accuracy, confirming the relevance of delayed market responses to macroeconomic shifts in the biomass sector.
The SHAP analysis revealed that the most influential predictor was the natural gas price with a six-month lag. Natural gas prices exert the strongest influence on prices of wood industry by-products. The EU’s decarbonization policy, including subsidies allocated for the energy transition, may drive increased demand for alternative energy sources, including wood industry by-products, consequently leading to price increases. Moreover, it appears that rising gas prices, partly due to reduced availability, may stimulate demand for wood industry by-products and contribute to price escalation.
Large-diameter industrial timber and wood industry by-products in the processing sector often exhibit substitution characteristics. Nonetheless, wood prices had a lower impact on the prices of by-products than natural gas prices, suggesting a dominant influence of the energy sector on biomass prices. Changes in industrial wood prices, however, translated rapidly (within three months) into changes in by-product prices.
Coal used for heating has only a minor effect on the biomass market. This indicates that changes in coal availability and prices do not directly translate into changes in wood industry by-product prices. It is likely that coal consumption for energy purposes will decline in line with EU policy due to increasing energy production costs.
The growing role of renewable energy, natural gas, and wood biomass shapes a distinct market independent from the traditional coal market. The renewable energy market, including bioenergy, is promoted as an independent alternative, which is reflected in the negligible impact of coal prices on wood industry by-product prices.
Wood availability currently represents a significant challenge for the economies of many countries; therefore, rational management of this resource in both primary and secondary markets is essential to ensure economic development and enhance socio-environmental benefits.
In Poland, biomass—including wood biomass from industrial residues (wood industry by-products) and post-consumer wood—plays a key role in the decarbonization of the energy sector due to limited access to alternative energy sources. Accordingly, national policy should promote afforestation and efficient bioenergy production technologies.

Author Contributions

Conceptualization, A.K. and D.C.; methodology, A.K.; software, D.C.; validation, A.K. and D.C.; formal analysis, A.K. and D.C.; investigation, A.K. and D.C. resources, A.K., D.C., M.W., M.G. and K.A.; data curation, A.K. and M.W.; writing—original draft preparation; A.K. and D.C.; writing—review and editing, A.K., D.C., M.G. and K.A.; visualization, A.K., D.C., M.W., M.G. and K.A.; supervision, A.K. and D.C.; project administration, A.K. and D.C.; funding acquisition A.K., M.G. and K.A. All authors have read and agreed to the published version of the manuscript.

Funding

This research was funded by The Ministry of Science and Higher Education of the Republic of Poland. This work is supported by the Slovak Research and Development Agency under the project contract no. APVV-22-0001: “Optimization of main health and safety risks in the use of forest biomass for energy purposes”.

Data Availability Statement

The original contributions presented in the study are included in the article, further inquiries can be directed to the corresponding author.

Conflicts of Interest

The authors declare no conflicts of interest.

References

  1. Gagnon, B.; Tanguay, X.; Amor, B.; Imbrogno, A.F. Forest Products and Circular Economy Strategies: A Canadian Perspective. Energies 2022, 15, 673. [Google Scholar] [CrossRef]
  2. Lieder, M.; Rashid, A. Towards Circular Economy Implementation: A Comprehensive Review in the Context of Manufacturing Industry. J. Clean. Prod. 2016, 115, 36–51. [Google Scholar] [CrossRef]
  3. Van Holsbeeck, S.; Brown, M.; Srivastava, S.K.; Ghaffariyan, M.R. A Review on the Potential of Forest Biomass for Bioenergy in Australia. Energies 2020, 13, 1147. [Google Scholar] [CrossRef]
  4. Näyhä, A. Transition in the Finnish Forest-Based Sector: Company Perspectives on the Bioeconomy, Circular Economy and Sustainability. J. Clean. Prod. 2019, 209, 1294–1306. [Google Scholar] [CrossRef]
  5. Giezen, M. Shifting Infrastructure Landscapes in a Circular Economy: An Institutional Work Analysis of the Water and Energy Sector. Sustainability 2018, 10, 3487. [Google Scholar] [CrossRef]
  6. Geissdoerfer, M.; Savaget, P.; Bocken, N.M.P.; Hultink, E.J. The Circular Economy—A new sustainability para-digm? J. Clean. Prod. 2017, 143, 757–768. [Google Scholar] [CrossRef]
  7. De Doile, G.N.D.; Rotella Junior, P.; Rocha, L.C.S.; Bolis, I.; Janda, K.; Coelho Junior, L.M. Hybrid Wind and So-lar Photovoltaic Generation with Energy Storage Systems: A Systematic Literature Review and Contributions to Technical and Economic Regulations. Energies 2021, 14, 6521. [Google Scholar] [CrossRef]
  8. Nunes, A.M.M.; Coelho Junior, L.M.; Abrahão, R.; Santos Júnior, E.P.; Simioni, F.J.; Rotella Junior, P.; Rocha, L.C.S. Public Policies for Renewable Energy: A Review of the Perspectives for a Circular Economy. Energies 2023, 16, 485. [Google Scholar] [CrossRef]
  9. Kyoto Protocol to the United Nations Framework Convention on Climate Change, 10 December 1997, 2303 U.N.T.S. 162. Available online: https://unfccc.int/resource/docs/convkp/kpeng.pdf (accessed on 15 January 2025).
  10. Paris Agreement to the United Nations Framework Convention on Climate Change, 12 December 2015, T.I.A.S. No. 16-1104. Available online: https://unfccc.int/sites/default/files/english_paris_agreement.pdf (accessed on 15 January 2025).
  11. European Commission. Regulation (EU) 2021/1119 of the European Parliament and of the Council of 30 June 2021 Establishing the Framework for Achieving Climate Neutrality and Amending Regulations (EC) No 401/2009 and (EU) 2018/1999 (‘European Climate Law’). Available online: https://eur-lex.europa.eu/eli/reg/2021/1119/oj/eng (accessed on 15 January 2025).
  12. European Commission. Directive of the European Parliament and of the Council of 18 October 2023 Amending Directive (EU) 2018/2001, Regulation (EU) 2018/1999 and Directive 98/70/EC as Regards the Promotion of Energy from Renewable Sources, and Repealing Council Directive (EU) 2015/652. 2023. Available online: https://www.europeansources.info/record/proposal-for-a-directive-amending-directive-eu-2018-2001-regulation-eu-2018-1999-and-directive-98-70-ec-as-regards-the-promotion-of-energy-from-renewable-sources-and-repealing-council-directive (accessed on 20 April 2025).
  13. Dyrektywa Parlamentu Europejskiego i Rady (UE) 2018/2001 z dnia 11 grudnia 2018 r. w Sprawie Promowania Stosowania Energii ze źródeł Odnawialnych (Przekształcenie). Available online: https://eur-lex.europa.eu/legal-content/PL/ALL/?uri=CELEX%3A32018L2001 (accessed on 20 April 2025).
  14. IEA Bioenergy. IEA-Bioenergy Annual Report 2021. Available online: https://www.ieabioenergy.com/blog/publications/iea-bioenergy-annual-report-2021 (accessed on 4 April 2025).
  15. Guney, T.; Kantar, K. Biomass energy consumption and sustainable development. Int. J. Sustain. Dev. World Ecol. 2020, 27, 762–767. [Google Scholar] [CrossRef]
  16. Hosen, M.E.; Siddik, M.N.A.; Miah, M.F.; Ali, M.H.; Alam, M.S. Biomass energy for sustainable development: Evidence from Asian countries. Environ. Dev. Sustain. 2024, 26, 3617–3637. [Google Scholar] [CrossRef]
  17. Bilgili, F.; Koçak, E.; Bulut, Ü.; Kuşkaya, S. Can biomass energy be an efficient policy tool for sustainable development? Renew. Sustain. Energy Rev. 2017, 71, 830–845. [Google Scholar] [CrossRef]
  18. Camia, A.; Robert, N.; Jonsson, K.; Pilli, R.; Garcia Condado, S.; Lopez Lozano, R.; Van Der Velde, M.; Ronzon, T.; Gurria Albusac, P.; M’barek, R.; et al. Biomass Production, Supply, Uses and Flows in the European Union: First Results from an Integrated Assessment; JRC Sci. Policy Rep; Publications Office of the European Union: Luxembourg, 2018; Available online: https://www.eea.europa.eu (accessed on 30 April 2025).
  19. Shabani, N.; Akhtari, S.; Sowlati, T. Value chain optimization of forest biomass for bioenergy production: A review. Renew. Sustain. Energy Rev. 2013, 23, 299–311. [Google Scholar] [CrossRef]
  20. Scarlat, N.; Dallemand, J.-F.; Monforti-Ferrario, F.; Nita, V. The role of biomass and bioenergy in a future bioeconomy: Policies and facts. Environ. Dev. 2015, 15, 3–34. [Google Scholar] [CrossRef]
  21. Tursi, A. A review on biomass: Importance, chemistry, classification, and conversion. Biofuel Res. J. 2019, 6, 962–979. [Google Scholar] [CrossRef]
  22. Titus, B.D.; Brown, K.; Helmisaari, H.-S.; Vanguelova, E.; Stupak, I.; Evans, A.; Clarke, N.; Guidi, C.; Bruckman, V.J.; Varnagiryte-Kabasinskiene, I.; et al. Sustainable forest biomass: A review of current residue harvesting guidelines. Energy Sustain. Soc. 2021, 11, 220. [Google Scholar] [CrossRef]
  23. Kurowska, A. Odpady drzewne w świetle polskich i unijnych przepisów prawnych. Sylwan 2015, 159, 355–360. [Google Scholar]
  24. Borzęcki, K.; Pudełko, R.; Kozak, M.; Borzęcka, M.; Faber, A. Przestrzenne rozmieszczenie odpadów drzewnych w Europie. Sylwan 2018, 162, 563–571. [Google Scholar]
  25. Munis, R.A.; Martins, J.C.; Camargo, D.A.; Simões, D. Dynamics of Pinus wood prices for different timber assortments: Comparison of stochastic processes. Bois For. Trop. 2022, 351, 45–52. [Google Scholar] [CrossRef]
  26. Olsson, O.; Hillring, B. Price relationships and market integration in the Swedish wood fuel market. Biomass Bioenergy 2013, 57, 78–85. [Google Scholar] [CrossRef]
  27. Malaty, R.; Toppinen, A.; Viitanen, J. Modelling and forecasting Finnish pine sawlog stumpage prices using alternative time-series methods. Can. J. For. Res. 2007, 37, 178–187. [Google Scholar] [CrossRef]
  28. Mei, B.; Clutter, M.; Harris, T. Modeling and forecasting pine sawtimber stumpage prices in the US South by various time series models. Can. J. For. Res. 2010, 40, 1506–1516. [Google Scholar] [CrossRef]
  29. Leskien, P.; Kangas, J. Modelling future timber price development by using expert judgments and time series analysis. Silva Fenn. 2001, 35, 93–102. [Google Scholar] [CrossRef]
  30. Meyer, J.; von Cramon-Taubadel, S. Asymmetric price transmission: A survey. J. Agric. Econ. 2004, 55, 581–611. [Google Scholar] [CrossRef]
  31. Mäki-Hakola, M. Roundwood Price Development and Market Linkages in Central and Northern Europe; Pellervo Economic Research Institute: Helsinki, Finland, 2004; Available online: https://www.ptt.fi/wp-content/uploads/media/liitteet/tp68.pdf (accessed on 20 April 2025).
  32. Mäki-Hakola, M. Cointegration of the Roundwood Markets around the Baltic Sea: An Empirical Analysis of Rundwood Markets in Finland, Estonia, Germany and Lithuania; Pellervo Economic Research Institute: Helsinki, Finland, 2002; Available online: https://www.ptt.fi/wp-content/uploads/media/liitteet/tp55.pdf (accessed on 10 April 2025).
  33. Mutanen, A.; Toppinen, A. Price dynamics in the Russian-Finnish roundwood trade. Scand. J. For. Res. 2007, 22, 71–80. [Google Scholar] [CrossRef]
  34. Niquidet, K.; Manlay, B. Testing for nonlinear spatial integration in roundwood markets. For. Sci. 2011, 57, 301–308. [Google Scholar] [CrossRef]
  35. Ning, Z.; Sun, C. Vertical price transmission in timber and lumber markets. J. For. Econ. 2014, 20, 17–32. [Google Scholar] [CrossRef]
  36. Kożuch, A.; Cywicka, D.; Adamowicz, K. A comparison of artificial neural network and time series models for timber price forecasting. Forests 2023, 14, 177. [Google Scholar] [CrossRef]
  37. Wagner, J.E.; Rahn, J.; Cavo, M. A pragmatic method to forecast stumpage prices. For. Sci. 2019, 65, 429–438. [Google Scholar] [CrossRef]
  38. Mehrotra, S.N.; Carter, D.R. Forecasting performance of lumber futures prices. Econ. Res. Int. 2017, 2017, 1650363. [Google Scholar] [CrossRef]
  39. Sivaram, M. Modeling the price of trends of teak wood using statistical and artificial neural network techniques. Electron. J. Appl. Stat. Anal. 2014, 7, 180–198. [Google Scholar] [CrossRef]
  40. Tsekos, C.; Tandurella, S.; de Jong, W. Estimation of lignocellulosic biomass pyrolysis product yields using artificial neural networks. J. Anal. Appl. Pyrolysis 2021, 157, 105180. [Google Scholar] [CrossRef]
  41. Parzych, S.; Mandziuk, A. Kształtowanie się cen sprzedaży drewna w użytkowaniu przedrębnym w drzewostanach dębowych w zależności od wieku. Sylwan 2021, 165, 600–608. [Google Scholar] [CrossRef]
  42. Koutroumanidis, T.; Ioannou, K.; Arabatzis, G. Predicting fuelwood prices in Greece with the use of ARIMA models, artificial neural networks and a hybrid ARIMA–ANN model. Energy Policy 2009, 37, 3627–3634. [Google Scholar] [CrossRef]
  43. Verly Lopes, D.J.; Bobadilha, G.S.; Peres Vieira Bedette, A. Analysis of lumber prices time series using long short-term memory artificial neural networks. Forests 2021, 12, 428. [Google Scholar] [CrossRef]
  44. Gangwar, S.; Bali, V.; Kumar, A. Comparative analysis of wind speed forecasting using LSTM and SVM. EAI Endorsed Trans. Scalable Inf. Syst. 2020, 7, e1. [Google Scholar] [CrossRef]
  45. Zhao, X.; Yu, B.; Liu, Y.; Chen, Z.; Li, Q.; Wang, C.; Wu, J. Estimation of poverty using random forest regression with multi-source data: A case study in Bangladesh. Remote Sens. 2019, 11, 375. [Google Scholar] [CrossRef]
  46. Zhou, X.; Zhu, X.; Dong, Z.; Guo, W. Estimation of biomass in wheat using random forest regression algorithm and remote sensing data. Crop J. 2016, 4, 212–219. [Google Scholar] [CrossRef]
  47. Pierdzioch, C.; Risse, M. Forecasting precious metal returns with multivariate random forests. Empir. Econ. 2020, 58, 1167–1184. [Google Scholar] [CrossRef]
  48. Yoon, J. Forecasting of real GDP growth using machine learning models: Gradient boosting and random forest approach. Comput. Econ. 2021, 57, 247–265. [Google Scholar] [CrossRef]
  49. Gumus Kiran, M.; Gumus, S. Crude oil price forecasting using XGBoost. In 2017 International Conference on Computer Science and Engineering (UBMK); IEEE: Antalya, Turkey, 2017; pp. 1100–1103. [Google Scholar] [CrossRef]
  50. Wang, S.X.; Zhao, W.; Guo, D. An application of a three-stage XGBoost-based model to sales forecasting of a cross-border e-commerce enterprise. Math. Probl. Eng. 2019, 2019, 8503252. [Google Scholar] [CrossRef]
  51. He, M.; Li, W.; Via, B.K.; Zhang, Y. Nowcasting of lumber futures price with Google Trends Index using machine learning and deep learning models. For. Prod. J. 2022, 72, 11–20. [Google Scholar] [CrossRef]
  52. Leszczyszyn, E. Wood by-products and their use in Poland in a context of the direct survey of wood producers. Intercathedra 2018, 34, 35–43. [Google Scholar] [CrossRef]
  53. Kawa, A. Łańcuch dostaw biomasy drzewnej–wyniki ilościowych badań empirycznych. Pr. Nauk. Uniw. Ekon. Wrocławiu 2024, 68, 57–68. [Google Scholar] [CrossRef]
  54. Mydlarz, K.; Wieruszewski, M. The energy potential of firewood and by-products of round wood processing—Economic and technical aspects. Energies 2024, 17, 4797. [Google Scholar] [CrossRef]
  55. Piwowar, A.; Dzikuć, M. Outline of the economic and technical problems associated with the co-combustion of biomass in Poland. Renew. Sustain. Energy Rev. 2016, 54, 415–420. [Google Scholar] [CrossRef]
  56. Wanat, L.; Mikołajczak, E. The value and profitability of converting sawmill wood by-products to paper production and energy. In Pulp and Paper Processing; IntechOpen Limited: London, UK, 2018; p. 109. [Google Scholar] [CrossRef]
  57. Izdebski, W.; Izdebski, M.; Kosiorek, K. Evaluation of economic possibilities of production of second-generation spirit fuels for internal combustion engines in Poland. Energies 2023, 16, 892. [Google Scholar] [CrossRef]
  58. Čermák, M.; Malatakova, J.; Malatak, J.; Aniszewska, M.; Gendek, A. Regional wood chip quality parameters decomposition and price linkage with impact on Polish energy sustainability: Time frequency analysis between 2013 and 2019. Heliyon 2024, 10, e33322. [Google Scholar] [CrossRef] [PubMed]
  59. Górna, A.; Szabelska-Beręsewicz, A.; Wieruszewski, M.; Starosta-Grala, M.; Stanula, Z.; Kożuch, A.; Adamowicz, K. Predicting Post-Production Biomass Prices. Energies 2023, 16, 3470. [Google Scholar] [CrossRef]
  60. Urząd Regulacji Energetyki. Energetyka w Liczbach-2022. Warszawa, Październik 2023. Departament Ryn-ków Energii Elektrycznej i Ciepła URE/Oddziały Terenowe URE. ISBN 978-83-948942-6-9. Available online: https://www.ure.gov.pl/pl/cieplo/energetyka-cieplna-w-l/11407,2022.html (accessed on 10 May 2025).
  61. Leśnictwo. 2024. Available online: https://www.bdl.lasy.gov.pl/portal/gus-lesnictwo (accessed on 30 May 2025).
  62. Order. 2021. Order No. 24 of the Director General of the State Forests of April 27, 2021 on the Indication of Wood Assortments Appropriate for the So-Called Forest Biomass Market for Energy Purposes in Accordance with the Principle of Cascading Use of Wood Raw Material. Available online: https://drewno.lasy.gov.pl/zarzadzenie-nr-24-dyrektora-generalnego-lasow-panstwowych-z-dnia-27-kwietnia-2021-roku-w-sprawie-wskazania-sortymentow-drzewnych-wlasciwych-dla-rynku-tzw-biomasy-lesnej-na-cele-energetyczne/ (accessed on 2 May 2025).
  63. USA liczą na Zwiększenie Importu Pelletu Drzewnego do Europy. Magazyn Biomasa. Available online: https://magazynbiomasa.pl/usa-licza-na-zwiekszenie-importu-pelletu-drzewnego-do-europy (accessed on 4 May 2025).
  64. Mydlarz, K.; Wieruszewski, M. Economic, Technological as Well as Environmental and Social Aspects of Local Use of Wood By-Products Generated in Sawmills for Energy Purposes. Energies 2022, 15, 1337. [Google Scholar] [CrossRef]
  65. Kurowska, A. Struktura podaży odpadów drzewnych w Polsce. Sylwan 2016, 160, 187–196. [Google Scholar]
  66. Ceny Energii i Surowców Energetycznych w Polsce. Available online: https://energy.instrat.pl/ceny/ (accessed on 12 January 2025).
  67. Aktualne Ceny Biomasy na Giełdzie Baltpool. Available online: https://magazynbiomasa.pl/aktualne-ceny-biomasy-na-gieldzie-baltpool-tydzien-26/ (accessed on 24 July 2025).
  68. Rocznik Statystyczny Leśnictwa. 2023. Available online: https://stat.gov.pl/obszary-tematyczne/roczniki-statystyczne/roczniki-statystyczne/rocznik-statystyczny-lesnictwa-2023,13,6 (accessed on 7 January 2025).
  69. Rocznik Statystyczny Rezczpospolitej Polskiej. 2023. Available online: https://stat.gov.pl/obszary-tematyczne/roczniki-statystyczne/roczniki-statystyczne/rocznik-statystyczny-rzeczypospolitej-polskiej-2023,2,23.html (accessed on 7 January 2025).
  70. Rocznik Statystyczny Leśnictwa. 2022. Available online: https://stat.gov.pl/obszary-tematyczne/roczniki-statystyczne/roczniki-statystyczne/rocznik-statystyczny-lesnictwa-2022,13,5.html (accessed on 7 January 2025).
  71. Rocznik Statystycznny Leśnictwa. 2021. Available online: https://stat.gov.pl/obszary-tematyczne/roczniki-statystyczne/roczniki-statystyczne/rocznik-statystyczny-lesnictwa-2021,13,4.html (accessed on 7 January 2025).
  72. Sprawozdanie Finansowo-Gospodarcze PGL LP. 2023. Available online: https://www.lasy.gov.pl/pl/informacje/publikacje/informacje-statystyczne-i-raporty/sprawozdanie-finansowo-gospodarcze-pgl-lp/sprawozdanie-finansowo-gospodarcze-pgl-lp-za-rok-2023.pdf (accessed on 7 January 2025).
  73. Sprawozdanie Finansowo-Gospodarcze PGL LP. 2022. Available online: https://www.lasy.gov.pl/pl/informacje/publikacje/informacje-statystyczne-i-raporty/sprawozdanie-finansowo-gospodarcze-pgl-lp/sprawozdanie-finansowo-gospodarcze-pgl-lp-za-rok-2022.pdf/view (accessed on 7 January 2025).
  74. Sprawozdanie Finansowo-Gospodarcze PGL LP. 2021. Available online: https://www.lasy.gov.pl/pl/informacje/publikacje/informacje-statystyczne-i-raporty/sprawozdanie-finansowo-gospodarcze-pgl-lp/sprawozdanie-finansowo-gospodarcze-za-2021-rok.pdf/view (accessed on 7 January 2025).
  75. Sprawozdanie Finansowo-Gospodarcze PGL LP. 2020. Available online: https://www.lasy.gov.pl/pl/informacje/publikacje/informacje-statystyczne-i-raporty/sprawozdanie-finansowo-gospodarcze-pgl-lp/sprawozdanie-finansowo-gospodarcze-pgl-lp-za-2020-rok_.pdf/view (accessed on 7 January 2025).
  76. Sprawozdanie Finansowo-Gospodarcze PGL LP. 2019. Available online: https://www.lasy.gov.pl/pl/informacje/publikacje/informacje-statystyczne-i-raporty/sprawozdanie-finansowo-gospodarcze-pgl-lp/sprawozdanie-finansowo-gospodarcze-2019.pdf/view (accessed on 7 January 2025).
  77. Przemysł Drzewny. Available online: https://przemysldrzewny.eu/index.php/2024/12/27/ranking-najwiekszych-przedsiebiorstw-tartacznych-siegnelismy-dna-czekamy-na-wzrost/ (accessed on 24 July 2025).
  78. Prokhorenkova, L.; Gusev, G.; Vorobev, A.; Dorogush, A.; Gulin, A. CatBoost: Unbiased boosting with categorical features. In Proceedings of the 32nd Conference on Neural Information Processing Systems (NeurIPS 2018), Montréal, QC, Canada, 3–8 December 2018; Available online: https://proceedings.neurips.cc/paper_files/paper/2018/file/14491b756b3a51daac41c24863285549-Paper.pdf (accessed on 10 April 2025).
  79. Hancock, J.T.; Khoshgoftaar, T.M. CatBoost for big data: An interdisciplinary review. J. Big Data 2020, 7, 94. [Google Scholar] [CrossRef]
  80. Liu, Y.; Wang, Y.; Zhang, J. New machine learning algorithm: Random Forest. In Information Computing and Applications. ICICA 2012; Liu, B., Ma, M., Chang, J., Eds.; Lecture Notes in Computer Science; Springer: Berlin/Heidelberg, Germany, 2012; Volume 7473, pp. 256–263. [Google Scholar] [CrossRef]
  81. Loecher, M.; Lai, D.; Qi, W. Approximation of SHAP values for randomized tree ensembles. In Proceedings of the International Cross-Domain Conference for Machine Learning and Knowledge Extraction, Vienna, Austria, 23–26 August 2022; Springer: Cham, Switzerland, 2022; pp. 18–31. [Google Scholar] [CrossRef]
  82. Kraev, E.; Koseoglu, B.; Traverso, L.; Topiwalla, M. Shap-Select: Lightweight feature selection using SHAP values and regression. arXiv 2024, arXiv:2410.06815. Available online: https://www.researchgate.net/publication/384769721_Shap-Select_Lightweight_Feature_Selection_Using_SHAP_Values_and_Regression (accessed on 12 May 2025). [CrossRef]
  83. Popp, J.; Kovács, S.; Oláh, J.; Divéki, Z.; Balázs, E. Bioeconomy: Biomass and biomass-based energy supply and demand. New Biotechnol. 2021, 60, 76–84. [Google Scholar] [CrossRef]
  84. Inci, M.; Çelik, Ö.; Lashab, A.; Bayındır, K.Ç.; Vasquez, J.C.; Guerrero, J.M. Power system integration of electric vehicles: A review on impacts and contributions to the smart grid. Appl. Sci. 2024, 14, 2246. [Google Scholar] [CrossRef]
  85. Ntombela, M.; Musasa, K.; Moloi, K. A comprehensive review of the incorporation of electric vehicles and renewable energy distributed generation regarding smart grids. World Electr. Veh. J. 2023, 14, 176. [Google Scholar] [CrossRef]
  86. Raman, R.; Sreenivasan, A.; Kulkarni, N.V.; Suresh, M.; Nedungadi, P. Analyzing the contributions of biofuels, biomass, and bioenergy to sustainable development goals. iScience 2025, 28, 112157. [Google Scholar] [CrossRef]
  87. Zhao, X.; Li, X.; Wu, Y.; Qiao, L.; Zhang, C. Assessment of the effects of China’s new energy vehicle industry policies: From the perspective of moderating effect of consumer characteristics. Environ. Dev. Sustain. 2025, 27, 4319–4340. [Google Scholar] [CrossRef]
  88. Mignogna, D.; Szabó, M.; Ceci, P.; Avino, P. Biomass energy and biofuels: Perspective, potentials, and challenges in the energy transition. Sustainability 2024, 16, 7036. [Google Scholar] [CrossRef]
  89. CEPI/Nova Institute. 2024. Wood Fibre Based Biorefineries Double Turnover in 3 Years to €6 Billion, Highlighting Rapid Growth in European Bio-Refinery Sector. Available online: https://www.cepi.org/press-release-wood-fibre-based-biorefineries-double-turnover-in-3-years-to-e6-billion/ (accessed on 25 July 2025).
  90. Bentsen, N.S. Biomass for biorefineries: Availability and costs. In Biorefinery; Bastidas-Oyanedel, J.R., Schmidt, J., Eds.; Springer: Cham, Switzerland, 2019; pp. 25–44. [Google Scholar] [CrossRef]
  91. Di Gruttola, F.; Borello, D. Analysis of the EU secondary biomass availability and conversion processes to produce advanced biofuels: Use of existing databases for assessing a metric evaluation for the 2025 perspective. Sustainability 2021, 13, 7882. [Google Scholar] [CrossRef]
  92. Bruck, S.R.; Parajuli, R.; Chizmar, S.; Sills, E.O. Impacts of COVID-19 pandemic policies on timber markets in the Southern United States. J. For. Bus. Res. 2023, 2, 130–167. Available online: https://www.srs.fs.usda.gov/pubs/ja/2023/ja_2023_bruck_001.pdf (accessed on 12 May 2025). [CrossRef]
  93. Gökhan, S.; Gungor, E. Determination of the seasonal effect on the auction prices of timbers and prediction of future prices. J. Bartin Fac. For. 2018, 20, 266–277. [Google Scholar] [CrossRef]
  94. Friedman, J.H. Greedy function approximation: A gradient boosting machine. Ann. Stat. 2001, 29, 1189–1232. [Google Scholar] [CrossRef]
  95. Breiman, L. Random forests. Mach. Learn. 2001, 45, 5–32. [Google Scholar] [CrossRef]
  96. Cha, G.-W.; Moon, H.-J.; Kim, Y.-C. Comparison of random forest and gradient boosting machine models for predicting demolition waste based on small datasets and categorical variables. Int. J. Environ. Res. Public Health 2021, 18, 8530. [Google Scholar] [CrossRef] [PubMed]
  97. Abrell, J.; Kosch, S.; Rausch, S. How Effective Is Carbon Pricing? Emissions and Cost Impacts of the UK Carbon Tax; ETH Zurich: Zurich, Switzerland, 2021; Available online: https://abrell.eu/public/papers/abrell_kosch_rausch_uk_carbon_tax.pdf (accessed on 25 July 2025).
  98. Bohdan, A.; Klosa, S.; Romaniuk, U. Fluctuations of natural gas prices for households in the 2017–2022 period—Polish case study. Energies 2023, 16, 1824. [Google Scholar] [CrossRef]
  99. Guotao, W.; Qi, L.; Zhengbing, L.; Haoran, Z.; Yongtu, L.; Xuemei, W. How does soaring natural gas prices impact renewable energy: A case study in China. Energy 2022, 252, 123940. [Google Scholar] [CrossRef]
  100. Zych, G.; Bronicki, J.; Czarnecka, M.; Kinelski, G.; Kamiński, J. The cost of using gas as a transition fuel in the transition to low-carbon energy: The case study of Poland and selected European countries. Energies 2023, 16, 994. [Google Scholar] [CrossRef]
  101. Kożuch, A.; Cywicka, D.; Adamowicz, K.; Wieruszewski, M.; Wysocka-Fijorek, E.; Kiełbasa, P. The Use of Forest Biomass for Energy Purposes in Selected Eu-ropean Countries. Energies 2023, 16, 5776. [Google Scholar] [CrossRef]
  102. Kumar Das, A.; Baldo, M.; Dobor, L.; Seidl, R.; Rammer, W.; Modlinger, R.; Washaya, P.; Merganičová, K.; Hlásny, T. The Increasing Role of Drought as an Inciting Factor of Bark Beetle Outbreaks Can Cause Large-Scale Transformation of Central European Forests. Landsc. Ecol. 2025, 40, 108. [Google Scholar] [CrossRef]
  103. Machado-Nunez Morerio, J.; Eid, T.; Antón-Fernández, C.; Kangas, A.; Trømborg, E. Natural Disturbances Risks in European Boreal and Temperate Forests and Their Links to Climate Change—A Review of Modelling Approaches. For. Ecol. Manag. 2022, 509, 120071. [Google Scholar] [CrossRef]
  104. Johnson, N.; Krey, V.; McCollum, D.L.; Rao, S.; Riahi, K.; Rogelj, J. Stranded on a low-carbon planet: Implications of climate policy for the phase-out of coal-based power plants. Technol. Forecast. Soc. Change 2015, 90 Pt A, 89–102. [Google Scholar] [CrossRef]
  105. Wang, Z.; Hou, H.; Wei, R.; Li, Z. A distributed market-aided restoration approach of multi-energy distribution systems considering comprehensive uncertainties from typhoon disaster. IEEE Trans. Smart Grid 2025, 11029621. [Google Scholar] [CrossRef]
  106. Tiwari, R.S.; Sharma, J.P.; Gupta, O.H.; Sufyan, M.A. Extension of pole differential current based relaying for bipolar LCC HVDC lines. Sci. Rep. 2025, 15, 16142. [Google Scholar] [CrossRef] [PubMed]
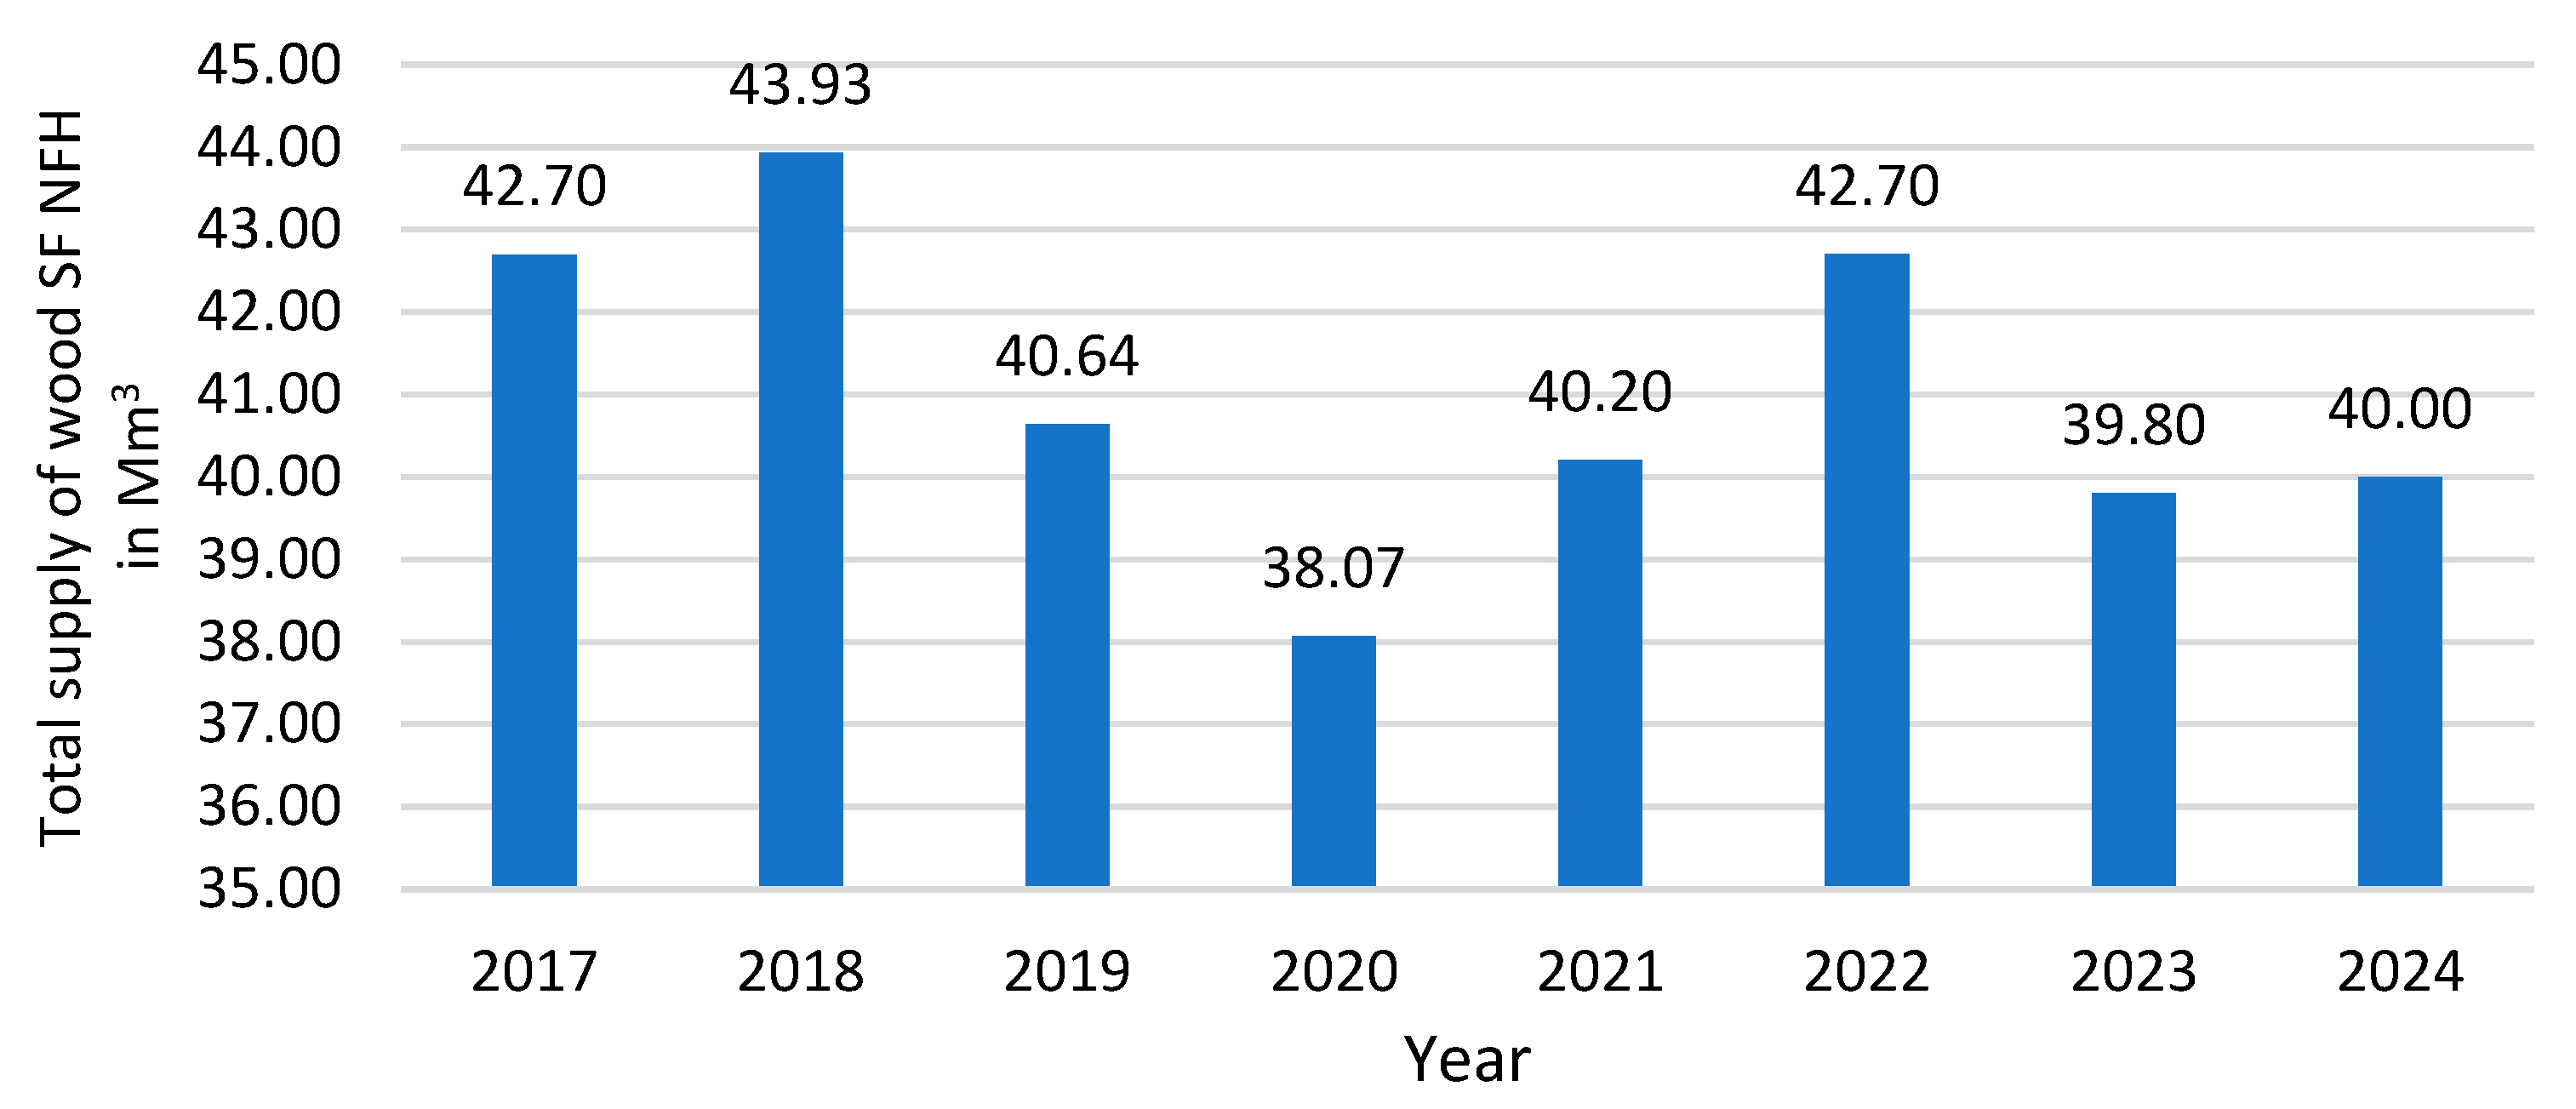
Figure 1. Total supply of wood by SF NFH (mln m3 in the years 2017–2024). Own study based on data presented on the Forest Data Bank (FDB).
Energies 18 04418 g001
Figure 2. Polar diagrams illustrating the variability and seasonality of pulpwood chips’ prices (PLN/m3) across two periods ((a) October 2017–August 2021; (b) September 2021–January 2025).
Energies 18 04418 g002
Figure 3. Polar diagrams illustrating the variability and seasonality of sawmill chips’ prices (PLN/m3) across two periods ((a) October 2017–August 2021; (b) September 2021–January 2025).
Energies 18 04418 g003
Figure 4. Polar diagrams illustrating the variability and seasonality of sawdust prices (PLN/m3) across two periods ((a) October 2017–August 2021; (b) September 2021–January 2025).
Energies 18 04418 g004
Figure 5. Polar diagrams illustrating the variability and seasonality of bark prices (PLN/m3) across two periods ((a) October 2017–August 2021; (b) September 2021–January 2025).
Energies 18 04418 g005
Figure 6. SHAP summary plot—influence of variables on prediction. Source: own study.
Energies 18 04418 g006
Figure 7. Feature importance—the impact of variables on the increase in MAE. Source: own study.
Energies 18 04418 g007
Figure 8. The impact of removing a variable (feature) on the decrease in R2. Source: own study.
Energies 18 04418 g008
Table 1. Descriptive statistics—prices of by-products of the wood industry in Poland compared to the prices of fossil fuels, firewood (S4), and wood for industrial purposes.
AssortmentNMean.Med.Min.Max.Q1Q3Stand. Dev.Coef var.
Pulpwood chips PLN/m3882232001014002002206128
Sawmill chips PLN/m3881871501014001501807138
Bark PLN/m3881681251003001202206639
Sawdust PLN/m38819915410055013622510151
S4 PLN/m388108102961291001111110
Industrial wood (roundwood) PLN/m3882472081893591973015623
Fossil fuels (coal) PLN/t8836826420974125048216946
Natural gas PLN/MWh88183122289208021217193
Source: own study.
Table 2. Evaluation metrics for assessing the performance of tree-based regression models—Random Forest (RF) and CatBoost (CB) (comparative analysis).
ModelMSERMSEMAEMAPER2
CatBoost559.22623.64813.8260.0620.901
Random Forest1061.09732.57421.4360.0930.813
Source: own study.
Disclaimer/Publisher’s Note: The statements, opinions and data contained in all publications are solely those of the individual author(s) and contributor(s) and not of MDPI and/or the editor(s). MDPI and/or the editor(s) disclaim responsibility for any injury to people or property resulting from any ideas, methods, instructions or products referred to in the content.