Abstract
Solar gasification is a thermochemical process that relies on concentrated solar radiation to heat steam and biomass to produce syngas. This study uses Machine Learning to model solar gasification using steam as an oxidizer, incorporating both thermodynamic simulations and predictive algorithms, developed using Python (version 3.11.13) scripting, to understand the relationship between the input and output variables. Three models—Artificial Neural Networks, Support Vector Machines, and Random Forests—were trained using datasets including biomass composition, solar irradiance (considering a solar furnace), and steam-to-biomass ratios in a downdraft or fluidized bed gasifier. Among the models, Random Forests provided the highest accuracy (average R2 = 0.942, Mean Absolute Error = 0.086, and Root Mean Square Error = 0.951) and were used for feature importance analysis. Results indicate that radiative heat transfer and steam-to-biomass ratio are the parameters that result in the largest increase in the syngas heating value and decrease in the tar contents. In terms of composition, the hydrogen contents have a direct relationship with the H2 and tar formed, while the carbon content affects the carbon conversion efficiency. This work highlights the of feature importance analysis to improve the design and operation of solar-driven gasification systems.
1. Introduction
Gasification consists of the thermal decomposition of a feedstock under a controlled oxidation atmosphere (usually air, steam, pure oxygen, or even CO2), where the main products are a mixture of gases (H2, CO, CH4, and CO2) called syngas, condensable hydrocarbons called tar, solid char, and, depending on the feedstock composition, ashes [1]. Based on the oxidation atmosphere, the process can be either autothermal (with air or oxygen) or allothermal (that is, requiring external energy for the process), making the use of steam as the gasification agent an energy intensive solution. Gasification can be attractive since residual biomass can be used as a feedstock to produce value-added fuels, and the resource is widely available, since countries like Mexico produce millions of metric tons of biomass per year (more than 50 million in the case of Mexico). Although the literature indicates that gasification with steam usually results in a syngas with better properties when compared with air, the energy demand represents a constraint [2,3]. Solar gasification (SG) is an innovative thermochemical conversion process that uses concentrated solar energy to transform biomass into high-value gaseous fuels, offering a clean and renewable alternative to conventional fuel-based methods [4,5]. This process can reach temperatures above 800 °C, allowing for the efficient breakdown of complex lignocellulosic structures into components such as hydrogen, carbon monoxide, methane, and carbon dioxide [6]. Research has been performed, varying parameters such as the feedstock and collector and reactor configuration [7], leading to developments that allow gasification at low temperatures and different types of bed reactors such as a spouted and fluidized bed [8]. SG has been researched to varying degrees of success; for example, the efficiency of the process has varied from 20 to around 70% [9,10]. Unlike conventional gasification, SG is subject to natural fluctuations in solar irradiance and weather, introducing thermal and operational variability, and making experimentation complicated and expensive [11]. Additional challenges for SG lie in aspects such as material durability and scalability; nonetheless, with enough development, this technology is promising [5].
This complex environment provides a unique opportunity to apply artificial intelligence (AI) tools such as Machine Learning (ML), which enables real-time modelling, optimization, and adaptation of the process [12]. ML requires data for adequate training, which can be supplied from experiments or computational simulations. Computational simulations based off engineering tools such as Computational Fluid Dynamics (CFD for short, using software such as Ansys Fluent), Process Modelling based off kinetic or equilibrium calculations (using software such as Aspen Plus), and finite-element (with software like Abaqus) offer reliable results and, while they can be complicated to develop and computationally demanding, tackle many of the problems associated with experimentation; hence, these can be a valuable asset in the development of ML models [13,14]. Previous studies have employed CFD and Process Modelling software to obtain training and validation data, then proceeded to use ML models to extrapolate results while reducing computation time [14,15].
Recent ML advancements have enabled highly accurate predictions of reaction kinetics, syngas yield, and product quality, even under variable input conditions [12,16]. Algorithms such as Artificial Neural Networks (ANN), Support Vector Machines (SVM), decision trees, XGBoost, and CatBoost have been successfully used to model non-linear systems and optimize parameters such as the temperature, steam-to-biomass ratio, and equivalence ratio [17,18]. ML models applied to this context can be trained with data on chemical composition, moisture, ash content, and thermal properties, along with seasonal solar simulations by region. Particularly relevant is the trend toward hybrid models, which integrate physicochemical equations with ML, improving the generalization capacity for new biomass types and variable solar conditions, while decreasing computation time [5,12,19]. ML models make it possible to quickly compare inputs and operational conditions, supporting strategic decisions about the sustainable use of biomass resources, as well as the selection of reactors and gasifying agents, leading to cost reductions; hence, when properly trained, they can be favoured over traditional models [18,20].
ML has been employed to simulate SG with different goals and research methodologies. For example, it has been employed for multi-objective optimization in a solar tower system, with costs and environmental performance as objective functions, while considering aspects such as the plant location and five different biomasses where the research results indicate that the process can reduce environmental impact by around 416,000 CO2eq [21]. Other works employ ML models to obtain mathematical relationships between parameters, with input parameters such as the temperature and carbon feeding rate and output parameters such as H2 or CO production or reactor efficiency, with the goal of simplifying calculations and generalizing results [22]. Similarly, ML has been employed to reduce the computation times of the simulation of combined cycles with chemical production by using algorithms such as Support Vector Machines, finding that ML can relate the process efficiency and chemical production rate as a function of temperature, solar irradiation and operation unit characteristics (such as operation pressure) [14], or, in novel processes that involve the solar chemical looping gasification of biomass to enhance the syngas H2 contents, employing the algorithms to predict the product gas composition [23]. Since the number of parameters that affect SG outcomes is extensive, a work that studies the relationship between inputs and outputs, using methodologies such as Machine Learning, could provide an upper hand in the development of novel efficient renewable energy technologies to satisfy the growing needs of society.
This work presents an analysis of the relationship between solar steam gasification parameters and product characteristics, considering the biomass composition (ultimate analysis), the solar irradiation that arrives into a solar furnace, where the irradiation is absorbed by a heat transfer fluid (HTF), and the steam-to-biomass ratio inside a downdraft or fluidized bed gasifier, using simulations based off thermodynamics and three ML algorithms (Artificial Neural Networks, Support Vector Machines, and Random Forests). The ML algorithms were chosen based on their robustness and capability to capture non-lineal interactions; on the other hand, algorithms like XGBoost were not tested since the literature has reported that for multivariate regression problems, traditional algorithms like Random Forest exhibit better performance and interpretability without intricate hyperparameter tuning [24,25].
Both the thermodynamic simulation and the ML algorithms were developed via Python scripting (version 3.11.13) with the addition of libraries (Cantera 3.1, TensorFlow 2.18, and Scikit Learn 1.6.1). Different operation parameters (such as solar radiation rates) are studied, to understand the variations in the product quality under different solar radiation conditions and biomass ratios. The results can be relevant for stakeholders looking to optimize small-scale gasification processes based off solar energy.
The structure of the work is as follows: firstly, the methodology is presented, where the steps followed for the development of the thermodynamic simulation model and the different Machine Learning algorithms as well as the procedure followed for the validation of the models is described. Afterwards, the results and discussion section is provided, where results from the thermodynamic simulations are presented, followed by a comparison of the three studied ML models. From the comparison of the models, one is studied in detail (Random Forest), and the algorithm is used to study in detail the relationships between the operation conditions and the results by using a feature importance analysis. Finally, a summary and conclusion section is conferred, where the main findings of the works are presented in bullet points, together with an outline for potential future work.
2. Methodology
2.1. Description of the Model
A thermodynamic Gibb’s free energy minimization-based model was developed to simulate SG (assuming a solar furnace in equilibrium) using the Python library Cantera (version 3.1.0), where the input values were the biomass ultimate analysis (that is, elemental composition in C, H, O, and N mass percentages), the Direct Normal Irradiance (DNI), and the Steam-To-Biomass ratio (SBR), where the output is a gas composed of H2, CO, CO2, CH4, C6H6, and solid char. The gasifier is considered as a 0D reactor, where transport properties are ignored, and reaction results are only a function of the gasification temperature (which is a function of input DNI), biomass composition, and SBR. Since tar is a complex mixture of (mostly aromatic) hydrocarbons that decompose and polymerize over a wide range of temperatures, simulation models often include model tars representative of different tar species. In this work, benzene (C6H6) is a condensable refractive tar precursor which afterward forms C7H8 and C10H8 to represent different types of tar, which decompose at temperatures between around 973 K and 1300 K [26].
Full transport in a gasification model can be computationally demanding and complicated; at the same time, the literature has shown that downdraft and fluidized bed gasifiers can be simulated accurately using the Gibb’s free energy minimization method [27]. Therefore, the presented model makes the following assumptions: (1) residence time does not influence the reaction; (2) the inorganic contents (that is, ashes) in the biomass do not participate in the reaction; (3) the biomasses are considered to be free of moisture; (4) the gasifier loses to the surroundings 20% of heat generated by oxidation reactions; (5) only carbon, hydrogen, oxygen, and nitrogen participate in the mass balances (due to the other elements constituting biomass being in negligible amounts) [28]; (6) a single tar precursor (benzene) is formed during the decomposition of biomass, which undergoes “HACA” (hydrogen abstraction/acetylene addition) and forms C7H8 (toluene) and C10H8 (naphthalene) (the three tars were chosen due to their refractiveness and prevalence in downdraft gasifiers [29,30]); and (7) biomass decomposition (e.g., devolatilization followed by cellulose, hemicellulose and lignin decomposition) occurs instantly.
The mass balance involves solving the global reaction:
where α, β, and γ are normalized values based on the biomass ultimate analysis; xi is the mass fraction of the i species in the product; and δ is a normalized steam mass.
CHαOβNγ + δH2O(g) ⟶ x1H2 + x2CO + x3CO2 + x4CH4 + x5Tar + x6H2O + x7C(s) + x8N2
The steam mass was calculated from the steam-to-biomass ratio (SBR):
where Yi are the mole flows of the species i (either steam or biomass).
SBR = Ysteam/Ybiomass
2.2. Energy Balance
A solar furnace is assumed as the employed technology in SG, with a solar receiver Concentration Ratio (CR) of 100 [31]. A theoretical scheme of the functioning of the system is portrayed in Figure 1.
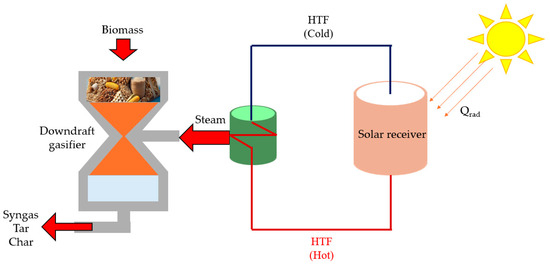
Figure 1.
Theoretical schematic of the solar gasification system.
The heat absorbed by the steam as heat transfer fluid (HTF) is calculated by the following relationship:
where Qrad is the energy collected by the receiver and transferred to the gasifier (in kWh), DNI is the Direct Normal Irradiation (in kWh/m2) and Areceiver and ηreceiver are the solar collector area (in m2) and efficiency (assumed as 80%), respectively.
Qrad = ηreceiver ∙ CR ∙ Areceiver ∙ DNI
The maximum achievable temperature under the DNI was calculated following the Stefan–Boltzmann law:
where ε is the collector’s emissivity (dimensionless), σ is the Stefan–Boltzmann constant (5.670374 × 10⁻⁸ W m−2 K−4), and T0 and THTF are the ambient and HTF temperatures (in K), respectively, assumed as constant and considering a black body. The temperature of the reactants inside the gasifier was calculated with the following:
where ηHE is the heat exchanger efficiency (dimensionless) and Cp,i and mi are the specific heat (in J/kgK) and masses (in kg) of species i.
Qrad = εσ(THTF4 − T04)
Tgas = T0 + ηHE (Qrad/(∑Cp,i mi)
The enthalpy of reaction (in J/mol) was calculated with the following:
where Δhi0 is the enthalpy of formation of species i and yi is the mass fraction of species i. The heat of formation, ΔH0Biomass, and Lower Heating Value of the fed biomass, LHVbiomass, (both in MJ/kg) were calculated with the following [1]:
where wi is the mass fraction of species i, from the ultimate analysis of the processed biomass.
ΔHrxn = ∑yi Δhi0
ΔH0i = ΔH0CO2 + 0.5 α ΔH0H2O + (12 + α + 16β)LHVbiomass
LHVbiomass = 34.835wc + 93.87wH − 10.8wO + 6.28wN + 10.465wS
2.3. Gasification Analysis
The Cold Gas Efficiency (CGE), which relates the heating values of the syngas and the feedstock, is calculated with the following expression:
where ρsyngas is the syngas density, and the LHV of the syngas is calculated (in MJ/Nm3) from its composition [32,33]:
CGE = ρsyngasLHVsyngas/LHVbiomas
LHVsyngas = 4.18 (2.57YH2 + 3.0YCO + 8.54YCO2 + 15.13YCH4)
Finally, the Carbon Conversion Efficiency (CCE) is calculated with the following expression [17]:
CCE = (YCO + YCO2 + YCH4)/YC,biomass
2.4. Gasification Model Validation
The model was validated by simulating 32 gasification experiments from literature and comparing the produced syngas composition [33,34,35,36,37,38,39,40]. To assess the accuracy of the model, the Mean Absolute Error (MAE) and Root Mean Square Error (RMSE) were calculated with the following formulas:
where Yi are the values obtained by the model, Xi are the values reported by literature, and n is the number of experiments. Details of the model MAE and RMSE (calculated by averaging the MAE and RMSE from comparing with the literature), by species, can be found in Table 1, where it can be seen that, in percentages, the error was less than 5%.
MAE = ∑(Yi − Xi)/n
RMSE = [∑(Yi − Xi)2/n]1/2

Table 1.
Mean Absolute Error and Root Mean Square Error obtained from comparing the simulation with literature results.
2.5. Machine Learning Algorithms
Three different Machine Learning (ML) algorithms were evaluated in the simulation. The algorithms were trained and validated from 8316 simulation results obtained, considering 40 different biomasses whose composition was obtained in the literature and can be found in Table 2. Different biomasses including bark, grass, and food waste, among others, were employed in the analysis, to provide information considering the variability of the biomass’s ultimate composition.
Table 2.
Elemental composition of the biomasses used to obtain data for the Machine Learning Models.
Besides the biomass composition, the DNI (from 635 to 3337 kWh/m2, which can represent places with moderately low DNI such as Finland and places with extreme DNI such as Chile, using solar technologies with high concentration ratio, needed to achieve temperatures above 1000 °C [51]) and SBR (from 0.2 to 1.2, identified as ratios used in the literature [52,53]) were varied.
After obtaining the simulation results, the data was used to develop, train, and test ML models using the open-source Python libraries Scikit-learn (version 1.7.1) and TensorFlow (2.17). An overview of the process is portrayed in Figure 2. Artificial Neural Network (ANN), Support Vector Machine (SVM), and Random Forest (RF) algorithms were deemed suitable due to their ability to handle non-linear variables and not being prone to overfitting [18]. The input data was standardized using a standard scaler, while the output values were normalized using a MinMaxScaler for numerical stability, convergence, and error estimation. A 5-fold cross validation was employed (where the data is split into five subsets, using four subsets for training and the remaining for validation, five times) to assess the performance of the ML models, which has been reported to provide unbiased results efficiently when compared with other methodologies such as a 10-fold cross validation [54].
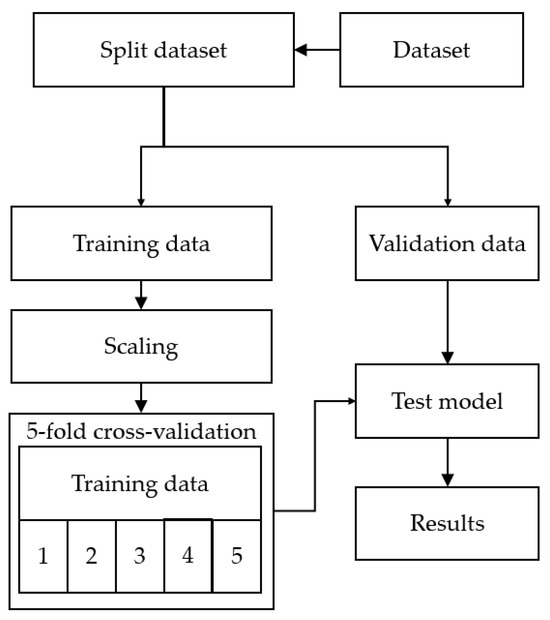
Figure 2.
Machine Learning algorithm workflow.
The ANN model was developed and subject to hyperparameter tuning, where the modified parameters included the number of hidden layers, the transfer function, and the model solving method. The final model containing 128 neurons in 2 hidden layers, employing rectifier linear units (ReLU) as activation functions and the Adaptive Moment Estimation (Adam) optimizer, where the hyperparameters were selected to capture non-linear relationships between the inputs and outputs [55]. The SVM model was developed following a similar tuning methodology; in the end, the model used a regularization parameter of 1 (to balance between bias and variance), a Radial Basis Function (RBF) kernel, and had gamma calculated based on the number of features (to avoid overfitting due to the variable non-homogeneous biomass composition) [56]. Finally, the RF model was tuned and included 200 trees in the forest, 15 as max tree depth, and 42 as random state (to prevent overfitting and ensure reproducibility of the results) [56].
3. Results and Discussion
To understand the results provided by the simulation using Machine Learning algorithms, in this section, results from the Gibb’s free energy model simulations are first presented. Afterwards, the different employed ML algorithms are compared in terms of accuracy, followed by a feature importance analysis to relate the inputs and the outputs, and provide information for potential optimization of processes for future research endeavours.
3.1. Simulation Results
Results present the effect of the gasification operation parameters in the gasification efficiencies (CGE and CCE), the tar concentration, gas yield, and LHV. Figure 3a shows the effect of solar radiation in the CGE and CCE, considering a SBR of 0.5; it can be seen that increasing solar radiation (and hence, the gasification temperature) results in an increased efficiency (for both cold gas and carbon conversion), where the change is most significant in the CCE (especially at low temperatures where cellulose, hemicellulose, and lignin start decomposing) due to increases in the thermal decomposition of the biomass with temperature (which leads to more syngas being produced from gasification); the increase with temperature becomes less pronounced at higher temperatures due to most biomass being already decomposed. Figure 3b shows the effect of solar radiation on the syngas LHV (in MJ/Nm3), tar contents (in g/Nm3) and gas yield (in Nm3/kg of gasified biomass). The tar concentration decreases at a constant rate with increasing radiation, disappearing entirely at around 1350 kWh (or a gasification temperature around 1200 K) due to complete tar cracking/reforming [57]. The gas yield increases with radiation, with the effect being more significant in the same temperature range at which the major increase in CCE occurs (from 600 to around 1700 kWh), followed by a plateau in rate of change (due to thermodynamic limitations). The increase in gas yield with radiation occurs because increasing the radiation increases the thermal decomposition of solid biomass into syngas. Finally, it can be observed that the syngas lower heating value decreases with increasing temperature; this happens due to the reverse water gas shift and dry reforming reactions occurring and forming CO, H2, and H2O (and also explaining the increase in gas yield), as well as due to methane becoming steam reformed into H2, which has a lower volumetric LHV [58,59].
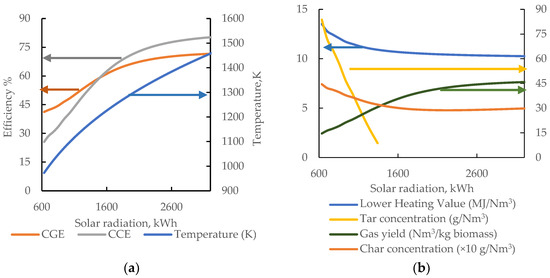
Figure 3.
Effect of solar radiation on (a) gasification efficiency and (b) syngas characteristics. The arrows represent the axis used for the corresponding-colored series.
Figure 4 portrays the effect of the SBR in the efficiencies (Figure 4a) and syngas LHV, gas yield, and char and tar concentrations (Figure 4b), showing the effect considering a radiation of 800 kWh. It can be seen that increasing the SBR results in an increased CCE and decreased CGE; this occurs because with more steam, the rate of syngas formation from gasification increases (due to more steam becoming available for the oxidation and reduction of biomass), but the syngas becomes diluted with gases (excess steam). Figure 4b shows that the SBR has a significant inverse effect on the tar and char concentrations (that is, the tar decreases with the increasing SBR because the tar reforms into H2, CO, and CO2 [57]) and a direct effect in the gas yield; similarly, steam reforms char; hence, less char is formed with high SBR values. On the other hand, the SBR decreases the syngas LHV, in agreement with the decrease in CGE due to dilution with steam.
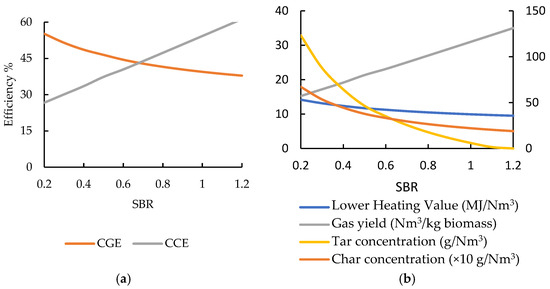
Figure 4.
Effect of the Steam-to-Biomass Ratio on (a) gasification efficiency and (b) syngas quality.
All in all, it might be argued that the syngas quality decreases with increasing SBR and increases with increasing solar radiation. In this sense, the SBR can be manipulated to adjust the gas yield, while the radiation may be tuned (via the inclusion of automatic control or the inclusion of shade-like masking devices [7]) to find a spot where the tar contents are at a minimum without compromising the syngas LHV. On another hand, it must be considered that the increase in SBR results in the process being more energy intensive due to the energy required to produce steam (since the production of steam requires energy, which, in the presented work, is assumed as coming from a solar collector).
3.2. Comparison of the Machine Learning Algorithms
The three studied ML models were compared by means of the MAE, RMSE, and R2 on a species basis as well as considering the predicted gas yield (per kg of gasified biomass), syngas LHV, CGE, and CCE. Additionally, the computation time is included in the table, to compare the computational intensity of the different models. The results are portrayed in Table 3. The RF exhibits the best performance while the SVM exhibits the worst (in terms of MAE, RMSE, and R2). Moreover, all the models have difficulties in calculating the syngas tar concentration due to the non-linearity of the chemical kinetics involved.
Table 3.
Mean Absolute Error, Root Mean Square Error, and coefficients of determination obtained with the validation data, using the different ML models.
Although the RF exhibited the longest computational time, due to its accuracy, it was used for further analysis, mainly focusing on a feature importance analysis to understand the relationship between the targets and the input features, with the goal of finding optimal points for SG.
3.3. Feature Importance Analysis
A feature importance analysis was conducted in the Random Forest algorithm using per target multi-output regression [26], with each of the targets trained in a separate RF. Results can be found in Figure 5 and Figure 6, while the cross-validation results of the model are found in Table 4. Overall, the most important features are the incident solar radiation assumed as captured by the solar collector (which translates into gasification temperature) and the SBR (as seen in Figure 5), where the gasification temperature (directly related to solar radiation) has the most significant effect on the CO, CO2, and CH4 contents, the SBR having the most significant effect on the H2 and char contents, and both solar radiation and the SBR having a similar effect on the tar concentration. Increasing the radiation received by the gasifier results in an increased gasification temperature, which leads to the tar cracking (hence, a reduction in the tar contents). In a similar manner, increasing the SBR provides not only more hydrogen for H2 formation but also contributes to tar reforming for additional H2 production.
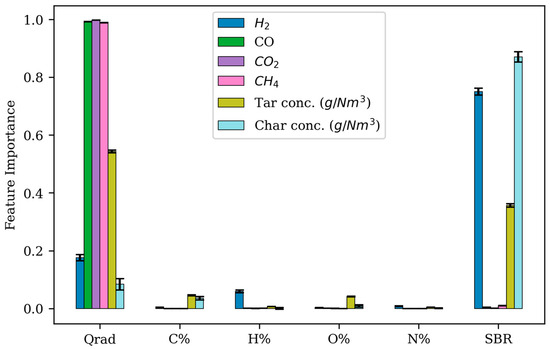
Figure 5.
Effect of the gasification conditions and the biomass composition on the syngas composition, considering the overall normalized feature importance.
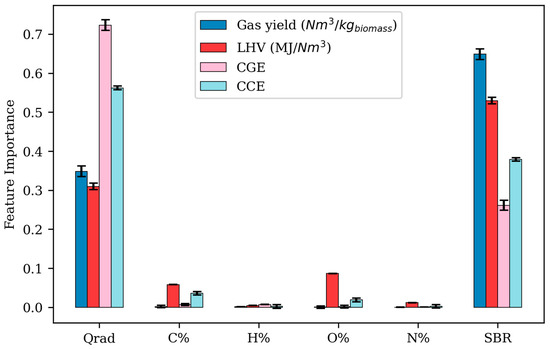
Figure 6.
Effect of the gasification conditions and the biomass composition in the gasification efficiencies, gas yield, and syngas LHV, considering the overall normalized feature importance.
Table 4.
Results from the cross-validation of the RF model.
Figure 6 shows an importance analysis in terms of the effect on the gasification efficiencies, amount of produced gas (gas yield), and syngas LHV. It can be seen that the most significant contribution for the CGE and CCE comes from the radiation, while the gas yield and LHV are mostly affected by the SBR; this is expected since increasing the SBR results in a larger gaseous steam mass being used during the gasification (resulting in a larger gas mass being produced) while also affecting the water–gas shift reaction equilibrium and diluting the syngas with steam.
To observe the effect of the biomass composition on the syngas characteristics, Figure 7 portrays a normalized feature importance analysis considering only the biomass elemental composition. While the hydrogen content in the biomass has the most impact on the produced H2, the syngas LHV depends more on the biomass carbon and oxygen than the hydrogen contents. At the same time, carbon has the highest importance in the formation of tar and char; this occurs since tar is mostly aromatic hydrocarbons requiring carbon atoms to form, while char is composed of pure carbon. Therefore, biomasses must be carefully selected since even if the produced syngas has a larger LHV, if there is tar present, it must be removed, requiring additional energy and offsetting the LHV.
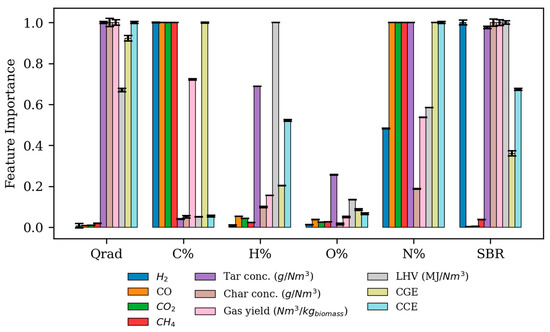
Figure 7.
Effect of the biomass on the syngas composition.
3.4. Effect of the Elemental Ratios in the Syngas Composition
Simulations were conducted using the RF model varying the C/O and C/H ratios in the biomass composition; the C/N ratio was not varied as nitrogen is mostly inert during steam gasification, and the nitrogen percentage is very small compared with carbon (averaging at 1.36% across all of the studied biomasses, compared with 50% being the average carbon percentage) [26]. The goal of varying the ratios is to generate information about the suitability of different biomasses for gasification. Figure 8 shows the composition of the syngas at different C/O ratios during gasification at 973 K and a SBR of 0.8 (which are considered a low gasification temperature and intermediate SBR that will ensure tar is not thermally cracked nor reformed due to a high SBR [52,59]). It is shown that as the H2 and CO percentage decreases, the tar and char increase and the CO and CH4 exhibit a negligible change. The increase in char is related to the number of available C atoms for carbon formation, while change in tar percentage is related to a shift in the equilibrium in the water–gas shift reaction (CO + H2O ⟶ CO2 + H2), which is also related to the decrease in H2 and CO2.
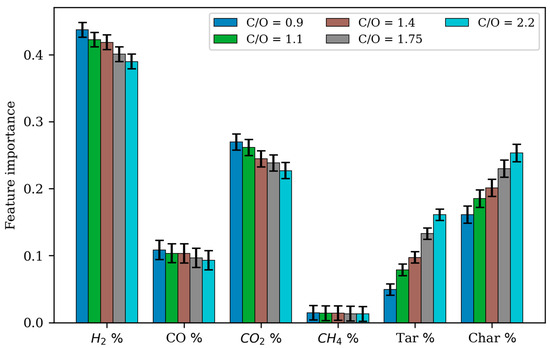
Figure 8.
Effect of the C/O ratio on the composition of the syngas, produced at 973 K and a SBR of 0.8.
Figure 9 shows the effect of the biomass C/H ratio on the produced syngas composition at 973 K and a SBR of 0.8. The graphic shows that increasing the C/H decreases the amount of H2 (significantly) and methane (marginally) while increasing the product’s tar, char, CO, and CO2 concentrations, where the largest increase is found in the CO2. This translates into making biomasses with a large C/H ratio potentially unsuitable for energy production, or else, relying on co-gasification with feedstocks with a large hydrogen percentage (for example, plastics [50]).
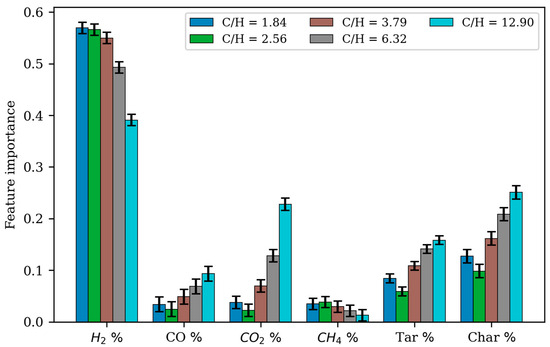
Figure 9.
Effect of the C/H ratio on the composition of the syngas, produced at 973 K and a SBR of 0.8.
Table 5 shows the elemental ratios for different biomasses from the literature; most of the reported biomasses have a C/O ratio between 0.94 and 1.60 and C/H ratios between 6 and 10. The C/H ratio can be adjusted by co-gasification of the biomass with plastics (for example, polyethylene or polypropylene) to increase the LHV of the syngas or prepare it for downstream upgrading with processes such as Fischer–Tropsch synthesis, while the C/O ratio can be adjusted with biomasses such as bark or macroalgae (which are at the upper and lower extremes of the ratios, respectively). This presents an important opportunity, due to the abundance of plastic waste and macroalgae such as sargassum, which get washed ashore seasonally.
Table 5.
Elemental ratios from different biomasses reported in the literature.
Based on the presented analysis, biomasses with low C/O ratios, like barks and husks, and low C/H ratios, like husks and straws, are the most suitable for gasification, depending on the end-use application (e.g., the synthesis of liquid fuels requires biomasses with low C/O and C/H ratios, while burning for heat can use a wider range of different biomasses). On the contrary, biomasses like bamboo or Christmas trees might not be as adequate for gasification, since these might lead to the formation of large amounts of tar while also producing gas with lesser amounts of H2, which will translate into high energy consumptions for tar removal, offsetting the potential advantage of gasification as a methodology to produce fuels from waste.
4. Summary and Conclusions
Simulations of steam gasification considering solar radiation as a source of energy were conducted using an in-house developed Python code (version 3.11.13), and the results were used for the development of three Machine Learning models based off different algorithms: Artificial Neural Networks, Support Vector Machines, and Random Forest. From the findings, the following were concluded:
- From the three tested ML algorithms, Random Forest provided the best accuracy (average R2 = 0.942, Mean Absolute Error = 0.086, and Root Mean Square Error = 0.951).
- Regarding the ultimate composition of the biomass, the element that had the most significant effect in the syngas composition was hydrogen, while byproducts such as tar and solid char were mostly impacted by the carbon percentage.
- Biomasses with low C/O and C/H ratios are the most suitable for gasification, since increasing their ratios increases tar production while also decreasing H2 production.
- The produced syngas lower heating value decreases with the hydrogen percentage and increases with carbon and oxygen. The gas yield increases with carbon and hydrogen.
- The gasification efficiency was measured by using the Cold Gas and Carbon Conversion Efficiencies (CGE and CCE). It was found that the amount of radiation (and hence temperature) had a significant impact in both efficiencies, since at higher DNIs, a higher CGE and CCE were found. On the other hand, increasing the steam-to-biomass ratio increased the CCE but decreased the CGE (due to the dilution of syngas with steam).
The results presented can be useful for the design of novel processes, which can also benefit from the implementation of automation for optimization.
Due to the intermittent nature of solar gasification, it is crucial to incorporate dynamic control strategies that validate the operational feasibility of solar processes and optimize their performance throughout the year; hence, future work will study ML algorithms for control purposes. Moreover, future works will study the incorporation of biomass mixtures (given that solid waste consists of a plethora of different mixed substances) and co-gasification with plastics, to adjust the C/H and C/O ratios. Moreover, the design of integral processes, which consider power generation or heat storage, represents an opportunity for research left unattended. Implementing these techniques, together with understanding the process variables, represents a key step toward the continuous and stable operation of hybrid solar gasification plants, with properly regulated syngas production. In combination with multi-objective optimization methodologies and life cycle assessments, ideally, future efforts will lead to the design of efficient, regionalized gasification systems adaptable to local socioeconomic conditions.
Author Contributions
Conceptualization, D.A.B.-M. and V.M.M.-S.; methodology, D.A.B.-M.; software, D.A.B.-M. and V.M.M.-S.; validation, D.A.B.-M.; formal analysis, D.A.B.-M. and V.M.M.-S.; investigation, V.M.M.-S.; resources, D.A.B.-M. and V.M.M.-S.; data curation, V.M.M.-S.; writing—original draft preparation, D.A.B.-M. and V.M.M.-S.; writing—review and editing, D.A.B.-M. and V.M.M.-S.; visualization, V.M.M.-S.; supervision, D.A.B.-M.; project administration, D.A.B.-M.; funding acquisition, D.A.B.-M. All authors have read and agreed to the published version of the manuscript.
Funding
This work was supported by the Instituto Tecnológico y de Estudios Superiores de Monterrey through the Publications Support Fund (FAP, by its initials in Spanish).
Data Availability Statement
Data available on request.
Acknowledgments
The authors would like to thank the financial support received from Tecnologico de Monterrey through the “Challenge-Based Research Founding Program 2024”, Project ID FP_EIC_CLS_S_4, “Integrated Circular Economy Pathways for Agro-industrial Waste: Composting, Biochar- Enhanced Anaerobic Digestion, and AI Optimization”.
Conflicts of Interest
The authors declare no conflicts of interest.
Abbreviations
The following abbreviations/Greek letters/symbols are used in this manuscript:
| abbreviations | |
| ANN | Artificial Neural Network |
| CCE | Carbon Conversion Efficiency |
| CGE | Cold Gas Efficiency |
| HTF | Heat Transfer Fluid |
| LHV | Lower Heating Value |
| MAE | Mean Absolute Error |
| ML | Machine Learning |
| RF | Random Forest |
| RMSE | Root Mean Square Error |
| SBR | Steam-to-Biomass ratio |
| SG | Solar Gasification |
| SVM | Support Vector Machine |
| WGS | Water–gas shift |
| Greek letters | |
| α | Normalized value from biomass ultimate analysis |
| β | Normalized value from biomass ultimate analysis |
| γ | Normalized value from biomass ultimate analysis |
| δ | Normalized steam mass |
| ε | Emissivity |
| ηreceiver | Solar receiver efficiency |
| σ | Steffan–Boltzmann constant |
| ρsyngas | Syngas density |
| symbols | |
| Areceiver | Solar receiver area |
| Cp | Specific heat at constant pressure |
| CR | Concentration Ratio |
| DNI | Direct Normal Irradiance |
| ΔH0Biomass | Enthalpy of formation of biomass |
| Δhi0 | Enthalpy of formation of species i |
| ΔHrxn | Enthalpy of reaction |
| Qrad | Energy collected by the receiver and transferred to gasifier |
| SBR | Steam-to-Biomass Ratio |
| T0 | Ambient temperature |
| Tgas | Gasification temperature |
| THTF | Heat transfer fluid temperature |
| wi | Mass fraction of species i from ultimate analysis |
| xi | Mass fraction of species i |
| Yi | Mole fraction of species i |
References
- Buentello-Montoya, D.A.; Sepúlveda-Montufar, L.; Pulido-Moreno, D.O. Valorization of waste biomass via an integrated gasification system for the co-production of dimethyl ether and urea. Energy 2025, 319, 134891. [Google Scholar] [CrossRef]
- Rabeti, S.A.M.; Manesh, M.H.K.; Amidpour, M. Techno-economic and environmental assessment of a novel polygeneration system based on integration of biomass air-steam gasification and solar parabolic trough collector. Sustain. Energy Technol. Assess. 2023, 56, 103030. [Google Scholar] [CrossRef]
- Freda, C.; Tarquini, P.; Sharma, V.K.; Braccio, G. Thermodynamic improvement of solar driven gasification compared to conventional one. Energy 2022, 261, 124953. [Google Scholar] [CrossRef]
- Ling, J.L.J.; Go, E.S.; Park, Y.K.; Lee, S.H. Recent advances of hybrid solar—Biomass thermo-chemical conversion systems. Chemosphere 2022, 290, 133245. [Google Scholar] [CrossRef]
- Fang, Y.; Paul, M.C.; Varjani, S.; Li, X.; Park, Y.-K.; You, S. Concentrated solar thermochemical gasification of biomass: Principles, applications, and development. Renew. Sustain. Energy Rev. 2021, 150, 111484. [Google Scholar] [CrossRef]
- Ouedraogo, H.; Sadio Sidibe, S.D.; Richardson, Y. Advancing small-scale biomass gasification (10–200 kW) for energy access: Syngas purification, system modeling and the role of artificial intelligence-A review. Energy Convers. Manag. X 2025, 27, 101059. [Google Scholar] [CrossRef]
- Maytorena, V.M.; Buentello-Montoya, D.A. Worldwide developments and challenges for solar pyrolysis. Heliyon 2024, 10, e35464. [Google Scholar] [CrossRef]
- Ravaghi-Ardebili, Z.; Manenti, F.; Corbetta, M.; Pirola, C.; Ranzi, E. Biomass gasification using low-temperature solar-driven steam supply. Renew. Energy 2015, 74, 671–680. [Google Scholar] [CrossRef]
- Lichty, P.; Perkins, C.; Woodruff, B.; Bingham, C.; Weimer, A. Rapid High Temperature Solar Thermal Biomass Gasification in a Prototype Cavity Reactor. J. Sol. Energy Eng. 2010, 132, 011012. [Google Scholar] [CrossRef]
- Müller, R.; Zedtwitz, P.V.; Wokaun, A.; Steinfeld, A. Kinetic investigation on steam gasification of charcoal under direct high-flux irradiation. Chem. Eng. Sci. 2003, 58, 5111–5119. [Google Scholar] [CrossRef]
- Jeon, P.R.; Moon, J.-H.; Ogunsola, N.O.; Lee, S.H.; Ling, J.L.J.; You, S.; Park, Y.-K. Recent advances and future prospects of thermochemical biofuel conversion processes with machine learning. Chem. Eng. J. 2023, 471, 144503. [Google Scholar] [CrossRef]
- Bellan, S.; Kodama, T.; Matsubara, K.; Gokon, N.; Cho, H.S.; Inoue, K. Thermal performance of a 30 kW fluidized bed reactor for solar gasification: A CFD-DEM study. Chem. Eng. J. 2019, 360, 1287–1300. [Google Scholar] [CrossRef]
- Li, X.; Zhong, K.; Feng, L. Machine learning-based metaheuristic optimization of an integrated biomass gasification cycle for fuel and cooling production. Fuel 2023, 332, 125969. [Google Scholar] [CrossRef]
- Liu, Y.; Pan, R.; Ansart, R.; Debenest, G. Optimization and analysis of solar-driven biomass gasification using a CFD-ANN-GA framework. Energy 2025, 325, 136036. [Google Scholar] [CrossRef]
- Mutlu, A.Y.; Yucel, O. An artificial intelligence based approach to predicting syngas composition for downdraft biomass gasification. Energy 2018, 165, 895–901. [Google Scholar] [CrossRef]
- Alrbai, M.; Al-Dahidi, S.; Alahmer, H.; Shboul, B.; Rinchi, B.; Al-Ghussain, L.; Abusorra, M.; Ayadi, O.; Alahmer, A. Applications of machine learning and multi-objective optimization in agricultural waste management: A techno-economic study of hydrogen production from olive waste via combined air-steam gasification. Bioresour. Technol. 2025, 434, 132844. [Google Scholar] [CrossRef] [PubMed]
- Meena, M.; Kumar, H.; Chaturvedi, N.D.; Kovalev, A.A.; Bolshev, V.; Kovalev, D.A.; Sarangi, P.K.; Chawade, A.; Rajput, M.S.; Vivekanand, V.; et al. Biomass Gasification and Applied Intelligent Retrieval in Modeling. Energies 2023, 16, 6524. [Google Scholar] [CrossRef]
- Fang, Y.; Li, X.; Wang, X.; Dai, L.; Ruan, R.; You, S. Machine learning-based multi-objective optimization of concentrated solar thermal gasification of biomass incorporating life cycle assessment and techno-economic analysis. Energy Convers. Manag. 2024, 302, 118137. [Google Scholar] [CrossRef]
- Ascher, S. Environmental and Techno-Economic Analysis of Biomass and Waste Gasification Facilitated by Machine Learning. Ph.D. Thesis, University of Glasgow, Glasgow, UK, 2024. [Google Scholar]
- Mahdavi, N.; Dutta, A.; Tasnim, S.H.; Mahmud, S. Review of machine learning techniques for energy sharing and biomass waste gasification pathways in integrating solar greenhouses into smart energy systems. Energy AI 2025, 20, 100498. [Google Scholar] [CrossRef]
- Tasneem, S.; Ageeli, A.A.; Alamier, W.M.; Hasan, N.; Goodarzi, M. Development of machine learning-based models for describing processes in a continuous solar-driven biomass gasifier. Int. J. Hydrogen Energy 2024, 52, 718–738. [Google Scholar] [CrossRef]
- Tahir, F.; Arshad, M.Y.; Saeed, M.A.; Ali, U. Integrated process for simulation of gasification and chemical looping hydrogen production using Artificial Neural Network and machine learning validation. Energy Convers. Manag. 2023, 296, 117702. [Google Scholar] [CrossRef]
- Ascher, S.; Wang, X.; Watson, I.; Sloan, W.; You, S. Interpretable machine learning to model biomass and waste gasification. Bioresour. Technol. 2022, 364, 128062. [Google Scholar] [CrossRef]
- Chen, T.; Guestrin, C. XGBoost: A scalable tree boosting system. In Proceedings of the ACM SIGKDD International Conference on Knowledge Discovery and Data Mining, San Francisco, CA, USA, 13–17 August 2016; Association for Computing Machinery: New York, NY, USA, 2016; pp. 785–794. [Google Scholar] [CrossRef]
- Laghari, A.A.; Jamro, I.A.; Kumar, A.; Chen, G.; Sajnani, S.; Guo, Z.; Shen, Y.; Zhang, J.; Khoso, S.; Guo, Q.; et al. Catalytic gasification of municipal solid waste using eggshell-derived CaO catalyst: An investigation of optimum H2 production, production distribution, and tar compounds. Next Sustain. 2024, 4, 100038. [Google Scholar] [CrossRef]
- Puig-Arnavat, M.; Bruno, J.C.; Coronas, A. Review and analysis of biomass gasification models. Renew. Sustain. Energy Rev. 2010, 14, 2841–2851. [Google Scholar] [CrossRef]
- Liu, Y.; Pan, R.; Ansart, R.; Debenest, G. Numerical simulation of solar-driven biomass gasification by using ceramic foam. Process Saf. Environ. Prot. 2024, 184, 300–313. [Google Scholar] [CrossRef]
- Jess, A. Mechanisms and Kinetics of Thermal Reactions of Aromatics From Pyrolysis of Solid Fuels. Fuel 1996, 75, 1441–1448. [Google Scholar] [CrossRef]
- Frenklach, M. Reaction mechanism of soot formation in flames. Phys. Chem. Chem. Phys. 2002, 4, 2028–2037. [Google Scholar] [CrossRef]
- Sajjadnejad, M.; Haghshenas, S.M.S.; Targhi, V.T.; Zahmatkesh, H.G.; Naeimi, M. Utilization of Sustainable Energies for Purification of Water. Adv. J. Chem. Sect. A 2020, 3, 493–509. [Google Scholar] [CrossRef]
- Fiore, M.; Magi, V.; Viggiano, A. Internal combustion engines powered by syngas: A review. Appl. Energy 2020, 276, 115415. [Google Scholar] [CrossRef]
- Samani, N.; Khalil, R.; Seljeskog, M.; Bakken, J.; Thapa, R.K.; Eikeland, M.S. Experimental and simulation studies of oxygen-blown, steam-injected, entrained flow gasification of lignin. Fuel 2024, 362, 130713. [Google Scholar] [CrossRef]
- Li, J.; Qiao, Y.; Chen, X.; Zong, P.; Qin, S.; Wu, Y.; Wang, S.; Zhang, H.; Tian, Y. Steam gasification of land, coastal zone and marine biomass by thermal gravimetric analyzer and a free-fall tubular gasifier: Biochars reactivity and hydrogen-rich syngas production. Bioresour. Technol. 2019, 289, 121495. [Google Scholar] [CrossRef]
- Tuomi, S.; Kaisalo, N.; Simell, P.; Kurkela, E. Effect of pressure on tar decomposition activity of different bed materials in biomass gasification conditions. Fuel 2015, 158, 293–305. [Google Scholar] [CrossRef]
- Barman, N.S.; Ghosh, S.; De, S. Gasification of biomass in a fixed bed downdraft gasifier—A realistic model including tar. Bioresour. Technol. 2012, 107, 505–511. [Google Scholar] [CrossRef]
- Jayah, T.H.; Aye, L.; Fuller, R.J.; Stewart, D.F. Computer simulation of a downdraft wood gasifier for tea drying. Biomass Bioenergy 2003, 25, 459–469. [Google Scholar] [CrossRef]
- Bates, R.B.; Ghoniem, A.F.; Jablonski, W.S.; Carpenter, D.L.; Altantzis, C.; Grag, A.; Barton, J.L.; Chen, R.; Field, R.P. Steam-Air Blown Bubbling Fluidized Bed Biomass Gasification (BFBBG): Multi-Scale Models and Experimental Validation. AIChE J. 2017, 63, 1543–1565. [Google Scholar] [CrossRef]
- Choi, Y.K.; Cho, M.H.; Kim, J.S. Steam/oxygen gasification of dried sewage sludge in a two-stage gasifier: Effects of the steam to fuel ratio and ash of the activated carbon on the production of hydrogen and tar removal. Energy 2015, 91, 160–167. [Google Scholar] [CrossRef]
- Aydin, E.S.; Yucel, O.; Sadikoglu, H. Development of a semi-empirical equilibrium model for downdraft gasification systems. Energy 2017, 130, 86–98. [Google Scholar] [CrossRef]
- Miles, T.R.; Miles, T.R., Jr.; Baxter, L.L.; Bryers, R.W.; Jenkins, B.M.; Oden, L.L. Alkali Deposits Found in Biomass Power Plants: A Preliminary Investigation of Their Extent and Nature; National Renewable Energy Laboratory: Golden, CO, USA, 1995. [Google Scholar]
- Bryers, R.W. Fireside slagging, fouling, and high-temperature corrosion of heat-transfer surface due to impurities in steam-raising fuels. Prog. Energy Combust. Sci. 1996, 22, 29–120. [Google Scholar] [CrossRef]
- Scurlock, J.M.O.; Dayton, D.C.; Hames, B. Bamboo: An overlooked biomass resource? Biomass Bioenergy 2000, 19, 229–244. [Google Scholar] [CrossRef]
- Moilanen, A. Thermogravimetric Characterisations of Biomass and Waste for Gasification Processes; VTT Technical Research Centre of Finland: Espoo, Finland, 2006; Volume 607, p. 103. [Google Scholar]
- Masiá, A.A.T.; Buhre, B.J.P.; Gupta, R.P.; Wall, T.F. Characterising ash of biomass and waste. Fuel Process. Technol. 2007, 88, 1071–1081. [Google Scholar] [CrossRef]
- Theis, M.; Skrifvars, B.-J.; Hupa, M.; Tran, H. Fouling tendency of ash resulting from burning mixtures of biofuels. Part 1: Deposition rates. Fuel 2006, 85, 1125–1130. [Google Scholar] [CrossRef]
- Werther, J.; Saenger, M.; Hartge, E.-U.; Ogada, T.; Siagi, Z. Combustion of agricultural residues. Prog. Energy Combust. Sci. 2000, 26, 1–27. [Google Scholar] [CrossRef]
- Demirbas, A. Combustion characteristics of different biomass fuels. Prog. Energy Combust. Sci. 2004, 30, 219–230. [Google Scholar] [CrossRef]
- Lapuerta, M.; Hernández, J.J.; Pazo, A.; López, J. Gasification and co-gasification of biomass wastes: Effect of the biomass origin and the gasifier operating conditions. Fuel Process. Technol. 2008, 89, 828–837. [Google Scholar] [CrossRef]
- Buentello-Montoya, D.A.; Armenta-Gutiérrez, M.Á.; Maytorena-Soria, V.M. Parametric Modelling Study to Determine the Feasibility of the Co-Gasification of Macroalgae and Plastics for the Production of Hydrogen-Rich Syngas. Energies 2023, 16, 6819. [Google Scholar] [CrossRef]
- Global Solar Atlas. Available online: https://globalsolaratlas.info/detail?c=28.971803,-110.99762,11&s=29.098177,-110.954361&m=site (accessed on 15 June 2025).
- Zhang, Y.; Xu, P.; Liang, S.; Liu, B.; Shuai, Y.; Li, B. Exergy analysis of hydrogen production from steam gasification of biomass: A review. Int. J. Hydrogen Energy 2019, 44, 14290–14302. [Google Scholar] [CrossRef]
- Umeki, K.; Yamamoto, K.; Namioka, T.; Yoshikawa, K. High temperature steam-only gasification of woody biomass. Appl. Energy 2010, 87, 791–798. [Google Scholar] [CrossRef]
- Pachouly, J.; Ahirrao, S.; Kotecha, K.; Selvachandran, G.; Abraham, A. A systematic literature review on software defect prediction using artificial intelligence: Datasets, Data Validation Methods, Approaches, and Tools. Eng. Appl. Artif. Intell. 2022, 111, 104773. [Google Scholar] [CrossRef]
- Kingma, D.P.; Ba, J. Adam: A Method for Stochastic Optimization. arXiv 2017, arXiv:1412.6980. [Google Scholar]
- Géron, A. Hands-on Machine Learning with Scikit-Learn, Keras, and TensorFlow: Concepts, Tools, and Techniques to Build Intelligent Systems; O’Reilly Media, Inc.: Sebastopol, CA, USA, 2019. [Google Scholar]
- Buentello-Montoya, D.; Zhang, X.; Li, J.; Ranade, V.; Marques, S.; Geron, M. Performance of biochar as a catalyst for tar steam reforming: Effect of the porous structure. Appl. Energy 2020, 259, 114176. [Google Scholar] [CrossRef]
- Toolbox, E. Engineering ToolBox Webpage. Available online: http://www.engineeringtoolbox.com/ (accessed on 15 June 2025).
- Levenspiel, O. Chemical Reaction Engineering. Ind. Eng. Chem. Res. 1999, 38, 4140–4143. [Google Scholar] [CrossRef]
- Abidin, S.Z.; Osazuwa, O.U.; Othman, N.H.; Setiabudi, H.D.; Sulaiman, S. Recent progress on catalyst development in biomass tar steam reforming: Toluene as a biomass tar model compound. Biomass Convers. Biorefinery 2024, 14, 15187–15222. [Google Scholar] [CrossRef]
Disclaimer/Publisher’s Note: The statements, opinions and data contained in all publications are solely those of the individual author(s) and contributor(s) and not of MDPI and/or the editor(s). MDPI and/or the editor(s) disclaim responsibility for any injury to people or property resulting from any ideas, methods, instructions or products referred to in the content. |
© 2025 by the authors. Licensee MDPI, Basel, Switzerland. This article is an open access article distributed under the terms and conditions of the Creative Commons Attribution (CC BY) license (https://creativecommons.org/licenses/by/4.0/).