Article

Influence of the Porous Transport Layer Surface Structure on Overpotentials in PEM Water Electrolysis

Department of Energy and Power Engineering, College of Mechanical and Vehicle Engineering, Hunan University, Changsha 410082, China
*
Authors to whom correspondence should be addressed.
Energies 2025, 18(16), 4396; https://doi.org/10.3390/en18164396
Submission received: 20 July 2025 / Revised: 8 August 2025 / Accepted: 15 August 2025 / Published: 18 August 2025

Abstract

The engineering of porous transport layer (PTL)–catalyst layer (CL) interfacial architecture plays a critical role in optimizing the performance of proton exchange membrane water electrolyzers (PEMWEs). Particularly, at the PTL-CL interface, our results reveal that anode catalyst loadings affect the modulation of the PTL surface structure on the overpotentials of PEMWEs. Under high anode catalyst loadings, the magnitude of overpotentials is predominantly governed by the electronic conductivity and mass transport resistance within the CL, where the modifying effects of PTL-CL interfacial contact characteristics become negligible. However, when the catalyst loading is reduced, the PTL-CL interfacial contact characteristics become critical for electron conduction, mass transport, and kinetic reaction. Under low catalyst loadings, the etched PTL demonstrates a maximum reduction of 59 mV compared to the pristine PTL at 4 A/cm2, with the former exhibiting a 10 mΩ·cm2 reduction. Meanwhile, the etched PTL integrated with a cell demonstrates superior performance in both mass transport and kinetic overpotentials compared to a pristine PTL. This clearly indicates that the surface structure of the PTL plays an increasingly significant role in regulating the overpotentials of PEMWEs as the catalyst loadings decrease.

1. Introduction

In the past few years, hydrogen technology has gained considerable attention and made great progress [1,2]. Proton exchange membrane water electrolyzers (PEMWEs) have emerged as a research hotspot due to their unique advantages in clean hydrogen production [3,4,5,6,7]. This technology produces high-purity hydrogen through the electrocatalytic splitting of water molecules and is characterized by high energy conversion efficiency and rapid dynamic response. Hence, it is regarded as one of the key technologies for enabling a green hydrogen economy [8,9,10,11,12,13,14,15,16,17].
As one of the core components in PEMWEs, the anode porous transport layer (PTL) fulfills multiple critical functions: it must ensure efficient transport of the reaction medium (water) and prompt removal of the product (oxygen), while simultaneously maintaining stable electron conduction pathways and providing reliable mechanical support [18,19,20,21]. Consequently, the PTLs largely dominate the overall efficiency and stability of PEMWEs. In recent years, extensive research has been conducted on PTL structural characteristics, including porosity, pore size distribution, thickness, and surface morphology [22,23,24,25,26]. Previous studies demonstrate that optimizing the micro–nano structural distribution of PTLs represents a crucial research direction for enhancing electrolyzer performance, where the optimization of pore architecture, interfacial contact properties, and mass transport channels proves particularly critical [27,28].
Catalyst loadings represent another critical factor affecting electrolyzer performance. While high catalyst loadings enhance reaction activity, they simultaneously increase costs and material consumption. Consequently, optimizing electrolyzer performance under low catalyst loadings holds significant practical importance. Recent studies have demonstrated improved catalyst layer contact and reactivity through the introduction of microporous layers (MPLs) or optimization of PTL surface structures [29,30]. Lee et al. employed laser ablation technology to engineer the surface structure of the PTL, revealing that optimized interfacial contact enhances catalyst utilization and leads to a significant performance improvement at ultra-low loadings [31]. Furthermore, Hasa et al. demonstrated that the thickness and porosity of the PTL play a critical role in mass transport overpotential, particularly under low catalyst loadings. The introduction of a MPL was shown to effectively improve interfacial contact, mitigate bubble coverage, and consequently reduce both ohmic and mass transport overpotentials [32]. Previous studies have examined the impacts of PTL porosity, thickness, and surface morphology on cell performance under low catalyst loadings. However, the correlation between PTL surface architecture and three key overpotentials (ohmic, mass transport, and kinetic) remains insufficiently understood across different catalyst loadings.
This study aims to elucidate the effects of PTL surface characteristics (smooth vs. rough) on the performance of PEMWEs across distinct catalyst loadings (1.0 mg/cm2 vs. 0.3 mg/cm2 IrO2). By decoupling electrochemical performances, we systematically analyze how PTL surface structures modulate overpotentials at varying loadings, thereby revealing the intrinsic relationship between the surface of the PTL and the performance of the PEMWEs.

2. Experiment

In this study, we investigated the effects of the surface properties of PTLs on the performance of PEMWEs. To ensure the consistency of the experimental conditions during performance tests with high and low anode loadings, we only varied the surface morphology of the PTL as the sole experimental variable. The catalyst-coated membrane (CCM) used for testing was fabricated internally using the decal transfer method. The surface-structural properties of the PTLs were characterized by imaging and analysis using a scanning electron microscope (SEM, ZEISS, IGMAHD, Oberkochen, Germany). The performance of the cell was characterized and analyzed using polarization curves, electrochemical impedance spectroscopy (EIS), and high-frequency resistance (HFR). The following sections, respectively, introduce the fabrication processes of the CCM and PTL, as well as the methods for measurement and data calculation.

2.1. Preparation of Catalyst-Coated Membrane

The ink used to fabricate the anode CL consisted of a mixture of IrO2/TiO2 (IrO2 supported on TiO2, 75 wt% Ir, Elyst Ir75 0480, Umicore, Brussels, Belgium), Nafion ionomer dispersion (20 wt% ionomer solution, D2020, DuPont, Wilmington, DE, USA), deionized water (DI water, 18.2 MΩ·cm), and isopropyl alcohol (IPA, Aladdin, Shanghai, China) using a Nafion/catalyst weight ratio (I/C ratio) of 0.15:1 and a water/alcohol volume ratio of 1:3. For the cathode catalyst ink, Pt/C powder (50 wt% carbon, TEC 10E50E, Tanaka, Tokyo, Japan), D2020 ionomer dispersion, DI water, and IPA were mixed with an I/C ratio of 0.6:1 and a water/alcohol volume ratio of 1:7.
All the inks were magnetically stirred for at least 30 min and then sonicated for the same duration, aiming to obtain homogeneous catalyst inks. The sonication treatments were performed in an ice bath environment to avoid heating and sintering of the catalyst nanoparticles. Before coating, the vacuum adsorption table was heated to 80 °C. A PTFE film was placed on the vacuum adsorption table and a 25 µm thick Kapton mask with an area of 5 cm2 was placed on top of the PTFE film. Then, the catalyst ink was uniformly coated onto the PTFE film using a Mayer rod. The catalyst loadings were determined by weighing the mass difference in the PTFE substrate before and after the decal transfer using a microbalance (±10 μg, Mettler Toledo XSR105, Greifensee, Switzerland). Subsequently, the coated PTFE substrates were hot-pressed onto a Nafion 212 membrane (DuPont, Wilmington, DE, USA) for 10 min at 130 °C under a pressure of 5 MPa. All the cathode catalyst loadings were 0.5 mg/cm2 Pt. For the anode, two catalyst loadings were used: one was 0.3 mg/cm2 IrO2, and the other was 1.0 mg/cm2 IrO2.

2.2. Preparation and Characterization of Different PTLs

Titanium felts (Bekaert, with a thickness of 350 μm and a porosity of 68%, Zwevegem, Belgium) were chosen as the PTLs used in this research. The felts were immersed for 5 min in acetone, then DI water, and finally absolute alcohol. In order to obtain a felt with a rough surface, we submerged the PTLs in a 37% w/w hydrochloric acid solution (Sinopharm Group Co., Ltd., Shanghai, China) at a temperature of 54 °C for 5 min of acid etching. The acid-etched PTLs were ultrasonically cleaned at least twice using DI water and ethanol, respectively, to thoroughly remove residual acid and reaction products from the PTL surface. Finally, the acid-etched PTLs were left to dry at room temperature. SEM was performed using ZEISS-IGMAHD at an accelerating voltage of 10 kV to visualize the PTLs.

2.3. Cell Assembly and Electrochemical Characterization

A platinized bipolar plate with parallel channels was used for the anode and a graphite bipolar plate with parallel channels was used for the cathode. Carbon paper (Toray 090, with a thickness of 280 µm and a porosity of 78%, Tokyo, Japan) was used as the gas diffusion layer (GDL) on the cathode side. By controlling the thickness of the PTFE gasket, the compression ratios of the GDL on the cathode side and the Ti felt on the anode side were both set at 20%. The cell was tightened with eight evenly distributed bolts to 4.5 Nm. The water supply flow rate on the anode side was 20 mL/min and the water supply temperature was 80 °C.
In this work, the electrochemical characterization of a single PEMWE cell was measured using an automated test station, which was equipped with a potentiostat/galvanostat (SP-150e, BioLogic, Grenoble, France) and a 20 A booster (BioLogic, Grenoble, France). The polarization curves were collected via a potentiostat. The EIS plots were recorded from 500 kHz to 50 mHz at 1 A/cm2. The HFR plots were recorded under a high frequency of ~5 kHz by using the Staircase Galvano Electrochemical Impedance Spectroscopy (SGEIS) technique with Biologic EC-Lab software (V11.60). For each condition, two MEAs were used to test and ensured repeatability of the results.
To measure the cell polarization curves, EIS and HFR were used to determine different overpotentials. The following section will discuss the mathematical methods used to calculate the overpotentials.
The cell voltage is composed of reversible cell voltage, ohmic overpotential, kinetic overpotential, and mass transport overpotential [33,34]:
E c e l l = E r e v 0 + η o h m i c + η k i n + η m t
Voltage breakdown analysis was conducted based on this equation. E r e v 0 is the reversible cell voltage, η o h m i c is the ohmic overpotential, η k i n is the kinetic overpotential, and η m t is the mass transport overpotential. The reversible cell voltage can be calculated using the following equation:
E r e v 0 = 1.2291 0.0008456 ( T 298.15 )
T is the cell temperature (K). The ohmic overpotential can be calculated using the following formula:
η o h m i c = i H F R
i is the current density applied to the cell (A/cm2). Due to the slow oxygen evolution reaction process, we only consider the kinetic overpotential at the anode. Kinetic overpotential is calculated based on the Tafel slope as follows:
η k i n = b log ( i / i 0 )
b is the measured Tafel slope (V/dec) and i 0 is the exchange current density (A/cm2). By subtracting the reversible cell voltage, ohmic overpotential, and kinetic overpotential from the measured cell voltage, the mass transport overpotential can be calculated.

3. Results and Discussion

3.1. Acid-Etched Porous Transport Layers

The PTLs before and after acid etching exhibit two distinct surface morphologies. As shown in Figure 1a, the pristine PTL surface remains relatively smooth and lacks microstructural features. By controlling the etching temperature and duration, the fiber architecture of the PTL is preserved while creating pronounced etching traces on the surface (Figure 1b). Higher-magnification SEM characterization of the etched PTL reveals the formation of well-aligned nanopillar structures, as highlighted in Figure 1c,d. These demonstrate that the acid-etching process effectively made the surface of the PTL rough and formed ordered structures.
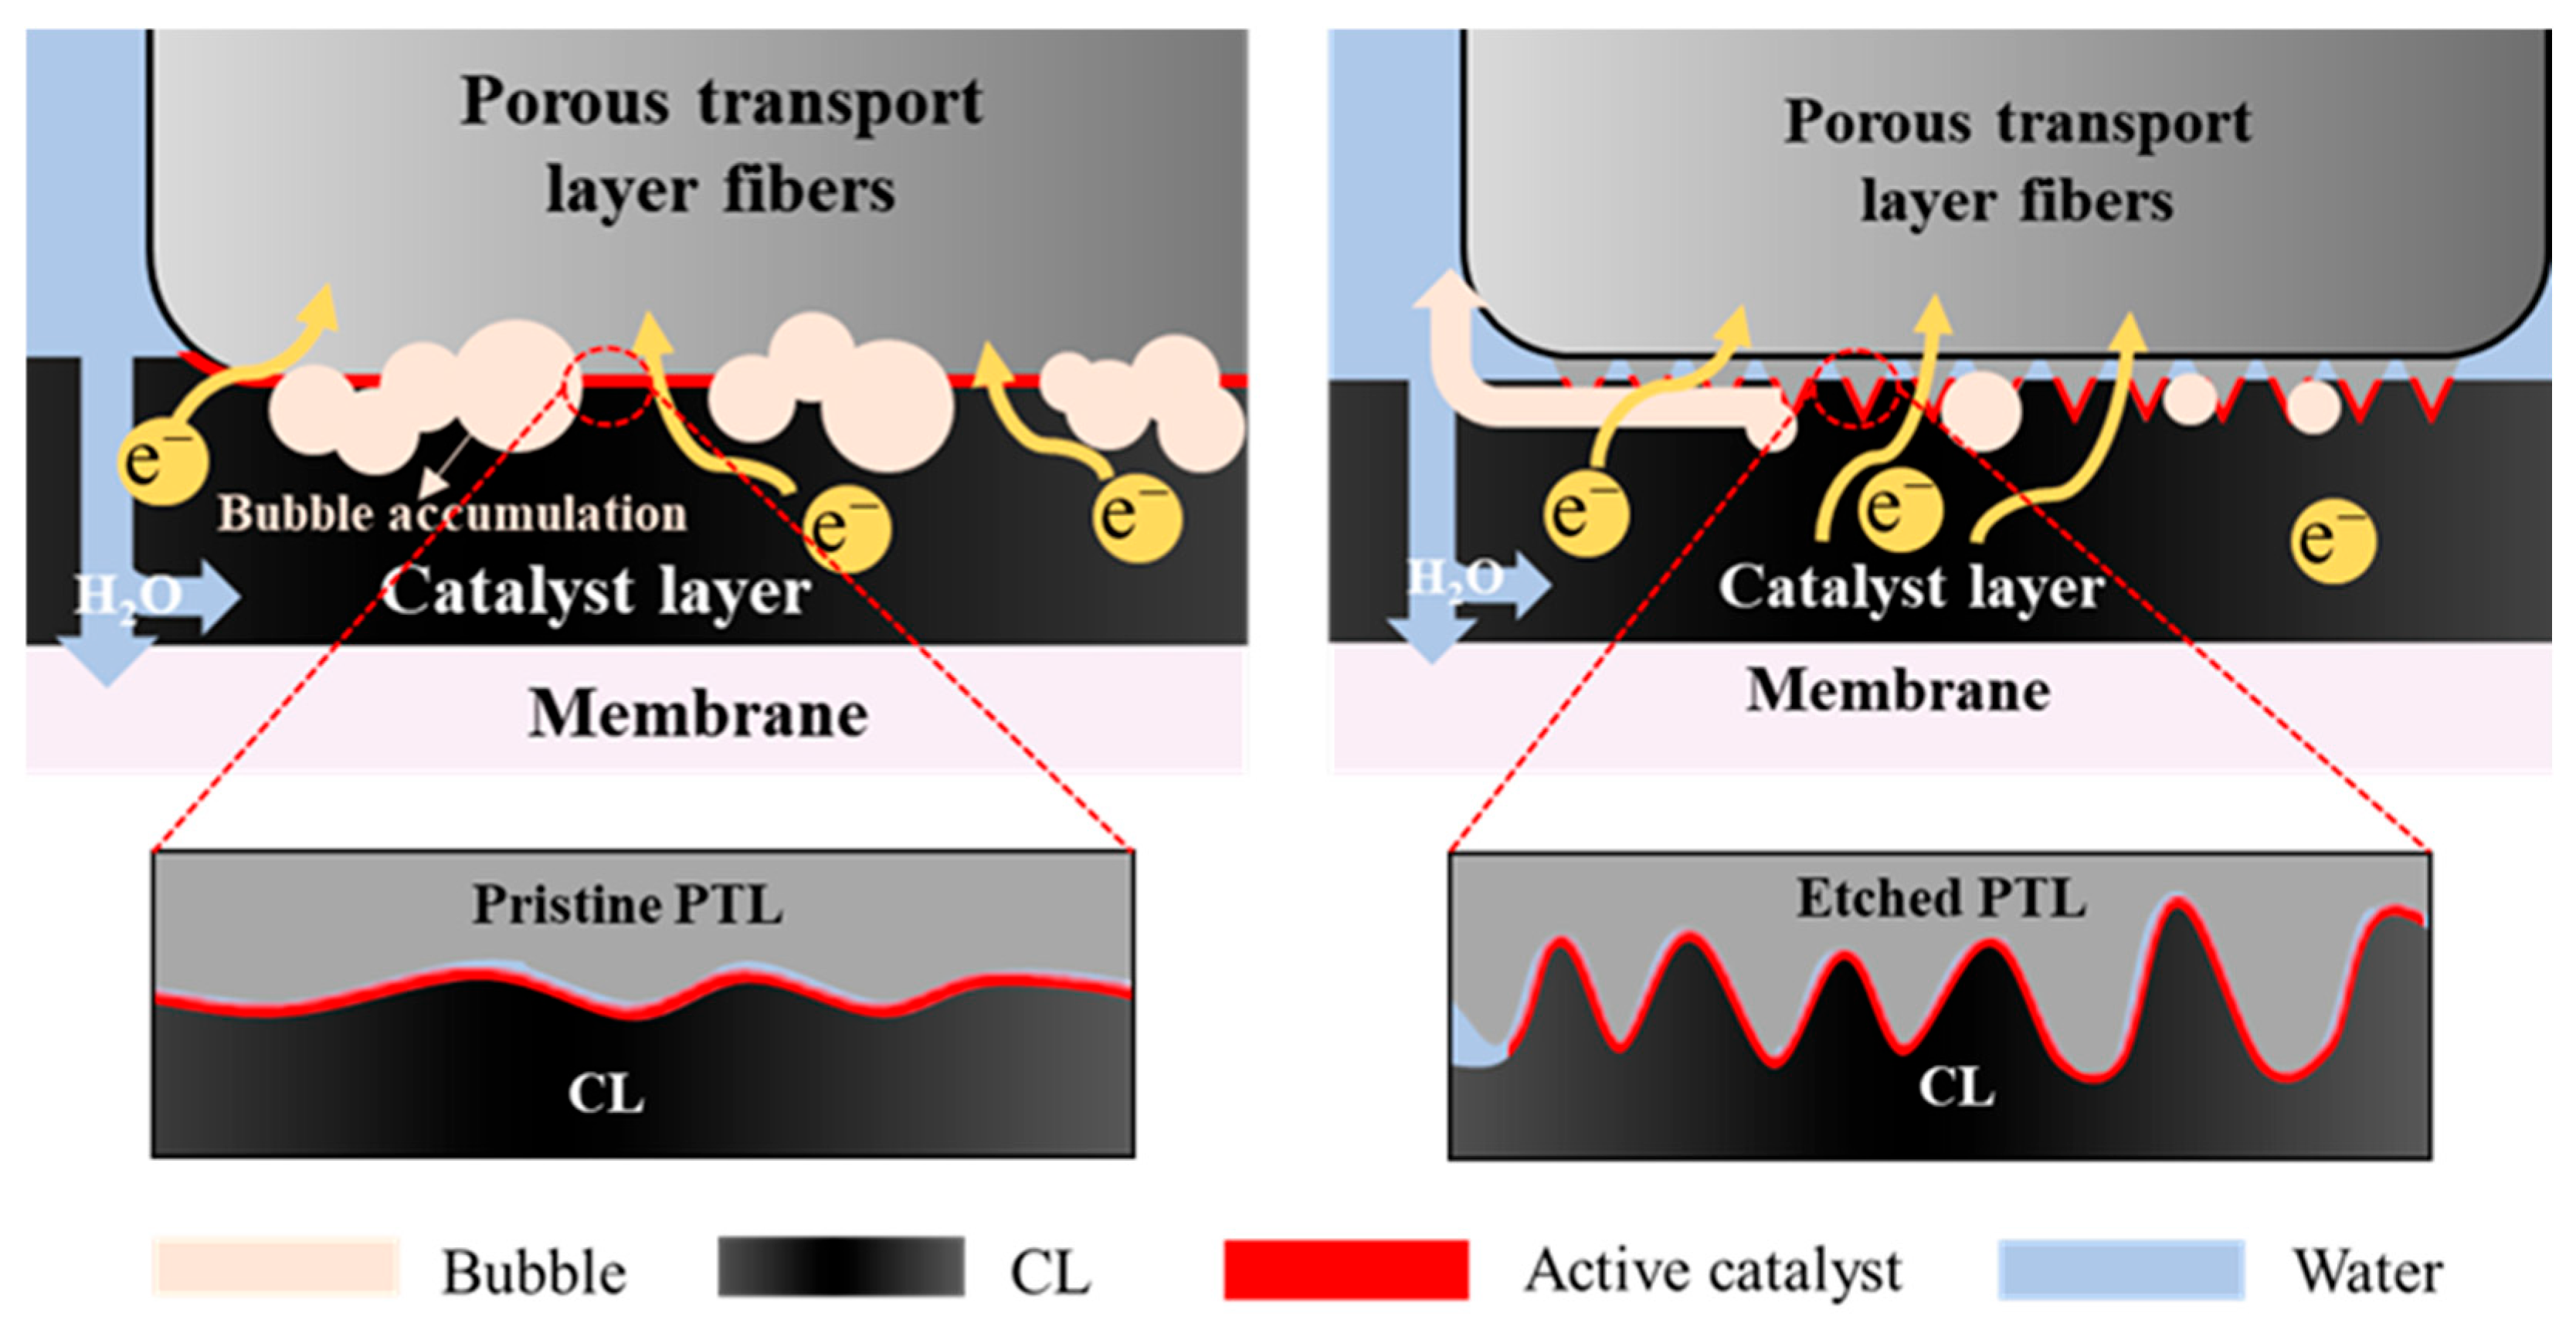
Therefore, because the surface of the anode CL is rough and has a porous structure (Figure S1), the acid-etched PTL with an ordered structure transforms the original planar PTL-CL interface into an interpenetrating three-dimensional contact (Figure 2) and increases the contact area with the CL. The enlarged contact interface is expected to enhance both electron conduction and mass transport efficiency (Figure 2b), while simultaneously increasing the number of triple-phase reaction sites.

3.2. The Influence of PTL Surface Structure on Cell Performance with High Catalyst Loadings

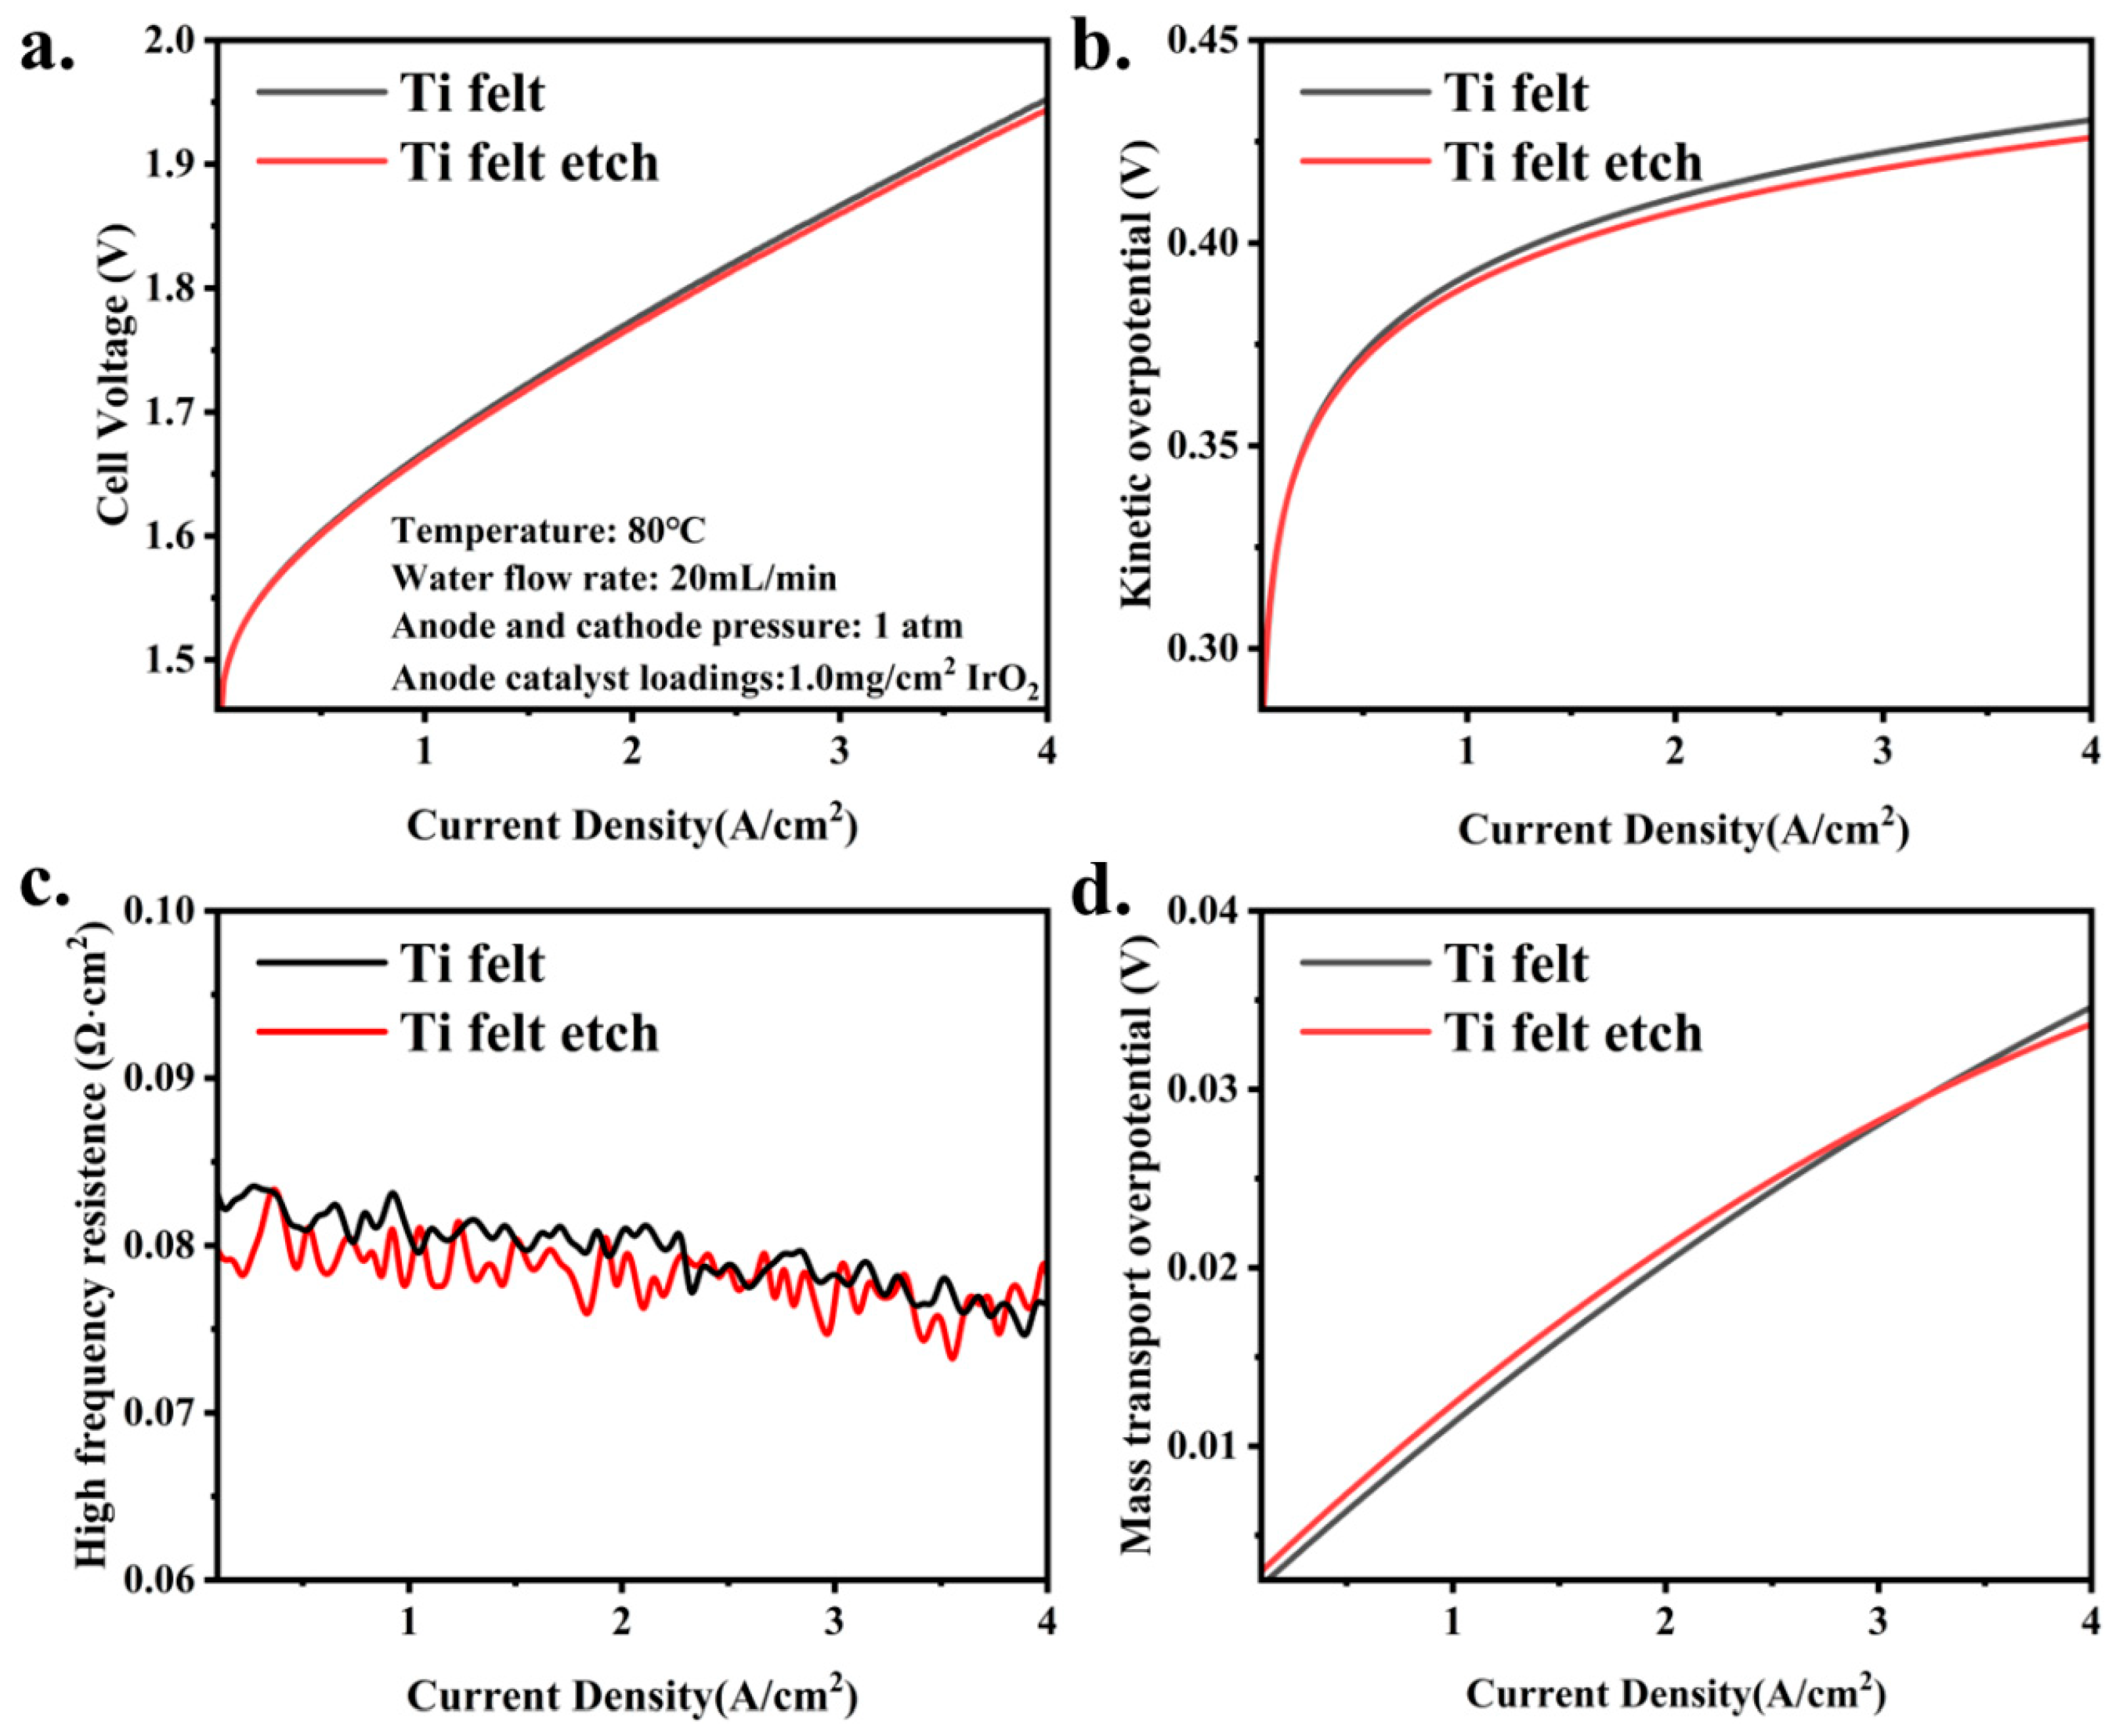
Figure 3 compares the electrochemical performance of electrolyzers assembled with two distinct PTLs under high anode catalyst loadings. As evidenced by Figure 3a,c,d, the results demonstrate nearly identical electrochemical behaviors, including HFR and mass transport overpotential. Compared to the pristine PTL, the etched PTL exhibits a reduced kinetic overpotential only at current densities exceeding 1 A/cm2 (Figure 3b). However, although the performance for the etched PTL shows a trend in improvement in kinetic overpotential, this difference is offset by its continuously adjusted HFR and mass transport overpotential (Figure 3c,d), resulting in minimal performance enhancement in PEMWEs. This phenomenon can likely be attributed to the high density of the active sites within the CL under high anode catalyst loadings, where the CL itself serves as the primary domain for both electron and mass transport, thereby diminishing the benefits of the etched PTL. These results demonstrate that under high catalyst loadings, the surface structure of the PTL is not a critical factor affecting performance.

3.3. The Influence of PTL Surface Structure on Cell Performance with Low Catalyst Loadings

Due to the high electronic conductivity typically associated with high catalyst loadings, the contribution of the etched PTL in improving PTL-CL interfacial electronic transport may be overshadowed by the intrinsically good electronic conductivity within the CL itself. Therefore, we employed CCM with reduced anode catalyst loadings to conduct identical experimental protocols, specifically investigating the influence of PTL surface structure on cell performance under low catalyst loadings.
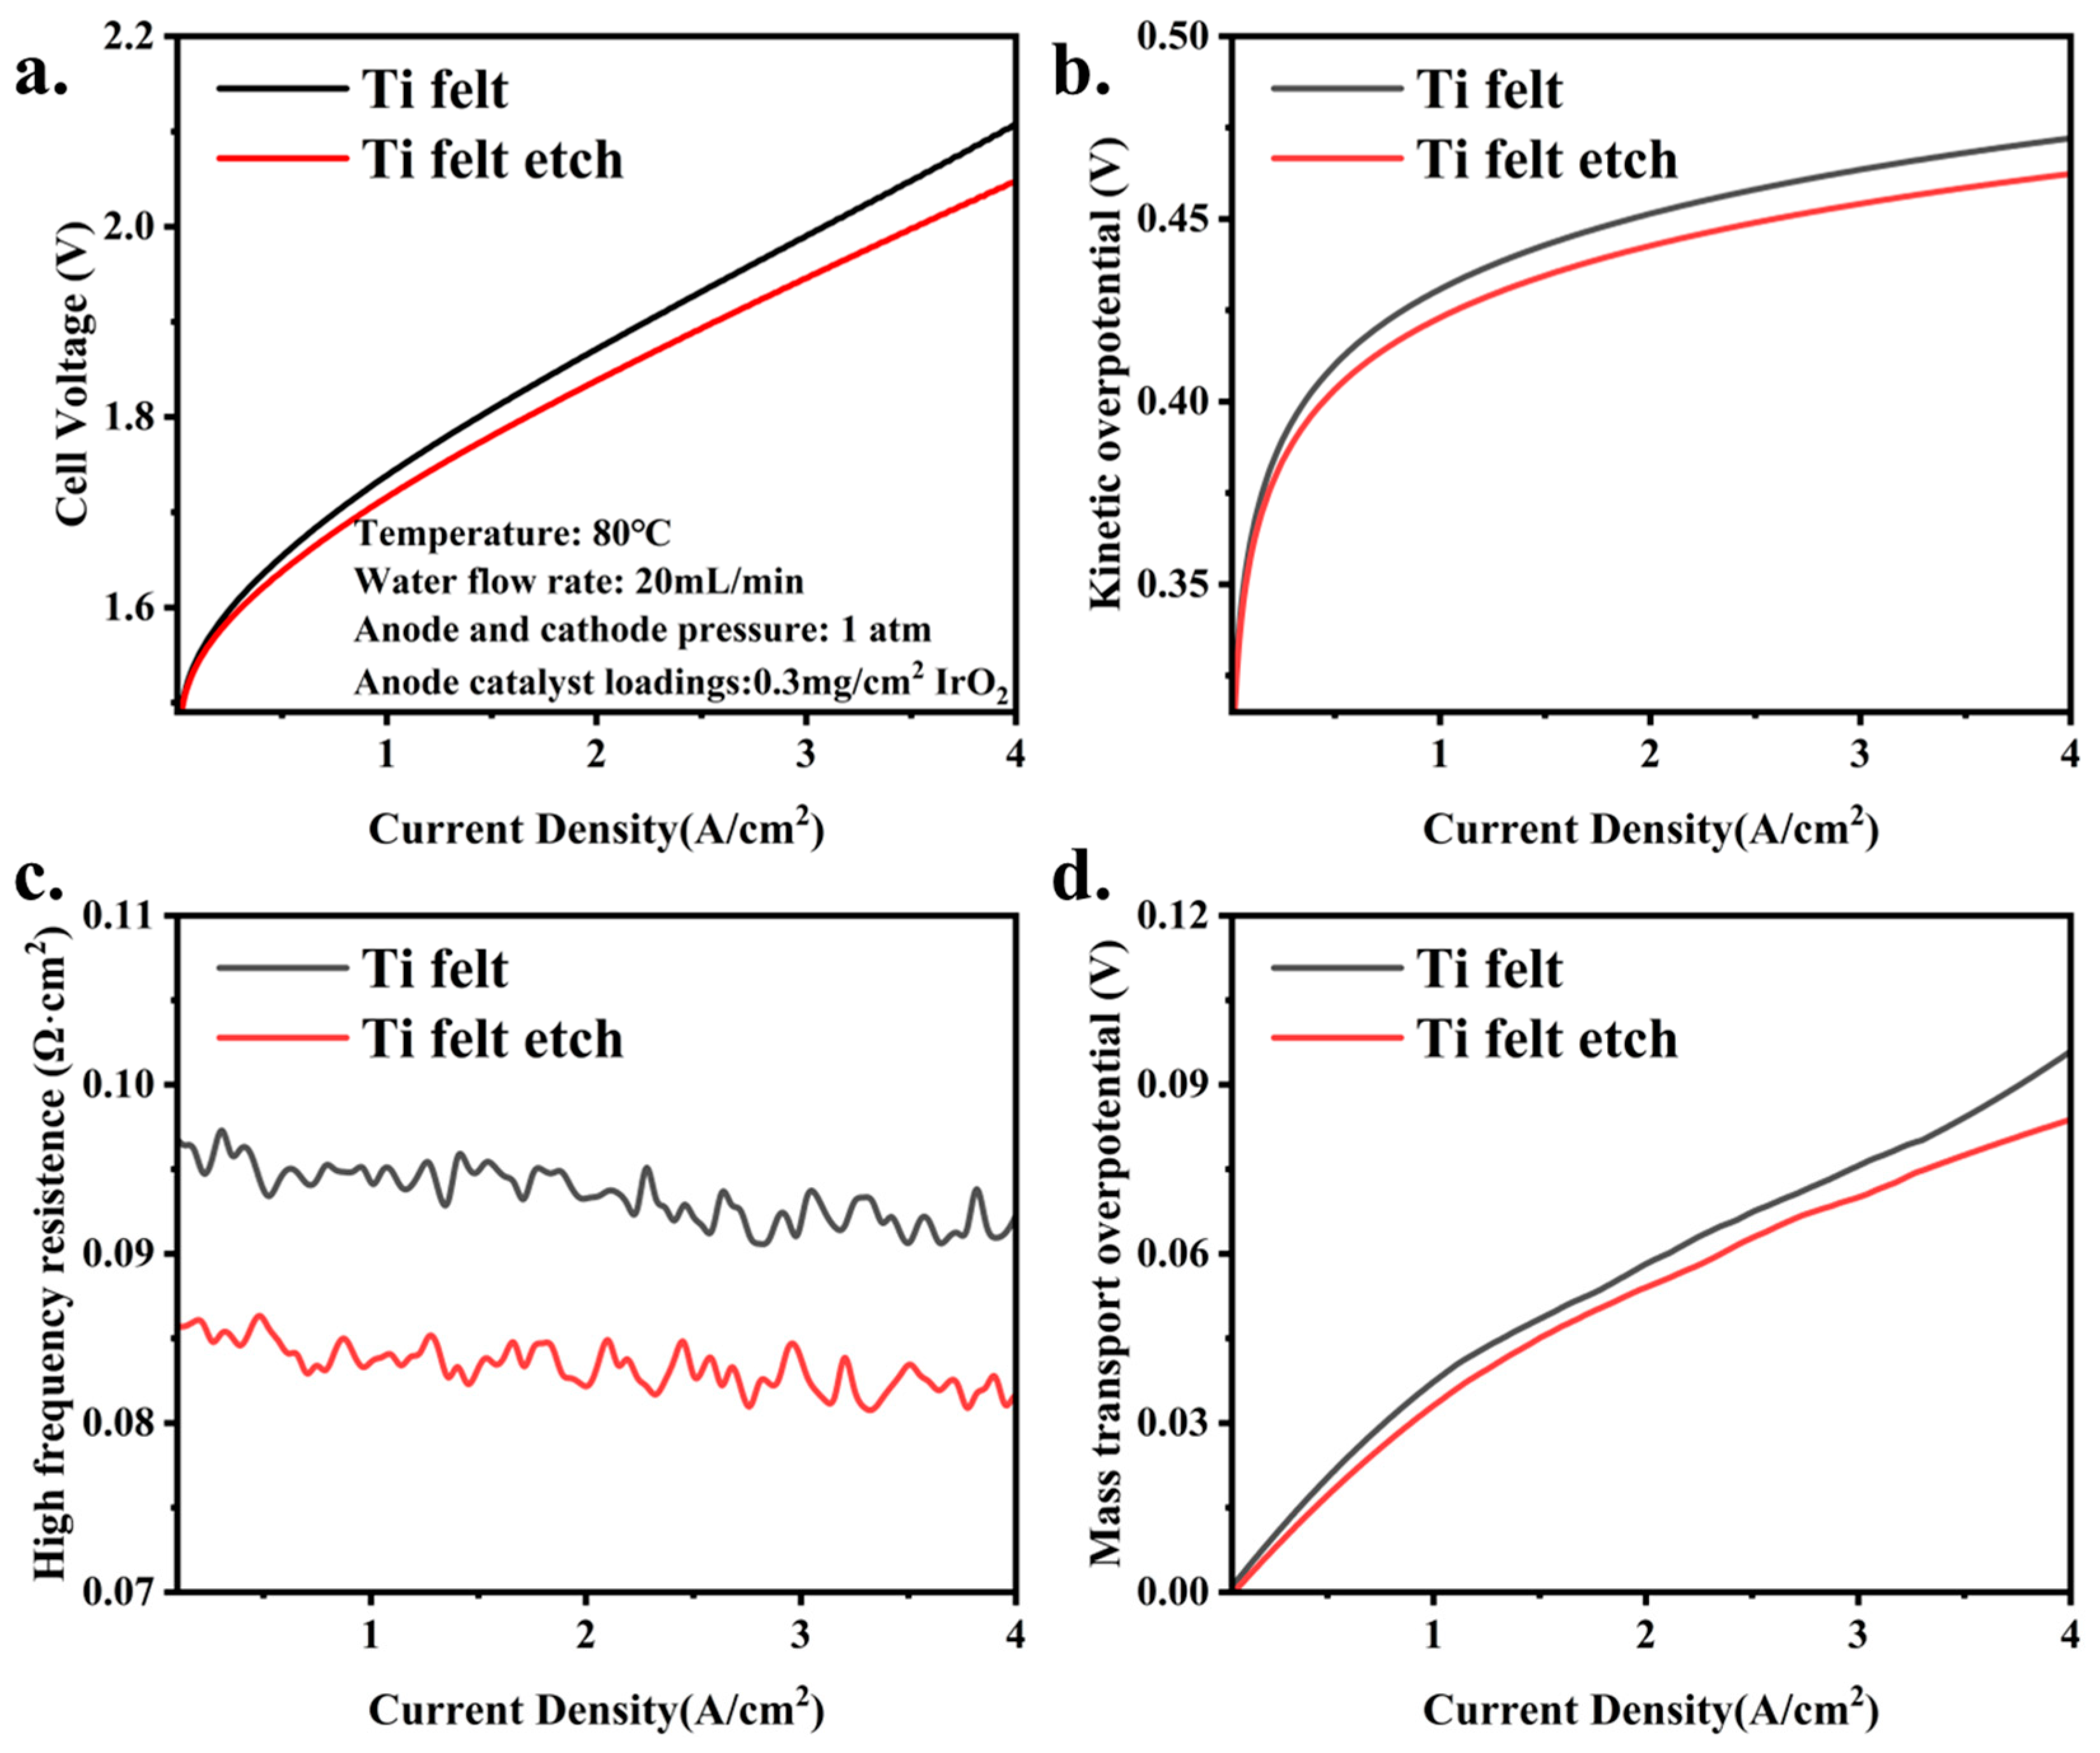
Under low anode catalyst loadings, the performance of cells assembled with the two distinct PTLs are presented in Figure 4. The etched PTL demonstrates significantly superior cell performance compared to the pristine PTL at reduced catalyst loadings (Figure 4a). This performance disparity becomes particularly pronounced at high current densities, reaching a notable potential difference of 59 mV at 4 A/cm2. Notably, both PTLs exhibit higher HFR values under low catalyst loadings compared to high catalyst loadings. However, the etched PTL exhibits a nearly 10 mΩ·cm2 improvement compared to the pristine PTL under low anode catalyst loadings (Figure 4c). This HFR difference did not occur on the CCM with high anode catalyst loadings (Figure 3c). Lopata et al. found that under low catalyst loadings, the in-plane electron transport capability of CL decreases, resulting in enhanced sensitivity to the PTL [35]. This strongly suggests that decreased in-plane conductivity of the CL at lower catalyst loadings amplifies the impact of PTL-CL interfacial properties on electron transport. In other words, under high anode catalyst loadings, the superior in-plane conductivity of the CL dominates electron transport, making bulk CL resistance the primary contributor to HFR. Under these conditions, HFR shows negligible dependence on PTL-CL interfacial characteristics. However, when the catalyst loadings are reduced, the decreased CL conductivity shifts the electron transport bottleneck to the PTL-CL interface. Consequently, interfacial contact properties become the determining factor for HFR values.
As evidenced in Figure 4d, the etched PTL demonstrates improved mass transport overpotential under low catalyst loadings. Crucially, the acid-etching process preserves the PTL’s native fiber architecture and porosity while modifying only its surface structure, transforming the original smooth PTL-CL interface into an interpenetrating contact. Previous studies have shown that nanostructure engineering can promote rapid bubble detachment from electrode surfaces, consequently decreasing bubble coverage and achieving reduced kinetic and mass transport overpotentials [36,37,38]. Thus, this engineered interface is expected to facilitate efficient oxygen bubble release during the oxygen evolution reaction, mitigating gas accumulation at the PTL-CL interface compared to a pristine PTL with a smooth surface. Under low anode catalyst loadings, the observed reductions in both HFR and mass transport overpotential collectively contribute to the improved kinetic overpotential. This kinetic enhancement originates from the optimized PTL-CL interfacial contact, which simultaneously enhances electron conduction and alleviates gas accumulation (Figure 4b). These interfacial improvements effectively increase the density of triple-phase boundaries at the PTL-CL interface, thereby significantly boosting catalyst utilization efficiency.
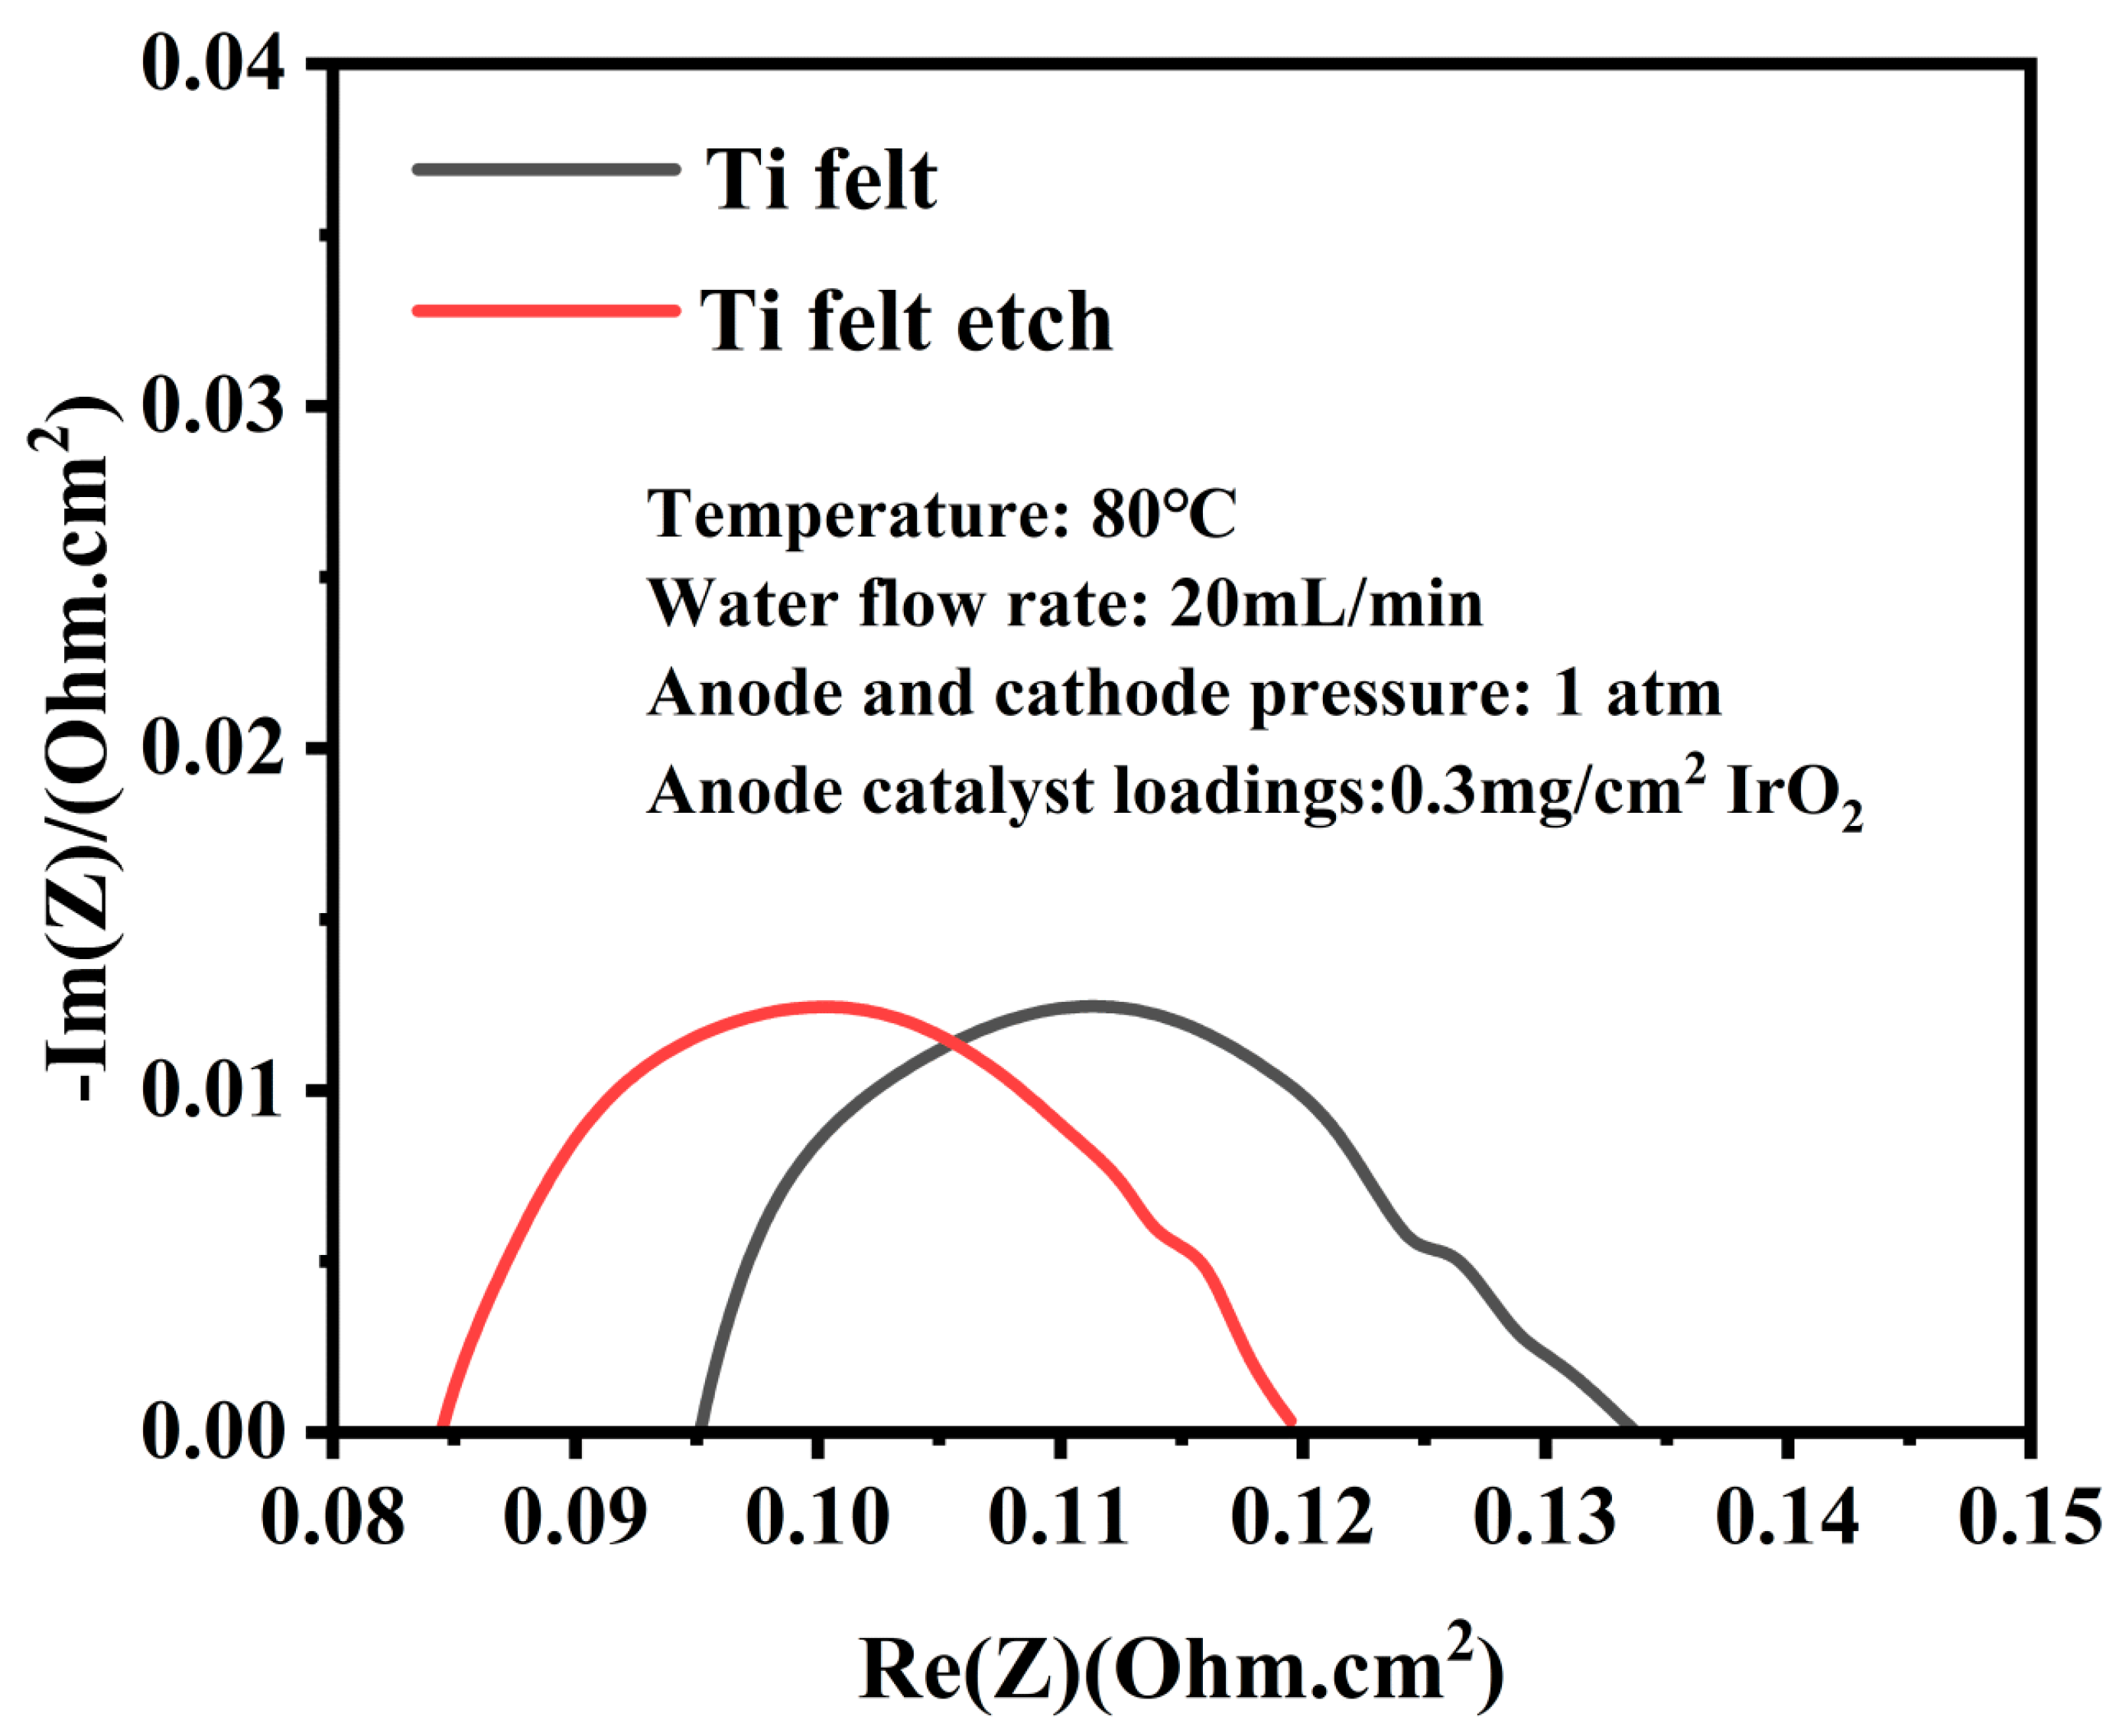
Figure S2 shows a comparison of the Tafel slopes on measured cell potentials at low catalyst loadings for the pristine PTL and etched PTL. Compared to the pristine PTL, the etched PTL demonstrates a lower Tafel slope. This finding indicates that the rough pillar surface structure of the etched PTL improves PTL-CL interface contact relative to the pristine PTL, leading to enhanced electrode kinetics and increased catalyst activity. The high-frequency intercept with the x-axis in the EIS spectra corresponds to the HFR, while the low-frequency intercept represents the low-frequency resistance (LFR) [39,40,41,42]. The difference between these values (LFR-HFR) reflects the sum of kinetic and mass transport resistances. As shown in Figure 5, under low catalyst loadings, the etched PTL demonstrates significantly reduced kinetic and mass transport resistances compared to the pristine PTL. This is quantitatively demonstrated by the smaller semi-arch of the etched PTL (~34 mΩ·cm2) compared to the pristine PTL (~39 mΩ·cm2) in Figure 5. The results clearly indicate that in low-anode-catalyst-loading CCM-based PEMWEs, a PTL with a rough surface significantly enhances both electron and mass transport capabilities compared to a pristine PTL.

4. Conclusions

This study focuses on the effects of the surface structure of the PTL and anode catalyst loadings on the performance of PEMWEs, aiming to better understand how PTL-CL interface characteristics influence various overpotentials. The results reveal that under high anode catalyst loadings, the intrinsic electron conductivity and mass transport resistance within the CL dominantly determine PEMWE overpotentials. In such conditions, the PTL-CL interfacial properties contribute negligibly to overpotential reduction, with PTLs of different surface morphologies demonstrating nearly identical cell performance. However, as the anode catalyst loadings decrease, both electron and mass transport within the CL become increasingly dependent on PTL-CL interfacial contact. The experimental results demonstrate that under low anode catalyst loadings, the etched PTL demonstrates a maximum reduction of 59 mV compared to the pristine PTL at 4 A/cm2. Furthermore, a notable 10 mΩ·cm2 reduction in HFR is observed for the etched PTL compared to the pristine PTL. These results demonstrate that under low anode catalyst loadings, rational design of PTL surface structures can effectively optimize various overpotentials in PEMWEs.

Supplementary Materials

The following supplementary materials can be downloaded at: https://www.mdpi.com/article/10.3390/en18164396/s1, Figure S1: The SEM image of the anode catalyst layer with a rough surface and porous structure; Figure S2: Tafel slope comparison between pristine PTL and etched PTL at low anode catalyst loadings [43,44,45,46].

Author Contributions

S.Y.: Conceptualization, methodology, investigation, writing—original draft, and data curation. B.H.: Conceptualization, methodology, investigation, and writing. Z.X.: Supervision, writing—review and editing, and funding acquisition. G.Y.: Supervision, writing—review and editing, and funding acquisition. All authors have read and agreed to the published version of the manuscript.

Funding

The research was supported by the National Science Foundation of China under award number Z202401390008, Hunan Province, under the Bai-Ren Project, and as well as the Fundamental Research Funds for the Central Universities (Grant No. 531118011103).

Data Availability Statement

Data will be made available on request.

Conflicts of Interest

The authors declare no conflict of interest.

Abbreviations

The following abbreviations are used in this manuscript:
PEMWEsProton exchange membrane water electrolyzers
PTLPorous transport layer
CLCatalyst layer
MPLMicroporous layer
CCMCatalyst-coated membrane
SEMScanning electron microscope
EISElectrochemical impedance spectroscopy
HFRHigh-frequency resistance
LFRLow-frequency resistance
GDLGas diffusion layer
SGEISStaircase Galvano Electrochemical Impedance Spectroscopy

References

  1. Bernt, M.; Gasteiger, H.A. Influence of Ionomer Content in IrO2/TiO2 Electrodes on PEM Water Electrolyzer Performance. J. Electrochem. Soc. 2016, 163, F3179–F3189. [Google Scholar] [CrossRef]
  2. Shang, Z.; Hossain, M.M.; Wycisk, R.; Pintauro, P.N. Poly(phenylene sulfonic acid)-expanded polytetrafluoroethylene composite membrane for low relative humidity operation in hydrogen fuel cells. J. Power Sources 2022, 535, 231375. [Google Scholar] [CrossRef]
  3. Liu, L.; Ma, H.; Khan, M.; Hsiao, B.S. Recent Advances and Challenges in Anion Exchange Membranes Development/Application for Water Electrolysis: A Review. Membranes 2024, 14, 85. [Google Scholar] [CrossRef] [PubMed]
  4. Buttler, A.; Spliethoff, H. Current status of water electrolysis for energy storage, grid balancing and sector coupling via power-to-gas and power-to-liquids: A review. Renew. Sustain. Energy Rev. 2018, 82, 2440–2454. [Google Scholar] [CrossRef]
  5. Salehmin, M.N.I.; Husaini, T.; Goh, J.; Sulong, A.B. High-pressure PEM water electrolyser: A review on challenges and mitigation strategies towards green and low-cost hydrogen production. Energy Convers. Manag. 2022, 268, 115985. [Google Scholar] [CrossRef]
  6. Rahim, A.H.A.; Tijani, A.S.; Kamarudin, S.K.; Hanapi, S. An overview of polymer electrolyte membrane electrolyzer for hydrogen production: Modeling and mass transport. J. Power Sources 2016, 309, 56–65. [Google Scholar] [CrossRef]
  7. Langemann, M.; Fritz, D.L.; Mueller, M.; Stolten, D. Validation and characterization of suitable materials for bipolar plates in PEM water electrolysis. Int. J. Hydrogen Energy 2015, 40, 11385–11391. [Google Scholar] [CrossRef]
  8. Song, S.; Zhang, H.; Ma, X.; Shao, Z.; Baker, R.T.; Yi, B. Electrochemical investigation of electrocatalysts for the oxygen evolution reaction in PEM water electrolyzers. Int. J. Hydrogen Energy 2008, 33, 4955–4961. [Google Scholar] [CrossRef]
  9. Chandesris, M.; Medeau, V.; Guillet, N.; Chelghoum, S.; Thoby, D.; Fouda-Onana, F. Membrane degradation in PEM water electrolyzer: Numerical modeling and experimental evidence of the influence of temperature and current density. Int. J. Hydrogen Energy 2015, 40, 1353–1366. [Google Scholar] [CrossRef]
  10. Lettenmeier, P.; Wang, R.; Abouatallah, R.; Helmly, S.; Morawietz, T.; Hiesgen, R.; Kolb, S.; Burggraf, F.; Kallo, J.; Gago, A.; et al. Durable Membrane Electrode Assemblies for Proton Exchange Membrane Electrolyzer Systems Operating at High Current Densities. Electrochim. Acta 2016, 210, 502–511. [Google Scholar] [CrossRef]
  11. Khatib, F.N.; Wilberforce, T.; Ijaodola, O.; Ogungbemi, E.; El-Hassan, Z.; Durrant, A.; Thompson, J.; Olabi, A.G. Material degradation of components in polymer electrolyte membrane (PEM) electrolytic cell and mitigation mechanisms: A review. Renew. Sustain. Energy Rev. 2019, 111, 1–14. [Google Scholar] [CrossRef]
  12. Kang, Z.; Wang, H.; Liu, Y.; Mo, J.; Wang, M.; Li, J.; Tian, X. Exploring and understanding the internal voltage losses through catalyst layers in proton exchange membrane water electrolysis devices. Appl. Energy 2022, 317, 119213. [Google Scholar] [CrossRef]
  13. Chen, Y.; Liu, C.; Xu, J.; Xia, C.; Wang, P.; Xia, B.Y.; Yan, Y.; Wang, X. Key Components and Design Strategy for a Proton Exchange Membrane Water Electrolyzer. Small Struct. 2023, 4, 2200130. [Google Scholar] [CrossRef]
  14. Chen, Z.; Guo, L.; Pan, L.; Yan, T.; He, Z.; Li, Y.; Shi, C.; Huang, Z.; Zhang, X.; Zou, J. Advances in Oxygen Evolution Electrocatalysts for Proton Exchange Membrane Water Electrolyzers. Adv. Energy Mater. 2022, 12, 2103670. [Google Scholar] [CrossRef]
  15. Li, X.; Yao, Y.; Tian, Y.; Jia, J.; Ma, W.; Yan, X.; Liang, J. Recent advances in key components of proton exchange membrane water electrolysers. Mater. Chem. Front. 2024, 8, 2493–2510. [Google Scholar] [CrossRef]
  16. Xie, Z.; Ding, L.; Yu, S.; Wang, W.; Capuano, C.B.; Keane, A.; Ayers, K.; Cullen, D.A.; Meyer, H.M.; Zhang, F.-Y. Ionomer-free nanoporous iridium nanosheet electrodes with boosted performance and catalyst utilization for high-efficiency water electrolyzers. Appl. Catal. B-Environ. 2024, 341, 123298. [Google Scholar] [CrossRef]
  17. Yang, G.; Mo, J.; Kang, Z.; Dohrmann, Y.; List, F.A., III; Green, J.B., Jr.; Babu, S.S.; Zhang, F.-Y. Fully printed and integrated electrolyzer cells with additive manufacturing for high-efficiency water splitting. Appl. Energy 2018, 215, 202–210. [Google Scholar] [CrossRef]
  18. Bazarah, A.; Majlan, E.H.; Husaini, T.; Zainoodin, A.M.; Alshami, I.; Goh, J.; Masdar, M.S. Factors influencing the performance and durability of polymer electrolyte membrane water electrolyzer: A review. Int. J. Hydrogen Energy 2022, 47, 35976–35989. [Google Scholar] [CrossRef]
  19. Stiber, S.; Balzer, H.; Wierhake, A.; Wirkert, F.J.; Roth, J.; Rost, U.; Brodmann, M.; Lee, J.K.; Bazylak, A.; Waiblinger, W.; et al. Porous Transport Layers for Proton Exchange Membrane Electrolysis Under Extreme Conditions of Current Density, Temperature, and Pressure. Adv. Energy Mater. 2021, 11, 2100630. [Google Scholar] [CrossRef]
  20. Lettenmeier, P.; Kolb, S.; Sata, N.; Fallisch, A.; Zielke, L.; Thiele, S.; Gago, A.S.; Friedrich, K.A. Comprehensive investigation of novel pore-graded gas diffusion layers for high-performance and cost-effective proton exchange membrane electrolyzers. Energy Environ. Sci. 2017, 10, 2521–2533. [Google Scholar] [CrossRef]
  21. Kang, Z.; Alia, S.M.; Young, J.L.; Bender, G. Effects of various parameters of different porous transport layers in proton exchange membrane water electrolysis. Electrochim. Acta 2020, 354, 136641. [Google Scholar] [CrossRef]
  22. Lettenmeier, P.; Kolb, S.; Burggraf, F.; Gago, A.S.; Friedrich, K.A. Towards developing a backing layer for proton exchange membrane electrolyzers. J. Power Sources 2016, 311, 153–158. [Google Scholar] [CrossRef]
  23. Schuler, T.; De Bruycker, R.; Schmidt, T.J.; Buchi, F.N. Polymer Electrolyte Water Electrolysis: Correlating Porous Transport Layer Structural Properties and Performance: Part I. Tomographic Analysis of Morphology and Topology. J. Electrochem. Soc. 2019, 166, F270–F281. [Google Scholar] [CrossRef]
  24. Grigoriev, S.A.; Millet, P.; Volobuev, S.A.; Fateev, V.N. Optimization of porous current collectors for PEM water electrolysers. Int. J. Hydrogen Energy 2009, 34, 4968–4973. [Google Scholar] [CrossRef]
  25. Siracusano, S.; Di Blasi, A.; Baglio, V.; Brunaccini, G.; Briguglio, N.; Stassi, A.; Ornelas, R.; Trifoni, E.; Antonucci, V.; Aricò, A. Optimization of components and assembling in a PEM electrolyzer stack. Int. J. Hydrogen Energy 2011, 36, 3333–3339. [Google Scholar] [CrossRef]
  26. Stiber, S.; Sata, N.; Morawietz, T.; Ansar, S.A.; Jahnke, T.; Lee, J.K.; Bazylak, A.; Fallisch, A.; Gago, A.S.; Friedrich, K.A. A high-performance, durable and low-cost proton exchange membrane electrolyser with stainless steel components. Energy Environ. Sci. 2022, 15, 109–122. [Google Scholar] [CrossRef]
  27. Peng, X.; Satjaritanun, P.; Taie, Z.; Wiles, L.; Keane, A.; Capuano, C.; Zenyuk, I.V.; Danilovic, N. Insights into Interfacial and Bulk Transport Phenomena Affecting Proton Exchange Membrane Water Electrolyzer Performance at Ultra-Low Iridium Loadings. Adv. Sci. 2021, 8, 2102950. [Google Scholar] [CrossRef]
  28. Lee, C.H.; Lee, J.K.; Zhao, B.; Fahy, K.F.; Bazylak, A. Transient Gas Distribution in Porous Transport Layers of Polymer Electrolyte Membrane Electrolyzers. J. Electrochem. Soc. 2020, 167, 024508. [Google Scholar] [CrossRef]
  29. Ernst, M.F.; Meier, V.; Kornherr, M.; Gasteiger, H.A. Preparation and Performance Evaluation of Microporous Transport Layers for Proton Exchange Membrane (PEM) Water Electrolyzer Anodes. J. Electrochem. Soc. 2024, 171, 074511. [Google Scholar] [CrossRef]
  30. Schuler, T.; Weber, C.C.; Wrubel, J.A.; Gubler, L.; Pivovar, B.; Buchi, F.N.; Bender, G. Ultrathin Microporous Transport Layers: Implications for Low Catalyst Loadings, Thin Membranes, and High Current Density Operation for Proton Exchange Membrane Electrolysis. Adv. Energy Mater. 2024, 14, 2302786. [Google Scholar] [CrossRef]
  31. Lee, J.K.; Schuler, T.; Bender, G.; Sabharwal, M.; Peng, X.; Weber, A.Z.; Danilovic, N. Interfacial engineering via laser ablation for high-performing PEM water electrolysis. Appl. Energy 2023, 336, 120853. [Google Scholar] [CrossRef]
  32. Hasa, B.; Aryal, U.R.; Higashi, S.; Tolouei, N.E.; Lang, J.T.; Erb, B.; Smeltz, A.; Zenyuk, I.V.; Zhu, G. Porous transport layer influence on overpotentials in PEM water electrolysis at low anode catalyst loadings. Appl. Catal. B-Environ. Energy 2025, 361, 124616. [Google Scholar] [CrossRef]
  33. Lee, J.K.K.; Anderson, G.; Tricker, A.W.; Babbe, F.; Madan, A.; Cullen, D.A.; Arregui-Mena, J.D.; Danilovic, N.; Mukundan, R.; Weber, A.Z.; et al. Ionomer-free and recyclable porous-transport electrode for high-performing proton-exchange-membrane water electrolysis. Nat. Commun. 2023, 14, 4592. [Google Scholar] [CrossRef]
  34. Lu, X.; Du, B.; Zhou, S.; Zhu, W.; Li, Y.; Yang, Y.; Xie, C.; Zhao, B.; Zhang, L.; Song, J.; et al. Optimization of power allocation for wind-hydrogen system multi-stack PEM water electrolyzer considering degradation conditions. Int. J. Hydrogen Energy 2023, 48, 5850–5872. [Google Scholar] [CrossRef]
  35. Lopata, J.; Kang, Z.; Young, J.; Bender, G.; Weidner, J.W.; Shimpalee, S. Effects of the Transport/Catalyst Layer Interface and Catalyst Loading on Mass and Charge Transport Phenomena in Polymer Electrolyte Membrane Water Electrolysis Devices. J. Electrochem. Soc. 2020, 167, 064507. [Google Scholar] [CrossRef]
  36. Darband, G.B.; Aliofkhazraei, M.; Shanmugam, S. Recent advances in methods and technologies for enhancing bubble detachment during electrochemical water splitting. Renew. Sustain. Energy Rev. 2019, 114, 109300. [Google Scholar] [CrossRef]
  37. Xu, W.; Lu, Z.; Wan, P.; Kuang, Y.; Sun, X. High-Performance Water Electrolysis System with Double Nanostructured Superaerophobic Electrodes. Small 2016, 12, 2492–2498. [Google Scholar] [CrossRef]
  38. Lu, Z.; Li, Y.; Lei, X.; Liu, J.; Sun, X. Nanoarray based “superaerophobic” surfaces for gas evolution reaction electrodes. Mater. Horiz. 2015, 2, 294–298. [Google Scholar] [CrossRef]
  39. Immerz, C.; Bensmann, B.; Trinke, P.; Suermann, M.; Hanke-Rauschenbach, R. Local Current Density and Electrochemical Impedance Measurements within 50 cm Single-Channel PEM Electrolysis Cell. J. Electrochem. Soc. 2018, 165, F1292–F1299. [Google Scholar] [CrossRef]
  40. Ma, L.; Sui, S.; Zhai, Y. Investigations on high performance proton exchange membrane water electrolyzer. Int. J. Hydrogen Energy 2009, 34, 678–684. [Google Scholar] [CrossRef]
  41. Suermann, M.; Bensmann, B.; Hanke-Rauschenbach, R. Degradation of Proton Exchange Membrane (PEM) Water Electrolysis Cells: Looking Beyond the Cell Voltage Increase. J. Electrochem. Soc. 2019, 166, F645–F652. [Google Scholar] [CrossRef]
  42. Chan, A.-L.; Yu, H.; Reeves, K.S.; Alia, S.M. Identifying electrochemical processes by distribution of relaxation times in proton exchange membrane electrolyzers. J. Power Sources 2025, 628, 235850. [Google Scholar] [CrossRef]
  43. Yu, S.; Li, K.; Wang, W.; Xie, Z.; Ding, L.; Kang, Z.; Wrubel, J.; Ma, Z.; Bender, G.; Yu, H.; et al. Tuning Catalyst Activation and Utilization Via Controlled Electrode Patterning for Low-Loading and High-Efficiency Water Electrolyzers. Small 2022, 18, 14. [Google Scholar] [CrossRef] [PubMed]
  44. Zhai, M.; Meng, Z.; Chen, R.; Song, J.; Zhang, A.; Zhao, S.; Tian, T.; Zhu, L.; Zhang, H.; Tang, H. Evolution of the network structure and voltage loss of anode electrode with the polymeric dispersion in PEM water electrolyzer. J. Colloid Interface Sci. 2024, 673, 934–942. [Google Scholar] [CrossRef]
  45. Kulkarni, D.; Huynh, A.; Satjaritanun, P.; O’Brien, M.; Shimpalee, S.; Parkinson, D.; Shevchenko, P.; DeCarlo, F.; Danilovic, N.; Ayers, K.E.; et al. Elucidating effects of catalyst loadings and porous transport layer morphologies on operation of proton exchange membrane water electrolyzers. Appl. Catal. B Environ. 2022, 308, 121213. [Google Scholar] [CrossRef]
  46. Padgett, E.; Bender, G.; Haug, A.; Lewinski, K.; Sun, F.; Yu, H.; Cullen, D.A.; Steinbach, A.J.; Alia, S.M. Catalyst Layer Resistance and Utilization in PEM Electrolysis. J. Electrochem. Soc. 2023, 170, 084512. [Google Scholar] [CrossRef]
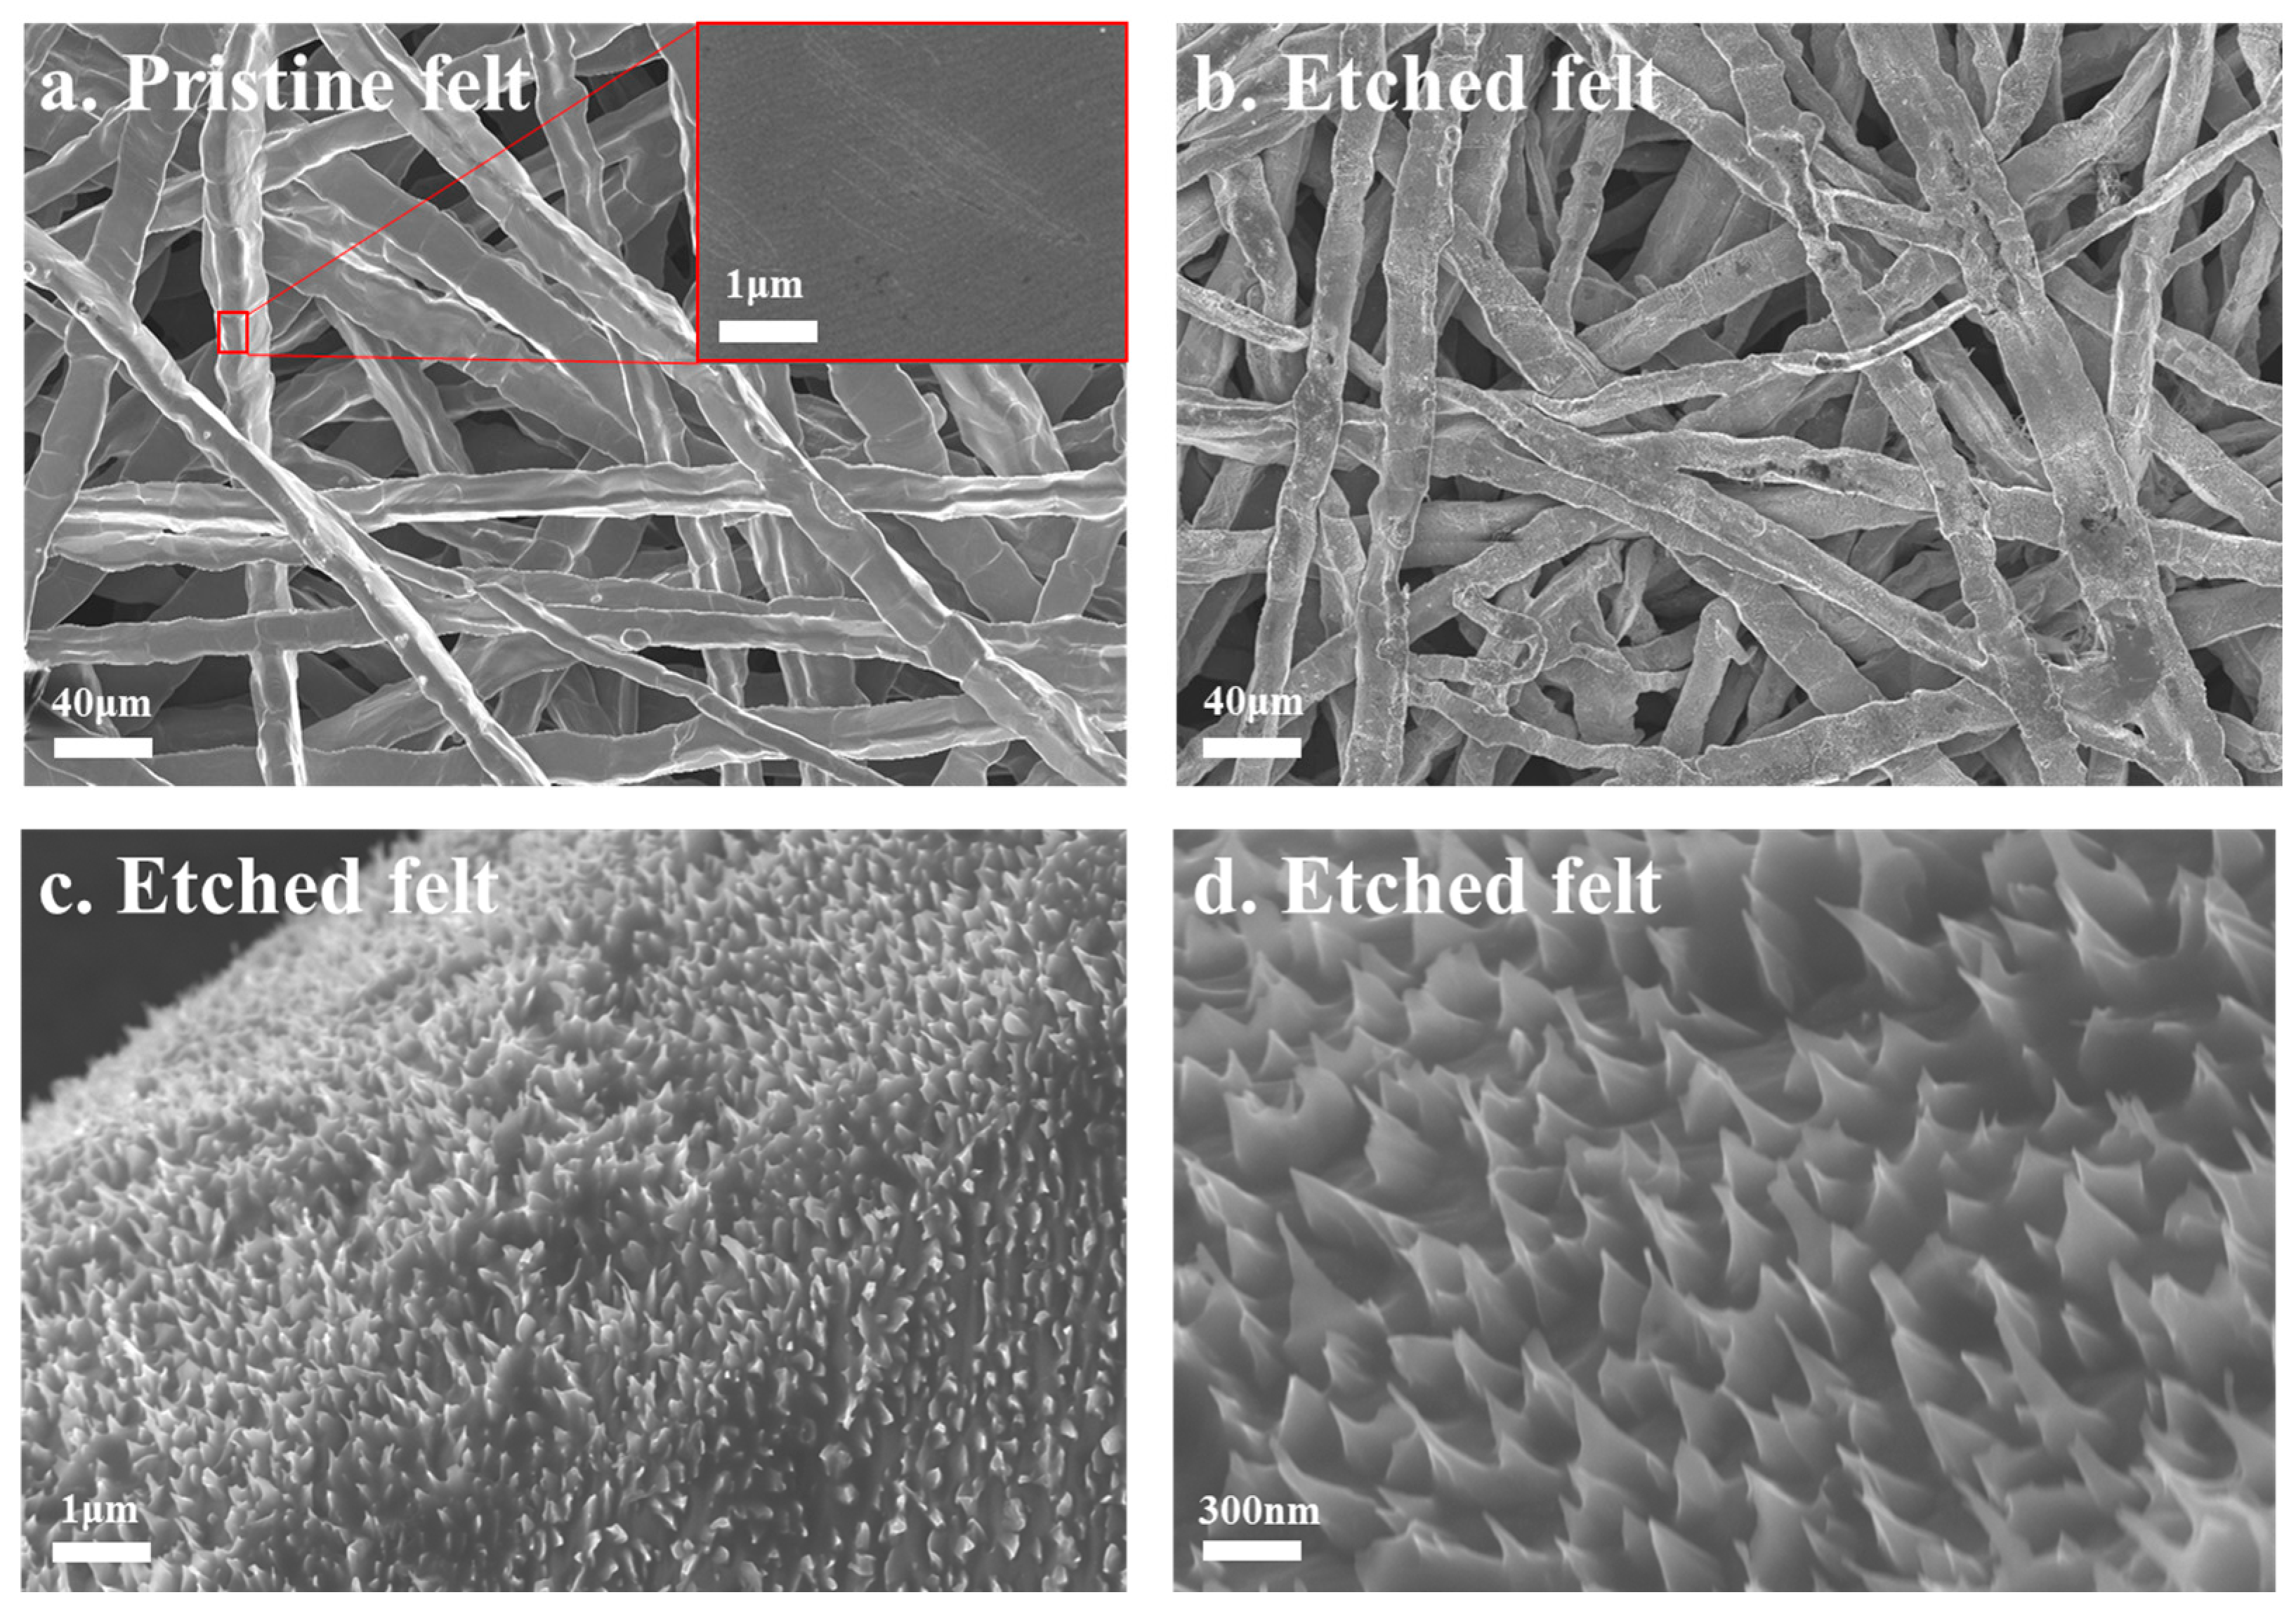
Figure 1. (a) SEM image of pristine Ti felt. The inset shows a higher-resolution SEM image of the surface of the Ti felt. (bd) SEM images of etched Ti felt with HCl treatment for 5 min at different magnifications.
Energies 18 04396 g001
Figure 2. Schematic illustration of the PTL-CL interfacial contact characteristics for (a) a pristine PTL and (b) an etched PTL.
Energies 18 04396 g002
Figure 3. Impact of the PTLs on cell performance with high catalyst loadings. (a) Polarization curves, (b) kinetic overpotential, (c) HFR, and (d) mass transport overpotential.
Energies 18 04396 g003
Figure 4. Impact of the PTLs on cell performance with low catalyst loadings. (a) Polarization curves, (b) kinetic overpotential, (c) HFR, and (d) mass transport overpotential.
Energies 18 04396 g004
Figure 5. The EIS plots of the etched and pristine PTL at 1 A/cm2.
Energies 18 04396 g005
Disclaimer/Publisher’s Note: The statements, opinions and data contained in all publications are solely those of the individual author(s) and contributor(s) and not of MDPI and/or the editor(s). MDPI and/or the editor(s) disclaim responsibility for any injury to people or property resulting from any ideas, methods, instructions or products referred to in the content.