1. Introduction
Towards the development goals of carbon peak and carbon neutrality, China’s energy sector is gradually transitioning to cleaner and low-carbon models [
1,
2]. Virtual power plants (VPPs) have garnered widespread attention due to their flexibility in aggregating distributed energy resources. A virtual power plant (VPP) refers to a system that integrates distributed energy resources (DERs) such as distributed generators, energy storage devices, and flexible loads through advanced information and communication technologies (ICTs) and intelligent management systems. Functioning as a coordinated entity, it aggregates the scattered and fluctuating energy resources to achieve optimized operation, enhanced grid stability, and improved energy efficiency. By participating in electricity markets and providing various ancillary services (e.g., peak shaving and frequency regulation), VPPs play a crucial role in facilitating the integration of renewable energy sources and promoting the transition towards a more sustainable and resilient power system. VPPs constructed on the demand side offer advantages such as low investment costs and flexible operational modes [
3,
4,
5] and have been widely adopted in residential communities. As the number of VPPs increases, they can form VPP clusters through energy sharing. This cluster mode provides an alternative form of energy interaction beyond the traditional interaction with the upper grid, namely, energy sharing among cooperative entities [
6,
7,
8].
In recent years, China’s electricity and carbon markets have flourished. Market entities participating in both markets need to formulate carbon market trading strategies based on electricity trading outcomes while also considering the feedback effects of carbon market transactions on electricity trading [
9,
10]. Therefore, studying the decision-making behaviors of participants in the coupled electricity and carbon markets is a key technology for achieving low-carbon economic operation of the power system. The literature [
11] proposes a bi-level game model for the coupled electricity and carbon markets under two practical trading modes—bilateral negotiation and centralized bidding—performed by power generators and solves it using an improved differential evolution algorithm. Ding et al. consider the current distribution of power generation resources and the market trading environment, constructing an optimization model for the joint operation of wind, solar, and thermal power under the coupling of electricity and carbon trading markets, promoting energy conservation and emission reduction while increasing the proportion of renewable energy transmission [
12]. The literature [
13] addresses the issue that traditional independent electricity and carbon market trading mechanisms fail to sufficiently incentivize multi-entity energy conservation and emission reduction, proposing a bi-level game scheduling model for integrated energy systems in industrial parks that considers the coordination of electricity and carbon market decisions. The literature [
14], under the price-taker mode, proposes a multi-scale (year–week–day) coupled collaborative decision-making mechanism and optimization model for hybrid power generation groups participating in the electricity and carbon markets. However, the existing research on market entity decision-making under the coupled electricity and carbon mechanism has the following limitations: firstly, the research perspective mainly focuses on the generation side, lacking in-depth exploration of the participation mechanisms on the demand side; secondly, few studies incorporate distribution network interaction constraints into decision-making models, failing to fully reflect the overall synergistic effects of the power system. The integration of asymmetric Nash bargaining with the electro-carbon comprehensive price (EACP) mechanism introduces distinct novelty by synergistically addressing two critical gaps in the existing literature. Unlike symmetric Nash bargaining, which assumes equal bargaining power and fails to account for differentiated contributions in electricity–carbon sharing, the asymmetric framework herein quantifies each VPP’s role via contribution indices (e.g., transaction volume and renewable energy penetration), ensuring that benefit allocation aligns with actual participation intensity, thus enhancing cooperation stability and incentivizing active engagement. Concurrently, the EACP mechanism, which embeds nodal carbon potential into pricing, transcends traditional P2P energy market strategies that often decouple electricity trading from carbon considerations. By merging economic signals (locational marginal prices) with environmental costs (carbon intensity), EACP guides VPPs toward low-carbon behaviors while enabling the asymmetric bargaining model to optimize both economic efficiency and emission reduction.
As an advanced group decision-making analysis tool, cooperative game theory [
15] provides systematic methodological support for addressing multi-entity collaborative decision-making problems by constructing alliance benefit allocation mechanisms and stability analysis frameworks, playing an indispensable role in optimizing resource allocation, enhancing overall benefits, and promoting stable cooperation. One study [
16] proposes a new cooperative game theory based solely on the concept of conflict equilibrium, in which solutions always exist and are usually unique. In peer-to-peer (P2P) transactions, cooperative game theory is often used to resolve pricing and quantitative issues. Another work [
17] establishes a mathematical model for an oilfield micro-energy network, introduces a shared energy storage mechanism and alliance mutual assistance strategy, and constructs a collaborative scheduling model for microgrid clusters with the goal of minimizing operational costs. A further study [
18] puts forward a P2P trading strategy optimization method based on stochastic game theory under incomplete information. Additionally, one study [
19] presents a framework combining non-cooperative and cooperative games to promote P2P electricity trading while maintaining contract stability. Another study [
20] utilizes cooperative game theory to propose a fundamental framework to overcome free-rider problems in production and sharing. Moreover, one study [
21] proposes a P2P electricity and reserve trading optimization mechanism based on Nash cooperative game theory under renewable energy uncertainty. While these studies optimize group common interests using cooperative game theory, they primarily focus on maximizing overall benefits, failing to adequately consider the differentiated contributions of each participant during cooperation. This results in a lack of precision and fairness in the benefit allocation mechanism, making it difficult to effectively stimulate the initiative and enthusiasm of cooperative entities. In a separate piece of research [
22], the authors summarize the literature on using game theory in modern power grids, exploring its applications in various aspects like energy trading and management across general energy markets, microgrids, and virtual power plants. They discuss how game theory can address pricing, bidding, etc. This work mainly focuses on general applications and summaries of game theory in power systems. In contrast, our paper zeroes in on applying cooperative game theory specifically to VPP or distribution network optimization. We detail the unique benefits and mechanisms of cooperative game theory in this context, such as how it promotes better resource sharing and coordinated operation among different entities in VPPs. Our work is essential as it fills the gap in providing in-depth, targeted research on cooperative game theory’s application in VPP and distribution network optimization, which is crucial for the efficient operation and development of these systems in the power grid.
In summary, this paper proposes a collaborative optimization trading mechanism for VPP clusters and distribution networks under the coupled electricity and carbon market environment. Firstly, a joint operation framework for VPP clusters and distribution networks is constructed, providing a systematic solution for multi-entity interactions in the coupled electricity and carbon market. Secondly, a bi-level optimization model is established, where the upper level formulates P2P electricity and carbon quota trading plans through cooperative game theory among VPPs, and the lower level solves the optimal power flow of the distribution network based on the trading plan and feeds back the comprehensive electricity and carbon price. Thirdly, the asymmetric Nash bargaining theory is introduced to construct the cooperative game model, and an improved alternating direction multiplier method is used for an efficient solution. Finally, case studies demonstrate that the proposed method effectively addresses issues such as the insufficient consideration of differentiated contributions and unfair benefit allocation mechanisms in traditional models, significantly enhancing the overall economic efficiency and cooperative stability of VPP clusters while ensuring the safe and economic operation of the distribution network.
2. Joint Operational Framework for Virtual Power Plant Clusters
This section outlines the foundational framework for coordinating VPP clusters and distribution networks in the electricity–carbon coupled market. It first elaborates on VPP concepts, technologies, and constituent resources; then, it explains carbon quota mechanisms, carbon emission flow, and integrated electricity–carbon pricing; finally, it details VPP applications in smart grids and the joint operation mode of VPP clusters, providing a systematic operational context.
2.1. VPP Concept and Technology
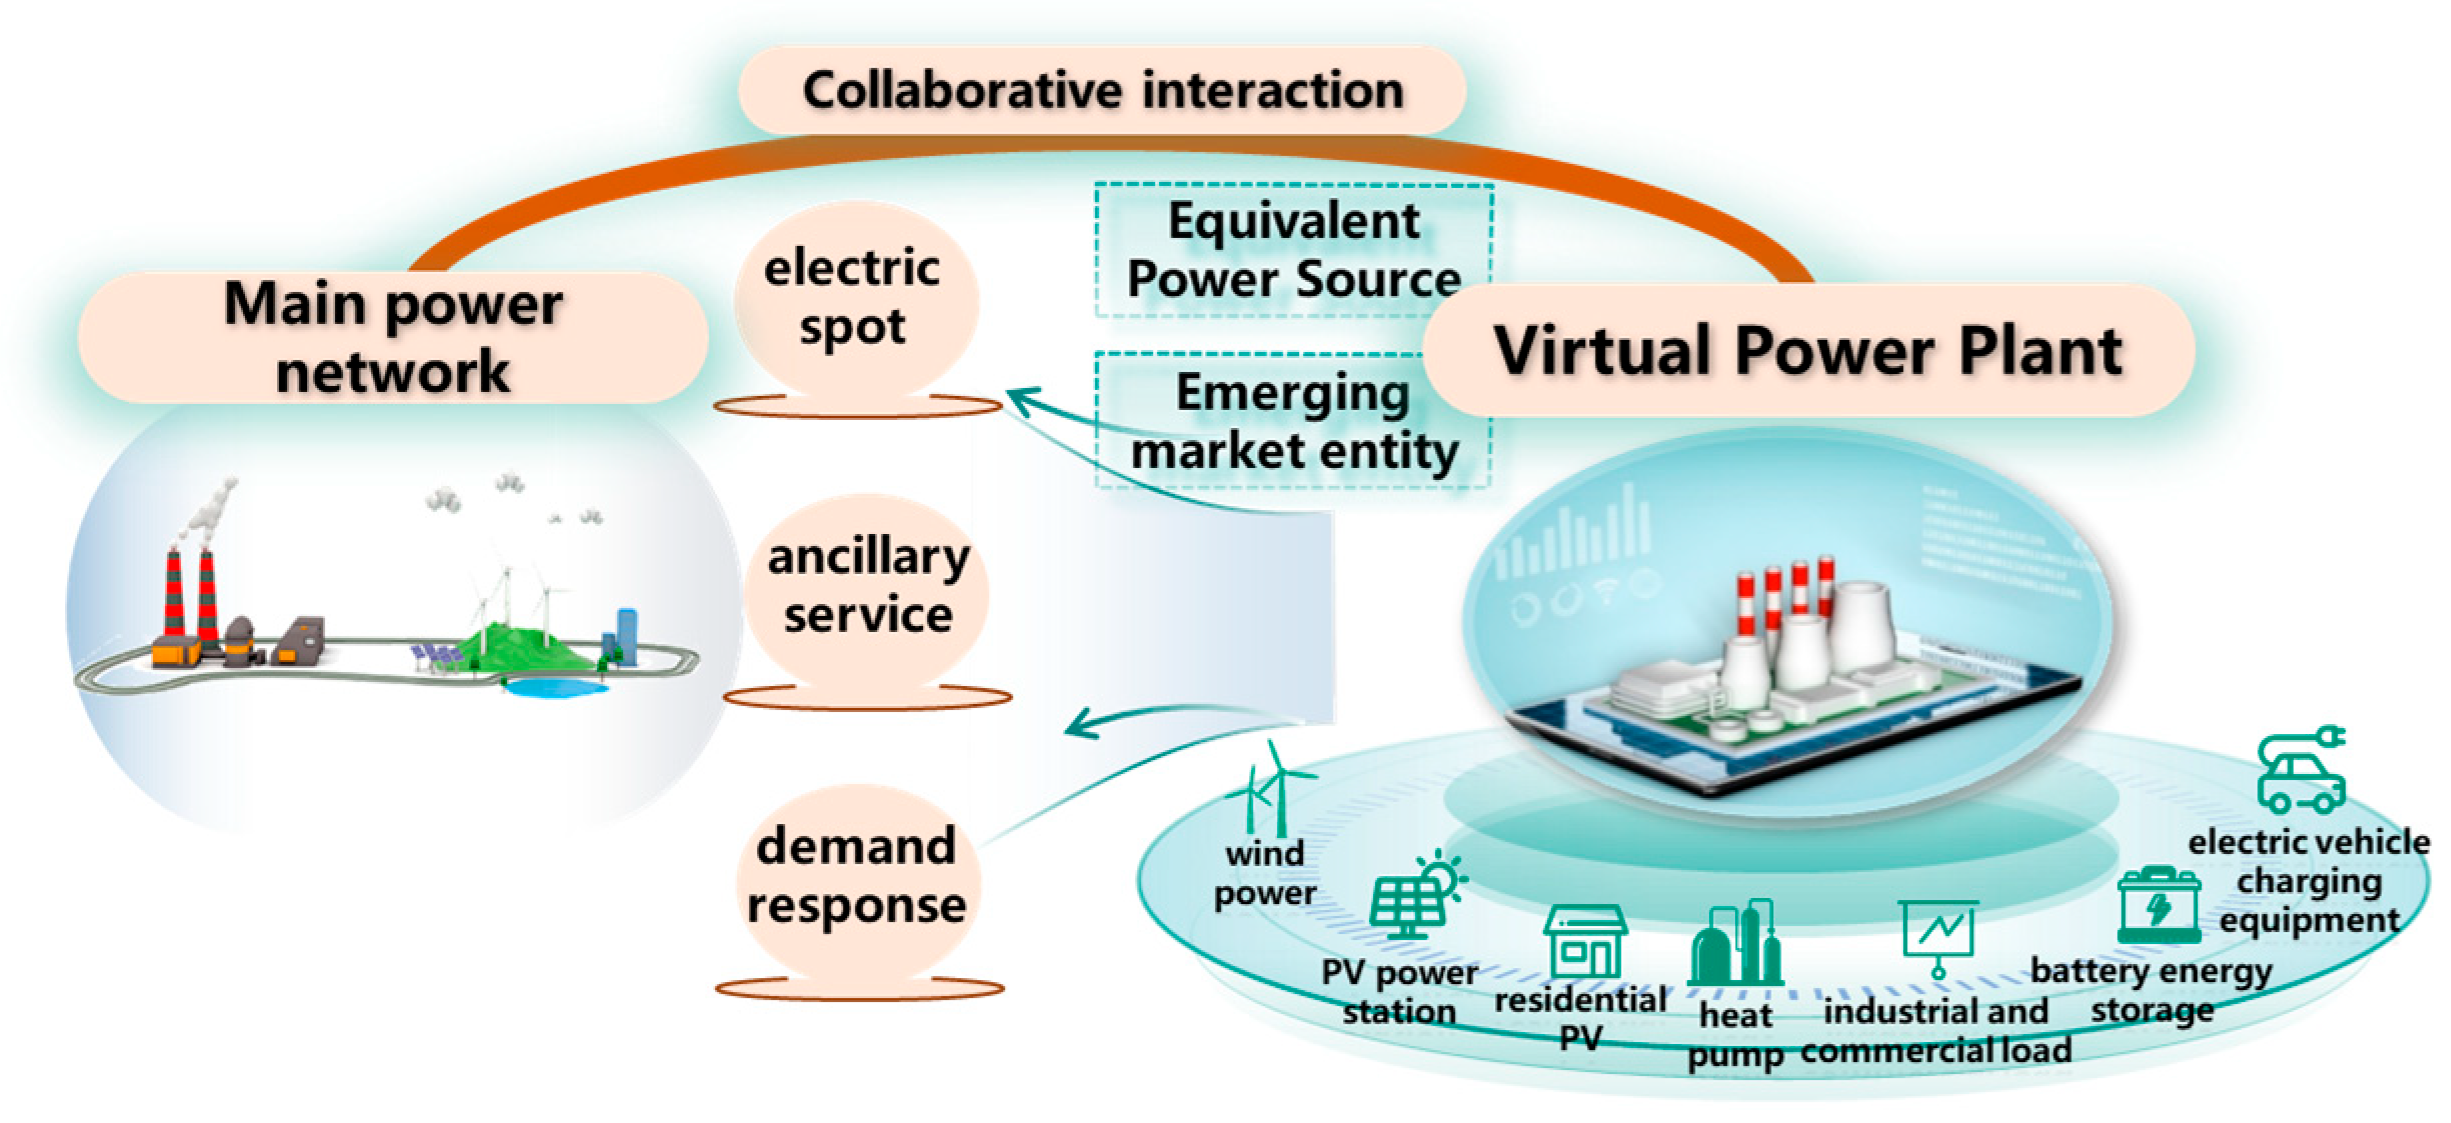
The schematic diagram of the virtual power plant is shown in
Figure 1. The virtual power plant (VPP) emerges as a technologically advanced and systemically integrated platform designed to dynamically coordinate, optimize, and manage a diverse portfolio of distributed energy resources (DERs) within a defined operational boundary. At its core, the VPP transcends the physical constraints of traditional power plants by leveraging sophisticated digital infrastructure to aggregate fragmented energy assets, thereby transforming their collective capacity into a unified, grid-responsive entity.
The resource ecosystem underpinning a VPP is notably diverse, encompassing intermittent renewable energy sources—such as wind turbines, photovoltaic (PV) arrays, and small-scale hydroelectric units—whose output fluctuates with environmental conditions. Complementing these are dispatchable generation units, including gas-fired micro-turbines, diesel generators, and biomass plants, which provide reliable power on demand to balance variability. Additionally, VPPs integrate energy storage systems (e.g., lithium–ion batteries, flywheels, and pumped hydro storage) to store excess energy during low-demand periods and discharge it when needed, enhancing flexibility. On the demand side, they incorporate flexible loads (e.g., adjustable industrial processes and smart buildings) and electric vehicle (EV) fleets, which can modulate their energy consumption or feed power back to the grid (via vehicle-to-grid, V2G technology) to support grid stability.
Central to the VPP’s functionality is a robust energy management system (EMS), equipped with advanced algorithms for real-time data analytics, predictive modeling, and optimal dispatch. This EMS processes inputs such as weather forecasts, market prices, grid congestion signals, and asset availability to determine the most efficient operation strategy—minimizing costs, maximizing renewable energy utilization, or prioritizing grid support. Through seamless communication protocols (e.g., IoT sensors, 5G networks, and standardized APIs), the EMS enables bidirectional data exchange and remote control of DERs, ensuring synchronized performance.
In practical grid applications, VPPs often evolve into clustered architectures by interconnecting multiple VPPs across regional distribution networks, spanning various voltage levels (from low-voltage residential feeders to medium-voltage industrial lines) and network nodes. This clustering amplifies their impact: it enables large-scale resource pooling, enhances resilience against localized outages, and facilitates participation in wholesale electricity markets as a single-market player. By acting as a bridge between distributed energy and the central grid, clustered VPPs not only improve grid reliability and efficiency but also accelerate the integration of renewable energy, making them a pivotal technology in the transition toward decarbonized, decentralized power systems.
2.2. Carbon Quota, Carbon Emission Flow, and Electricity–Carbon Integrated Pricing
The carbon emissions caused by virtual power plants (VPPs) consist of two components. The first part stems from the inherent emissions of distributed resources within the VPP, which in this study are generated by the operation of gas turbine generators. The second part arises indirectly from the VPP’s electricity purchases from the distribution grid, leading to emissions from coal-fired generation units on the power supply side.
Internal carbon emissions can be regulated through a carbon quota trading mechanism. Carbon quotas, set by governments or regulatory authorities, represent the maximum allowable carbon emissions for each entity within a specified period. To manage and reduce the carbon emissions of VPPs, this study integrates VPPs into the carbon emission trading market, allocating a certain amount of free carbon quotas to each VPP’s internal gas turbine generators and renewable energy generation units. Through carbon quota trading, VPPs with surplus quotas can sell their excess allowances to those with insufficient quotas. Any emissions exceeding the allocated quotas after trading will incur penalty fees.
Indirect carbon emissions are guided and regulated through an electricity–carbon integrated pricing mechanism based on carbon emission flow (CEF) [
23]. As a virtual network flow corresponding to power flow, CEF quantifies the carbon emission responsibility on the demand side. Key CEF indicators include node carbon intensity, branch carbon flow density, and grid loss carbon flow rate. Node carbon intensity represents the equivalent generation-side carbon emissions per unit of electrical energy injected into a node. The calculation formula for the carbon intensity of each node in the system is as follows:
In the formula, is the node carbon potential of the node in the time period; is the set of all coal-fired units connected to the node ; is the output power of the unit ; is the carbon emission intensity of the unit in the time period, that is, the carbon emission contained in the unit energy output of the generator; is the set of all first nodes connected to the node in the distribution network; is the branch power connecting the node and the node , is the network loss power on the branch, is the branch carbon current density of the branch in the time period, and aa represents the carbon emission when the branch transmits unit power; is the sum of other powers injected by the node in the time period, such as the power injected into the distribution network by wind power and photovoltaic units connected to the node , the power injected into the distribution network by the virtual power plant, etc.
According to the principle of proportional sharing, the carbon current density of all branches flowing out from node
is equal to the carbon potential of the node. Therefore, Equation (1) can be transformed into
According to Equation (2), when the power flow distribution of the distribution network is known, only the carbon emission intensity of coal-fired units on the power generation side is required to calculate the carbon potential of all nodes and the branch carbon current density in the distribution network, so as to calculate the real-time carbon emissions in the distribution network.
The electro-carbon comprehensive price (EACP) is based on the node carbon potential, which adds the electricity price and carbon emission cost to comprehensively reflect the environmental impact of electric energy transmission and consumption. Using the electro-carbon comprehensive price (EACP) can guide power producers and consumers to choose low-carbon or zero-carbon energy sources to reduce carbon emissions. The calculation formula for the electro-carbon comprehensive price (EACP) is as follows:
In the formula, is the electro-carbon comprehensive price (EACP) of node in period ; is the locational marginal price (LMP) of node in period ; is the carbon tax.
2.3. VPP Applications in Smart Grids and the Joint Operation of Virtual Power Plant Clusters
Virtual power plants (VPPs) serve as critical enablers in smart grids, facilitating the seamless integration of distributed energy resources (DERs) while enhancing grid flexibility and reliability. Beyond optimizing the real-time dispatch of renewables, storage systems, and flexible loads to mitigate intermittency, VPPs excel in coordinating energy service delivery across multi-stakeholder ecosystems. This coordination encompasses the dynamic matching of supply–demand fluctuations, orchestrating demand response programs, and enabling transactive energy mechanisms, whereby aggregated resources collectively provide ancillary services (e.g., frequency regulation and peak shaving) and tailored energy solutions to end-users. By acting as a unified interface between distributed assets and grid operators or electricity markets, VPPs not only strengthen supply–demand balance but also unlock value from decentralized energy, making them indispensable for efficient, user-centric smart grid operations.
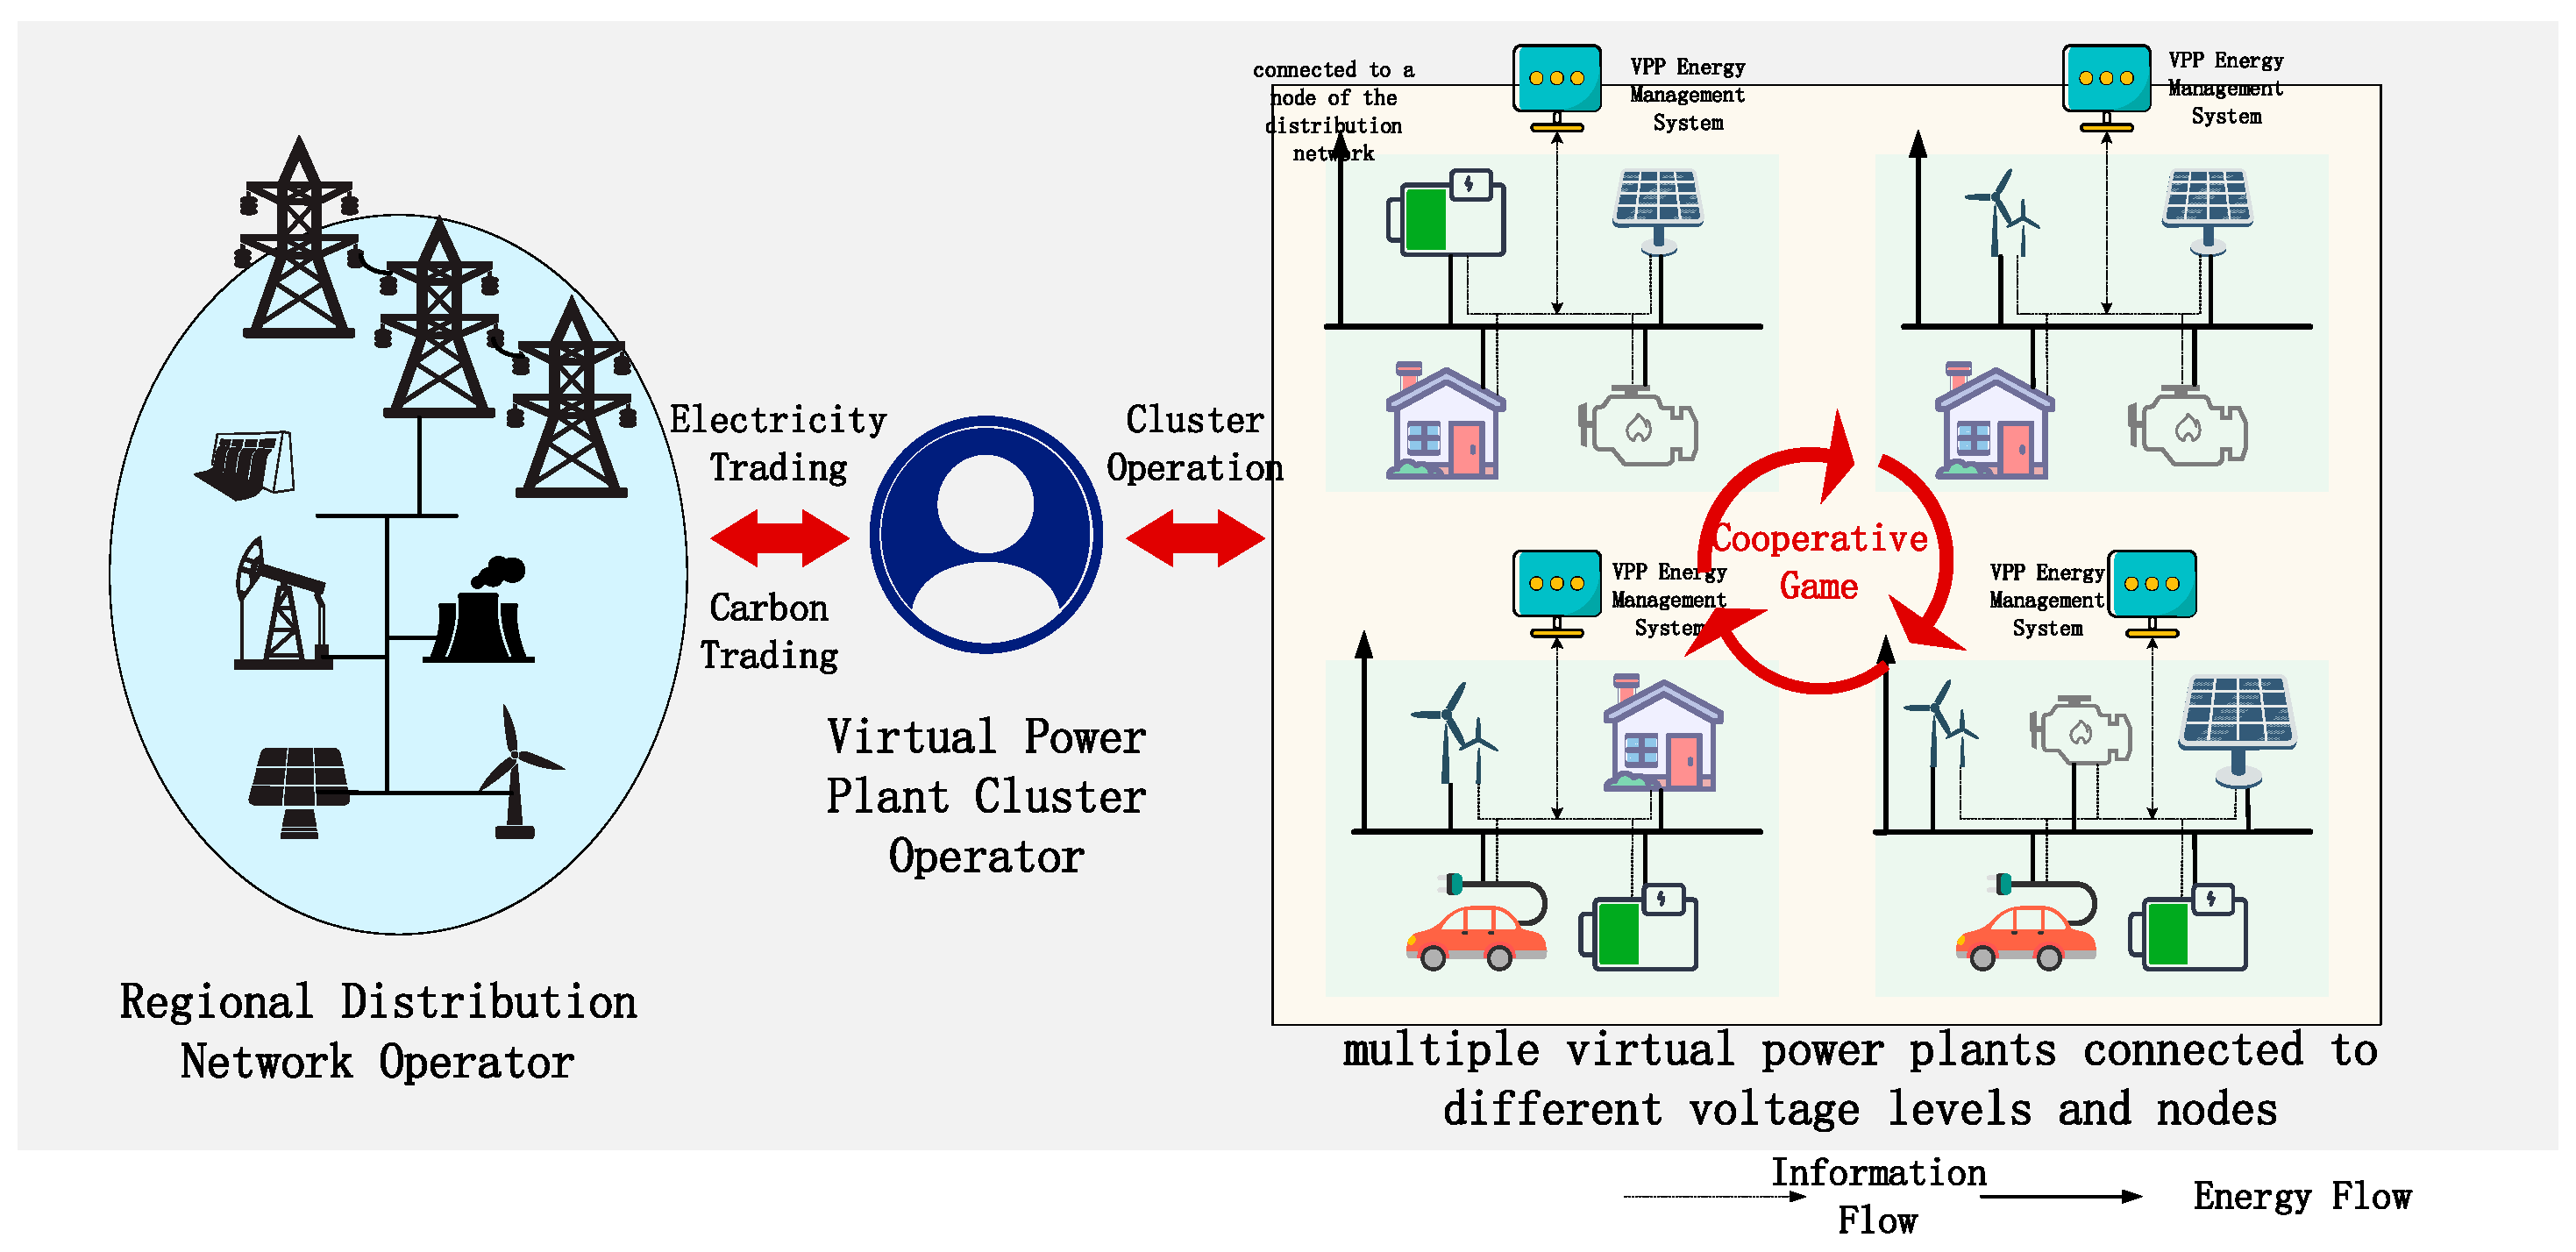
The joint operation framework of virtual power plant clusters is shown in
Figure 2. Since the electricity selling price of the power grid is usually higher than the purchasing price, the economic benefits of virtual power plants directly engaging in buy–sell electricity transactions with the grid are low. As independent and rational interest entities, each virtual power plant hopes to leverage the diversity and complementarity in power generation/consumption and carbon emissions, carry out cooperation within the cluster, and enhance individual profits while reducing carbon emissions by sharing electrical energy and carbon allowances.
The virtual power plant cluster operator is responsible for organizing the joint operation of the virtual power plant cluster, which is divided into two stages. The first stage organizes internal shared transactions within the cluster to form a peer-to-peer (P2P) trading plan. In this stage, the virtual power plant cluster operator only formulates the rules for internal shared transactions and organizes the transactions, without interfering with the pricing decisions between virtual power plants. The second stage involves trading the cluster’s unbalanced electrical energy with the distribution network operator.
Externally to the cluster, as this paper focuses on the operational strategies of the cluster side, the entities on the grid side and market side are simplified. Entities such as grid operators, power market operators, and carbon market operators are no longer distinguished and are uniformly referred to as regional distribution network operators representing the external operational entities of the cluster. The responsibilities of the distribution network operator are as follows: (1) Calculate the optimal power flow of the regional distribution network, and carry out routine work such as dispatching control and transaction operation. (2) Based on the carbon emission flow and node carbon potential of the distribution network calculated by power flow, form an integrated electricity–carbon price for selling electricity to the virtual power plant cluster. (3) Allocate carbon allowances for each node and collect excess carbon emission penalties, while purchasing electricity from the superior grid to maintain the power balance of the distribution network.
4. A Double-Layer Model for Cluster Trading Strategies in the Electricity–Carbon Synergy Market
This section presents the core double-layer optimization model. The upper layer establishes a cooperative game framework (using asymmetric Nash bargaining) to optimize P2P energy and carbon trading among VPPs; the lower layer solves distribution network optimal power flow and feeds back integrated pricing. It also details the model solution method via iterative optimization.
4.1. Framework of the Double-Layer Optimization Model
Under the operational framework outlined in
Section 1, this section aims to minimize the electricity consumption costs and environmental costs of virtual power plant (VPP) cluster operations, expand the scale of local transactions, and reduce carbon emissions by formulating optimized trading strategies. Focusing on the day-ahead stage (which can be extended to other time scales), a double-layer optimization model is established to devise the trading strategies for VPP clusters in the electricity–carbon synergy market. The upper-level model endeavors to minimize the total cluster operating costs. Within the boundaries of the comprehensive electricity–carbon price set by the distribution network operator, it forms peer-to-peer (P2P) trading plans for electric energy and carbon allowances, as well as optimized dispatch plans for individual VPPs, through cooperative games among VPPs within the cluster. The lower-level model aims to minimize the distribution network operation costs. Based on the P2P trading plans submitted by the VPP cluster operator, it calculates the optimal power flow of the distribution network and determines the comprehensive electricity–carbon price. With the P2P trading plans and the comprehensive electricity–carbon price serving as interactive variables, the double-layer optimization model coordinates the decision-making between the upper and lower levels through iterative cycles. The process continues until the convergence criteria are met, thereby achieving the optimal operation of VPP clusters in the electricity–carbon synergy market.
4.2. Upper-Level Model
The objective function for minimizing the total operating cost of the virtual power plant cluster is as follows:
Active power balance constraint for each virtual power plant:
Carbon emission balance constraint for each virtual power plant:
In the virtual power plant model of this paper, resources generating electricity from fossil energy do not receive free carbon allowances, while resources using clean energy can obtain a certain proportion of free carbon allowances based on historical carbon emission intensity to encourage more clean energy production. In the equations, represents the carbon emissions from gas turbine generators, and denotes the initially allocated carbon allowances.
In summary, the upper-level optimization model is
4.2.1. Proof of the Existence of Cooperative Games in Virtual Power Plant Clusters
The core of the upper-level model lies in enabling the cluster to achieve both overall and individual optimal benefits through internal cooperative games within the given price signal boundaries. This requires ensuring two key issues: (1) the existence of cooperative games; (2) the fairness of benefit allocation. The existence of cooperative games namely proves that member cooperation indeed brings more benefits to the cluster, otherwise cooperation would be meaningless. According to cooperative game theory, the existence of cooperative games can be proved by the superadditivity of the characteristic function of cooperative coalitions. In this model, the characteristic function is modeled as the total operating cost of the virtual power plant cluster. Existing studies have proven that such characteristic functions possess superadditivity, thus confirming the existence of cooperative games.
In the equations, represents the cooperative game model, denotes the game participants, and stands for the characteristic function of the cooperative game.
4.2.2. Interest Allocation Method Based on Asymmetric Nash Bargaining
The key issue to be addressed in this section is to determine the transaction prices and volumes for electricity and carbon trading among virtual power plants. In cooperative games, the Nash bargaining model can balance individual and collective interests to achieve multi-agent benefit allocation. However, the Nash bargaining model assumes equal bargaining power for all agents, which fails to measure differences in contribution degrees during electricity–carbon sharing. Therefore, this section employs an asymmetric Nash bargaining approach based on contribution indices to realize benefit allocation for joint operations.
In the equation,
represents the contribution index in electricity energy trading. By analogy, the contribution index
in carbon allowance trading can be obtained, and the formula is not listed here. Integrating the contribution indices of electricity energy trading and carbon allowance trading, the comprehensive contribution index is obtained as shown in Equation (36).
The asymmetric Nash bargaining model is constructed to solve the upper-level optimization model, i.e., Equation (37):
where
denotes the optimal operating cost of the virtual power plant connected to node
before participating in the cooperative game.
For ease of solution, the above model is logarithmically transformed to convert the maximization problem into a minimization problem, as shown in Equation (39).
4.2.3. Upper-Level Model Solving Method
The solution to the asymmetric Nash bargaining model is typically transformed into sequentially solving two subproblems: the minimum total cost subproblem for the cooperative coalition (Problem 1, P1) and the maximum benefit allocation subproblem for coalition members (Problem 2, P2). The Alternating Direction Method of Multipliers (ADMM), a distributed algorithm for solving problems with separable optimization variables, is applied here to determine the P2P transaction volumes and prices in the asymmetric Nash bargaining model. The detailed steps are as follows:
(1) Minimum Total Cost Subproblem for the Cooperative Coalition (P1)
The expression for Subproblem P1 is
where
and
are coupling variables representing the generalized electricity and carbon allowance trading volumes between VPPs connected to nodes
and
, satisfying
.
denotes the operating cost of an individual VPP in P1. Since
, the cost of shared transactions need not be considered in individual VPPs. The ADMM algorithm is used to solve P1.
(a) Construct the Augmented Lagrangian function
for P1:
where the Lagrange multipliers are
and
are the penalty factors for P1, respectively.
(b) Update the Coupling Variables and Lagrange Multipliers:
where
denotes the iteration count of the distributed solution.
(c) Convergence Conditions for Primal and Dual Residuals:
where
and
are the set convergence thresholds for primal and dual residuals in P1, respectively.
(2) Maximum Benefit Allocation Subproblem for Coalition Members (P2)
By substituting the optimal shared transaction volumes obtained from P1 into the asymmetric Nash bargaining model, Subproblem P2 is formulated as
where
and
are coupling variables representing the generalized electricity and carbon allowance trading prices between VPPs connected to nodes
and
, satisfying
.
denotes the optimal solution from P1. To solve the maximum benefit allocation Subproblem P2 for the cooperative alliance of virtual power plant clusters using the ADMM algorithm, the augmented Lagrangian function
of P2 is first constructed as
where
and
are the Lagrange multipliers and penalty factors for P2, respectively.
The subsequent solution process is roughly the same as that of P1 and will not be repeated here.
4.3. Lower-Level Model
The lower-level model aims to minimize the operation cost of the distribution network and calculate the optimal power flow. The objective function of the lower-level model is
where
represents the operation cost of thermal power units, and
denotes the power purchase cost from the upper-level distribution network.
is the operating power of thermal power units, and
,
, and
are the operation cost coefficients of thermal power units.
is the power purchase price from the upper-level distribution network, and
is the purchased power from the upper-level distribution network.
Constraint Conditions of the Lower-Level Model:
(1) Active Power Balance Constraint
where
and
represent the power of photovoltaic and wind farm stations connected to the distribution network, respectively.
is the Lagrange multiplier for handling the active power balance constraint, satisfying
.
(2) Reactive Power Balance Constraint
(3) Other Operational Constraints of the Distribution Network
(4) Output Constraints of Thermal Power Units
4.4. Double-Layer Model Solution Method
In this study, the double-layer model is solved using an optimization strategy based on iterative back-and-forth calculations, which gradually approaches the optimal solution by alternately solving the upper- and lower-level problems. Specifically, the upper-level decision variables are first fixed to solve the lower-level problem and obtain the corresponding lower-level decision variables. Then, the upper-level decision variables are updated based on the solution of the lower-level problem to optimize the upper-level objective function. This process is repeated in each iteration until the preset convergence condition is met. Through the collaborative optimization of the upper and lower-level problems, this method ensures the convergence of the solution process while effectively addressing the complex structural characteristics of the double-layer model. The algorithm flowchart is shown in
Appendix A.
The model is highly scalable, owing to its architectural design features. By adopting ADMM, the bi-level optimization problem is decomposed into distributed subproblems that can be solved in parallel for each VPP and the distribution network. This avoids the computational bottleneck of centralized solving, so the complexity does not grow sharply with an increasing number of VPPs. For real-time adaptation, its core mechanism focuses on key interactions (P2P transactions and EACP feedback), which can be streamlined by shortening the optimization time window, making it adaptable to dynamic scenarios without losing core functionality.
5. Case Study Analysis
This section validates the proposed mechanism through practical simulations. It describes the parameter configuration (based on the IEEE 33-node system and three VPPs), analyzes scheduling results, P2P transactions, and carbon potential distribution, and evaluates economic efficiency and the effectiveness of asymmetric bargaining, demonstrating the model’s feasibility and advantages.
5.1. Parameter Configuration
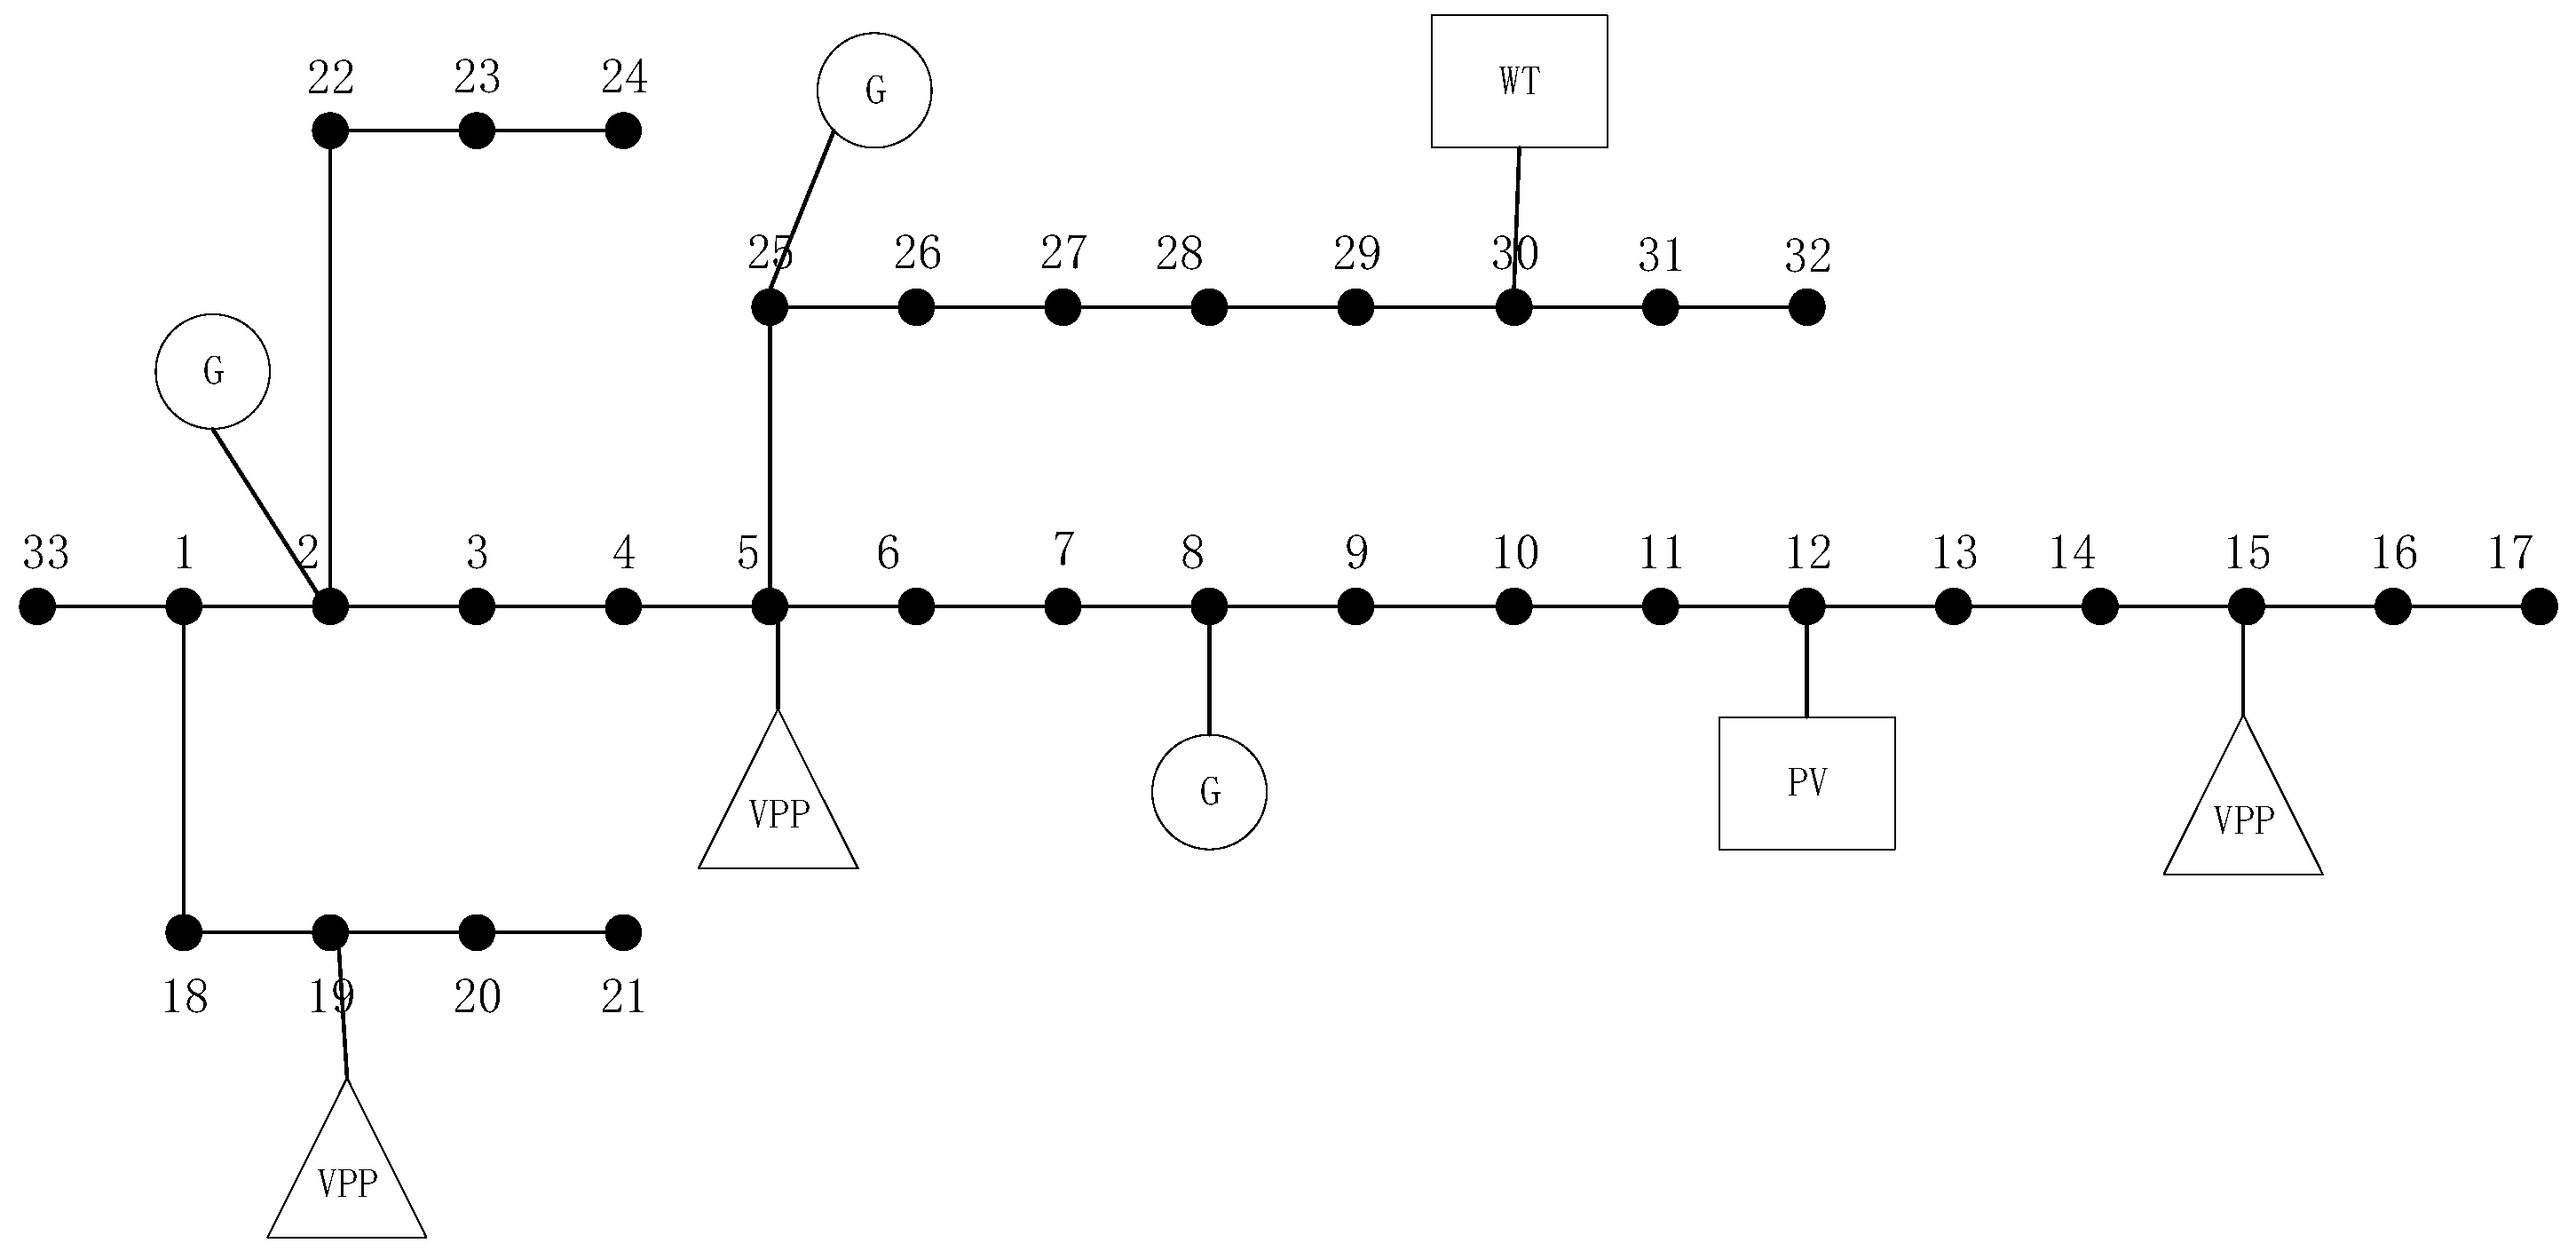
This section selects three virtual power plants (VPPs) for case studies. Each VPP incorporates distributed photovoltaic (PV) or wind power as renewable energy sources, complemented by energy storage systems. The loads within the VPPs are subject to demand response control. The case studies are conducted on a distribution network based on the IEEE 33-node standard distribution system. The configuration of the distribution network is illustrated in
Figure 3.
Specifically, the distribution network is connected with three coal-fired units at Nodes 2, 8, and 25, a photovoltaic (PV) plant at Node 12, a wind farm at Node 30, and three virtual power plants (VPPs) at Nodes 5, 15, and 19. Virtual Power Plant 1 (VPP1) incorporates distributed wind power, while Virtual Power Plants 2 and 3 (VPP2 and VPP3) are equipped with distributed photovoltaic (PV) systems. The power generation and load forecasts for the three VPPs are shown in
Figure 4.
5.2. Analysis of Simulation Results
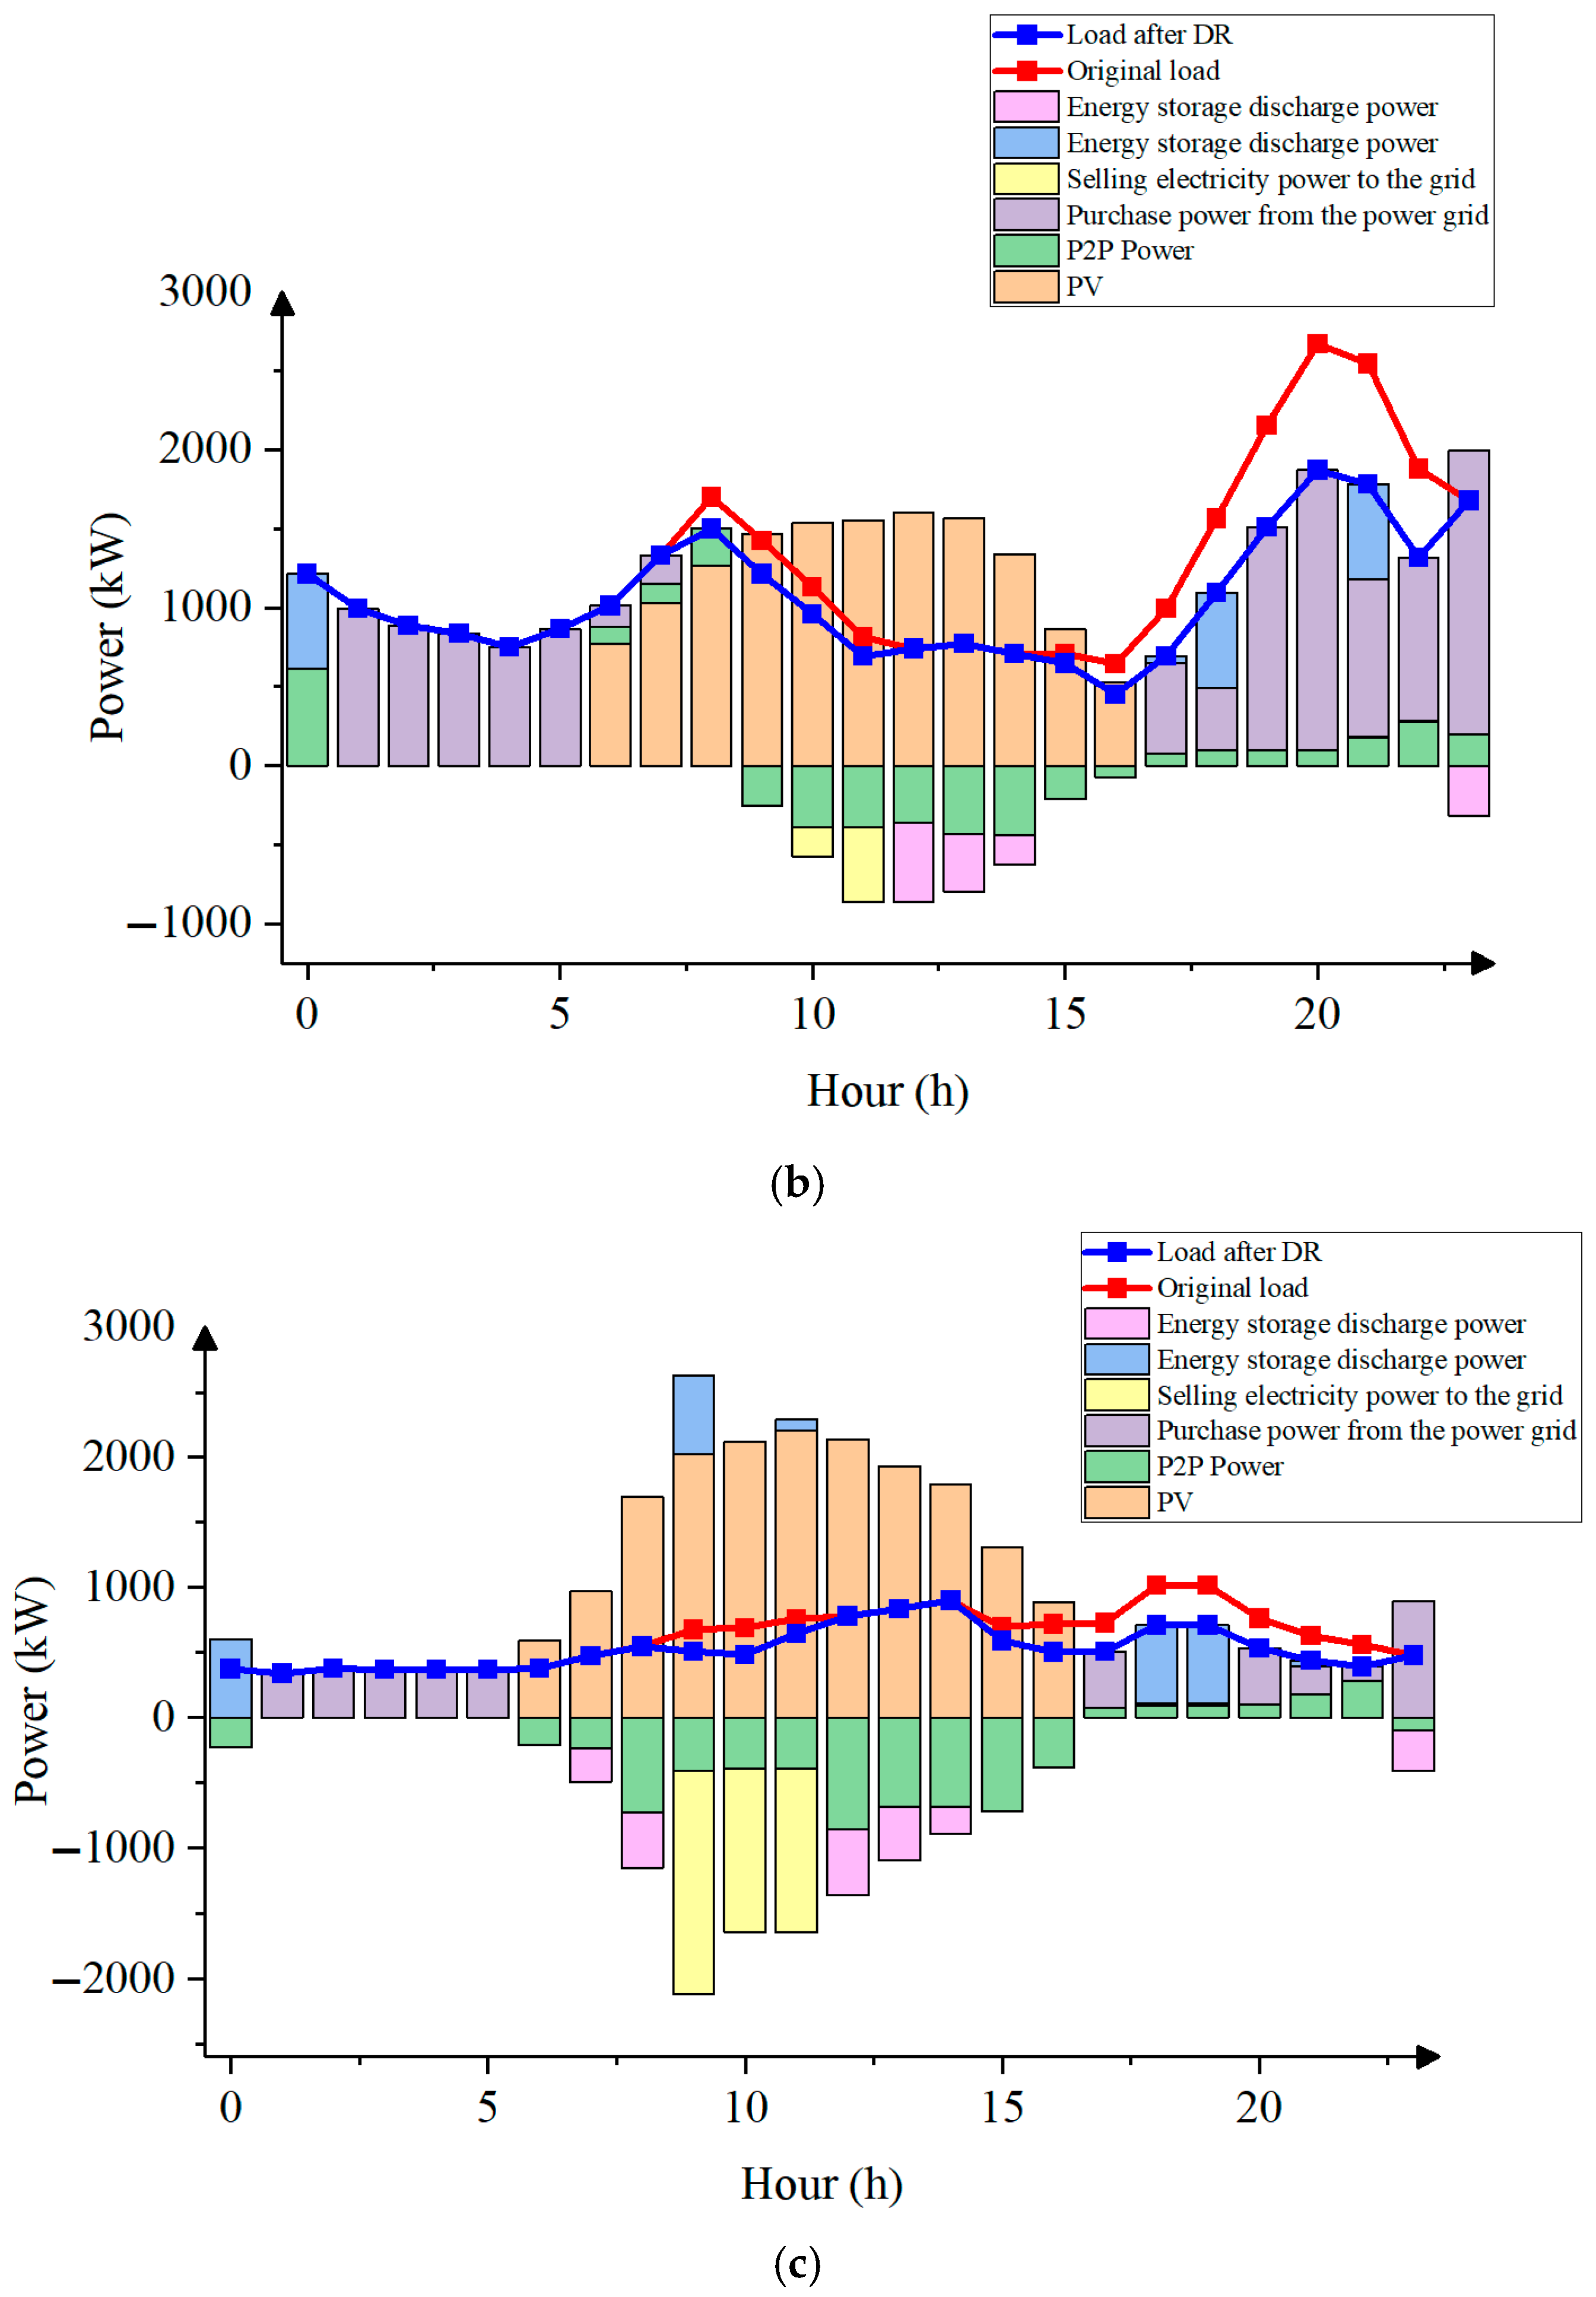
First,
Figure 5 demonstrates the internal optimal scheduling results of each VPP. It can be seen from this that the demand response (DR) mechanism has played a significant role. The blue curves (post-DR load) in the three figures exhibit obvious “peak shaving” characteristics compared to the red curves (original load). Especially during the peak power consumption periods in the afternoon and evening (approximately 12:00–15:00 and 18:00–21:00), demand response effectively reduces the peak load. This not only alleviates the pressure on VPPs to purchase electricity from the regional distribution network or start expensive backup power sources but also creates favorable conditions for the system to integrate intermittent renewable energy sources such as wind turbines (WTs) and photovoltaic (PV) systems.
Second,
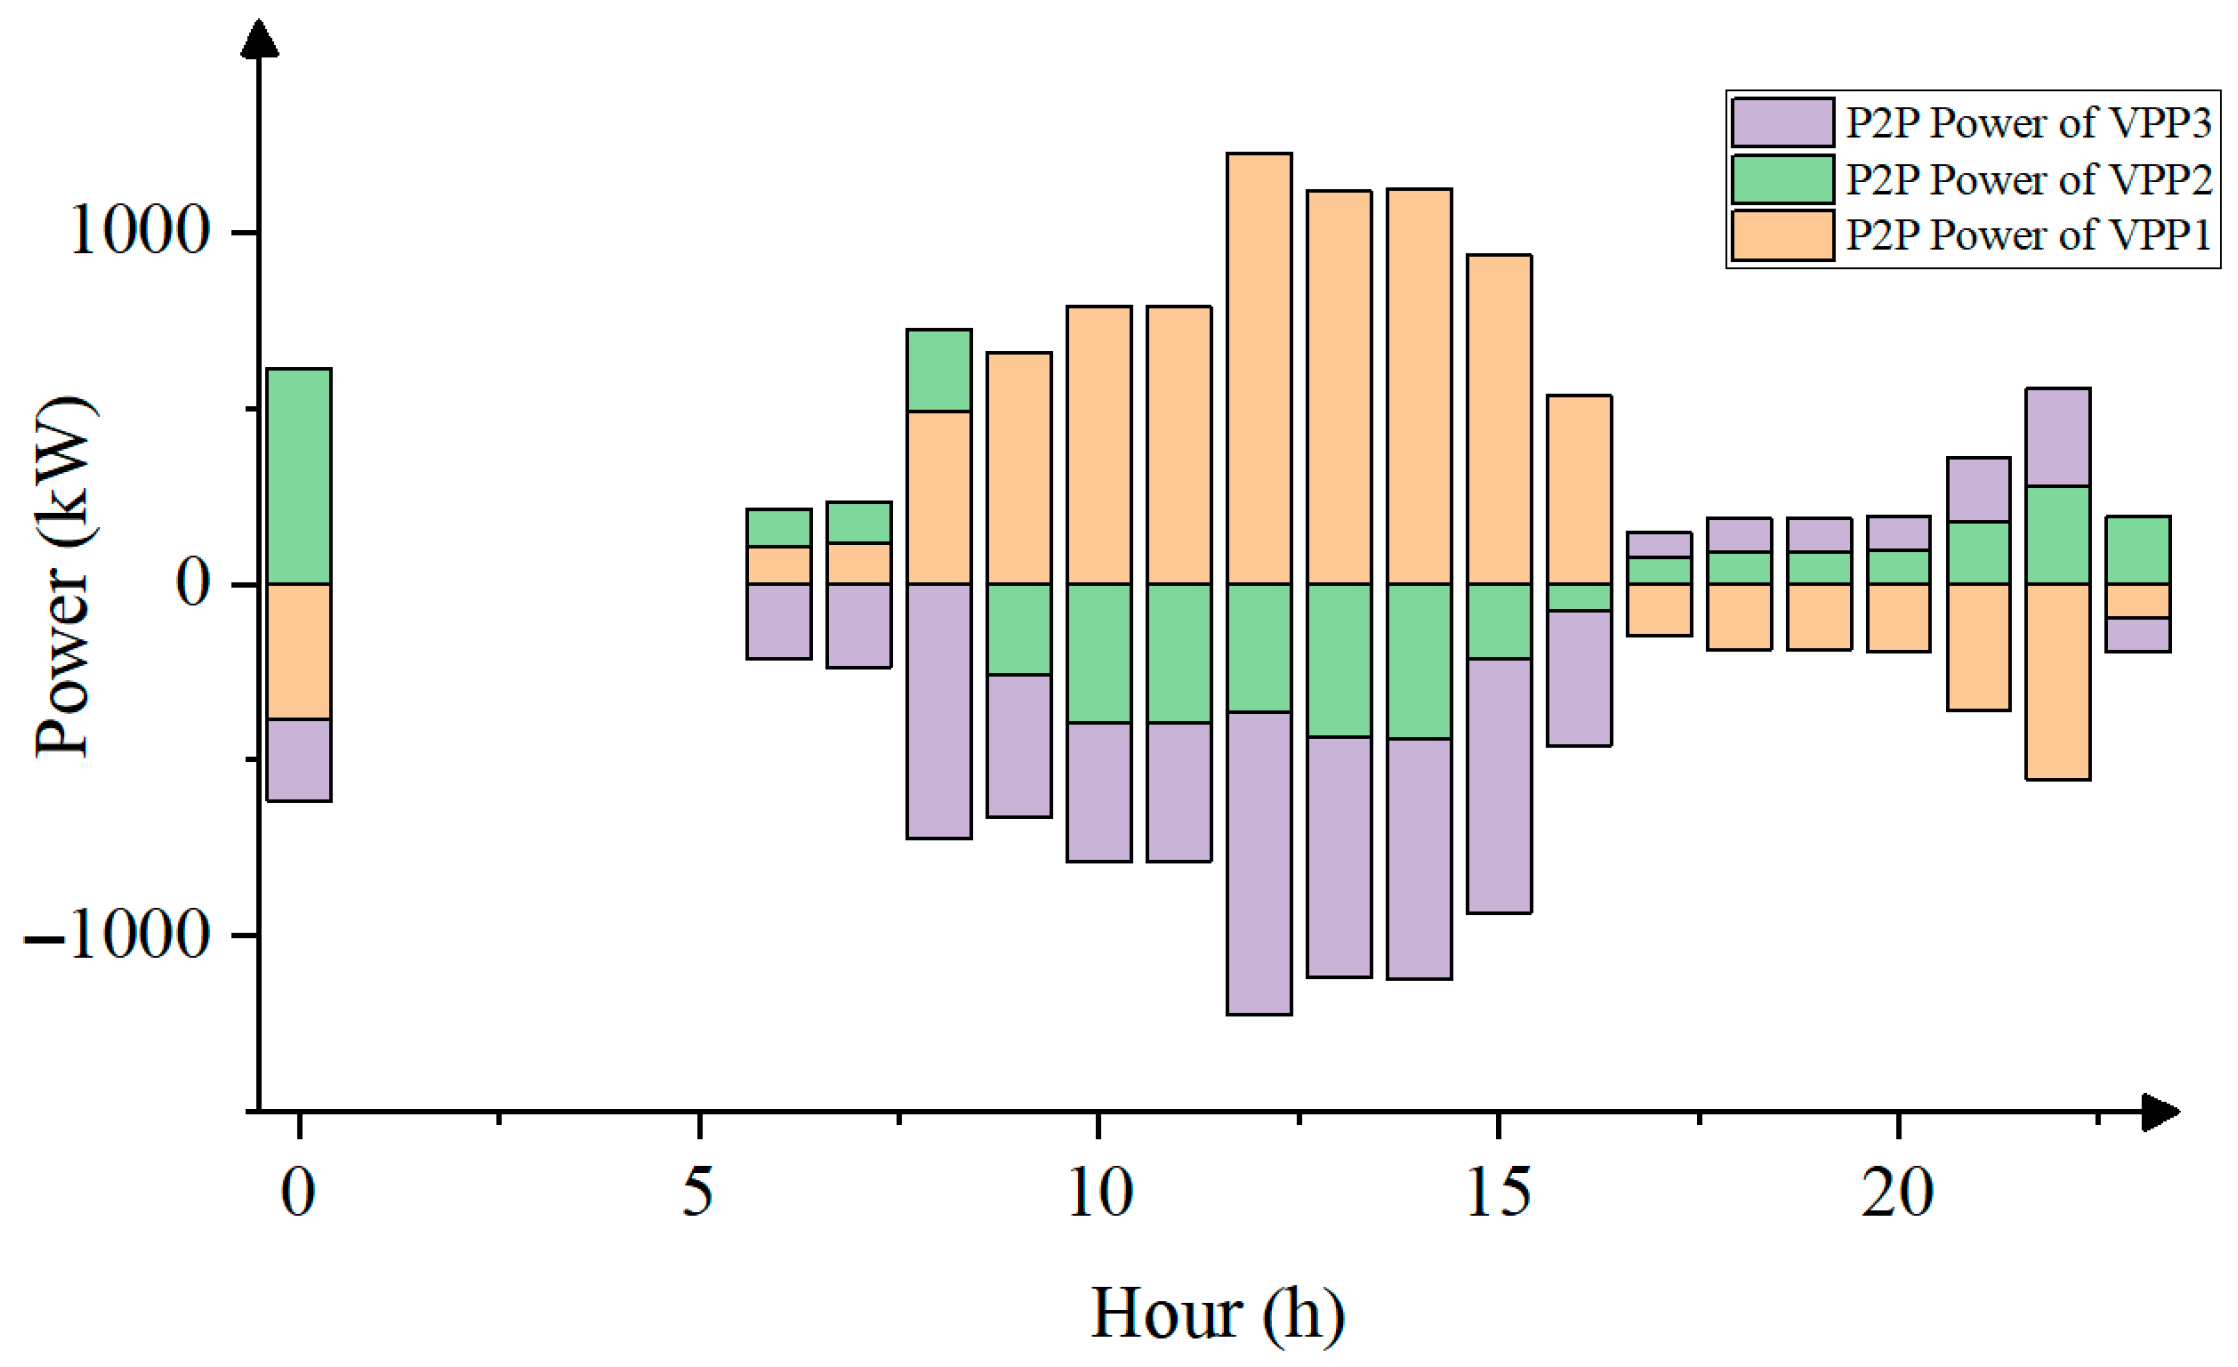
Figure 6 shows the P2P electricity transaction results among VPPs. Each VPP plays a different role in transactions according to its own resource endowment and load characteristics. VPP2 and VPP3 act as the main power sellers in the P2P market during most periods, especially when solar energy generation is at its peak. VPP1, on the other hand, mainly acts as a power buyer to meet its internal power shortage. This trading behavior is closely related to their respective P2P pricing strategies.
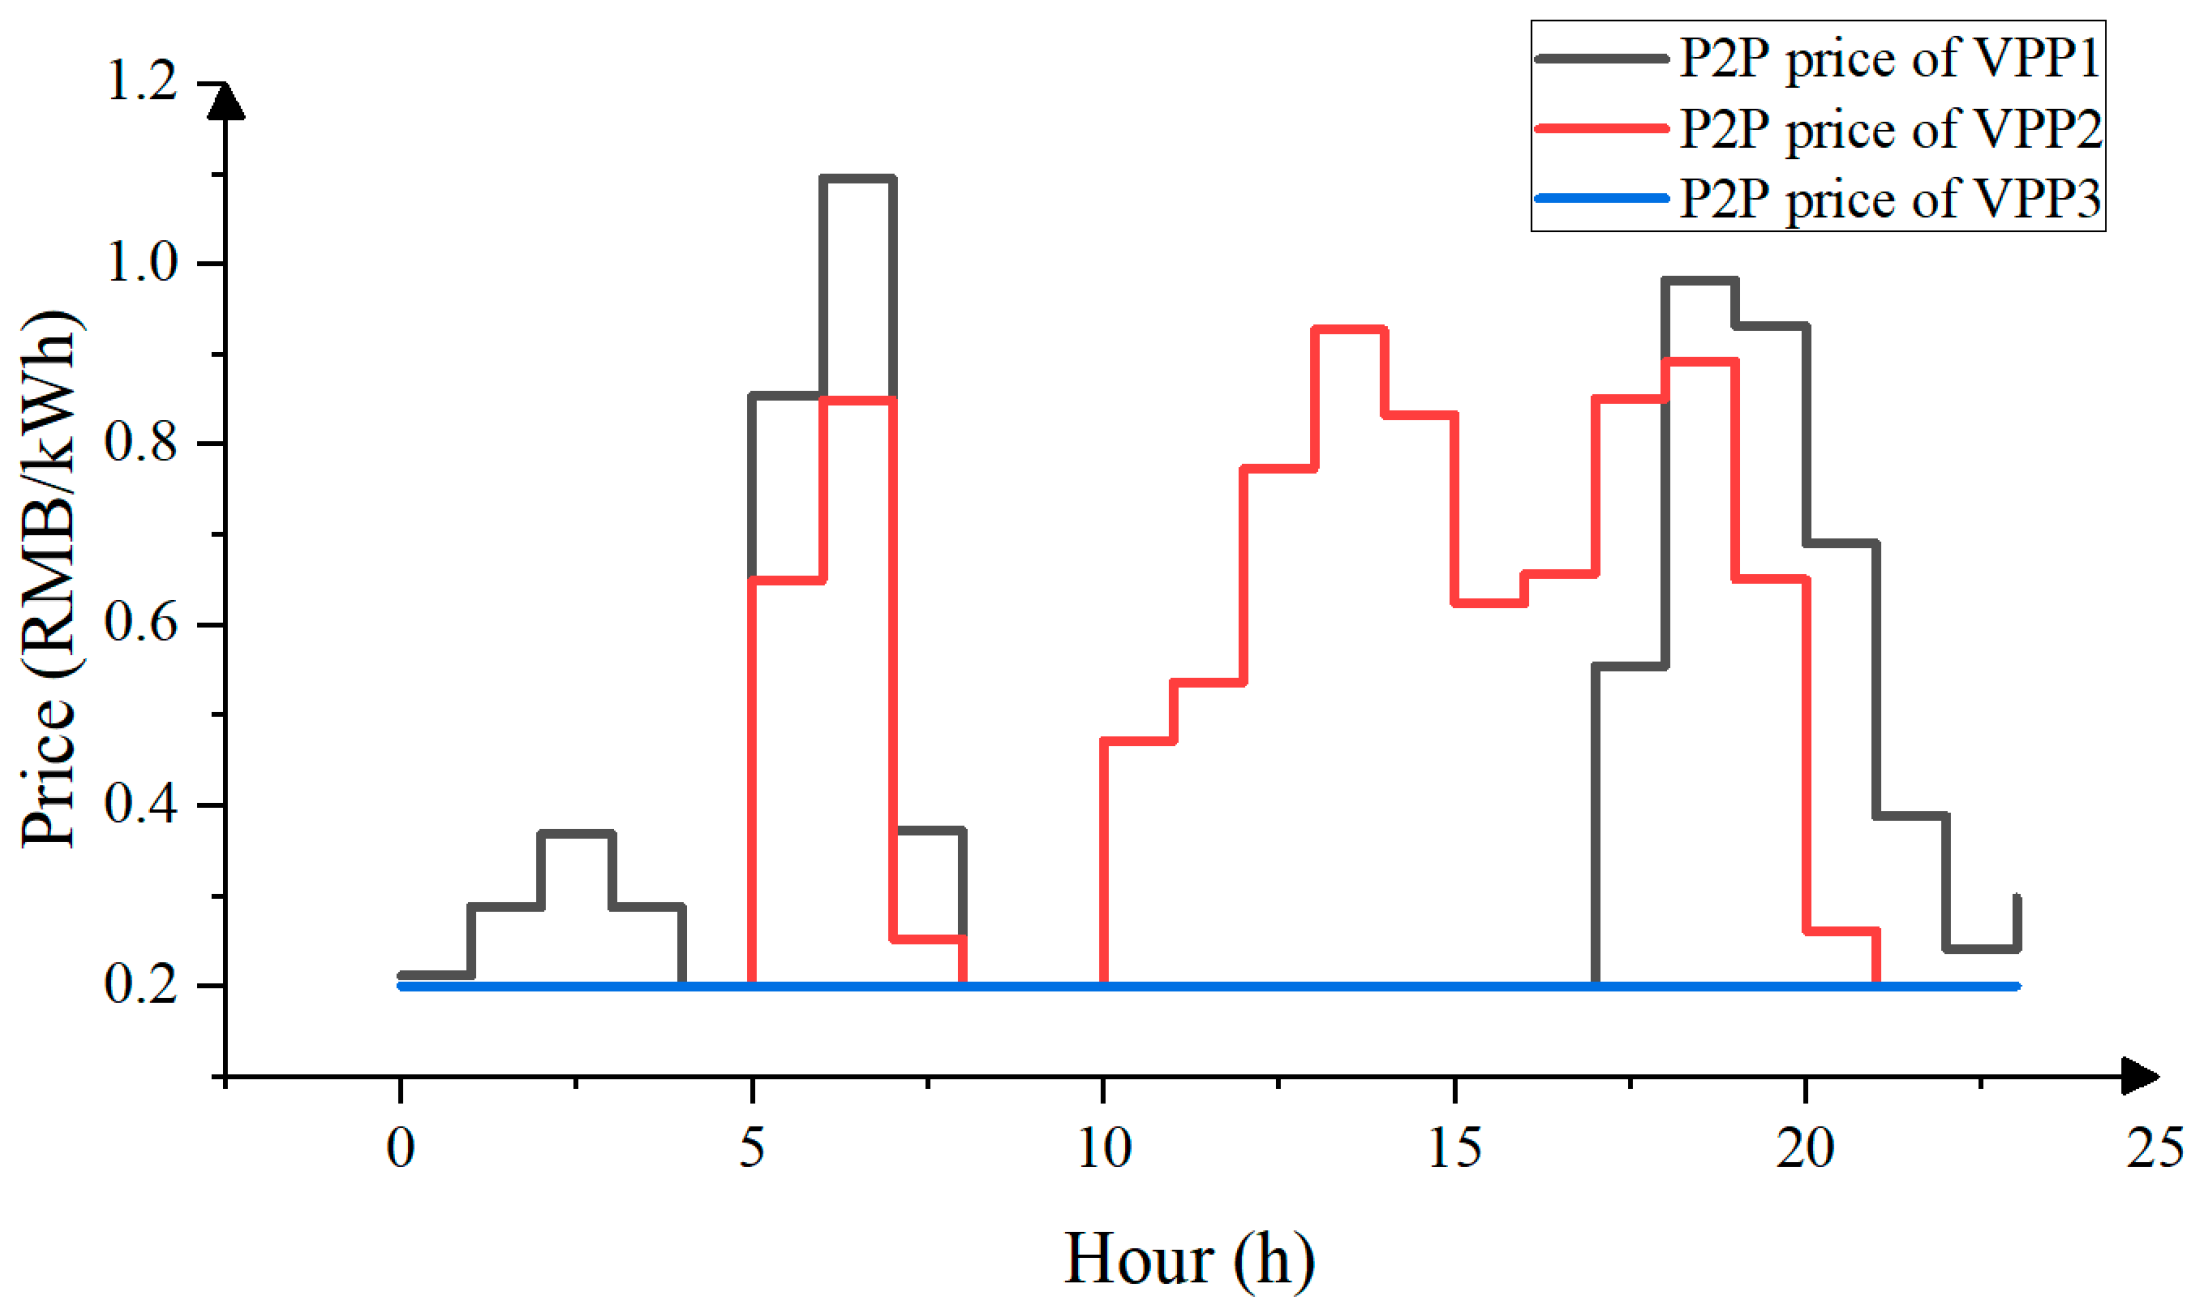
Figure 7 shows the electricity transaction prices among VPPs in each time period, which are related to benefit allocation and calculated by the asymmetric Nash bargaining method, and a detailed analysis will be conducted later.
Furthermore,
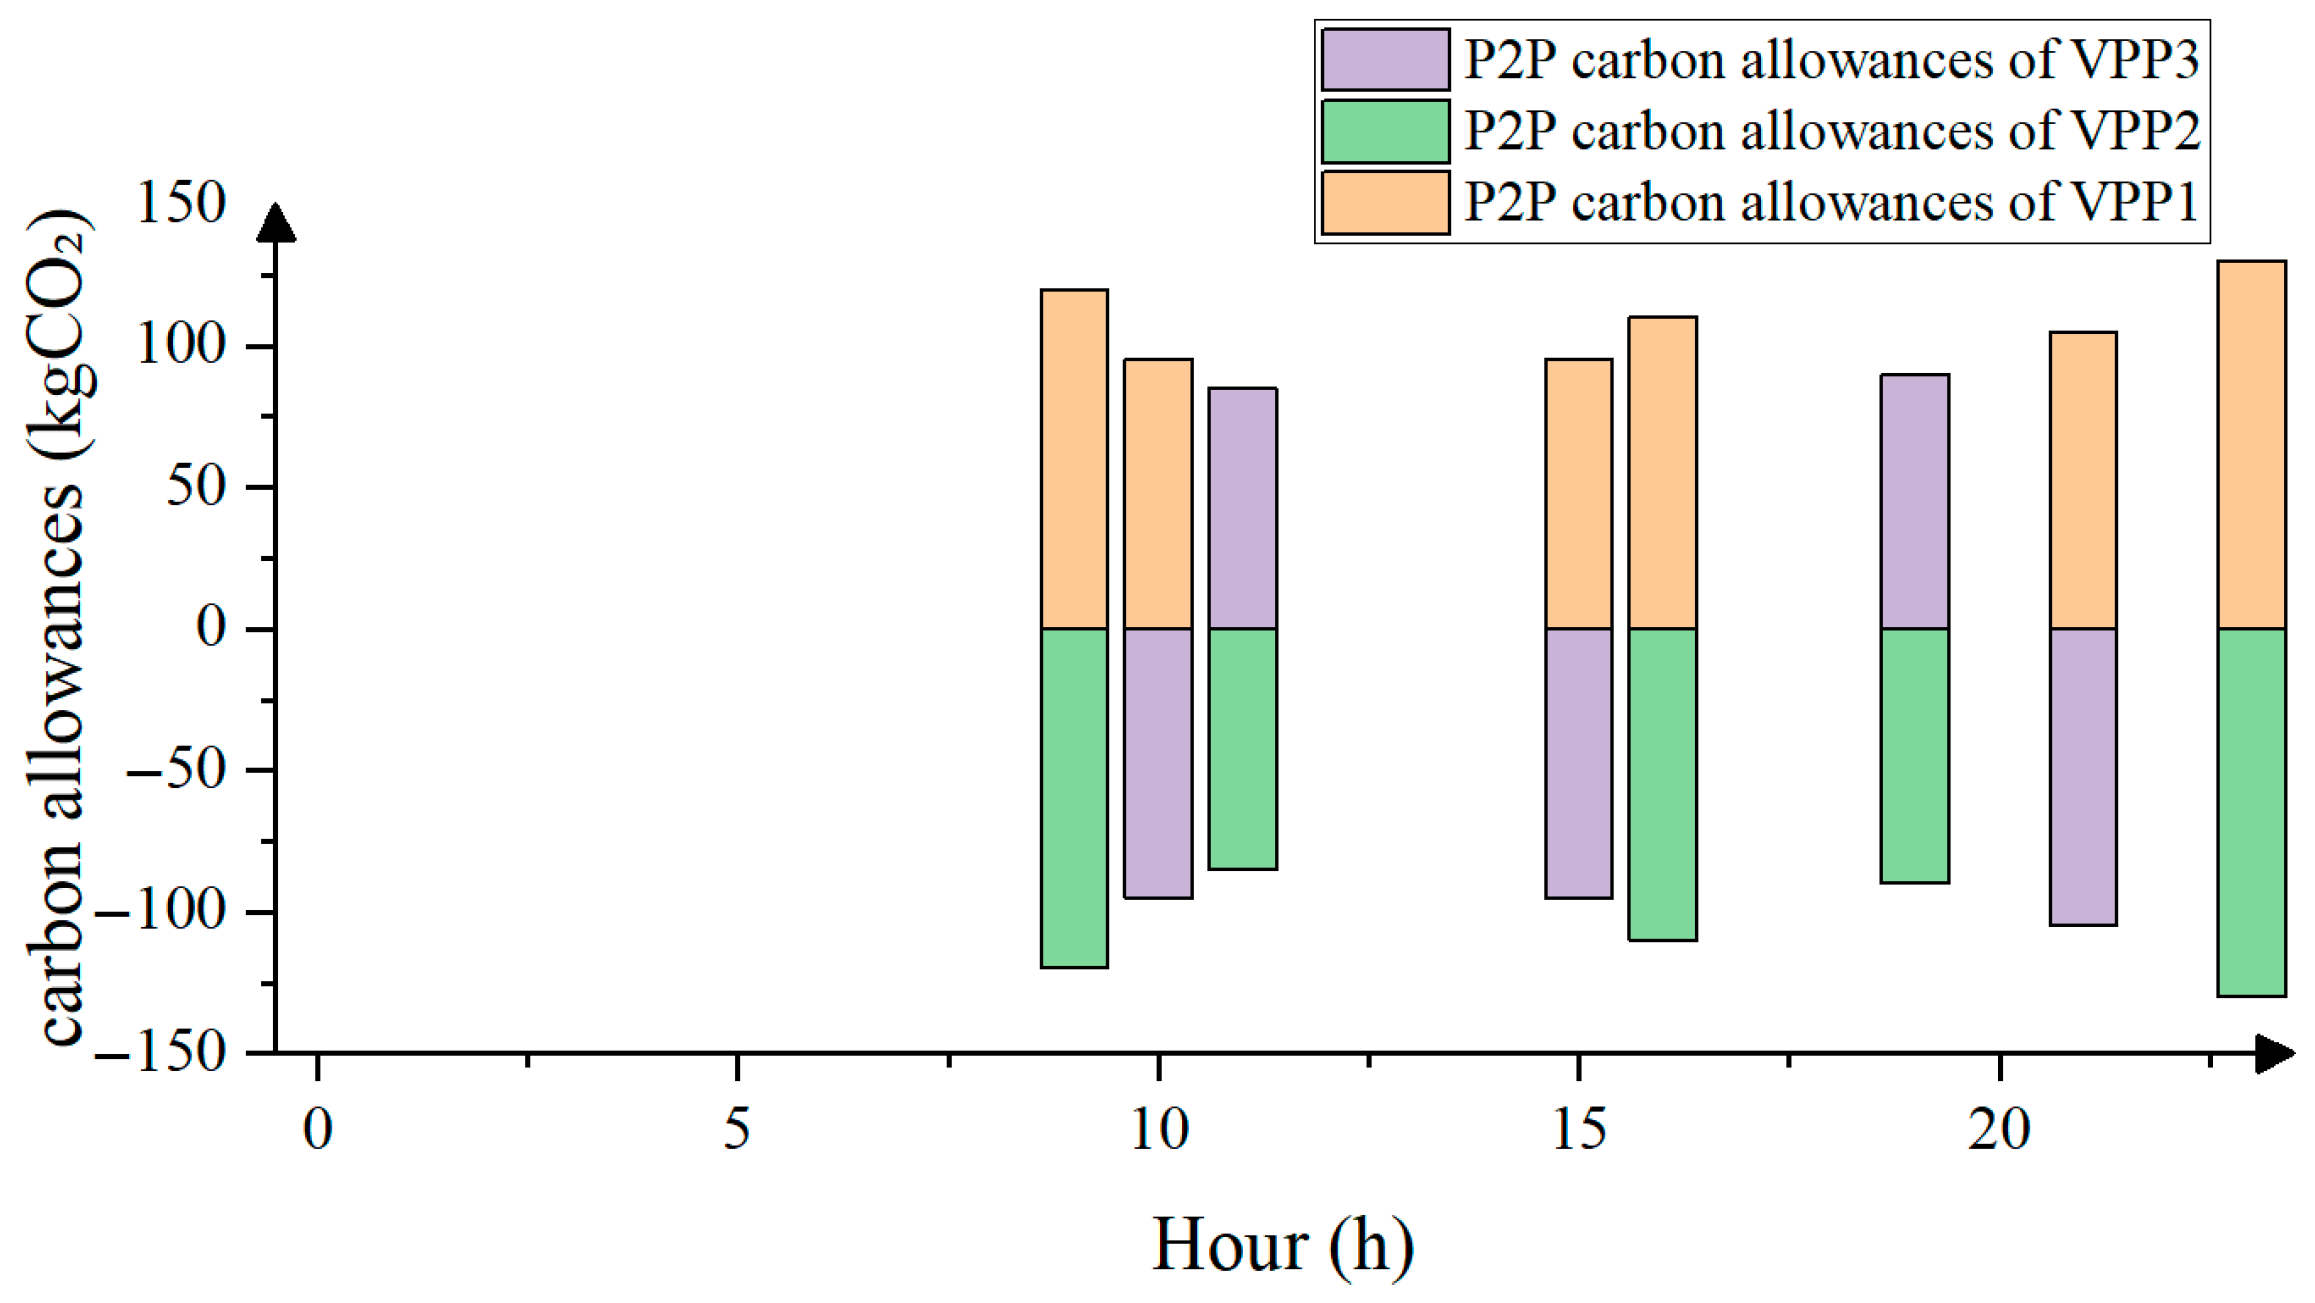
Figure 8 shows the results of P2P carbon quota trading among VPPs. As the primary providers of clean energy (wind power and photovoltaic), virtual power plants can obtain free carbon emission allowances, which means that they realize the monetization of low-carbon value by generating green electricity and acquiring carbon emission quotas. The three VPPs conduct P2P transactions of surplus carbon emission allowances in different periods. As the main buyer, VPP1 needs to additionally purchase carbon quotas from the other two VPPs to avoid high excessive carbon emission penalty fees. This mechanism effectively links the economic dispatch of the electricity market with the environmental benefits of the carbon market, incentivizing VPPs with high proportions of renewable energy to actively participate in market transactions.
Finally, as shown in
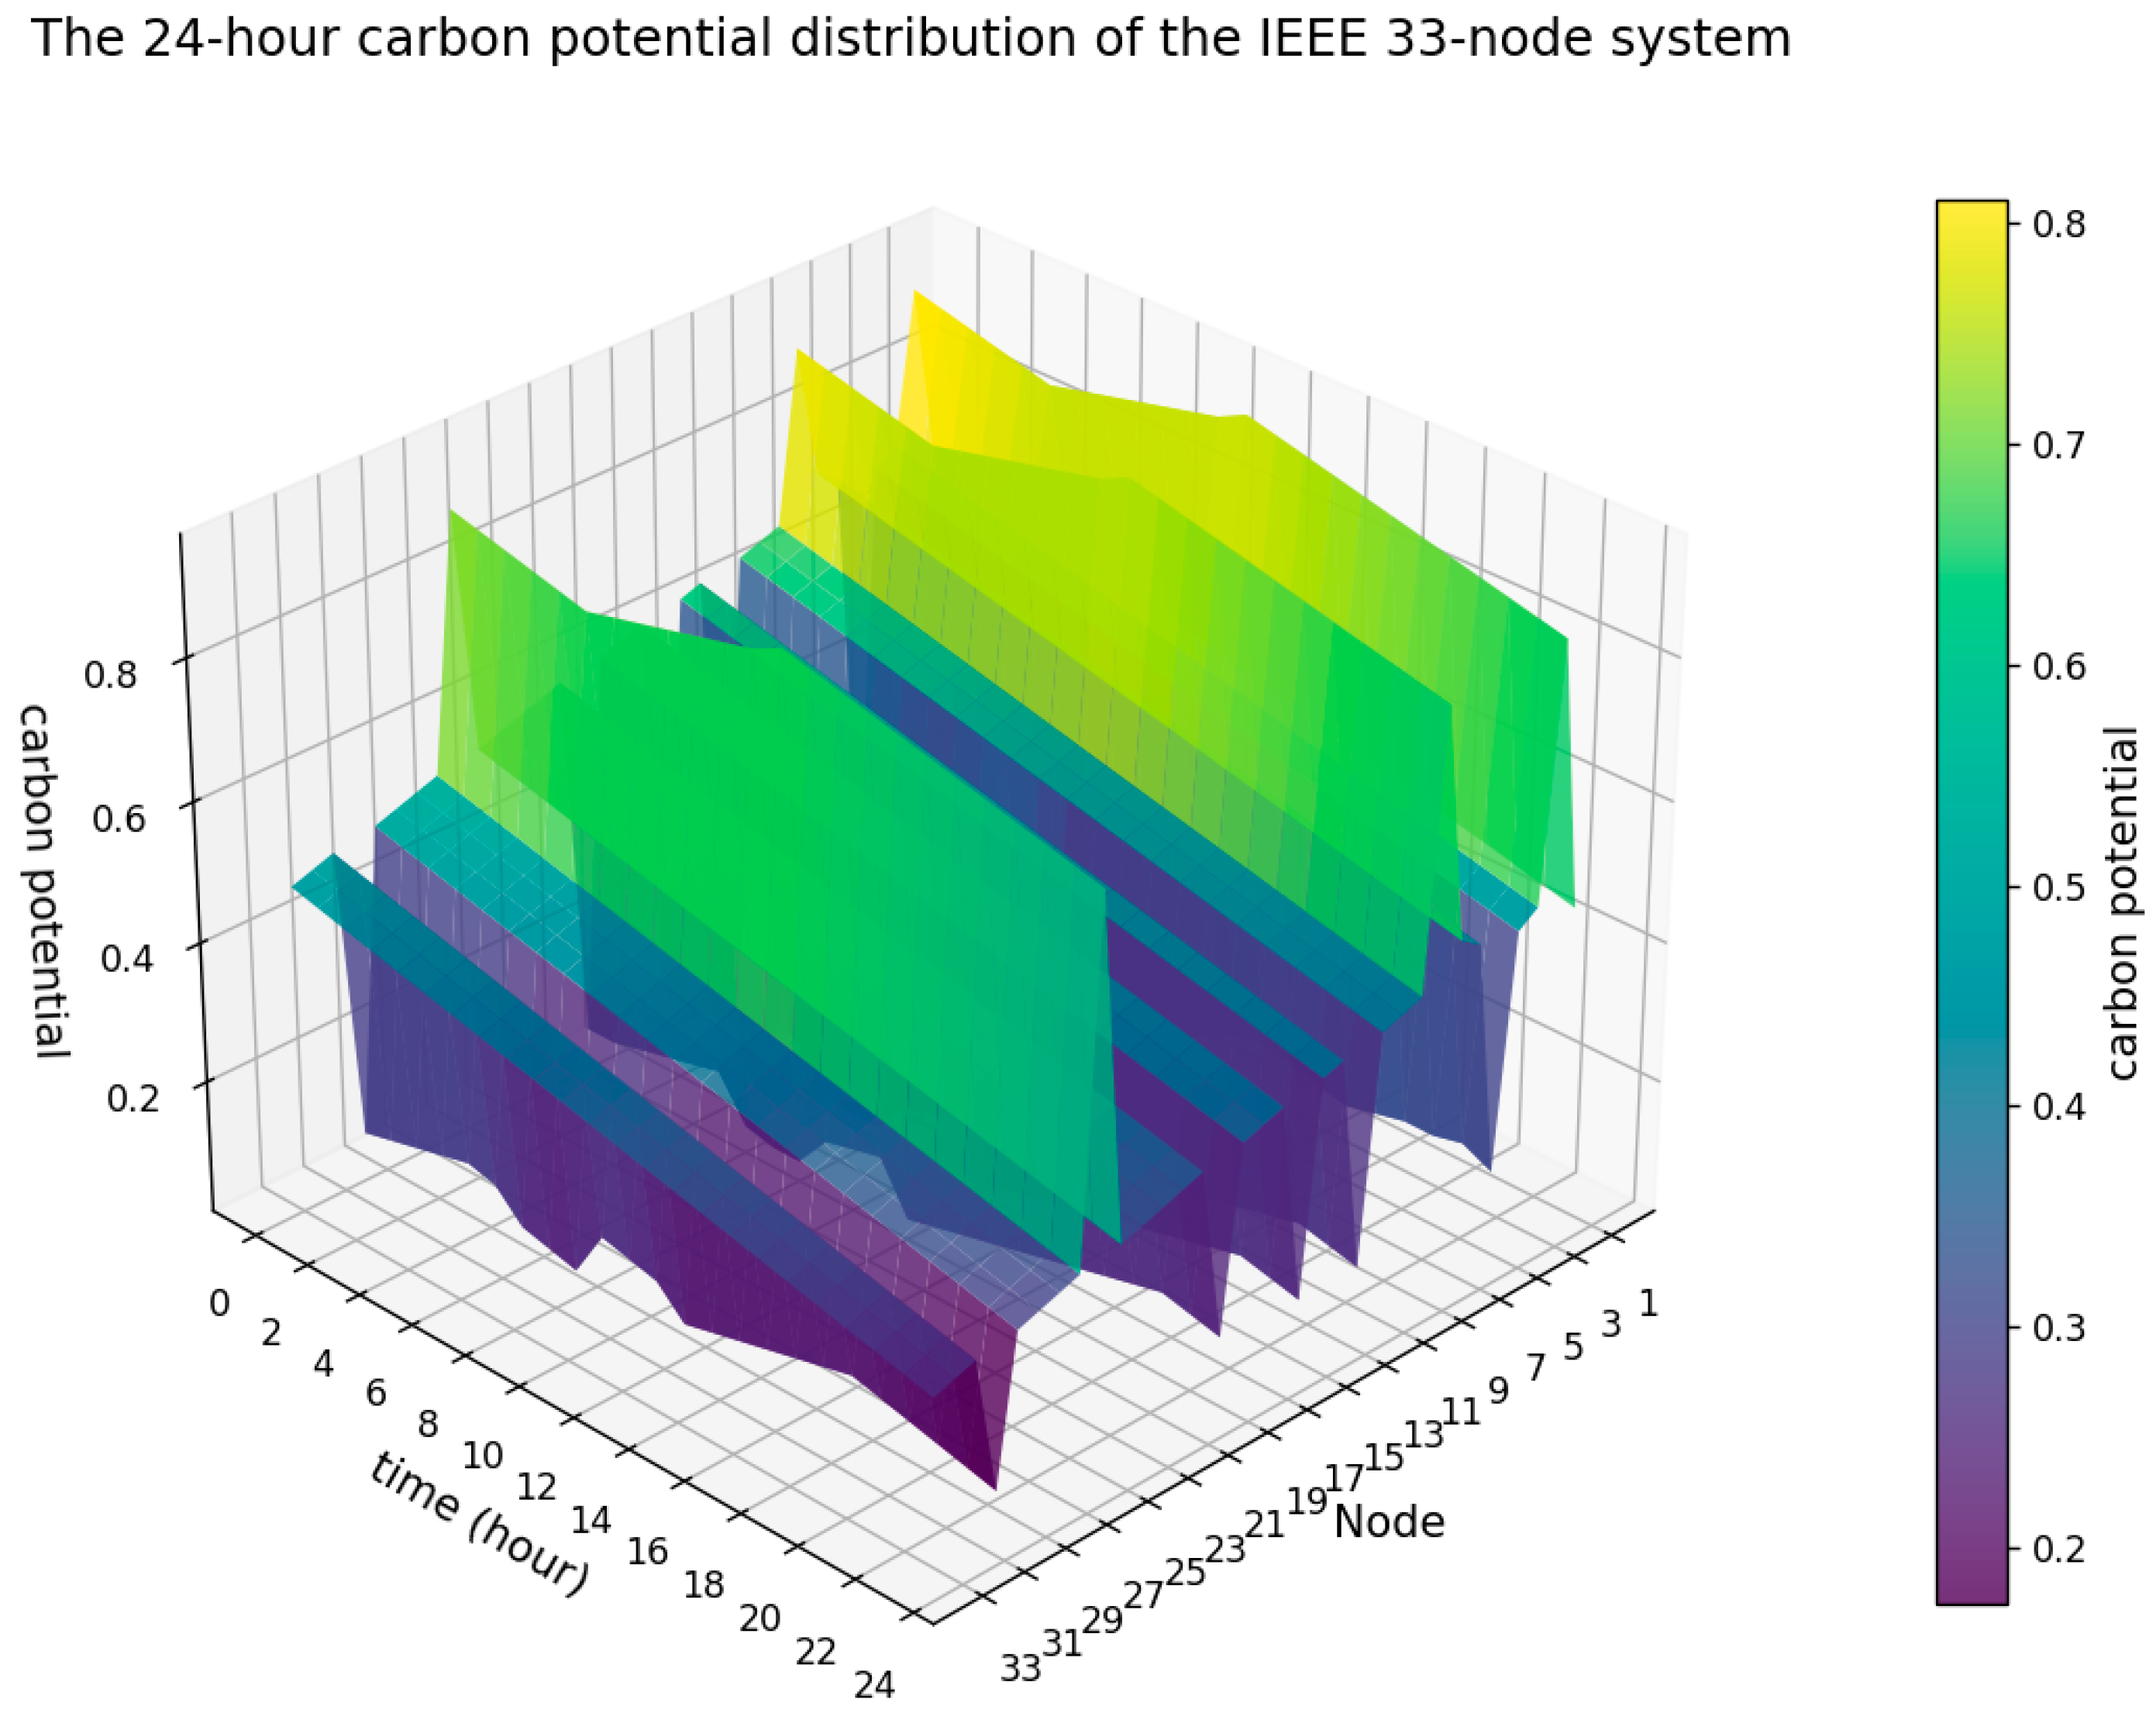
Figure 9, the 24 h carbon potential of the entire IEEE 33-node system demonstrates the above-mentioned system-level optimization effects. Spatially, carbon potential varies among different nodes, which is related to network power flow, line losses, and the power supply and load structure of each region. Temporally, the system carbon potential shows obvious regularity: during the midday period (approximately 10:00–16:00), due to the large-scale integration of new energy sources such as photovoltaics and the optimized scheduling among VPPs, the overall carbon potential of the system is at the lowest level of the day, indicating that the “carbon content” of electricity consumption during this period is the lowest. In the early morning and evening peak electricity consumption periods, due to the decrease in renewable energy output and the increased reliance on traditional power sources, the system carbon potential is relatively high. This intuitively proves the effectiveness of the proposed optimization strategy in reducing the overall carbon emission intensity of the system.
5.3. Effectiveness Analysis of the EACP
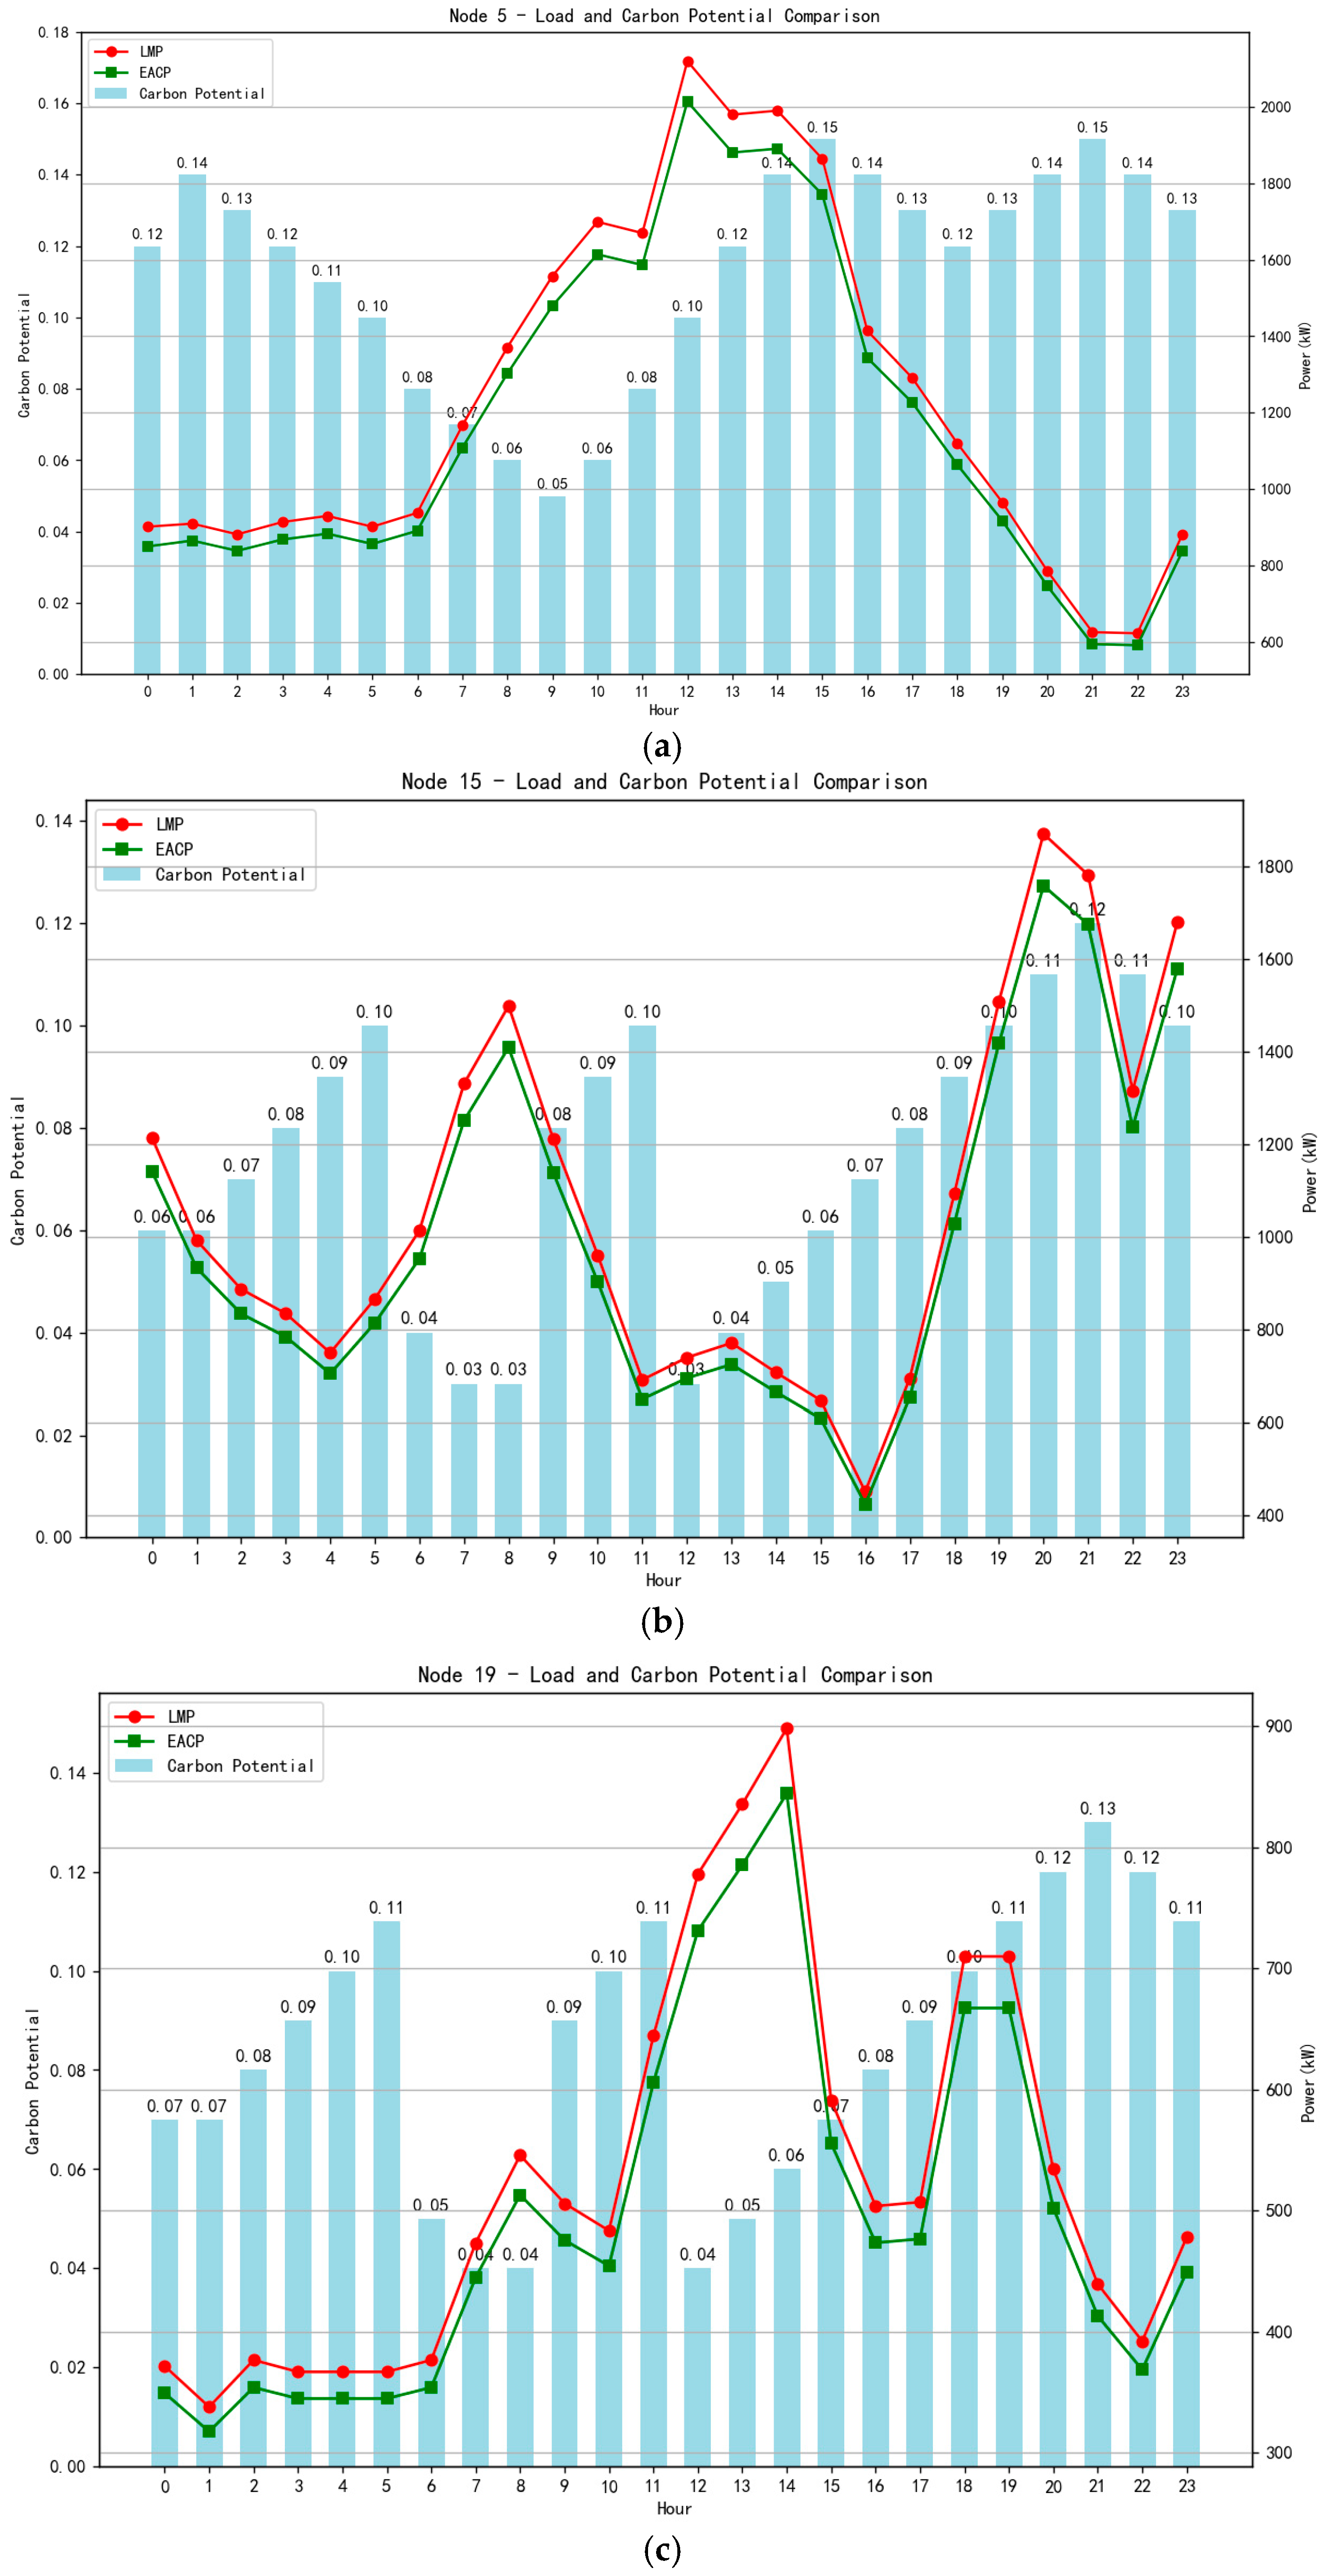
This section analyzes the effectiveness of the constructed integrated electricity–carbon price (EACP) through the case study shown in
Figure 10. The price mechanism can transform the carbon emission characteristics of the system into economic signals in the electricity market, guiding low-carbon power consumption and optimal resource allocation.
As shown in
Figure 10, taking Nodes 5, 15, and 19, where three virtual power plants (VPPs) are located as examples, the integrated electricity–carbon price (EACP, green curve) shows a positive correlation with the nodal carbon potential (blue bar chart). When the nodal carbon potential is high, it indicates that the marginal power supply unit at that node and time has a high carbon emission intensity, and accordingly, the EACP also stays at a high level. Conversely, during the midday period when photovoltaic power generation is abundant, the penetration rate of renewable energy is high, and the system carbon potential is at a low point, the EACP also drops to its minimum. This relationship makes the EACP not only reflect the supply–demand situation in the traditional electricity market (its trend is highly consistent with LMP) but also quantify the “carbon” attribute into market price signals.
The EACP provides clear economic incentives for virtual power plants and their aggregated resources. When facing a relatively high EACP, VPPs will naturally reduce power load. This behavior enables VPPs to proactively avoid “high-carbon” electricity, thereby promoting emission reduction in the entire system. For example, during the evening peak power consumption period (such as 14:00 at Node 19 or 19:00–20:00 at Node 15), the high EACP will suppress power demand.
5.4. Economic Analysis and Effectiveness Analysis of Asymmetric Bargaining
This section analyzes the overall economic efficiency of P2P transactions and the effectiveness of asymmetric bargaining strategies in interest allocation based on cost and revenue improvement data.
As shown in
Table 1, participating in P2P alliance transactions has brought significant economic benefits to all virtual power plants (VPPs). Without P2P trading, the total operating cost of the three VPPs was 31,636. After forming the P2P alliance, the total cost decreased to 28,841.2, achieving a systematic cost saving of 2794.8. This saving is reflected in each participant: the costs of VPP1, VPP2, and VPP3 all decreased to varying degrees. The fundamental reason for this saving is that VPPs mutually complement each other in energy and power supply and demand, which not only avoids purchasing relatively expensive power from the distribution network but also increases the revenue from selling power to the distribution network. This fully demonstrates that through resource complementarity and energy sharing among VPPs, P2P trading can effectively optimize the resource allocation of the entire system, reduce dependence on expensive main grid power, and thus create considerable economic value.
The total revenue enhancement of 2794.8 created by the P2P alliance must be distributed to each member through a fair and reasonable mechanism to maintain the alliance’s stability and participation enthusiasm. This case study compares two different interest allocation schemes: symmetric bargaining and asymmetric bargaining. Although the total revenue distributed by the two schemes is the same, the share allocated to each VPP differs significantly. This indicates that different allocation principles will directly affect the final revenue of all parties and reflect different evaluations of each VPP’s contribution to the alliance.
As shown in the previous figure, VPP1 is the main power buyer, and VPP3 is the main power seller. Their absolute transaction power during the daytime when renewable energy is abundant is relatively large, constituting the main supply and demand in the market. According to the principle of “the larger the transaction volume, the greater the contribution,” they should obtain a higher revenue share. The table confirms this: under asymmetric bargaining, VPP1’s revenue enhancement value (1453.8) is higher than that under symmetric bargaining (1352.8). Combined with the previous analysis, VPP1 (wind power VPP) is the main power buyer in the P2P market at noon, and this allocation reflects its core value in absorbing midday photovoltaic power, enabling it to obtain a higher revenue allocation weight. Similarly, VPP3’s revenue (650.8) is also higher than that under symmetric bargaining (620.8). This indicates that the method proposed in this paper can successfully identify and incentivize VPP users with a large share in the P2P market.
As another photovoltaic power seller in the market, VPP2’s total transaction power is also crucial to the formation of the market, but from the perspective of the power volume in
Figure 6, the absolute value of its 24 h cumulative transactions is smaller than that of VPP1 and VPP3. Therefore, the asymmetric bargaining model has adjusted its revenue accordingly. The table shows that VPP2’s revenue under asymmetric bargaining (690.2) is lower than that under symmetric bargaining (821.2). This is not a punishment but a precise calibration based on the principle of contribution, meaning that its total transaction volume accounts for a slightly lower proportion in the alliance than the share allocated according to the symmetric principle.
In summary, this asymmetric Nash bargaining revenue allocation method can tilt revenue toward more active participants with larger transaction volumes in the market. This mechanism directly incentivizes all VPPs to maximize their participation in the P2P market. For power generators, it encourages them to trade surplus power in the market; for power consumers, it also encourages them to meet their own gaps through the market. This method can promote the development of the P2P market and guide an active and efficient P2P sharing ecosystem. Integrating virtual power plants (VPPs) into the studied case presents distinct challenges, including technical hurdles like ensuring real-time coordination among diverse distributed energy resources (DERs) under fluctuating renewable output, and regulatory barriers such as aligning multi-stakeholder interests (grid operators, DER owners, aggregators) within existing market frameworks. Additionally, data security risks in bidirectional communication and the need for standardized protocols to enable interoperability across heterogeneous assets further complicate seamless integration.

