1. Introduction
The rapid growth in global energy demand has created several challenges, such as resource depletion, environmental pollution, damage to the ozone layer, and worsening global warming. To address these issues, renewable sources have become a focus of attention, offering sustainable solutions that have a lower environmental impact. Among these, solar energy stands out for its abundance and ecological benefits, being applied in thermal collectors, photovoltaic (PV) systems, solar power generation, building heating and cooling, and even in desalination systems. Commercial PV panels, which directly convert solar radiation into electricity, have gained relevance in large-scale clean energy production, aligning with the transformations in the global energy market [
1,
2]. Modern electrical grids have rapidly evolved into a distributed structure, with growing reliance on solar energy [
3]. In addition, the development of energy storage technologies, such as batteries, supercapacitors, and fuel cells, is intensifying to support PV-based energy generation [
4]. These advancements reflect not only a push toward sustainability but also a response to the growing demand for clean and efficient energy from solar sources. At the same time, technological progress and increasing computational power are driving the development of more sophisticated control algorithms, enabling the formulation of new control laws tailored explicitly to solar energy systems. This evolution aims to achieve desired closed-loop responses, ensuring smooth and efficient integration of solar energy into the power grid [
5].
Currently, one of the main challenges in controlling renewable generation systems is related to the stochastic behavior of the system itself [
6,
7]. The variability and unpredictability of the primary sources compromise the controllability of these systems, especially when they are connected to the electrical grid, requiring more robust and adaptive control strategies. This difficulty is intensified in countries with high renewable penetration, as is the case in several European nations, where system operators impose stricter interconnection requirements in order to ensure stability and power quality [
6].
In grid-connected PV generation systems, the current loop control complexity is heightened due to the multivariable nature, modulation diversity, and coupling of differential equations in
coordinates. In this context, designing controllers capable of decoupling the loops represented in
coordinates or avoiding delays between reference and output signals while maintaining harmonic rejection capability becomes a significant challenge [
8,
9,
10]. Various control approaches exist for voltage source inverters (VSIs), including conventional PI controllers, multivariable PI controllers [
11], resonant control [
12], and deadbeat (DB) control [
13], among others. All these controllers aim primarily to reject grid disturbances and to control the injection of active and reactive power at the point of common coupling (PCC) with the grid [
3].
This work aims to evaluate the performance of different current controllers applied to grid-connected PV generation systems using a three-level neutral point clamped (NPC) inverter. Specifically, the study focuses on linear multivariable controllers (PI, PR, and DB)implemented in both and coordinate systems. The controllers are assessed under three operating conditions: steady-state, transient conditions with input power variations and during grid impedance variations, with the primary focus on analyzing how each control strategy influences the total harmonic distortion (THD) of the injected grid current and overall system robustness. Furthermore, the study emphasizes often overlooked aspects in current control modeling, such as the influence of the output LC filter capacitor and the implementation of the space vector modulation (SVM) strategy. This comprehensive approach aims to enhance understanding of the controllers’ dynamic behavior and identify potential improvements to optimize the performance and reliability of grid-tied PV systems. By addressing these technical challenges and providing a comparative analysis of control strategies, this work also aims to highlight the advantages of adopting multivariable control techniques in PV applications, fostering the development of more robust and efficient renewable energy systems.
The remainder of this work is structured as follows:
Section 2 presents the plant modeling methodology in different reference frames, covering DC- and AC-side modeling, three-level inverter modulation, and the derivation of current-loop transfer functions in the
and
frames.
Section 3 discusses the control structures for VSI, focusing on the tuning of multivariable controllers in both reference frames.
Section 4 compares these structures across three distinct scenarios, enabling a comparative performance evaluation. Finally,
Section 5 presents the conclusions.
2. Modeling Methodology of the Plant in Different Reference Frames
The integration of photovoltaic systems into the power grid requires precise control of the DC-AC converter to ensure efficiency and power quality (PQ). The inverter control is typically structured in two cascaded loops: the inner loop, responsible for current control and PQ, and the outer loop, which regulates the power injected into the grid, promoting system stability and energy balance in the DC bus [
3,
7].
These control loops work together to optimize solar energy conversion, regulate the DC bus voltage, and mitigate issues such as harmonic distortion.
Figure 1 presents the flowchart of the methodology used for the analysis and tuning of the control structures.
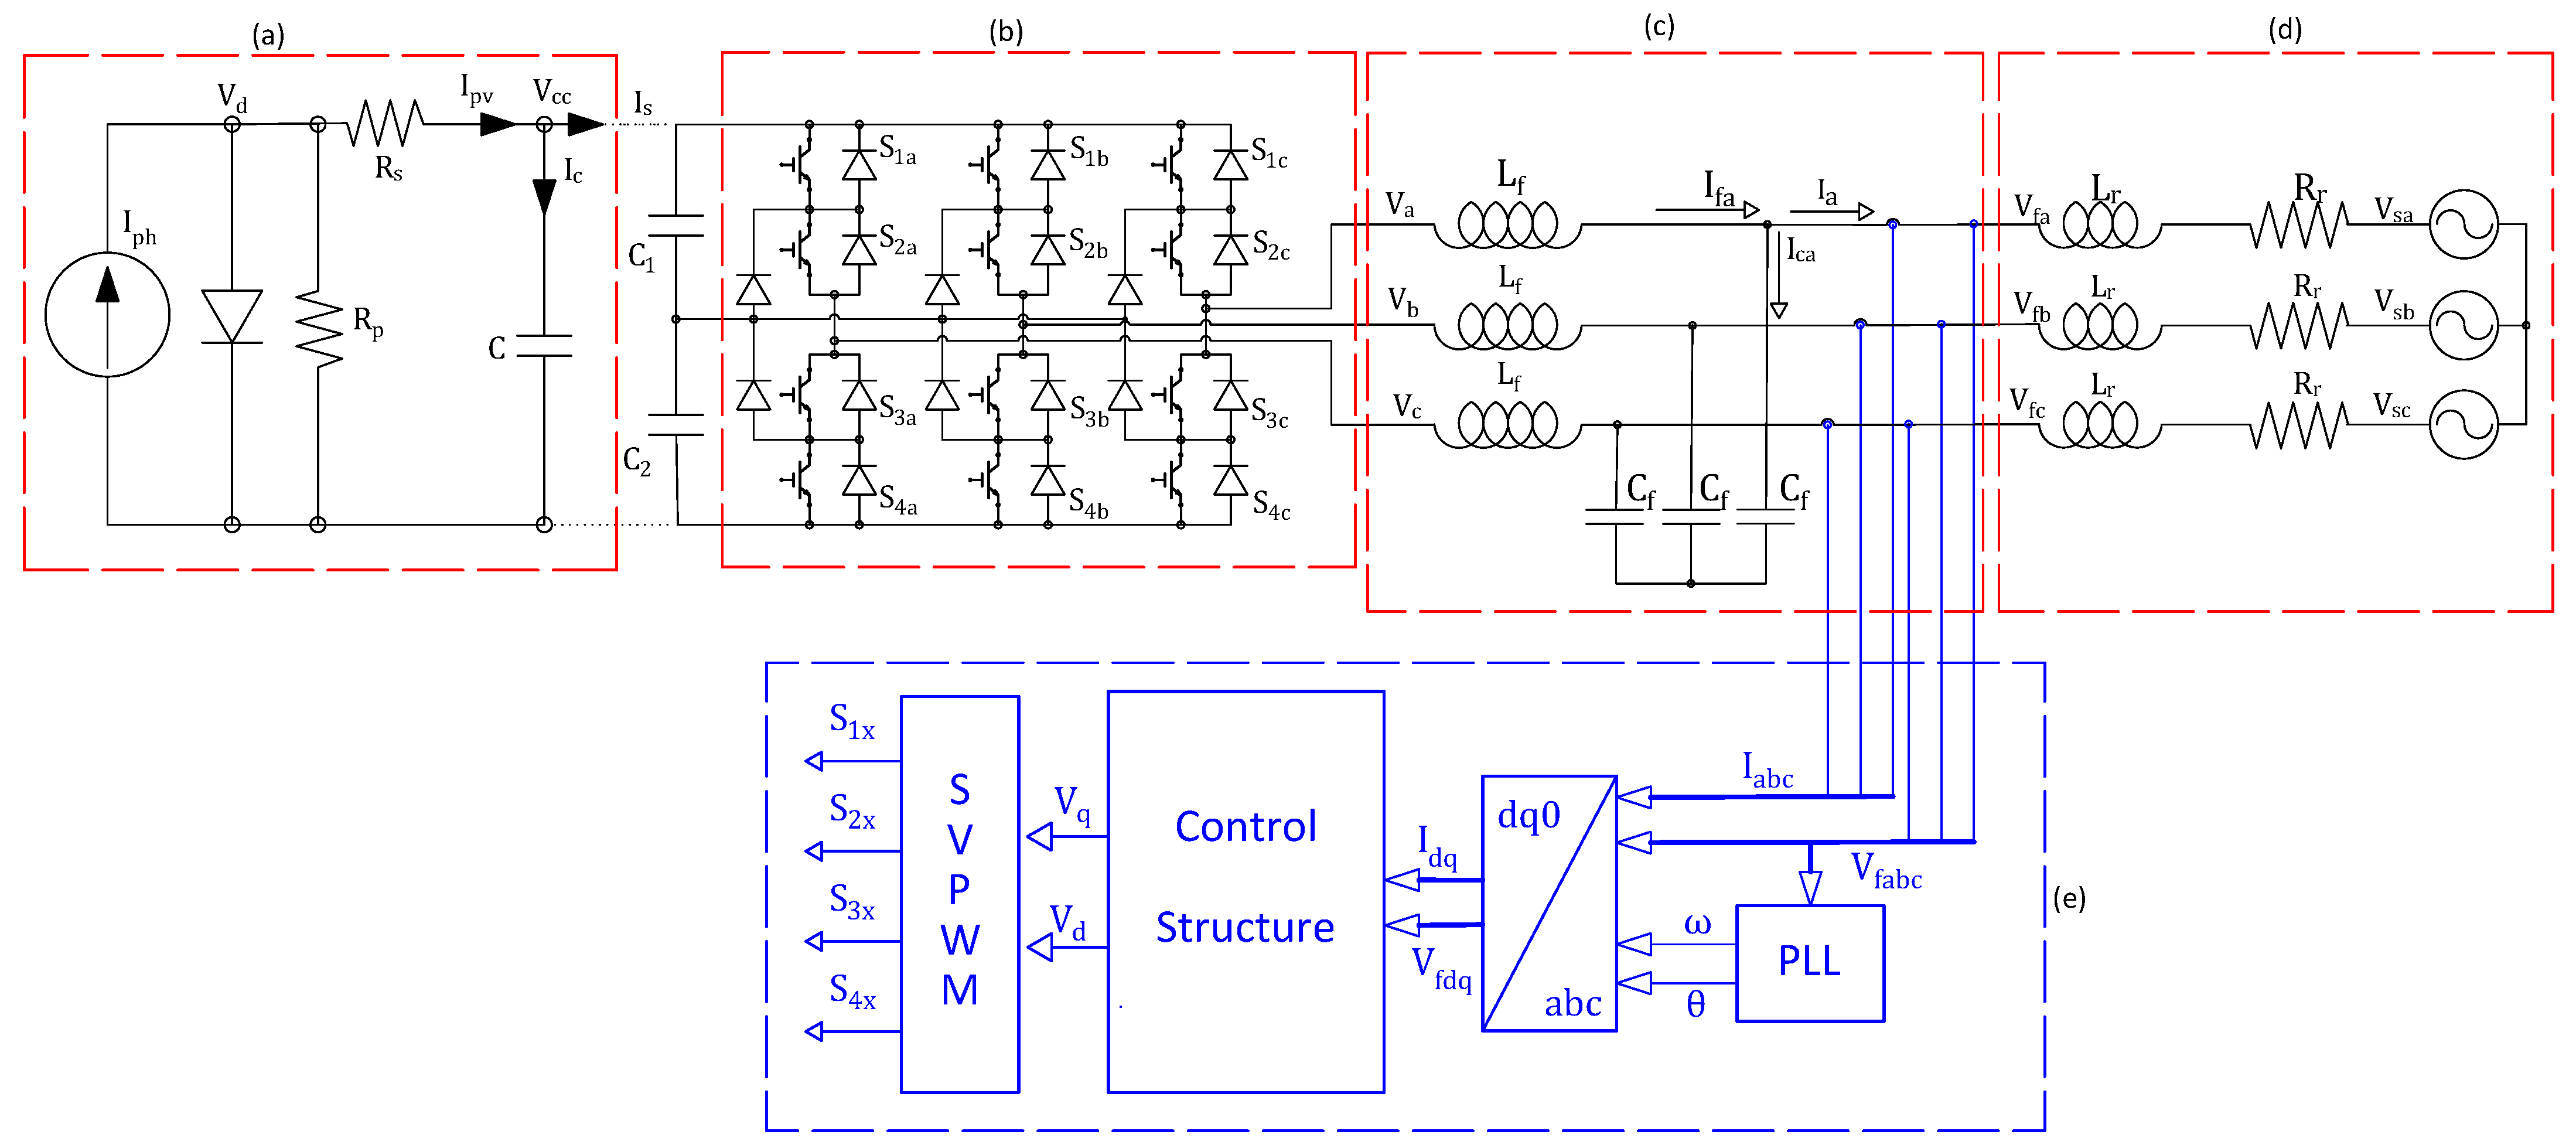
The energy conversion system shown in
Figure 2 consists of a PV array connected to an NPC converter controlled by space vector pulse-width modulation (SVPWM), an output LC filter, and control structures that perform synchronization and regulate the active and reactive power injected into the grid. For the system under analysis,
Table 1 presents the values of the grid-equivalent impedances (
and
) and the filter parameters (
and
).
The PV plant consists of nine strings, each composed of six CIGS modules connected in series, using the Q.Smart UF 95 technology. The plant generates 5130 W under STC (Standard Test Conditions) according to the parameters detailed in
Table 2.
The parameters shown in
Table 1 and
Table 2 are based on information provided by [
7,
13] and adapted to the current system. In particular, the PLL structure implemented in this work corresponds to the synchronous reference-frame (SRF-PLL) model presented in [
13].
2.1. Modeling of the DC Side
Among the performance models for PV modules widely accepted in the scientific community, the most comprehensive one stands out. This model incorporates ohmic losses, defects in the semiconductor structure, and minority carrier recombination. When recombination is neglected, the model becomes less complex and is often employed for evaluation of new Maximum Power Point Tracking (MPPT) algorithms. The output current of this model exhibits a transcendental and nonlinear nature, as expressed by the relation of
, which requires the use of iterative methods for its resolution [
14].
In this analysis, an equivalent circuit is used for the module that represents impurities and defects in the structure, as illustrated in
Figure 2. Applying nodal analysis to the DC link, the variation in the capacitor voltage (
) is given by [
14,
15]:
Considering the voltage drop across the resistance (
), (
1) can be expressed in terms of the rate of change of the diode voltage (
) as follows:
In contrast, the equation defining the diode voltage is given by
where
: Diode voltage;
n: Diode ideality factor;
: Number of cells in series in the PV module;
: Diode thermal voltage;
: Photocurrent of the module;
: Module output current;
: Parallel resistance associated with module losses;
: Series resistance associated with module losses;
: Diode saturation current.
Applying the derivative operator to both sides of (
3) yields
Replacing (
4) in (
2) results in
where
Representing (
2) and (
5) in standard state-space form yields
2.2. Modeling the AC Side
This section presents the modeling of the alternating current (AC) side, which includes the inverter, the LC filter, and the network equivalent, based on the modeling from [
15]. The following equations describe the dynamics of these components, which are fundamental for the development of control strategies. The multidimensional variables in phase coordinates are defined as follows:
Performing analyses on the AC side of the grid shown in
Figure 2, the output current from the inverter, the voltage on the capacitor, and the current injected into the grid can be represented, respectively, as follows:
Representing (
10), (
11), and (
12) in the state-space form yields
where
and
are identity and null matrices of order 3, respectively, and
is the zero vector.
Representing the PCC voltage as a function of the state vector shown in (
13) yields
Considering the structure presented in
Figure 2, the equations relating the AC- and DC-side variables are expressed as follows:
where matrices
and
are defined as follows:
where
,
, and
are the logical states associated with the switches of the positive group in the A-, B-, and C-phase arms, respectively.
Replacing (
15) and (
16) in (
13) and (
8), respectively, yields
From (
19) and (
20), the system in state space is obtained as follows:
From (
14) and (
21), the voltages at the PCC can be computed as follows:
2.3. Three-Level Inverter Modulation
The three-level inverter operates through specific combinations of its switches, thereby controlling the output voltage in different states.
Table 3 presents the possible operating states of a three-level inverter, as described by the control signals of the switches (
,
,
, and
) for each phase of the system, represented by
. These states are classified as
P (positive),
O (zero), and
N (negative), indicating the voltage level that will be applied to the load. The table also shows the switching combinations corresponding to each state and the respective phase voltages generated by the NPC converter. Each switching state results in a distinct voltage level, allowing the inverter to modulate the output voltage efficiently, meeting the load requirements in a controlled and precise manner [
16].
The modulation of the three-level inverter can be described in terms of the time average of the switching functions (
) over a sampling period (
). As illustrated in
Figure 3, the control signal (
) represents the behavior of an arbitrary leg of the inverter.
The relationship between conduction times and duty cycles (
) is given by
where
and
are vectors containing the conduction times of the positive and negative states, respectively, for phases
over
[
17].
Expressing (
15) in terms of the average voltage values over
, the following relation for the average phase voltages is obtained:
or, in simplified form,
where
is the average total DC bus voltage.
Knowing that the inverter’s average output voltage must match the reference voltage provided by the controller (
), substituting this equality and (
23) into (
26) yields
Substituting (
A13) into (
26) yields
Now, defining
it is possible to write
Solving the system defined by (
28) and (
30) yields
Considering that, despite the states of the vectors (
), the value of
may not be zero, for simplification purposes, the average value (
) is defined as zero. Thus, the following simplified expressions are obtained:
2.4. Plant Transfer Function Modeling
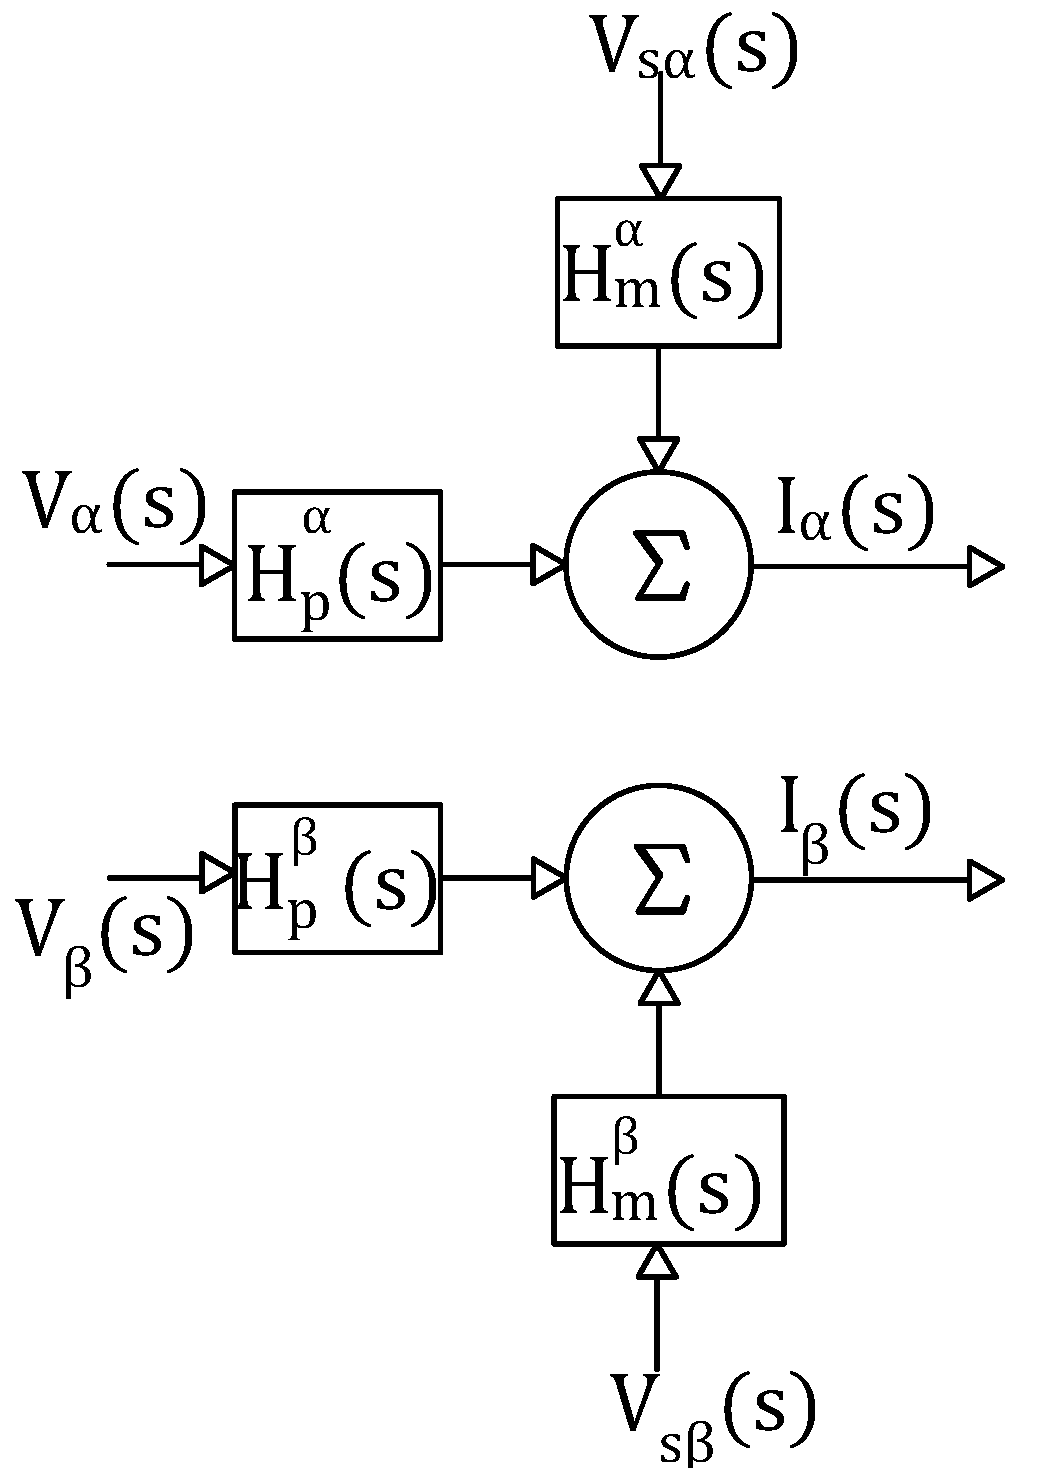
An inspection of the diagram shows that, after processing the nodal voltages observed at the PCC, the use of the
coordinate system allows the currents injected into the grid to be expressed as follows [
13]:
where
and
are the voltages of the inverter and the internal grid, respectively, and
are the transfer function matrices whose block-diagram representation is shown in
Figure 4.
In [
13] a methodology to convert
coordinates into
dq coordinates in the frequency domain is presented, which is of utmost importance for obtaining the plant in
dq coordinates and, consequently, for controller development. Let a transfer matrix in
coordinates be defined as follows:
where
and
are the zeros and poles of the transfer function matrix. The transformation of (
36) into the
coordinate system can be expressed as follows:
where
is the synchronous frequency, while
Therefore, it is possible to write
in which,
where
The procedure to obtain (
40) and (
41) is presented in
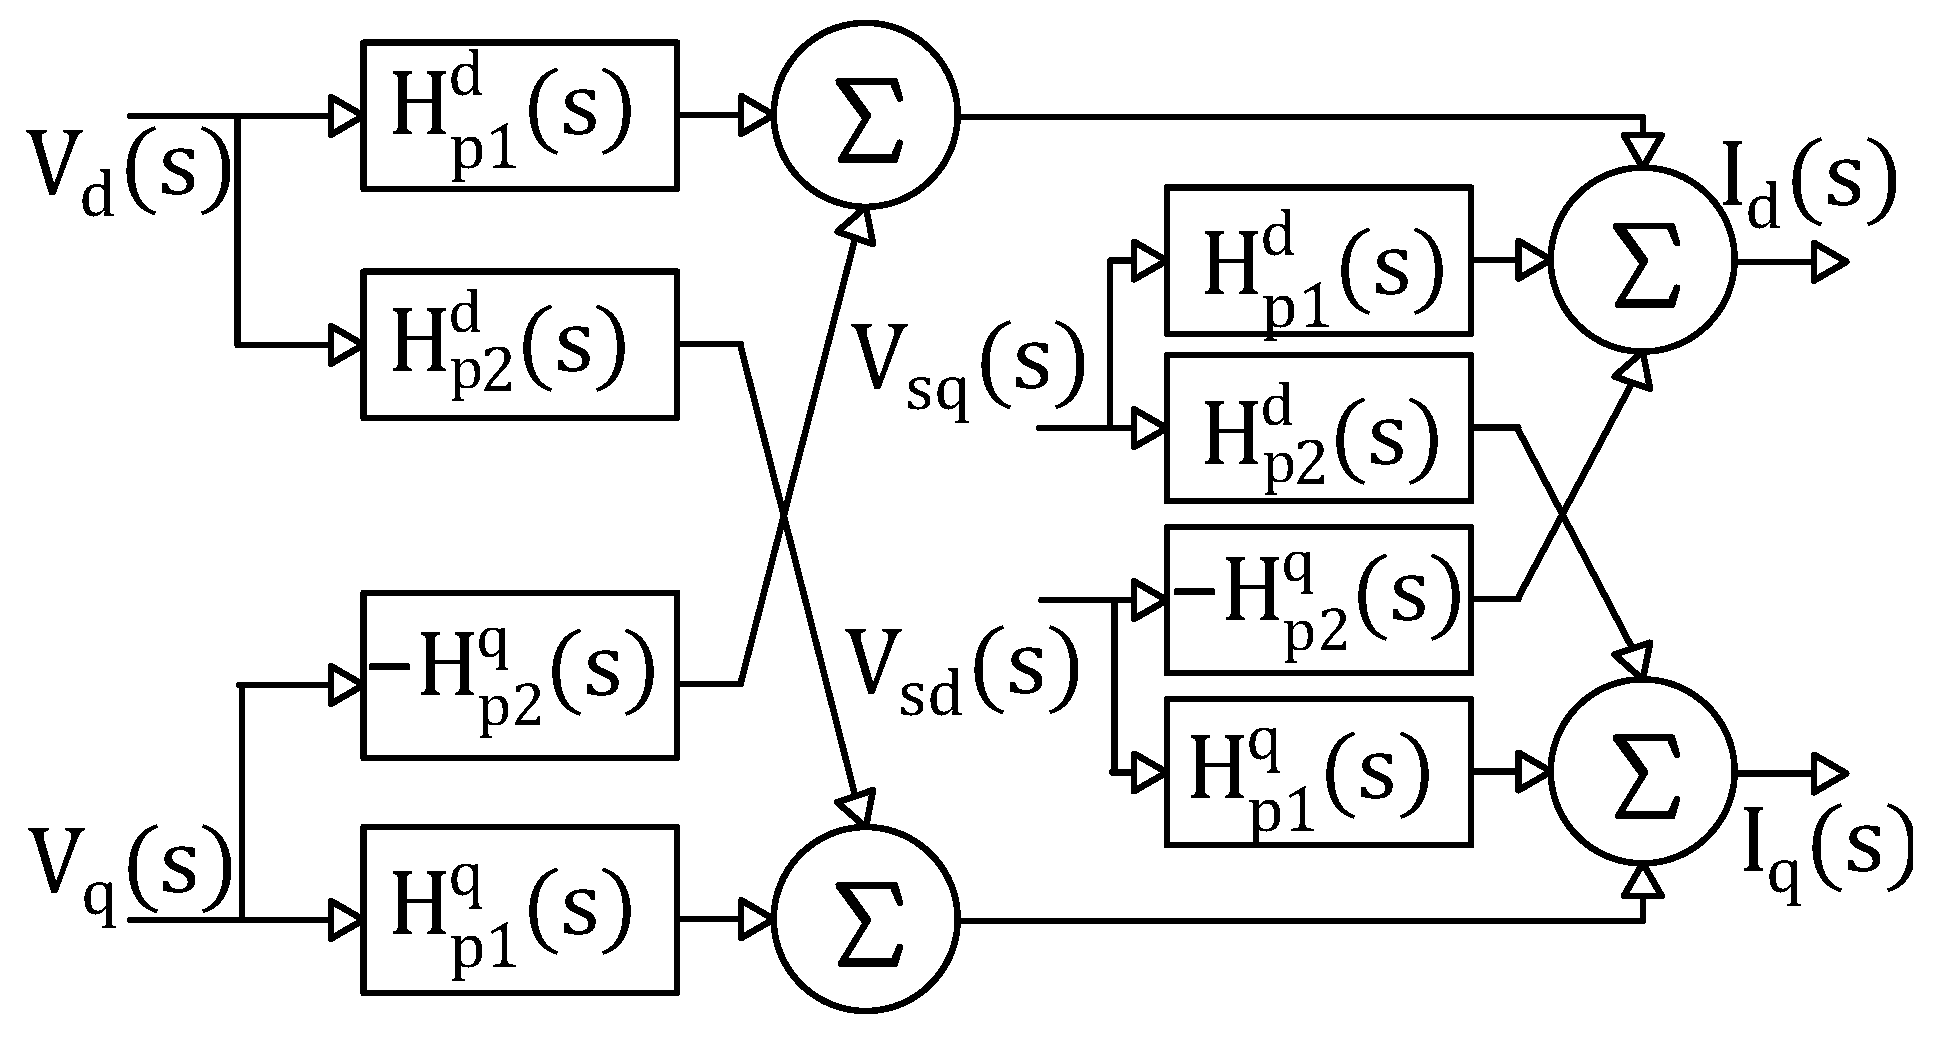
Appendix A. Similarly to the current loop representation in
coordinates, (
38) defines the current loop of the VSI in synchronous
dq coordinates, whose block diagram representation is shown in
Figure 5.
3. Control Structures for VSI
The implementation of control strategies for a generation system with VSI can be performed in different reference frames, including the rotating synchronous reference frame (dq), the stationary reference frame (), and the phase reference frame (abc). This section presents an overview and comparative analysis of these control structures, highlighting their respective characteristics.
3.1. PI Controller
In the control structure, the control variables are represented in a reference frame synchronized with the grid voltage frequency, transforming current and voltage signals into unidirectional signals.
A specific characteristic of grid-following VSI is the need for synchronization with the phase angle of the grid voltage. Proportional-integral (PI) strategies are typically associated with the
control structures [
3,
18]. The transfer function of a single-variable PI controller can be expressed as follows:
where
and
are the proportional and integral gains, respectively. In order to maintain symmetry based on (
37), the multivariable PI controller can be defined as follows:
where
represents the proportional gain matrix and
defines the integral gain matrix, while
and
correspond to the gains that compose the control matrices and
a is zero on the main diagonal.
Using the relations presented in (
36) and (
37), the equivalent PI controller in
is obtained as follows:
PI Tuning
As observed in (
40), the plant assumes a complexity that makes PI controller tuning difficult, considering that the system is Multiple Input, Multiple Output (MIMO) system with coupling between coordinates. In order to facilitate tuning, (
40) is represented in terms of poles as follows:
where
To avoid designing an individual PI controller for each loop, a zero of the controller is defined to the left of the pole (
) on the main diagonal, maintaining the system’s nature, as shown in (
47).
In this work, the gain matrix (
K) is computed to enable decoupling of the control loops, which is possible by compensating for off-diagonal terms. Mathematically, this is expressed as follows:
Since
, considering
yields the following:
which results in
The relationship between the gains defined in (
50) ensures the decoupling of the control loops, resulting in the need to determine only one variable. Considering a maximum overshoot of
and a settling time of less than 0.1 s, the continuous PI controller can be expressed as follows:
From the solution of (
51), the gain matrix of the multivariable PI controller assumes the following numerical form:
Using the zero-order hold (ZOH) method, the discrete PI controller takes the following form:
The complete control-loop diagram is presented in
Figure 6.
3.2. PR Controller
The PR controller has gained significant popularity in the last decade due to its ability to eliminate steady-state error in the
or abc control structures. Additionally, its ability to act as a compensator for low-order harmonics makes it versatile in applications of VSI control connected to the grid [
7,
19,
20,
21].
The transfer function of the single-input resonant controller can be defined as follows:
where
and
are the proportional and resonant gains, respectively. The multivariable case is a direct extension, as follows:
or just by phase, as shown in (
56).
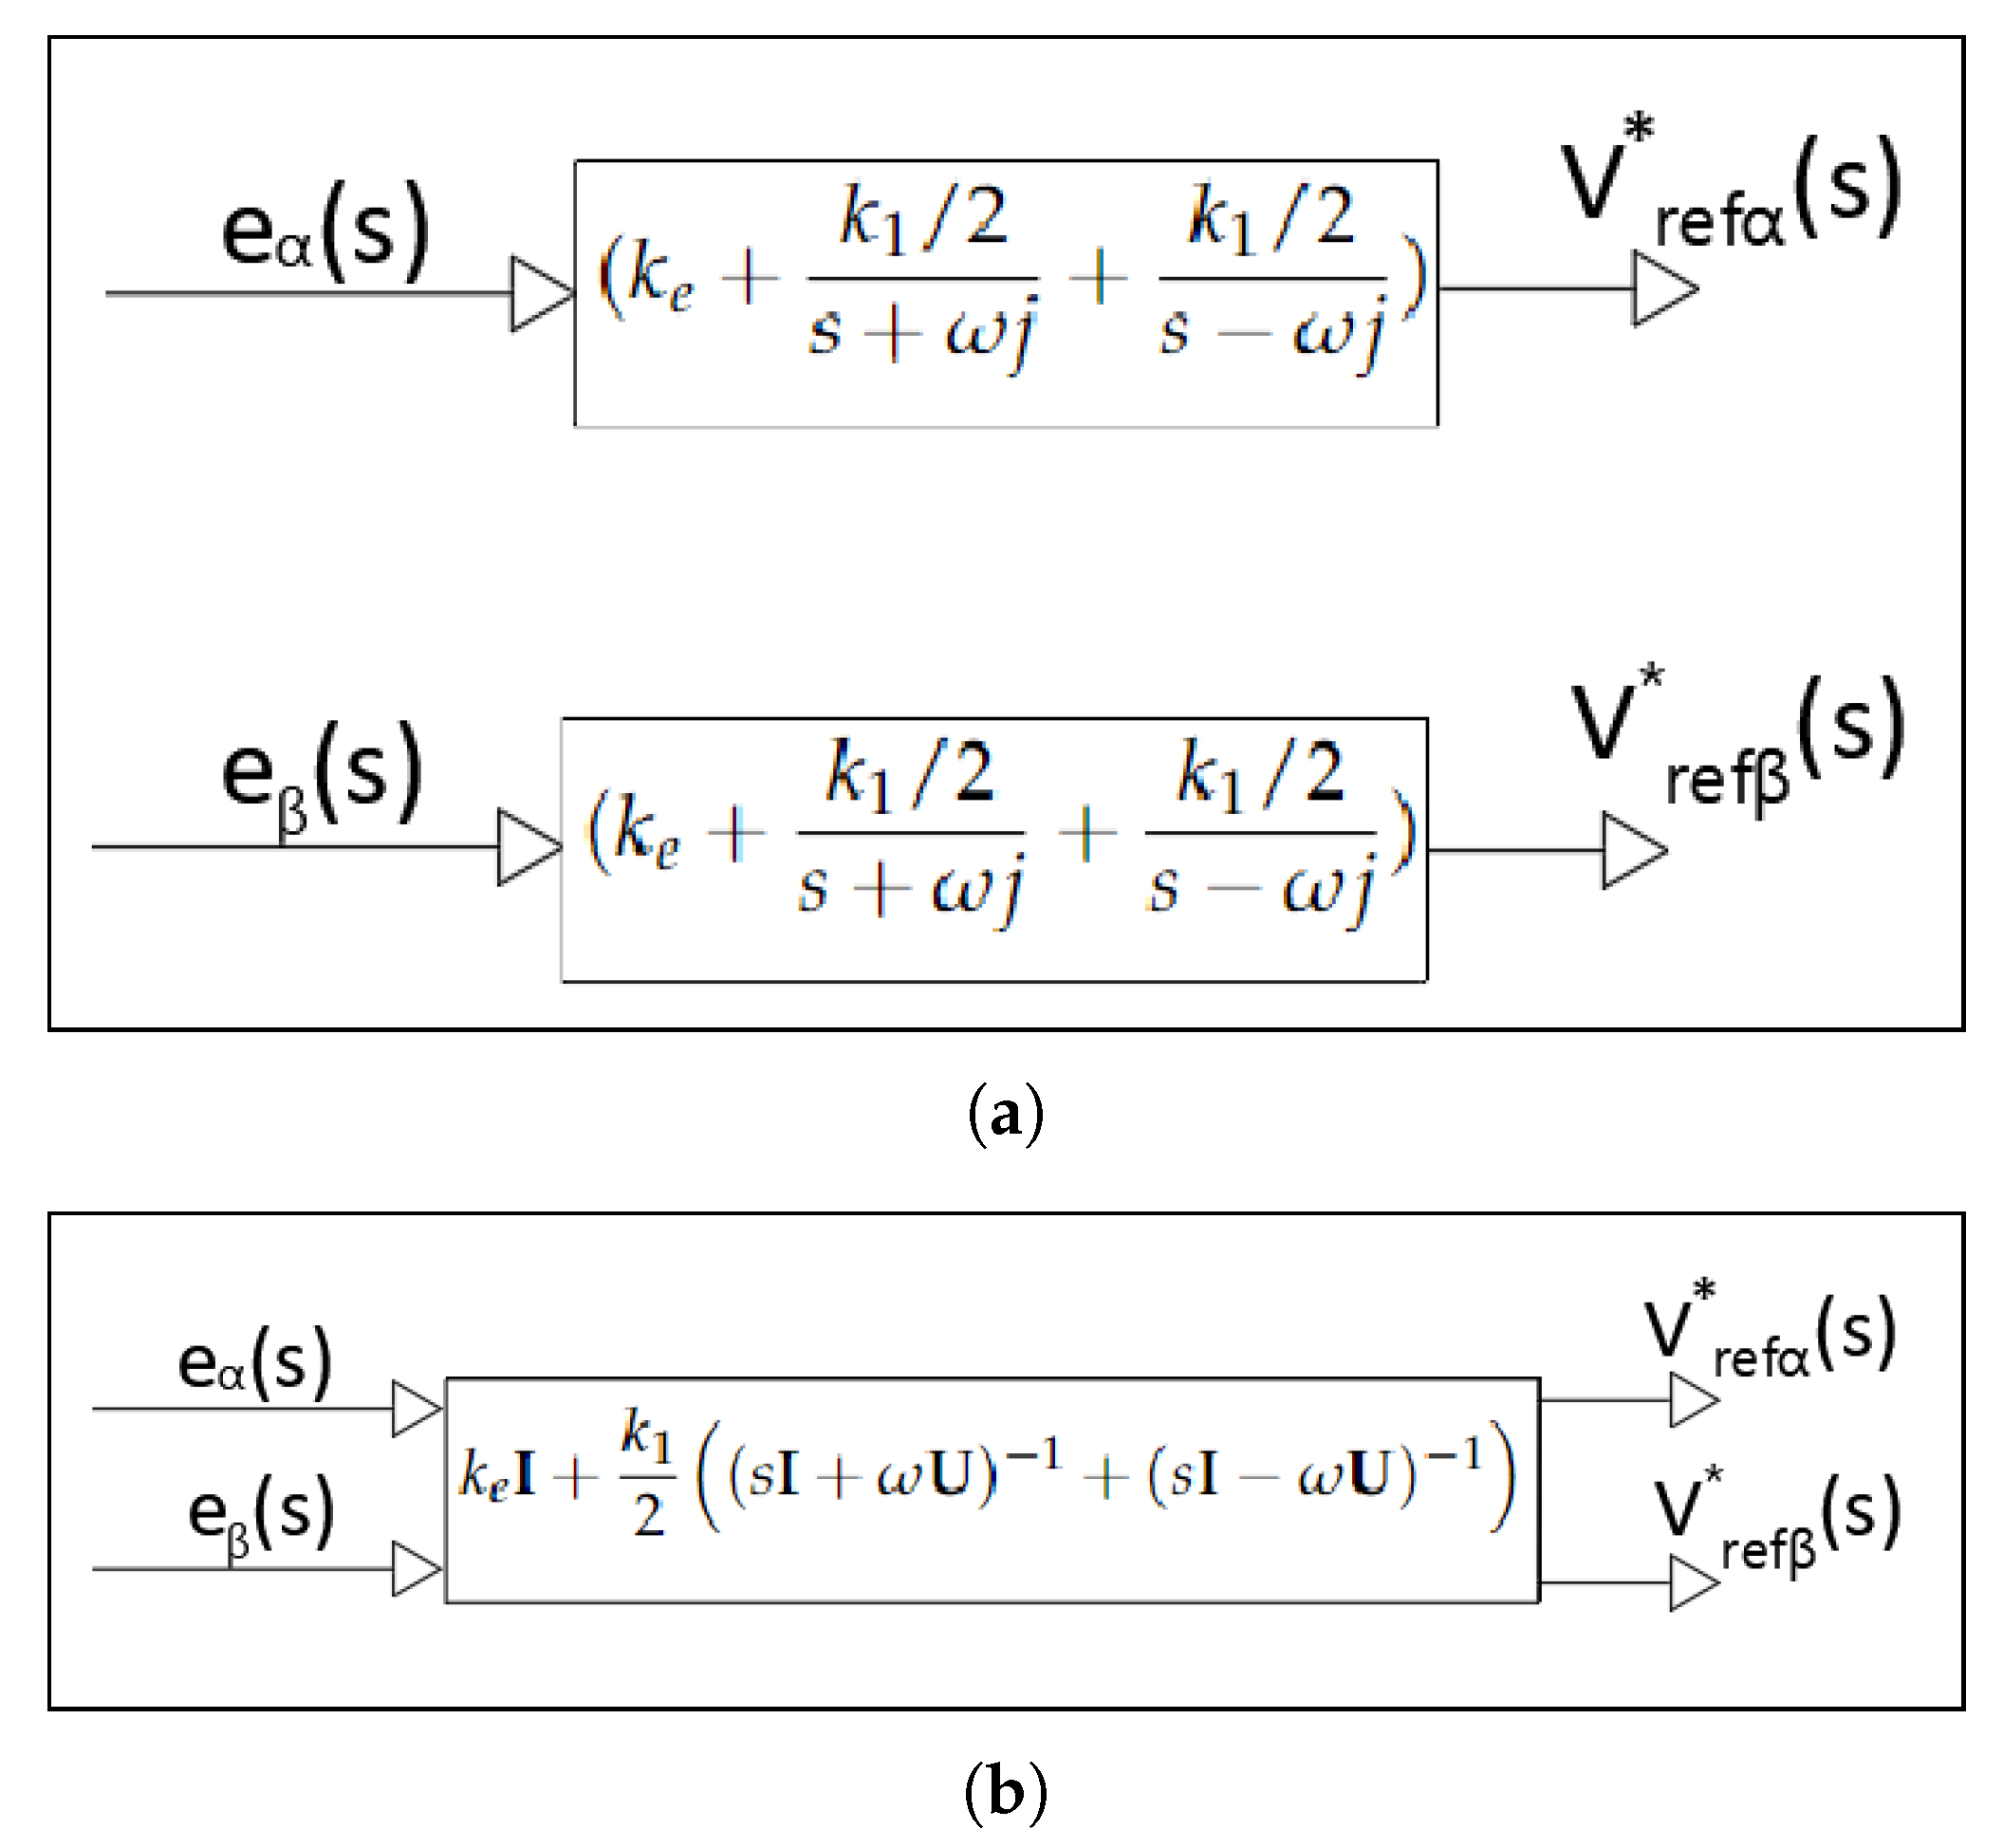
Appendix B presents, a detailed mathematical development related to the PR controller equation, focusing on its properties in
coordinates. This analysis allows for a deeper understanding of the controller’s behavior and facilitates the application of appropriate tuning strategies.
PR Tuning
Using (
37), the equivalent of (
56) in
coordinates in complex form is expressed as follows:
Since
preserves the controller’s zero characteristic in the real part, similar to the multivariable PI controller, it is necessary to ensure that
. By choosing
, we then have
. Under these conditions,
To define
, the
root-locus method was used with the modulus condition, considering a
overshoot and a settling time of less than 0.1 s, as follows:
resulting in
.
In order to achieve better disturbance rejection, the gain (
) was adjusted, resulting in the following controller:
With the designed analog PR controller, discretization is straightforward. Applying the zero-order hold method to (
60) yields the following:
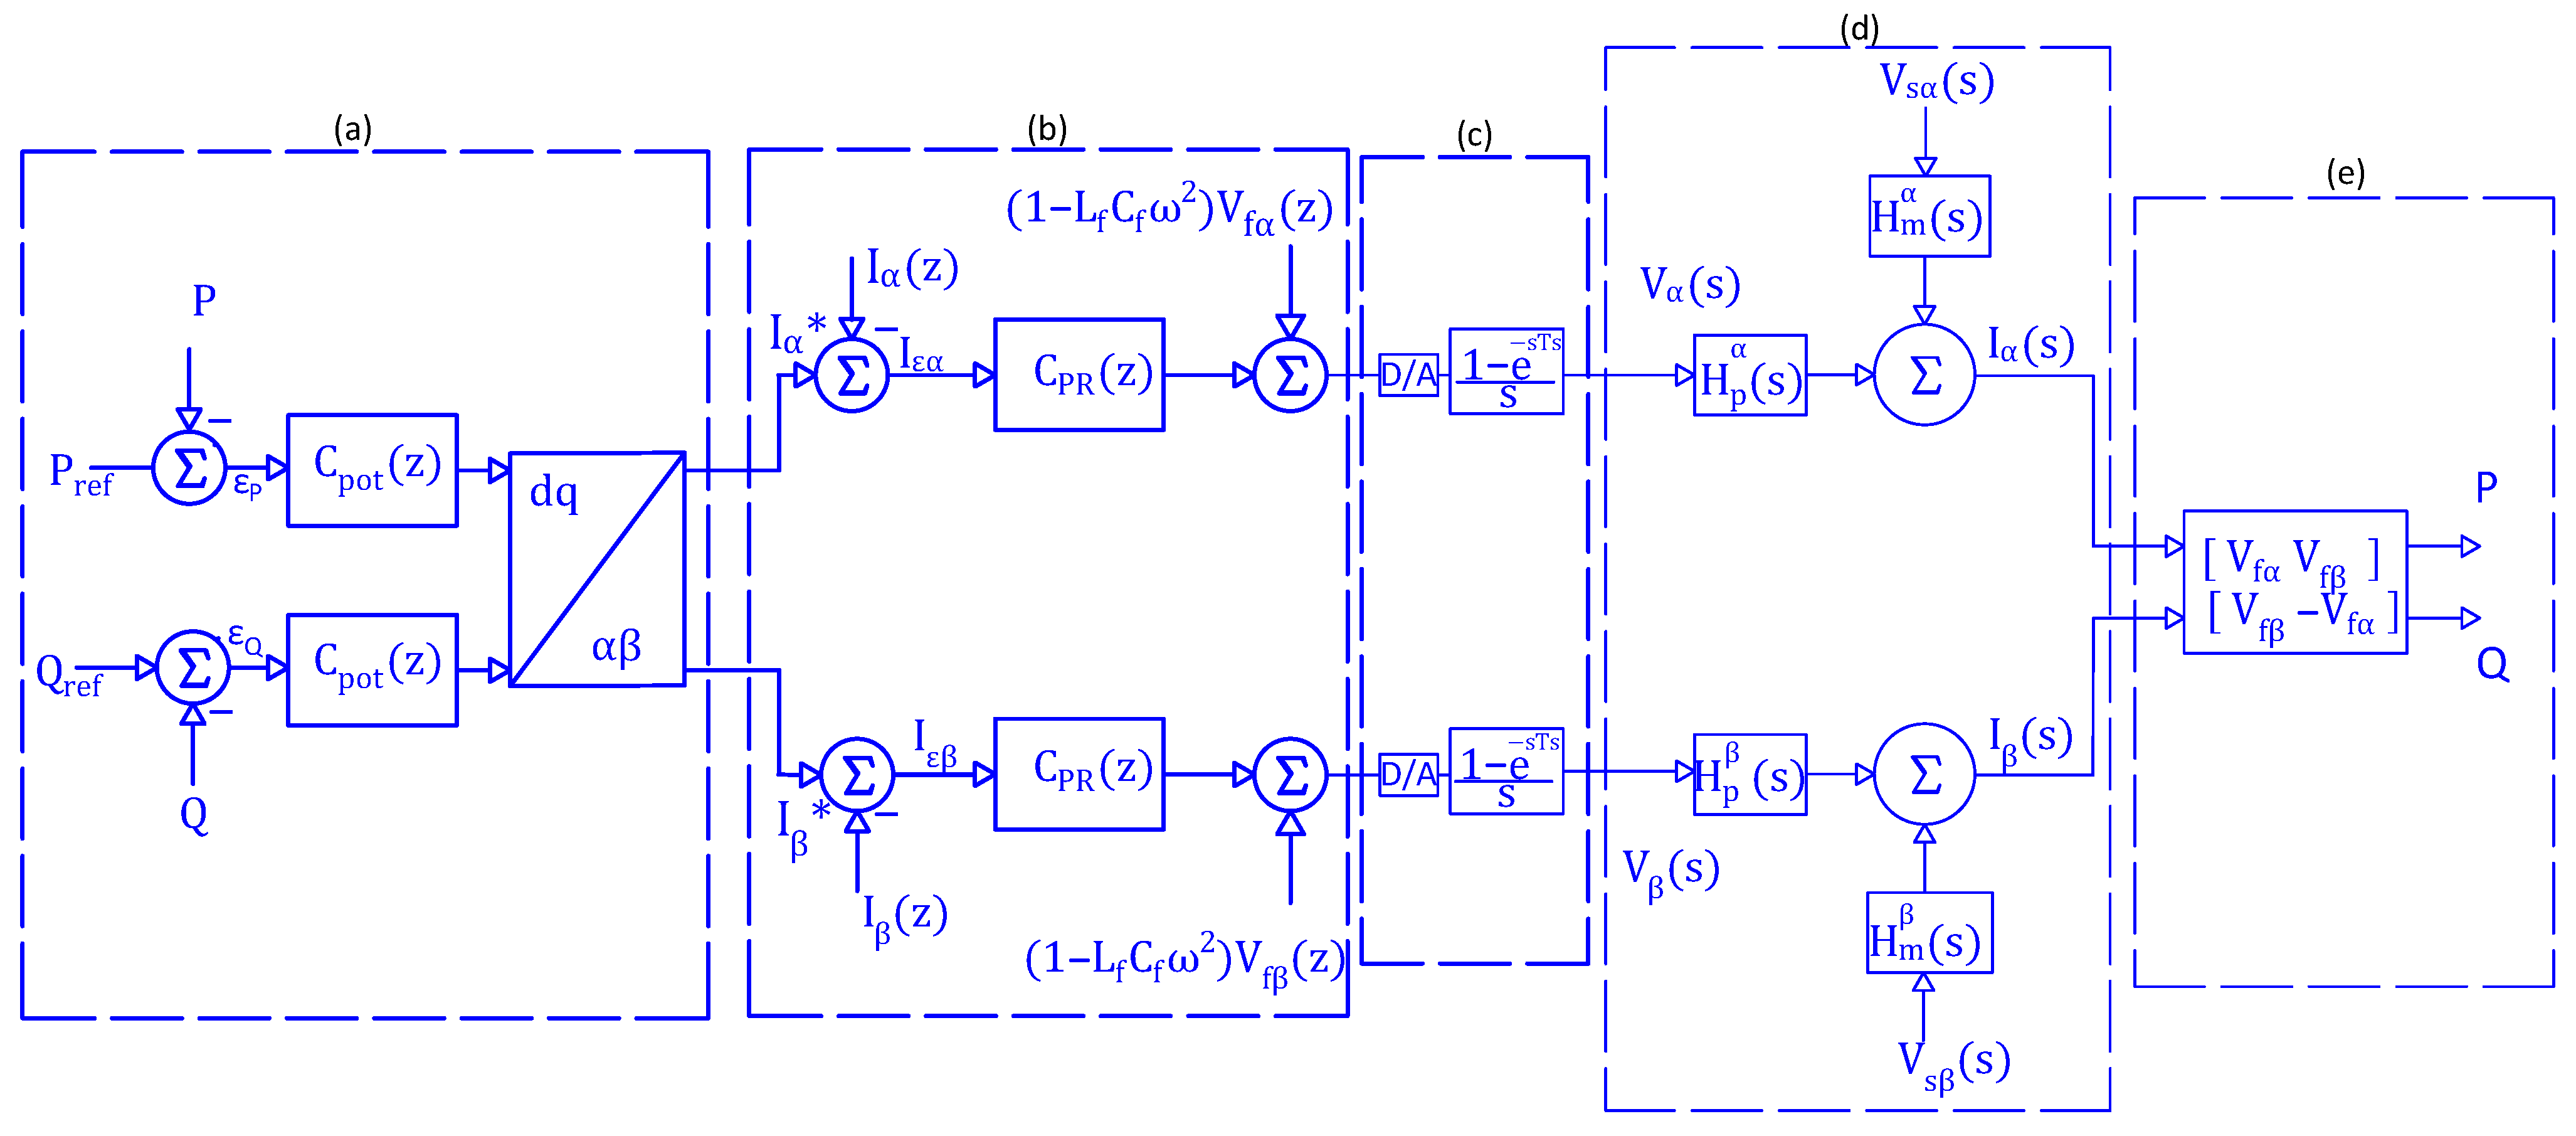
where
The complete control-loop diagram with the PR controller is shown in
Figure 7.
3.3. Deadbeat Controller
In control theory, designing a DB controller involves finding a control signal that drives the output to the desired value in the minimum number of sampling intervals, ensuring rapid convergence to the reference [
22,
23]. This technique uses the inverse of the plant model to eliminate undesired dynamics and replace them with desired characteristics specified by the designer.
According to Galvez [
24], the DB controller is defined by the synthesis equation:
where
represents the delay and
p is the number of steps required for the system output to reach the reference.
For a MIMO system represented in
coordinates, the synthesis equation becomes [
13]
where
is the plant transfer matrix, with
and
Replacing (
65) in (
64) and considering
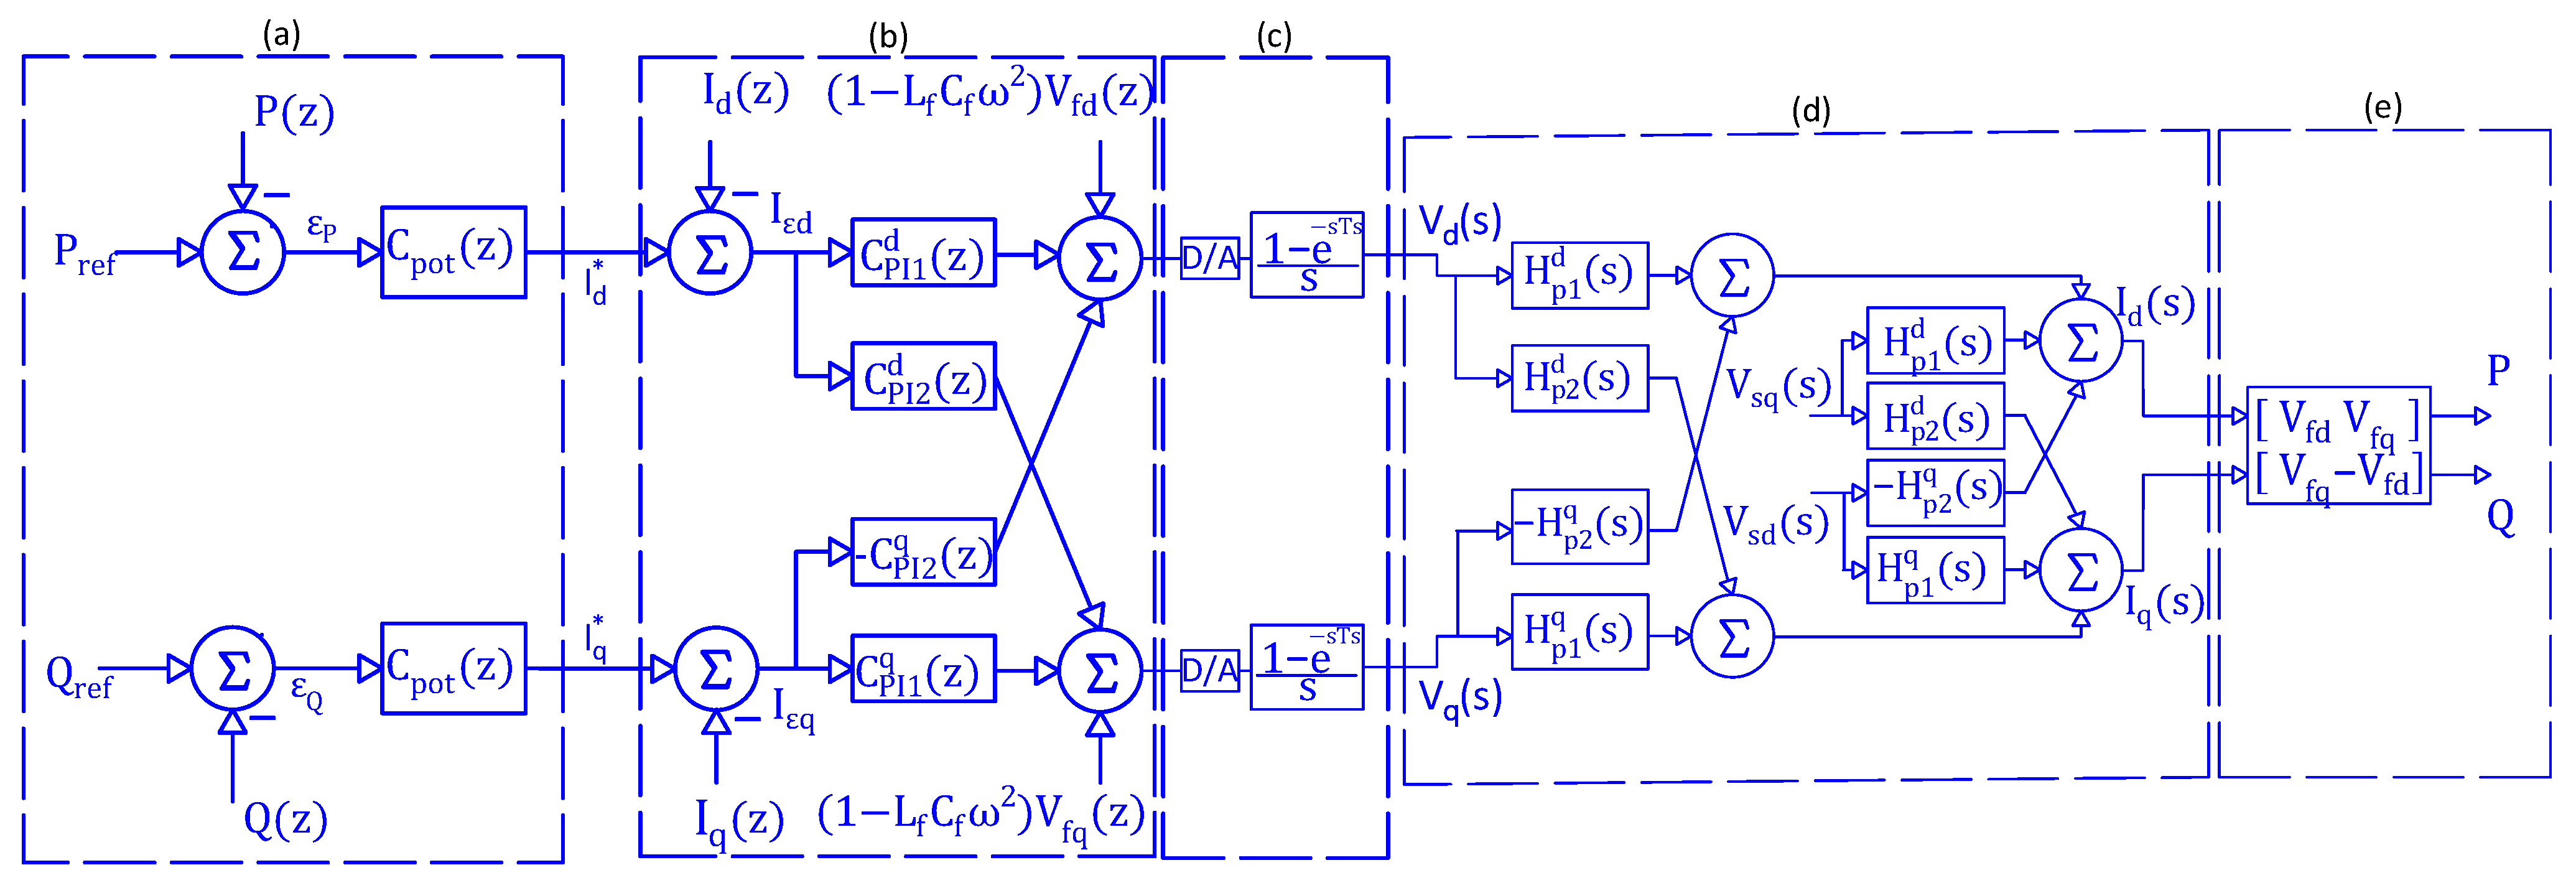
, the DB controller takes the following form:
The complete closed-loop control diagram using the DB controller is shown in
Figure 8.
4. Performance Assessment
The evaluation of the control structures, multivariable PI, PR, and multivariable DB is carried out in three distinct scenarios—steady-state operation, transients, and during variations in the grid parameters—in order to analyze the stability and robustness of the controllers. During these variations, the controllers’ responses to changes in grid conditions are examined to assess their ability to maintain the desired performance under different circumstances.
4.1. Steady-State Analysis
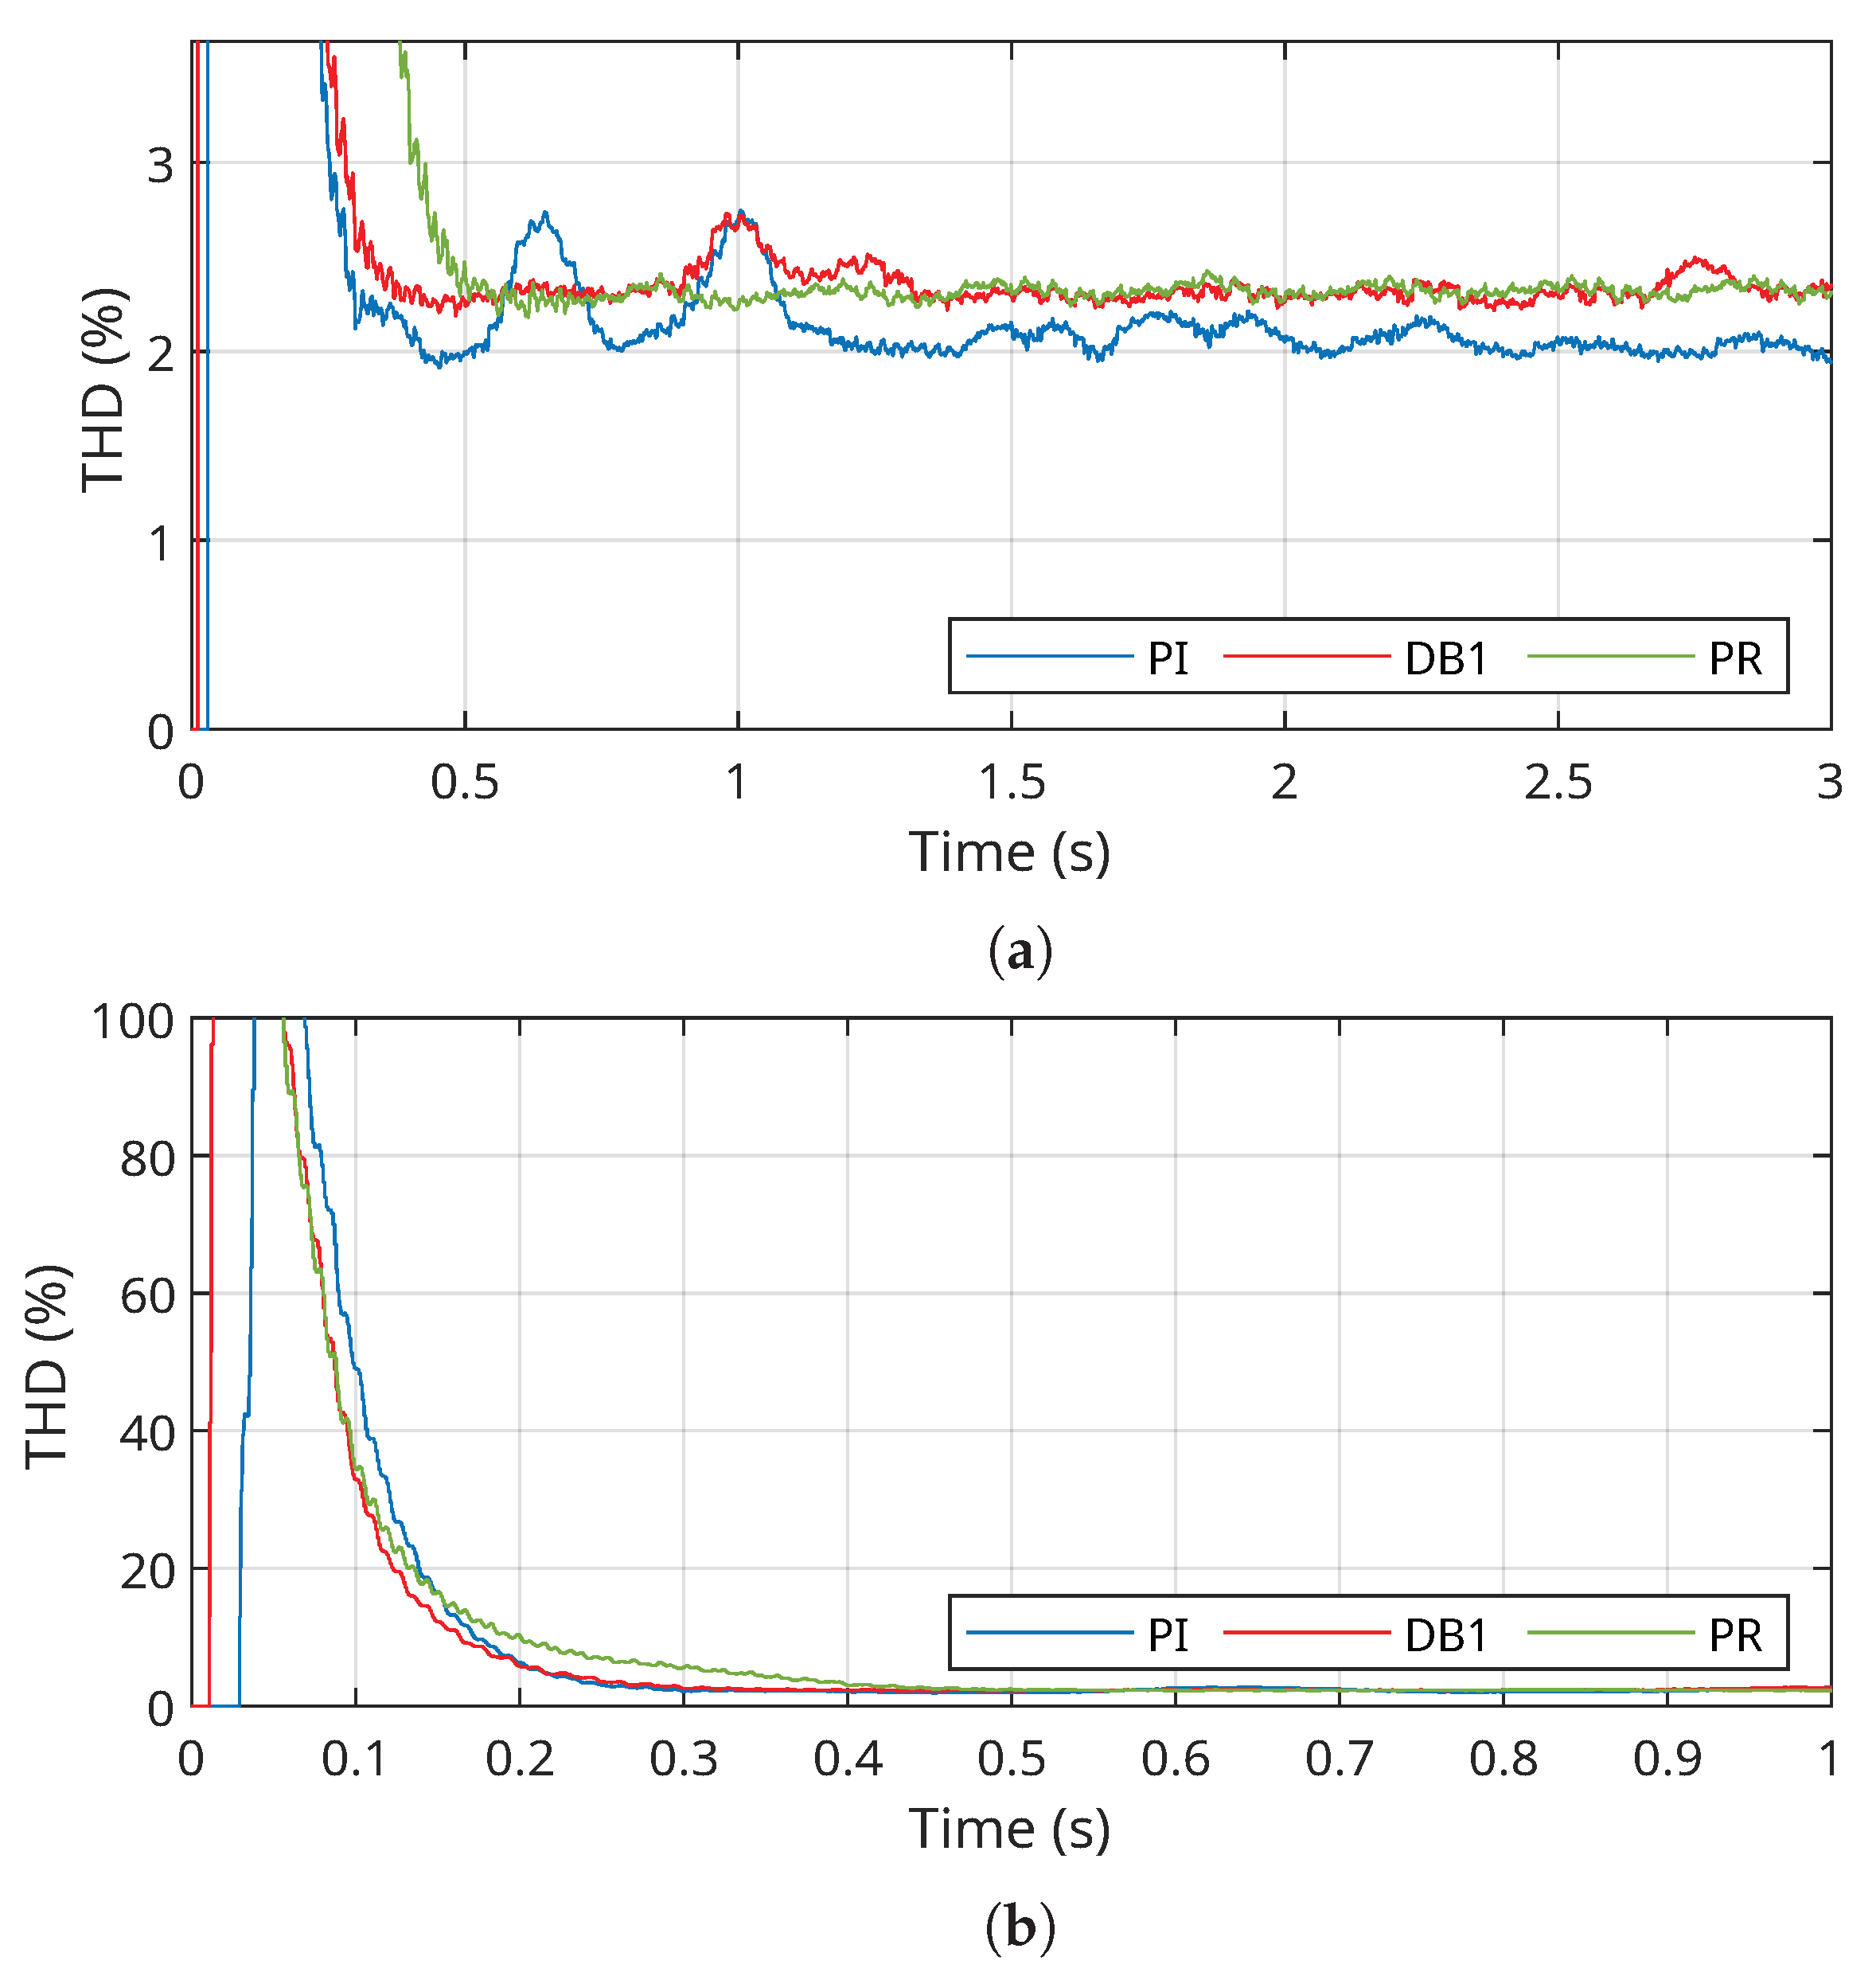
In this operating scenario, the controllers were evaluated under stable and constant operating conditions. The objective is to verify the controllers’ ability to maintain optimal and consistent performance over time, with the total harmonic distortion (THD) of the current injected into the grid being a key performance indicator. For better visualization,
Figure 9a,b present the total harmonic distortion (THD) of the current signals, calculated using the Discrete Fourier Transform (DFT) over a 12-cycle window of the fundamental component (B = 200 ms), as specified in [
25].
Figure 9a highlights the system’s behavior during the transient period, while
Figure 9b shows the results under steady-state conditions. For further details on the harmonic analysis methodology and THD calculation, refer to
Appendix D.
A detailed evaluation of the control strategies demonstrated that, in addition to stability and performance under steady-state conditions, the multivariable PI structure exhibited a more robust response to load variations and adverse grid conditions, confirming its technical superiority and potential applicability in environments with high demands for power quality and reliability.
Although the THD values shown in
Figure 9a,b appear numerically similar across the three control strategies, a more detailed analysis reveals important distinctions. During the transient period, the multivariable PI and DB controllers outperformed the PR controller by achieving lower harmonic distortion. In steady-state conditions, however, the PI controller demonstrated superior performance over both the PR and DB controllers, which yielded nearly identical results. This enhanced performance of the PI controller is attributed to the presence of secondary diagonal terms in (
53), which enable cross-axis compensation, allowing the controller to attenuate harmonic effects appearing in one coordinate axis by acting through the other. Consequently, the PI controller achieves superior harmonic rejection without relying on explicit harmonic compensators. Overall, although all three control strategies maintained THD values close to
, the PI structure provided the most effective harmonic suppression in both the dynamic and steady-state conditions. This highlights its robustness and adaptability, leading to improved current quality and ensuring compliance with international power quality standards in grid-connected PV systems.
To further investigate the harmonic content of the injected current under steady-state conditions,
Table 4 presents the values of each harmonic component from the 1st (fundamental) up to the 13th harmonic. This finer resolution allows for a direct comparison of the controllers’ ability to suppress individual harmonics.
Overall, although all three control strategies maintained THD values close to , the PI structure provided the most effective harmonic suppression in both the dynamic and steady-state conditions.
4.2. Transient Condition Analysis
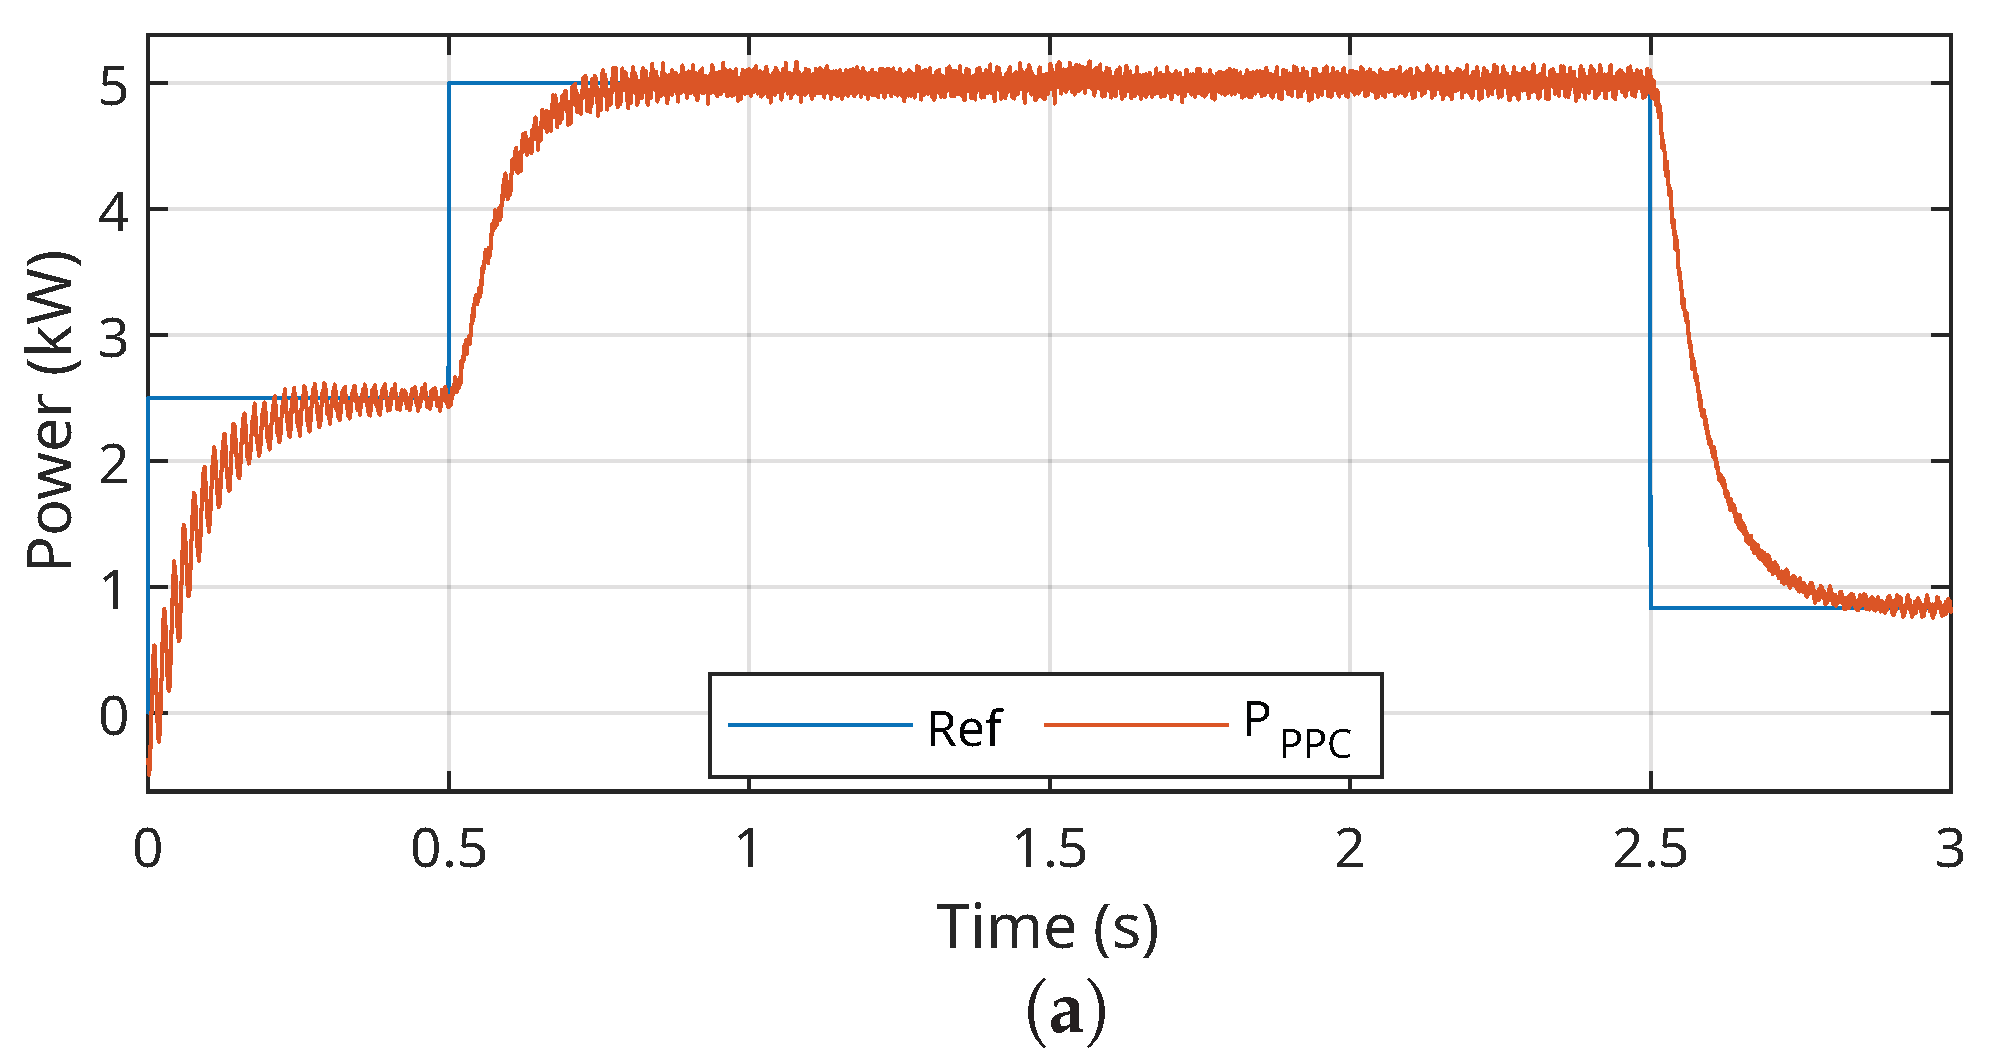
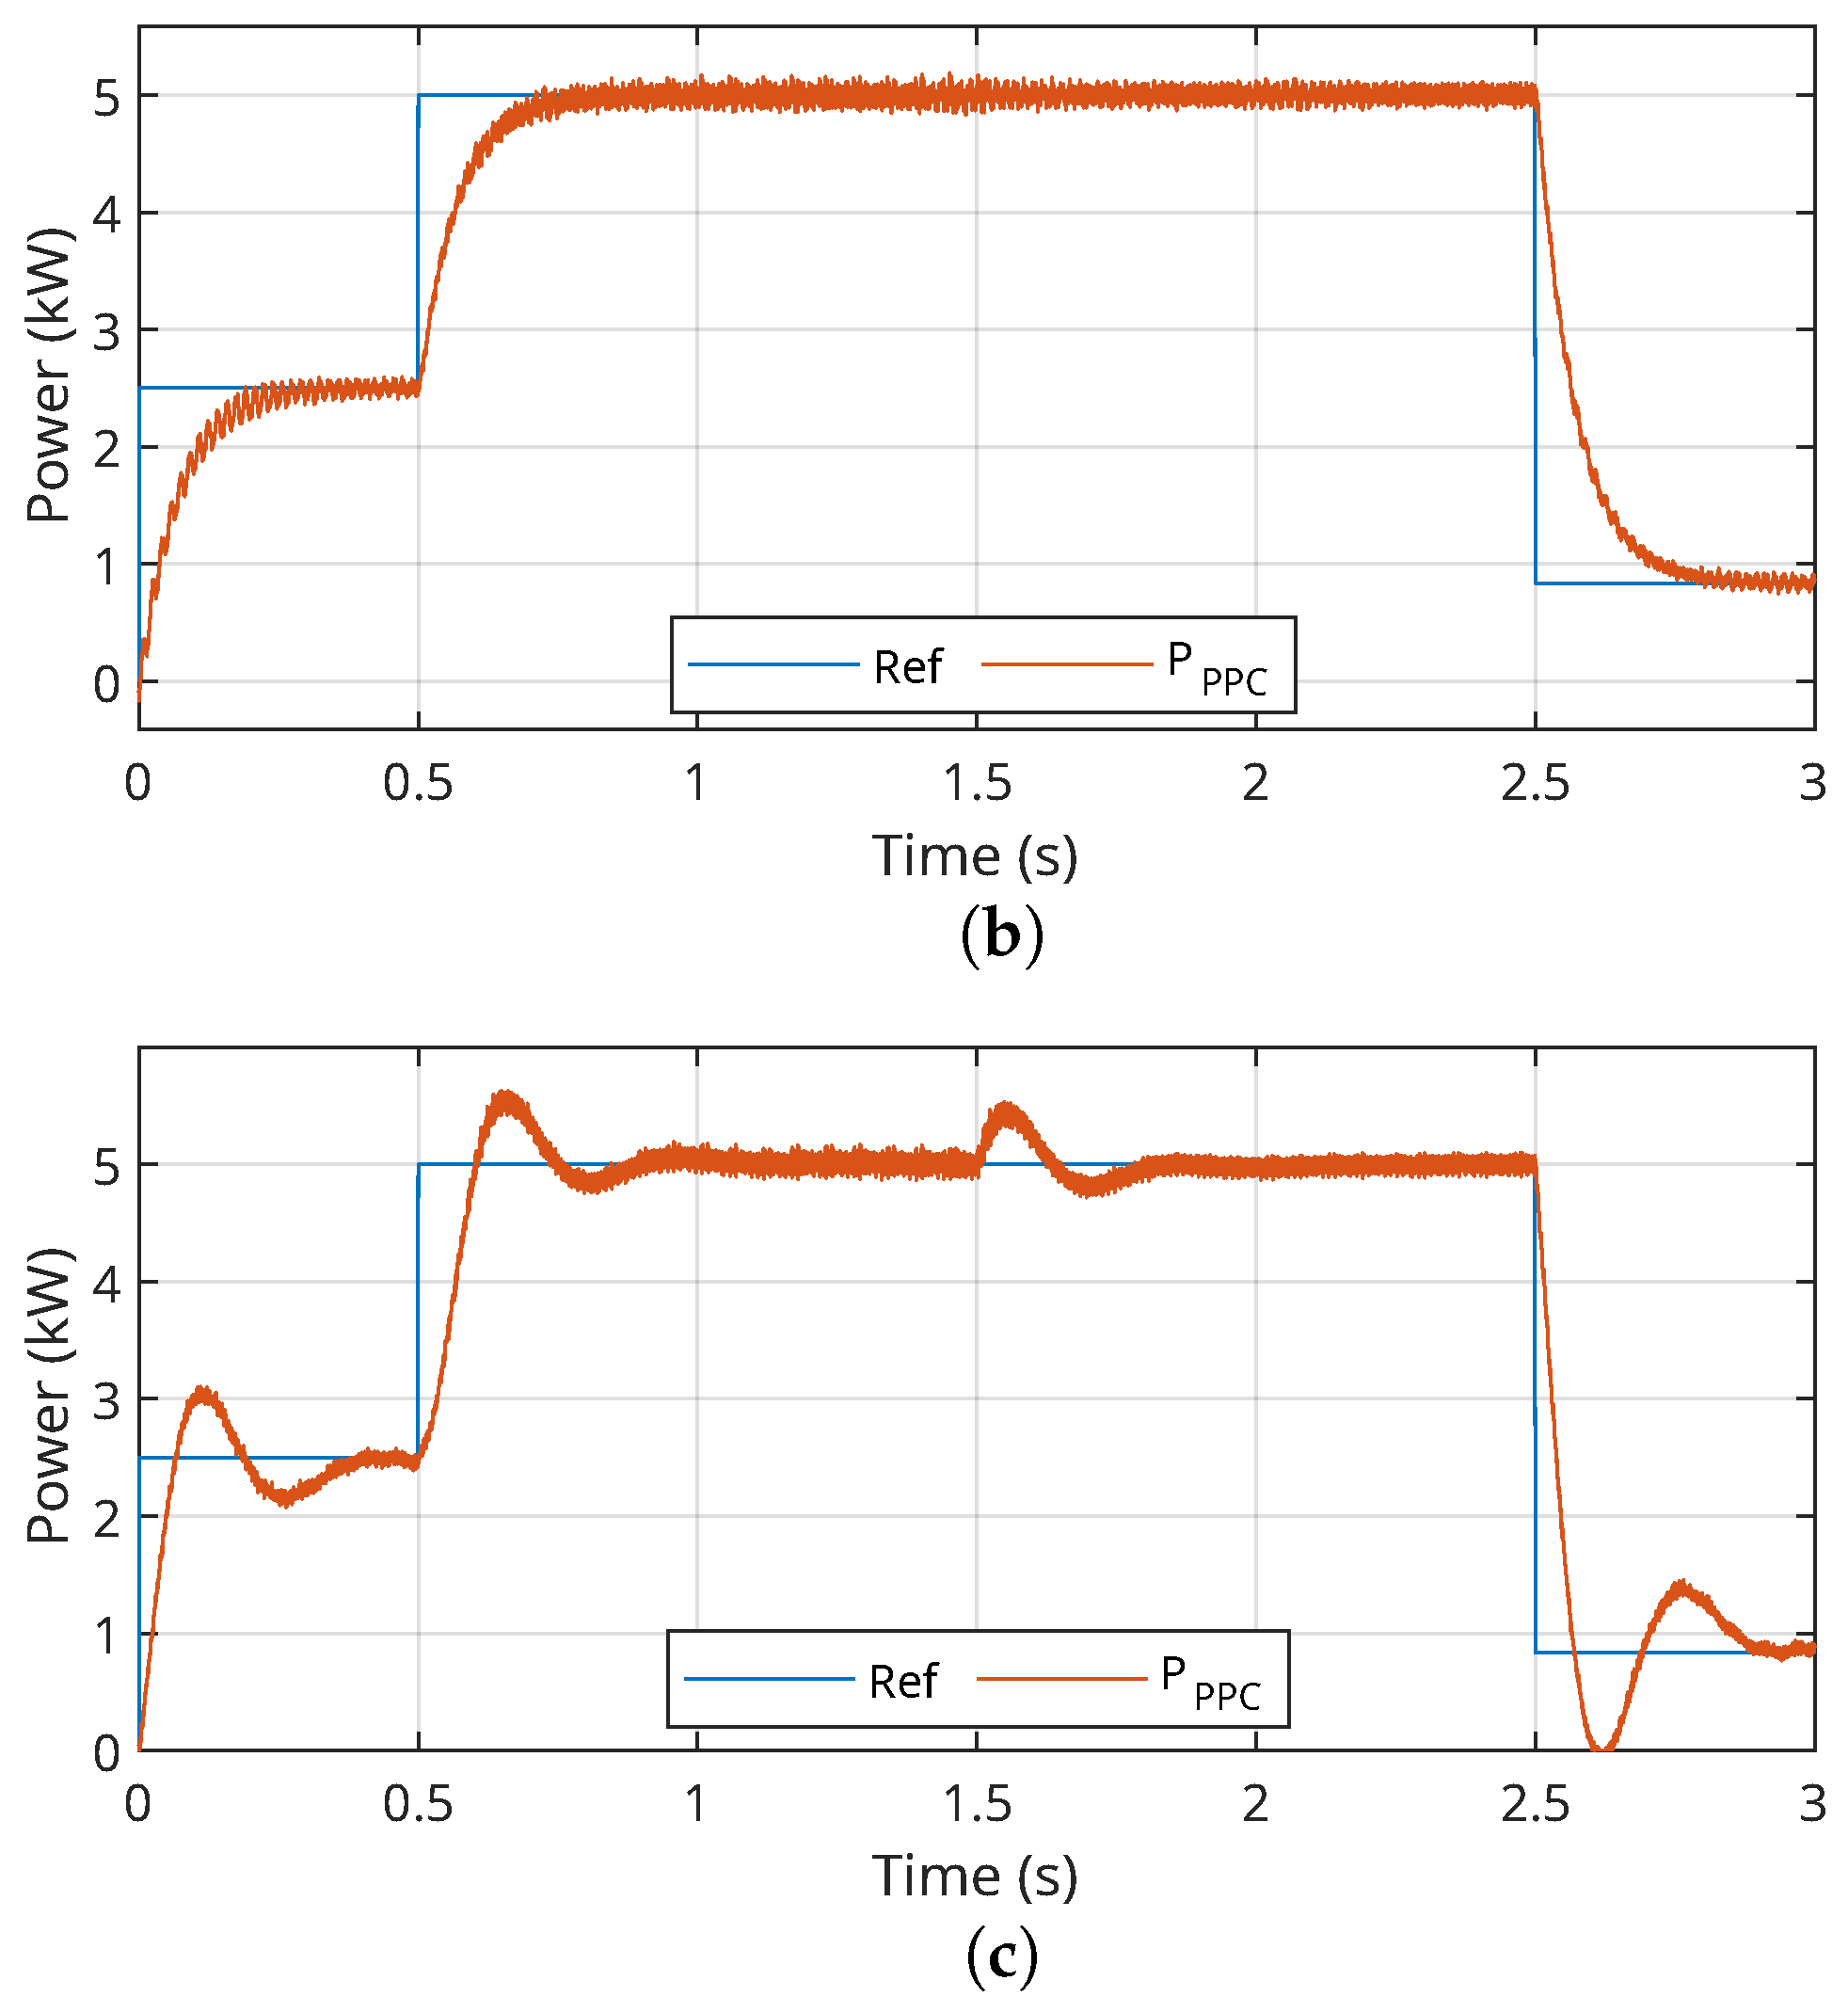
For the analysis under transient conditions, the system was subjected to the reference signal shown in
Figure 10a–c, with the active power reference varying from
kW to 5 kW in 0.5 s. At 2.5 s, the active power was reduced to
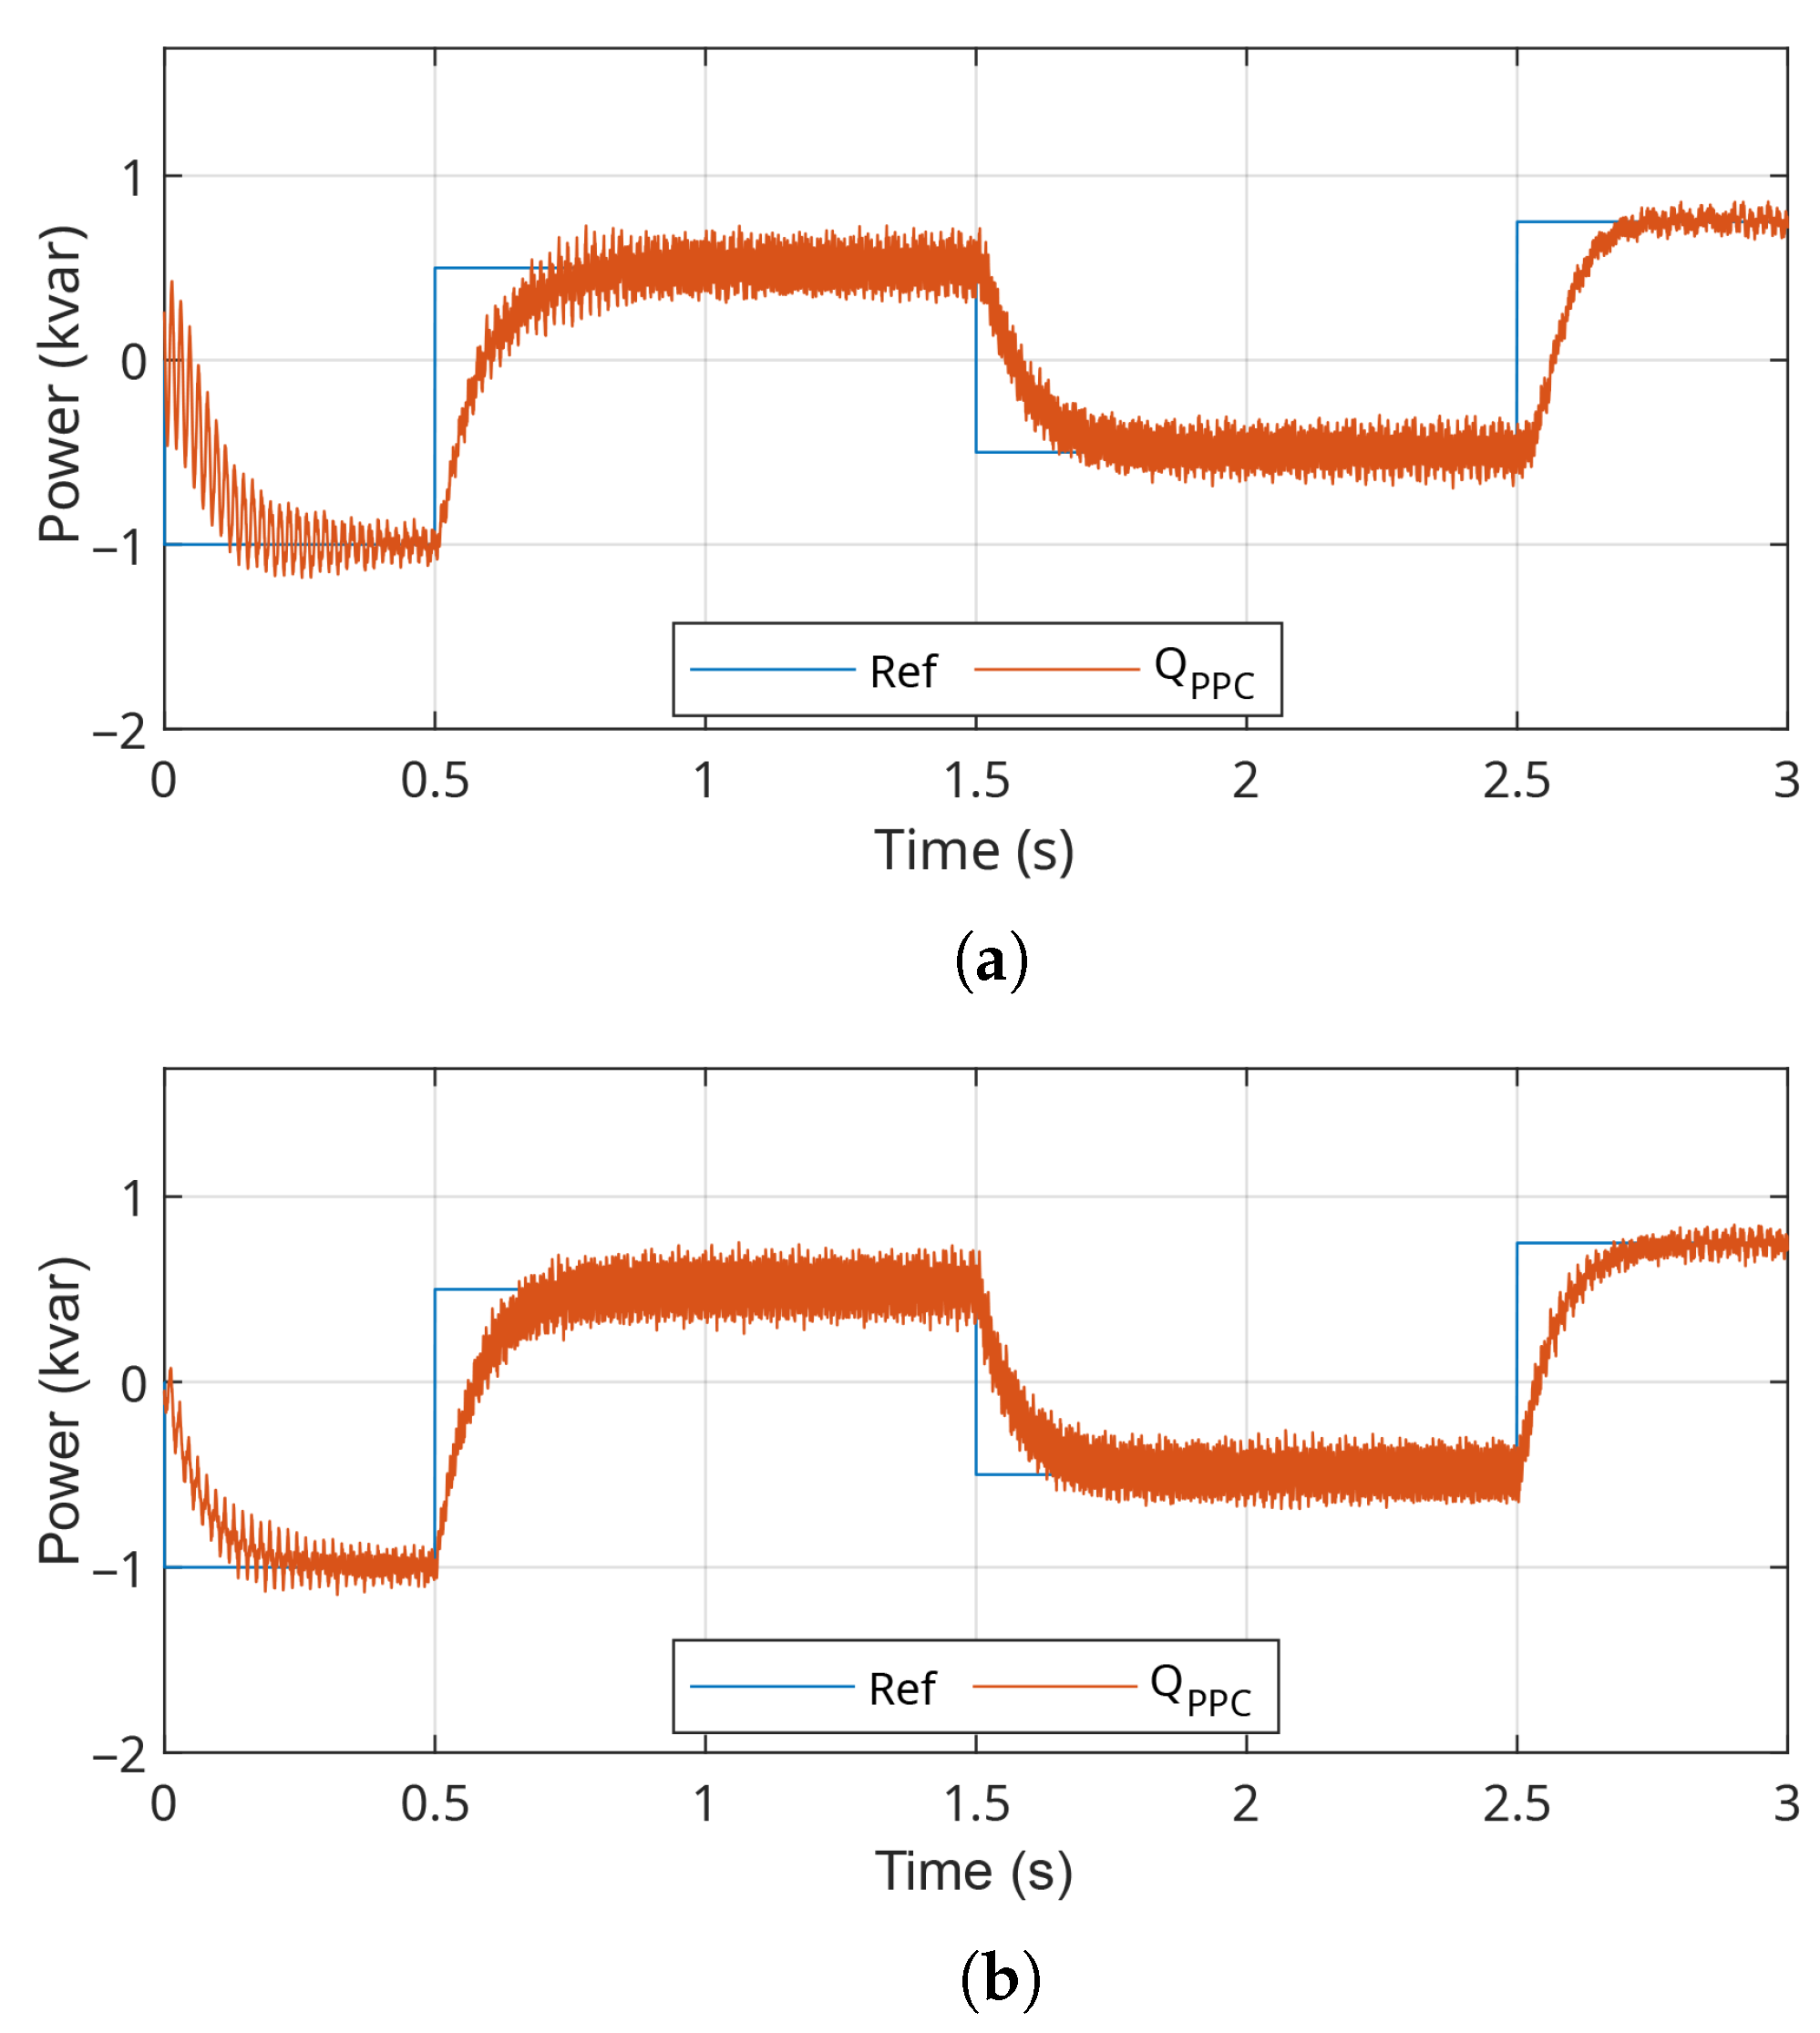
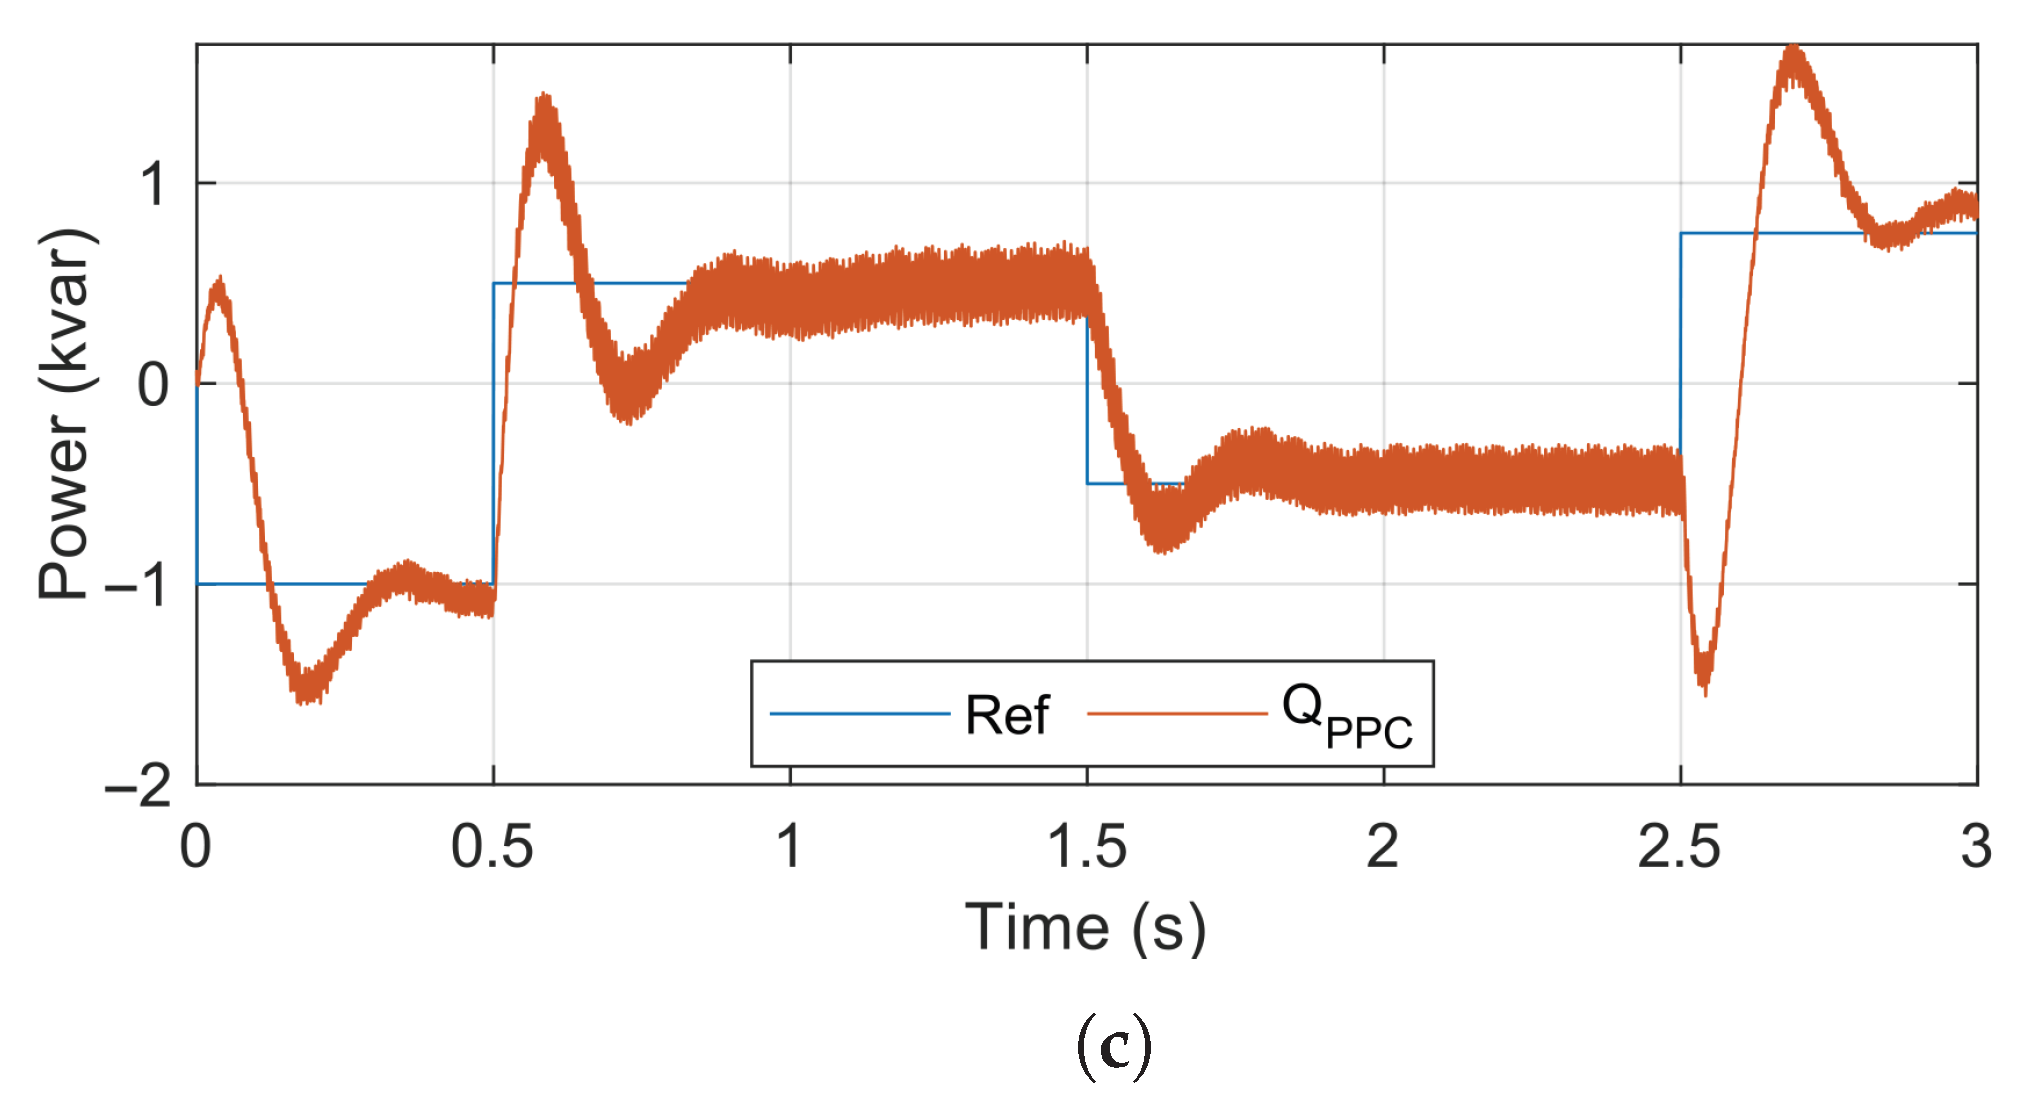
kW. Additionally, the reactive power reference, as illustrated in
Figure 11a–c, varied from
kvar to
kvar in 0.5 s, then to
kvar at 1.5 s and, finally, to
kvar at 2.5 s.
Figure 10a,b show the responses of the PI and DB controllers, highlighting a first-order dynamic behavior in the inner current loop, which indicates a fast and well-damped response to generation variations. The structure with the PR controller, on the other hand, exhibited a second-order dynamic, reflected in additional oscillations in the active power response, as seen in
Figure 10c.
The PR controller demonstrates coupling between the internal loops, as shown in
Figure 10c. This feature becomes evident when a change in the reactive power reference (
Figure 11c) causes a significant disturbance in the active power response, suggesting an undesired interaction between the
d and
q axes.
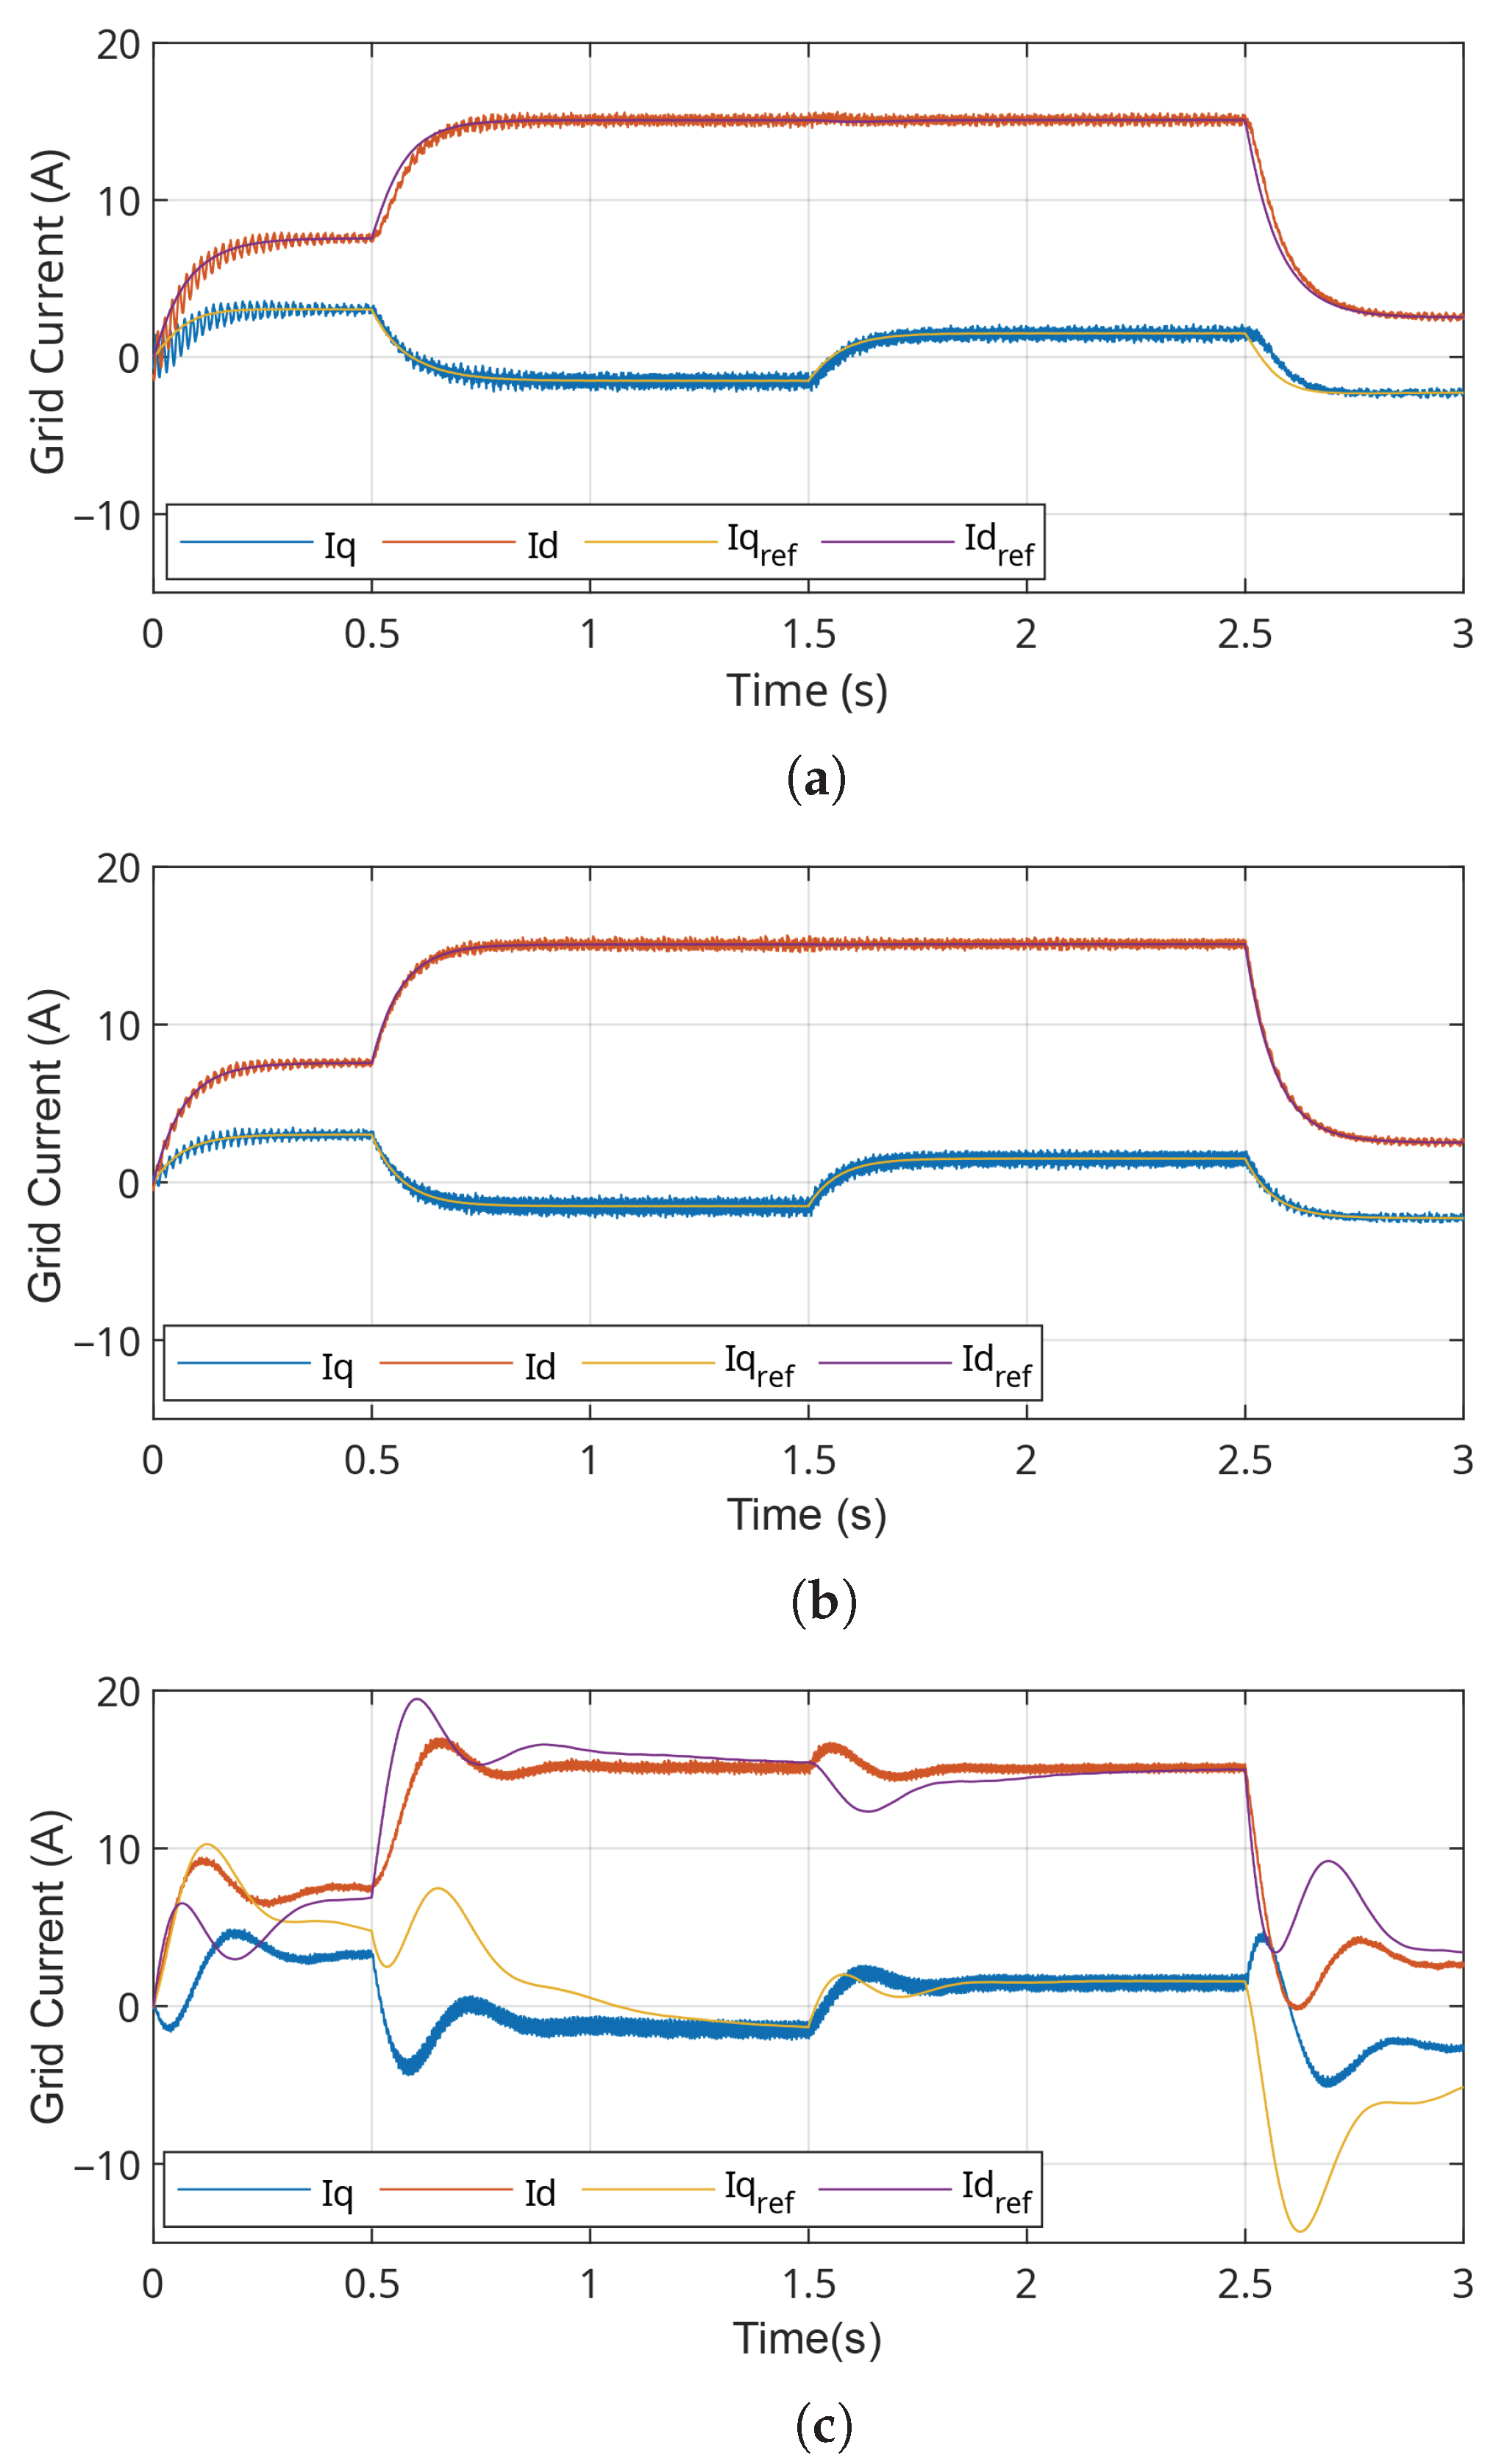
For a more detailed analysis of the current controller performance,
Figure 12 presents the currents in
coordinates for the PI, DB, and PR controllers. The PI and DB controllers demonstrate effective decoupling of the
d and
q axes, resulting in a clean and well-controlled response, without significant interference between the current components.
Comparison Metrics
The most commonly used performance metrics to evaluate the quality of controllers in control systems are the following:
Integral of the Squared Error (ISE): This metric is obtained by integrating the square of the error over time. It is defined as follows:
where
is the time-dependent error. The ISE strongly penalizes large errors, favoring controllers that minimize large deviations from the reference signal.
Integral of the Absolute Error (IAE): This metric is obtained by integrating the absolute value of the error over time. It is defined as follows:
Unlike the ISE, the IAE considers only the absolute error, making it less sensitive to large errors and allowing a less conservative controller response.
Integral of Time-weighted Absolute Error (ITAE): This metric is obtained by integrating the product of time and the absolute error. It is defined as follows:
In the ITAE, the error is weighted by time, penalizing errors that occur later. This metric favors controllers that quickly drive the system to the desired state, minimizing long-term errors.
To compare the performance of the different control strategies, the ISE, IAE, and ITAE metrics were used.
Table 5 presents the results of these metrics, highlighting the effectiveness of each controller in terms of squared, absolute, and time-weighted errors.
The table analysis reveals that the DB controller is the most efficient in minimizing squared errors (ISE), standing out as the best option for applications requiring high precision. It also shows a good balance in the IAE and ITAE metrics, indicating an effective response in correcting errors over time. The PI controller shows a well-balanced overall performance, with moderate values in all metrics, making it a solid choice for applications requiring a good combination of precision and speed. The PR controller, on the other hand, presents the worst performance, especially in terms of ISE, suggesting significant limitations in its error correction effectiveness, which may restrict its applicability in systems that demand high accuracy.
4.3. Disturbances in Grid Parameters
In this scenario, the objective was to evaluate the robustness of the controllers with respect to changes in the power grid parameters. During these variations, the controllers’ responses were analyzed to determine their ability to adapt and recover.
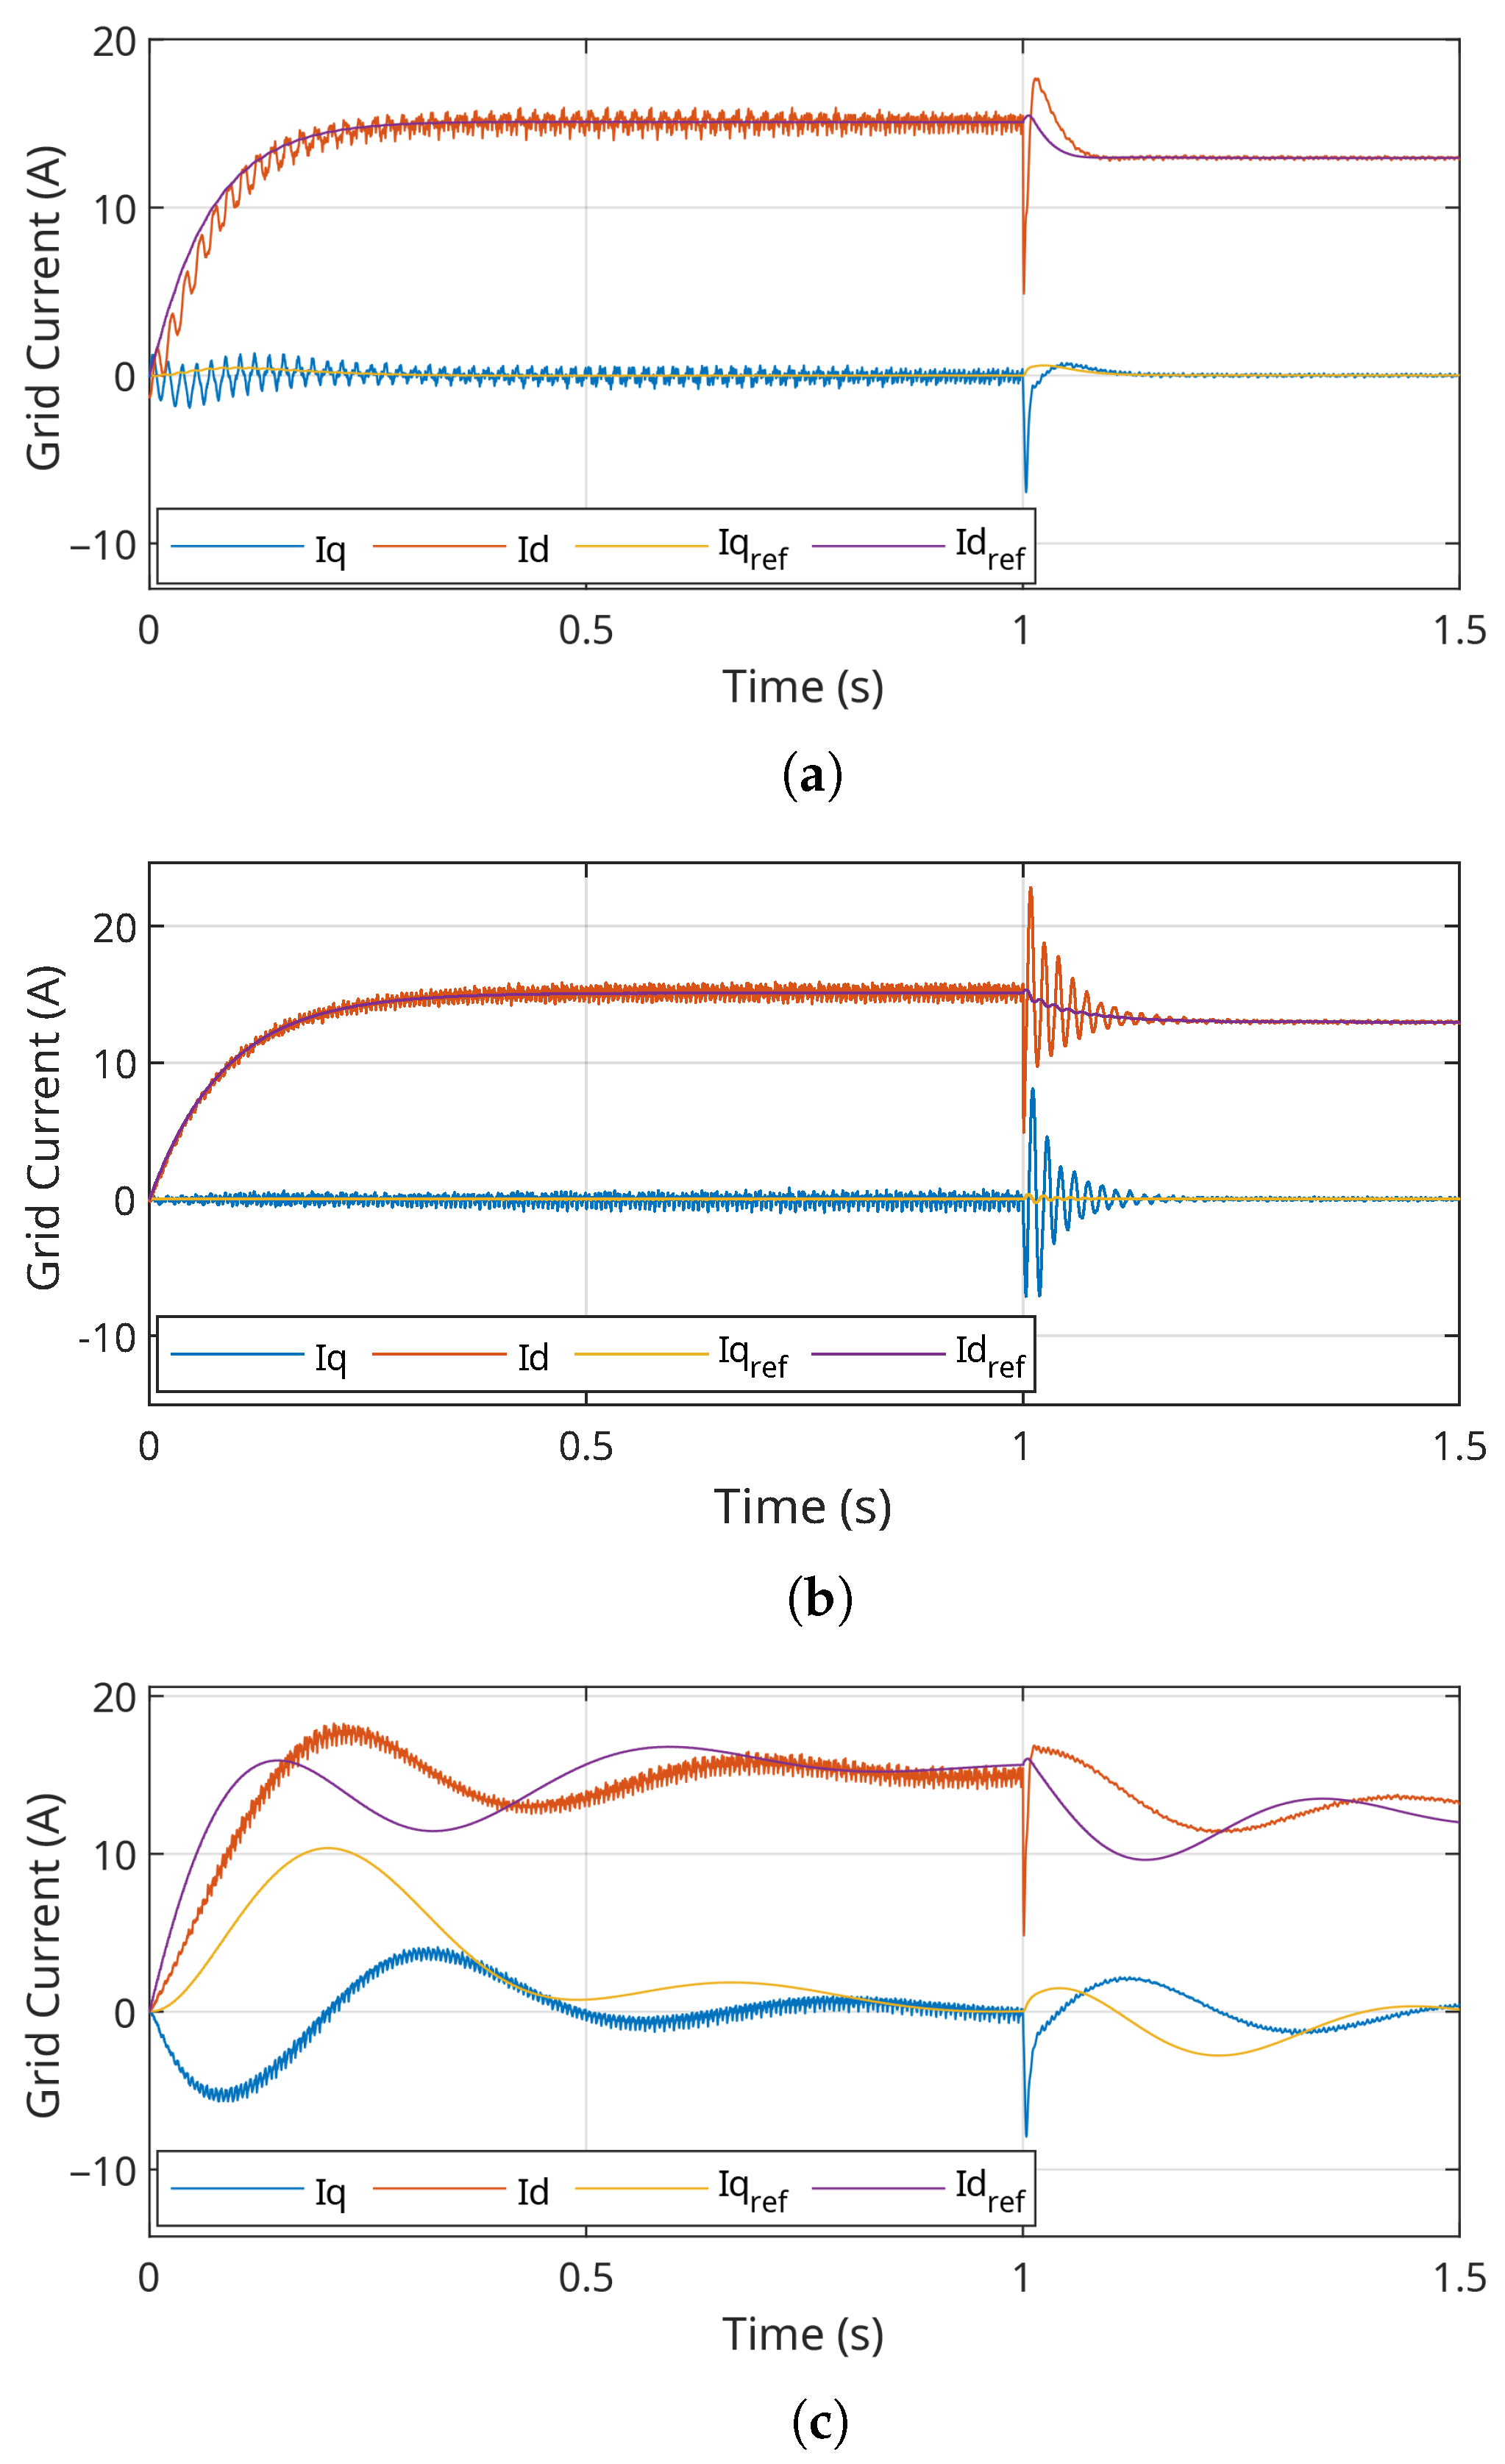
Figure 13a,c illustrate the performance of the different control structures when subjected to significant variations in the grid impedances, which were increased by up to 10 times the original value at
. These disturbances were applied to both the resistance and inductance of the grid, allowing for a comprehensive robustness analysis of the controllers.
The analysis of the results revealed important differences between the control structures. The PR controller exhibited persistent oscillations after the disturbance in the grid parameters, indicating difficulties in regaining stability and resulting in higher harmonic distortion. The DB controller also showed oscillations but was able to quickly stabilize and track the reference after the disturbance. On the other hand, the multivariable PI controller stood out as the most robust, exhibiting the smallest transients and rapid adaptation to the new conditions, maintaining stability and minimizing harmonic distortion.
These results indicate that, although all control structures demonstrated stability, the multivariable PI controller was the most efficient in terms of robustness, while the PR controller proved to be more susceptible to grid variations.
4.4. Summary of Results
The comprehensive performance assessment across steady-state operation, transient conditions, and grid disturbances highlights the strengths and limitations of each control strategy. While all controllers maintained stability and acceptable THD levels under nominal conditions, the multivariable PI controller consistently outperformed the others in key performance metrics. Its superior harmonic suppression, faster dynamic response, and greater robustness under grid impedance variations are primarily attributed to its structural ability to perform cross-axis tasks, thereby enhancing control accuracy without the need for additional harmonic compensators. The DB controller also demonstrated strong transient behavior but exhibited slightly higher sensitivity to grid perturbations. In contrast, the PR controller, despite maintaining acceptable steady-state performance, revealed limitations in dynamic decoupling and robustness, making it less suitable for demanding grid conditions. Overall, the multivariable PI controller proved to be the most balanced and technically robust solution, offering high power quality, dynamic adaptability, and compliance with international standards for grid-connected PV systems.
5. Conclusions
Based on the obtained results, the evaluated current controllers exhibited different performances under various operating conditions, each with its own characteristics and strengths. The multivariable PI controller stood out in harmonic suppression by effectively reducing the THD of the current injected into the grid. The PI and DB structures were more efficient in handling variations in the reference power, showing a faster and more stable response to such changes. The PR controller showed inferior performance, especially under transient conditions and in harmonic mitigation, as evidenced by more pronounced oscillations in the current. This behavior can be attributed to the coupling between the internal loops of the PR controller, which compromises its ability to respond to disturbances.
The superiority of the multivariable PI controller is attributed to its interconnected structure, which functions as four coordinated PI controllers, reducing disturbances between the d and q coordinates. Although DB controllers share a similar philosophy, the cross-decoupling in them is less effective, resulting in lower performance under certain conditions. The results highlight the importance of choosing the most appropriate control strategy for different operating conditions in PV systems.
Each controller has a distinct purpose and performance trade-off. The PR controller includes a pair of imaginary poles that enable the tracking of both positive and negative sequence components, which is advantageous under unbalanced conditions. However, the tuning process becomes more complex due to this structure. The DB controller is simpler to design, as it aims to cancel the plant dynamics directly, facilitating controller synthesis. Nonetheless, its goal is not necessarily to improve system performance in terms of error metrics. The proposed multivariable PI controller showed the best performance among the evaluated scenarios. Its structure, particularly the inclusion of secondary diagonal terms, enhances dynamic decoupling and helps reduce harmonic distortion. In multivariable controllers, whether implemented in dq or coordinates, the main diagonal terms govern the core dynamic control, while the secondary diagonal terms contribute to decoupling and transient compensation.
In addition to the numerical results, this work provides several important contributions, including (i) a comprehensive mathematical formulation of multivariable control strategies in the and reference frames; (ii) a systematic modeling approach for grid-connected photovoltaic systems using a three-level NPC inverter; (iii) dedicated tuning procedures for each controller, with emphasis on practical implementation aspects; and (iv) a critical performance comparison between multivariable PI, PR, and DB controllers under different scenarios, including steady-state operation, transient conditions, and grid disturbances.
Based on the results and insights obtained in this study, future research can pursue several extensions. One promising direction is the application of multivariable control strategies to grid-forming inverters, which play a critical role in maintaining voltage and frequency stability in low-inertia power systems with high renewable energy penetration. Investigating how multivariable PI, PR, and DB controllers can be adapted to grid-forming operation, including the implementation of virtual impedance and power sharing mechanisms, can provide valuable contributions to the development of stable and resilient microgrids. Furthermore, future research can explore the performance of the controllers under unbalanced grid conditions, voltage dips, and frequency disturbances. Finally, the integration of advanced control methods, such as predictive, adaptive, or nonlinear approaches, can also be considered.
Author Contributions
Conceptualization, R.S.R.J. and E.P.M.; methodology, R.S.R.J.; software, R.S.R.J.; validation, E.P.M., D.F.J., T.A.d.S.B. and F.B.C.; formal analysis, E.P.M., D.F.J., T.A.d.S.B. and F.B.C.; investigation, E.P.M. and F.B.C.; writing—original draft preparation, R.S.R.J.; writing—review and editing, E.P.M., D.F.J., T.A.d.S.B. and F.B.C.; project administration, D.F.J. and E.P.M.; funding acquisition, D.F.J. All authors have read and agreed to the published version of the manuscript.
Funding
This work was funded by the Brazilian National Council for Scientific and Technological Development (CNPq) through research projects Grant numbers 407087/2024-9 and 444594/2024-8. Support from the Coordination for the Improvement of Higher Education Personnel (CAPES) is also acknowledged.
Data Availability Statement
The data presented in this study are available upon request from the corresponding author.
Acknowledgments
The authors are grateful to Coordination for the Improvement of Higher Education Personnel (Capes).
Conflicts of Interest
The authors declare no conflicts of interest.
Abbreviations
The following abbreviations are used in this manuscript:
| AC | Alternating Current |
| DC | Direct Current |
| DB | Deadbeat |
| DFT | Discrete Fourier Transform |
| IAE | Integral of the Absolute Error |
| ISE | Integral of the Squared Error |
| ITAE | Integral of the Time-weighted Absolute Error |
| MIMO | Multiple Input, Multiple Output |
| MPPT | Maximum Power Point Tracking |
| NPC | Neutral Point Clamped |
| PI | Proportional Integral |
| PR | Proportional Resonant |
| STC | Standard Test Conditions |
| SVPWM | Space Vector Pulse-Width Modulation |
| THD | Total Harmonic Distortion |
Appendix A. Development of the Equations in dq Coordinates
Development of the equations:
Using the relationship between the
and
coordinates, represented by (
37), it is possible to transform the transfer function to
coordinates:
Expanding the powers of the expression
yields
Replacing these expressions in the original equation yields the following:
Grouping like matrices to simplify the final expression yields the following:
Appendix B. Analysis of the PR Controller
The PR controller applied to the system in
coordinates can be represented either in single-variable or multivariable form. Its characteristic equation is expressed as follows:
Considering that
, (
A8) can be rewritten as follows:
It can also be described by phase, as shown in (
A10):
Note that while (
A10) depends on complex poles, (
A9) is associated with real multivariable poles. This facilitates the understanding of the controller’s nature.
Figure A1 illustrates that the same controller can be interpreted in both single-variable and multivariable forms, highlighting their different modeling approaches.
Figure A1.
PR Controller: (a) Complex poles. (b) Multivariable poles.
Figure A1.
PR Controller: (a) Complex poles. (b) Multivariable poles.
Appendix C. Matrix Relating Modulation Indices to Phase Voltages
The matrix (
) defined in (
26), being a non-singular matrix, satisfies the following property for any natural number (
n):
Consequently, we can infer
Matrix
exhibits remarkable properties when applied to the product with phase vectors. For a three-phase signal vector (
, where
is the positive sequence component,
is the negative sequence component, and
is the zero sequence component), the matrix acts differently on each of these components:
Appendix D. Calculation of Total Harmonic Distortion of Current and Recursive Approaches
In order to calculate the THD of the current over time (
), it is necessary to know the amplitude of the fundamental component and the other harmonics. The
can be computed as follows:
where
is the amplitude of the harmonics,
is the fundamental component, and
N is the total number of harmonics considered in the analysis. To simplify the computation of
, one can use the relationship expressed as
, which allows for the representation of (
A14) as follows:
where
is the root mean square value of the monitored current, taking into account its harmonics. The amplitude of the fundamental component (
) can be defined by the relationship expressed as
, where
is obtained using the Short-Time Fourier Transform (STFT) as follows:
where
B is the width of the window in the STFT and
is the current signal at time
. Equation (
A16) can be represented in discrete form as follows:
where
is the number of samples in the STFT window and
is the
m-th sample of the current signal. Using (
A17), a recursive approach to reduce computational effort can be defined as follows:
Similarly, the root mean square value of the monitored current (
), taking into account its harmonics, can be computed as follows:
References
- Zayed, M.E.; Rehman, S.; Elgendy, I.A.; Al-Shaikhi, A.; Mohandes, M.A.; Irshad, K.; Abdelrazik, A.S.; Alam, M.A. Benchmarking reinforcement learning and prototyping development of floating solar power system: Experimental study and LSTM modeling combined with brown-bear optimization algorithm. Energy Convers. Manag. 2025, 332, 119696. [Google Scholar] [CrossRef]
- Attia, M.E.H.; Zayed, M.E.; Kabeel, A.E.; Khelifa, A.; Arıcı, M.; Abdelgaied, M. Design and performance optimization of a novel zigzag channeled solar photovoltaic thermal system: Numerical investigation and parametric analysis. J. Clean. Prod. 2024, 434, 140220. [Google Scholar] [CrossRef]
- Morey, M.; Gupta, N.; Garg, M.M.; Kumar, A. A comprehensive review of grid-connected solar PV system: Architecture, control, and ancillary services. Renew. Energy Focus 2023, 45, 307–330. [Google Scholar] [CrossRef]
- Wang, F.; Xue, Y. A Review of the Development of the Energy Storage Industry in China: Challenges and Opportunities. Energies 2025, 18, 1512. [Google Scholar] [CrossRef]
- Rahman, K.; Hashimoto, J.; Orihara, D.; Ustun, T.S.; Otani, K.; Kikusato, H.; Kodama, Y. A Review of Grid-Forming Inverter Control Paradigms and Emerging Trends—A Comparative Study. Energies 2024, 17, 2400. [Google Scholar] [CrossRef]
- Landera, G.Y.; Zevallos, C.O.; Neto, R.C.; Castro, J.F.C.; Neves, F.A.S. A Review of Grid Connection Requirements for Photovoltaic Power Plants. Energies 2023, 16, 2093. [Google Scholar] [CrossRef]
- Timbus, A.; Liserre, M.; Teodorescu, R.; Rodriguez, P.; Blaabjerg, F. Evaluation of Current Controllers for Distributed Power Generation Systems. IEEE Trans. Power Electron. 2009, 24, 654–664. [Google Scholar] [CrossRef]
- Abreu, M.P.S.d. Synthesis of Multivariable Controllers Based on Internal Model Control and Multi-Objective Evolutionary Optimization. Master’s Thesis, Federal Center for Technological Education of Minas Gerais, Belo Horizonte, Brazil, 2019; p. 290. [Google Scholar]
- Krause, P.C.; Wasynczuk, O.; Sudhoff, S.D.; Pekarek, S.D. Analysis of Electric Machinery and Drive Systems, 7th ed.; John Wiley & Sons: Hoboken, NJ, USA, 2013. [Google Scholar]
- Zeb, K.; Uddin, W.; Khan, M.A.; Ali, Z.; Ali, M.U.; Christofides, N.; Kim, H.J. A comprehensive review on inverter topologies and control strategies for grid connected photovoltaic system. Renew. Sustain. Energy Rev. 2018, 94, 1120–1141. [Google Scholar] [CrossRef]
- Sadabadi, M.S.; Sharifzadeh, M.; Mehrasa, M.; Karimi, H.; Al-Haddad, K. Decoupled dq Current Control of Grid-Tied Packed E-Cell Inverters in Vehicle-to-Grid Technologies. IEEE Trans. Ind. Electron. 2023, 70, 1356–1366. [Google Scholar] [CrossRef]
- Gadde, P.H.; Brahma, S. Comparison of PR and PI Controllers for Inverter Control in an Unbalanced Microgrid. In Proceedings of the 2020 52nd North American Power Symposium (NAPS), Tempe, AZ, USA, 11–13 April 2021; pp. 1–6. [Google Scholar] [CrossRef]
- Ribeiro Junior, R.S.; Machado, E.; Júnior, D. Development of a Multivariable Deadbeat Controller in dq Coordinates for the Current Loop of a Grid-Connected VSI. J. Control. Autom. Electr. Syst. 2024, 35, 588–600. [Google Scholar] [CrossRef]
- Ribeiro, R.S.; Silva, E.C.; Machado, E.P.; Fernandes, D.; Pinto, A.C.; De Melo Filho, J.B. Performance Analysis of Photovoltaic Modules Employing Single-and Double-Diode Models. In Proceedings of the 2023 15th IEEE International Conference on Industry Applications (INDUSCON), São Bernardo do Campo, Brazil, 22–24 November 2023; pp. 228–235. [Google Scholar] [CrossRef]
- Machado, E.P.; Costa, E.B.C.; Pinto, A.C.; Sá, J.S.; Prates, R.M.; Ramos, R.P.; Silva, W.P.; Costa, F.B.; de Melo Filho, J.B.; Pereira, A.C. Modeling Principles of a Three-Phase Inverter with LC Filter Connected to the Grid. Braz. Symp. Electr. Syst. 2022, 2, 1. (In Portuguese) [Google Scholar]
- Subbulakshmy, R.; Palanisamy, R. SVPWM control strategy for Novel Interleaved High Gain DC converter fed 3-level NPC Inverter for Renewable Energy Applications. ISA Trans. 2023, 140, 426–437. [Google Scholar] [CrossRef] [PubMed]
- Soares, F.A.B. Pulse width Modulation Techniques with Reduced Number of Switchings for Multilevel Converters (In Portuguese). Master’s Thesis, Federal University of Minas Gerais, Belo Horizonte, Brazil, 2004. [Google Scholar]
- Bahrani, B.; Kenzelmann, S.; Rufer, A. Multivariable-PI-Based dq Current Control of Voltage Source Converters With Superior Axis Decoupling Capability. IEEE Trans. Ind. Electron. 2011, 58, 3016–3026. [Google Scholar] [CrossRef]
- Kumar, A.; Patel, N.; Gupta, N.; Gupta, V. Design, Analysis and Implementation of Electronically Interfaced Photovoltaic System Using ARM Cortex-M4 Microcontroller. Comput. Electr. Eng. 2022, 98, 107701. [Google Scholar] [CrossRef]
- Seifi, K.; Moallem, M. An Adaptive PR Controller for Synchronizing Grid-Connected Inverters. IEEE Trans. Ind. Electron. 2019, 66, 2034–2043. [Google Scholar] [CrossRef]
- Souza, C.; Cocco, G.; Scherer, L.; Camargo, R. Proportional Integral Resonant and Proportional Derivative Controllers Applied to Zero Sequence Harmonic Compensation in Four-Wire Microgeneration Systems. J. Control. Autom. Electr. Syst. 2022, 34, 443–454. [Google Scholar] [CrossRef]
- Chen, B.M.; Lin, Z.; Shamash, Y. Linear Systems Theory; Springer: New York, NY, USA, 2004. [Google Scholar]
- Dorf, R.C.; Bishop, R.H. Modern Control Systems, 11th ed.; Pearson Prentice Hall: Upper Saddle River, NJ, USA, 2008. [Google Scholar]
- Galvez, J.M. Active Control of Noise and Mechanical Vibrations Using a Deadbeat-Type Control Algorithm. Proceeding Ser. Braz. Soc. Comput. Appl. Math. 2013, 1, 1–19. (In Portuguese) [Google Scholar]
- IEC 61000-4-7; Electromagnetic Compatibility (EMC) Part 4-7: Testing and Measurement Techniques—General Guide on Harmonics and Interharmonics Measurements and Instrumentation, for Power Supply Systems and Equipment Connected Thereto. International Electrotechnical Commission: Geneva, Switzerland, 2009.
Figure 1.
Flowchart of the methodology for the analysis of control structures and controller tuning.
Figure 1.
Flowchart of the methodology for the analysis of control structures and controller tuning.
Figure 2.
Structure of the inverter–filter–grid system. (a) PV plant. (b) Voltage source inverter. (c) LC filter. (d) Power grid. (e) Control system.
Figure 2.
Structure of the inverter–filter–grid system. (a) PV plant. (b) Voltage source inverter. (c) LC filter. (d) Power grid. (e) Control system.
Figure 3.
Control signal for an arbitrary inverter leg ().
Figure 3.
Control signal for an arbitrary inverter leg ().
Figure 4.
Inverter–filter–grid system in coordinates.
Figure 4.
Inverter–filter–grid system in coordinates.
Figure 5.
Inverter–filter–grid system in dq coordinates.
Figure 5.
Inverter–filter–grid system in dq coordinates.
Figure 6.
Block diagram of closed-loop control with multivariable PI. (a) Active and reactive power control structure. (b) Current control structure through multivariable PI. (c) VSI. (d) Current plant. (e) Power plant.
Figure 6.
Block diagram of closed-loop control with multivariable PI. (a) Active and reactive power control structure. (b) Current control structure through multivariable PI. (c) VSI. (d) Current plant. (e) Power plant.
Figure 7.
Closed-loop control block diagram with PR. (a) Control structure for active and reactive powers. (b) Control structure for currents through PR controllers. (c) VSI. (d) Current plant. (e) Power plant.
Figure 7.
Closed-loop control block diagram with PR. (a) Control structure for active and reactive powers. (b) Control structure for currents through PR controllers. (c) VSI. (d) Current plant. (e) Power plant.
Figure 8.
Closed-loop control block diagram with the DB controller. (a) Active and reactive power control structure. (b) Current control structure using DB controllers. (c) VSI. (d) Current plant. (e) Power plant.
Figure 8.
Closed-loop control block diagram with the DB controller. (a) Active and reactive power control structure. (b) Current control structure using DB controllers. (c) VSI. (d) Current plant. (e) Power plant.
Figure 9.
(a) Transient period. (b) Details under steady-state conditions.
Figure 9.
(a) Transient period. (b) Details under steady-state conditions.
Figure 10.
Active power delivered to the point of common coupling for the multivariable controllers: (a) PI; (b) DB; (c) PR.
Figure 10.
Active power delivered to the point of common coupling for the multivariable controllers: (a) PI; (b) DB; (c) PR.
Figure 11.
Reactive power delivered to the point of common coupling for the multivariable controllers: (a) PI; (b) DB; (c) PR.
Figure 11.
Reactive power delivered to the point of common coupling for the multivariable controllers: (a) PI; (b) DB; (c) PR.
Figure 12.
Current dynamics in coordinates for the multivariable controllers: (a) PI; (b) DB; (c) PR.
Figure 12.
Current dynamics in coordinates for the multivariable controllers: (a) PI; (b) DB; (c) PR.
Figure 13.
Performance of the control structures under grid impedance variation: (a) PI; (b) DB; (c) PR.
Figure 13.
Performance of the control structures under grid impedance variation: (a) PI; (b) DB; (c) PR.
Table 1.
Grid and inverter parameters.
Table 1.
Grid and inverter parameters.
| Parameter | Value |
|---|
| 0.18 mH |
| 0.575 |
| 7.9 mH |
| 470 F |
| rad/s |
| 220 V |
| 1 ms |
| 1 kHz |
Table 2.
PV plant parameters.
Table 2.
PV plant parameters.
| Parameter | Value |
|---|
| 6 |
| 9 |
| 1.68 A |
| 78 V |
| 95 W |
| 10 mF |
| 470 V |
Table 3.
Switching states and phase voltages of a three-level NPC inverter.
Table 3.
Switching states and phase voltages of a three-level NPC inverter.
| State | | | | | | Phase Voltage |
|---|
| P | 1 | ON | ON | OFF | OFF | |
| O | 0 | OFF | ON | ON | OFF | |
| N | −1 | OFF | OFF | ON | ON | 0 |
Table 4.
Comparison of harmonic components in the injected current.
Table 4.
Comparison of harmonic components in the injected current.
| Controller | H1 (A) | H2 (A) | H3 (A) | H4 (A) | H5 (A) | H6 (A) | H7 (A) | H8 (A) | H9 (A) | H10 (A) | H11 (A) | H12 (A) | H13 (A) |
|---|
| PI | 13.199 | 0.597 | 0.0038 | 0.1254 | 0.4021 | 0.0023 | 0.0981 | 0.0981 | 0.0524 | 0.0039 | 0.0377 | 0.0301 | 0.0034 |
| DB | 13.450 | 0.734 | 0.0036 | 0.1705 | 0.4364 | 0.0021 | 0.1061 | 0.1061 | 0.0502 | 0.0041 | 0.0295 | 0.0238 | 0.0026 |
| PR | 13.639 | 0.689 | 0.0033 | 0.1313 | 0.4193 | 0.0024 | 0.0971 | 0.0971 | 0.0453 | 0.0036 | 0.0255 | 0.0203 | 0.0021 |
Table 5.
Controller performance comparison.
Table 5.
Controller performance comparison.
| Controller | ISE | IAE | ITAE |
|---|
| PI | | | |
| PR | | | |
| DB | | | |
| Disclaimer/Publisher’s Note: The statements, opinions and data contained in all publications are solely those of the individual author(s) and contributor(s) and not of MDPI and/or the editor(s). MDPI and/or the editor(s) disclaim responsibility for any injury to people or property resulting from any ideas, methods, instructions or products referred to in the content. |
© 2025 by the authors. Licensee MDPI, Basel, Switzerland. This article is an open access article distributed under the terms and conditions of the Creative Commons Attribution (CC BY) license (https://creativecommons.org/licenses/by/4.0/).
