Article

Calculation of the Natural Fracture Distribution in a Buried Hill Reservoir Using the Continuum Damage Mechanics Method

1
Department of Development and Management, Sinopec Zhongyuan Oilfield Company, Puyang 457001, China
2
College of Petroleum Engineering, China University of Petroleum (Beijing), Changping, Beijing 266580, China
3
Institute of Petroleum Exploration & Development, Sinopec Zhongyuan Oilfield Company, Puyang 457001, China
*
Author to whom correspondence should be addressed.
Energies 2025, 18(16), 4369; https://doi.org/10.3390/en18164369 (registering DOI)
Submission received: 14 July 2025 / Revised: 5 August 2025 / Accepted: 12 August 2025 / Published: 16 August 2025
(This article belongs to the Section H1: Petroleum Engineering)

Abstract

Due to their low permeability, the location of natural fractures is key to the successful development of buried hill reservoirs. Due to the high degree of rock fragmentation and strong absorption of seismic waves at the top of buried hill formations, it is hard to identify the distribution of natural fractures inside a buried hill using conventional seismic methods. To overcome this difficulty, this study proposes a natural fracture identification technology for buried hill reservoirs that combines a continuum damage mechanics model with finite element numerical simulation. A 3D numerical solution workflow is established to determine the natural fracture distribution in target buried hill reservoirs. By constructing a geological model of a block, reconstructing the orogenic history, developing a 3D finite element model, and performing numerical simulations, the multi-stage orogenic processes experienced by buried hill reservoirs and the resultant natural fracture formation are replicated. This approach yields 3D numerical results of natural fracture distribution. Using the G-Block in the Zhongyuan Oilfield as a case study, the natural fracture distribution in a buried hill reservoir composed of mixed lithologies, including marble and Carboniferous formations, within the faulted G6-well group is analyzed. The results include plane views of the contour of damage variable SDEG, which represents the fracture distribution within the subsurface layer at 600 m intervals below the buried hill surface, as well as a vertical sectional view of the contour of SDEG’s distribution along specified well trajectories. By comparison with the results of the fracture distribution obtained with logging data, a consistency of 87.5% is achieved. This indicates the reliability of the numerical results for natural fractures obtained using the technology presented here.

1. Introduction

Buried hill reservoirs are widely distributed in North China, Northeast China, the Bohai Bay Rim, and the Pearl River Mouth Basin. They are hotspots for tight oil and gas development in China [1,2,3,4,5,6,7,8,9,10,11,12,13]. Among these References, Refs. [1,3] discuss the buried hills reservoir in the Pearl River Basin, Refs. [5,6,7,8,9,11,12,13] introduce the features of buried hills in Bohai Basin, Ref. [10] introduces features of buried hills in Tarim Basin, and Ref. [4] introduces results of fracture prediction with seismic interpretation for buried hills’ reservoir. For such kinds of reservoirs, hydrocarbons only exist within fractures; areas without fractures have no oil. Consequently, accurately determining the spatial distribution of natural fractures is key to the successful exploitation of buried hill reservoirs.
Buried hill reservoirs, sometimes referred to as basement reservoirs, have been studied extensively globally [14,15,16,17]. These reservoirs are widely distributed in coastal regions of the Middle East [14], Southeast Asia [15], North America [17], and South America [16].
Seismic interpretation methods for identifying natural fractures can only detect those with significant fault displacements. These methods exhibit low resolution in recognizing minor fractures or secondary fracture zones with displacements of less than 10 m. Furthermore, due to the high degree of rock fragmentation and strong seismic wave absorption at the buried hill surface, conventional seismic approaches often fail to delineate natural fracture distributions within the buried hill reservoir, leading to elevated exploration and development costs. In contrast, continuum–damage–mechanics-based methods, in which finite element software is employed to simulate fracture formation during tectonic events, are not constrained by fracture displacement scales. Thus, continuum damage mechanics represents a highly accurate novel technique for identifying natural fractures in buried hill reservoirs.
Investigating the continuum damage mechanics of rock remains a focal area in solid mechanics [18,19,20,21,22]. Rocks in buried hill reservoirs are quasi-brittle materials; natural fractures in these formations typically occur in clusters with various sizes, ranging from hundred-meter-scale fault systems to millimeter-scale microfractures. In engineering practice, natural fractures in rock formations often manifest as zones of continuum damage of specific widths. While it is hard to use fracture mechanics to precisely characterize such complex failure behaviors, continuum damage mechanics provides an ideal theoretical framework for analyzing rock fragmentation phenomena in buried hill reservoirs.
The G-block is a block of buried hill reservoir of Sinopec Zhongyuan Oilfield in Inner Mongolia. Due to the complexity of the formation and history of orogeny, it is difficult to locate regions of natural fractures with traditional method of seismic prediction in this block. The method of continuum damage mechanics is used as alternative to the one of seismic prediction of natural fractures.
This study presents a 3D numerical workflow that integrates a continuum damage mechanics model with finite element simulations to calculate natural fracture distributions in target buried hill reservoirs. Using the G-Block as a case study, we systematically demonstrate the entire process—from geological modeling and orogenic history reconstruction to finite element model construction, fracture distribution computation, and validation of numerical results against single-well logging interpretations of natural fractures—ensuring the accuracy and reliability of the proposed methodology.

2. Materials and Methods

2.1. Principles of the Calculation and Workflow

The workflow for simulating orogenic movements and calculating natural fracture distributions using the continuum–damage–mechanics-based finite element numerical method comprises the following steps.
(1) Geological model analysis.
Analysis of the depositional history and stratigraphic sequence conducted, and the geometric configurations and mechanical properties of formations within the target block are established. The input data of this step are the formation tops and the resultant data from a 1D geomechanical analysis with the logging data of existing wells.
(2) Analysis of tectonic movements and stress field characteristics.
Displacement magnitudes or stress field distributions are determined based on critical events in crustal movement/orogenic history. This iterative process requires parameter adjustments through comparing simulated damage variable fields with observed natural fracture discrepancies.
(3) Finite element modeling of natural fractures/fault zones of continuum damage.
Geomechanical numerical tools are utilized to simulate rock deformation, and a continuum damage mechanics material model is adopted to simulate the process of generation of natural fractures/fault zones of continuum damage under the loading of tectonic movement.
(4) Parameter identification for the continuum damage mechanics model with the block-scale finite element model.
The parameters of the continuum damage mechanics model are iteratively calibrated by comparing simulated large-scale fracture/fault locations and dimensions with observational data of natural fractures. The calibration parameters include the following two categories:
  • Load/boundary condition parameters of the finite element model;
  • Plastic damage material model parameters of rocks.
(5) The target block is meshed with a finer mesh, and a numerical calculation is performed with the values of the parameters identified before. The numerical results of damage variables present the location of natural fractures of the target block under tectonic movement.
The first four steps constitute the process of establishing the geomechanical damage mechanics model, identifying parameters, and defining loads/material properties. In the final step, the calibrated model is applied to predict 3D natural fracture distributions with a finer mesh.
This work adopts the continuum damage mechanics constitutive model described in the literature [22,23]. This model characterizes material damage evolution through two scalar variables: tensile damage (dt) and compressive damage (dc). A synthetic damage scalar, SDEG, which is a dimensionless variable, quantifies the combined material degradation effect. Critical model parameters, including damage evolution rates and damage initiation criteria, follow the definitions given in [22,23]. The parameter determination involves a trial-and-error process with a phenomenon-matching approach.

2.2. Geological Model

The buried hill reservoir in the G-Block formed as an isolated uplift during the Carboniferous–Triassic periods. The reservoir exhibits complex lithological compositions; drilling data from Wells GC-1, G4, and G6 reveal Mesozoic lithologies that include metamorphic basalt, metamorphic sandstone, dolomitic marble, and quartz schist, which share similarities with the Carboniferous Amushan Formation’s lithologic assemblages.
The structural configuration of the buried hill reservoir is intricate. The initial Mesozoic extensional rifting was followed by Himalayan compressional forces and subsequent extension, ultimately forming the current faulted basin structure. Some faults penetrate both the buried hill surface and overlying strata, creating interconnected fracture networks. Figure 1 illustrates the mesh of the geological model of the buried hill reservoir of the G6 well group and the spatial distribution of existing wells.

2.3. Orogenic Movements

The target block has undergone multi-stage orogenic processes, primarily including the following:
(1)
Late Triassic Mesozoic extensional rifting.
(2)
Mid-Late Cretaceous compressional tectonism.
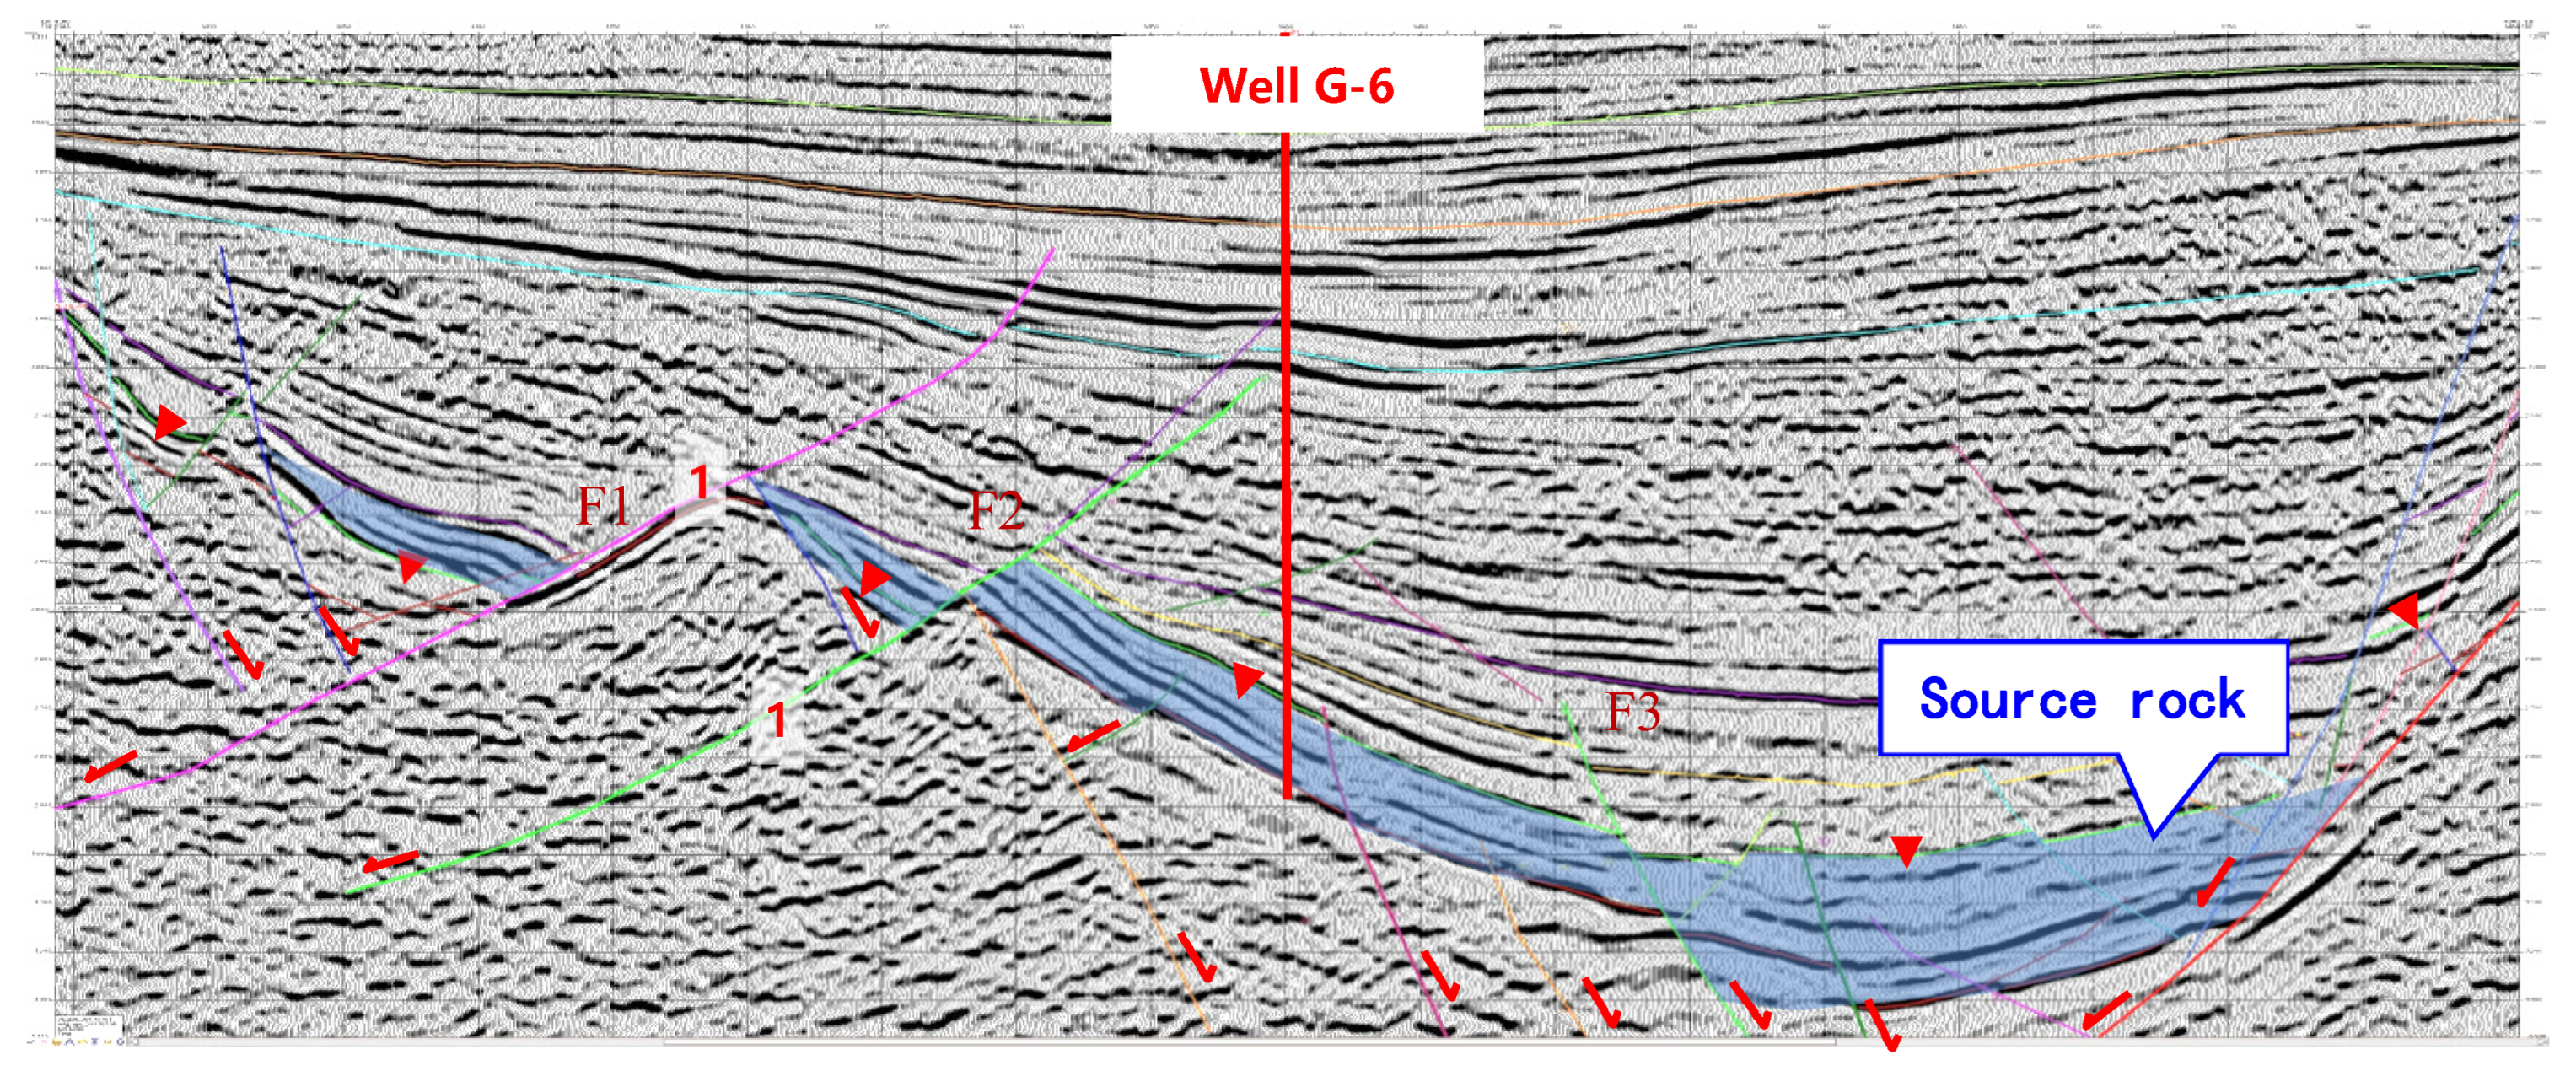
Figure 2 reveals critical insights obtained through fault-tracing analysis. Fault zones generated during orogenic movements exhibit continuous propagation across strata of different kinds of lithologies. Notably, these faults maintain their spatial trajectories without deflection or termination despite encountering different kinds of lithological variations.
This observation justifies the following model simplification: when simulating orogeny-induced natural fractures, strata formed contemporaneously may be approximated as lithologically homogeneous units. Consequently, lithological heterogeneity within buried hill reservoirs can be strategically disregarded. The numerical results confirm that fracture distributions within coeval formations remain statistically consistent regardless of lithological differences.
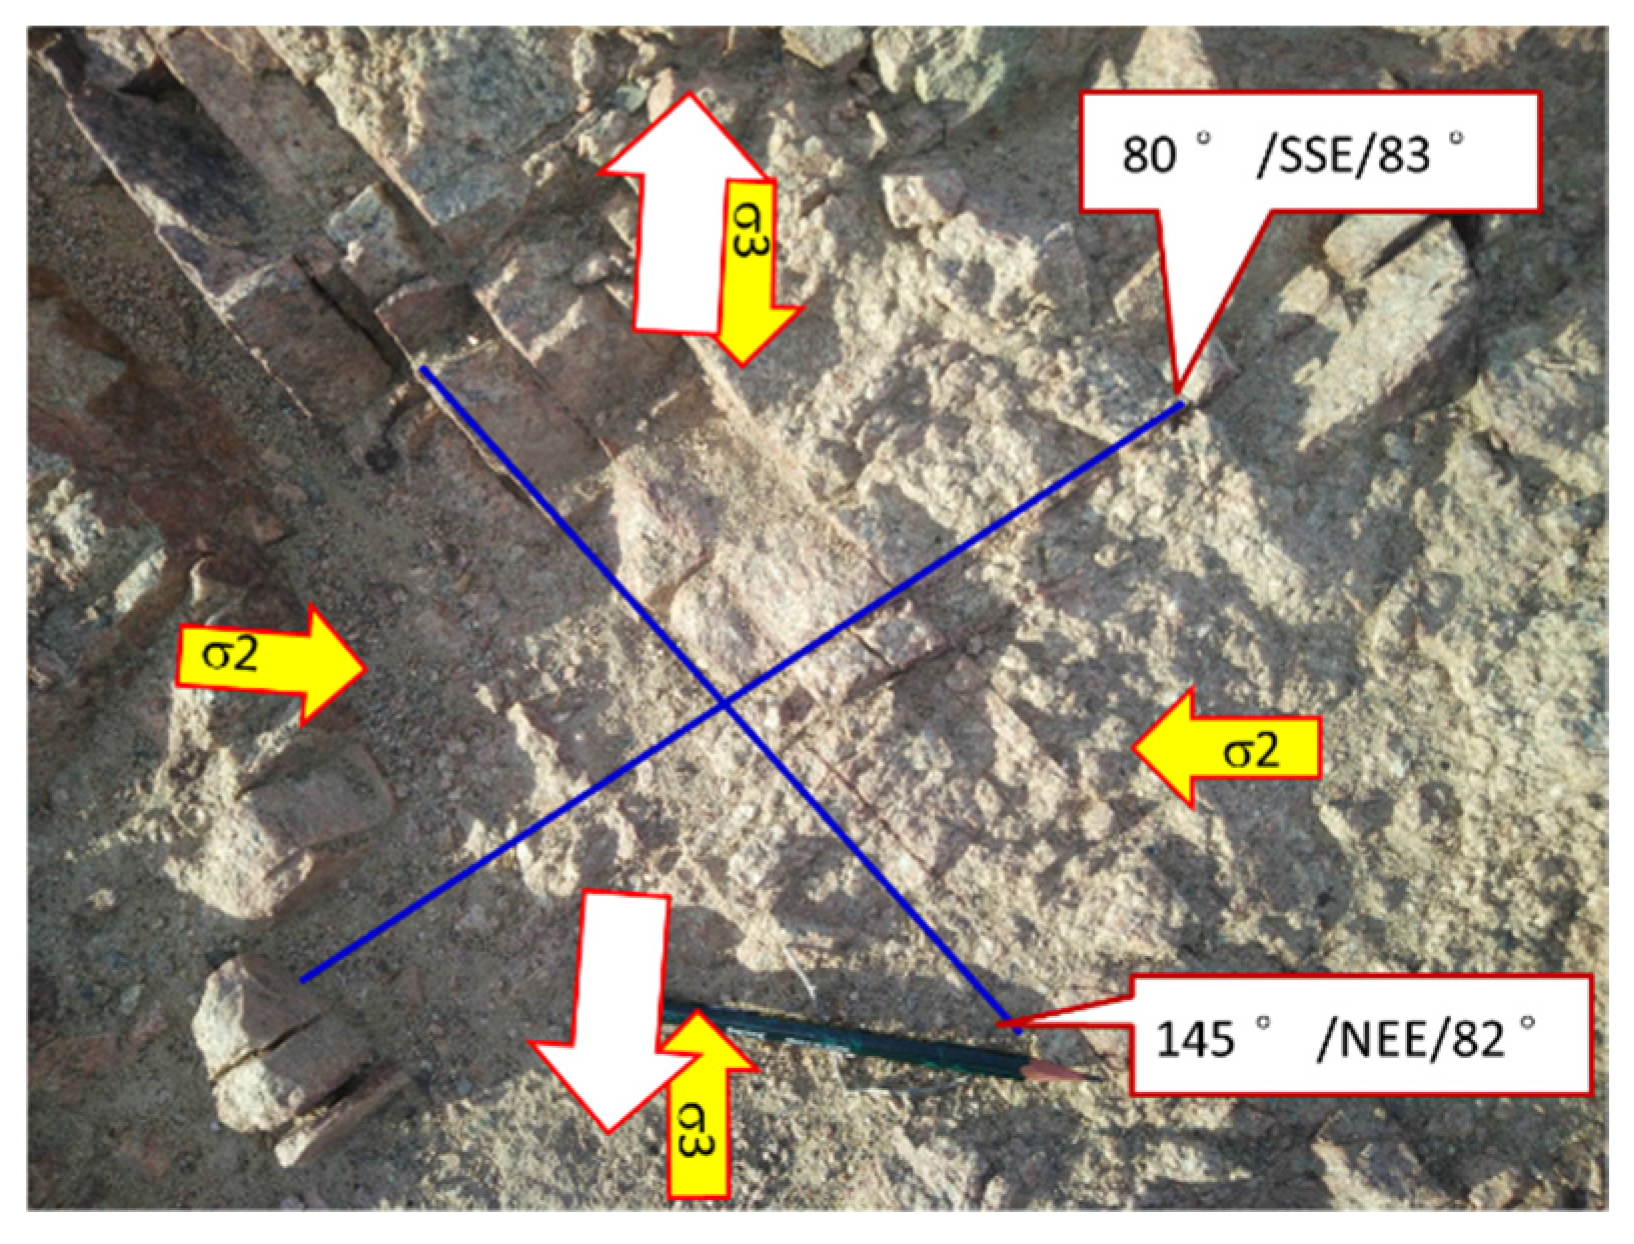
As shown in Figure 3, well-developed X-type conjugate joints in syenogranite outcrops adjacent to the target block indicate a historical NNE–SSW-oriented extension. The strata experienced cyclic tension–compression stress under the pulsed far-field effects of Himalayan collisional events. Both extensional and compressional orogenic stresses shared identical NNE–SSW orientations.

2.4. Finite Element Model

Figure 4 presents the finite element model mesh of the G6 well group. The model has a total thickness of 7117 m, with plane view dimensions of 18.0 km (length) × 13.2 km (width). The in-plane mesh resolution is 150 m × 150 m, discretized into 387,684 nodes and 369,600 eight-node linear brick elements (C3D8R). These elements employ a reduced integration scheme with second-order accuracy to mitigate shear locking effects.
The model comprises the following three stratigraphic units:
(1)
Top layer (green);
(2)
Cretaceous K1b Formation (gray-white);
(3)
Buried hill reservoir (reddish-brown).
The following table, Table 1, lists the values of parameters of the rock in the model.
The mesh stratification details are outlined as follows:
(1)
K1b Formation: 5 sublayers.
(2)
Buried hill reservoir: 25 sublayers.
(3)
Top layer: 5 sublayers.
The minimum vertical mesh thickness is 60 m, ensuring adequate resolution for stress gradient characterization.
Figure 4. The mesh of the finite element model for the G6 well group.
Energies 18 04369 g004
The model’s boundary conditions impose zero normal displacement constraints on all lateral surfaces and the bottom surface. The loading regime incorporates gravitational forces and orogenic loads, with the latter being implemented through prescribed displacements that simulate tectonic movements.

2.5. The Plastic Damage Model for the Rock of the Target Formation

The constitutive relationship adopted in the calculation is the so-called plastic damage model described in [22,23]. It uses d c and d t to represent the stiffness degradation caused by compression and tension, respectively. Further, it uses the variable d, which represents the synthetic damage due to the stiffness degradation caused jointly by compression and tension loading. d is calculated from both d c and d t in the following way:
1 d = ( 1 s t d t ) ( 1 s c d c ) )
where d is the synthetic damage variable; s t is the coefficient for d t , which reflects the effect of tensile loading and is a function of the tensile stress. s c is a coefficient for d c , which reflects the effect of compressive loading and is a function of the compressive stress. Further details can be found in [22,23]. The variable d is represented by SDEG in the numerical software toolset used in the calculation. Its value varies between 0 and 1, where 0 indicates intact rock and 1 indicates that the rock is completely broken.

3. Results

3.1. Numerical Results of the Distribution of Damage Variables Within the Reservoir

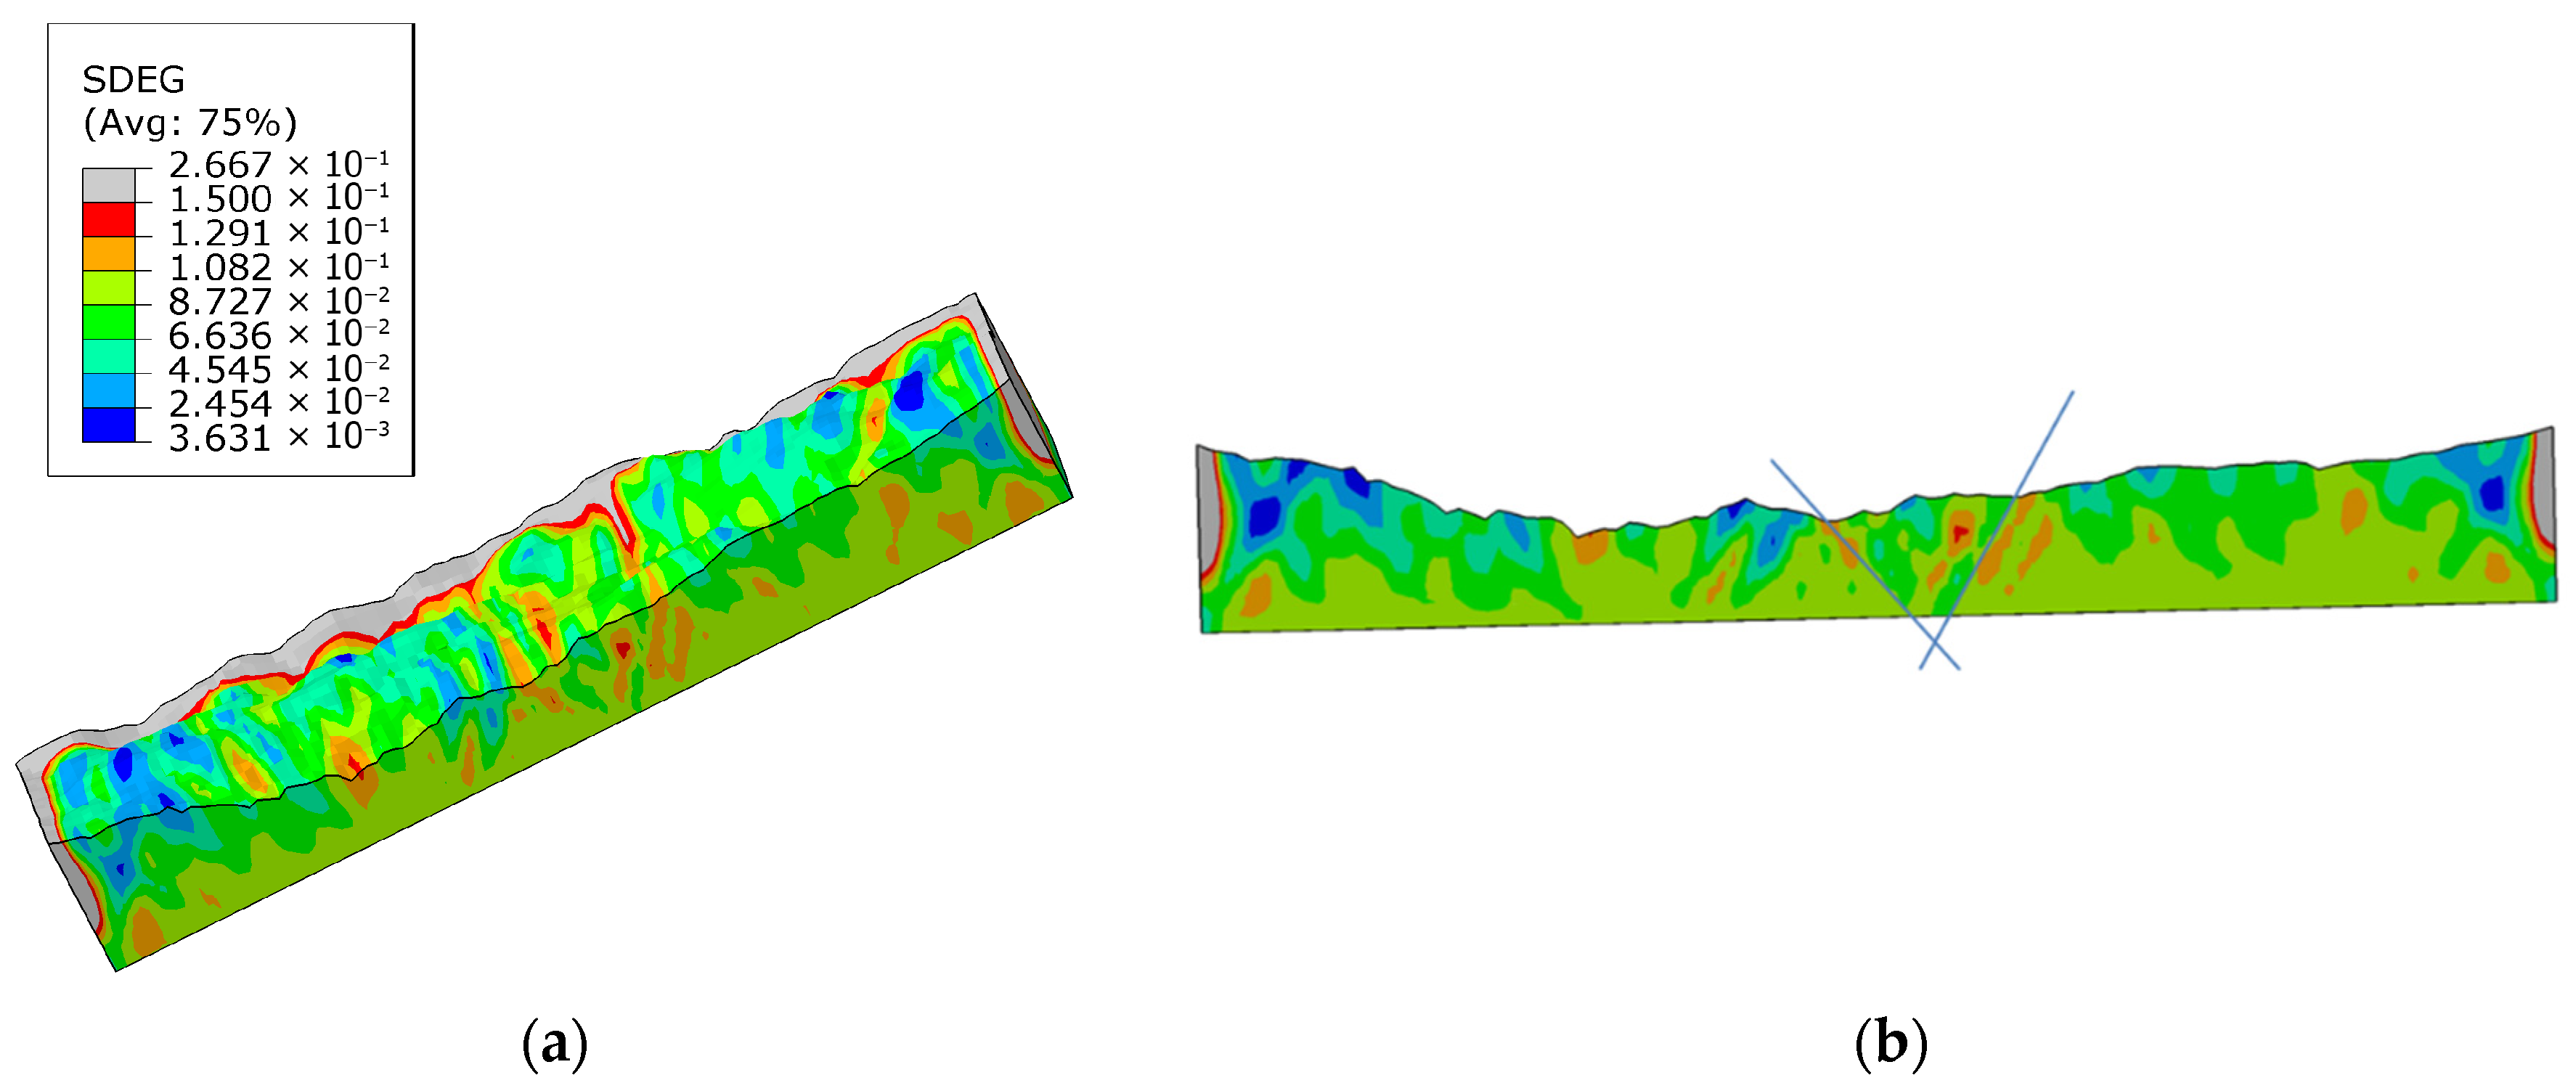
Figure 5 illustrates the distribution of natural fractures in the form of a contour of the SDEG within the buried hill reservoir during the first-stage orogenic movement (extensional rifting). The left panel (Figure 5a) displays a cut-view of the contour of the SDEG of half of the 3D block model, while the right panel (Figure 5b) shows the cross-sectional profile of the contour of the SDEG. The distribution of continuum damage exhibits an inverted triangular geometry formed by rifting processes, which is consistent with geological interpretations of extensional basin evolution.
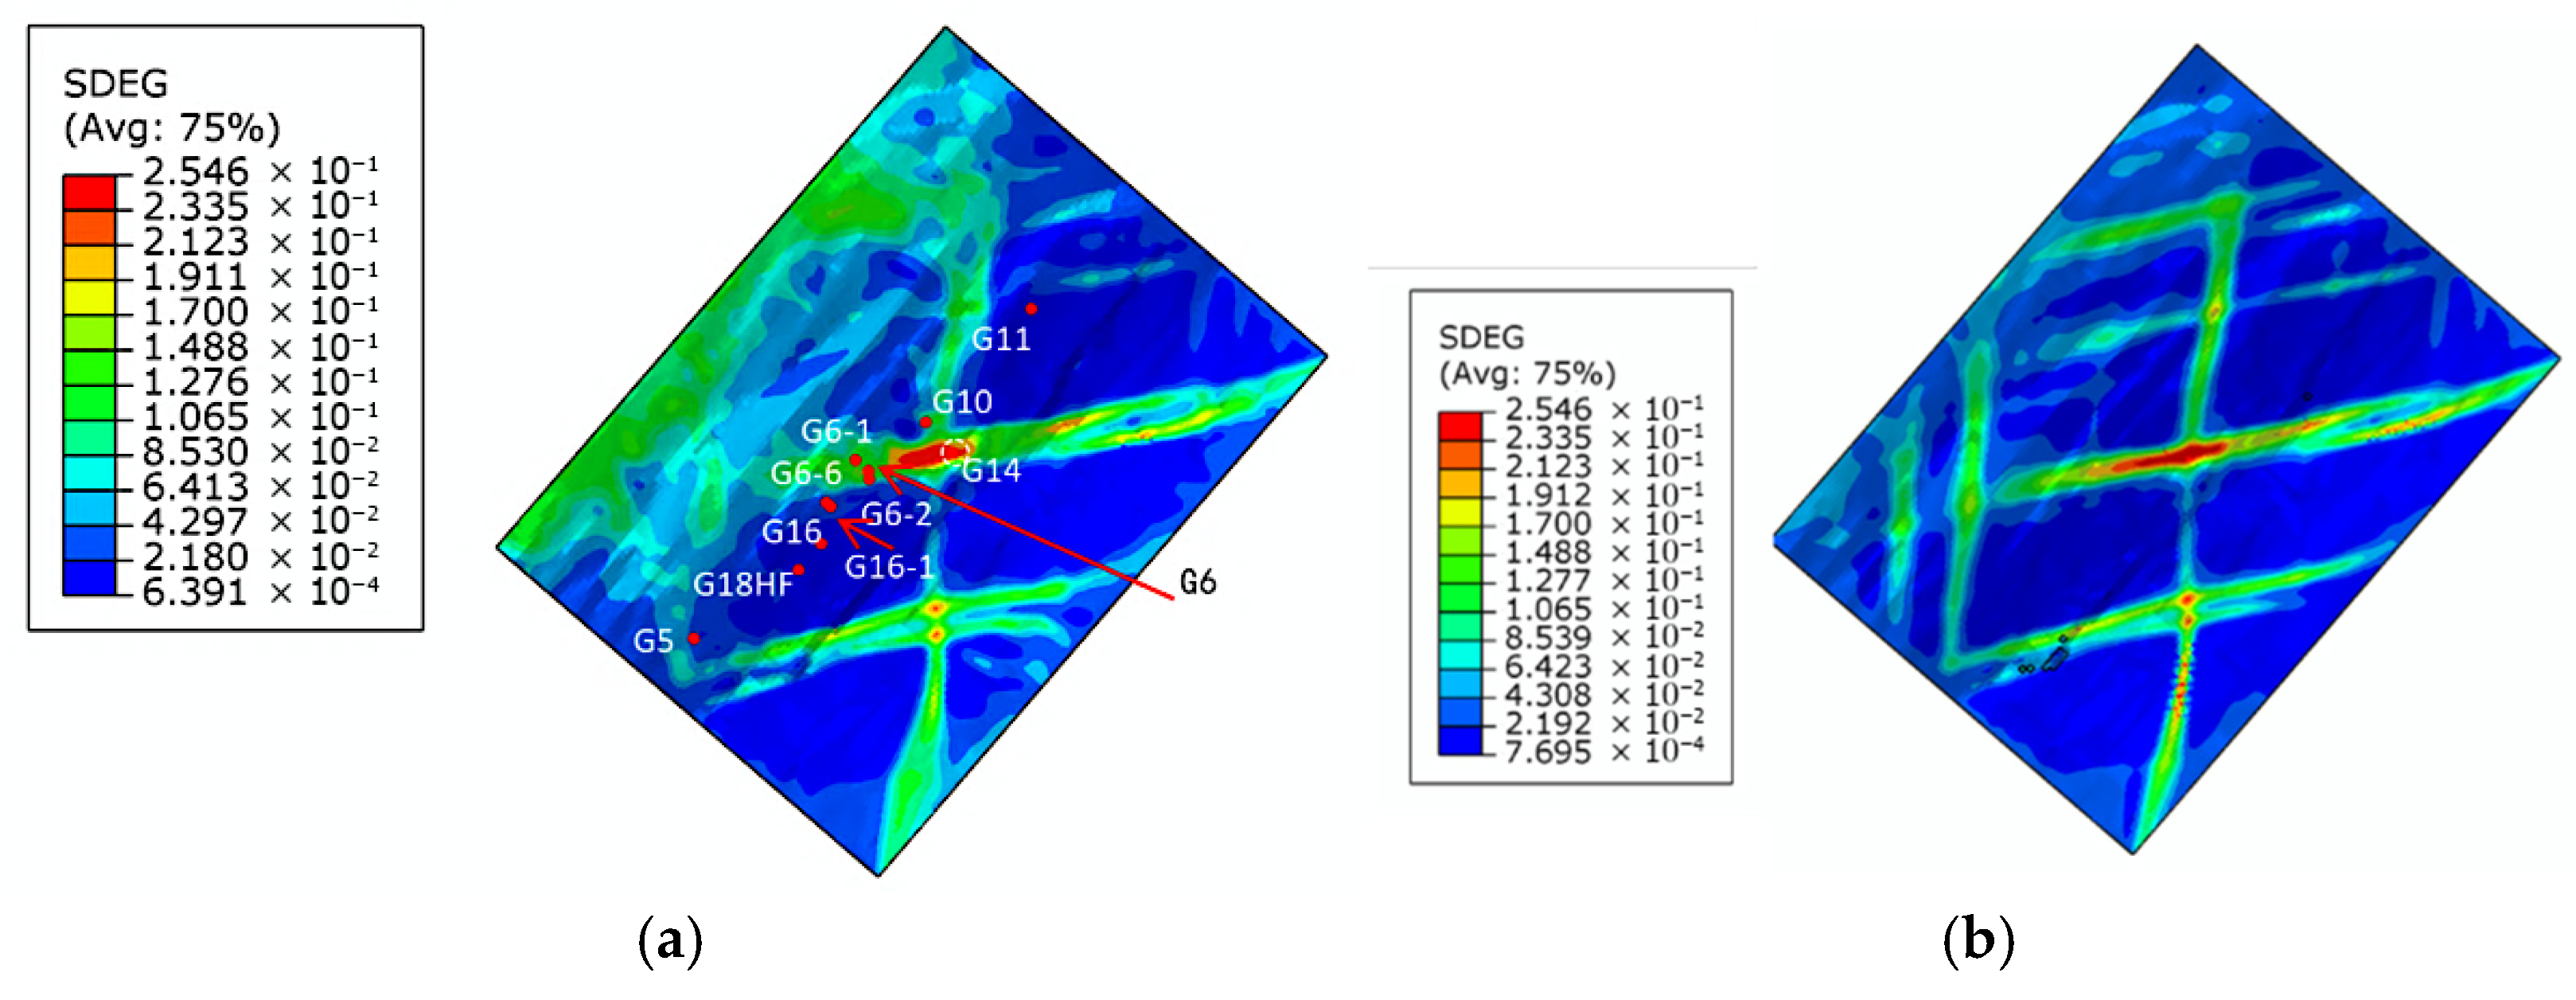
Figure 6 presents the results of natural fracture damage zones generated by multi-stage orogenic events (initial rifting followed by compressional tectonism): (a) damage distribution contours on the buried hill surface; (b) distribution of natural fracture damage zones across the surface 600 m below the surface of the buried hill.
Figure 7 presents the contour of the damage variable and the fracture density profiles along the element column at Target A of existing wells.
Key observations from Figure 6 and Figure 7 include the following:
(1)
Three primary damage zones are identified on the buried hill surface: two E–W trending zones and one N–S trending zone.
(2)
Well G14 is situated at the intersection of the N–S and E–W damage zones, exhibiting the highest fracture intensity (SDEG > 0.25).
(3)
Favorable fracture development occurs at Wells G6, G14, and G5, with moderate fracturing observed at Wells G6-1, G6-2, and G10. Other wells show limited fracture connectivity.
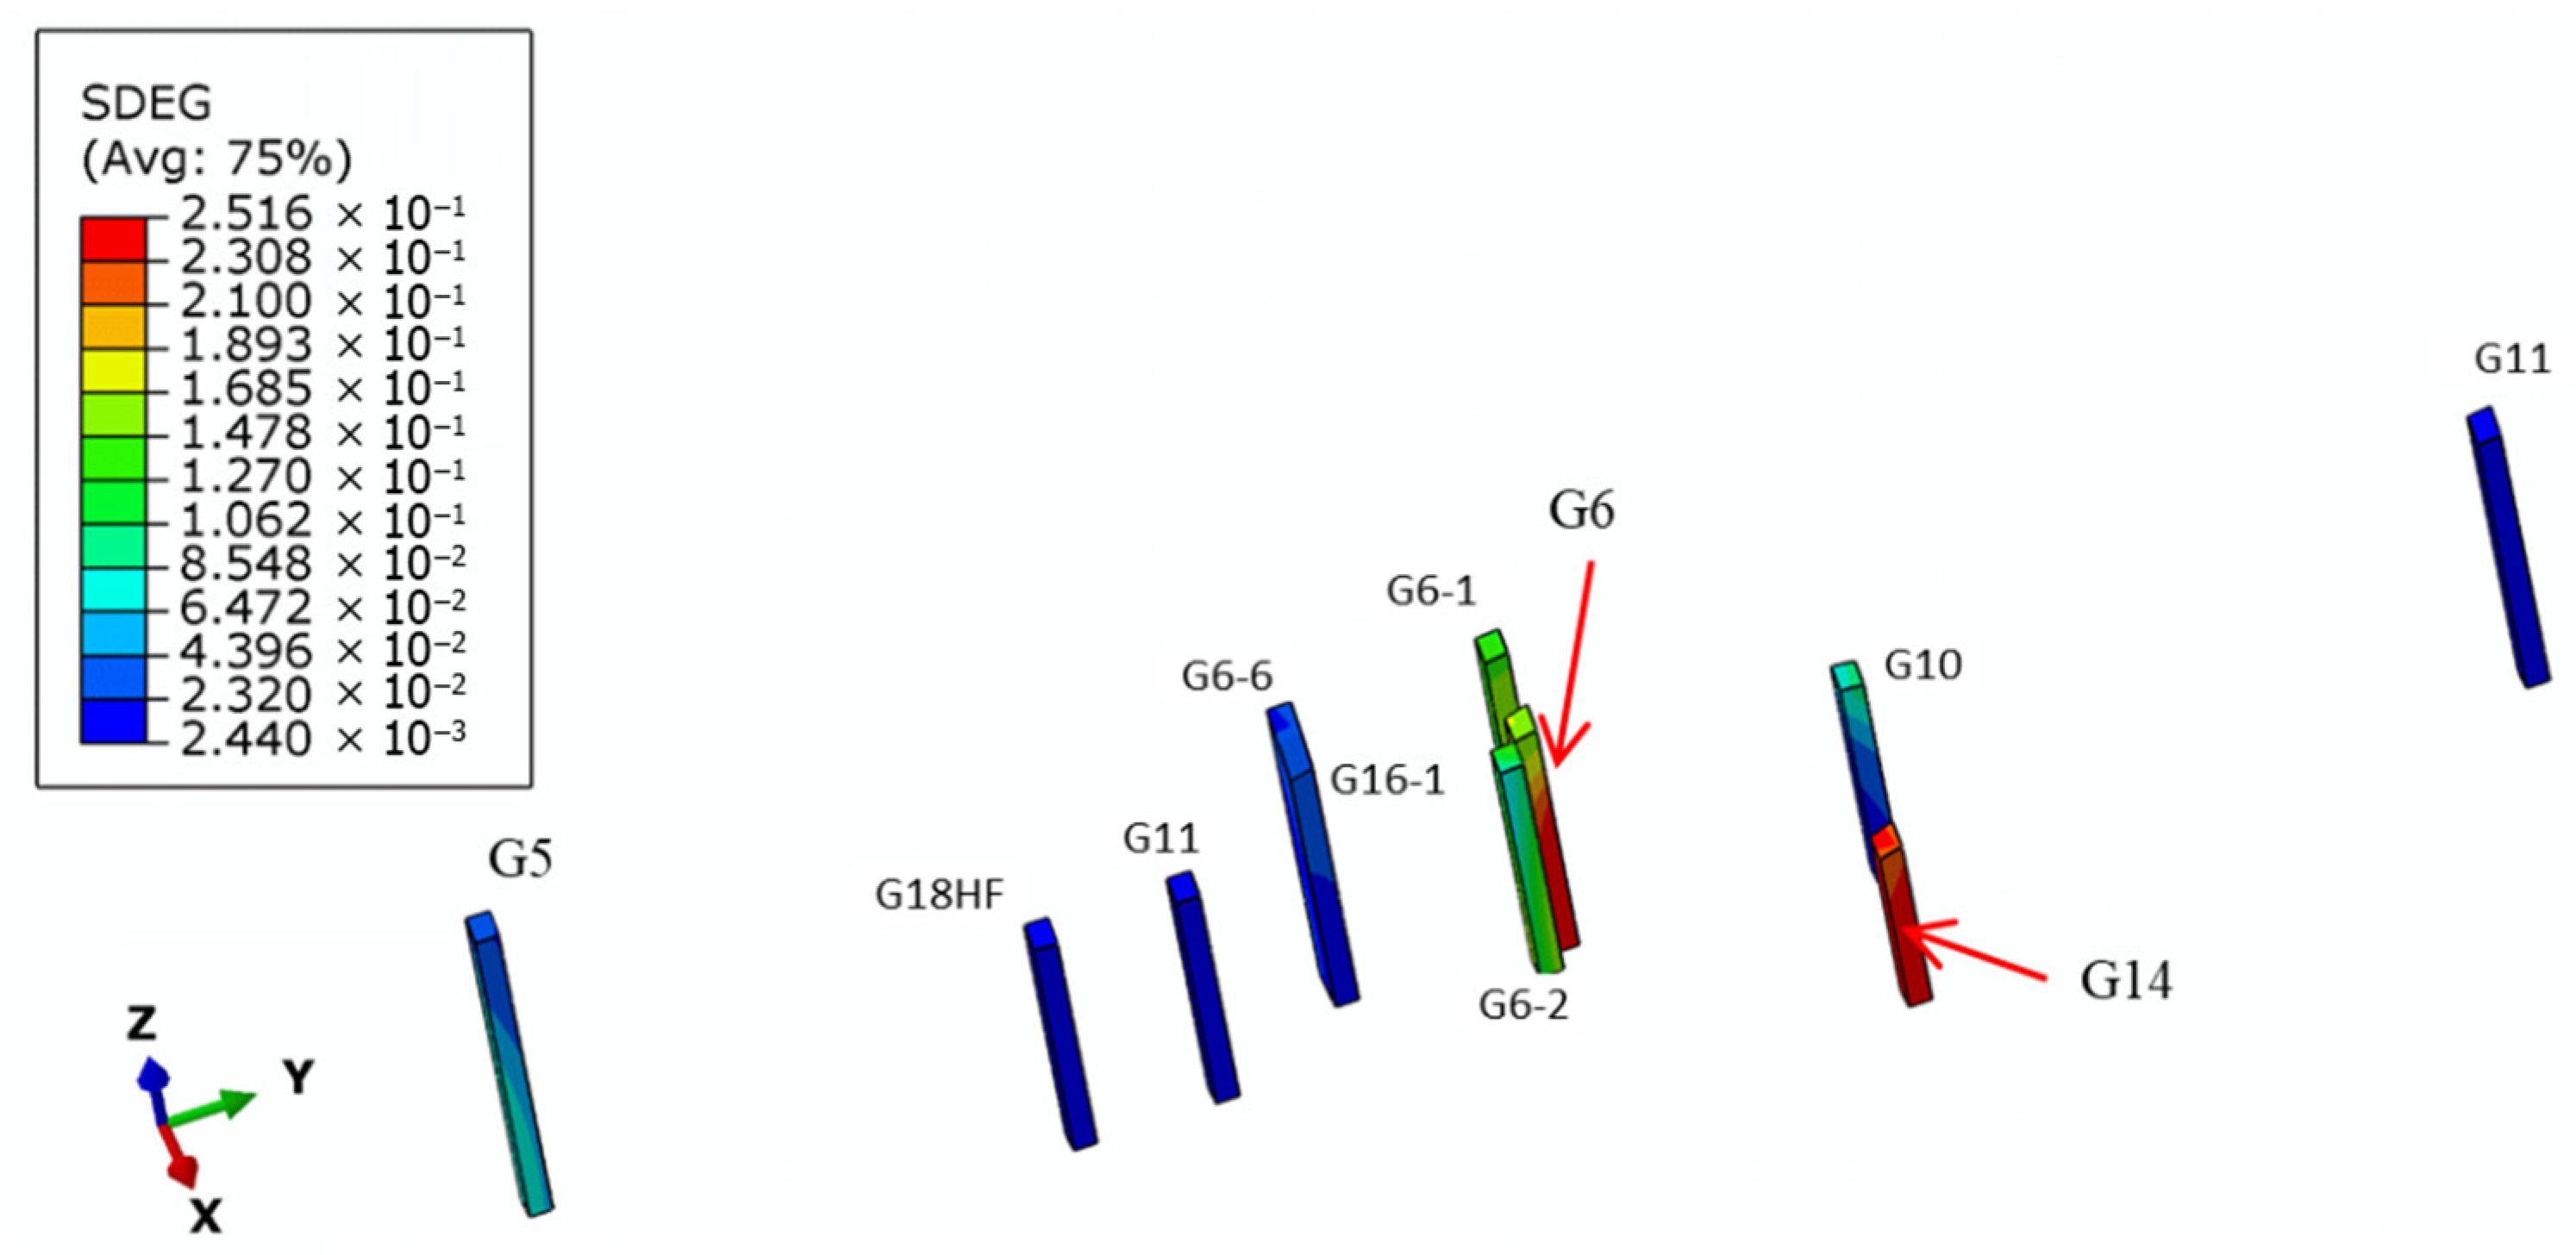
Figure 7. Results of natural fractures/zones of the SDEG generated by multi-stage orogenic events: contour of the SDEG around wells.
Energies 18 04369 g007

3.2. Comparison Between the Numerical Results and the Well Logging Analysis Results of Natural Fractures

The criteria for evaluating the development degree of natural fractures within the target range based on numerical solutions are defined as follows:
(1)
Damage value < 0.05: Natural fractures are underdeveloped.
(2)
0.05 ≤ Damage value ≤ 0.1: Natural fractures exhibit moderate development.
(3)
0.1 < Damage value ≤ 0.15: Natural fractures show good development.
(4)
Damage value > 0.15: Natural fractures are highly developed.
The purpose of this set of criteria is for comparison between the results of natural fractures obtained from numerical calculations with the those obtained from a single well’s logging interpretation. Thess criteria are proposed using an empirical method. More rigorous calibration will be carried out in the future with methods such as numerical tests, single-well logging interpretation, and lab tests.
The natural fracture interpretation results from the single-well logging analysis are quantified using the metric of “fracture segments”, where each segment represents a discrete fracture interval with lengths ranging from 1 to 3 m, predominantly measuring less than 2 m. The criteria for evaluating natural fracture development based on the well logging interpretation results are defined as follows:
(1)
If there are ≤1 segments of Class III fracture or no fractures, natural fractures are underdeveloped;
(2)
If there are 3–5 segments of Class III fractures or the presence of Class II fractures, natural fractures exhibit moderate development;
(3)
If there are 5–10 segments of Class III fractures or the presence of Class II fractures, natural fractures show good development;
(4)
If there are >10 segments of Class III fractures, natural fractures are well developed.
The principle of natural fracture interpretation through well logging analysis involves multivariate computation, where four key logging curves are comprehensively analyzed to derive four petrophysical parameters. The logging curves used are the following:
  • Sonic logging, compensated neutron log (CNL), deep laterolog resistivity (LLD), and deep induction resistivity (ILD);
  • The four kinds of resultant petrophysical parameters are oil saturation, formation porosity, permeability, and clay content;
  • This is achieved through a cross-plot matrix approach where each parameter is calculated using weighted combinations of multiple logging responses.
The interpreted lithologies—including hydrocarbon zones, dry layers, Class I/II/III fracture zones, suspicious zones, low-productivity intervals, and hydrocarbon-indicator layers—are then classified using an integrated scoring system based on these computed parameters.
The steps in the procedure of fracture interpretation with single-well logging data are listed as follows:
Step 1: Data preparation and quality control scope: Log depth matching, environmental corrections, and outlier removal.
Step 2: Lithology and brittle interval identification. Method: GR-DEN-CNL cross-plots for lithology discrimination. Focus: Targeting brittle, low-clay intervals (e.g., carbonates, quartz-rich sandstones).
Step 3: Conventional log response analysis. Baseline establishment: Determining background values for resistivity and sonic transit time in homogeneous, non-fractured intervals (e.g., massive shale or tight limestone).
Step 4: Exclusion of false signals. Differentiating fractures from matrix porosity effects. Eliminating clay/mechanical washout interference.
Step 5: Semi-quantitative evaluation. Methodology: The Tri-Porosity Difference Method is used to calculate the porosity of nature fractures:
φf ≈ (φN + φD)/2 − φS
where φN = neutron porosity; φD = density porosity; φS = sonic porosity.
Step 6: Multi-Source Validation and Fracture Classification. Classification criteria are:
  • Category I: φf ≥ 0.15 (major fractures);
  • Category II: 0.1 ≤ φf < 0.15 (moderate fractures);
  • Category III: 0.05 <φf < 0.1.
If φf < 0.05, they are negligible fractures and are excluded from analysis.
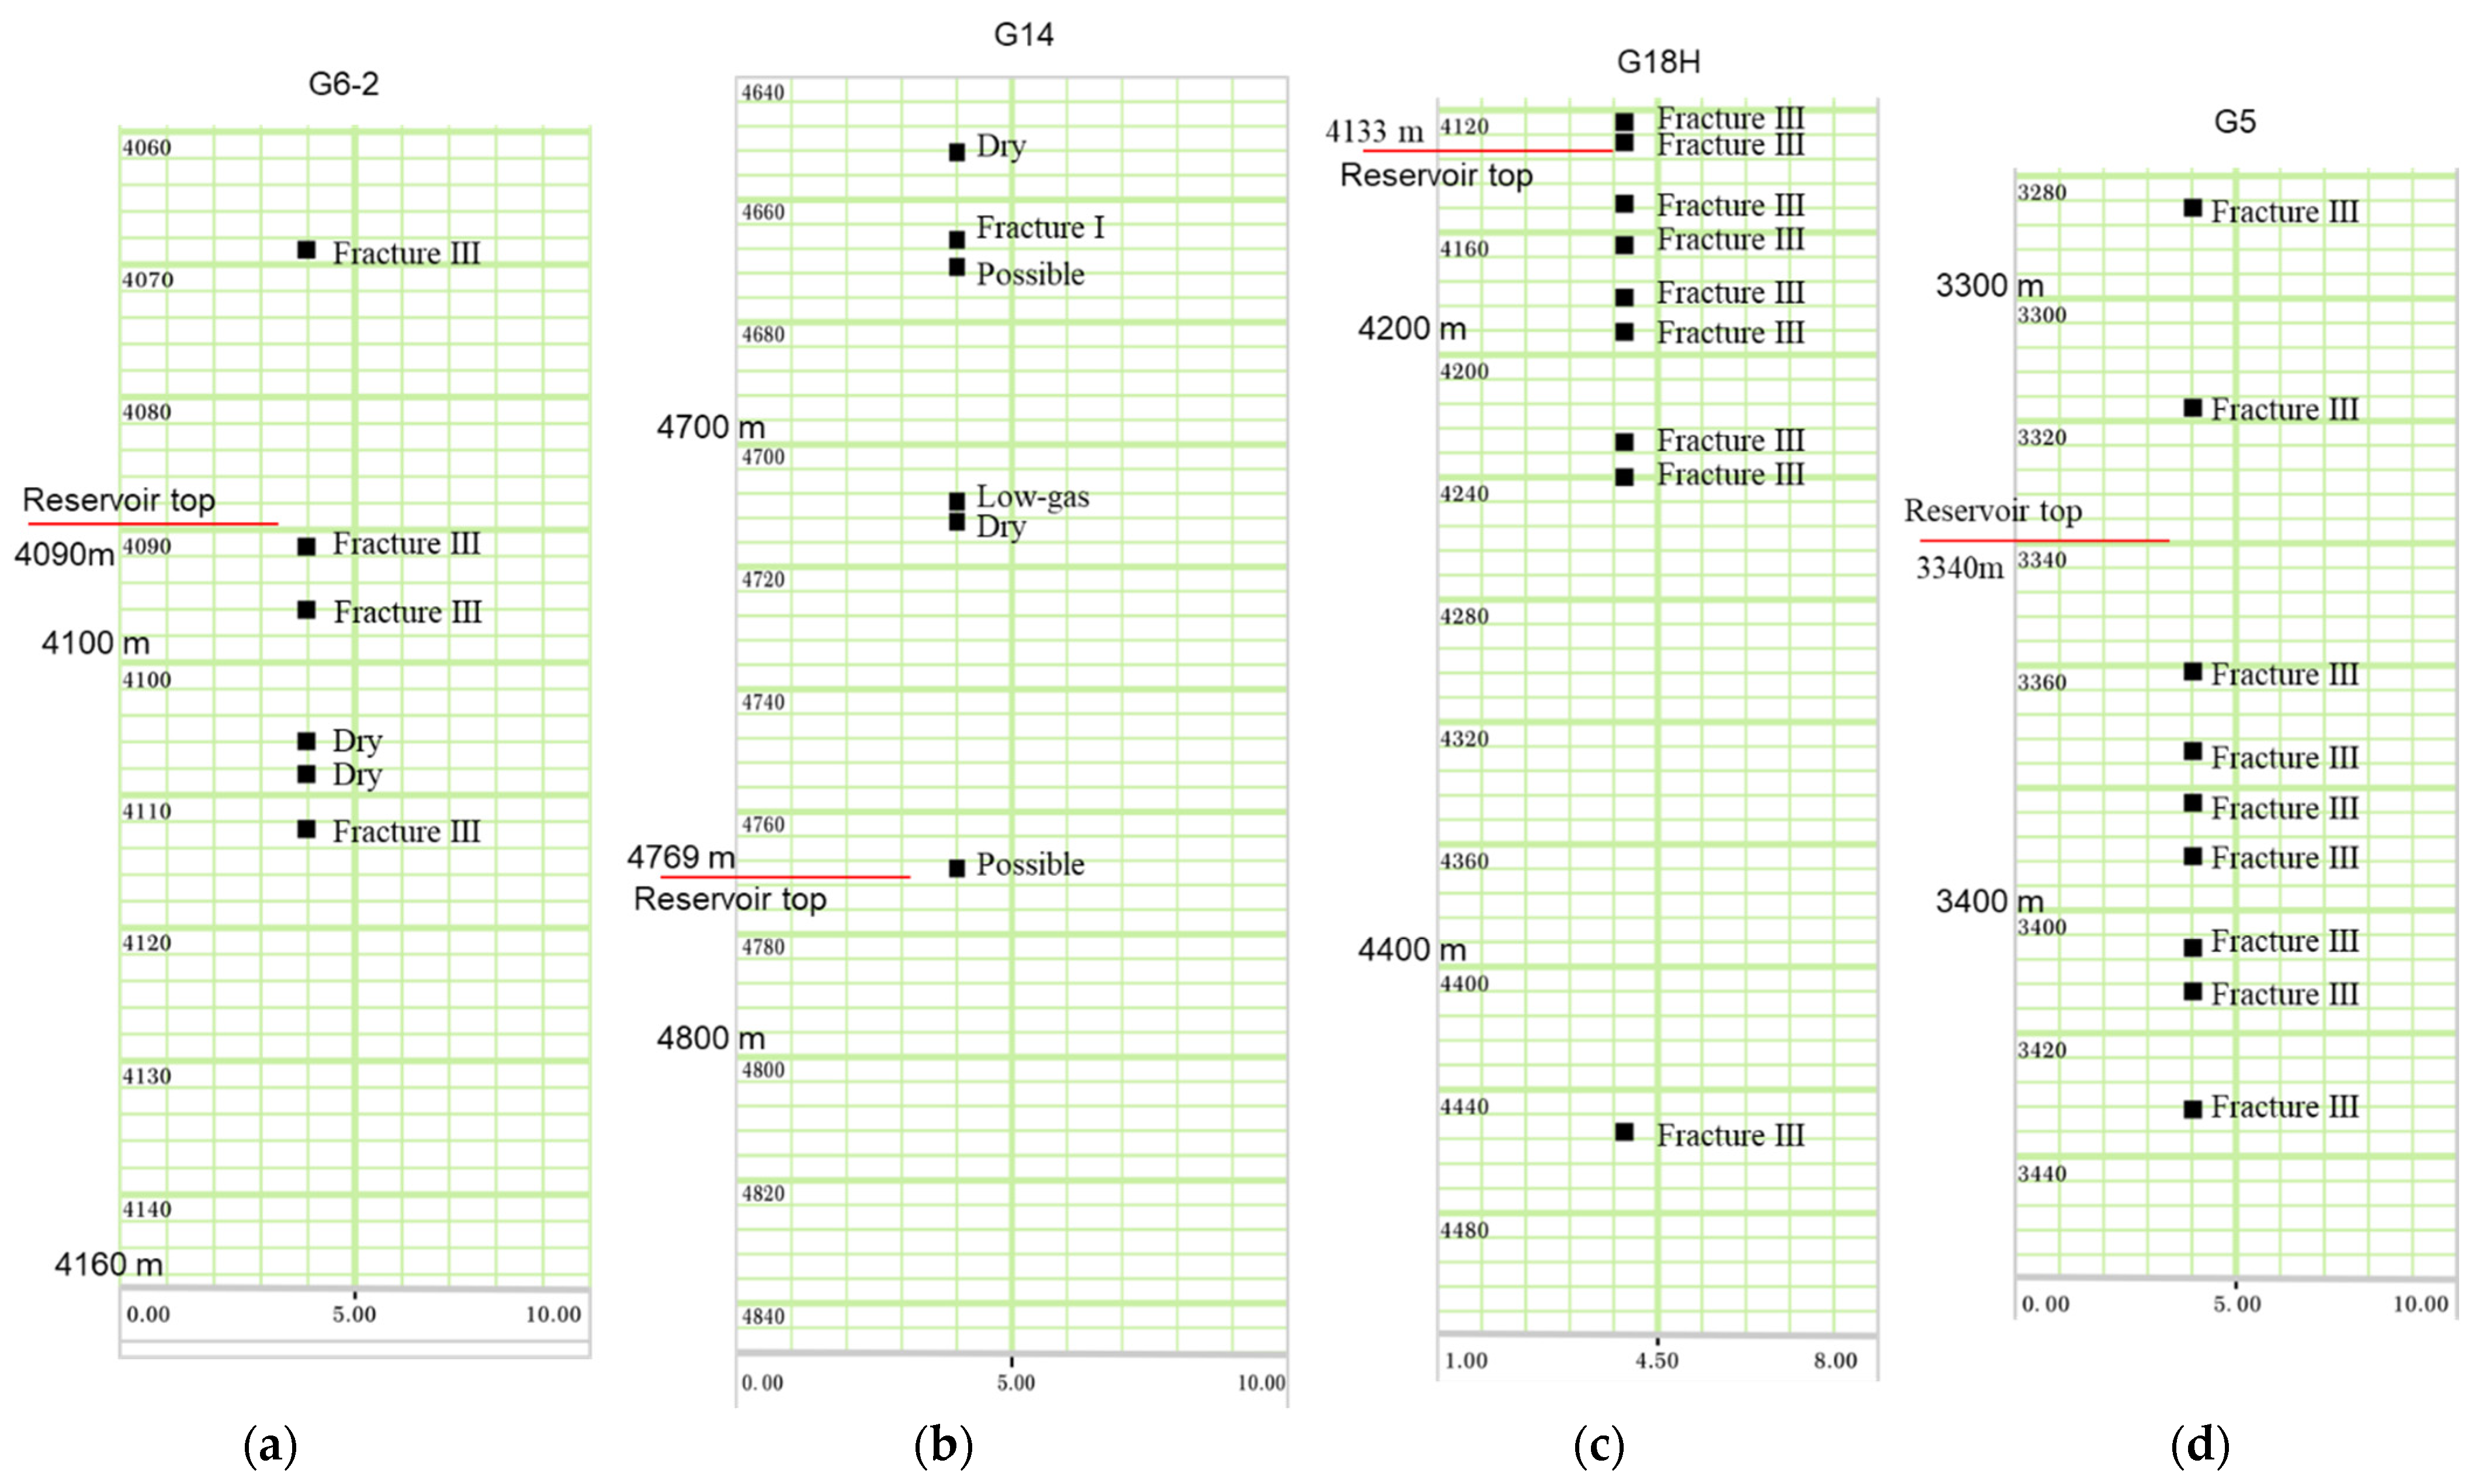
Figure 8 presents the interpretation results of natural fractures from well logging for four individual wells. Figure 9 shows the contour of the damage variable SDEG in the cross-section along the trajectories of these four wells. Because Wells G6-2, G14, and G18H are inclined wells and G5 is a vertical well, the sectional visualization of the SDEG’s contour for the first three wells is performed with the Petrel 2020 software, and that for G5 is performed with the Abaqus 2022 software.
Specifically, Figure 8a displays the logging interpretation results of the natural fractures for Well G6-2, while Figure 9a illustrates the distribution of the finite element numerical solution of the damage variable SDEG along the trajectory of Well G6-2. The numerical solution indicates that the value of SDEG along the well trajectory is approximately 0.07, with its natural fracture density being classified as moderately low. Target Point A at 4100 m is located at the edge of a locally favorable zone of natural fractures at the same depth. Higher-density natural fractures are distributed to the left of this position. The well logging interpretation results of natural fractures reveal that dry layers dominate the interval from 3660 to 4050 m, with only one segment of Class III fractures present between 4060 and 4110 m. One segment of fractures is situated right on the top surface of buried hill reservoir, which is at 4091 m. Within the buried hill reservoir below 4091 m, only two segments of Class III fractures are identified, and all intervals below 4140 m are dry layers. The fracture density remains moderately low throughout. These findings demonstrate consistency between the numerical solutions for natural fractures and the logging interpretation results in Well G6-2.
Figure 8b presents the interpretation results of natural fractures from well logging for Well G14. Figure 9b shows the contour of damage variable SDEG in the cross-section along the trajectories of Well G14. The buried hill surface is at a depth of 4769 ms. The following can be observed from the above figures.
The damage variable of the natural fracture numerical solution for Well G14 reaches 0.17, indicating highly developed natural fractures. The single-well logging interpretation results reveal the presence of well-developed Class I fractures near a depth of 4660 m. The buried hill reservoir lies below 4769 m. The logging interpretation shows the possible presence of oil, representing a potential oil reservoir with good natural fracture development.
Therefore, it can be concluded that the numerical solution of natural fractures and the results of logging interpretation for Well G14 support and are consistent with each other.
Figure 8c presents the interpretation results of natural fractures from well logging for Well G18H. Figure 9c shows the contour of the damage variable SDEG in the cross-section along the trajectories of Well G18H. The top of the buried hill reservoir is situated at 4133 m. The numerical solutions indicate a maximum damage value of 0.04 along the G18H well trajectory, indicating underdeveloped natural fractures. The single-well logging interpretations reveal that there are six segments of Class III natural fractures at 4133–4240 m intervals. This is classified as moderate development of natural fractures. Below 4300 m, there is only one segment of Class III natural fractures identified near the depth of 4450 m, with all other intervals being classified as dry layers that exhibit minimal fracture development. It can, therefore, be concluded that within the upper section of the buried hill reservoir along the G-18HF well trajectory, the numerical solutions for natural fractures show discrepancies with single-well logging interpretations. In contrast, the lower section of the reservoir demonstrates consistent alignment between the numerical solutions and logging interpretation results.
Figure 8d presents the interpretation results of natural fractures from well logging for Well G5. Figure 9d shows the contour of the damage variable SDEG in the cross-section along the trajectories of Well G5. The location of the buried hill formation top is at a depth of 3340 m. The numerical solution of the damage variable SDEG indicates that the value of SDEG along the trajectory of Well G5 reaches 0.2, signifying highly developed natural fractures. The single-well logging interpretation results of natural fractures reveal that nine sets of Class III natural fractures have been identified below the depth of 3340 m, demonstrating good natural fracture development. The numerical solution of SDEG and the logging interpretation results of natural fractures are in good agreement.
Table 2 compares the numerical solutions of natural fractures with the well logging interpretation results for the four aforementioned wells. Based on the comparative analysis of all four wells, the overall consistency rate is 87.5%.
It is important to note that the natural fractures calculated from orogenic movement modeling are tectonic fractures. On top of the buried hill reservoir, fractures consist of both tectonic fractures and weathering-induced fractures. However, fractures derived from orogenic movement calculations do not include weathering-induced fractures. This discrepancy may explain the differences between the numerical solutions of natural fractures and the well logging interpretation results.
Due to the complexity of natural fracture distribution and the inherent mesh dependency of the SDEG numerical results, rigorous quantitative comparison between continuum damage mechanics (CDM) predictions and single-well logging interpretations remains challenging. However, employing a finer mesh in the finite element model improves SDEG solution accuracy, enabling higher-fidelity characterization of natural fracture distribution.

4. Discussion

This study employs models of continuum damage mechanics and finite element numerical simulation technology to establish a workflow for predicting natural fracture distribution in buried hill reservoirs. The methodology was applied to analyze natural fracture distribution in the buried hill reservoir of the G6 well group block. Observations of contours of damage variables that represent the distribution of natural fractures reveal the following.
(1)
Three major zones of natural fracture are identified on the buried hill surface, comprising two east–west trending zones and one north–south trending zone.
(2)
Well G14 is situated at the intersection of the north–south and east–west fracture zones, exhibiting the highest degree of fracturing at this location. The well G6 situated at the place is only the slope close to the well G14.
(3)
Substantial natural fracture development is observed in wells G6, G14, and G5. Moderate fracture distribution occurs in wells G6-1, G6-2, and G10, while other wells demonstrate limited natural fracture development.
By comparing with the results of existing well logging interpretations of natural fractures, this study validated the accuracy of numerical solutions for damage variables for natural fractures in Wells G6-2, G14, G18H, and G5. Comparative analysis of the results of the natural fracture distributions obtained with these two methodologies demonstrates that the fracture distribution patterns derived from numerical solutions align consistently with the results of well logging interpretations, confirming the validity and reliability of the numerical approach.
The research findings indicate that through the integration of 3D continuum damage mechanics modeling with finite element numerical analysis, the spatial distribution of tectonically induced natural fractures can be effectively simulated. The results of natural fractures can include the following:
(1)
Azimuthal orientations of fracture zones;
(2)
Fracture zone widths;
(3)
Fault fragmentation intensity;
(4)
Vertical connectivity characteristics.
The forward modeling technique based on continuum damage mechanics and finite element method proves particularly advantageous in blocks with minor fault displacement (<10 m), where conventional seismic methods cannot resolve fracture systems.

5. Conclusions

By comparison between numerical results of SDEG and the results of natural from single well logging data interpretation, it is found that the natural fractures generated by weathering cannot included in the results of SDEG. This is a weakness of the proposed method. In addition, the closed fractures which are filled with non-permeable materials are also not able to be excluded from the results of SDEG. These two points should be noted when using this proposed method for further application.
In addition, values of SDEG in Table 2 is the maximum value of SDEG from that on the nodal points of the section of well trajectory within buried hill reservoir. This section is usually not very long but just at the value of 100 m or less. Mesh thickness of the element is about 30 m. The distance between 2 points of logging data is about 1 foot. Scale of the Finite Element model and the well trajectory are not the same. Therefore, comparison between density of natural fractures represented by SDEG and the one derived from logging data cannot be point-to-point, but only an qualitative one which averaged over the length of about 100 m which is the length of the well trajectory within the buried hill reservoir.

Author Contributions

Conceptualization, Y.J. and X.S.; methodology, X.S.; software, X.S.; validation, P.G.; formal analysis, W.H.; investigation, J.R.; resources, Y.J.; data curation, W.H.; writing—original draft preparation, Y.J. and X.S.; writing—review and editing, W.H. and X.S.; visualization, P.G. and X.S.; supervision, Y.J.; project administration, W.H.; funding acquisition, Y.J. and X.S. All authors have read and agreed to the published version of the manuscript.

Funding

This research was funded by the National Natural Science Foundation of China, grant number 11272216, through the Project of “Theoretical and experimental Investigation on key mechanical problems in unconventional natural gas exploitation”.

Data Availability Statement

The original contributions presented in this study are included in the article. Further inquiries can be directed to the corresponding author.

Acknowledgments

The authors thank Guoyang Shen for contributing to the development of the user subroutine used in the numerical modeling part presented in this study.

Conflicts of Interest

Author Yunchao Jia, Peng Gao and Jinwei Ren were employed by the company Sinopec Zhongyuan Oilfield Company. The remaining authors declare that the research was conducted in the absence of any commercial or financial relationships that could be construed as a potential conflict of interest.

References

  1. Liu, J.; Peng, G.R.; Zhang, L.L. Genetic mechanisms and classification of paleo-buried hills in the inherited continental margin setting of Baiyun Sag, northern South China Sea. Earth Sci. 2025, 50, 405–418. (In Chinese) [Google Scholar]
  2. Wang, Y.; Wang, B.J.; Deng, H. Structural evolution and genetic mechanisms of buried hills in southern Liaoning area, Bohai Bay Basin. Geotecton. Metallog. 2025, 49, 1–10. (In Chinese) [Google Scholar]
  3. Gao, Z.L.; Li, H.B.; Zhang, L.L. Application of finite element numerical simulation technology to quantitative prediction of buried hill fractures: A case study of Huizhou 26 structure in Huizhou Sag, Pearl River Mouth Basin. Geol. Rev. 2023, 69, 591–602. (In Chinese) [Google Scholar]
  4. Guo, Z.N. Seismic attribute response and fracture prediction in metamorphic rock buried hills. Sci. Technol. Innov. 2021, 27, 142–143. (In Chinese) [Google Scholar]
  5. Li, X.G.; Guo, Y.M.; Cai, G.G.; Zhao, L.M.; Wang, G.W. Reservoir formation conditions and exploration of subtle buried hills in Damintun Sag. Pet. Explor. Dev. 2007, 02, 135–141. (In Chinese) [Google Scholar]
  6. Yi, J.; Li, H.; Shan, X.L.; Hao, G.L.; Yang, H.F.; Wang, Q.B.; Xu, P.; Ren, S. Division and identification of vertical reservoir units n Archaeozoic metamorphic buried hill of Bozhong Sag, Bohai Bay Basin, East China. Petroleum. Explor. Dev. 2022, 49, 1282–1294. [Google Scholar] [CrossRef]
  7. Wang, Z.; Zhang, K.; Cheng, Y.H.; Wu, Q.H. Identification and evaluation of fault-fracture reservoirs in buried hills of the Lower Paleozoic, Chengdao area, China. Energy Geosci. 2023, 4, 100183. [Google Scholar] [CrossRef]
  8. Zhang, X.N.; Yao, Y.B.; Zhang, G.B.; Ma, R.Y.; Wang, Z.F. Natural fractures in a metamorphic buried hill reservoir, Bozhong 19–6 area, Bohai Bay Basin, China. Mar. Pet. Geol. 2023, 155, 106402. [Google Scholar] [CrossRef]
  9. Jin, F.M.; Wang, X.; Li, H.J.; Wu, X.S.; Fu, L.X.; Lou, D.; Zhang, J.N.; Feng, J.Y. Formation of the primary petroleum reservoir in Wumaying inner buried-hill of Huanghua Depression, Bohai Bay Basin, China. Petroleum. Explor. Dev. 2019, 46, 543–552. [Google Scholar] [CrossRef]
  10. Wang, S.; Wang, G.; Lai, J.; Li, D.; Liu, S.C.; Chen, X.; Yang, K.F.; Song, L.T. Logging identification and evaluation of vertical zonation of buried hill in Cambrian dolomite reservoir: A study of Yingmai-Yaha buried hill structural belt, northern Tarim basin. J. Pet. Sci. Eng. 2020, 195, 107758. [Google Scholar] [CrossRef]
  11. Xie, Y.H.; Luo, X.P.; Wang, D.Y.; Xu, C.Q.; Xu, Y.L.; Hou, M.C.; Chen, A.Q. Hydrocarbon accumulation of composite-buried hill reservoirs in the western subsag of Bozhong sag, Bohai Bay Basin. Nat. Gas Ind. B 2019, 6, 546–555. [Google Scholar] [CrossRef]
  12. Xu, C.G.; Yang, H.F.; Wang, F.L.; Peng, I.S. Formation conditions of deep to ultra-deep large composite buried-hill hydrocarbon reservoirs in offshore Bohai Bay Basin, China. Pet. Explor. Dev. 2024, 51, 1421–1434. [Google Scholar] [CrossRef]
  13. Xu, C.G.; Wang, Q.B.; Zhu, H.T.; Liu, X.J.; Feng, C.; Hu, B.; Li, H.; Hao, Y.W.; Jin, X.Y.; Jia, Y. Hydrothermal alteration mechanisms of an Archaean metamorphic buried hill and the models for reservoir zonation, Bozhong depression, Bohai Bay Basin, China. Mar. Pet. Geol. 2024, 164, 106843. [Google Scholar] [CrossRef]
  14. Veeningen, R.; Fall, A.; Böttcher, M.E.; Eichhubl, E.; Decker, K.; Grasemann, B. Deformation and fluid flow history of a fractured basement hydrocarbon reservoir below the Sab’atayn Basin, Habban Field. Yemen. Mar. Pet. Geol. 2024, 169, 107082. [Google Scholar] [CrossRef]
  15. Son, L.N.; Trung, P.N.; Masuda, Y.; Murata, S.; Nguyen, T.D.; Takagi, S.; Ghassemi, A. Development of a method for adjusting rock compaction parameters and aquifer size from production data and its application to Nam-Su fractured basement reservoir of Vietnam. J. Pet. Sci. Eng. 2022, 210, 109894. [Google Scholar] [CrossRef]
  16. Valencia-Gómez, J.C.; Cardona, A.; Zapata, S.; Monsalve, G.; Marín, D.; Rodríguez-Cuevas, M.; Sobel, E.R.; Parra, M.; Glodny, J. Fracture analysis and low-temperature thermochronology of faulted Jurassic igneous rocks in the Southern Colombian Andes: Reservoir and tectonic implications. Mar. Pet. Geol. 2024, 165, 106850. [Google Scholar] [CrossRef]
  17. Pantaleone, S.; Bhattacharya, S. Hydrologic and geomechanical characterization of deep sedimentary rocks and basement for safe carbon sequestration in the Cook Inlet Basin, Alaska. Int. J. Greenh. Gas Control. 2021, 106, 103243. [Google Scholar] [CrossRef]
  18. Ziaie, M.; Takmili, A.; Sadeghnejad, S.; Hakimzadeh, M. Integrated geomechanical analysis of shear failure wellbore instability in abnormal and normal pore pressure zones using diverse input data: A case study. Ore Energy Resour. Geol. 2025, 18, 100093. [Google Scholar] [CrossRef]
  19. Cao, Y.L.; Feng, B.; Cui, Z.P.; Duan, X.F.; Zhao, L.C. Numerical simulation study of segmented hydraulic fracturing in horizontal wells of fractured hot dry rocks, at the U.S. FORGE site. Geoenergy Sci. Eng. 2025, 249, 213790. [Google Scholar] [CrossRef]
  20. Vazic, E.C.; Bryant, K.C.B. Single objective optimization for modeling elastoplastic damage of rock. Int. J. Rock Mech. Min. Sci. 2025, 186, 106034. [Google Scholar] [CrossRef]
  21. Shen, X.P.; Yang, L. Concrete Damage Theory and Experiments, 1st ed.; Science Press: Beijing, China, 2009. [Google Scholar]
  22. Dassault Systèmes Simulia Corp. Abaqus user’s manual, 2: Analysis, Version 6.10; Dassault Systems: Vélizy-Villacoublay, France, 2010. [Google Scholar]
  23. Lee, J.; Fenves, G.L. Plastic-damage model for cyclic loading of concrete structures. ASCE J. Eng. Mech. 1998, 124, 892–900. [Google Scholar] [CrossRef]
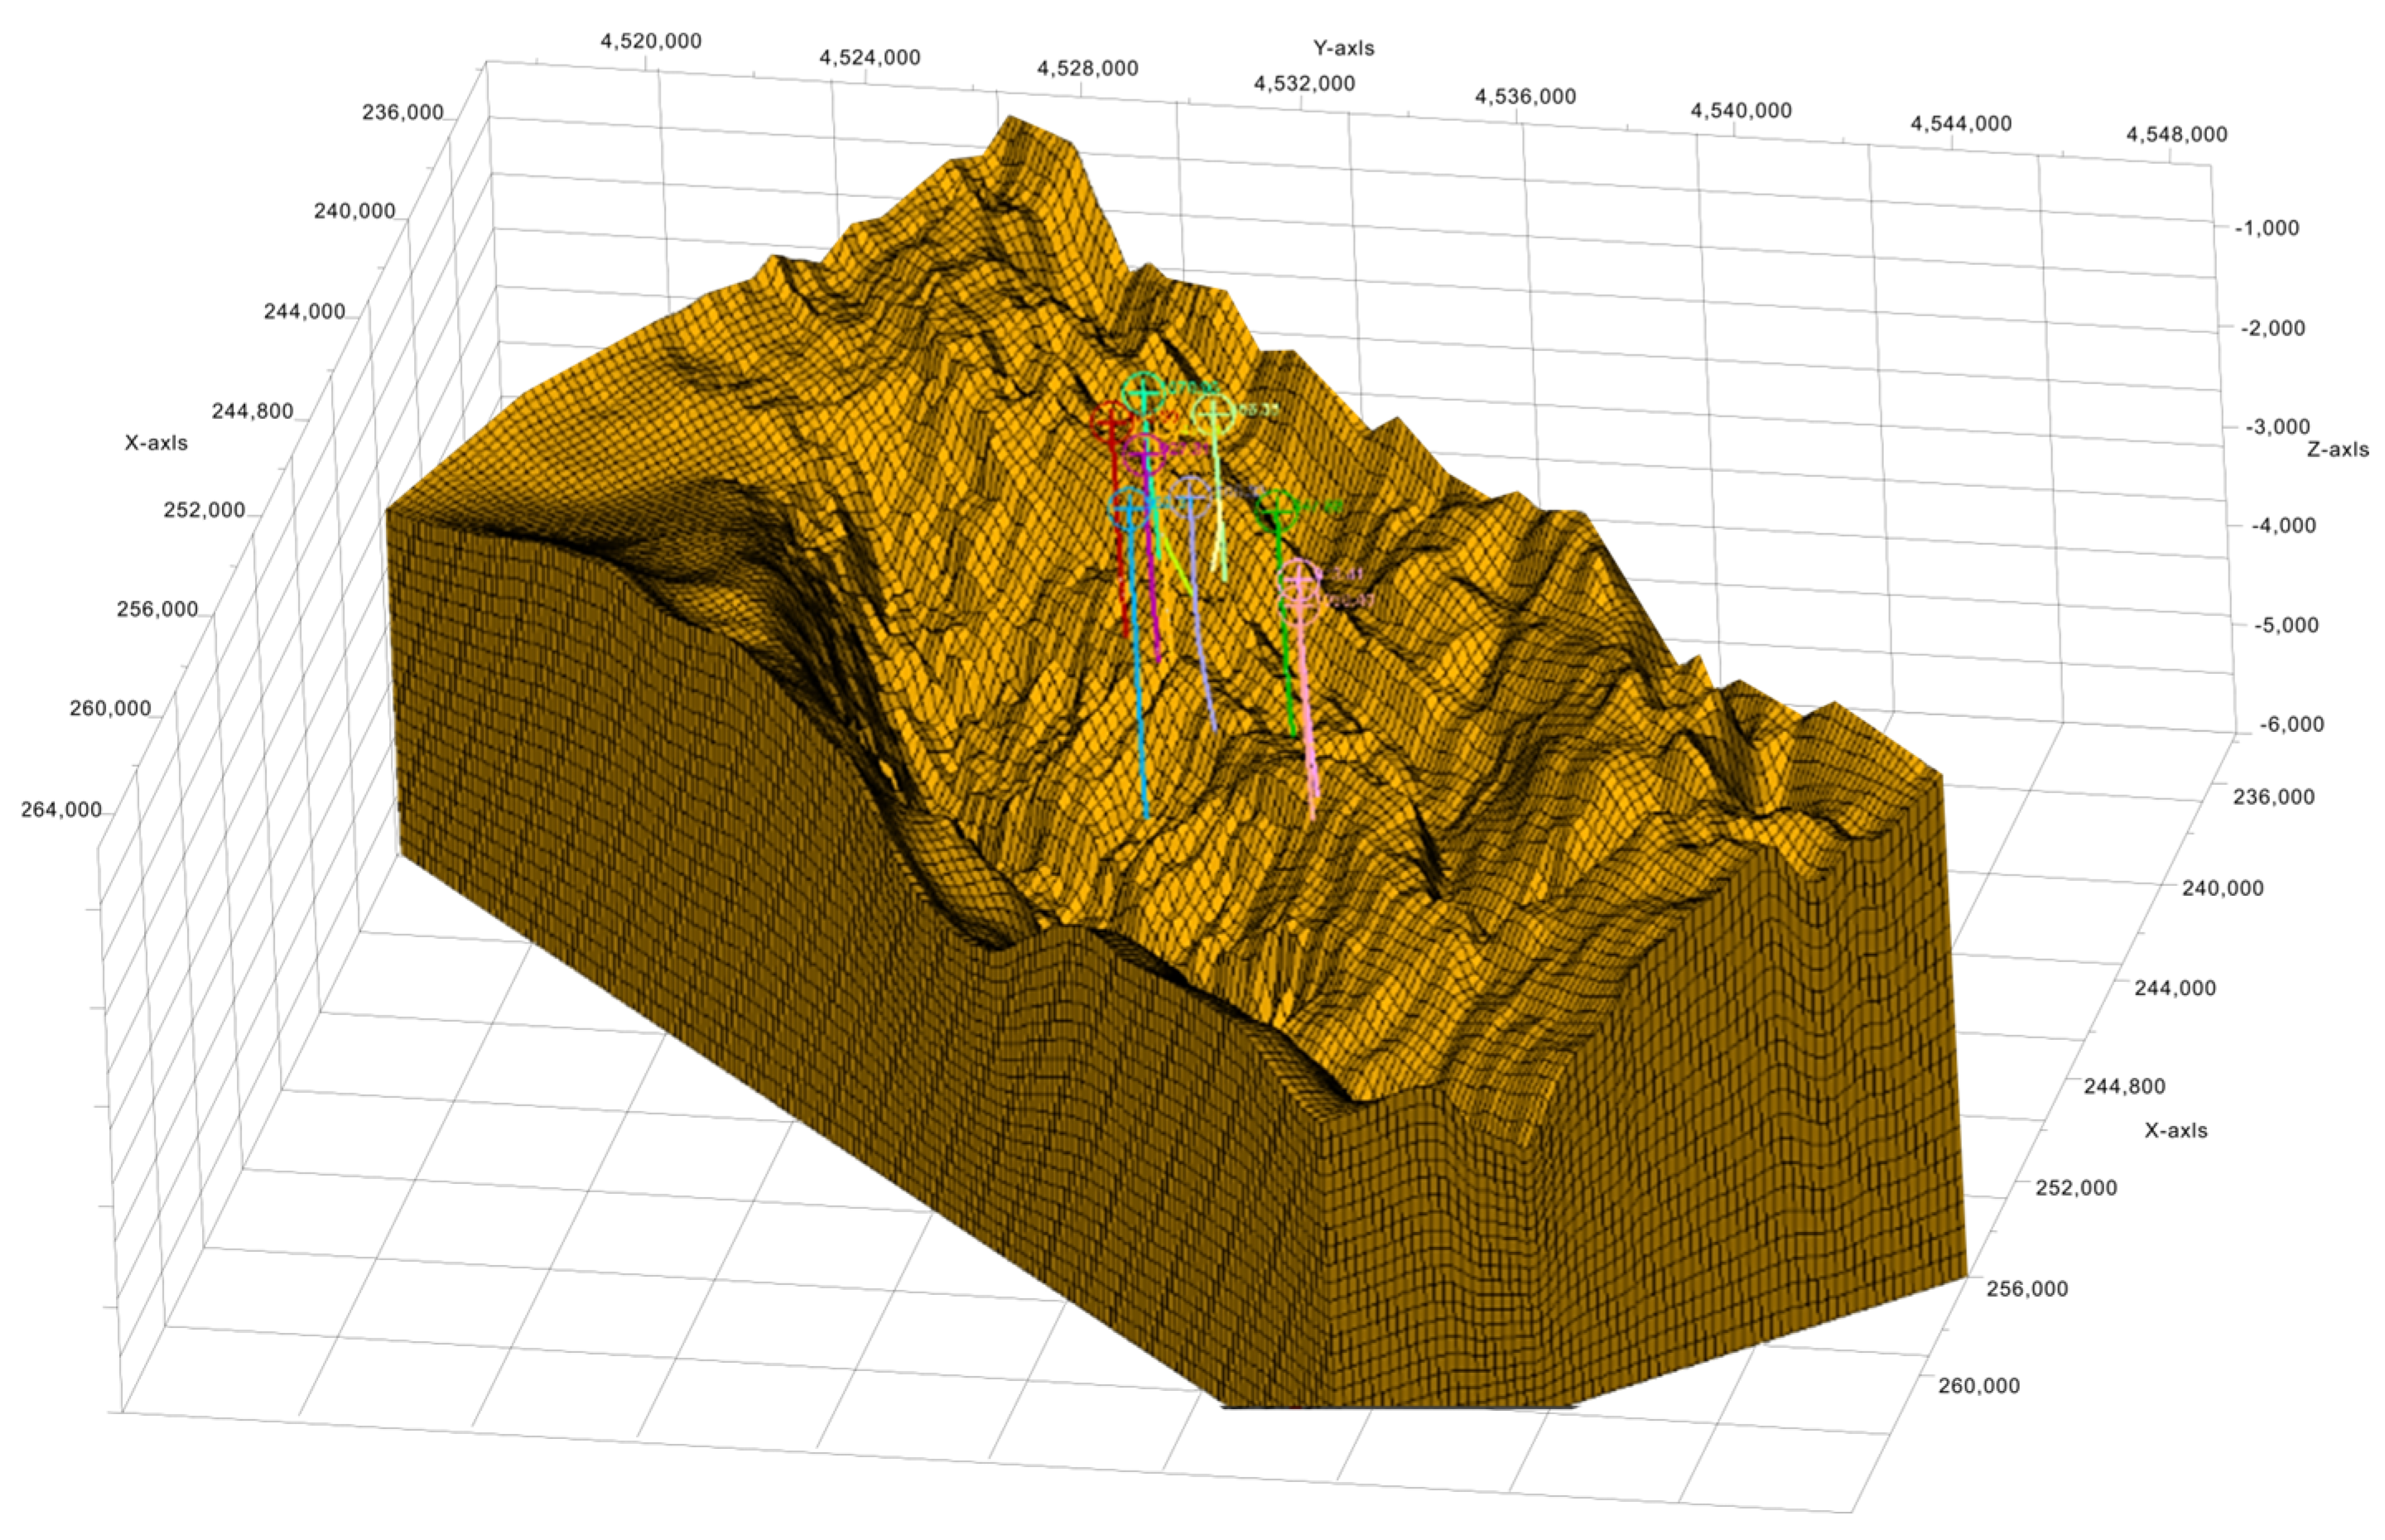
Figure 1. The mesh of the geological model of the buried hill reservoir.
Energies 18 04369 g001
Figure 2. Fault line distribution based on seismic data.
Energies 18 04369 g002
Figure 3. Distribution map of G-type conjugate joints developed in syenogranite outcrops.
Energies 18 04369 g003
Figure 5. Distribution of natural fractures/the contour of the SDEG during the extensional rifting process. (a) Cross sectional view in NE-SW direction; (b) Cross sectional view in NW-SE direction.
Energies 18 04369 g005
Figure 6. Results of natural fractures/the contour of the SDEG generated by multi-stage orogenic events: plane view. (a) Distribution of natural fractures/the contour of the SDEG across the buried hill surface. (b) Distribution of natural fractures/the contour of the SDEG across the surface 600 m below the surface of the buried hill.
Energies 18 04369 g006
Figure 8. Interpretation results of natural fractures from well logging for four wells. (a) Well G6-2; (b) G14; (c) G16H; (d) G5.
Energies 18 04369 g008
Figure 9. Contour of the damage variable SDEG in the cross-section along the trajectories of these four wells. (a) Well G6-2; (b) G14; (c) G16H; (d) G5.
Energies 18 04369 g009
Table 1. Values of rock properties.
Formation TypeYoung’s Modulus/GPaPoisson’s Ratio
Top layer150.21
cretaceous K1b Formation200.23
Buried hill reservoir250.22
Table 2. Comparison between numerical solutions of natural fractures with the well logging interpretation results.
Well G6-2Well G14Well G18HWell G5
Numerical SolutionSDEG value ≈ 0.07: Natural fractures are moderately underdeveloped.SDEG value reaches 0.17: Natural fractures are well developed.Maximum value of SDEG = 0.04: Natural fractures are underdeveloped.Maximum SDEG value = 0.2: Natural fractures are highly developed.
Well Interpretation ResultsBelow 4090 m, only two Class III fractures exist in the buried hill reservoir; below 4140 m, all layers are dry. Fracture density is moderately low.Well-developed Class I fractures near 4660 m. The buried hill reservoir lies below 4769 m. Logging interpretation shows possible oil existence, representing a potential oil reservoir with good natural fracture development.Upper section (4133–4240 m): Six natural fractures identified; fractures are well developed.
Lower section: Only one Class III natural fracture near 4450 m; other intervals are dry, indicating underdeveloped natural fractures.
Nine sets of Class III natural fractures have been identified below 3340 m, demonstrating good natural fracture development
ComplianceGood complianceGood compliance50% compliance (upper section non-compliant, lower section compliant).Good compliance
Disclaimer/Publisher’s Note: The statements, opinions and data contained in all publications are solely those of the individual author(s) and contributor(s) and not of MDPI and/or the editor(s). MDPI and/or the editor(s) disclaim responsibility for any injury to people or property resulting from any ideas, methods, instructions or products referred to in the content.