Abstract
In this study, a 3D model is developed to simulate multi-hole leakage scenarios in buried pipelines transporting hydrogen-blended natural gas (HBNG). By introducing three parameters—the First Dangerous Time (FDT), Ground Dangerous Range (GDR), and Farthest Dangerous Distance (FDD)—to characterize the diffusion hazard of the gas mixture, this study further analyzes the effects of the number of leakage holes, hole spacing, hydrogen blending ratio (HBR), and soil porosity on the diffusion hazard of the gas mixture during leakage. Results indicate that gas leakage exhibits three distinct phases: initial independent diffusion, followed by an intersecting accelerated diffusion stage, and culminating in a unified-source diffusion. Hydrogen exhibits the first two phases, whereas methane undergoes all three and dominates the GDR. Concentration gradients for multi-hole leakage demonstrate similarities to single-hole scenarios, but multi-hole leakage presents significantly higher hazards. When the inter-hole spacing is small, diffusion characteristics converge with those of single-hole leakage. Increasing HBR only affects the gas concentration distribution near the leakage hole, with minimal impact on the overall ground danger evolution. Conversely, variations in soil porosity substantially impact leakage-induced hazards. The outcomes of this study will support leakage monitoring and emergency management of HBNG pipelines.
1. Introduction
Against the backdrop of global socio-economic development, widespread reliance on fossil fuels has not only accelerated resource depletion but also generated substantial greenhouse gas emissions, driving unprecedented increases in global temperatures [1]. Following the ratification of the Paris Agreement, governments worldwide have intensified efforts to deploy clean energy technologies, aiming to achieve carbon peak and neutrality targets [2]. Among clean energy alternatives, hydrogen energy has emerged as one of the most promising energy carriers due to its high calorific value, pollution-free combustion, and zero carbon emissions [3,4,5].
Long-distance hydrogen transportation encompasses pipeline transport, liquid hydrogen transport, hydrogen carrier transport, and solid-state hydrogen storage transport. Pipeline transport is a compelling solution for large-scale hydrogen deployment [6], offering advantages including low cost, operational continuity, and high efficiency. However, as dedicated pure-hydrogen pipeline networks remain in the nascent development phase, blending hydrogen into existing natural gas pipelines emerges as a transitional strategy, offering substantial economic and temporal efficiency [7]. Marking a national milestone, China commissioned its first high-pressure natural gas transmission pipeline with hydrogen-blending capability in 2024. This method concurrently leverages the established natural gas pipeline infrastructure and its comprehensive operational frameworks, thereby providing critical foundational support for the burgeoning hydrogen industry.
The safety of traditional oil and gas pipelines has reached a well-established research stage, as evidenced by comprehensive studies [8,9,10]. Nevertheless, the introduction of hydrogen into natural gas infrastructure presents emerging safety challenges that require systematic investigation [11]. This dual-threat scenario manifests through distinct mechanisms: First, hydrogen permeation into pipeline microstructures accelerates hydrogen embrittlement (HE), degrading mechanical integrity and increasing leakage probability [12,13]. Second, hydrogen’s lower minimum ignition energy (0.02 mJ vs. methane’s 0.29 mJ) and reduced Lower Explosive Limit (LEL) significantly increase both the probability of ignition following leakage and subsequent explosion severity [14,15]. Consequently, quantifying leakage diffusion dynamics in hydrogen-blended natural gas (HBNG) transmission pipelines is critical for operational integrity management and risk mitigation strategies.
Research on leakage diffusion characteristics in buried natural gas pipelines has evolved over decades. Montiel et al. [16] developed a mathematical model predicting gas release rates and duration from damaged pipelines in medium-to-low pressure distribution systems, accommodating scenarios ranging from pinhole leaks to full-bore ruptures. Through large-scale experimental studies, Yan et al. [17] and Okamoto et al. [18] characterized subsurface gas diffusion behavior, validating numerical modeling approaches. Ebrahimi-Moghadam et al. [19] established correlation equations via numerical simulation to quantify leakage rates in urban gas networks, proposing novel predictive formulas. Complementary experiments examined gas leakage impacts on soil matrix structural integrity in high-pressure pipelines [20,21]. Given the prohibitive costs of physical test setups, recent advances in CAE technologies have facilitated computational fluid dynamics (CFD) investigations into leakage diffusion dynamics [22,23]. These approaches enable systematic parametric analyses of subsurface gas pipeline leakage behavior [24,25,26].
Compared with research on natural gas pipelines, studies concerning leakage and diffusion in HBNG pipelines remain underdeveloped. Zhu et al. [27] established a large-scale experimental system to investigate leakage diffusion behavior and concentration distribution of hydrogen-natural gas mixtures under various release conditions, quantifying the relationship between hydrogen concentration and the diffusion distance to the LEL. Xia et al. [28,29] developed a multi-phase coupled numerical model revealing dynamic evolution patterns of leakage in buried HBNG pipelines, further examining hazard progression under different leakage geometries. Hu et al. [30] and Wang et al. [31] constructed three-dimensional Fluent-based models for buried HBNG pipeline leakage, analyzing effects of hole characteristics, burial depth, soil properties, pipeline pressure, and HBR on leakage and diffusion characteristics. Wang et al. [32] formulated a non-adiabatic leakage model to study the impacts of thermal conductivity, initial pressure, and HBR on HBNG pipeline leakage flow characteristics. Ouyang et al. [33] and Guo et al. [34] investigated leakage consequences and risk profiles under different failure modes, providing frameworks for HBNG pipeline safety prevention and mitigation.
Existing research primarily focuses on subsurface gas diffusion, whereas post-leakage fires or explosions predominantly occur at ground level and above. Consequently, investigating the ground-level hazard evolution of escaped gases is imperative. Furthermore, during pipeline failure processes—such as hydrogen embrittlement and corrosion—multiple weak zones may develop, potentially resulting in simultaneous multi-hole leakage [35,36,37]. This critical scenario lacks a comprehensive understanding of current HBNG leakage studies.
Consequently, this study employs numerical simulation methods, leveraging ANSYS Fluent software (2022R1) to establish a 3D transient model for simulating multi-hole leakage diffusion behavior in buried HBNG pipelines. Initially, comparative analysis of concentration distributions between multi-hole and single-hole leakage scenarios reveals diffusion characteristics and ground-level hazard evolution patterns. Subsequently, a parametric investigation across 14 cases examines the effects of leakage hole number, inter-hole spacing, HBR, and soil porosity on hazard progression. This research provides valuable insights for identifying and assessing leakage risks in buried high-pressure HBNG pipelines, while offering practical guidance for the strategic placement of HBNG leakage monitoring systems and post-leakage source localization.
2. Method
2.1. Assumptions of the Model
To simplify the model, the following assumptions are made:
- The soil, as a porous medium, is considered isotropic, and changes in its spatial structure before and after leakage are neglected;
- Due to the leak hole diameter being less than 5% of the pipeline diameter, pressure variations within the pipeline before and after leakage are neglected;
- Given the minimal gas leakage volume, temperature changes induced by pressure variations after leakage are neglected;
- The gas within the pipeline comprises only methane and hydrogen, with the effects of other gases neglected;
- The influence of soil moisture is neglected.
2.2. Governing Equation
Unlike aboveground pipelines, gas leakage from buried pipelines encounters resistance from soil porous media. This necessitates incorporating porosity as a coefficient in the governing equations and introducing a Darcy–Forchheimer resistance source term into the momentum equation, while ignoring soil anisotropy and structural alterations in the soil matrix pre- and post-leakage. Under these assumptions, the diffusion behavior of HBNG in buried pipelines can be characterized by the following equations.
2.2.1. Mass Conservation
2.2.2. Momentum Conservation Equation
2.2.3. Continuity Equation
2.2.4. Transport Equation
2.2.5. Equation of Gas State
2.2.6. Soil Conditions
This study employs an isotropic porous media model for soil numerical simulation. The key soil physical parameters include particle size, porosity, viscous resistance, and inertial resistance. Among these parameters, soil particle size and porosity must be directly measured through experimental methods, while the viscous resistance coefficient and inertial resistance coefficient can be derived through theoretical calculations based on the measurement results of the first two parameters [38,39]. According to the ANSYS FLUENT User’s Guide, the calculation methods for the soil viscous resistance coefficient and inertial resistance coefficient are as follows:
where and γ denote the soil particle diameter and porosity, respectively, while represents the inertial resistance coefficient. The parameter α signifies soil permeability, with its reciprocal corresponding to the viscous resistance coefficient. Using yellow cinnamon soil as a representative soil type, this study investigates the effects of varying porosity levels on the leakage diffusion characteristics of HBNG.
2.2.7. Mass Diffusivity
Compared to binary systems, mass transfer in multicomponent mixtures involves greater complexity. Due to intermolecular interactions, the mass flux of each component is influenced by concentration gradients of both its own and other constituents. To more accurately characterize the diffusion behavior of individual gaseous components, the introduction of diffusion coefficients is essential in computational procedures [31].
This study computed multicomponent diffusion coefficients using the species transport model with multicomponent diffusion capabilities in ANSYS Fluent. The calculated diffusion coefficients are as follows: hydrogen in air: 7.4 × 10⁻⁷ m2/s; methane in air: 1.8 × 10⁻⁷ m2/s; hydrogen in methane: 6.0 × 10⁻⁷ m2/s.
2.3. Numerical Modeling of Multi-Hole Leakage
2.3.1. Geometric Dimension
This study employs a soil domain measuring 12 m × 12 m × 3 m (L × W × H) as the computational zone to simulate subsurface diffusion behavior following leakage from an HBNG pipeline. Based on the technical parameters of in-service long-distance hydrogen-blended pipelines in China, a three-dimensional model of a buried pipeline with an outer diameter of 500 mm, wall thickness of 10 mm, and burial depth of 1.5 m is established. The leak hole is positioned at the crown of the pipeline. Research by Hu et al. [30] demonstrates symmetric distribution of HBNG mass fractions along both axial and radial directions near leakage holes. Therefore, to enhance computational efficiency while minimizing resource consumption, symmetry boundary conditions were applied to reduce the computational domain to one-quarter of the original fluid domain. This configuration preserves physical field integrity while significantly improving numerical convergence and computational efficiency. The coordinate system origin resides at the geometric center of the model, as illustrated in Figure 1.
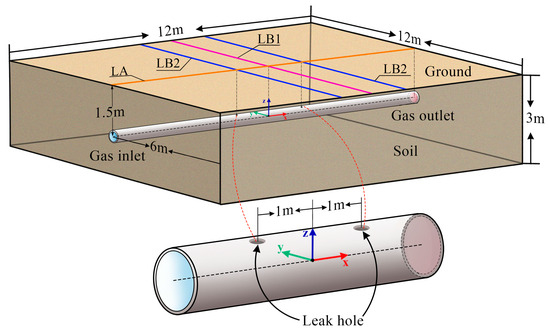
Figure 1.
Geometric dimension.
2.3.2. Numerical Modeling
This study employs the finite volume method within ANSYS Fluent to analyze leakage diffusion characteristics in buried HBNG pipelines. Leveraging the Fluent Meshing module, a geometry-adaptive mesh generation strategy was implemented, incorporating localized grid refinement at leakage port regions. Comprehensive quality assessment confirmed domain-wide mesh orthogonality exceeding 0.45. Key parameters of the numerical model are detailed in Table 1.

Table 1.
Model parameter settings.
To reduce computational complexity, this model incorporates judicious simplifications by neglecting internal flow dynamics within the HBNG pipeline. The soil medium is characterized as a porous domain with pressure outlet boundary conditions. Since this study focuses solely on the diffusion characteristics of gas leakage within soil, the pipeline leakage region is defined as a pressure inlet, while the external pipe surface is configured as a no-slip wall constraint. Geometric symmetry planes employ symmetry boundary conditions to preserve spatial symmetry.
Current literature primarily focuses on leakage diffusion characteristics of HBNG in soil environments, with simulation durations typically limited to ≤1000 s [28,30,31]. To investigate ground-level diffusion distribution and hazard evolution of HBNG, this study requires extended simulation durations. Consequently, the computational timeframe was extended to 5000 s. To ensure computational convergence, a time step size of 0.5 s is employed, with a maximum of 100 iteration steps.
2.4. Numerical Model Analysis
This study investigates hazard zone characteristics formed during leakage diffusion processes in buried HBNG pipelines under varied operational scenarios. Given that both gases possess lower densities than air, upward diffusion dominates the leakage behavior. As combustible gas explosions predominantly occur at surface levels, and considering pipeline vicinities typically constitute high-risk zones containing dense populations and critical infrastructure, this research focuses on analyzing surface diffusion pathways and the defining mechanisms of hazard zone boundaries resulting from HBNG leakage.
Gas diffusion following HBNG leakage exhibits complex patterns. To precisely quantify the dynamic impact of stratified diffusion on leakage risks, three key parameters are defined: First Dangerous Time (FDT), Farthest Dangerous Distance (FDD), and Ground Dangerous Range (GDR).
The First Dangerous Time (FDT) denotes the elapsed time until the gas mixture concentration first reaches the lower explosion limit (LEL) at ground level. Due to hydrogen’s lower molecular weight and higher diffusion coefficient, the FDT of HBNG is significantly shorter than that in pure methane leakage scenarios.
Farthest Dangerous Distance (FDD) represents the maximum linear distance from the ground projection of the pipeline axis to the farthest point of the LEL contour in the horizontal direction.
Ground Dangerous Range (GDR) is defined as the surface area where the volumetric concentration of the gas mixture exceeds its LEL threshold. For HBNG, this LEL threshold ranges between 4.0% and 4.9% vol, depending on the hydrogen blending ratio (HBR); a conservative value of 4.0% vol is adopted in this study to enhance safety margins.
Hydrogen blending accelerates gas leakage and diffusion in soil, resulting in shortened FDT, extended FDD and GDR, and consequently elevated safety risks.
2.5. Simulated Scene
A controlled variable approach was employed to investigate the effects of four parameters—leakage hole number, inter-hole spacing, HBR, and soil porosity—on leakage diffusion characteristics and hazard evolution in buried natural gas pipelines. The parametric matrix (Table 2) comprises 14 simulation cases, with case 6 designated as the control group for all parameters. Pipeline pressure was maintained at 6.3 MPa, consistent with the actual situation of China’s inaugural HBNG pipeline (Baotou-Linhe Gas Transmission Pipeline (Inner Mongolia West Natural Gas Co., Ltd., Inner Mongolia Autonomous Region, China)).

Table 2.
Numerical simulation parameter matrix.
The monitoring line LA is defined as the ground projection of the pipeline centerline. Monitoring line LB1 is established perpendicular to LA and passing through its midpoint, while monitoring line LB2 runs parallel to LB1 and extends directly above the center of the leakage hole. All three monitoring lines are positioned at ground level, as depicted in Figure 1.
2.6. Numerical Analysis Model Validation
2.6.1. Grid Independence Validation
Generally, finer mesh resolution enhances computational accuracy but concurrently increases computational costs. Consequently, identifying an optimal grid size is essential to achieve a balance between these competing factors.
Building upon case 6, a grid independence study was conducted using four distinct mesh resolutions, with specifications detailed in Table 3. By comparing the hydrogen volume fractions at the monitoring point (1, 0, and 0.5) after 200 s across these cases (as shown in Figure 2), the simulation results demonstrate minimal variation when the maximum face mesh size is reduced from 100 mm to 50 mm. Considering computational resource constraints, this mesh configuration was selected for subsequent simulations.

Table 3.
Grid independence validation.
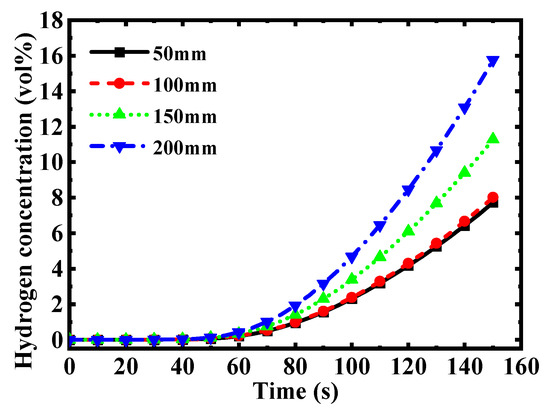
Figure 2.
Grid independence validation.
2.6.2. Model Reliability Validation
Experimental data for high-pressure buried pipelines transporting HBNG remain scarce. This study validates numerical models against experimental results from Zhu et al. [24], employing a leakage source composition of 30% H2/70% CH4. Gas was released from a buried pipe with a 25-mm diameter centered within a 4 m × 4 m × 1.8 m soil domain, with its centerline located 1.5 m below ground level. Leakage occurred at 4 MPa through a 1 mm-diameter circular hole positioned at the pipe crown.
Figure 3 compares experimental measurements and numerical simulation results of hydrogen concentration at monitoring point (1, 0, 0.5). During initial leakage stages, significant deviations exist between simulated and experimental data. However, the discrepancy diminishes progressively after 180 s, with the relative error reducing to within 2.8% after 240 s. Given the extended simulation duration adopted in this study, these results demonstrate the model’s reliability for investigating leakage scenarios in buried high-pressure HBNG pipelines.
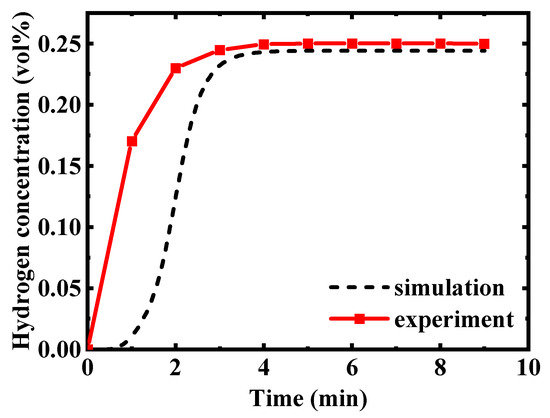
Figure 3.
Model reliability validation.
3. Results and Discussion
3.1. Diffusion Characteristics of Multi-Hole Leakage
Using case 6 as the baseline scenario (two leakage holes at 2 m spacing, 30% HBR, and soil porosity 0.43), Figure 4 illustrates gas diffusion characteristics of multi-hole HBNG leakage. Surface gas diffusion evolves through three distinct phases:
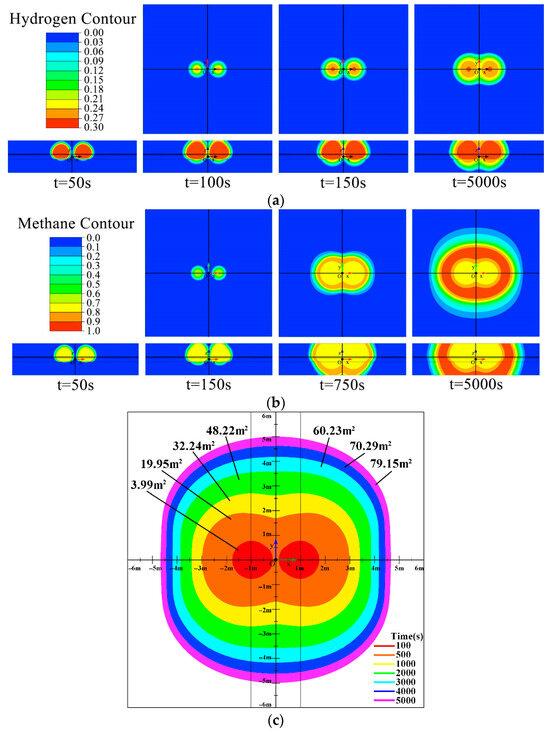
Figure 4.
Gas leakage and diffusion characteristics in case 6. (a) Hydrogen concentration counter, (b) Methane concentration counter, (c) Changes in GDR.
Phase I is Independent Diffusion: Initially, each leakage hole functions as an isolated emission source, exhibiting concentration distributions analogous to single-hole leakage dynamics. Gas breakthrough points manifest directly above respective holes, forming two discrete concentration peaks at ground level.
Phase II is Interaction-Accelerated Diffusion: During plume expansion, overlapping diffusion fields generate intensified concentration gradients. This interaction results in accelerated vertical migration along the connecting axis of the two holes, producing a characteristic peanut-shaped concentration contour. Enhanced transport velocity within the interaction zone elevates local gas concentrations.
Phase III is Unified-Source Diffusion: When the diffusion envelope significantly exceeds inter-hole spacing, the surface concentration profile transitions to a circular or runway-shaped pattern. This morphs the merged leakage field into an equivalent single source with diffusion characteristics approximating single-hole leakage behavior.
Significant disparities exist in ground-level concentration distributions between hydrogen and methane during diffusion. In Figure 4a,b, the top row depicts gas concentration distributions at ground level, while the bottom row shows distributions on the XZ-plane. Hydrogen concentrations predominantly concentrate near leakage ports with steep concentration gradients, ultimately forming a peanut-shaped distribution (Figure 4a). This phenomenon arises from hydrogen’s lower density and volumetric concentration, enabling rapid ascent to ground level and atmospheric dispersion. Hydrogen diffusion stabilizes after 150 s without progressing beyond Phase 2 evolution. Conversely, methane exhibits broader diffusion areas with gentler concentration gradients, forming circular concentration contours (Figure 4b). This behavior results from methane’s weaker buoyancy effect relative to air, promoting homogeneous diffusion and facilitating complete three-phase evolution.
Figure 4c documents the temporal evolution of the GDR following HBNG leakage. Analysis reveals that both FDD and GDR of HBNG are predominantly governed by methane’s diffusion extent. The GDR morphology evolution mirrors gas concentration distribution patterns, progressing through three distinct phases: At 52.5 s, gas first reaches ground level directly above leakage ports. By 100 s, GDR manifests as two isolated segments. At 500–1000 s, plume intersection yields a peanut-shaped GDR. From 2000 to 5000 s, expanding diffusion scales transform GDR into a circular configuration. Crucially, FDD occurs along LB2 during Phases 1–2, but shifts to LB1 in Phase 3.
Analyzing ground-level gas concentration distributions enables quantitative risk evolution assessment and provides critical guidance for post-leakage source localization. From the above results, it can be concluded that when locating leakage sources based on near-circular concentration contours, both single-hole leakage scenarios and multi-hole leakage with extended duration must be considered as potential candidates.
Figure 5 depicts methane and hydrogen concentration distributions along LA, LB1, and LB2 at 5000 s. Due to divergent diffusion coefficients and volumetric fractions, methane exhibits significantly broader diffusion than hydrogen at ground level. Methane concentrations display bimodal (“M-shaped”) profiles extending farther along all three monitoring lines, while hydrogen exhibits unimodal distributions (“n-shaped”) confined to proximal zones. These observations align with the findings of Wang et al. [31].
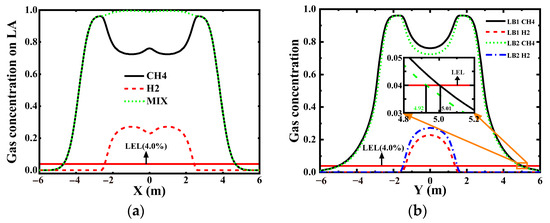
Figure 5.
Distribution of gas on monitoring lines in case 6. (a) Gas concentration on LA, (b) Gas concentration on LB1, LB2.
The horizontal red line in each subfigure denotes the LEL of the mixture gas. Its intersection with concentration distribution curves defines the FDD along each monitoring line. Figure 5a reveals near-saturation gas concentrations around leakage holes, confirming that the ground hazardous extent and FDD of HBNG are primarily governed by methane diffusion. Consequently, subsequent case analyses prioritize methane diffusion behavior. Figure 5b demonstrates concentration profiles along monitoring lines LB1 and LB2: significant divergence near x = 0 contrasts with convergent distributions at distal regions. Inset magnification confirms FDD occurs along LB1, indicating that the surface gas distribution shows the characteristics of Unified-Source Diffusion at this time.
3.2. The Influence of the Leakage Hole Number
Changes in the external environment may cause multiple leakage holes in the pipeline, which may be different from the diffusion characteristics of a single leakage hole. Cases 1, 2, 3, 6, and 9 were selected to study the effect of the number of leakage holes on the leakage diffusion characteristics. Cases 1, 2, and 3 are single-hole leaks. The area of leakage holes in case 1 is 25 π mm2, which is the same as that in cases 6 and 9, so as to compare the influence of the number of leakage holes when the area of a single leakage hole is the same. The total area of leakage holes in case 2 and case 6 is equal, both of which are 50 π mm2, and the total area of leakage holes in case 3 and case 9 is equal, both of which are 75 π mm2, so as to compare the influence of the number of leakage holes when the total area of leakage holes is equal.
Figure 6a documents methane concentration distributions along monitoring line LA for the aforementioned cases. Analysis reveals that multi-hole leakage scenarios exhibit extended diffusion ranges compared to single-hole cases, primarily due to inter-hole spacing facilitating accelerated gas diffusion along the pipeline axis direction.
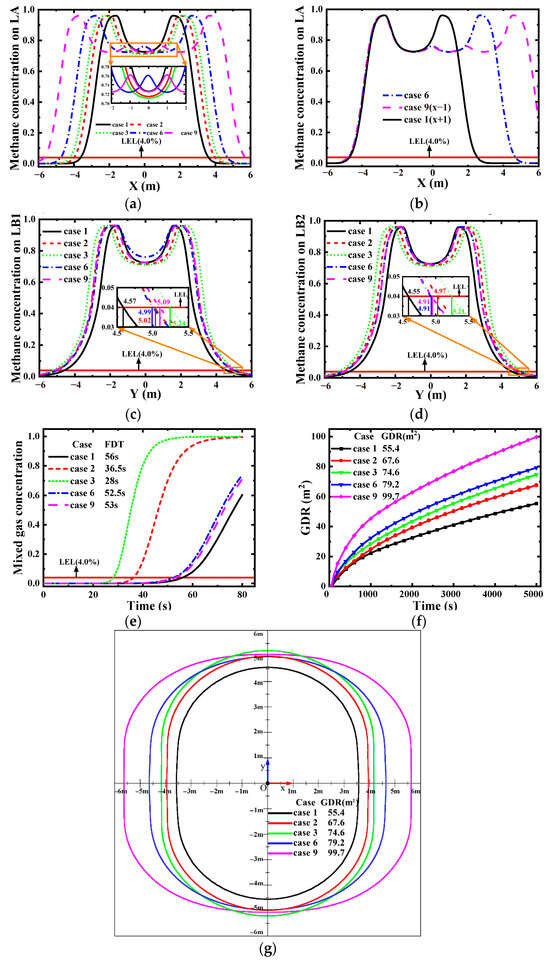
Figure 6.
Influence of the leakage hole number. (a) Methane concentration on LA, (b) Methane concentration after displacement, (c) Methane concentration on LB1, (d) Methane concentration on LB2, (e) FDT for different cases, (f) GDR for different cases, (g) GDR of each case at 5000 s.
Figure 6b was generated by laterally shifting case 1 and case 8 concentration curves by ±1 m along the x-axis. Analysis reveals nearly identical concentration distributions within the domain x < 1 m, indicating that multi-hole and single-hole leakage scenarios exhibit equivalent concentration gradients along the monitoring line LA. Crucially, the total diffusion distance in multi-hole leakage obeys the relation:
where dsingle denotes single-hole diffusion distance, s is inter-hole spacing, and n is the number of leakage holes. This relationship rigorously validates the superposition principle’s applicability to scenarios with n leakage holes.
Furthermore, the gas concentration distributions at both ends are nearly identical across all cases, indicating that the disturbances caused by interactions among multiple leak holes are confined to the region between the holes, with minimal effects on the outer regions.
Figure 6c,d presents methane concentration distributions along monitoring lines LB1 and LB2 across all cases. Analysis reveals that the FDD consistently occurs on LB1, indicating that multi-hole leakage diffusion ultimately evolves into a unified-source diffusion regime (Phase III) given sufficient diffusion duration. Methane distributions for case 6 (dual holes) and case 9 (triple holes) exhibit significant similarity along LB2, demonstrating that the leakage hole number exerts negligible influence on the y-axis direction.
Given that leakage holes are positioned at the pipeline crown and the vertical upward path to ground level represents the shortest trajectory, the initial emergence of HBNG at ground level occurs directly above the leakage holes. Figure 6e documents the temporal evolution of gas mixture concentrations at these ground projection points above leakage ports, enabling quantitative analysis of the FDT.
Both increased leakage hole number and enlarged leakage area reduce the FDT, while the leakage area exerts substantially greater influence than the port quantity. Consider case 1 as baseline: When maintaining constant individual port area (25 π mm2), cases 6 and 9 increase port count to 2 and 3, respectively, yet FDT decreases by merely 3.0 s and 3.5 s. Conversely, enlarging individual port areas significantly increases mass flow rates, reducing FDT by 19.5 s and 28.0 s in cases 2 and 3. Critically, despite identical total leakage areas—case 2 vs. 6 (50 π mm2) and case 3 vs. 9 (75 π mm2)—substantial FDT disparities persist. These findings demonstrate that leakage hole number exerts minimal influence on FDT in multi-port leakage scenarios.
Figure 6f records the time-dependent variations in GDR for different cases, with all cases showing a monotonic increase over time. At a leakage duration of 5000 s, the GDR values for cases 1, 2, 3, 6, and 9 are 79.2 m2, 55.4 m2, 67.6 m2, 74.6 m2, and 99.7 m2, respectively. It can be observed that a larger total leakage hole area corresponds to a higher GDR; when leakage hole areas are equal, multi-hole leakage exhibits faster GDR growth, indicating greater risk compared to single-hole leakage. However, during multi-hole leakage, the GDR remains greater than single-hole leakage but less than the sum of GDRs from independent leakages. Figure 6g presents the GDR distribution of all cases at 5000 s, revealing that the FDD of each case at 5000 s is located on LB1. This suggests that, given sufficient time, multi-hole leakage will undergo all three phases completely.
3.3. The Influence of Inter-Hole Spacing
Cases 4 through 8 were configured with progressively increasing inter-hole spacing (d), with values of 0.5 m, 1 m, 2 m, 3 m, and 4 m, respectively, to analyze spacing effects on HBNG diffusion characteristics.
Figure 7a reveals consistent concentration gradients at the periphery of monitoring line LA across all cases, aligning with conclusions from the preceding section. When inter-hole spacing is minimal (cases 4–6), hydrogen diffusion intersects along LA, exhibiting single-hole leakage characteristics. As inter-port spacing increases, methane concentrations near x = 0 diminish, gradually manifesting multi-hole diffusion signatures. At 4 m spacing (case 8), complete plume separation occurs, demonstrating a distinct dual-hole leakage characteristic. Consequently, it is inferred that multi-hole leakage diffusion will only progress through Phases 1–2 when inter-hole spacing exceeds critical thresholds. Further spacing enlargement will yield multiple isolated single-port diffusion patterns.
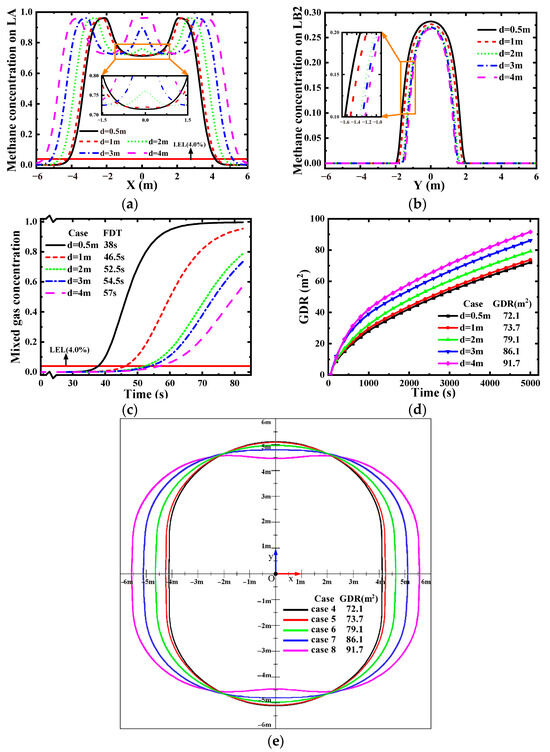
Figure 7.
The influence of inter-hole spacing. (a) Methane concentration on LA, (b) Hydrogen concentration on LB2, (c) FDT for different cases, (d) GDR for different cases, (e) GDR of each case at 5000 s.
Figure 7b presents hydrogen concentration distributions along LB2 across all the cases. Analysis reveals that reduced inter-hole spacing diminishes both the distribution extent and peak concentrations along the monitoring line. Notably, hydrogen diffusion characteristics exhibit minimal variations among cases demonstrating multi-hole leakage behavior (cases 6, 7, and 8).
Figure 7c demonstrates that increasing inter-hole spacing progressively delays FDT, with recorded values of 38.0 s, 46.5 s, 52.5 s, 54.5 s, and 57.0 s at spacings of 0.5 m, 1 m, 2 m, 3 m, and 4 m, respectively. Beyond 2 m spacing, further increases exert negligible influence on FDT, consistent with the established multi-hole leakage characteristics. For spacings below 2 m, the superposition effect of dual leakage diffusion shifts the initial ground emergence location from directly above leakage ports (1, 0, 1.5) to above the coordinate origin (0, 0, 1.5).
Figure 7d analyzes the impact of inter-hole spacing on GDR. Analysis reveals that larger hole spacings accelerate GDR expansion, suggesting heightened explosion risks. During initial leakage, GDR growth rates remain consistent across spacings as diffusions evolve independently, allowing GDR to approximate the arithmetic sum of isolated leakage holes. Upon diffusion intersection, GDR growth rates decline significantly. Figure 7e illustrates GDR distributions at t = 5000 s, demonstrating a progressive reduction in FDD with increasing spacing. At 4 m spacing (case 8), GDR adopts a peanut-shaped morphology with FDD shifting from monitoring line LB1 to LB2, confirming that leakage progresses only through Phases I–II at extended spacings.
3.4. The Influence of HBR
Given hydrogen’s significantly lower molar mass compared to methane, increasing the HBR progressively reduces the density of HBNG [28]. Consequently, variations in HBR substantially alter HBNG leakage diffusion characteristics. This study configured cases 6, 10, 11, and 12 with HBRs of 0%, 10%, 20%, and 30% respectively, to quantify multi-hole leakage effects.
Figure 8a,b depicts methane concentration distributions along LA and LB1, respectively. Analysis reveals an inverse correlation between methane diffusion extent and HBR along LA, while higher HBR induces greater lateral diffusion perpendicular to LA (i.e., along LB1). Near leakage sources, lower HBR yields higher methane concentrations, whereas elevated HBR generates greater FDD at distal locations. This phenomenon is likely attributable to hydrogen’s superior diffusivity, where increased HBR accelerates diffusion and disperses concentration profiles, thereby elevating ground-level hazards.
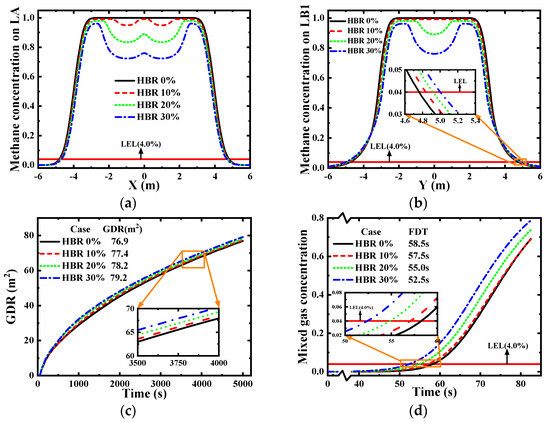
Figure 8.
The influence of HBR. (a) Methane concentration on LA, (b) Methane concentration on LB1, (c) Influence of HBR on GDR, (d) Influence of HBR on FDT.
Figure 8c documents the temporal evolution of GDR during HBNG leakage. At equivalent time points, GDR values for HBRs of 0%, 10%, 20%, and 30% are 76.87 m2, 77.36 m2, 78.16 m2, and 79.15 m2, respectively. This progression demonstrates that increasing HBR expands ground-level hazardous areas, thereby elevating fire and explosion risks.
Figure 8d characterizes the impact of HBR on FDT. At HBRs of 0%, 10%, 20%, and 30%, corresponding FDT values are 58.5 s, 57.5 s, 55.0 s, and 52.5 s, respectively. Hydrogen’s superior diffusivity accelerates the ground arrival of HBNG with increasing HBR. However, due to hydrogen’s lower volumetric fraction in the mixture, FDT variations across cases exhibit minimal difference.
3.5. The Influence of Soil Porosity
Soil particle size and porosity constitute the primary parameters governing soil physical properties. In long-distance pipeline projects, modifying in-situ soil particle size proves impractical, whereas soil porosity can be effectively modulated through engineering interventions. Consequently, this section investigates the influence of soil porosity on the leakage diffusion characteristics of HBNG.
Soil porosity, defined as the percentage of void volume relative to total soil volume, serves as a critical indicator of soil aeration capacity and water retention potential. Compared to studies manipulating soil types, controlling porosity as a single independent variable provides more interpretable experimental outcomes. Taking China’s inaugural hydrogen-blended high-pressure pipeline—the Baotou-Linhe Gas Transmission Pipeline—as a representative case, the surrounding soil comprises yellow cinnamon soil with a mean particle size of approximately 0.05 mm. Consequently, this study employs yellow cinnamon soil to investigate porosity impacts on multi-hole leakage in buried HBNG pipelines through cases 6, 13, and 14. Key soil parameters are detailed in Table 4. The viscous resistance coefficient and inertial resistance coefficient are derived from Equations (6) and (7), respectively, while minor variations in porosity have a significant impact on their values.

Table 4.
Soil parameter matrix.
As a critical parameter governing gas diffusion, higher soil porosity attenuates gas transport impedance, thereby accelerating the diffusion rate of HBNG through soil. Figure 9a,b presents methane concentration distributions along monitoring lines LA and LB2, respectively. Analysis reveals that reduced soil porosity contracts gas saturation zones. Due to the fast diffusion rate of hydrogen, it is more affected by changes in porosity. When the porosity is 0.21, the diffusion range of hydrogen is limited to a smaller range, resulting in three characteristic peaks of methane appearing on LA. Notably, elevated porosity yields reduced FDD along LB2, attributable to porosity-enhanced buoyancy dominance governing vertical transport, thereby suppressing horizontal diffusion extents.
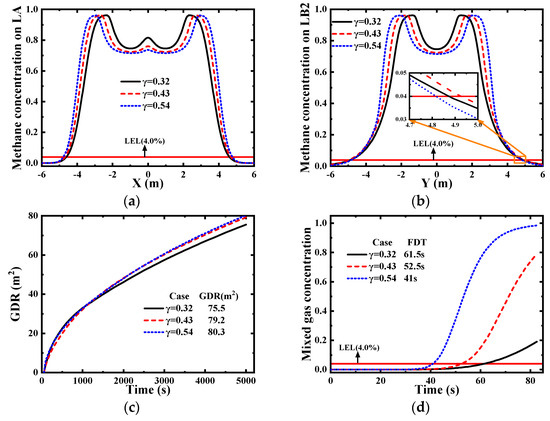
Figure 9.
The influence of soil porosity. (a) Methane concentration on LA, (b) Methane concentration on LB2, (c) Influence of soil porosity on GDR, (d) Influence of soil porosity on FDT.
Figure 9c,d demonstrates that increased soil porosity accelerates HBNG migration from leakage sources to ground level, reducing FDT to 61.5 s, 52.5 s, and 41.0 s at porosities of 0.32, 0.43, and 0.54, respectively. Concurrently, elevated porosity significantly expands horizontal diffusion extents. Consequently, both GDR and FDT are robustly modulated by porosity variations, with higher porosity values substantially amplifying explosion risks due to expanded flammable gas footprints and accelerated hazard onset.
It should be noted that actual geological conditions may introduce greater soil complexity than simulated scenarios. Factors such as soil moisture, anisotropy, and surface vegetation coverage could significantly impact the results.
4. Conclusions
This study established a numerical model for HBNG leakage and diffusion in buried long-distance transmission pipelines using Fluent. The leakage and diffusion characteristics of mixed gases under multi-hole leakage scenarios were analyzed, incorporating the effects of leakage hole number, inter-hole spacing, HBR, and soil porosity. The results are presented as follows:
- The multi-hole leakage diffusion of HBNG exhibits three distinct evolutionary phases. Initially, during the independent diffusion phase, the two leakage plumes remain spatially separated, with concentration distributions mirroring single-hole leakage characteristics. Subsequently, in the interaction-accelerated diffusion phase, overlapping gas plumes in the soil matrix generate intensified concentration gradients, forming a peanut-shaped concentration contour with significantly enhanced vertical migration velocity along the inter-hole axis. Eventually, when the diffusion envelope exceeds the inter-hole spacing, the merged leakage field transitions into a Unified-Source diffusion mode, characterized by circular or runway-shaped surface concentration profiles approximating unified aperture diffusion patterns. Hydrogen, due to its low-density properties, exhibits limited lateral migration confined near leakage sources and undergoes only two diffusion stages. In contrast, methane progresses through all three phases, ultimately forming extensive circular distribution patterns. The hazardous potential of the gas mixture is predominantly governed by methane’s expansive diffusion footprint rather than hydrogen’s localized accumulation.
- The multi-hole and single-hole leakage scenarios exhibit similarity in gas concentration gradients along both axial and horizontal directions. When leakage hole diameters are identical, the distribution distance along the central axis equals the algebraic sum of the single-hole diffusion distance and the inter-hole spacing. Radial distribution patterns also demonstrate comparable characteristics, where the number of leakage holes does not influence gas diffusion along LB2. Under equivalent total leakage hole areas, multi-hole leakage configurations present higher hazard potential compared to single-hole scenarios.
- The inter-hole spacing significantly influences the gas diffusion characteristics in multi-hole leakage scenarios. When leakage holes are in closer proximity, the interacting gas plumes rapidly coalesce, causing the diffusion behavior to approximate single-hole dynamics with an extended FDD. Conversely, increased inter-hole spacing restricts the diffusion process to only the first two evolutionary phases while generating a substantially expanded GDR
- Compared to pure methane leakage and diffusion behavior, low HBR (<30%) increases post-leakage hazard potential but primarily modifies near-source gas concentration distribution characteristics, with minimal influence on GDR. When hydrogen blending reaches 30%, the surface hazardous zone expands by only 3% compared to natural gas leakage. This occurs because hydrogen’s superior diffusivity generates localized dilution effects without significantly altering methane’s expansive diffusion footprint. Therefore, for low HBR, critical parameters like GDR can be conservatively estimated using natural gas leakage models.
- The hazard potential of HBNG leakage is significantly influenced by soil porosity variations. Using yellow cinnamon soil as a representative example, increased porosity reduces both inertial and viscous resistances to gas migration, thereby accelerating subsurface diffusion and expanding GDR. Consequently, engineering interventions aimed at decreasing soil porosity can substantially mitigate leakage-related risks through controlled modification of subsurface transport pathways.
Author Contributions
Methodology, H.W.; Funding acquisition, X.T.; Software, H.W.; Validation, H.W.; Formal analysis, H.W.; Investigation, H.W.; Data curation, H.W.; Project administration, X.T.; Writing—original draft, H.W.; Writing—review and editing, X.T.; Supervision, X.T. All authors have read and agreed to the published version of the manuscript.
Funding
This research was funded by the Beijing Natural Science Foundation (No. 8242019).
Data Availability Statement
The raw data supporting the conclusions of this article will be made available by the authors on request. The data are not publicly available due to the large amount of data.
Conflicts of Interest
The authors declare no conflicts of interest.
Nomenclature
| p | pressure (Pa) |
| g | gravitational acceleration (m/s2) |
| v | leak velocity (m/s) |
| t | time (s) |
| ui | velocity in the x, y, z direction (m/s) |
| Si | resistance loss in porous media |
| R | general gas constant (J/(mol K)) |
| T | temperature (K) |
| M | molecular mass of the component |
| DP | soil particle diameter |
| C2 | inertial resistance coefficient |
| d | diffusion distance |
| s | inter-hole spacing |
| D | diffusion coefficient |
| Greek letters | |
| ρ | density (kg/m3) |
| α | soil permeability |
| 1/α | viscous resistance coefficient (1/m2) |
| γ | soil porosity |
| ε | turbulence dissipation rate (J/(kg s)) |
| μ | viscosity (kg/ms) |
| ω | mass fraction of the component |
Abbreviations
| HBNG | hydrogen-blended natural gas |
| LEL | lower explosive limit |
| HBR | hydrogen blending ratio |
| FDT | first dangerous time |
| FDD | farthest dangerous distance |
| GDR | ground dangerous range |
References
- Cao, M.; Wang, F.; Ma, S.; Geng, H.; Sun, K. Recent advances on greenhouse gas emissions from wetlands: Mechanism, global warming potential, and environmental drivers. Environ. Pollut. 2024, 355, 124204. [Google Scholar] [CrossRef] [PubMed]
- Zhang, X.; Zhong, J.; Zhang, X.; Zhang, D.; Miao, C.; Wang, D.; Guo, L. China Can Achieve Carbon Neutrality in Line with the Paris Agreement’s 2 °C Target: Navigating Global Emissions Scenarios, Warming Levels, and Extreme Event Projections. Engineering 2025, 44, 207–214. [Google Scholar] [CrossRef]
- Ahmad, S.; Ullah, A.; Samreen, A.; Qasim, M.; Nawaz, K.; Ahmad, W.; Alnaser, A.; Kannan, A.M.; Egilmez, M. Hydrogen production, storage, transportation and utilization for energy sector: A current status review. J. Energy Storage 2024, 101, 113733. [Google Scholar] [CrossRef]
- Muhammed, N.S.; Gbadamosi, A.O.; Epelle, E.I.; Abdulrasheed, A.A.; Haq, B.; Patil, S.; Al-Shehri, D.; Kamal, M.S. Hydrogen production, transportation, utilization, and storage: Recent advances towards sustainable energy. J. Energy Storage 2023, 73, 109207. [Google Scholar] [CrossRef]
- Yao, Y.; Tan, L.; Chen, F.; Pan, A.; Ma, Q.; Zhao, J.; Kang, R. Hydrogen energy industry in China: The current status, safety problems, and pathways for future safe and healthy development. Saf. Sci. 2025, 186, 106808. [Google Scholar] [CrossRef]
- Sharma, G.; Dewangan, A.K.; Yadav, A.K.; Ahmad, A. Current status of research on hydrogen generation, storage and transportation technologies: A state-of-the-art review towards sustainable energy. Process Saf. Environ. Prot. 2024, 191, 1445–1460. [Google Scholar] [CrossRef]
- Wang, X.; Cheng, T.; Hong, H.; Guo, H.; Lin, X.; Yang, X.; Nie, B.; Hu, Z.; Zou, J. Challenges and opportunities in hydrogen storage and transportation: A comprehensive review. Renew. Sustain. Energy Rev. 2025, 219, 115881. [Google Scholar] [CrossRef]
- Ilyushin, Y.; Nosova, V.; Krauze, A. Application of Systems Analysis Methods to Construct a Virtual Model of the Field. Energies 2025, 18, 1012. [Google Scholar] [CrossRef]
- Dutkiewicz, M.; Dalyak, T.; Shatskyi, I.; Venhrynyuk, T.; Velychkovych, A. Stress Analysis in Damaged Pipeline with Composite Coating. Appl. Sci. 2021, 11, 676. [Google Scholar] [CrossRef]
- Dutkiewicz, M.; Velychkovych, A.; Andrusyak, A.; Petryk, I.; Kychma, A. Analytical Model of Interaction of an Oil Pipeline with a Support of an Overpass Built in a Mountainous Area. Energies 2023, 16, 4464. [Google Scholar] [CrossRef]
- Tian, X.; Pei, J. Study progress on the pipeline transportation safety of hydrogen-blended natural gas. Heliyon 2023, 9, e21454. [Google Scholar] [CrossRef]
- Jia, G.; Lei, M.; Li, M.; Xu, W.; Li, R.; Lu, Y.; Cai, M. Hydrogen embrittlement in hydrogen-blended natural gas transportation systems: A review. Int. J. Hydrogen Energy 2023, 48, 32137–32157. [Google Scholar] [CrossRef]
- Wu, X.; Zhang, H.; Yang, M.; Jia, W.; Qiu, Y.; Lan, L. From the perspective of new technology of blending hydrogen into natural gas pipelines transmission: Mechanism, experimental study, and suggestions for further work of hydrogen embrittlement in high-strength pipeline steels. Int. J. Hydrogen Energy 2022, 47, 8071–8090. [Google Scholar] [CrossRef]
- Qi, S.; Li, Y.; Zhang, W.; Wang, D.; Zhou, R.; Jing, Q.; Cheng, L.; Wang, Z. Flame characteristics and explosion risk of hydrogen-blended natural gas pipeline leakage under high-pressure and high-equivalence-ratio environments. Fuel 2025, 401, 135876. [Google Scholar] [CrossRef]
- Cao, J.; Wu, J.; Zhang, H.; Cai, J.; Wang, Y.; Fan, C. Experimental study on hydrogen-blended natural gas explosion characteristic and severity control measure in utility tunnels. Int. J. Hydrogen Energy 2024, 92, 738–747. [Google Scholar] [CrossRef]
- Montiel, H.; Vílchez, J.A.; Casal, J.; Arnaldos, J. Mathematical modelling of accidental gas releases. J. Hazard. Mater. 1998, 59, 211–233. [Google Scholar] [CrossRef]
- Yan, Y.; Dong, X.; Li, J. Experimental study of methane diffusion in soil for an underground gas pipe leak. J. Nat. Gas Sci. Eng. 2015, 27, 82–89. [Google Scholar] [CrossRef]
- Okamoto, H.; Gomi, Y. Empirical research on diffusion behavior of leaked gas in the ground. J. Loss Prev. Process Ind. 2011, 24, 531–540. [Google Scholar] [CrossRef]
- Ebrahimi-Moghadam, A.; Farzaneh-Gord, M.; Deymi-Dashtebayaz, M. Correlations for estimating natural gas leakage from above-ground and buried urban distribution pipelines. J. Nat. Gas Sci. Eng. 2016, 34, 185–196. [Google Scholar] [CrossRef]
- Zheng, D.; Zhang, J.; Liu, Z.; Liu, Q.; Liu, C.; Yao, W.; Li, M. Effects of Pipeline Pressure on Diffusion Characteristics of Leaked Natural Gas in Tunnel Space. ACS Omega 2023, 8, 10235–10241. [Google Scholar] [CrossRef]
- Bonnaud, C.; Cluzel, V.; Corcoles, P.; Dubois, J.-P.; Louvet, V.; Maury, M.; Narbonne, A.; Orefice, H.; Perez, A.; Ranty, J.; et al. Experimental study and modelling of the consequences of small leaks on buried transmission gas pipeline. J. Loss Prev. Process Ind. 2018, 55, 303–312. [Google Scholar] [CrossRef]
- Parvini, M.; Gharagouzlou, E. Gas leakage consequence modeling for buried gas pipelines. J. Loss Prev. Process Ind. 2015, 37, 110–118. [Google Scholar] [CrossRef]
- Ebrahimi-Moghadam, A.; Farzaneh-Gord, M.; Arabkoohsar, A.; Moghadam, A.J. CFD analysis of natural gas emission from damaged pipelines: Correlation development for leakage estimation. J. Clean. Prod. 2018, 199, 257–271. [Google Scholar] [CrossRef]
- Wang, X.; Tan, Y.; Zhang, T.; Xiao, R.; Yu, K.; Zhang, J. Numerical study on the diffusion process of pinhole leakage of natural gas from underground pipelines to the soil. J. Nat. Gas Sci. Eng. 2021, 87, 103792. [Google Scholar] [CrossRef]
- Bu, F.; Liu, Y.; Liu, Y.; Xu, Z.; Chen, S.; Jiang, M.; Guan, B. Leakage diffusion characteristics and harmful boundary analysis of buried natural gas pipeline under multiple working conditions. J. Nat. Gas Sci. Eng. 2021, 94, 104047. [Google Scholar] [CrossRef]
- Bezaatpour, J.; Fatehifar, E.; Rasoulzadeh, A. CFD investigation of natural gas leakage and propagation from buried pipeline for anisotropic and partially saturated multilayer soil. J. Clean. Prod. 2020, 277, 123940. [Google Scholar] [CrossRef]
- Zhu, J.; Pan, J.; Zhang, Y.; Li, Y.; Li, H.; Feng, H.; Chen, D.; Kou, Y.; Yang, R. Leakage and diffusion behavior of a buried pipeline of hydrogen-blended natural gas. Int. J. Hydrogen Energy 2023, 48, 11592–11610. [Google Scholar] [CrossRef]
- Xia, Z.; Xu, Z.-D.; Lu, H.; Peng, H.; Zang, X.; Liu, X.; Wang, X. Modeling and assessment of hydrogen-blended natural gas releases from buried pipeline. Int. J. Hydrogen Energy 2024, 90, 230–245. [Google Scholar] [CrossRef]
- Xia, Z.; Xu, Z.-D.; Xie, Z.; Peng, H.; Zang, X.; Liu, X.; Wang, X.; Lu, H. Hazard evolution of different orifice shapes leakage in buried hydrogen-blended natural gas pipelines. J. Pipeline Sci. Eng. 2025, 100315. [Google Scholar] [CrossRef]
- Hu, W.; Chen, G.; Qi, B.; Zhang, Y. Numerical simulation of leakage and diffusion of buried pure hydrogen/hydrogen-doped natural gas pipeline. Oil Gas Storage Transp. 2023, 42, 1118–1127+1136. [Google Scholar]
- Wang, L.; Tian, X. Numerical investigation of the leakage and diffusion characteristics of hydrogen-blended natural gas in long-distance pipelines. Int. J. Hydrogen Energy 2024, 90, 950–960. [Google Scholar] [CrossRef]
- Wang, L.; Chen, J.; Ma, T.; Ma, R.; Bao, Y.; Fan, Z. Numerical study of leakage characteristics of hydrogen-blended natural gas in buried pipelines. Int. J. Hydrogen Energy 2024, 49, 1166–1179. [Google Scholar] [CrossRef]
- Ouyang, B.; Sun, D.; Yu, Y.; Hu, Z.; Wu, M. Simulation and analysis of leakage characteristics in hydrogen-blended natural gas pipelines. Int. J. Hydrogen Energy 2025, 99, 888–897. [Google Scholar] [CrossRef]
- Guo, C.; Jiang, J.; Zhang, B.; Lou, F. A study on the leakage consequence and risk analysis of hydrogen-blended natural gas pipeline in different failure modes. Int. J. Hydrogen Energy 2025, 134, 100–112. [Google Scholar] [CrossRef]
- Wang, J.; Zhao, J.; Yang, X.; Lv, R.; Li, J.; Yu, B.; Yan, D.; Zhang, H.; Guo, W.; Hao, R.; et al. Study on the synergistic failure of hydrogen embrittlement and corrosion in high-pressure hydrogen-blended natural gas pipelines. J. Mater. Res. Technol. 2025, 36, 6099–6112. [Google Scholar] [CrossRef]
- Zhang, J.; Yang, P.; Xia, Z.; Wang, C.; Li, Y. Experimental study on the influence of CO2 corrosion on hydrogen permeation and hydrogen embrittlement sensitivity of X52 pipeline steel. Eng. Fail. Anal. 2025, 176, 109622. [Google Scholar] [CrossRef]
- Jiang, J.; Huang, L.; Peng, Z.; Yan, J.; Huang, G.; Tang, Y. Failure mechanism of sulfur transport jacketed pipeline induced by the combined effects of steam erosion and wet sulfur corrosion. Eng. Fail. Anal. 2025, 178, 109749. [Google Scholar] [CrossRef]
- Yoon, H.C.; Mallikarjunaiah, S.M. A steady Darcy–Brinkman–Forchheimer flow model in porous media: Comparison study of non-Darcy flow models with viscous and inertial resistances and Forchheimer coefficient. Eur. J. Mech.-B/Fluids 2025, 114, 204303. [Google Scholar] [CrossRef]
- Gan, F.-S.; Zhou, J.-Q.; Wang, L.; Li, C.; Jiang, X.-Y.; Zhu, Y. Global inertial permeability for non-Darcian flow in porous media with different shape configurations. J. Hydrol. 2025, 662, 133807. [Google Scholar] [CrossRef]
Disclaimer/Publisher’s Note: The statements, opinions and data contained in all publications are solely those of the individual author(s) and contributor(s) and not of MDPI and/or the editor(s). MDPI and/or the editor(s) disclaim responsibility for any injury to people or property resulting from any ideas, methods, instructions or products referred to in the content. |
© 2025 by the authors. Licensee MDPI, Basel, Switzerland. This article is an open access article distributed under the terms and conditions of the Creative Commons Attribution (CC BY) license (https://creativecommons.org/licenses/by/4.0/).