Abstract
Renewable energy sources, particularly solar photovoltaics (PVs), are rapidly expanding to achieve carbon neutrality. Integrated photovoltaic (IPV) solutions in underutilized spaces offer a viable option for countries with land constraints and public opposition. Vertical PV (VPV) systems, featuring bifacial solar modules installed vertically, facing east and west, present a promising alternative. In contrast to conventional tilted PV (CPV) systems, which peak around midday, VPV systems generate more power in the morning and afternoon. This mitigates issues such as the duck curve and curtailment caused by midday overgeneration. Moreover, combining VPV and CPV systems can increase the solar hosting capacity of a distribution line (DL) for PV-system interconnections, driving research interest. This study assessed the hosting-capacity improvements from VPV systems by analyzing voltage fluctuations and thermal constraints using OpenDSS software (Version 9.1.1.1). The potential substitution effect of a smart inverter-based energy-storage system (ESS) was also explored. The analysis, based on real-grid conditions in South Korea, incorporated actual DL data, generation and demand profiles, and operational data from both VPV and CPV systems. Worst-case scenarios were simulated to evaluate their impact on grid stability. The results demonstrate that VPV systems can increase hosting capacity by up to 23% and ensure stable grid operation by reducing power-generation uncertainties.
1. Introduction
Previous efforts to enhance the economic viability of solar projects have focused on increasing energy yield. However, future research is likely to prioritize specialized, diversified IPV solutions utilizing underutilized spaces. Diversified siting of IPV technologies leverages unused land, eliminating the need for new acquisitions and reducing environmental impact, while increasing solar deployment. These systems also serve unique purposes, enhancing public acceptance [1,2]. Examples include agrivoltaics, noise-barrier PVs, fence-integrated PVs, and building-integrated PVs [3]. A key example is agrivoltaics, where solar panels are installed above agricultural land with minimal impact on crop growth by utilizing solar irradiance above the light saturation point. This dual-use system boosts land productivity by up to 60% [4,5]. Similarly, agricultural PV fences and highway noise-barrier PV systems using VPV technology maintain their primary physical functions while generating power.
Bifacial modules, which capture light on the rear side, improve energy generation by approximately 5%. Because these modules generate electricity on both sides, they are particularly well-suited for VPV systems. Research is ongoing to increase their rear-side bifaciality, and studies have explored the use of heterojunction solar modules to enhance energy generation [6,7].
Numerous studies have investigated bifacial modules in VPV systems, particularly in applications such as agricultural fences and rooftops, where power generation and additional benefits are being explored [8,9]. Global research is focused on strategies to increase VPV energy yield [10] and conducting economic analyses to evaluate VPVs’ feasibility and advantages under specific conditions [11]. Concerning renewable-energy hosting-capacity improvements in distribution systems, various factors that distribution-system operators consider for calculating and increasing hosting capacity have been examined in previous studies [12]. Researchers have also analyzed the effects of regulatory reforms and investment recovery on hosting capacity [13], hosting-capacity planning in response to solar PV and electric-vehicle penetration [14], and the benefits of combining VPV and CPV systems, typically installed at a 25° tilt facing south, to increase hosting capacity [15,16]. This study explores the effect of VPV systems on distribution-system hosting capacity by analyzing actual grid power output data from an experimental VPV installation and comparing the results with the effects of integrating smart inverter-based ESSs. This new study directly compares the effectiveness of improved hosting capacity with ESS, using actual VPV output operational data. It can serve as a basic data for quantitative analysis of the impact of VPV systems, which will likely become widespread in the future.
2. Materials and Approaches
2.1. Materials
2.1.1. Characteristics of Bifacial PV Modules and VPV Systems
Bifacial PV modules use a transparent backsheet or glass on the rear side to capture light reflected from the ground, increasing power generation by >5% compared with conventional monofacial modules. This enhancement is governed by Equation (1).
Here, denotes the total power generation (W); denotes the conversion efficiency of the module (%); denotes the effective area of the module (m2); and denote the rear and front incident radiation (W/m2), respectively; and is the bifaciality factor of the bifacial module.
In a VPV system, bifacial modules can be installed upright, with the front and rear sides facing east and west, respectively, altering the temporal distribution of power output by shifting peak generation to the morning and late afternoon hours. This mitigates midday overgeneration—commonly associated with curtailment in conventional PV systems—by aligning generation more closely with load demand and reducing reverse power flow. As a result, VPV systems contribute to a more balanced power profile, alleviating curtailment without the need for additional energy storage or control infrastructure. Bifacial VPV systems are typically cost-effective in regions above 40° latitude but may also be economically viable in areas below 40° if the ground reflectance (albedo) is higher than usual [17].
2.1.2. Functions and Characteristics of Smart Inverter-Based ESS
The primary function of an ESS is to balance power supply and demand using three control algorithms. The first stabilizes renewable-energy outputs through power smoothing. The second regulates frequency, ensuring grid stability. The third involves energy time-shifting and peak load reduction, storing energy during off-peak hours and discharging it during peak periods [18].
In modern distribution grids, voltage–reactive power (Volt-Var) control is essential to address the voltage rise caused by reverse power flow from grid-connected PV systems. In South Korea, regulations require that all new distributed generation (DG) systems be equipped with smart inverters. These inverters provide four-quadrant active/reactive power compensation, frequency and voltage support, parallel operation, unbalanced load compensation, and enhanced grid stability. The present study focuses on Volt-Var control, which is critical for mitigating voltage fluctuations in distribution grids.
In this study, the voltage control capability of the ESS was analyzed without considering the operation of the on-load tap changer, which is typically used to regulate transformer voltage. This exclusion is based on the fundamental difference in control scope: on-load tap changers are installed at the main transformer and operate by adjusting the voltage level of all DLs connected to the main transformer simultaneously. In contrast, the proposed method focuses on localized voltage regulation at the individual DL level.
South Korea’s DG interconnection standards specify a ramp-up control characteristic curve for smart inverter-based Volt-Var control, as shown in Figure 1. This curve ensures gradual reactive power changes within predefined limits to maintain grid stability. The relationship between reactive power and voltage at the point of common coupling (PCC) is expressed in Equation (2). If the PCC voltage drops below a threshold, reactive power is injected to boost the voltage; if the voltage exceeds the set point, reactive power is absorbed to reduce the voltage rise. Smart inverter-based ESS, through such controls, stabilizes and enhances grid reliability.
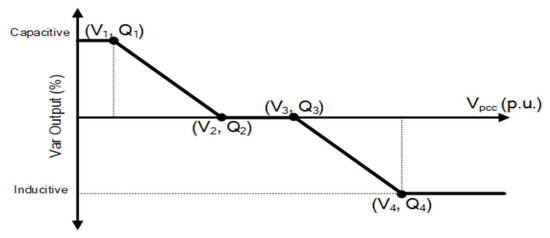
Figure 1.
Volt-Var control requirements for the ramp-up method.
This performance curve and equation are illustrated using DG interconnection standards in Figure 2a. As the voltage increases from 1.02 to 1.08 p.u., the smart inverter absorbs reactive power at a constant slope, whereas between 0.98 and 0.92 p.u., it supplies reactive power.

Figure 2.
Details of Volt-Var control: (a) ramp-up method; (b) step-up method.
Additionally, this curve can be adjusted in consultation with the system operator. A simulation was conducted with a more aggressive step-up control strategy, shown in Figure 2b. In contrast to the constant slope, this strategy features a steeper reactive power response, with charging and discharging occurring more abruptly at the same initiation points of 1.02 and 0.98 p.u., respectively [19].
However, in the case of the step-up method, if applied to special line conditions where voltage fluctuations are repeated within a specific range, the reactive power output may change rapidly, which may cause problems with system stability. In addition, care must be taken because a large number of distributed power sources may lead to synchronized switching, which may result in large-scale dropouts in the worst case.
2.1.3. Effect of PV-System Interconnection on DL Voltage Rise
PV systems are commonly installed at the ends of DLs to reduce land costs. However, they can introduce reverse currents, causing voltage rise and power quality issues in the distribution grid. The effect of PV generation on the distribution voltage can be quantified as follows [20]:
where represents the voltage variation in the DL, denotes the impedance between the PV system and DL, and denotes the current generated by the PV system.
Additionally, and denote the active and reactive power outputs of the PV system, respectively, while denotes its bus voltage.
Equation (5) follows from Equations (3) and (4), illustrating how the PV system’s power influences voltage variations in the distribution grid. These variations can be decomposed into d-axis (active) and q-axis (reactive) components, with the total voltage change expressed as
Here, denotes the overall distribution system voltage. Because the d-axis voltage is significantly larger than the q-axis voltage, the latter can be neglected. Thus, Equation (6) simplifies to in vector form. As shown in Figure 3, this results in the receiving voltage (Vr) on the load side exceeding the sending voltage (Vs) from the substation.
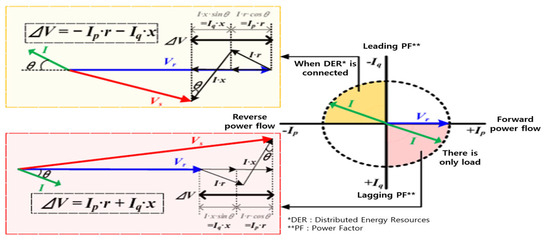
Figure 3.
Voltage vector diagram of DLs connected to a PV system [21].
2.1.4. Operational Data for East–West-Oriented VPV Systems
We used operational data collected throughout 2023, originally recorded at 1 min intervals but analyzed using hourly averages. The data for an hour, such as 7:00, represent the average of the values recorded during the preceding hour (i.e., from 6:00 to 7:00).
Figure 4 presents box plots of the maximum hourly generation peaks for a month, focusing on systems with east- and west-facing modules. A statistical analysis of hourly VPV power generation, visualized through box-and-whisker plots, reveals notable diurnal patterns in output variability. During the morning period (up to approximately 11:00 a.m.), power generation steadily increases, accompanied by moderate variability attributed to changing solar irradiance angles and atmospheric conditions.
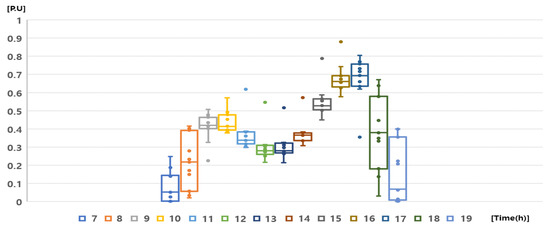
Figure 4.
Box and whisker plots of peak power generation by timeslots for an east–west-oriented vertical PV module (front of the west-facing module).
In contrast, the midday interval (12:00–14:00) demonstrates relatively low and stable power output with minimal variability. This pattern is characteristic of vertically mounted or east–west-oriented PV modules operating under suboptimal solar angles, resulting in limited irradiance during this period.
The late afternoon hours (15:00–17:00) exhibit the highest average generation levels along with increased variability, indicating greater sensitivity to environmental fluctuations and seasonal solar paths.
Overall, standard deviation in PV output—closely associated with variability—remains relatively low between 10:00 and 16:00, while significantly increasing during the early morning and late evening hours, particularly around sunrise and sunset.
Table 1 presents the maximum power generation outputs for each period based on the operational data. These values reflect the generation output pattern from the highest recorded values in the annual dataset for each time zone.

Table 1.
Hourly peak power generation of VPV systems.
The peak generation of the VPV system was lower than its installed capacity owing to the physical characteristics of vertically mounted solar modules, which limit optimal solar radiation absorption.
To account for potential voltage rise in the distribution grid from high PV-generation output, a conservative approach was adopted by simulating the worst-case generation pattern, defined by the highest peak output in each timeslot. Because this does not represent continuous generation throughout the day, results should be interpreted carefully. The peak power generation of vertically mounted PV modules facing east and west was approximately 88% of the installed capacity. The data were obtained from bifacial PV modules (460 W) on the testbed. The module specifications are presented in Table 2. The orientation reversal between the front and rear sides of the PV modules resulted in negligible differences in both overall energy yield and peak power generation [22].

Table 2.
Specifications of the bifacial modules.
2.2. Methodological Approach
This study employs a multi-step methodological framework to evaluate the hosting capacity enhancement of DL using VPV systems and to compare the effect with smart inverter-based ESS. The overall approach is structured as follows:
- Step 1:
- Data AcquisitionTo ensure the validity and realism of the analysis, actual operational data were collected from both VPV and CPV systems. Additionally, actual operational data on the “H” DL were obtained, including detailed information on feeder topology, conductor type, PV plant capacity, and load profiles.
- Step 2:
- Statistical Analysis for Output SmoothingUsing the collected VPV and CPV generation data, statistical analyses were conducted to evaluate the temporal smoothing effect of power output. Key statistical metrics such as MAE, RMSE, and R2 were used to quantify the degree of output flattening. Through this analysis, the optimal range of VPV-to-CPV mix ratios was identified in terms of minimizing generation fluctuations.
- Step 3:
- OpenDSS-Based Hosting Capacity SimulationTo assess the impact of the combined generation patterns on the hosting capacity, a distribution network model was constructed using OpenDSS. The model was based on the actual configuration and parameters of the “H” DL. Time-series simulations were carried out using various VPV/CPV mix ratios, reflecting the output characteristics derived from the earlier statistical analysis.
- Step 4:
- Hosting Capacity Evaluation CriteriaHosting capacity improvement was evaluated based on two key criteria: the voltage regulation range defined by the operational standards for 22.9 kV DLs in South Korea and the thermal capacity limit of the DL. The maximum allowable additional PV integration was determined for each mix ratio without violating these constraints, and the optimal mix was identified accordingly.
- Step 5:
- Comparison with Smart Inverter-Based ESSTo analysis the effectiveness of the proposed VPV integration strategy, an equivalent voltage regulation scenario was simulated using reactive power control functions of a smart inverter-based ESS. Both ramp-up and step-up Volt-Var control strategies were implemented to evaluate their ability to achieve comparable hosting capacity enhancement.
- Step 6:
- Derivation of Hosting Capacity Improvement ResultsBased on the comparative simulations, the final hosting capacity improvement attributed to the VPV system was quantified. This outcome was then assessed in terms of its effectiveness and practicality relative to ESS-based solutions, highlighting the potential of VPV deployment as a passive yet impactful strategy for mitigating distribution-level curtailments and voltage violations.
3. Results
3.1. Hosting-Capacity Enhancement Using VPV Systems
3.1.1. Optimal Ratio of CPV to VPV for Power-Output Smoothing
The peak generation periods of the CPV and VPV systems do not significantly overlap. By integrating these two systems, the power output can be more evenly distributed throughout the day. To explore this, an analysis was conducted to determine the optimal combination ratio of VPV and CPV systems for output smoothing.
These patterns were based on the maximum hourly generation recorded for both systems. In this study, the VPV system was modeled with the front side of the bifacial module facing west, and the output patterns were synthesized by varying the VPV-generation proportion from 0% to 100% in 10% increments. The resulting profiles are shown in Figure 5.
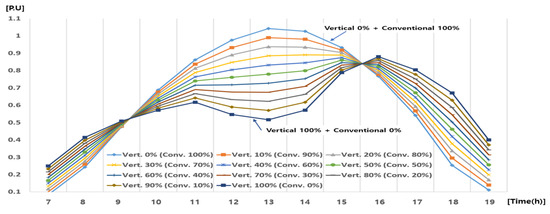
Figure 5.
Combined PV output patterns for various vertical PV composition ratios.
To evaluate the smoothing effect of the power output, it is necessary to define the periods during which output stabilization is most critical. Consequently, the analysis focused on the timeframe between 10:00 a.m. and 4:00 p.m.—a period characterized by frequent renewable-energy curtailments in South Korea. The decision to prioritize output leveling during periods when curtailment typically occurs was based on economic considerations. Performing optimal leveling across the entire time span may reduce the total energy yield, as increasing the proportion of vertical PV systems—while beneficial for peak shifting—can lead to a lower overall generation due to their orientation-dependent irradiance characteristics.
Figure 6 shows the linear-regression trend lines for the output patterns between 10:00 a.m. and 4:00 p.m. under different PV composition ratios. This analysis examines output smoothing, average generation, and deviation for each ratio.
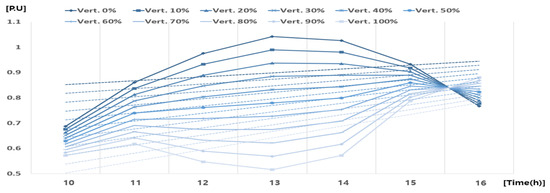
Figure 6.
Linear regression of the output patterns for different PV composition ratios.
For a linear function, a slope near zero indicates better smoothing, while the y-intercept represents power-generation magnitude. The goodness-of-fit is assessed using the coefficient of determination (R2), which quantifies alignment between the synthesized output and trend line, measuring deviation. Optimal smoothing is achieved when the slope is near zero, R2 is close to 1, and the y-intercept is relatively high.
An error analysis was performed using the mean absolute error (MAE), mean squared error (MSE), and root-mean-square error (RMSE) to evaluate discrepancies between the trend lines and actual output. Smaller error metrics indicate better smoothing [23]. Table 3 summarizes the results for different VPV and CPV system combinations. The coefficient of determination (R2) and error metrics indicated favorable performance for combinations between 50% and 70%. However, a more comprehensive evaluation indicated that the optimal VPV ratio lies between 40% and 70% owing to the near-flat slope of the trend line.

Table 3.
Analysis results for the various VPV ratios.
Next, the power output for each ratio was modeled using a normal distribution function, as shown in Figure 7. The bold line represents the range where the output deviation between 10:00 a.m. and 4:00 p.m. remains below the mean value. Extreme values and a right-skewed distribution benefit smoothing. A VPV ratio of 40–60% is considered optimal.
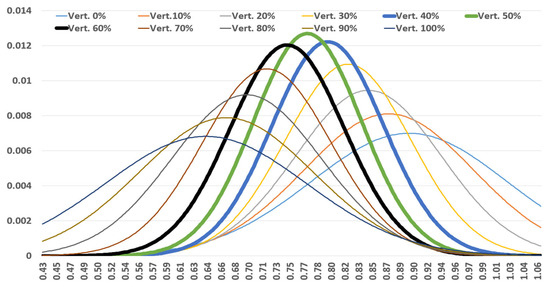
Figure 7.
Normal distribution of combined PV-generation patterns.
From these analyses, a VPV system ratio of 40–60% is optimal. This study aimed to refine the combination ratio by matching the combined PV output with actual load data and evaluating the resulting voltage fluctuations.
3.1.2. OpenDSS-Based Modeling
OpenDSS modeling is performed using the process flow chart in Figure 8 to evaluate the feasibility of integrating PV systems into the distribution grid. The study focused on an actual DL designated “H,” which experienced delays in PV-system interconnection. Although the selected “H” DL does not represent the full range of conductor types, PV plant configurations, or load conditions across all DLs, it effectively simulates actual operating conditions of DL with fully high PV penetration. Therefore, it was deemed appropriate for conducting a comparative analysis of VPV systems and ESS.
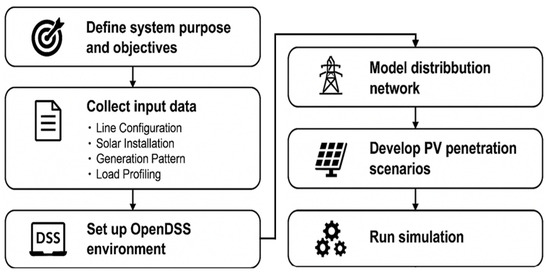
Figure 8.
OpenDSS modeling process flow chart.
The DL operates at 22.9 kV and meets the conditions presented in Table 4. The system configuration is shown in Figure 9. To increase computational efficiency while preserving key electrical characteristics, a simplified model was developed, as depicted in Figure 10. This model utilized critical parameters, e.g., line impedance, load capacity, and PV-system capacity and location, to accurately represent real-grid power-system conditions. Load data for the DL were based on gross load measurements from January to August 2023. Simulations were performed for combined PV-generation compositions ranging from 0% to 100% in 10% increments.

Table 4.
Modeling specifications for DL “H”.
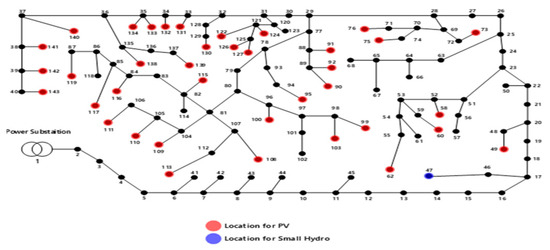
Figure 9.
Distributed system diagram of DL “H”.

Figure 10.
Abbreviated distributed system model of DL “H”.
3.1.3. Hosting-Capacity Enhancement Results and Thermal-Capacity Analysis
Simulations were conducted for various PV-generation combinations within DL “H” to evaluate the improvement in hosting capacity. The analysis focused on the voltage fluctuation ratio, which must comply with the operational requirements for 22.9 kV DLs in South Korea. The prescribed voltage range is approximately 20.8–23.8 kV (0.909–1.039 p.u.). This study examined the voltage fluctuation characteristics when integrating different PV-generation compositions, aiming to identify the maximum number of additional PV systems that can be accommodated within voltage regulation limits. The hosting-capacity improvement was derived accordingly [24].
Voltage fluctuation is influenced by the PV system’s peak power output and its correlation with the DL’s time-series load profile. The results for each simulation scenario are summarized in Table 5. The analysis assumed a total PV-system capacity of 10 MW, with varying VPV system compositions.

Table 5.
Maximum voltage increase rate for each PV ratio.
As shown in Table 6, the greatest hosting-capacity improvement occurred when the VPV system accounted for 60% of the total PV capacity. With this optimal ratio, an additional 2.3 MW of combined PV generation was integrated into the existing 10 MW-connected DL without requiring extra control measures.

Table 6.
Thermal-capacity analysis results for different PV ratios.
The thermal effects of current flow in high-voltage lines can cause degradation and fire hazards owing to excessive heat generation. Therefore, the thermal capacity of the DL was evaluated according to the conductor’s heat-dissipation characteristics. In South Korea, the operational capacity of power lines is determined by thermal capacity, which is crucial for assessing the maximum PV-system capacity that can be connected to a DL. The operational capacity is calculated by considering the worst weather conditions during the summer: ambient temperature of 40 degrees and continuous use temperature of 90 degrees [25].
The results indicated that with 12.3 MW of CPV in the PV system, the maximum thermal loading reached 9.61 MVA. No operational constraints were observed, as this value remained within the 10 MVA limit of the ACSR-160 [mm2] conductor.
3.2. Hosting-Capacity Enhancement for Smart Inverter-Based ESS
3.2.1. OpenDSS Modeling
ESS modeling was performed using the Storage code in OpenDSS, which can operate independently or be controlled by either the StorageController, which manages active power dispatch, or InvControl, which regulates active and reactive powers through various control functions. In this study, the ESS simulation used the InvControl method to regulate reactive power. The inverter capacity and battery capacity were set to 1 MW and 2 MWh, respectively. The ESS was integrated at the end of the DL. The simplified system configuration is shown in Figure 11.

Figure 11.
Abbreviated power-system model for DL “H” with an ESS.
3.2.2. Volt-Var Control of ESS (Ramp-Up and Step-Up Methods)
Although voltage regulation using the active power of an ESS is generally feasible, it requires a substantial battery capacity, limiting its economic viability. To address this, we propose increasing the hosting capacity through reactive power control.
Reactive power control is typically implemented using the Volt-Var control curve of conventional smart inverters, as shown in Figure 2. In this study, we introduced a modified voltage control strategy by adjusting the slope of the control curve and applying a step-up method. These adjustments aim to increase hosting capacity similarly to VPV systems.
Figure 12a,b show the voltage profiles obtained using the ramp-up and step-up methods. For the ramp-up method, multiple control slopes were evaluated, as shown in Table 7. The analysis indicated that achieving the same hosting-capacity improvement as the combined PV system under South Korea’s regulatory conditions requires approximately sevenfold inverter-capacity expansion (7 MW with a control rate of 0.44).

Figure 12.
Voltage profile at the end of the DL using reactive power control: (a) ramp-up control; (b) step-up control.

Table 7.
Required control rate and maximum voltage rise for each control curve.
For the step-up method, various step sizes, including 0.44, 0.88, and 0.96, were analyzed to assess their impact on hosting-capacity improvement. The results suggest that a scale-up factor of 0.96 is necessary to achieve an effect equivalent to that of combined PV-system interconnection. As this study focuses on hosting-capacity improvement in terms of installed capacity, the amount of generation is not considered.
3.2.3. Calculation of Battery and Inverter Capacity for Generation Shift
To simulate voltage regulation through active power control of an ESS, an analytical approach was used. The goal was to calculate the necessary battery storage and inverter capacity for transforming the CPV-generation pattern into that of a combined PV configuration. The generation patterns in this study were based on a scenario with a maximum hosting capacity of 12.3 MW for the combined PV system. As shown in Figure 13, these patterns match the data used in the OpenDSS simulation. The fundamental assumption was that ESS charging and discharging could effectively redistribute the peak generation of the CPV system to other periods, aligning with the combined PV-generation profile, while maintaining a consistent voltage rise during peak generation.
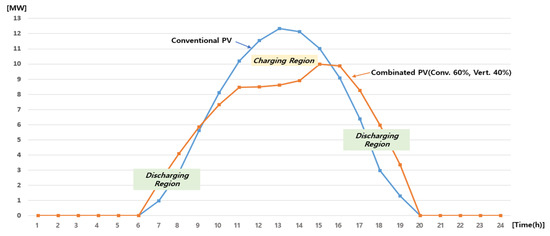
Figure 13.
Comparison of PV generation between conventional and combined PV systems.
Using this dataset, the required ESS storage capacity and power output were estimated. The ESS was assumed to utilize lithium-ion batteries with 90% charging/discharging efficiency, 80% depth of discharge, and an available state of charge (SOC) range of 10–90% [26].
The battery storage capacity was calculated by considering both the charging and discharging efficiencies. The power-generation difference between the two PV configurations was computed using hourly generation data, and the battery capacity was then estimated, incorporating the efficiency (η) and available SOC range. Table 8 indicates that the total charging capacity of the ESS—based on the difference in power generation when CPV output exceeds combined PV output—was 12.2 MWh. The total discharging capacity, based on the difference when combined PV output exceeds the CPV output, was 11.5 MWh, resulting in a net difference of 0.7 MWh. However, this discrepancy can be offset by discharging at night; thus, it was excluded from the final battery-capacity estimation. To determine the required smart-inverter capacity, the power-output difference between the two PV configurations was analyzed. The maximum output difference of 3.73 MW at 13:00 was used to define the inverter capacity. Ultimately, to achieve power-output smoothing for CPV generation, an ESS with a 15.3 MWh storage capacity (considering 80% SOC range) and 3.73 MW maximum output was required.

Table 8.
Calculation of battery capacity.
4. Conclusions
We aimed to increase hosting capacity in distribution grids through PV integration. By modeling a DL reflecting actual conditions, a combined PV system incorporating VPV and CPV systems was connected to shift peak solar generation from midday to later hours. The effectiveness of VPV integration was verified using OpenDSS, considering voltage regulation and thermal limits. The results confirmed that a combined PV configuration with 60% VPV and 40% CPV enabled an additional 2.3 MW of capacity integration without line reinforcements.
To quantitatively assess the hosting-capacity improvement due to VPV integration, a comparative analysis was performed using a smart inverter-based ESS. The control performance and battery capacity needed for an ESS to achieve the same hosting-capacity improvement as a 12.3 MW CPV system were investigated.
First, to implement reactive power control with smart inverters and minimize infrastructure costs related to mitigating voltage rise from PV-generation peaks, it was found that a 1 MW smart inverter could provide the same enhancement. However, instead of the ramp-up curve specified in existing DG standards, a step-up method was needed, requiring reactive power charge/discharge at 96% of the inverter’s rated capacity.
Second, to achieve the same improvement via active power control, an ESS with 3.73 MW/15.3 MWh capacity was needed. Given the high costs of constructing and operating such an ESS, its practical feasibility for large-scale deployment is considered low.
In summary, integrating VPV into the distribution system increases hosting capacity without additional control devices, allowing PV-capacity expansion. From an infrastructure perspective, this approach avoids the need for a 1 MW smart inverter and a 3.73 MW/15.3 MWh ESS, except when a 1 MW smart inverter is already installed. Utilizing VPV or a smart inverter-based ESS in DLs with high PV penetration can increase the hosting capacity by 23%, depending on the operational strategy. This helps mitigate challenges such as output curtailment and the duck curve effect, reducing uncertainties in distribution-grid operation [27]. Future research should focus on developing optimal operational strategies for increasing PV hosting capacity in distribution grids through economic analyses.
Author Contributions
Conceptualization, S.L.; Methodology, S.L. and J.L.; Formal analysis, S.L.; Investigation, G.K., S.S. and J.L.; Resources, G.K., S.S. and J.L.; Data curation, J.L.; Writing—original draft, S.L.; Writing—review & editing, S.L.; Visualization, S.S.; Supervision, S.L. All authors have read and agreed to the published version of the manuscript.
Funding
This research was funded by a KEPCO Research Institute (KEPRI) grant from the Korea Electric Power Corporation (KEPCO) (R24EA09).
Data Availability Statement
The original contributions presented in the study are included in the article, further inquiries can be directed to the corresponding author.
Conflicts of Interest
Authors Seungmin Lee, Garam Kim, Seungwoo Son, and Junghun Lee were employed by the company KEPCO Research Institute. The remaining authors declare that the research was conducted in the absence of any commercial or financial relationships that could be construed as a potential conflict of interest.
Abbreviations
| PV | Photovoltaic |
| VPV | Vertical PV |
| CPV | Conventional PV |
| IPV | Integrated PV |
| DL | Distribution line |
| ESS | Energy storage system |
| DG | Distributed generation |
| PCC | Point of common coupling |
| Volt-Var | Voltage–reactive power |
| SOC | State of charge |
References
- Paravantis, J.A.; Stigka, E.; Mihalakakou, G.; Michalena, E.; Hills, J.M.; Dourmas, V. Social acceptance of renewable energy projects: A contingent valuation investigation in Western Greece. Renew. Energy 2018, 123, 639–651. [Google Scholar] [CrossRef]
- Hernandez, R.R.; Easter, S.; Murphy-Mariscal, M.; Maestre, F.; Tavassoli, M.; Allen, E.; Barrows, C.; Belnap, J.; Ochoa-Hueso, R.; Ravi, S.; et al. Environmental impacts of utility-scale solar energy. Renew. Sustain. Energy Rev. 2014, 29, 766–779. [Google Scholar] [CrossRef]
- Integrated Photovoltaics. Available online: https://www.ise.fraunhofer.de/en/business-areas/solar-power-plants-and-integrated-photovoltaics/integrated-photovoltaics.html (accessed on 2 April 2025).
- Jang, S.J. Characteristics and research trend of agrivoltaics. Curr. Photovolt. Res. 2024, 12, 74–79. [Google Scholar]
- Libra, M.; Kozelka, M.; Šafránková, J.; Belza, R.; Poulek, V.; Beránek, V.; Sedláček, J.; Zholobov, M.; Šubrt, T.; Severová, L. Agrivoltaics: Dual usage of agricultural land for sustainable development. Int. Agrophys. 2024, 38, 121–126. [Google Scholar] [CrossRef]
- Slivina, E.; Bätzner, D.; Schmager, R.; Langenhorst, M.; Lehr, J.; Paetzold, U.W.; Lemmer, U.; Rockstuhl, C. Annual energy yield of mono- and bifacial silicon heterojunction solar modules with high-index dielectric nanodisk arrays as anti-reflective and light trapping structures. Opt. Express 2021, 29, 34494–34509. [Google Scholar] [CrossRef]
- Abdallah, A.A.; Kivambe, M.; Aïssa, B.; Figgis, B.W. Performance of monofacial and bifacial silicon heterojunction modules under desert conditions and the impact of PV soiling. Sustainability 2023, 15, 8436. [Google Scholar] [CrossRef]
- Baumann, T. Performance Analysis of Vertically Mounted Bifacial PV Modules on Green Roof System. In Proceedings of the 35th European Photovoltaic Solar Energy Conference and Exhibition (EU PVSEC), Brussels, Belgium, 24–27 September 2018. [Google Scholar]
- Reker, S.; Schneider, J.; Gerhards, C. Integration of vertical solar power plants into a future German energy system. Smart Energy 2022, 7, 100083. [Google Scholar] [CrossRef]
- Sun, X.; Khan, M.R.; Deline, C.; Alam, M.A. Optimization and performance of bifacial solar modules: A global perspective. Appl. Energy 2018, 212, 1601–1610. [Google Scholar] [CrossRef]
- Chudinzow, D. Vertical bifacial photovoltaics—A complementary technology for the European electricity supply? Appl. Energy 2020, 264, 114782. [Google Scholar] [CrossRef]
- Ismael, S.M.; Abdel Aleem, S.H.E.; Abdelaziz, A.Y.; Zobaa, A.F. State-of-the-art of hosting capacity in modern power systems with distributed generation. Renew. Energy 2019, 130, 1002–1020. [Google Scholar] [CrossRef]
- Ye, Y.; Wang, H.; Tang, Y. Market-based hosting capacity maximization of renewable generation in power grids with energy storage integration. Front. Energy Res. 2022, 10, 933295. [Google Scholar] [CrossRef]
- Bollen, M.H.J.; Rönnberg, S.K. Hosting capacity of the power grid for renewable electricity production and new large consumption equipment. Energies 2017, 10, 1325. [Google Scholar] [CrossRef]
- Jouttijärvi, S.; Thorning, J.; Manni, M.; Huerta, H.; Ranta, S.; Di Sabatino, M.; Lobaccaro, G.; Miettunen, K. A comprehensive methodological workflow to maximize solar energy in low-voltage grids: A case study of vertical bifacial panels in Nordic conditions. Sol. Energy 2023, 262, 111819. [Google Scholar] [CrossRef]
- Lee, S.; Lee, E.; Lee, J.; Park, S.; Moon, W. Strategy for enhancing hosting capacity of distribution lines using a vertical photovoltaic system. Energies 2024, 17, 1390. [Google Scholar] [CrossRef]
- Kim, G.-j.; Lee, T.-K.; Kim, J.-U. Analysis of power generation performance by applying operational algorithms for bifacial photovoltaic module. J. Korean Inst. Illum. Electr. Install. Eng. 2024, 68, 13–23. [Google Scholar]
- IEEE Std 1547-2018; IEEE Standard for Interconnection and Interoperability of Distributed Energy Resources with Associated Electric Power Systems Interfaces. IEEE Standards Association: Piscataway, NJ, USA, 2018.
- Park, S.-J.; Nam, T.-Y.; Cho, D.-I.; Lee, J.-W.; Lee, S.-M.; Kim, B.-K.; Kim, J.-C.; Moon, W.-S. Application of ESS aggressive Volt-Var control in the distribution system for hosting capacity enhancement. Trans. Korean Inst. Electr. Eng. 2023, 72, 1782–1788. [Google Scholar] [CrossRef]
- Kwon, S. Study on the Stabilization of Voltage Regulation in the Distribution System Considering Stochastic Solar Power Generation. In Proceedings of the 51st KIEE 2020, Busan, Republic of Korea, 15–17 July 2020; pp. 533–534. [Google Scholar]
- Yoon, K.-H.; Shin, J.-W.; Nam, T.-Y.; Kim, J.-C.; Moon, W.-S. Operation method of on-load tap changer on main transformer considering reverse power flow in distribution system connected with high penetration on photovoltaic system. Energies 2022, 15, 6473. [Google Scholar] [CrossRef]
- Lee, S.-M.; Lee, E.-C.; Lee, J.-H.; Yu, S.-H.; Heo, J.-S.; Lee, W.-Y.; Kim, B.-S. Analysis of the output characteristics of a vertical photovoltaic system based on operational data: A case study in Republic of Korea. Energies 2023, 16, 6971. [Google Scholar] [CrossRef]
- Chicco, D.; Warrens, M.J.; Jurman, G. The coefficient of determination R-squared is more informative than SMAPE, MAE, MAPE, MSE and RMSE in regression analysis evaluation. PeerJ Comput. Sci. 2021, 7, e623. [Google Scholar] [CrossRef]
- Regulations for the Use of Transmission and Distribution Electrical Facilities. Available online: https://recloud.energy.or.kr/ (accessed on 12 August 2025).
- Lee, H. An analysis study on the proposal for increasing hosting capacity in distribution feeders. Trans. Korean Inst. Electr. Eng. 2020, 5, 516–522. [Google Scholar] [CrossRef]
- Asri, L.I.M.; Ariffin, W.N.S.F.W.; Zain, A.S.M.; Nordin, J.; Saad, N.S. Comparative study of energy storage systems (ESSs). J. Phys. Conf. Ser. 2021, 1962, 012035. [Google Scholar] [CrossRef]
- Obara, S.; Konno, D.; Utsugi, Y.; Morel, J. Analysis of output power and capacity reduction in electrical storage facilities by peak shift control of PV system with bifacial modules. Appl. Energy 2014, 128, 35–48. [Google Scholar] [CrossRef]
Disclaimer/Publisher’s Note: The statements, opinions and data contained in all publications are solely those of the individual author(s) and contributor(s) and not of MDPI and/or the editor(s). MDPI and/or the editor(s) disclaim responsibility for any injury to people or property resulting from any ideas, methods, instructions or products referred to in the content. |
© 2025 by the authors. Licensee MDPI, Basel, Switzerland. This article is an open access article distributed under the terms and conditions of the Creative Commons Attribution (CC BY) license (https://creativecommons.org/licenses/by/4.0/).