Article

Parametric Evaluation of Coolant Channels for Proton-Exchange Membrane Fuel Cell Based on Multi-Pass Serpentine Flow Field

by
Qingsheng Liu
1,2,
Xuanhong Ye
3,4,
Hai Huang
3,
Junjie Cheng
3,
Kai Meng
1,
Qinglong Yu
3,
Junyi Liu
3,
Waqas Ahmad
3,
Zulkarnain Abbas
2,3,4,
Muhammad Aurangzeb
2,3,4,
Muhammad Ahmed
2,3,4,* and
Shusheng Xiong
2,3,4,5,*
1
Jiashan Power Supply Company, State Grid Zhejiang Electric Power Co., Ltd., Jiashan 314100,China
2
Provincial Key Laboratory of New Energy Vehicles Thermal Management, Longquan 323700, China
3
College of Energy Engineering, Yuquan Campus, Zhejiang University, Hangzhou 310027, China
4
Longquan Industrial Innovation Research Institute, Longquan 323050, China
5
Jiaxing Research Institute, Zhejiang University, Jiaxing 314016, China
*
Authors to whom correspondence should be addressed.
Energies 2025, 18(16), 4264; https://doi.org/10.3390/en18164264
Submission received: 25 June 2025 / Revised: 3 August 2025 / Accepted: 6 August 2025 / Published: 11 August 2025
(This article belongs to the Special Issue Challenges and Opportunities in the Global Clean Energy Transition)

Abstract

Proton-exchange membrane fuel cells (PEMFCs) stand out for their exceptional efficiency, high power density, and zero emissions, as they produce merely heat and water as byproducts. Appropriate and robust thermal management is the key to ensuring the maximum efficiency of the fuel cell (FC) as its optimum operating temperature is 70~80 °C. The current study was designed for the parametric evaluation of coolant channels (CCs) based on the multi-pass serpentine flow field (MPSFF) to investigate the relationship between channel geometry and thermal performance in PEM fuel cells, offering novel insights into optimal design configurations for improved thermal management. Six 3D computational models of PEMFCs with varying numbers of coolant channels were created and evaluated using COMSOL 6.2. The acquired results suggested that longer channel lengths with more serpentine turns cause the maximum number of hot spots around turns and offer a maximal pressure drop, whereas increasing the number of channels results in a uniform thermal distribution and leads to a minimal pressure drop. The findings indicate that systematic variations in geometrical configurations of MPSFFs can significantly enhance thermal uniformity and minimize the pressure drop, offering valuable insights for improving the efficiency of PEMFCs.

1. Introduction and Literature Review

Global demographic expansion, exponentially increasing energy demands, and anthropogenic climate challenges, including rising emissions and air pollution, demand a paradigm shift from carbon-intensive energy systems to clean, green, and sustainable energy solutions. As the global population is expected to surpass 8.9 billion by 2035, this will require additional energy resources to meet the needs of almost 720 million more individuals [1]. The current power generation system is the biggest contributor to global pollution, as the share of renewable energy in the electrical sector is only 30%. However, it remains challenging to expand the scope of renewable energy in other sectors, such as heating and transportation [2]. Therefore, this emphasizes the need for a clean, green, and sustainable energy solution to not only meet increasing energy demands but also contribute to achieving the goal of net-zero emissions by the middle of the century, set by the major economies of the world.
In recent years, PEMFCs have emerged as a highly promising and sustainable technology for clean energy generation as they offer a much higher energy density than conventional energy resources (gasoline/diesel) and even traditional renewable energy resources (solar and wind), which makes them particularly suitable for transportation applications. Furthermore, low-temperature PEMFCs offer many other benefits, including their quick startup, continuous operation, quick refueling, low operating temperatures, and minimal environmental impact as they primarily produce only water as a byproduct. Their scalability, versatility, and compact nature make them a promising solution for the decarbonization of the transportation sector [3]. Therefore, the adaptation of PEMFCs can play a pivotal role in bridging the renewable energy adaptation gap, particularly in heating and, especially, in the transportation sector, due to their compact size and high energy density.
A PEMFC is an electrochemical device that converts the chemical energy of reactants (hydrogen and oxygen) directly into electricity after a reaction and produces only heat and water as byproducts [4]. When operating, the fuel (hydrogen) and the oxidizer (oxygen) are supplied externally, and the system involves an exchange of both energy and matter with the environment, as hydrogen fuel must be replenished, and the byproducts (water) must be discharged. In principle, as long as the necessary reactants are continuously supplied and the reaction products are effectively removed, the FC can generate power without interruption, making it a highly efficient and sustainable energy solution [5,6].
The choice of a low-temperature PEMFC is due to its various advantages, which make it suitable for automotive, portable, and backup power applications. Its low operating temperature (60 to 80 °C) offers several benefits, including quick startup, as it is easy to reach this operating temperature in cold regions, typically taking from seconds to minutes. Another benefit is its rapid response to changing power demands. Further, the use of a solid polymer electrolyte membrane (PEM) and a compact catalyst layer enables very compact stack designs, which results in a high power density [7,8].
The smooth operation of a PEMFC is affiliated with the proper thermal management of the system. For a single cell, the overall heat generation rate (W/cm2) is given by the following equation:
q   = E t n E c e l l × i
where E t n refers to the thermal voltage (which gives the hypothetical voltage of the FC when the change in enthalpy is converted into electricity), i shows the current density (A/cm2), and E c e l l is the operating voltage. Therefore, the rate of heat generation is directly proportional to the current density and cell voltage, as given in Equation (1). As a result, the heat generation exceeds the power generation at higher current densities in PEMFCs. This causes critical challenges in thermal management, especially for vehicle applications in which a higher current density is required.
The performance of the stack is greatly impacted by temperature. When the stack temperature is low, the chemical reaction’s activation energy inside the cell is larger, and the activation loss increases. Lower temperatures also lead to lower conductivity and increased ohmic polarization. At the same time, the expansion rate of the gas decreases at low temperatures, and the concentration polarization increases. Similarly, at very high temperatures, the water content of the proton-exchange membrane (PEM) decreases, and the conductivity and transport characteristics of the membrane decrease, which increases the ohmic loss and concentration loss and decreases the output performance of the stack [9,10,11,12].
Furthermore, excessively high temperatures can dry out the membrane, and over time, this may lead to damage in both the membrane and the catalyst layers [13]. Very low temperatures can reduce catalyst activity and increase the risk of water buildup, leading to flooding inside the cell [14,15]. Temperature impacts nearly all the transport properties of an FC, and studies suggest that thermal management systems can account for up to 8% of the total stack design in some cases [16,17]. Therefore, the proper thermal management of PEMFCs is necessary, and the main objective of thermal management is to maintain PEMFCs within an optimal temperature range (70–80 °C) to ensure maximum efficiency [18].
However, effectively cooling a PEMFC stack in real-world applications is quite challenging. In practice, multiple single cells are combined to form a stack, which makes uniform temperature control even more difficult [19]. As a result, the temperature across the cells in the stack can become uneven. Addressing thermal management is the key to improving PEMFC stack performance and durability [20]. Various thermal management techniques can be used, such as edge cooling, separate airflow cooling, air cooling, cooling with the cathode air supply, phase change cooling, and liquid cooling. Each method has its own advantages and limitations, making the choice dependent on specific system requirements [18]. Due to its high heat removal capability and simple operation, liquid cooling is preferred in all FC electric vehicles (FCEVs). Typically, coolant channels are engraved in the bipolar plates, and the coolant is circulated in those coolant channels with the help of liquid pumps [21]. Serpentine designs are widely recognized as the industry standard because of their excellent performance and their ability to maintain a uniform thermal distribution. They are often used as a benchmark when evaluating or developing new flow field configurations [22,23].
Despite significant advancements in the design and analysis of SFFs for PEMFCs’ thermal management, there remain critical gaps in our understanding of the interplay between the impact of varying channel counts and channel widths of multi-path serpentine flow fields (MPSFFs). Previous studies have predominantly focused on limited configurations and simplified geometries, often neglecting the combined effects of varying channel counts and channel widths on the fluid dynamics and heat transfer efficiency of SFFs. Existing studies often isolate design parameters (e.g., varying channel counts, varying channel widths, or comparing different types of FFs). A few research studies have considered the combined effect of varying channel counts and widths by holistically addressing their coupled impact on thermo-electrochemical performance. For instance, prior works typically explored fixed channel widths while varying channel counts (or vice versa).
For instance, Yihong Gu et al. [24] demonstrated that coupling LBM-LES effectively models high-speed gear lubrication with baffles, revealing optimal baffle designs that enhance fluid enthalpy and vorticity while maintaining stable oil film formation at radial speeds of 8 m/s. This approach provides insights into turbulence control and energy dissipation, which are critical for aerospace and industrial applications. Similarly, Yunfeng Tan et al. [25] reviewed advancements in SAF, highlighting the integration of ultrasonic and magnetic fields to enhance turbulence and abrasive particle kinetics. Techniques like CFD-DEM coupling and PIV measurements have elucidated particle–wall interactions and cavitation effects, improving surface finish uniformity and efficiency. For example, gas–liquid–solid three-phase flows with microbubbles were shown to increase fluid velocity by 20%, significantly boosting polishing performance for hard materials like optical glass and silicon wafers.
S.M. Rahgoshay et al. [10] analyzed the index of uniform temperature (IUT), pressure drops, and temperature gradients of two different types of flow fields (SFF and Parallel FF) and found that SFF outperformed Parallel FF by 24%. Yang Wang et al. [26] investigated six different PEMFC models by integrating six different CFFs (single serpentine channel, triple serpentine channels, quintuple serpentine channels, and two configurations with mixed serpentine channels (I–V and V–I)) to obtain a better temperature distribution and found that V–I yielded the best performance. Xin Xu et al. [27] compared two novel CFFs (A and B) with the traditional SFF through numerical modelling. They found the A novel CFF was the best CFF in terms of cooling performance.
Xuanyu Liu et al. [28] compared three different CFFs (parallel flow field (PFF), parallel serpentine flow field (PSFF) along the Y-axis, and PSFF along the X-axis) in terms of thermal performance and found that the PSFF along the X-axis contributes to the effective thermal management of PEMFCs. Similarly, Ben Chen et al. [29] analyzed the impact of the different coolant directions and found that when the coolant flow direction is the same as that of the reactants, an improved IUT is achieved and the coolant temperature difference is less than 6 K. Zhang et al. [30] also analyzed a metallic PEMFC structure by integration with a wavy flow field. Their study demonstrated that the thermal distribution is more uniform when the CFF is has the same direction as that of the cathode.
Moreover, while the remarkable advantages of SFFs are well documented, the pressure drop remains a significant challenge. Numerous researchers have attempted to address this issue using various techniques, but there remains a research gap. The study by Xuanyu Liu et al. [28] highlighted an important observation regarding pressure drops in their research, in which they found that while the PSFF along the X-axis provided improved thermal management, it also resulted in a pressure loss that was consistently 1.06 times higher than that of the PFF. This emphasizes the challenge of optimizing the trade-off between cooling efficiency and pressure loss in MPSFFs. Specifically, the research indicated that while reducing the number of channels in a manifold is beneficial for enhancing the uniformity of flow, it inevitably leads to an increase in the pressure drop within the CFFs. This underscores the need for further analyses to balance improved cooling performance and acceptable pressure losses.
Seung Man Baek et al. [31] also assessed the performance of parallel MPSFFs in designing a flow field for a larger cooling plate measuring 18 cm × 18 cm. Their findings indicated that parallel MPSFFs demonstrated a superior cooling efficiency compared to conventional parallel SFFs, while the pressure drop characteristics remained similar when the number of parallel channels was unchanged. The study attributed the improved temperature uniformity in parallel MPSFFs to their highly intertwined structure.
Similarly, G Amarnath et al. [32] conducted a CFD analysis of a PEMFC using ANSYS Fluent 17.2, comparing two different flow configurations: the dual serpentine flow field (DSFF) and the split serpentine counter flow field (SSCFF). The DSFF consisted of two distinct single serpentine flow fields within the active region of the FC, whereas the SSCFF was designed with a counterflow arrangement to enhance thermal management. The study revealed that the SSCFF configuration demonstrated a superior performance in terms of temperature regulation and uniformity across the FC system compared to the DSFF.
Extensive research on the thermal performance of PEMFCs has provided a thorough evaluation of various coolant flow field (CFF) configurations, particularly serpentine flow fields (SFFs) used with bipolar plates or cooling plates. These studies have rigorously examined aspects such as temperature distribution, heat dissipation efficiency, and overall thermal behavior and have proposed that the SFFs greatly enhance all these parameters. Variations in SFFs’ design configurations can augment the effective coolant fluid distribution and could help in keeping PEMFCs under an ideal operating temperature [2]. While these investigations emphasize the importance of effective thermal regulation, they also consistently highlight the often overlooked need to address pressure drops.
To bridge this gap, the present study focuses on advanced computational fluid dynamics (CFD) modeling of multi-pass serpentine flow fields (MPSFFs). It aims to systematically analyze channel geometry to both optimize thermal management and minimize pressure losses within the flow field. This dual optimization is expected to significantly enhance the efficiency and operational performance of PEMFC systems.
While existing studies have explored various aspects of CFFs, few have investigated the impact of geometric variations in MPSFFs, particularly the number of channels. Increasing the number of channels has shown promise in improving both the thermal uniformity and reducing pressure drops. He Lu et al. [33] studied the impact of increasing the number of channels on the reactant distribution in PEMCs and indicated that increasing the number of channels of SFFs makes the length of individual channels shorter, which improves the fluid supply capacity and distribution uniformity. Further, they concluded that the increased number of channels has a shunt-like effect on the fluid, which significantly minimizes the pressure drop.
However, the effectiveness of SFFs in maintaining a uniform thermal distribution and reliable coolant flow has led to them being a widely adopted design in proton-exchange membrane fuel cells (PEMFCs). Despite their popularity, recent studies have highlighted the potential for further performance improvements through careful geometric optimization of the flow field. Specifically, variations in the number of the channels can significantly enhance the thermal distribution and reduce pressure drops within the flow path. Existing research has demonstrated that even modest adjustments to the channel geometry can lead to better heat management and more efficient coolant flow. By systematically evaluating the impact of the number of channels, it is possible to optimize the thermal profile and minimize the pressure drop, which are the two critical factors that directly influence the efficiency and longevity of PEMFCs. Given the limitations of traditional SFFs and the significant gap in the literature regarding geometric optimization, this study focuses on the dual optimization of multi-pass serpentine flow fields (MPSFFs). The aim is to enhance thermal management while simultaneously reducing pressure drops, addressing these key challenges to improve the overall performance of PEMFCs.
Furthermore, the most compelling aspects of geometric variation in MPSFFs are their simplicity and cost-effectiveness. Unlike complex multi-material or multi-layer designs, adjusting the number and width of channels is a straightforward modification that can be implemented without the need for expensive materials or intricate manufacturing processes. This makes it an attractive approach for improving PEMFC performance, especially in commercial applications for which cost and efficiency are critical factors.
This study uses numerical simulations to evaluate the cooling efficacy and pressure drop of CFFs based on MPSFFs in a PEMFC. For this purpose, six three-dimensional (3D) computational models were developed using COMSOL Multiphysics 6.2. This investigation aimed to optimize the cooling capabilities of MPSFFs and to minimize the pressure drop, which plays a critical role in maintaining the operating temperature of PEMFCs within an ideal range. The novelty of this study is the dual optimization of the coolant flow field (CFF) configuration based on a multi-path serpentine flow field (MPSFF) strategy to enhance the thermal distribution uniformity while minimizing the pressure drop in PEMFCs and the proposed geometrical designs, which are not only structurally effective but also inherently simple, making them highly practical and cost-efficient for real-world manufacturing and integration.

2. Model Description

2.1. Geometrical Modeling

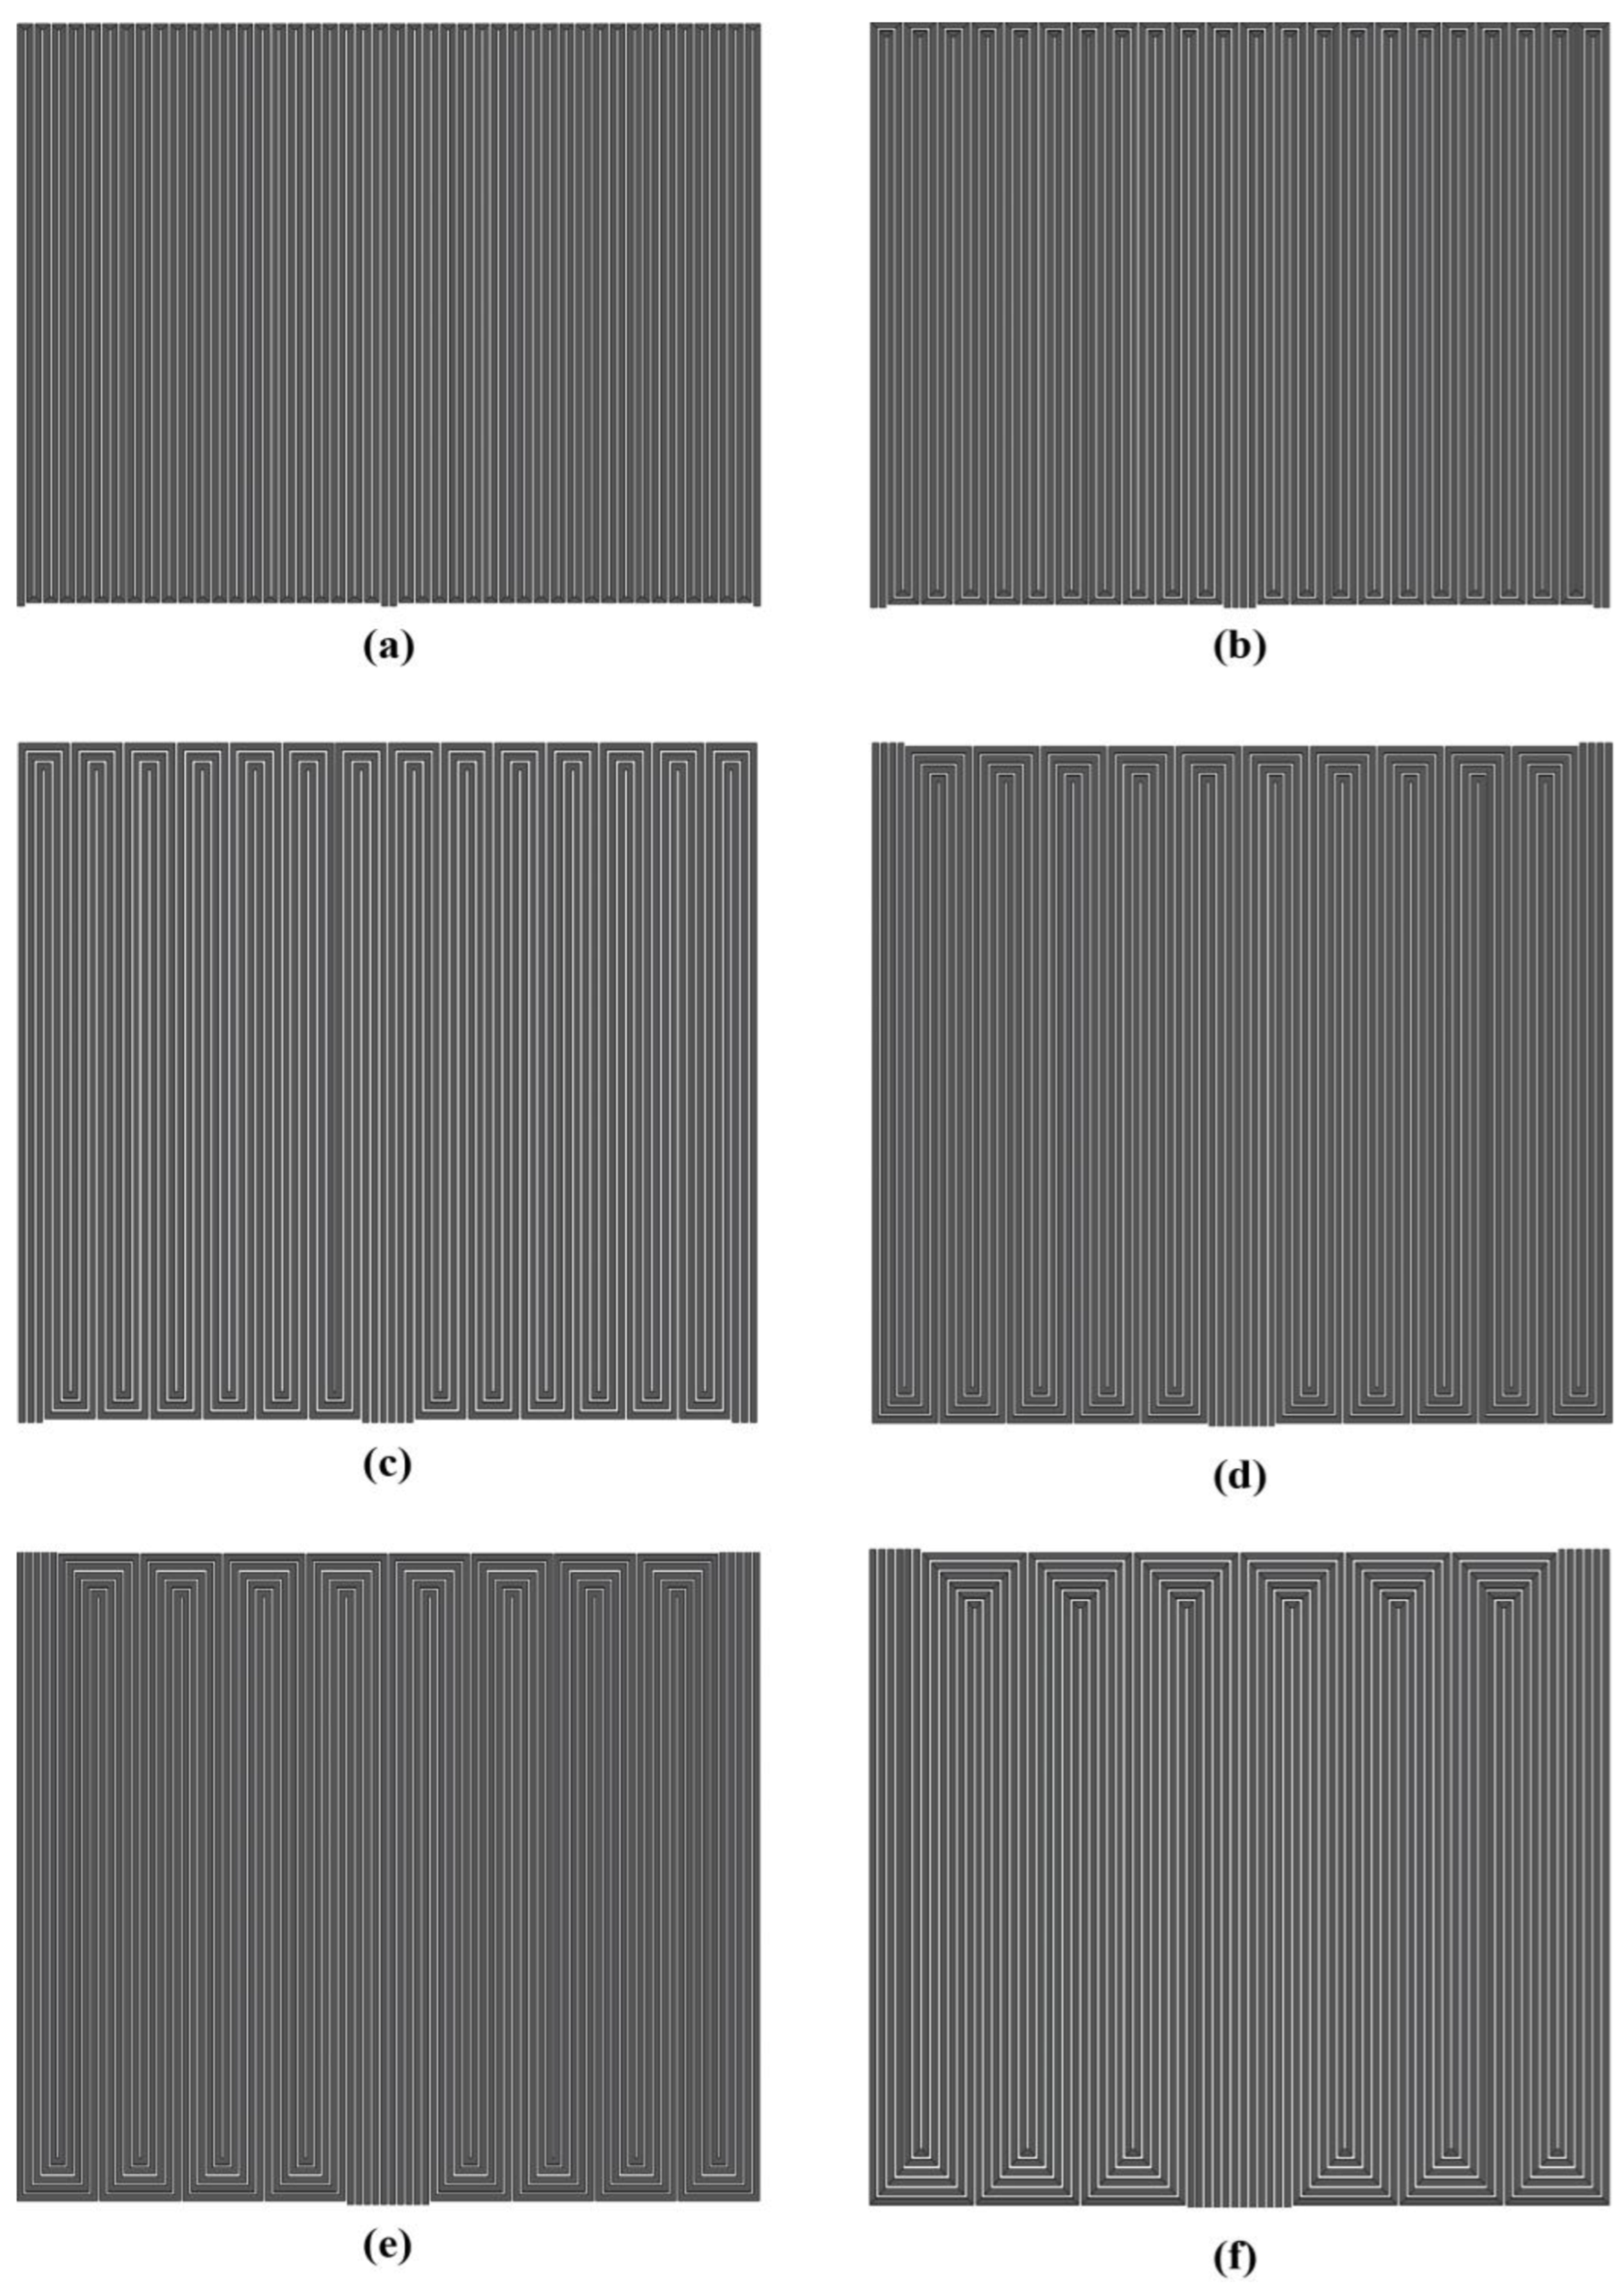
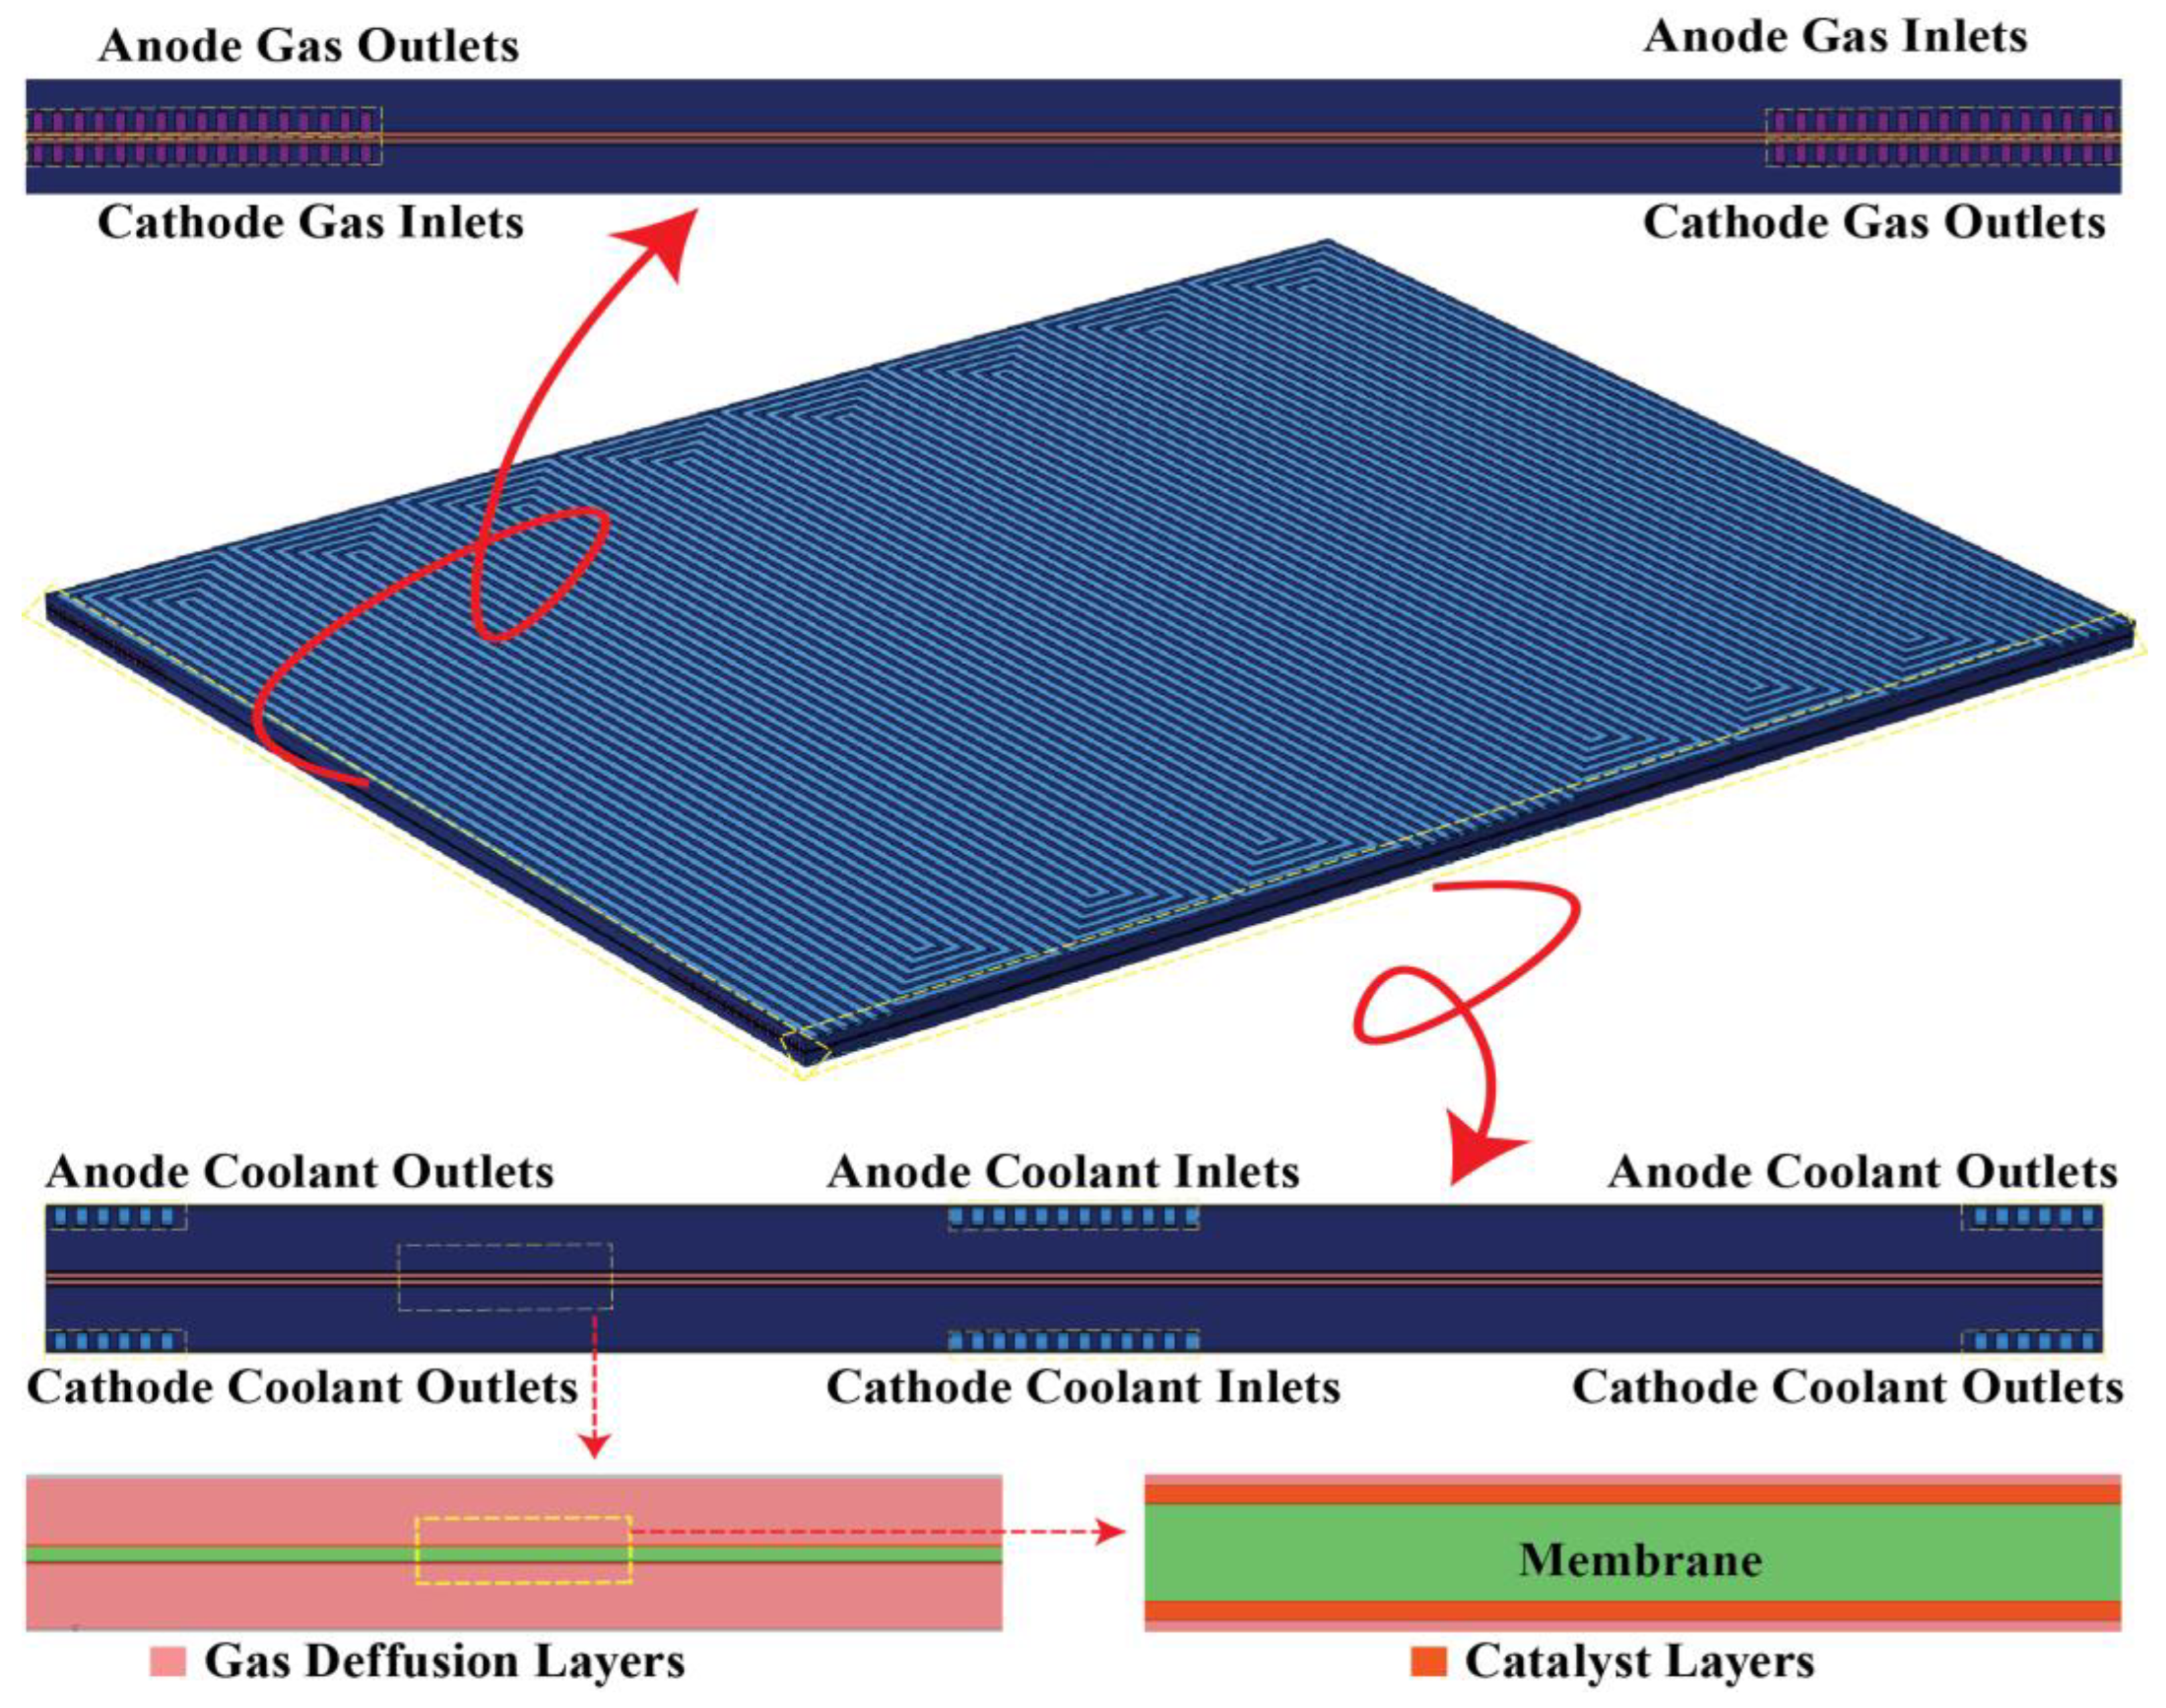
Six computational models with distinct configurations of CFFs, all having a fixed channel width of 1.5 mm and varying numbers of channels, ranging from two to twelve channels (two, four, six, eight, ten, and twelve) were designed, which are depicted in Figure 1. The 3D layout of the structural model of all the components including the CFFs, gas channels, GDL, CL, and membrane is shown in Figure 2. Detailed geometrical specifications for all these components except for those of the coolant channels are provided in Table 1, and the geometrical parameters of the coolant channels are presented in Table 2.
Experimental data from previous fuel cell (FC) studies were comprehensively analyzed at the initial stage of this research to establish accurate and reliable baseline parameters for designing the structure of the above model. Subsequently, six FC models were designed by integrating the MPSFFs with them to provide a comprehensive analysis. The gas flow fields utilized in this study are consistent across all of the six models, comprising 17-path serpentine gas flow channels. Each channel is designed with a uniform width and height of 1 mm, ensuring geometric consistency throughout the configurations. This specific cross-sectional design was chosen because it aligns with findings from previous research. For instance, S. Toghyani [34] demonstrated that reducing the cross-sectional area of gas flow channels can significantly enhance the performance of PEMFCs. The reduction in channel width, in particular, leads to an improved gas distribution, enhanced reactant availability, and better water management within the cell, thereby optimizing the overall cell efficiency. So, the deliberate selection of these dimensions reflects an evidence-based approach to achieving a PEMFC system with a superior thermal and electrochemical performance.

2.2. Computational Model

The computational models presented in this study were designed to simulate fluid flow and thermal characteristics in PEMFCs with different CFF configurations. To effectively fulfill the objectives of this study, the computational model was developed with a comprehensive and detailed representation of all essential components of the PEMFC. These components include the gas diffusion layers (GDLs), catalyst layers (CLs), polymer electrolyte membrane (PEM), gas flow fields, and coolant flow fields (CFFs). Such an integrated modeling approach is crucial for accurately capturing the complex interactions of electrochemical reactions, heat transfer, and fluid flow within the cell. For this study, the active area was defined as 50,000 mm2, corresponding to dimensions of 200 mm in width and 250 mm in length. This specification ensures a highly realistic representation of practical PEMFC configurations, offering a robust foundation for the accurate evaluation of the thermal performance of various CFF geometries. All the numerical models were solved by using COMSOL 6.2, and all the physics parameters utilized are listed in Table 3.
To solve all the computational models, an XFUSION (Zhengzhou, China) computer was used, which consisted of an Intel Xeon Platinum 8374C processor, with 72 physical cores, 84 logical cores, a processor base frequency of 2.70 GHz, and a max turbo frequency of 4.40 GHz. The system is equipped with a total of 512 GB of RAM and 10 TB of ROM, running on Windows Server 2019. The time taken by each model to converge was about 7 h. To optimize the solver time and enhance the computational efficiency, we employed the biconjugate gradient stabilization (BiCGStab) solver, which is known for its effectiveness in solving large and complex numerical simulations. We configured the solver with a relative tolerance of 0.001 to balance performance and accuracy. In addition, we incorporated the F-cycle multigrid preconditioner with 60 levels to accelerate the convergence process. The choice of 60 levels was made to optimize the convergence further. Each model required approximately 75 GB of physical memory (RAM). The combined use of the BiCGStab solver, a relative tolerance of 0.001, and the F-cycle multigrid preconditioner allowed us to strike an optimal balance between computational efficiency and solution accuracy. Despite the substantial memory demand (75 GB of physical memory), these settings helped reduce the solver time while ensuring precision.
The study assessed thermal performance metrics such as the temperature uniformity across the cell, peak operating temperature at the membrane, maximum temperature of CFFs, average temperature of CFFs, average temperature of the membrane, index of uniform temperature, and pressure drop in CFFs. To access the IUT, the following expression was employed:
I U T = A | T T a v g | d A A d A
T a v g = A T d A A d A
where T is the local temperature at a specific point on the surface, T a v g is the average temperature of the surface, and A is the total surface area.

2.2.1. Boundary Conditions

The following boundary conditions were considered to replicate the operational characteristics of a PEMFC under realistic conditions while maintaining computational efficiency and ensuring accurate simulation results:
  • The geometry was constructed in three dimensions;
  • The flow was set to be laminar and compressible;
  • Models were studied under a steady-state condition;
  • Terminals and side boundaries were treated as thermally insulated;
  • At outlets, the flow was considered fully developed;
  • At walls, zero diffusive flux was considered;
  • Periodic conditions were used for top and bottom boundaries;
  • Inflow and outflow boundaries were used to ensure that the only heat transfer occurring across the boundaries was through the flowing coolant in FFs by convection;
  • Periodic boundary conditions were used to predict the stack-level behavior of a single cell with a reduced computational cost;
  • Gravitational impact was neglected.
To emulate the thermal behavior of a practical FC stack, periodic temperature boundary conditions were applied to the top and bottom boundaries of the computational domain. This approach replicates the thermal coupling between adjacent cells in a stacked configuration, in which the heat generated in one cell influences its neighbors. By enforcing thermal periodicity, the model captures longitudinal heat propagation and stack-level temperature gradients without the computational expense of simulating an entire stack.

2.2.2. Mesh Independence Test

In computational studies, one of the important aspects that affects the simulation results is mesh independence. In PEMFC studies, mesh independence is particularly of great importance as they involve coupled multiphysics phenomena, fluid dynamics electrochemical reactions, mass transfer, and heat transfer. A poorly resolved mesh can lead to improper reaction rates and incorrect predictions of results. Achieving mesh independence ensures that the numerical results are artifacts of the discretization process and accurately represent the applied physics. Therefore, a mesh-independent solution strengthens the confidence in the prediction capability of the studied models and ensures the predicted trends are physically meaningful.
The meshing process for the studied models was performed using COMSOL 6.2. To ensure grid independence, the number of elements was systematically increased from 0.7 million to 4.5 million. A noticeable deviation in current density can be observed in Figure 3 from 0.7 to 2.3 million mesh, and this deviation is above 1%, whereas when the element count exceeded 2.3 million, the current density value stabilizes and the deviation becomes minor (under 1%). Keeping in mind the computational resources and the time requirements for computing the models, the mesh count of 2.3 million elements was utilized. In addition, the deviation in current density remained under 1% from 2.3 to 4.5 million mesh elements, which made it reasonable for further analysis. The number of mesh elements and the mesh quality in all six of the models are similar due to the fact that the overall dimensions of all the models are the same, i.e., 200 mm × 25 mm × 6.15 mm, and the difference is only in regards to channel count.
To further strengthen the mesh independence, the values for the maximum temperature were extracted to examine the impact of a different number of mesh elements. In Figure 4, the maximum temperature can be observed with a mesh element quantity of 0.7 million and 1.3 million, whereas when the element quantity ranged from 2.3 million to 4.5 million, the variation in the value for the maximum temperature stabilizes within an acceptable limit (<1%). Therefore, the mesh element quantity of 2.3 million was utilized for further computing. These were allocated based on the complexity and resolution requirements of each component. The bipolar plates and flow channels accounted for about 0.4 million elements, the GDLs for 0.6 million, the catalyst layers (CLs) for 0.5 million, the microporous layers (MPLs) for 0.3 million, and the membrane for approximately 0.5 million elements.

2.2.3. Model Validation

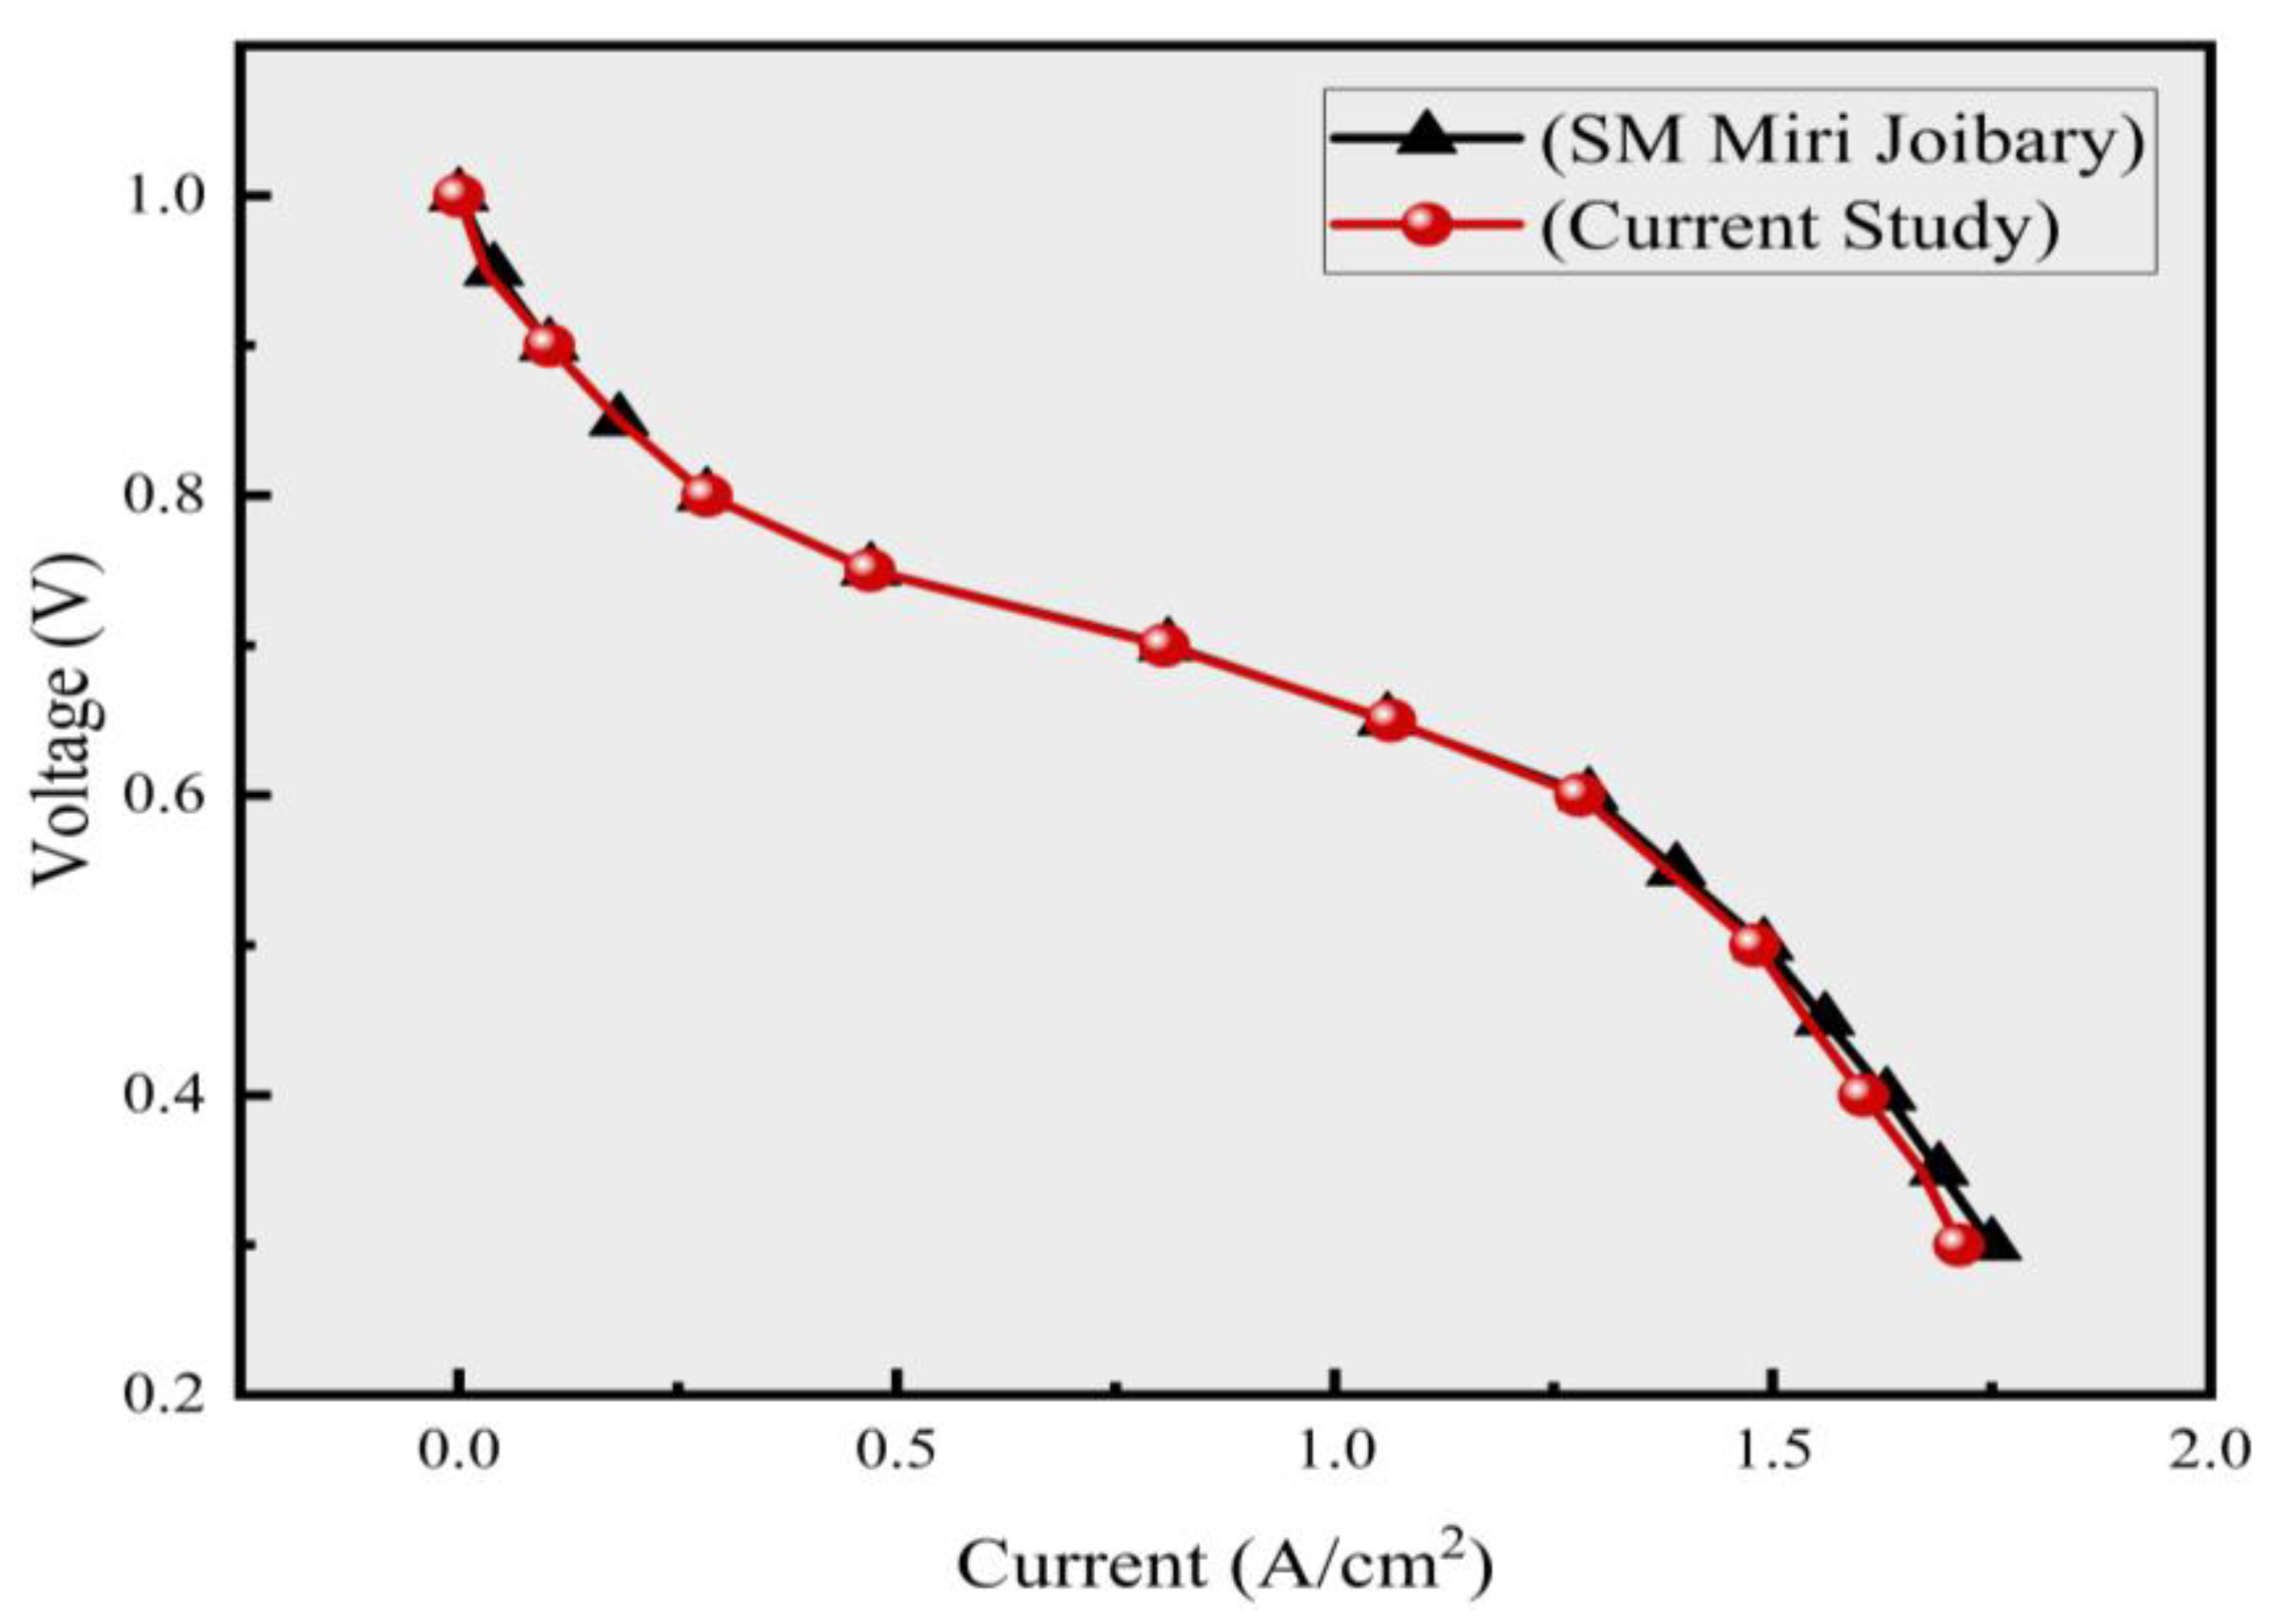
To guarantee the reliability and accuracy of the computational model, validation against experimental or numerical benchmarks is essential. However, the experimental testing of FC components at the microscopic level, such as the membrane, GDL, and catalytic layer, is often prohibitively expensive and technically challenging due to their complex geometries and operating conditions. Consequently, it is standard practice to validate simulation results using widely accepted datasets from the peer-reviewed literature. In this study, a rigorous comparative analysis was conducted by benchmarking the simulation outcomes of the model with 12-path CFFs with a 1.5 mm width against a prior established study [35].
In the present work, water was used as a coolant, and the inlet boundary condition was set to the velocity inlet with a specific inlet velocity and inlet temperature. At the outlet of the coolant channels, the boundary condition of a fully developed flow was considered. The results show consistency with the reported work. A quantitative comparison of I/V values is provided in Table 4, and the polarization curve shown in Figure 5 confirms the validity of the present study. The validation outcomes are associated with the 12-channel model, which exhibited an optimal performance across the six configurations. This robust validation ensures that the simulation aligns closely with established thermal behaviors, enhancing its reliability for practical, real-world applications.

2.2.4. Governing Equations [35]

A PEMFC is a multiphysics system that contains different coupled phenomena during its operation, including the mass transport of species (H2, O2, H2O, and N2) associated with fluid flow, heat transfer, and electrochemical reactions. The numerical modeling of those phenomena involves the physical and chemical processes generally occurring in a PEMFC and was solved numerically using a set of conservation equations and transport equations, such as mass, energy, and momentum conservation equations, electrochemical reaction equations, and mass transfer equations.
Mass Conservation (Continuity Equation)
This ensures that reactants and products properly account for the flow of reactant gases (hydrogen and oxygen) and the production of water within the FC.
The gas continuity equation is as follows:
ϵ g ρ g t + ϵ g ρ g V g = R r e a c t i o n R p h a s e
where ϵg: the porosity of the porous medium (e.g., GDL or CL), ρg: the density of the gas mixture, vg: the velocity vector of the gas phase, Rreaction: the source term representing the mass consumed or generated due to chemical reactions (e.g., hydrogen and oxygen consumption and water production), and Rphase: the phase change term representing the conversion between water vapor and liquid water (condensation or evaporation).
R r e a c t i o n = M O 2 4 F j c a t h o d e + M H 2 O 2 F j c a t h o d e ( Cathode   Catalyst   Layer )
where M O 2 : the molar mass of oxygen, M H 2 O : the molar mass of water, F: the Faraday constant (96,485 C/mol) representing the charge of one mole of electrons, and j c a t h o d e : the local current density at the cathode.
R r e a c t i o n = M H 2 2 F j a n o d e ( A n o d e   C a t a l y s t   L a y e r )
R r e a c t i o n = 0   ( O t h e r   R e g i o n ) ( A n o d e   C a t a l y s t   L a y e r )
where M H 2 : the molar mass of hydrogen, j a n o d e : the local current density at the anode, F: the Faraday constant (96,485 C/mol) representing the charge of one mole of electrons, single term: represents hydrogen consumption during the anode reaction, and Rreaction is specific to each layer, capturing the consumption of reactants.
The liquid continuity equation is as follows:
ρ l v l = R p h a s e ( L i q u i d   W a t e r   T r a n s p o r t )
where ρ l : the density of liquid water, v l : the velocity of liquid water flow, and R p h a s e : the source term representing the phase change between water vapor and liquid water (e.g., condensation or evaporation).
ρ c o o l v c o o l = 0   ( C o o l i n g   F l u i d   T r a n s p o r t )
where ρ c o o l : the density of liquid water and v c o o l : the velocity of liquid water flow.
The momentum conservation (Navier–Stokes) equation is as follows:
ϵ ρ g V g V g = p + τ ( M o m e n t u m   C o n s e r v a t i o n   f o r   G a s e s )
where ϵ : the porosity of the medium (e.g., GDL), ρ g : the density of the gas mixture (dependent on temperature, pressure, and species concentration), V g : the velocity vector of the gas phase, P: the pressure of the gas phase, and τ: the viscous stress tensor, representing the momentum dissipation due to viscosity.
ρ c o o l V c o o l V c o o l = τ μ c o o l α V c o o l ( M o m e n t u m   C o n s e r v a t i o n   C o o l a n t )
where ρ c o o l : the density of the coolant (constant for incompressible flow), V c o o l : the velocity vector of the coolant flow, μ c o o l : the dynamic viscosity of the coolant, and α: the permeability of the medium, representing resistance in porous layers.
The energy conservation (heat transfer) equation is as follows:
ρ c p e f f v g T = k e f f T + S t e m p ( G a s   P h a s e   H e a t   T r a n s f e r )
where ρ c p : the effective heat capacity of the gas-phase medium, v g : the velocity of the gas flow (for convective heat transfer), k e f f : the effective thermal conductivity of the region (e.g., GDL and gas channels), S t e m p : the total heat generation in the region, and S t e m p represents the heat generated due to various mechanisms within the PEMFC.
S t e m p = I 2 σ c c ( Current   Collectors ) r w h L ( Gas   Channels ) I 2 σ G D L + r w h L ( GDL ) I 2 σ m + r w h L ( Membrane ) η a n o d e , c a t h o d e + I 2 1 σ m + 1 σ s + r w h L ( CL )
where I 2 σ : the heat generated due to resistance in current collectors (σcc), GDL (σGDL), membrane (σm), and catalyst supports (σs); η a n o d e , c a t h o d e : the heat generated due to exothermic electrochemical reactions at the anode and cathode; I: the current density (the amount of current flowing through a unit area); r w : the rate of water production or phase change in the given region; and h L : the latent heat of vaporization (or condensation) of water.
ρ c o o l C p c o o l V c o o l T = k e f f T ( C o o l a n t   H e a t   T r a n s f e r )
where ρ c o o l C p c o o l : the density of the coolant (constant for incompressible flow), V c o o l : the coolant velocity (driving convective heat removal), and k e f f : the effective thermal conductive species transport equation (diffusion and convection).
ρ g v g Y i = J i + S i ( S p e c i e s   T r a n s p o r t   E q u a t i o n )
where the left-hand side represents the convective transport of species i in the gas phase, ( J i ) accounts for the diffusion of species i , and S i : the source or sink term for species i due to chemical reactions or phase changes.
J i = j = j = 1 N 1 ρ g D i j Y j ( D i f f u s i v e   F l u x )
where ρ g : the gas-phase density and D i j : the binary diffusion coefficient between species i and j .
D i j = D i j 0 P 0 P T T 0 γ T ( B i n a r y   D i f f u s i o n   C o e f f i c i e n t )
where D i j 0 : the reference diffusion coefficient at a standard pressure ( P 0 ) and temperature ( T 0 ) , p: the local pressure, t: the local temperature, and γ T : the temperature dependence exponent.
S o u c e   T e r m   S i = S H 2 = M H 2 2 F j anode   S H 2 O = n a M H 2 O F I m r w ( Anode   CL ) S O 2 = M O 2 4 F j cathode   S H 2 O = M H 2 O 2 F j cathode   + n a M H 2 O F I m r w ( Cathode   CL )   S H 2 O = n a M H 2 O F I m r w ( Membrane ) r w = n a M H 2 O F j cathode   ( Water   Phase   Change   Rate )
where M H 2 : the molar mass of hydrogen, M h 2 o : the molar mass of water, F : the Faraday constant, j anode   : the current density at the anode, I m : the proton current density gradient, r w : the water phase change rate, M O 2 : the molar mass of oxygen, and j cathode   : the current density at the cathode. Water transport in the membrane is driven by proton drag ( I m ), the water phase change is driven by ( r w ), and S i represents the production or consumption of species i .
The charge conservation equation is as follows:
σ m ϕ m = S e m ( M e m b r a n e   P h a s e   P o t e n t i a l )
S e m = R a ( Anode   Catalyst   Layer   ( ACL ) ) R c   ( Cathode   Catalyst   Layer   ( CCL ) )  
where σ m : the proton conductivity of the membrane (s/m), ϕ m : the electric potential in the membrane (v), S e m : the source term for the membrane potential, representing proton transfer due to electrochemical reactions, and ( R a ) and ( R c ) : the reaction rates, which are derived from Faraday’s law.
σ s ϕ s = S e s
S e s = R a ( Anode   Catalyst   Layer ) R c ( Cathode   Catalyst   Layer )
where σ s : the electrical conductivity of the solid (s/m), ϕ s : the electric potential in the solid phase (v), S e s : the source term for the solid-phase potential, representing the electron transfer due to electrochemical reactions, and ( R a ) and ( R c ) : the reaction rates, which are derived from Faraday’s law.
Electrochemical Kinetics (Butler–Volmer Equation)
This equation governs the rate of the electrochemical reactions at the electrodes, considering both the anodic and cathodic reactions.
The anode Butler–Volmer equation is as follows:
j anode   = j anode   ref   C H 2 C H 2 ref   γ anode   exp α anode   F η anode   R T e x p α cathode   F η anode   R T
Here, overpotential at the anode ( η anode ) is defined as follows:
η anode     =   ϕ s anode       ϕ m     E e q anode  
where j anode   : the local current density at the anode a / m 2 , j anode   ref   : the reference exchange current density at standard conditions, C H 2 : the local hydrogen concentration, C H 2 ref .   : the reference hydrogen concentration, γ anode   : the reaction order with respect to hydrogen, α anode   , α cathode   : the anodic and cathodic transfer coefficients, respectively, ϕ s anode   : the solid-phase potential at the anode, ϕ m : the membrane-phase potential, and E e q anode   : the equilibrium potential of the hydrogen oxidation reaction.
The cathode Butler–Volmer equation is as follows:
j cathode   = j cathode   ref   C O 2 C O 2 ref   γ cathode   e x p α cathode   F η cathode   R T e x p α anode   F η cathode   R T
Here, overpotential at the anode ( η cathode   ) is defined as follows:
η cathode   = ϕ s cathode   ϕ m E e q cathode  
where j cathode   : the local current density at the cathode a / m 2 , j cathode   ref   : the reference exchange current density at standard conditions, C o 2 : the local oxygen concentration, C O 2 ref .   : the reference oxygen concentration, γ cathode   : the reaction order with respect to oxygen, α cathode , α anode   : the cathodic and anodic transfer coefficients, respectively, ϕ s cathode .   : the solid-phase potential at the cathode, ϕ m : the membrane-phase potential, and E e q cathode   : the equilibrium potential of the oxygen reduction reaction.

3. Results and Discussion

The efficiency of a PEMFC is influenced by various factors, such as the operating temperature, species concentration in the GDL, catalyst layer (CL), membrane, membrane hydration, and the risk of drying out. All these factors could be controlled by effective thermal management. In this study, the thermal performance of MPSFFs is evaluated by varying the number of channels across various configurations, ranging from 2 to 12, while maintaining the channel width constant at 1.5 mm. All the models were evaluated to assess the impact of channel variations on the temperature distribution in CFFs and the overall efficiency of PEMFCs. Cell performance was analyzed for voltages ranging from 0.3 V to 1 V; however, the results were reported at 0.6 V to maintain consistency with comparable studies.

3.1. Thermal Distribution

The primary objective of this study was to improve the thermal management capability of MPSFFs in PEMFC applications. To achieve this goal, a comprehensive thermal analysis of the critical components of PEMFC, like anode coolant channels, the membrane midplane, and cathode coolant channels, was conducted. This approach is widely regarded as best practice for thermal optimization studies of PEMFC systems. Therefore, temperature plots were extracted at the above-mentioned locations from the computed models. As liquid coolant channels were utilized to enhance the performance of the FC, the heat distribution in the coolant channels could effectively reflect the cooling performance of CFFs.
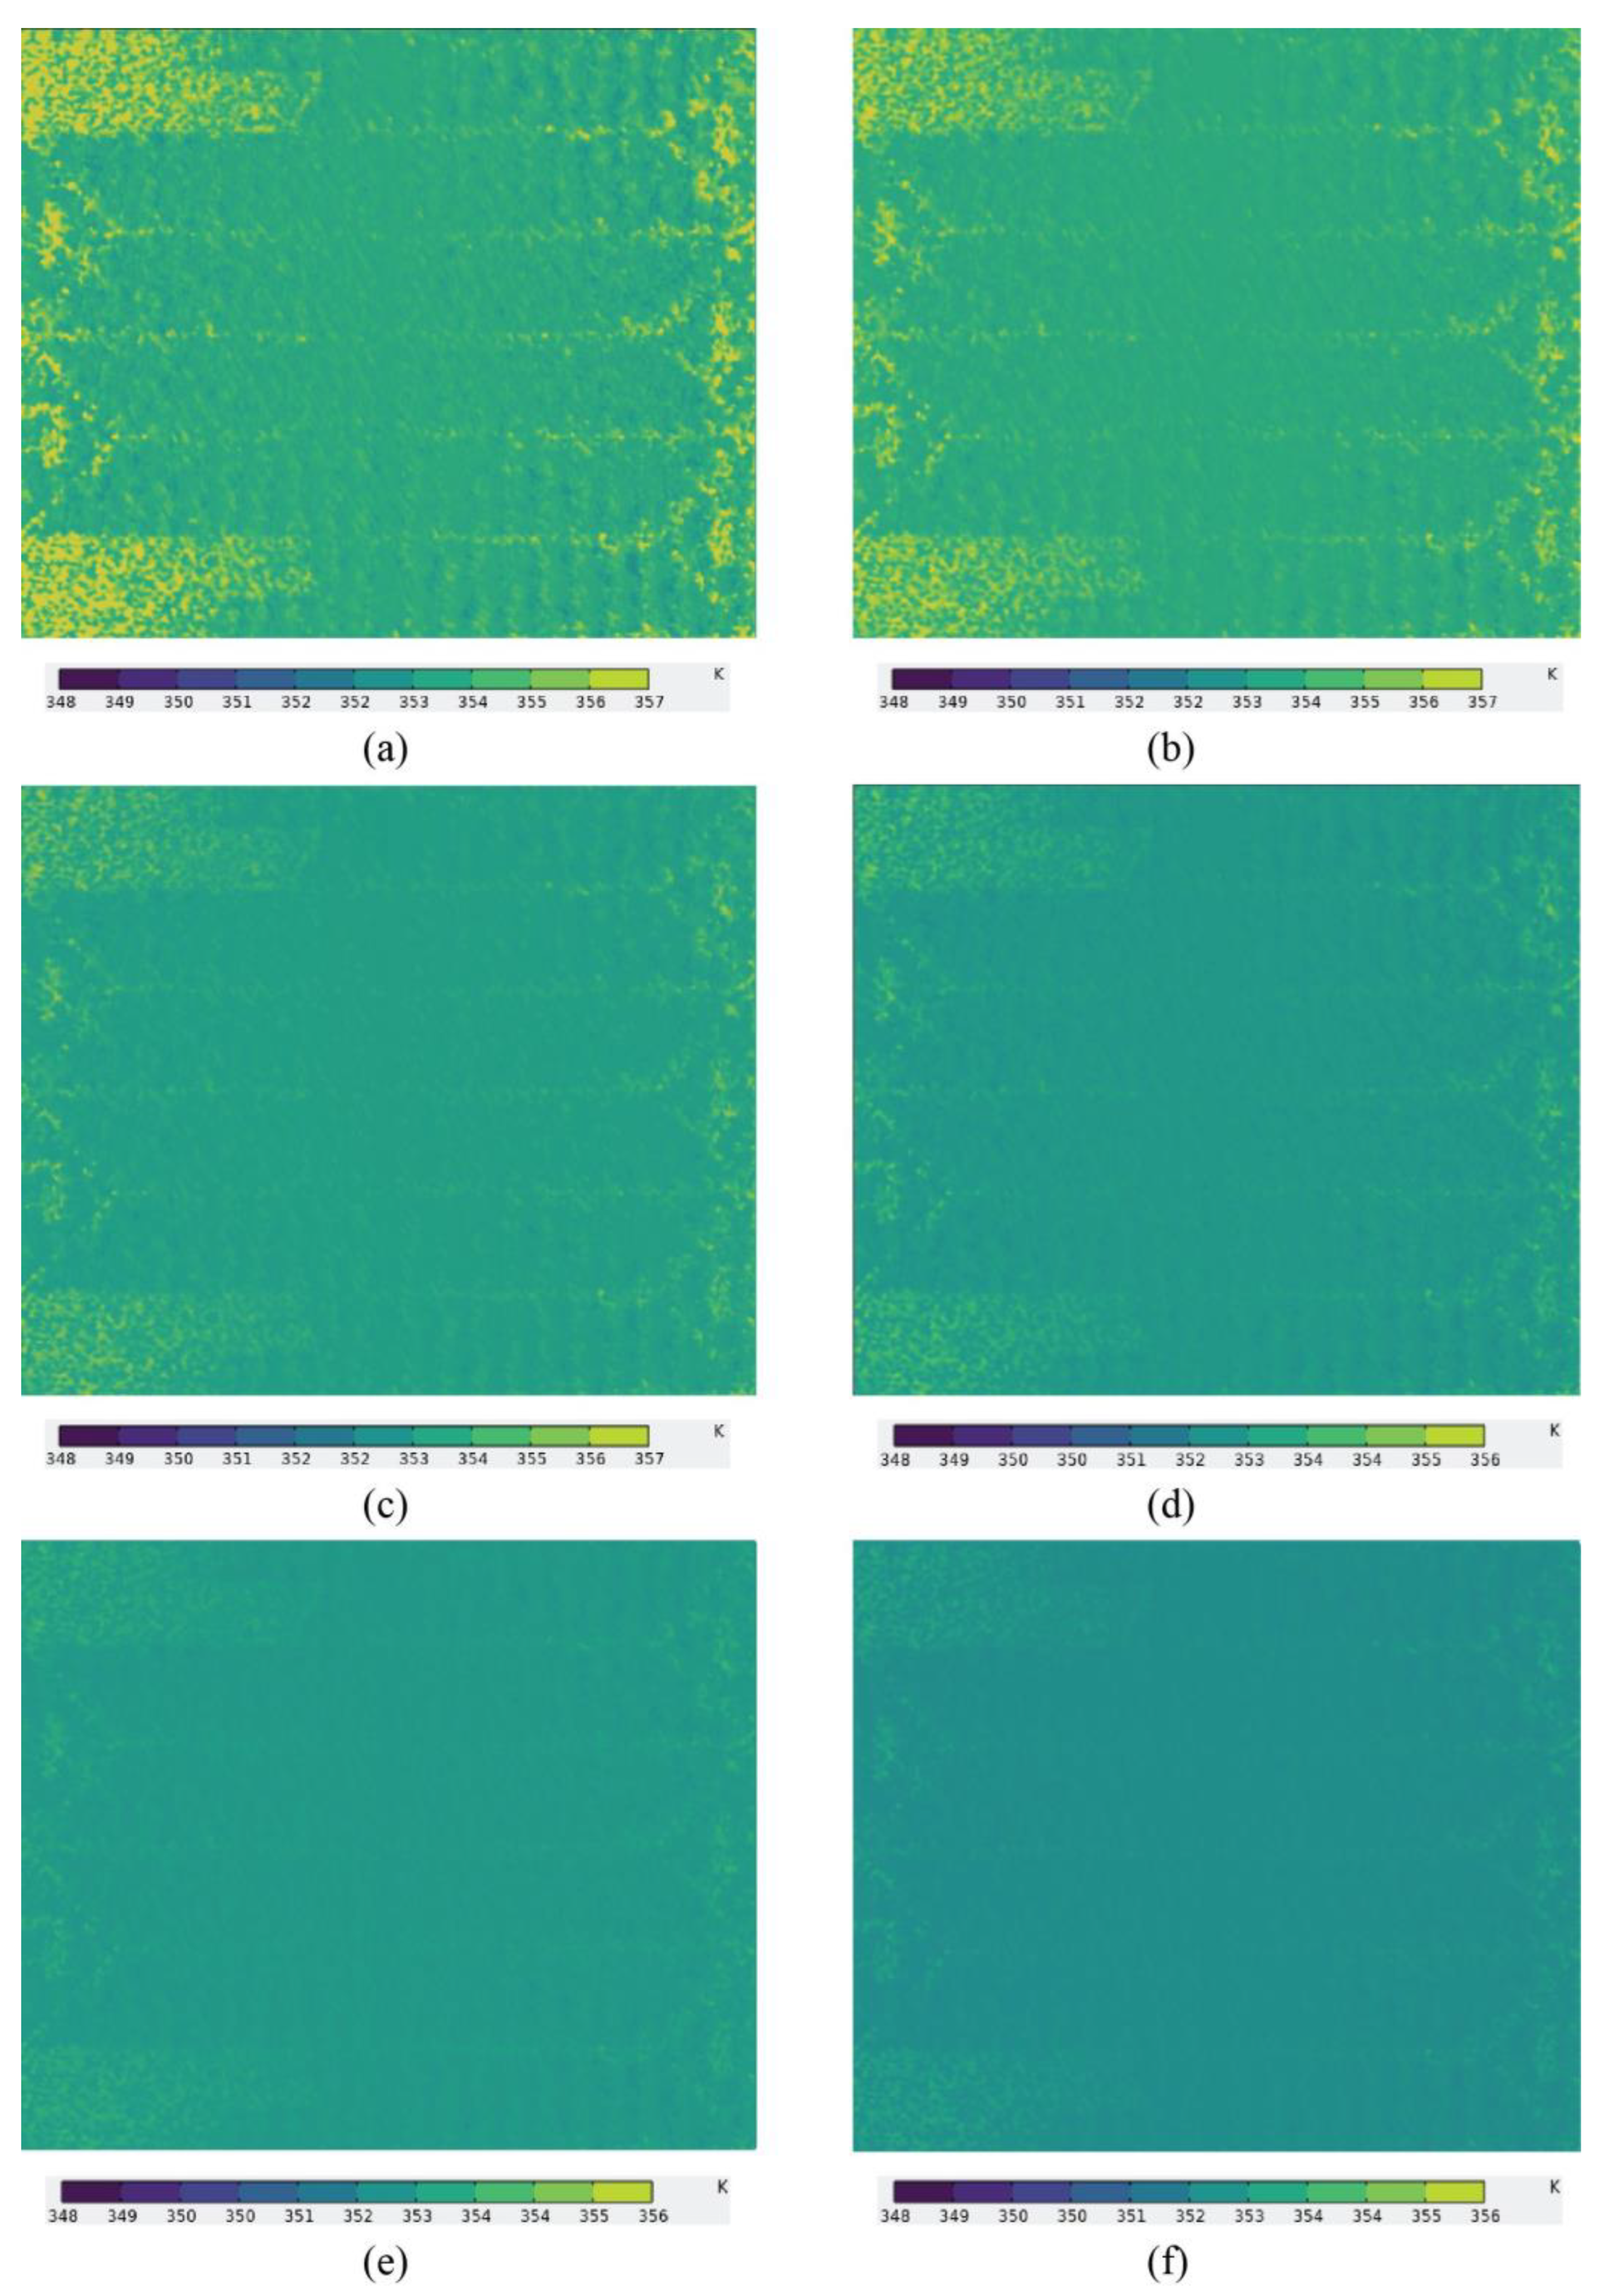
This study is based on varying the number of channels of MPSFFs, and it is a fact that increasing the number of channels results in a decreased length of the channels, which ultimately shortens the distance covered by the fluid from the inlet to outlet. Figure 6 shows the temperature distribution on the membrane midplane, where it is evident that as the number of channels increases from two to twelve, the average temperature of the plane is reduced sufficiently. The temperature at the membrane midplane in geometries with two- to six-paths yields a large number of hotspots, which shows a nonuniform temperature distribution. This uneven temperature distribution in the models with two-, four-, and six-path CFFs could be attributed to the greater number of serpentine curves in the channels, which hinders the coolant in these FFs. Planes with eight to twelve paths yielded a much better thermal performance as fewer and less intense hotspots could be seen in planes with these geometries. This is due to the shorter channel length and fewer serpentine curves. The highest thermal uniformity was observed in the membrane midplane with twelve-path CFF geometry.
It is clearly noticeable in Figure 7 and Figure 8 that the temperature varies from the inlet to outlet in the cathode and anode coolant channels. Considering the overall performance of the coolant channels, it is observed that the FFs with more serpentine turns and a greater number of curves (two- to six-path FFs) experience higher temperatures near the outlets. It is also observed that these FFs failed to extract uniform heat from the system and yielded more hotspots, which could be attributed to their longer channels and the greater number of serpentine curves. In contrast, geometries with a higher number of channels (six to twelve) presented a better cooling performance, as fewer hotspots were observed in these FFs, and the thermal extraction by these FFs was remarkable. The 12-path FF geometry was observed to have the best cooling performance in terms of its uniform heat distribution throughout.
Figure 9 represents the average temperature distribution at the membrane midplane, anode coolant channel, and cathode coolant channels of various models. The highest average temperature was observed in the two-path CFF, whereas the lowest average temperature was observed in the 12-path FF. Further, a consistent temperature differential of nearly 1 K was measured between the anode- and cathode-side CFFs across all tested models, with the cathode side exhibiting elevated temperatures compared to the anode side. This thermal asymmetry can be linked to the distinct electrochemical reactions occurring at each electrode, in which exothermic processes at the cathode dominate, while the anode experiences comparatively lower levels of heat generation. The primary source of heat generation in PEMFCs is the oxygen reduction reaction (ORR), which releases heat as the oxygen molecules are reduced to water. Further, the average temperature difference of the membrane midplane of the models is interesting: the temperature difference between two-, four-, and six-path FFs is less than one degree, whereas as the number of channels increases from six to twelve, the temperature of the membrane midplane drops with a difference of more than one degree, which shows the 10- and 12-path FFs have a better thermal performance.
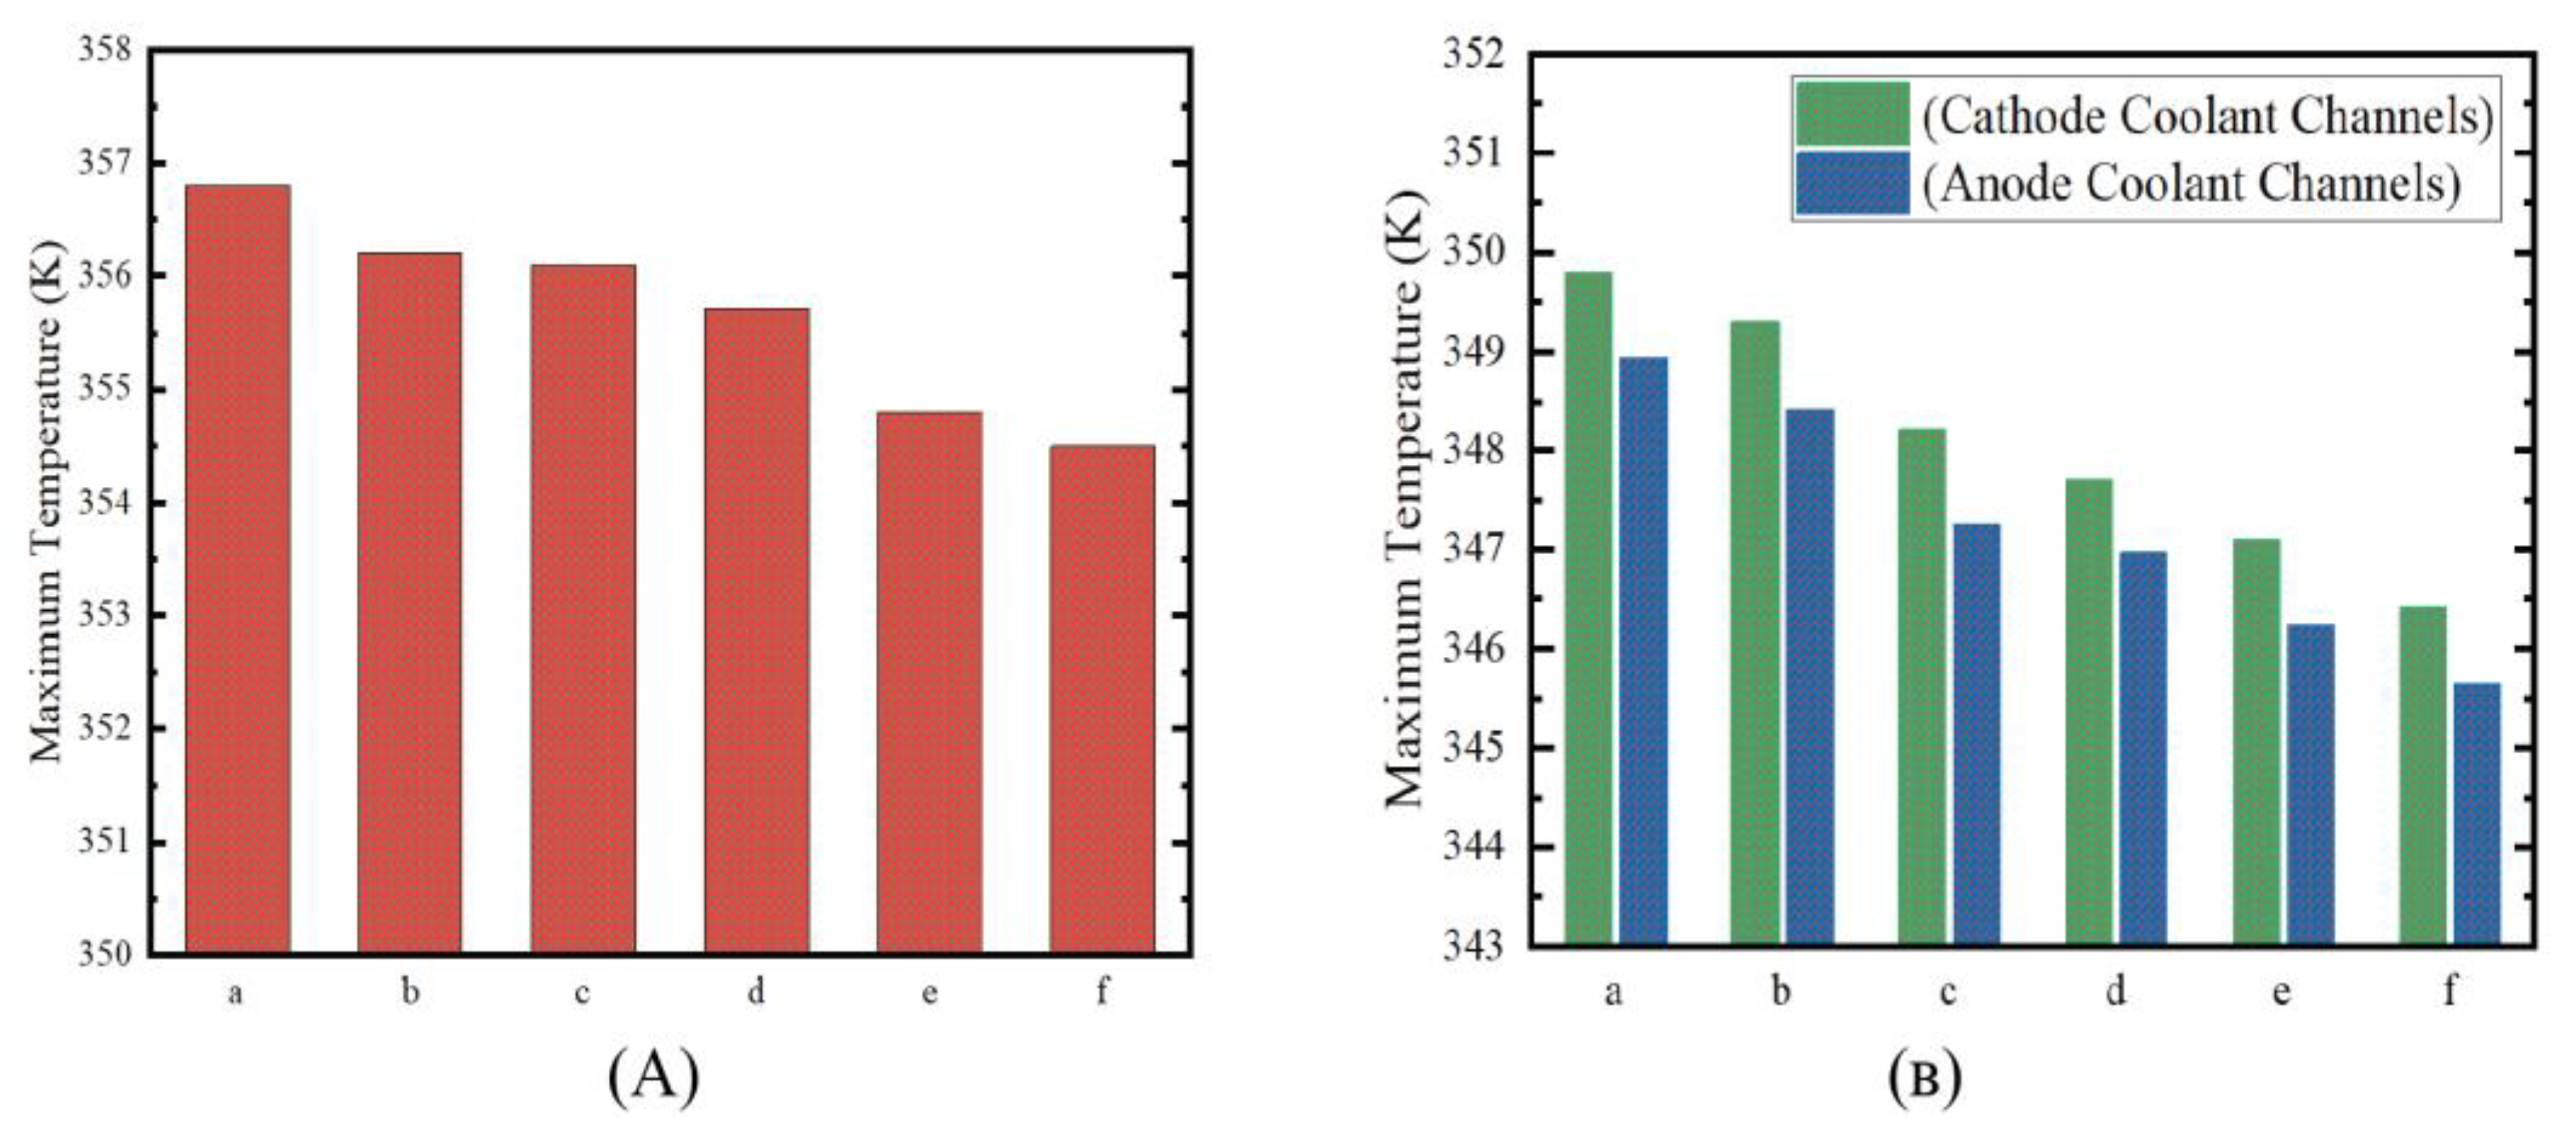
The maximum temperature measurements also serve as a crucial indicator of the inefficiency or inadequacy of a flow channel design. It is evident in Figure 10 that the two-path CFF exhibits the maximum temperature, reaching approximately 350 K at the cathode-side channels and around 349 K at the anode-side channels. In contrast, the 12-path CFF demonstrates the lowest maximum temperature. This temperature disparity can be attributed to several factors inherent to the channel design. The two-path CFF exhibits the highest temperature because it has fewer paths, resulting in a longer coolant residence time in each channel. Longer channels with more serpentine curves and turns allow the coolant to remain inside the channels longer. Consequently, this extended flow time allows the coolant to absorb more heat from the FC system, resulting in a higher temperature near turns. Additionally, the longer path means that the fluid has more time to equilibrate with the temperature of the FC, leading to greater thermal transfer during the fluid’s passage through the system.
However, a lower maximum temperature was observed in the 12-path CFF. This does not indicate a failure in heat extraction, but it is due to the balanced heat distribution inside the cell. It has also been discussed above that improved thermal management was achieved by the twelve-path CFF, followed by the eight-path and six-path CFF. The twelve-path configuration resulted in more balanced heat exchange, ensuring that the coolant can distribute the extracted heat more evenly across the system. The eight-, ten-, and twelve-path CFFs allow for more temperature uniformity, leading to more balanced thermal profiles, ensuring that the system operates within an optimal temperature range. It is crucial to emphasize that the role of the CFFs in PEMFC applications is not to extract the maximum possible heat from the system, but to keep the FC temperature within an appropriate operational range, typically between 70 °C and 80 °C. As highlighted in the literature, temperature uniformity is just as important, if not more so, than heat extraction efficiency. Maintaining a stable thermal distribution ensures that the FC operates efficiently, minimizes the risk of thermal stresses on the components, and contributes to the longevity and reliability of the system. Therefore, the 12-path CFF in this study offers the best overall thermal performance not necessarily by extracting more heat, but by ensuring an optimal heat distribution and maintaining the system within its ideal temperature range.
The temperature distribution in the membrane is the most critical issue as it directly influences the performance and durability of the FC. The maximum temperature in the membrane midplane refers to the highest recorded temperature in the membrane midplane. This is an important parameter that shows the localized hotspots in the membrane. Figure 10 reflects the maximum temperature at the membrane midplanes of various models. The maximum temperature in this region is offered by the two-path FF, followed by four and six-path configurations. These FFs reflect the most critical behavior at the membrane midplane. This critical thermal behavior greatly influences the current density in the membrane midplane. Moreover, this thermal pattern also affects the temperature uniformity index in these models. The 12-path geometry depicts the appropriate maximum temperature patterns, followed by the ten- and eight-path geometries.

3.2. Temperature Uniformity Index

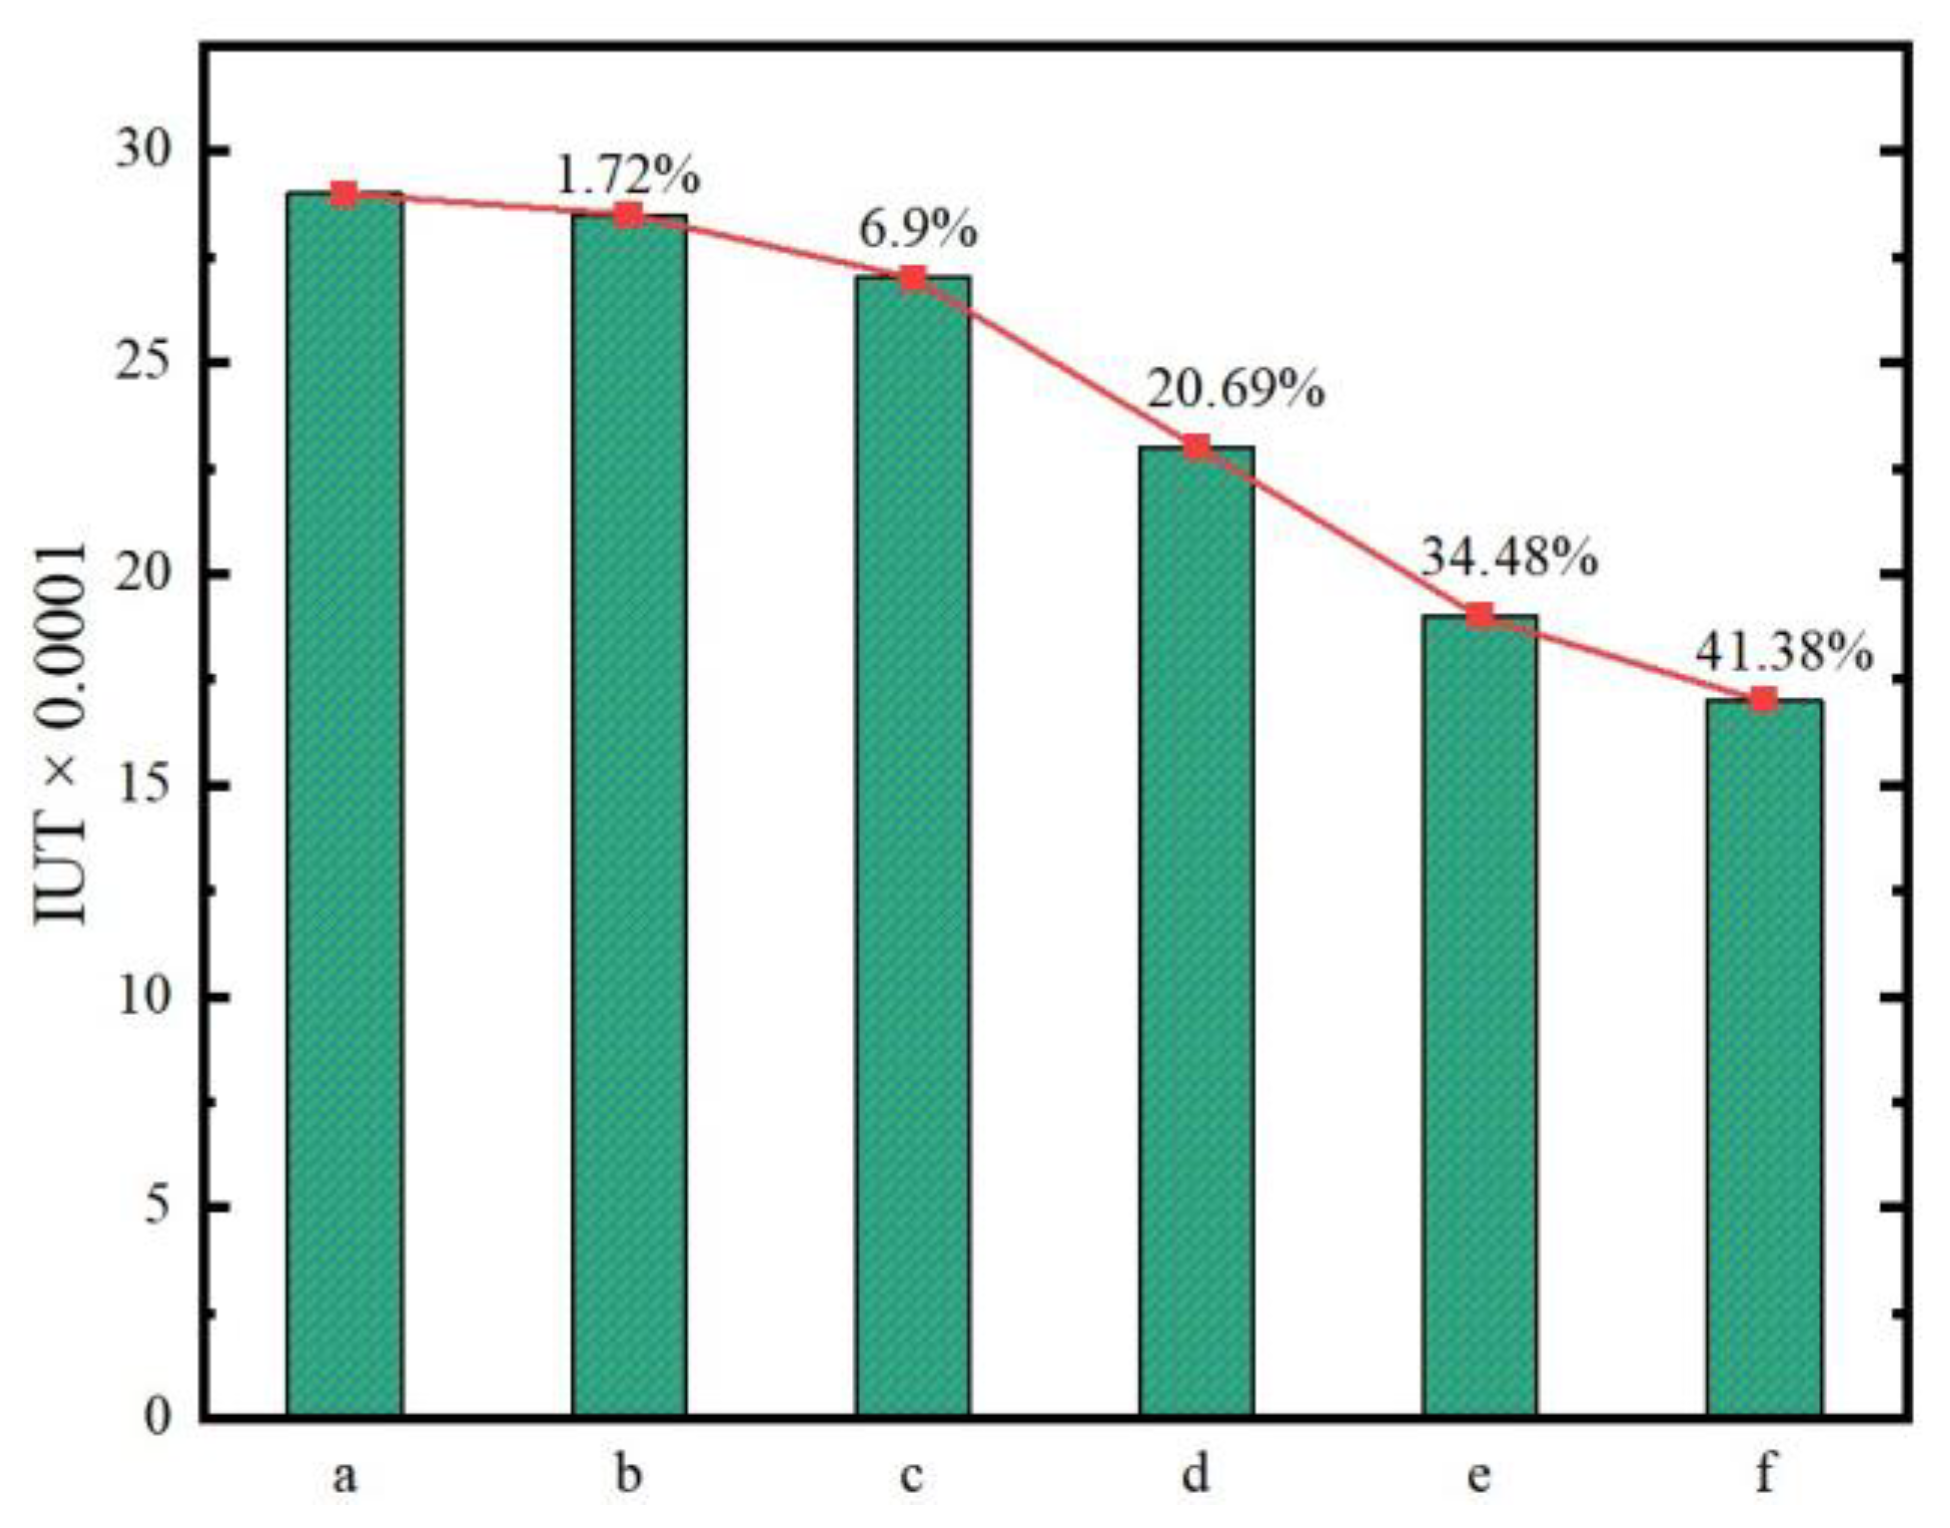
The IUT quantifies the degree of temperature variation across the FC, which directly impacts several performance aspects. Areas with excessive heat (hot spots) may experience an overconsumption of hydrogen, while cooler regions may face fuel starvation. A high IUT indicates that these imbalances are present, leading to inefficient energy production and a reduction in performance. Monitoring the IUT helps to maintain stable operating conditions and avoid thermal imbalance during operation. Similarly the IUTs of membrane midplanes in various models were calculated and are reflected in Figure 11. The highest temperature uniformity was achieved with the twelve-path CFF geometry, followed by the ten-path and eight-path geometries. Overall, in all the models, the IUT was noted as being in the acceptable range, reflecting the proper thermal distribution capability of MPSFF. This is because the cooling fluid starts the cooling process at the center of the FC, which is crucial. After all, this area often experiences higher temperatures due to the concentration of electrochemical reactions. This geometrical arrangement ensures that the most critical regions receive adequate thermal management by initiating cooling at the center. Similarly, as the cooling fluid reaches the outlets towards the edges, it enhances the reaction rates in areas with high hydrogen and oxygen mass ratios. This is because optimal temperatures facilitate faster electrochemical reactions, leading to the increased efficiency and performance of the FC.
This approach promotes efficient thermal management by ensuring that the regions with higher reaction rates (typically where the hydrogen and oxygen mass ratios are the greatest) are adequately cooled. By optimizing cooling in these areas, reaction rates increase, leading to better fuel utilization and improved performance. As the chemical species are consumed more effectively in the well-cooled regions, the temperature becomes more uniform across the FC. This uniformity results from the more balanced reaction rates throughout the FC, where the energy input and reaction output are harmonized. With a more even temperature distribution, less cooling is required in regions further from the inlet, as these areas operate at more stable, lower temperatures. Consequently, this efficient cooling strategy not only optimizes the overall FC performance but also reduces the cooling energy consumption, making the system more energy-efficient and enhancing its operational stability over time.

3.3. Hydrogen Concentrations

The concentration of hydrogen in the membrane midplane plays a crucial role in examining the overall performance of PEMFCs. It refers to how evenly the hydrogen is distributed across the membrane. Since the membrane is responsible for transporting the protons from the anode to the cathode, a uniform hydrogen distribution is key for the uniform transportation of protons across the membrane. This critical factor influences multiple aspects of the FC, including reaction kinetics, proton conductivity, membrane hydration, temperature distribution, and overall efficiency. Areas with excessive hydrogen result in oversaturation.
In contrast, areas with a lower hydrogen concentration would suffer from the underutilization of the electrochemical sites; both factors contribute to reducing the overall current density and power output. All these phenomena are greatly affected by the uneven temperature distribution, as hotter regions would cause a faster hydrogen flow, while cooler regions may result in fuel starvation. Further, poor cooling would cause water evaporation (drying out the membrane), whereas excessive cooling would cause water accumulation (flooding). Therefore, effective thermal management not only prevents fuel starvation and overconsumption but also keeps the membrane in an optimally hydrated state, which helps to safeguard it from both drying out and flooding.
The hydrogen distribution at the membrane midplane is depicted in Figure 12. It could be observed that the hydrogen concentration is highest at the inlet regions (e.g., edges or entry zones of the channels), consistent with the depletion of the reactant as the hydrogen flows toward the center. This concentration reduction toward the FC center is caused by the interplay of flow dynamics, reactant consumption, and electrochemical reaction distribution, as different patterns were observed in different models. A clear relation between temperature and hydrogen concentration was observed. The variation in concentration patterns across different models suggests that the geometry of CFFs plays a significant role in the hydrogen distribution. The clear relationship between temperature and hydrogen concentration likely indicates that higher temperatures result in a reduced hydrogen concentration gradient. This phenomenon resulted from the enhanced hydrogen diffusion and accelerated reaction kinetics at elevated temperatures, promoting a more uniform hydrogen distribution across the membrane.

3.4. Pressure Drop

In serpentine coolant flow channels for PEMFC applications, a pressure drop is an important factor that influences the overall performance of the FC, as the serpentine channels have a series of serpentine turns that offer remarkable resistance to the fluid. The length of the SFF also plays a critical role in pressure reduction. Longer channels result in a greater level of resistance to the flow and, thus, a greater pressure drop. There are many other factors affecting the pressure, but in this study, the effect of channel geometry was considered as a prime factor. Considering that the pressure drop is also influenced by the number of paths in the serpentine design, various models with different numbers of paths were produced. As it is also the fact that having fewer number of passes, increases the length of the channel, leading to a higher resistance to fluid. Therefore, this study has evaluated various models with different numbers of passes to investigate the impact of varying the number of channels.
The total pressure drop in the coolant flow field is reflected in Figure 13. The pressure drops in CFFs follows the normal trend of SFFs and significant reduction in the pressure drop was observed with increasing number of channels. This optimization in the pressure drop could be attributed to the reduced length and serpentine turns of channels, as increasing the number of channels results in a reduced length and fewer serpentine turns of channels, ultimately minimizing the residence period of the coolant inside the CFF. This shorter residence time of the coolant inside the CFF facilitates the extraction of a balanced amount of heat from the cell, ultimately increasing the thermal uniformity. Similarly, the maximum pressure drop was observed in the FF with the maximum length and the highest number of serpentine turns. In contrast, the minimum pressure drop was reported in the FF with the fewest serpentine turns and the minimum length. Therefore, this increased pressure drop results in the increased residence of the coolant inside the CFF, which also ultimately increases the heat extraction by the coolant near turns, causing a non-uniform temperature distribution, as seen in Figure 7a–c and Figure 8a–c. Evaluating the overall pressure drop in the CFF, the 12-path CFF offered the lowest pressure drop of the fluid.
The key mechanisms influencing the thermal and flow behavior in PEMFCs with MPSFF are the convective heat transfer, pressure drop, and the distribution of the flow within the channels. These factors interact in complex ways to influence the temperature distribution, coolant flow dynamics, and ultimately, the performance of the fuel cell.

3.5. Key Mechanisms Influencing Thermal and Flow Behaviors

3.5.1. Convective Heat Transfer

The increase in the number of channels generally improves the convective heat transfer by increasing the surface area available for heat exchange. This effect is particularly important for larger active areas, as a higher channel count leads to a more efficient thermal distribution, helping to avoid the formation of localized hot spots. The path length also plays a significant role, as longer channels promote a more uniform heat distribution, which reduces the thermal gradient across the membrane.

3.5.2. Flow Distribution and Pressure Drop

Path length and channel geometry impact the flow distribution, with longer channels typically resulting in a more uniform flow, while shorter paths may lead to higher velocity fluctuations and potential areas of stagnant flow. This has a direct effect on heat dissipation, as uneven flow can cause localized heating or a reduced cooling efficiency. Additionally, the pressure drop in the flow field increases with longer channels, which can affect the overall fuel cell efficiency by requiring greater pumping power.

3.5.3. Membrane Water Management

The temperature distribution across the membrane is also closely tied to membrane hydration levels, which affect ionic conductivity. As the coolant flow is adjusted, both the channel count and path length can influence water removal and hydration at different locations within the membrane. Effective temperature management, therefore, not only minimizes thermal stress but also helps in maintaining optimal hydration levels for ionic conduction.

4. Conclusions and Future Recommendations

This study investigated the impact of MPSFF on the thermal management and pressure drop of PEMFCs. It was concluded that introducing a coolant at the center led to effective thermal management, preventing hotspots, maintaining optimal temperatures, and ensuring peak reaction rates. As the reaction concentration is usually high at the center, effective cooling in high-reactant-concentration regions prevents thermal inhibition, stabilizing temperatures to maintain efficient charge transfer, reactant utilization, and an enhanced power output.
This study systematically analyzed the thermal behavior of coolant channels with two- to twelve-paths, while maintaining a constant channel width of 1.5 mm. Models with two-to-six-path CFFs demonstrated notable high-temperature hotspots, primarily caused by the extended length of the cooling channels and the excessive number of serpentine bends. However, models with eight-to-twelve-path CFFs had fewer hotspots and a uniform temperature distribution. At the membrane midplane, the highest average temperature was observed for the model with the two-path CFF, having an average membrane temperature around 356 K. In contrast, the model with 12-path CFFs reflected the 0.98% lowest average temperature (352.1) in the region. Similarly, a temperature difference of up to 1 K was observed between the anode and cathode CFFs, which could be due to the ORR on the cathode side. The highest maximum temperature was also observed in two-path CFFs, which could be attributed to the extended coolant residence time inside the FF due to longer channels with the maximum number of serpentine turns. In contrast, the value of the maximum temperature observed in the 12-path CFF was 0.81% lower, which outperformed all other CFF configurations, which could be due to the same reason that the maximum temperature in the two-path CFF is elevated.
The study concluded that the minimum number of coolant channels (i.e., two paths) causes longer channel lengths and a greater number of serpentine turns, resulting in the maximum number of hot spots around turns, whereas maximizing the number of channels (12 paths) results in the shorter length of the channels, causing a uniform thermal distribution. In addition, the maximum uniformity of the thermal distribution was reflected in 12-path CFFs with the lowest average temperature of around 352.3 K at the membrane midplane. However, this investigation is constrained by fixed channel dimensions, static operational parameters, and limited material variations. To advance this research, future work should incorporate dynamic operating conditions, such as modulated coolant flow rates, and evaluate advanced cooling media, e.g., nanofluids. Additionally, conventional CFD tools face computational limitations in exhaustively exploring geometric design spaces. Thus, a data-driven approach leveraging machine learning models, trained on high-fidelity CFD datasets, is proposed to efficiently predict optimized CFF architectures.
Building on the current findings, the optimized CFF configuration warrants further investigation through parametric variations in channel width and height, guided by a systematic evaluation of hydraulic diameter and aspect ratio. Such an approach could refine the trade-off between thermal uniformity and pressure drops. A future work will specifically examine width-adjusted channel designs derived from the present optimized geometry, targeting enhanced pressure loss mitigation. This methodology holds significant potential to redefine thermal–fluid performance boundaries in MPSFFs, enabling next-generation designs that harmonize thermal regulation and hydrodynamic efficiency.
Author Contributions

Conceptualization, Q.L., X.Y., H.H., Q.Y., Z.A., M.A. (Muhammad Ahmed) and S.X.; Methodology, Q.L., H.H., J.C., K.M., Q.Y., J.L., W.A. and M.A. (Muhammad Aurangzeb); Software, Q.L., X.Y., J.C., W.A., Z.A. and M.A. (Muhammad Aurangzeb); Validation, Q.L., H.H., K.M., J.L., Z.A. and M.A. (Muhammad Aurangzeb); Formal analysis, Q.L., X.Y., J.C., Q.Y., W.A., Z.A., M.A. (Muhammad Aurangzeb) and M.A. (Muhammad Ahmed); Investigation, Q.L., X.Y., H.H., K.M., J.L., W.A., M.A. (Muhammad Aurangzeb) and S.X.; Resources, M.A. (Muhammad Ahmed) and S.X.; Data curation, Q.L. and J.L.; Writing—original draft, Q.L., X.Y., H.H., J.C., K.M., Q.Y., J.L., W.A., M.A. (Muhammad Aurangzeb), M.A. (Muhammad Ahmed) and S.X.; Writing—review & editing, Q.L., X.Y., H.H., J.C., K.M., Q.Y., J.L., W.A., Z.A., M.A. (Muhammad Aurangzeb), M.A. (Muhammad Ahmed) and S.X.; Visualization, J.C., K.M., Q.Y. and M.A. (Muhammad Aurangzeb); Supervision, M.A. (Muhammad Ahmed) and S.X.; Project administration, M.A. (Muhammad Ahmed) and S.X.; Funding acquisition, M.A. (Muhammad Ahmed) and S.X. All authors have read and agreed to the published version of the manuscript.

Funding

This research was funded by Zhejiang Province Spearhead and Leading Goose Research and Development Key Program "Research and Development of Intellectualized Key Technologies for Thermal Management System Components of New Energy Vehicles–Research and Development of Intellectualized Key Technologies for Thermal Management System Compressors of New Energy Vehicles" (grant no. 2024C01229) and the APC was funded by Longquan Industrial Innovation Research Institute, Longquan 323050, China.

Data Availability Statement

The original contributions presented in the study are included in the article, further inquiries can be directed to the corresponding author.

Acknowledgments

This work was supported by National Key Research and Development Program Project (grant no. 2022YFB2502400; “High-power density fuel cell stack and engine technology for passenger vehicles”) and Zhejiang Province’s “Spearhead and Leading Goose + X” Research and Development Breakthrough Plan (grant no. 2023C01239; “Ultra-long endurance hydrogen-electric hybrid drone”).

Conflicts of Interest

Authors Qingsheng Liu, Kai Meng were employed by the company Jiashan Power Supply Company, State Grid Zhejiang Electric Power Co., Ltd. The remaining authors declare that the research was conducted in the absence of any commercial or financial relationships that could be construed as a potential conflict of interest.

Nomenclature

Abbreviations
PEMFCProton-Exchange Membrane Fuel Cell
CCCoolant Channel
CFFsCoolant Flow Fields
UNEPUnited Nations Environment Program
WHOWorld Health Organization
EVElectric Vehicle
PEMProton-Exchange Membrane
FCEVFuel Cell Electric Vehicle
FFFlow Field
MPSFFMulti-Path Serpentine Flow Field
FCFuel Cell
SFFSerpentine Flow Field
BiCGStabBiconjugate Gradient Stabilization
RAMRandom Access Memory
ROMRead-Only Memory
IUTIndex of Uniform Temperature
GDLGas Diffusion Layer
CLCatalyst Layer
CFDComputational Fluid Dynamics
ORROxygen Reduction Reaction
Greek Letters
ϵPorosity (typically used for GDL or CL)
ρDensity
μDynamic Viscosity
σElectrical or Thermal Conductivity
αPermeability (of the medium)
ΦPotential (usually electric potential)
Symbols
TTemperature (Local or Average)
PPressure
ICurrent Density
RResistance
VVoltage
FFaraday’s Constant
MMolar Mass
tTime
cConcentration
QHeat or Heat Transfer

References

  1. Department of Economic and Social Affairs-Population Division. 2024 Revision of World Population Prospects; United Nations: New York, NY, USA, 2024; Available online: https://population.un.org/wpp/ (accessed on 23 May 2025).
  2. Ahmed, M.; Shusheng, X. Comprehensive review of serpentine flow fields for effective thermal management of proton exchange membrane fuel cel. Heliyon 2024, 10, e39793. [Google Scholar] [CrossRef] [PubMed]
  3. Afshari, E.; Ziaei-Rad, M.; Jahantigh, N. Analytical and numerical study on cooling flow field designs performance of PEM fuel cell with variable heat flux. Mod. Phys. Lett. B 2016, 30, 1650155. [Google Scholar] [CrossRef]
  4. Ajanovic, A.; Haas, R. Economic prospects and policy framework for hydrogen as fuel in the transport sector. Energy Policy 2018, 123, 280–288. [Google Scholar] [CrossRef]
  5. Jie, W.; Cunguang, F. Research on Hydrogen Fuel Cell Controllers Based on Thermal Management. Intern. Combust. Engine Accessories 2023, 23, 27–29. [Google Scholar] [CrossRef]
  6. Teimouri, A.; Kabeh, K.Z.; Changizian, S.; Ahmadi, P.; Mortazavi, M. Comparative lifecycle assessment of hydrogen fuel cell, electric, CNG, and gasoline-powered vehicles under real driving conditions. Int. J. Hydrogen Energy 2022, 47, 37990–38002. [Google Scholar] [CrossRef]
  7. Qasem, N.A.A. A recent overview of proton exchange membrane fuel cells: Fundamentals, applications, and advances. Appl. Therm. Eng. 2024, 252, 123746. [Google Scholar] [CrossRef]
  8. Zucconi, A.; Hack, J.; Stocker, R.; Suter, T.A.M.; Rettie, A.J.E.; Brett, D.J.L. Challenges and opportunities for characterisation of high-temperature polymer electrolyte membrane fuel cells: A review. J. Mater. Chem. A 2024, 12, 8014–8064. [Google Scholar] [CrossRef]
  9. Chen, Q.; Zhang, G.; Zhang, X.; Sun, C.; Jiao, K.; Wang, Y. Thermal management of polymer electrolyte membrane fuel cells: A review of cooling methods, material properties, and durability. Appl. Energy 2021, 286, 116496. [Google Scholar] [CrossRef]
  10. Rahgoshay, S.M.; Ranjbar, A.A.; Ramiar, A.; Alizadeh, E. Thermal investigation of a PEM fuel cell with cooling flow field. Energy 2017, 134, 61–73. [Google Scholar] [CrossRef]
  11. Bao, C.; Ouyang, M.; Yi, B. Analysis of the water and thermal management in proton exchange membrane fuel cell systems. Int. J. Hydrogen Energy 2006, 31, 1040–1057. [Google Scholar] [CrossRef]
  12. Jeo, D.H. Numerical study of serpentine flow-field cooling plates on PEM fuel cells performance. Int. J. Energy Res. 2013, 37, 510–521. [Google Scholar] [CrossRef]
  13. Choi, E.J.; Park, J.Y.; Kim, M.S. A comparison of temperature distribution in PEMFC with single-phase water cooling and two-phase HFE-7100 cooling methods by numerical study. Int. J. Hydrogen Energy 2018, 43, 13406–13419. [Google Scholar] [CrossRef]
  14. Gong, D.; Xu, S.; Gao, Y. Investigation of Water and Heat Transfer Mechanism in PEMFCs Based on a Two-Phase Non-Isothermal Model. Energies 2023, 16, 697. [Google Scholar] [CrossRef]
  15. Nolan, J.; Kolodziej, J. Modeling of an automotive fuel cell thermal system. J. Power Sources 2010, 195, 4743–4752. [Google Scholar] [CrossRef]
  16. Wang, J.; Wang, H.; Fan, Y. Techno-Economic Challenges of Fuel Cell Commercialization. Engineering 2018, 4, 352–360. [Google Scholar] [CrossRef]
  17. Zhang, G.; Jiao, K. Multi-phase models for water and thermal management of proton exchange membrane fuel cell: A review. J. Power Sources 2018, 391, 120–133. [Google Scholar] [CrossRef]
  18. Li, Q.; Liu, Z.; Sun, Y.; Yang, S.; Deng, C. A Review on Temperature Control of Proton Exchange Membrane Fuel Cells. Processes 2021, 9, 235. [Google Scholar] [CrossRef]
  19. Veeranjaneyulu, K.; Joshi, S.; Devalla, V.; Kiran, K.S.; Khushal. Recent advancements of PEMFC in transport applications. AIP Conf. Proc. 2023, 2492, 050019. [Google Scholar] [CrossRef]
  20. Deng, Q.; Meng, K.; Chen, W.; Yang, G.; Zhang, N.; Chen, B. Study on the heat and mass transfer mechanisms of liquid-cooled PEMFC stacks based on non-isothermal model. Energy Convers. Manag. 2024, 313, 118628. [Google Scholar] [CrossRef]
  21. Carrère, P.; Prat, M. Impact of non-uniform wettability in the condensation and condensation-liquid water intrusion regimes in the cathode gas diffusion layer of proton exchange membrane fuel cell. Int. J. Therm. Sci. 2019, 145, 106045. [Google Scholar] [CrossRef]
  22. Jeon, D.H.; Greenway, S.; Shimpalee, S.; Zee, J.W.V. The effect of serpentine flow-field designs on PEM fuel cell performance. Int. J. Hydrogen Energy 2008, 33, 1052–1066. [Google Scholar] [CrossRef]
  23. Zhang, G.; Guo, L.; Ma, B.; Liu, H. Comparison of current distributions in proton exchange membrane fuel cells with interdigitated and serpentine flow fields. J. Power Sources 2009, 188, 213–219. [Google Scholar] [CrossRef]
  24. Gu, Y.; Li, L.; Zheng, G. Study on the Dynamic Characteristics of the Gear Lubrication Flow Field with Baffles and Optimization Design Strategies. Lubricants 2025, 13, 143. [Google Scholar] [CrossRef]
  25. Tan, Y.; Ni, Y.; Xu, W.; Xie, Y.; Li, L.; Tan, D. Key technologies and development trends of the soft abrasive flow finishing method. J. Zhejiang Univ.-Sci. A 2023, 24, 1043–1064. [Google Scholar] [CrossRef]
  26. Wang, Y.; Sun, Z.Y.; Yang, L. Optimizing temperature distribution in a PEMFC stack: A computational study on cooling plate and coolant dynamics. Int. J. Hydrogen Energy 2025, 97, 88–103. [Google Scholar] [CrossRef]
  27. Xu, X.; Zhang, L.; Wang, S.; Han, D.; You, S.; Zhou, J. Numerical and experimental analyses of a novel type PEMFC coolant channel. Int. J. Hydrogen Energy 2024, 49, 652–673. [Google Scholar] [CrossRef]
  28. Liu, X.; Bai, M.; Zhou, Z.; Poramapojana, P.; Li, Y.; Gao, L.; Li, Y.; Song, Y. Three-dimensional multi-phase numerical study for the effect of coolant flow field designs on water and thermal management for the large-scale PEMFCs. Int. J. Hydrogen Energy 2023, 48, 23681–23705. [Google Scholar] [CrossRef]
  29. Chen, B.; Deng, Q.; Yang, G.; Zhou, Y.; Chen, W.; Cai, Y.; Tu, Z. Numerical study on heat transfer characteristics and performance evaluation of PEMFC based on multiphase electrochemical model coupled with cooling channel. Energy 2023, 285, 128933. [Google Scholar] [CrossRef]
  30. Yong, Z.; Shirong, H.; Xiaohui, J.; Yuntao, Y.; Mu, X.; Xi, Y. Performance study on a large-scale proton exchange membrane fuel cell with cooling. Int. J. Hydrogen Energy 2022, 47, 10381–10394. [Google Scholar] [CrossRef]
  31. Baek, S.M.; Yu, S.H.; Nam, J.H.; Kim, C.-J. A numerical study on uniform cooling of large-scale PEMFCs with different coolant flow field designs. Appl. Therm. Eng. 2011, 31, 1427–1434. [Google Scholar] [CrossRef]
  32. Amarnath, G.; Babu, A.V. Comparative computational fluid dynamic analysis between split and dual serpentine flow field for proton exchange membrane fuel cells. Chem. Pap. 2023, 77, 5033–5045. [Google Scholar] [CrossRef]
  33. Lu, H.; Pei, X.; Yan, F.; Yao, J.; Feng, S. Numerical Analysis of the Effect of a Radial Serpentine Flow Field on PEMFC Performance. J. Energy Eng. 2025, 151, 04024046. [Google Scholar] [CrossRef]
  34. Toghyani, S.; Nafchi, F.M.; Afshari, E.; Hasanpour, K.; Baniasadi, E.; Atyabi, S.A. Thermal and electrochemical performance analysis of a proton exchange membrane fuel cell under assembly pressure on gas diffusion layer. Int. J. Hydrogen Energy 2018, 43, 4534–4545. [Google Scholar] [CrossRef]
  35. Joibary, S.M.M.; Rahgoshay, S.M.; Rahimi-Esbo, M.; Firouzjaee, K.D. Numerical investigation of the influence of different cooling flow channels on the thermal and water saturation distribution in a real dimensional polymer electrolyte membrane fuel cell. Int. J. Hydrogen Energy 2023, 48, 2762–2787. [Google Scholar] [CrossRef]
Figure 1. Coolant flow fields—(a) two-path SFF, (b) four-path SFF, (c) six-path SFF, (d) eight-path SFF, (e) ten-path SFF, (f) twelve-path SFF.
Energies 18 04264 g001
Figure 2. 3D layout of the structural model.
Energies 18 04264 g002
Figure 3. Mesh independence graph (current density vs number of mesh elements).
Energies 18 04264 g003
Figure 4. Mesh independence graph (maximum temperature vs number of mesh elements).
Energies 18 04264 g004
Figure 5. Polarization curves representing model validation.
Energies 18 04264 g005
Figure 6. Temperature distribution at membrane midplane—(a) two-path SFF, (b) four-path SFF, (c) six-path SFF, (d) eight-path SFF, (e) ten-path SFF, (f) twelve-path SFF.
Energies 18 04264 g006
Figure 7. Temperature distribution in cathode coolant channels—(a) two-path SFF, (b) four-path SFF, (c) six-path SFF, (d) eight-path SFF, (e) ten-path SFF, (f) twelve-path SFF.
Energies 18 04264 g007
Figure 8. Temperature distribution in anode coolant channels—(a) two-path SFF, (b) four-path SFF, (c) six-path SFF, (d) eight-path SFF, (e) ten-path SFF, (f) twelve-path SFF.
Energies 18 04264 g008
Figure 9. (A)Average temperature distribution at membrane midplane, (B) average temperature distribution at cathode and anode coolant channel—(a) two-path SFF, (b) four-path SFF, (c) six-path SFF, (d) eight-path SFF, (e) ten-path SFF, (f) twelve-path SFF.
Energies 18 04264 g009
Figure 10. (A) Maximum temperature distribution at membrane midplane, (B) maximum temperature distribution at cathode and anode coolant channel—(a) two-path SFF, (b) four-path SFF, (c) six-path SFF, (d) eight-path SFF, (e) ten-path SFF, (f) twelve-path SFF.
Energies 18 04264 g010
Figure 11. Index of uniform temperature at membrane midplane—(a) two-path SFF, (b) four-path SFF, (c) six-path SFF, (d) eight-path SFF, (e) ten-path SFF, (f) twelve-path SFF.
Energies 18 04264 g011
Figure 12. Hydrogen concentration at membrane midplane—(a) two-path SFF, (b) four-path SFF, (c) six-path SFF, (d) eight-path SFF, (e) ten-path SFF, (f) twelve-path SFF.
Energies 18 04264 g012
Figure 13. Total pressure drops in coolant flow channels—(a) two-path SFF, (b) four-path SFF, (c) six-path SFF, (d) eight-path SFF, (e) ten-path SFF, (f) twelve-path SFF.
Energies 18 04264 g013
Table 1. Geometrical parameters of the PEMFC model.
DetailsUnitsValues
Active area of PEMFCmm250,000
Length of PEMFCmm200
Width of PEMFCmm250
Bipolar plate thickness (anode/cathode)mm2.8
Gas diffusion layer thickness (anode/cathode)µm240
Catalyst layer thickness (anode/cathode)µm10
Membrane thicknessµm50
Number of gas channels--17
Height of gas channelsmm1
Width of gas channelsmm1
Height of cooling channelsmm0.8
Table 2. Detailed geometrical parameters of the coolant channels.
CW (mm)CH (mm)L (mm)NSNCHDAR
1.50.888604421.04350.533
1.50.844362241.04350.533
1.50.830201461.04350.533
1.50.821161081.04350.533
1.50.8181208101.04350.533
1.50.8161007121.04350.533
Note: Abbreviations: CW stands for channel width; CH stands for channel height; L stands for length; NS stands for number of serpentine turns; NC stands for no. of channels; HD stands for hydraulic diameter; AR stands for aspect ratio.
Table 3. Detailed physics parameters of the model [35].
DetailsUnitsValues
GDL porosities (anode/cathode) 0.5
GDL permeabilities (anode/cathode)m22.7 × 10−12
GDL electrical conductivityS·m−117,000
GDL densitykg·m−3437.5
Effective porosity of the catalyst layers in anode and cathode 0.3
Inlet temperature of gases (anode/cathode)K343
Inlet temperature of the coolant fluid (anode/cathode)K343
Inlet flow velocity (anode gas)m/s0.1
Inlet flow velocity (cathode gas)m/s0.5
Inlet flow velocity (coolant)m/s0.05
Contact resistancem−24.45 × 10⁻⁶
Reference exchanged current density at the anode sideA·m−2104
Reference exchanged current density at the cathode sideA·m−250
Open-circuit voltage of the cellV1.03
Anode and cathode transfer coefficients for the hydrogen oxidation reaction 1.2
Anode and cathode transfer coefficients for the oxygen reduction reaction 1.2
Faraday constantC·mol−196,457
Density of membranekg·m−31980
Density of the collector plateskg·m−31800
Density of the catalyst layerskg·m−32719
Specific heat of the membraneJ·kg−1·K−12000
Specific heat of the gas diffusion and catalyst layersJ·kg−1·K−1871
Specific heat of the collector platesJ·kg−1·K−11040
Thermal conductivity of the dry membraneW·m−1·K−12
Thermal conductivity of gas diffusion layerW·m−1·K−10.25
Thermal conductivity of collector platesW·m−1·K−146.2
Thermal conductivity of catalyst layerW·m−1·K−110
Electrical conductivity of the dry membraneS·m−110−16
Table 4. Quantitative comparison of I/V values.
Voltage (V)Current (A/cm2)Deviation
%
SM Miri JoibaryCurrent Study
1000
0.950.040.03951.26
0.90.102940.102940
0.850.18280.182970.09
0.80.2830.2830
0.750.470.4690.21
0.70.810.805010.62
0.651.061.063820.36
0.61.291.300.77
0.551.391.400.72
0.51.491.480.67
0.451.561.5540.39
0.41.631.603971.6
0.351.691.669631.4
0.31.751.712722.2
Disclaimer/Publisher’s Note: The statements, opinions and data contained in all publications are solely those of the individual author(s) and contributor(s) and not of MDPI and/or the editor(s). MDPI and/or the editor(s) disclaim responsibility for any injury to people or property resulting from any ideas, methods, instructions or products referred to in the content.