Article

Effects of Partial Admission Ratio on the Performance and Flow Characteristics of a Supercritical Carbon Dioxide Axial-Flow Turbine

School of Vehicle and Mobility, State Key Laboratory of Intelligent Green Vehicle and Mobility, Tsinghua University, Beijing 100084, China
*
Author to whom correspondence should be addressed.
Energies 2025, 18(16), 4259; https://doi.org/10.3390/en18164259
Submission received: 1 July 2025 / Revised: 3 August 2025 / Accepted: 7 August 2025 / Published: 11 August 2025

Abstract

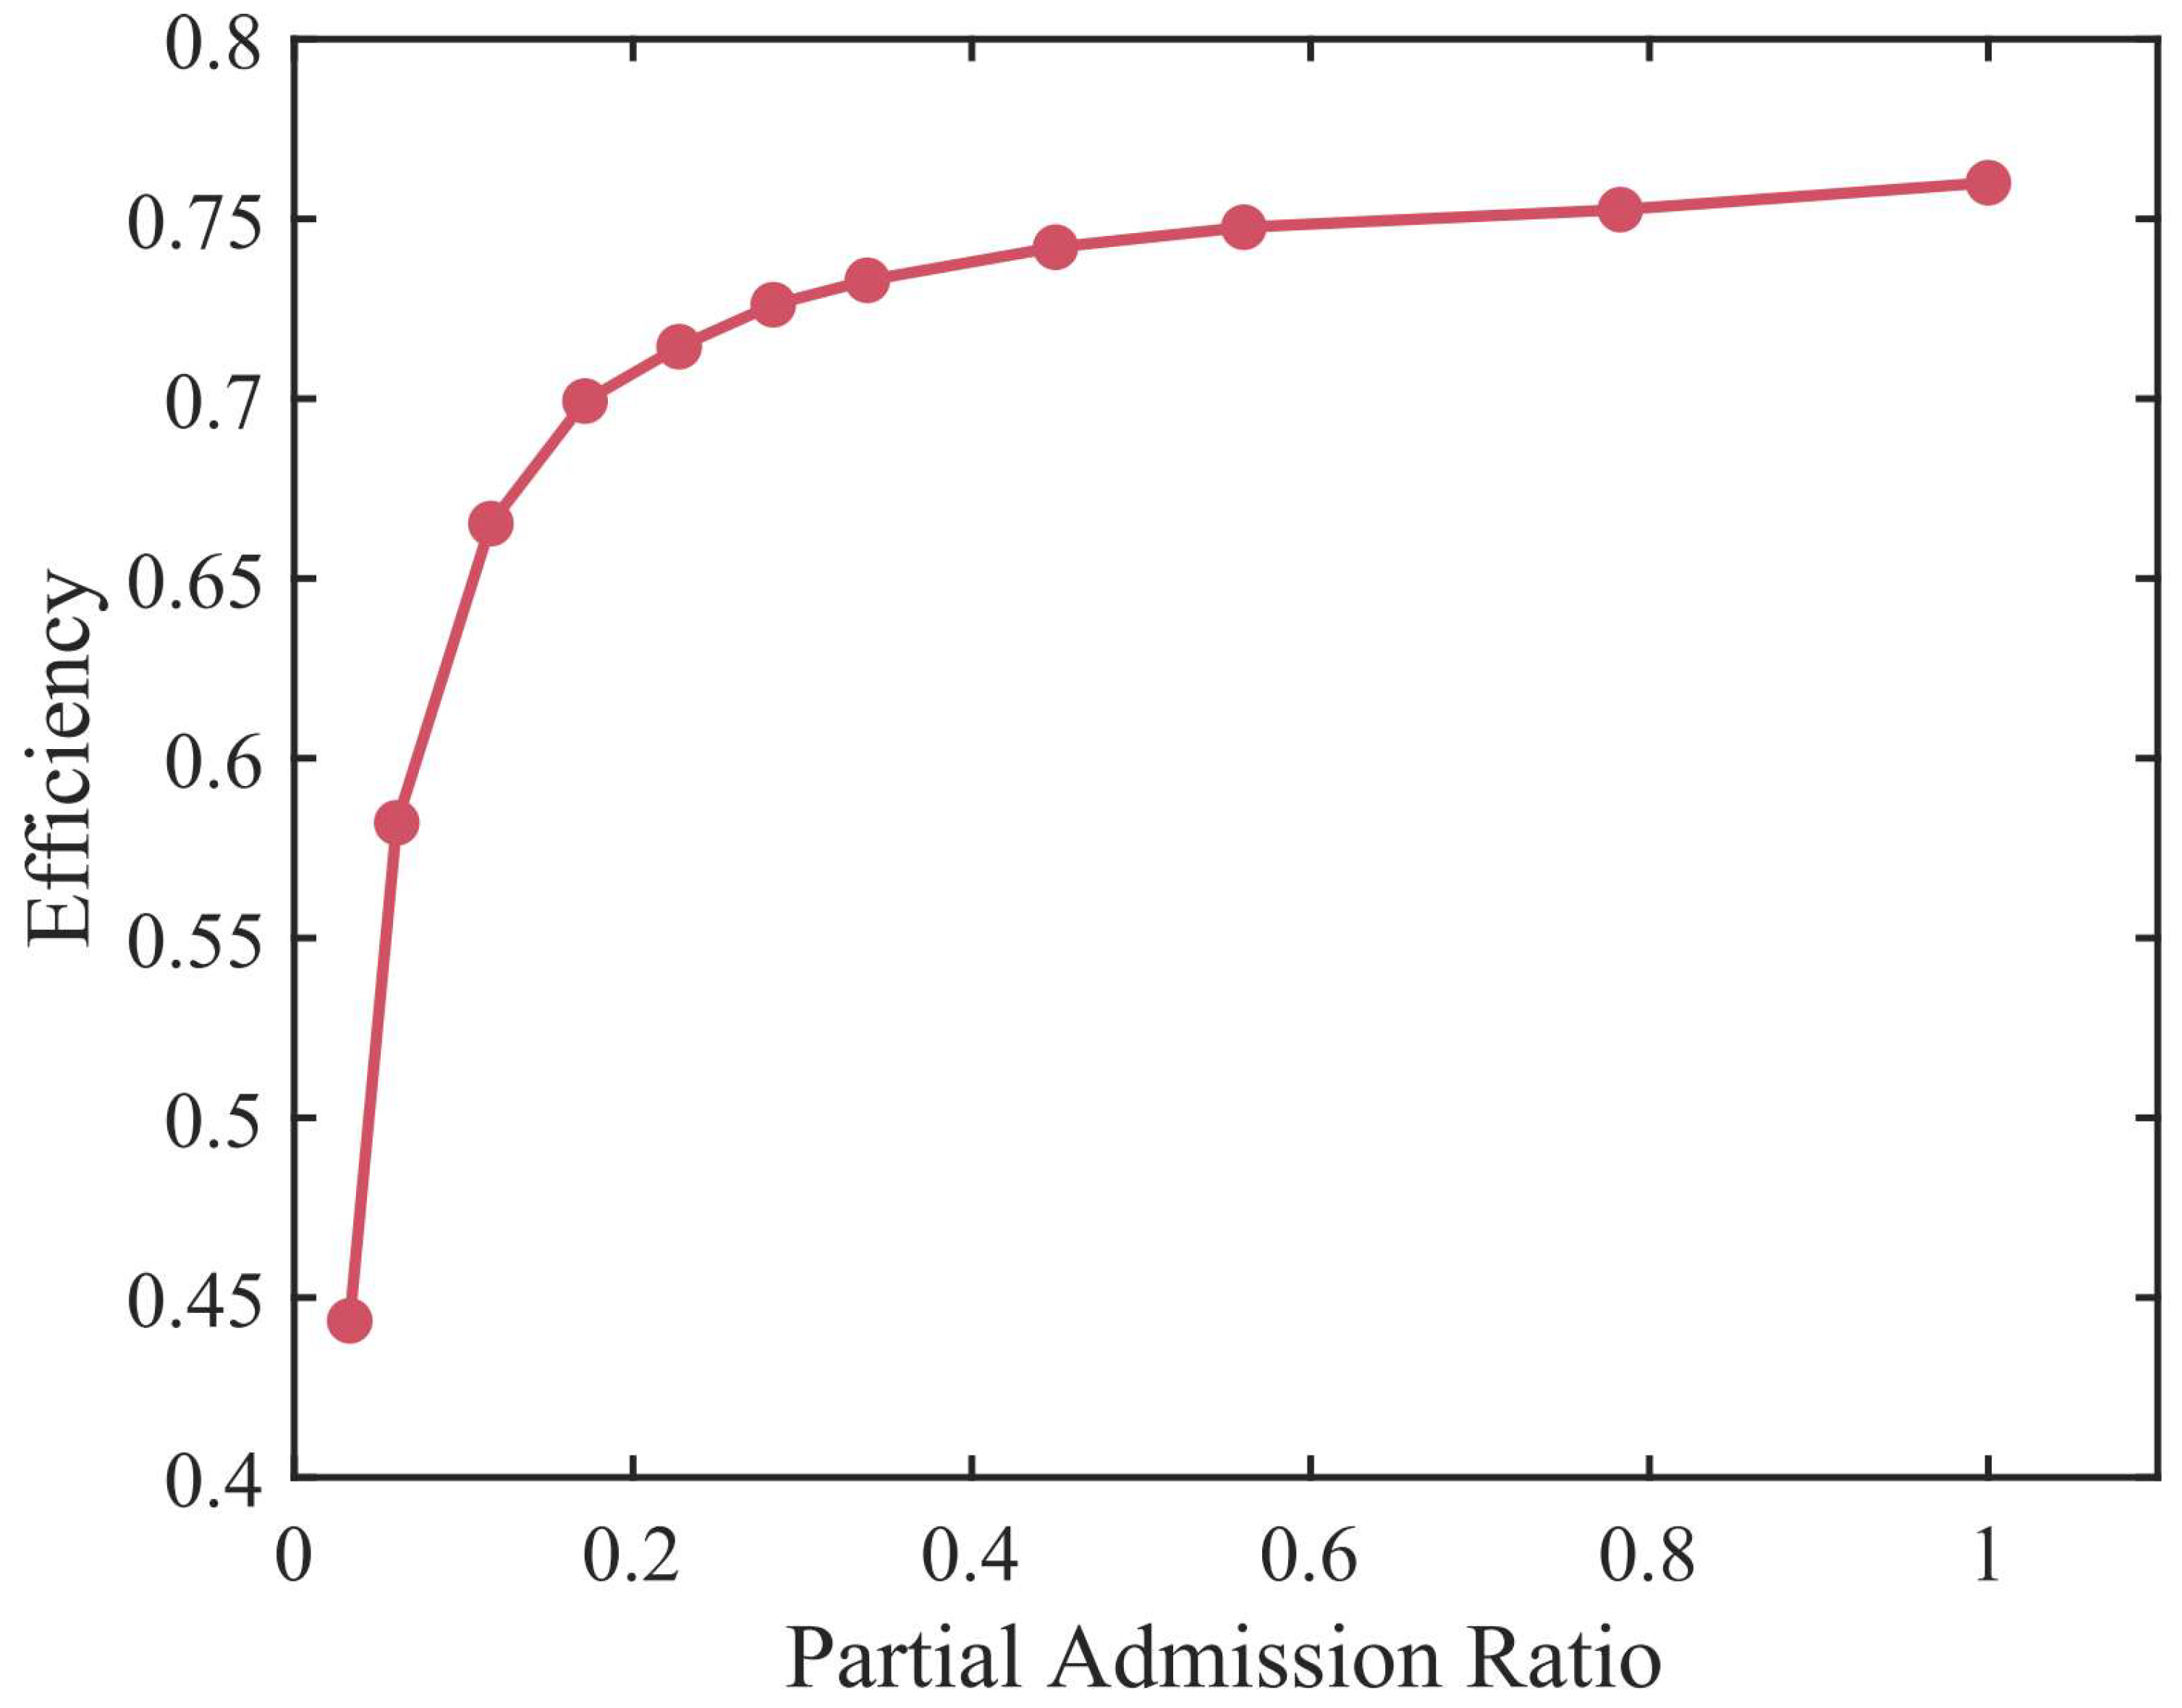
The supercritical carbon dioxide (S-CO2) Brayton cycle has become one of the most promising power generation systems in recent years. Owing to the high density of S-CO2, the turbine operates with a lower flow coefficient and a reduced blade height compared to conventional gas turbines, leading to relatively higher tip leakage and secondary flow losses. A properly designed partial admission scheme can increase blade height and improve turbine efficiency. In this study, the effects of partial admission ratio on the performance and flow characteristics of a partial admission S-CO2 turbine were investigated using numerical methods. The results indicate that the decline in turbine efficiency accelerates when the partial admission rate falls below 0.3. Furthermore, the maximum blade torque begins to decrease once the partial admission ratio drops below 0.1. Stronger tip passage vortices and a large-scale leakage vortex were identified in the passage located at the sector interface. Blade loading analysis revealed a reduction in pressure on the pressure surface of blades just entering the active sector, and a significant increase in suction surface pressure for blades about to exit the active sector. These pressure variations result in reduced blade torque near the boundaries of the active sector.

1. Introduction

The supercritical carbon dioxide (S-CO2) Brayton cycle offers high efficiency and a compact structure, making it one of the most promising power generation systems in recent years. Near its critical point, carbon dioxide becomes incompressible, which significantly reduces the compression work required [1]. As a result, S-CO2 Brayton cycle can achieve high efficiency at moderate temperatures [2]. The high density of carbon dioxide also contributes to smaller sizes of the cycle components [3]. These advantages make the S-CO2 Brayton cycle particularly suitable for distributed energy systems, such as solid oxide fuel cells [4], small modular reactors [5], and biomass energy systems [6]. Additionally, the critical temperature of carbon dioxide is close to the ambient temperature, allowing the S-CO2 Brayton cycle to match a wide range of heat sources [7]. The potential of the S-CO2 Brayton cycle has also been discussed in the context of nuclear power plants [8], solar energy [9], and coal-fired power plants [10]. Extensive research has been conducted on the layout and key components of the S-CO2 cycle. A detailed summary, categorization, and comparison of cycle configurations has been presented [11]. In addition, key technologies and challenges concerning turbines, heat exchangers, materials, and control systems have been discussed [12].
The turbine is one of the key components in the S-CO2 Brayton cycle. Researchers have studied the flow characteristics of S-CO2 turbines in order to improve the flow field and enhance turbine performance during the design process. Wang et al. employed a system–component coupling method for the design of the S-CO2 turbomachinery and analyzed the effects of the interaction between the stator and rotor on the flow field in the rotor passage and the associated flow losses [13]. Zhou et al. analyzed the flow field at different positions along the blade span and studied the secondary flows in the rotor passages as well as the load characteristics of the blades [14]. Xia et al. designed an S-CO2 turbine with an output power of 100 kW, focusing on the characteristics of leakage flow through the gaps and its impact on the turbine performance [15]. Han et al. used numerical simulations to study the flow characteristics of the boundary layer in S-CO2 turbines [16]. They discussed the evolution of horseshoe vortex and the formation of passage vortex and suction separation line vortex. Ying et al. found that the development of passage vortex in the rotor blade passages differs from the vortex structures in gas turbines [17]. They analyzed the development process of hub passage vortex, tip passage vortex, and tip leakage vortex, as well as their interaction mechanisms. Uusitalo et al. presented a series of designs based on varying specific speeds, utilizing CFD simulations to identify distinctions in flow losses between low and high specific speed conditions [18]. Zhao et al. conducted design and simulation studies on an S-CO2 turbine, analyzing the characteristics of the tip leakage vortex and the counter vortex near the blade leading edge pressure side, and investigating vortex flow features under different clearance sizes [19]. Gunawan et al. designed a 113 kW turbine and characterized potential flow separation scenarios based on CFD results [20]. Al Moghazy et al. designed a multi-stage radial-outflow supercritical carbon dioxide turbine and performed three-dimensional CFD simulations to analyze supersonic flow behavior and associated losses across different configurations [21]. The vortex flow in S-CO2 turbines has attracted attention from researchers. Based on the above studies, it is evident that the turbine vortex flow mechanism is closely related to flow losses, indicating the necessity for continued in-depth research.
Due to the higher density of S-CO2, S-CO2 turbines in existing studies are typically smaller in size and have higher design rotational speeds compared to gas turbines of equivalent power. For turbines with small design mass flow rates, full admission often leads to smaller blade heights, causing significant flow losses due to tip leakage and secondary flows. Partial admission, where part of the total annular arc is blocked, can reduce the flow losses caused by small blade heights [22]. Current research on the flow mechanisms of partial admission turbines has primarily focused on working fluids such as air and steam. These studies can serve as references for S-CO2 turbines. Partial admission leads to flow inhomogeneity, especially at the interface between the active and inactive regions. Wakeley et al. used two-dimensional CFD to analyze the flow field of partial admission turbines and pointed out the differences from three-dimensional analysis methods [23]. Sakai et al. analyzed the impact of the circumferential position of the admission arc section on turbine performance [24]. Hushmandi et al. analyzed the effect of axial gaps between the stator and rotor blades on turbine performance, noting that disk cavity leakage flow interacts with the mainstream [25]. Newton et al. compared the flow losses between full admission and partial admission turbines, discovering high-entropy production zones, including the shear layer formed between the flowing and non-flowing regions, and the leading and trailing edges of the blade pressure surface in the non-flowing section [26]. Gao et al. analyzed the impact of rotor solidity on turbine flow fields and performance, comparing it with full admission turbines [27]. Wang et al. studied the flow field of partial admission radial turbines and compared the flow losses with existing models [28]. Abdalhamid et al. designed a 440 kW partial admission supersonic turbine and analyzed the impact of design parameters [29]. Peng et al. designed a single-stage partial admission impulse turbine, characterizing several distinct flow patterns, including inverse flow, endwall crossflow in the region proximate to the blade hub, and forward crossflow near the blade shroud [30]. Guan et al. employed the spatial distribution of the total entropy production rate to identify regions of high loss and elucidated the evolution mechanisms of vortices at different spanwise locations [31]. Li et al. investigated shock waves and flow separation in a supersonic partial admission impulse turbine, additionally analyzing the mixing of high- and low-energy fluid within the passage [32].
The aforementioned studies offer valuable insights into the investigation of partial admission S-CO2 turbines. However, the thermophysical properties of S-CO2 differ from those of traditional ideal gas working fluids, and these differences lead to variations in the flow characteristics of turbomachinery. S-CO2 turbines exhibit higher tip leakage vortex strength compared to gas turbines, which is attributed to the larger clearance and stronger tip leakage jet [17]. Yang et al. studied the impact of real gas characteristics on S-CO2 centrifugal compressors and highlighted how the high density and strong pressure gradient of S-CO2 exacerbate boundary layer accumulation, and the different speeds of sound can influence shock wave formation [33]. Research on partial admission S-CO2 turbines has mainly focused on experimental studies. KIER has developed three S-CO2 experimental loops: 10 kWe class, sub-kWe class, and 60 kWe class [34,35]. For these cycles, a partial admission radial turbine [36] and a partial admission axial turbine [37] were designed. Preliminary test results for the radial turbine using R134a as the working fluid—where a turbine power output of 400 W was successfully achieved under similarity conditions—have been reported [38]. Test results for the axial turbine, including a continuous operation lasting 44 min, are also reported [39]. The maximum turbine power reached 25.4 kW, and the maximum electric power was 10.3 kWe. Huang et al. constructed a CO2 transcritical power cycle system and conducted tests on a partial admission impulse turbine, with the maximum power output reaching 692 W [40], and later achieving 2.27 kW in subsequent studies [41]. Li et al. tested a partial admission turbine designed for 40,000 rpm and 13.5 kW of power, providing dynamic and steady-state results and constructing a performance map [42]. These experimental studies enhance researchers’ understanding of the performance of partial admission S-CO2 turbines. However, the underlying flow mechanisms remain unclear, which are closely linked to flow losses in such turbines. Therefore, further investigation is warranted.
In this study, numerical simulations were conducted on an axial-flow partial admission S-CO2 turbine. The effects of partial admission ratio on turbine efficiency and rotor blade torque were investigated. Flow field characteristics were analyzed, with particular attention to flow non-uniformity. Special focus was placed on the vortex structures near the interface between the active and inactive regions. Furthermore, the study explored the relationship between vortex flow characteristics under different partial admission ratios and the rotor blade loading distribution.

2. Numerical Methods

This paper investigates a S-CO2 axial turbine, with the thermodynamic and geometric parameters listed in Table 1. The mass flow rate in the table represents the full admission conditions, and the performance and flow field of the turbine under partial admission conditions will be analyzed later. The turbine has relatively small geometric dimensions, with both the chord length and blade span on the millimeter scale. The choice of an axial design is based on the fact that a radial design would result in higher turbine rotational speeds, which are more difficult to achieve. A 3D schematic of the turbine is shown in Figure 1, where the blue section represents the stator and the orange section represents the rotor. In this schematic, six passages are retained, corresponding to the areas between five adjacent stator blades, while the other passages are blocked. The active sector considered in this study is continuous in the circumferential direction, and the discontinuous distribution of active sector is not considered. The sidewall shapes of the active sector are consistent with the suction and pressure surfaces of the corresponding blades in order to minimize the interference of wall shape on the flow field analysis. The partial admission ratio (PAR) is defined as the active fraction of the stator exit area. The turbine efficiency is calculated using Equation (1), which is employed consistently throughout this paper:
η = h 01 h 02 h 01 h 02 , s
where h denotes specific enthalpy. The subscripts 0, 1, 2, and s represent total conditions, the turbine inlet location, the turbine outlet location, and isentropic conditions, respectively.
The three-dimensional steady-state Reynolds-Averaged Navier-Stokes (RANS) equations were solved using the commercial solver ANSYS CFX 2021 R1 [43]. The governing equations consist of the continuity equation, momentum equation, and energy equation, as expressed in Equations (2)–(4).
ρ t + x j ρ U j = 0
ρ U i t + x j ρ U i U j = p x i + x j τ i j ρ u i u j ¯ + S M
ρ h t p t + x j ρ U j h = x j λ T x j ρ u j h - + x j U i τ i j ρ u i u j ¯ + S E
The system of equations was closed using the two-equation Shear Stress Transport (SST) model proposed by Menter [44]. The SST model accurately predicts the onset and extent of flow separation by incorporating transport effects into the eddy viscosity formulation. Therefore, the SST model is suitable for solving flow in turbomachinery. The automatic wall function in CFX is used. A lookup table was incorporated in the solver to read the thermophysical properties of S-CO2. The properties of CO2 were referenced from the Span and Wagner (S-W) equation of state model provided in the NIST Reference Fluid Thermodynamic and Transport Properties [45]. The imported lookup table (rgp file) had a size of 1500 × 1300, with a pressure range from 2 to 17 MPa and a temperature range from 273 to 923 Kelvin, with resolutions of 1 kPa for pressure and 1 Kelvin for temperature. The boundary conditions were set to the total pressure and total temperature at the inlet and the pressure at the outlet, as shown in Table 1. The flow direction at the inlet was set to be perpendicular to the inlet boundary, with a turbulence intensity of 5%. All walls were considered adiabatic, smooth, and no-slip, with the rotor shroud set to reverse rotational speed. Convergence of the solution was verified by ensuring that the residuals for mass, momentum, and turbulence were reduced by at least seven orders of magnitude, and by checking that the mass flow rate variation at the inlet and outlet was less than 1%, with pressure and temperature fluctuations also less than 1%.
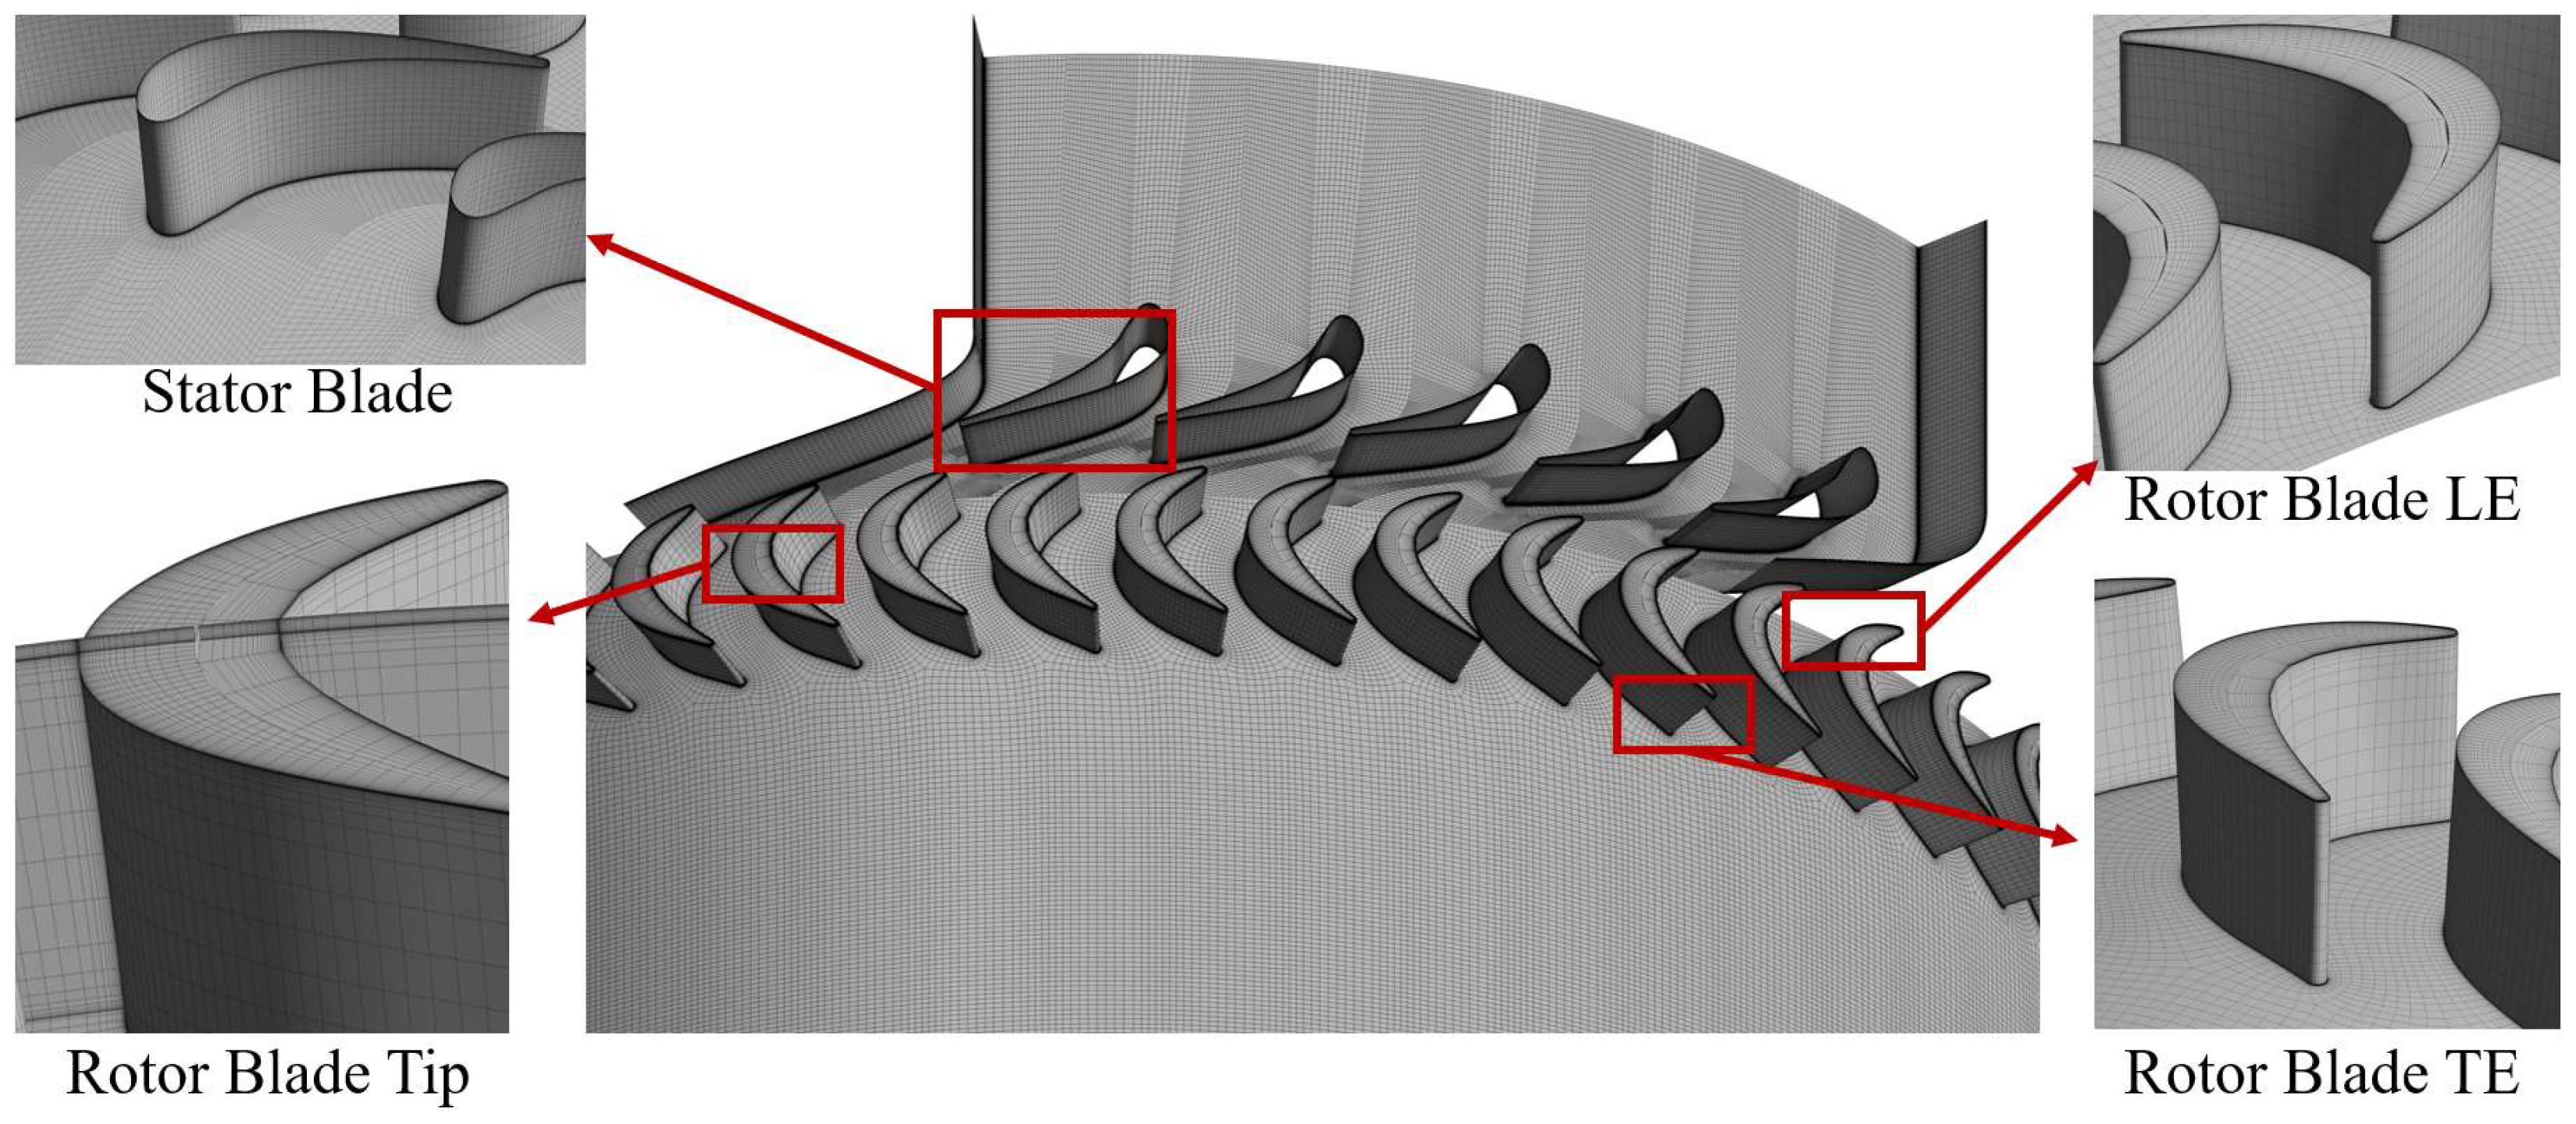
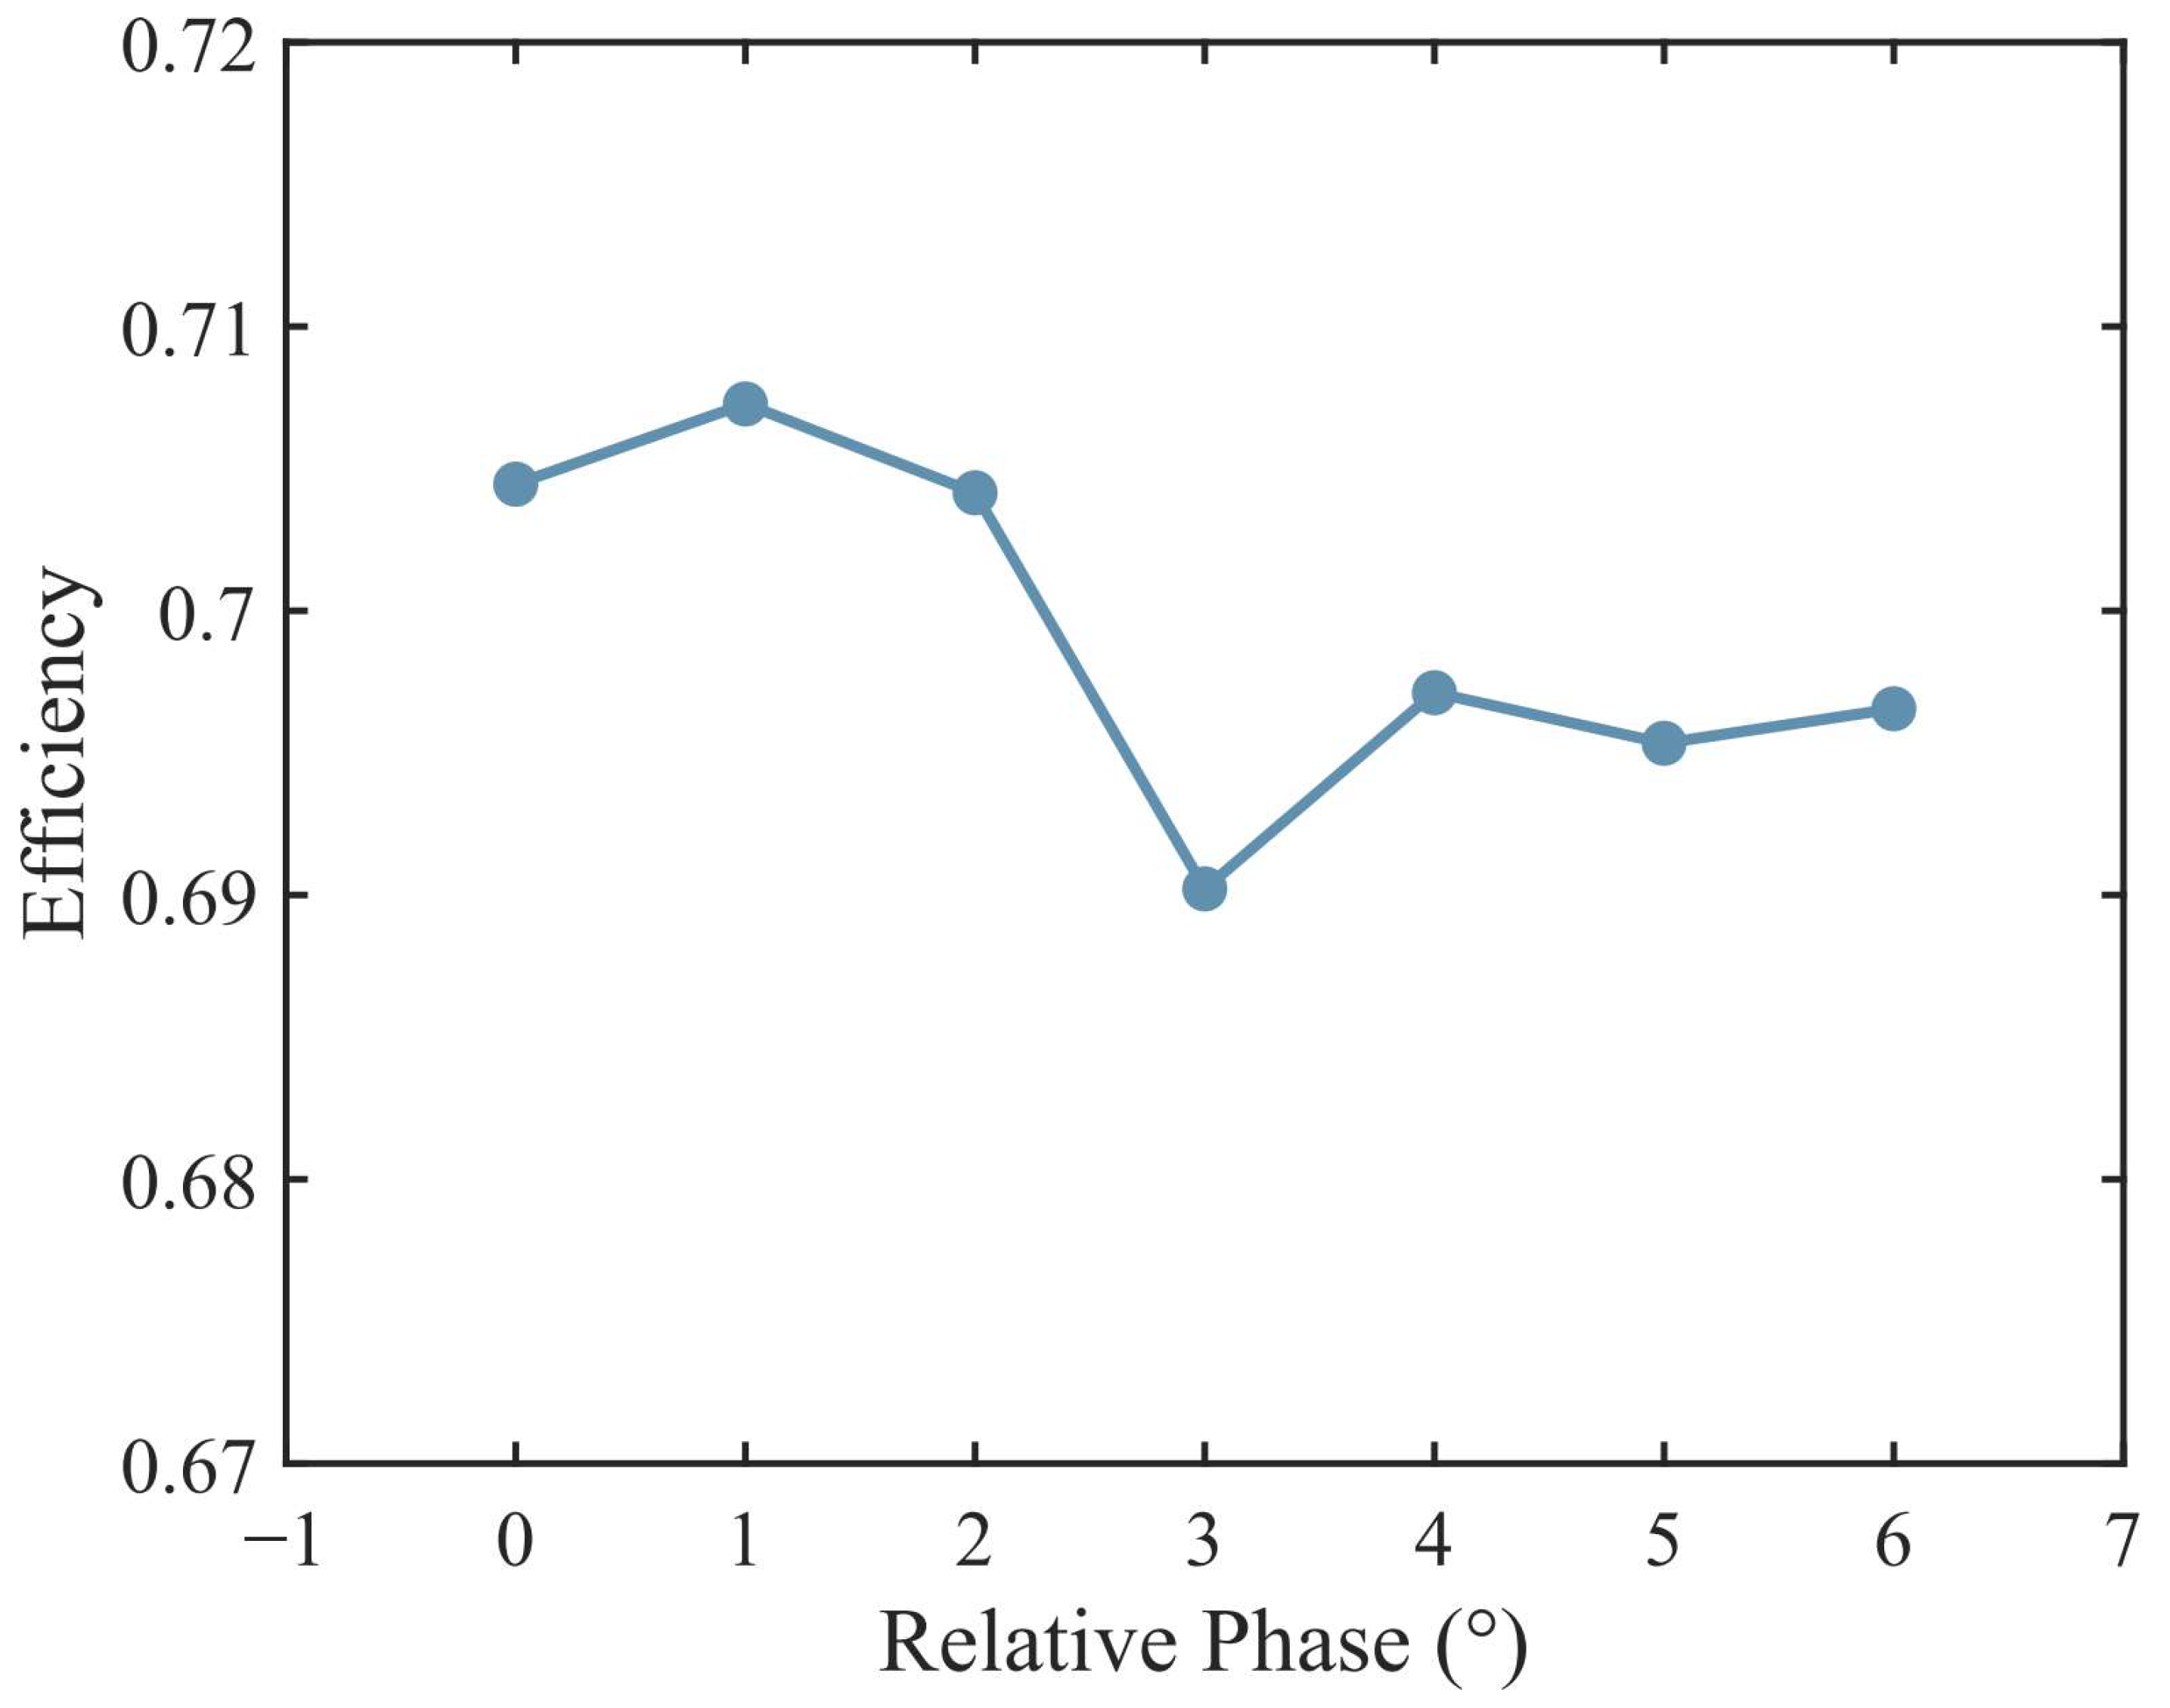
Partial admission can lead to flow nonuniformities; thus, a full-annulus model is used for the calculations. The computational domain is extended axially at both the stator inlet and rotor outlet. Structured grids for the stator and rotor domains were generated using ICEM CFD 2021 R1 and TurboGrid 2021 R1, respectively. The tip clearance size of the rotor blades is set to 0.1 mm, and the mesh is refined near the walls. To assess mesh independence, efficiency was evaluated for a case with six blade passages, as shown in Table 2. When the number of mesh elements exceeds 14.68 million, the change in efficiency becomes negligible and has almost no impact on the results, so Mesh 3 was selected for the final calculations. When structural parameters, such as the number of inlet passages, are changed, the same mesh settings are applied. Figure 2 shows a schematic of the mesh. The interface between the stator and rotor domains in this study utilized the frozen rotor model. In this model, the two frames of reference are connected such that they maintain a fixed relative position throughout the calculation [43]. The frozen rotor approach effectively captures the circumferential variation in rotor inflow conditions caused by the non-uniform stator exit flow field and its significant influence on the time-averaged rotor flow field, as demonstrated in previous studies [31,46]. Due to the circumferential flow non-uniformity, the relative circumferential position between the stator and rotor domains must be taken into account. Figure 3 illustrates the influence of the relative phase angle between the two computational domains on the simulated turbine efficiency, calculated using Equation (1). The maximum deviation in turbine efficiency among different phase angles was 1.7 percentage points, which is considered acceptable. For the subsequent performance analysis, the averaged results over different relative phase angles were adopted, while the flow field analysis was based on the case with a relative phase angle of 4°.
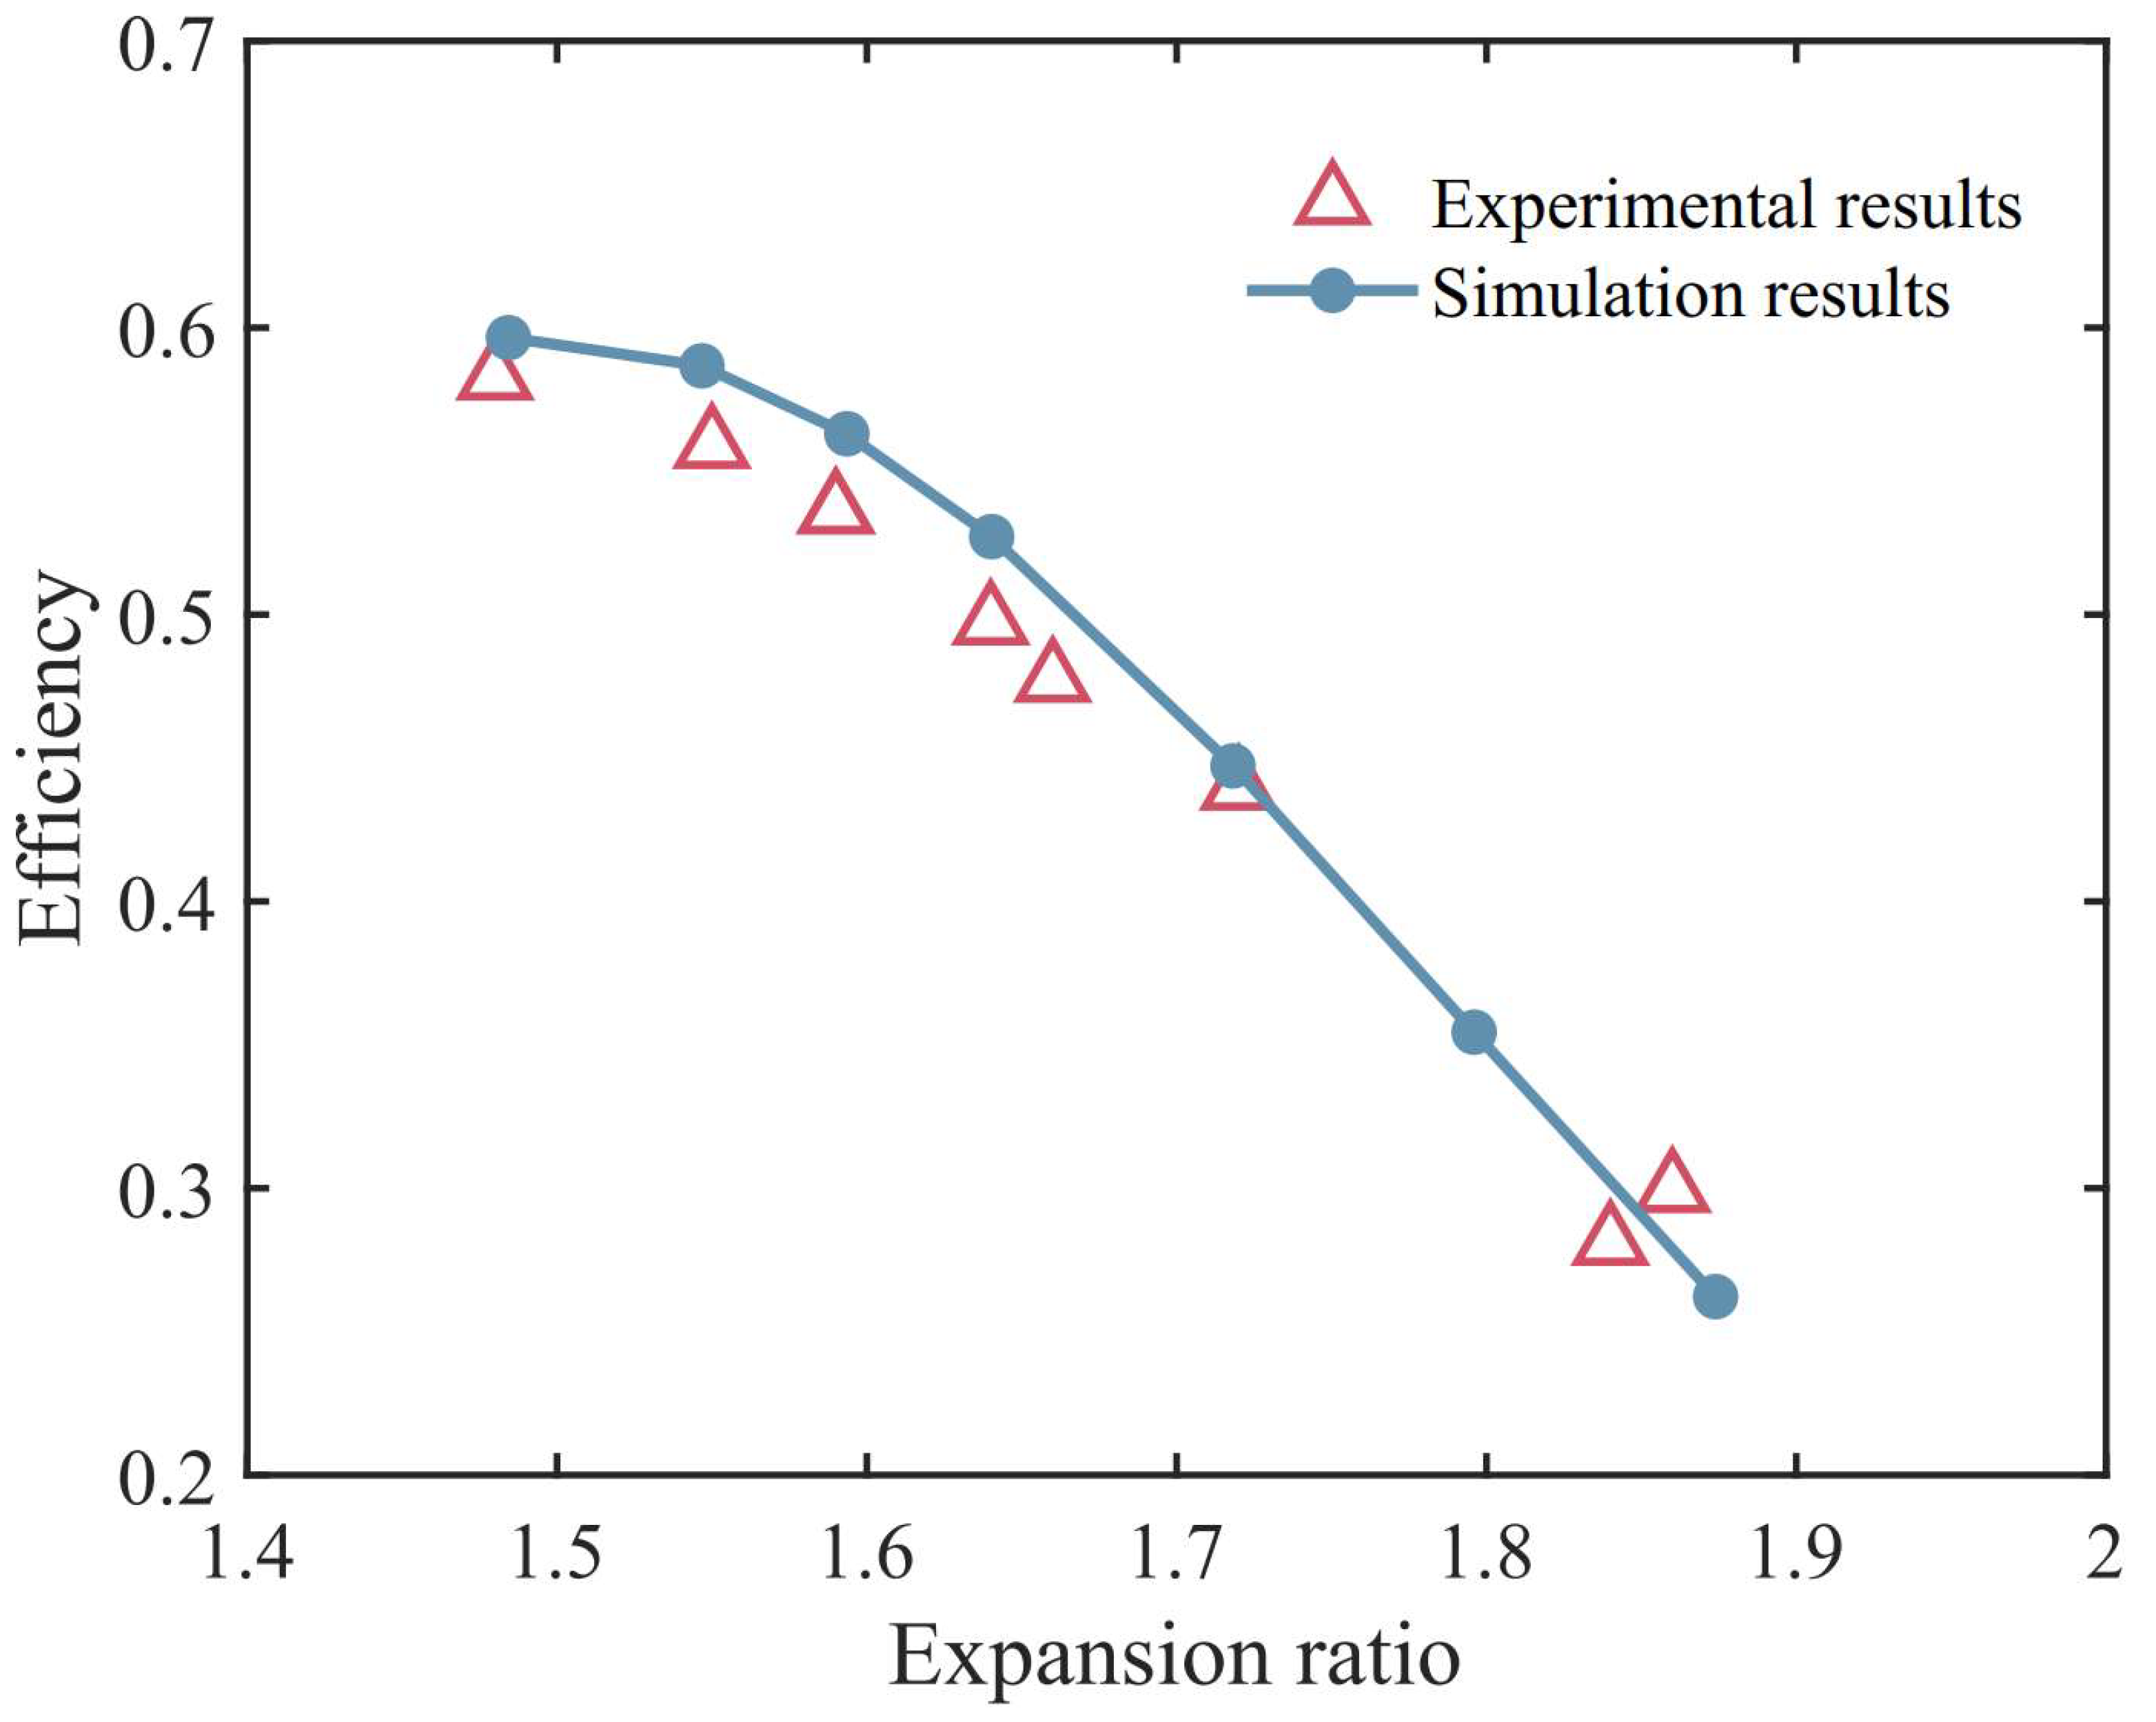
The numerical method employed in this study was validated against a previous experimental investigation [42]. A simulation was conducted on the same partial admission turbine used in that experimental study, employing the same numerical approach described earlier. Figure 4 compares the simulated turbine efficiency, calculated using Equation (1), with the experimental data across a range of expansion ratios. Overall, good agreement is observed, with the predicted efficiency trends closely matching the experimental data. The maximum absolute deviation in efficiency is approximately three percentage points. This discrepancy may be attributed to several factors. First, for small-scale turbines, manufacturing tolerances and surface roughness may have a noticeable impact on performance. Second, during actual operation, the turbine generator system incurs additional losses such as windage losses, which are not accounted for in the CFD simulations using ANSYS CFX 2021 R1. Therefore, considering the close agreement in trends and the inherent differences between the modeled and measured efficiencies, the numerical method adopted in this study is deemed reliable for analyzing the aerodynamic performance of partial admission S-CO2 turbines.

3. Results and Discussion

In this section, the effect of partial admission on turbine performance and flow field characteristics was analyzed. This study focused on vortex flow behavior, particularly at the interface between the active and inactive sectors. The relationship between vortex flow and blade torque was also discussed.

3.1. Performance of the Partial Admission Turbine

Figure 5 shows the CFD-simulated variation of turbine efficiency with the partial admission ratio. When the partial admission ratio is equal to one, the turbine operates with full admission. The cases with full admission used a full-annular model to avoid potential impacts on performance and flow field due to the rotational periodic boundary conditions in the software. As the partial admission ratio decreases, the turbine efficiency decreases, and the rate of decrease accelerates, especially when the partial admission ratio is less than 0.3. When the partial admission ratio is 0.338, the turbine efficiency drops by 2.71 percentage points compared to the full admission turbine. When the partial admission ratio is 0.172, the efficiency decrease rises to 6.07 percentage points. In the case of a relatively extreme partial admission ratio of 0.0328 (where only one stator blade passage remains for admission), the efficiency loss reaches 31.65 percentage points.
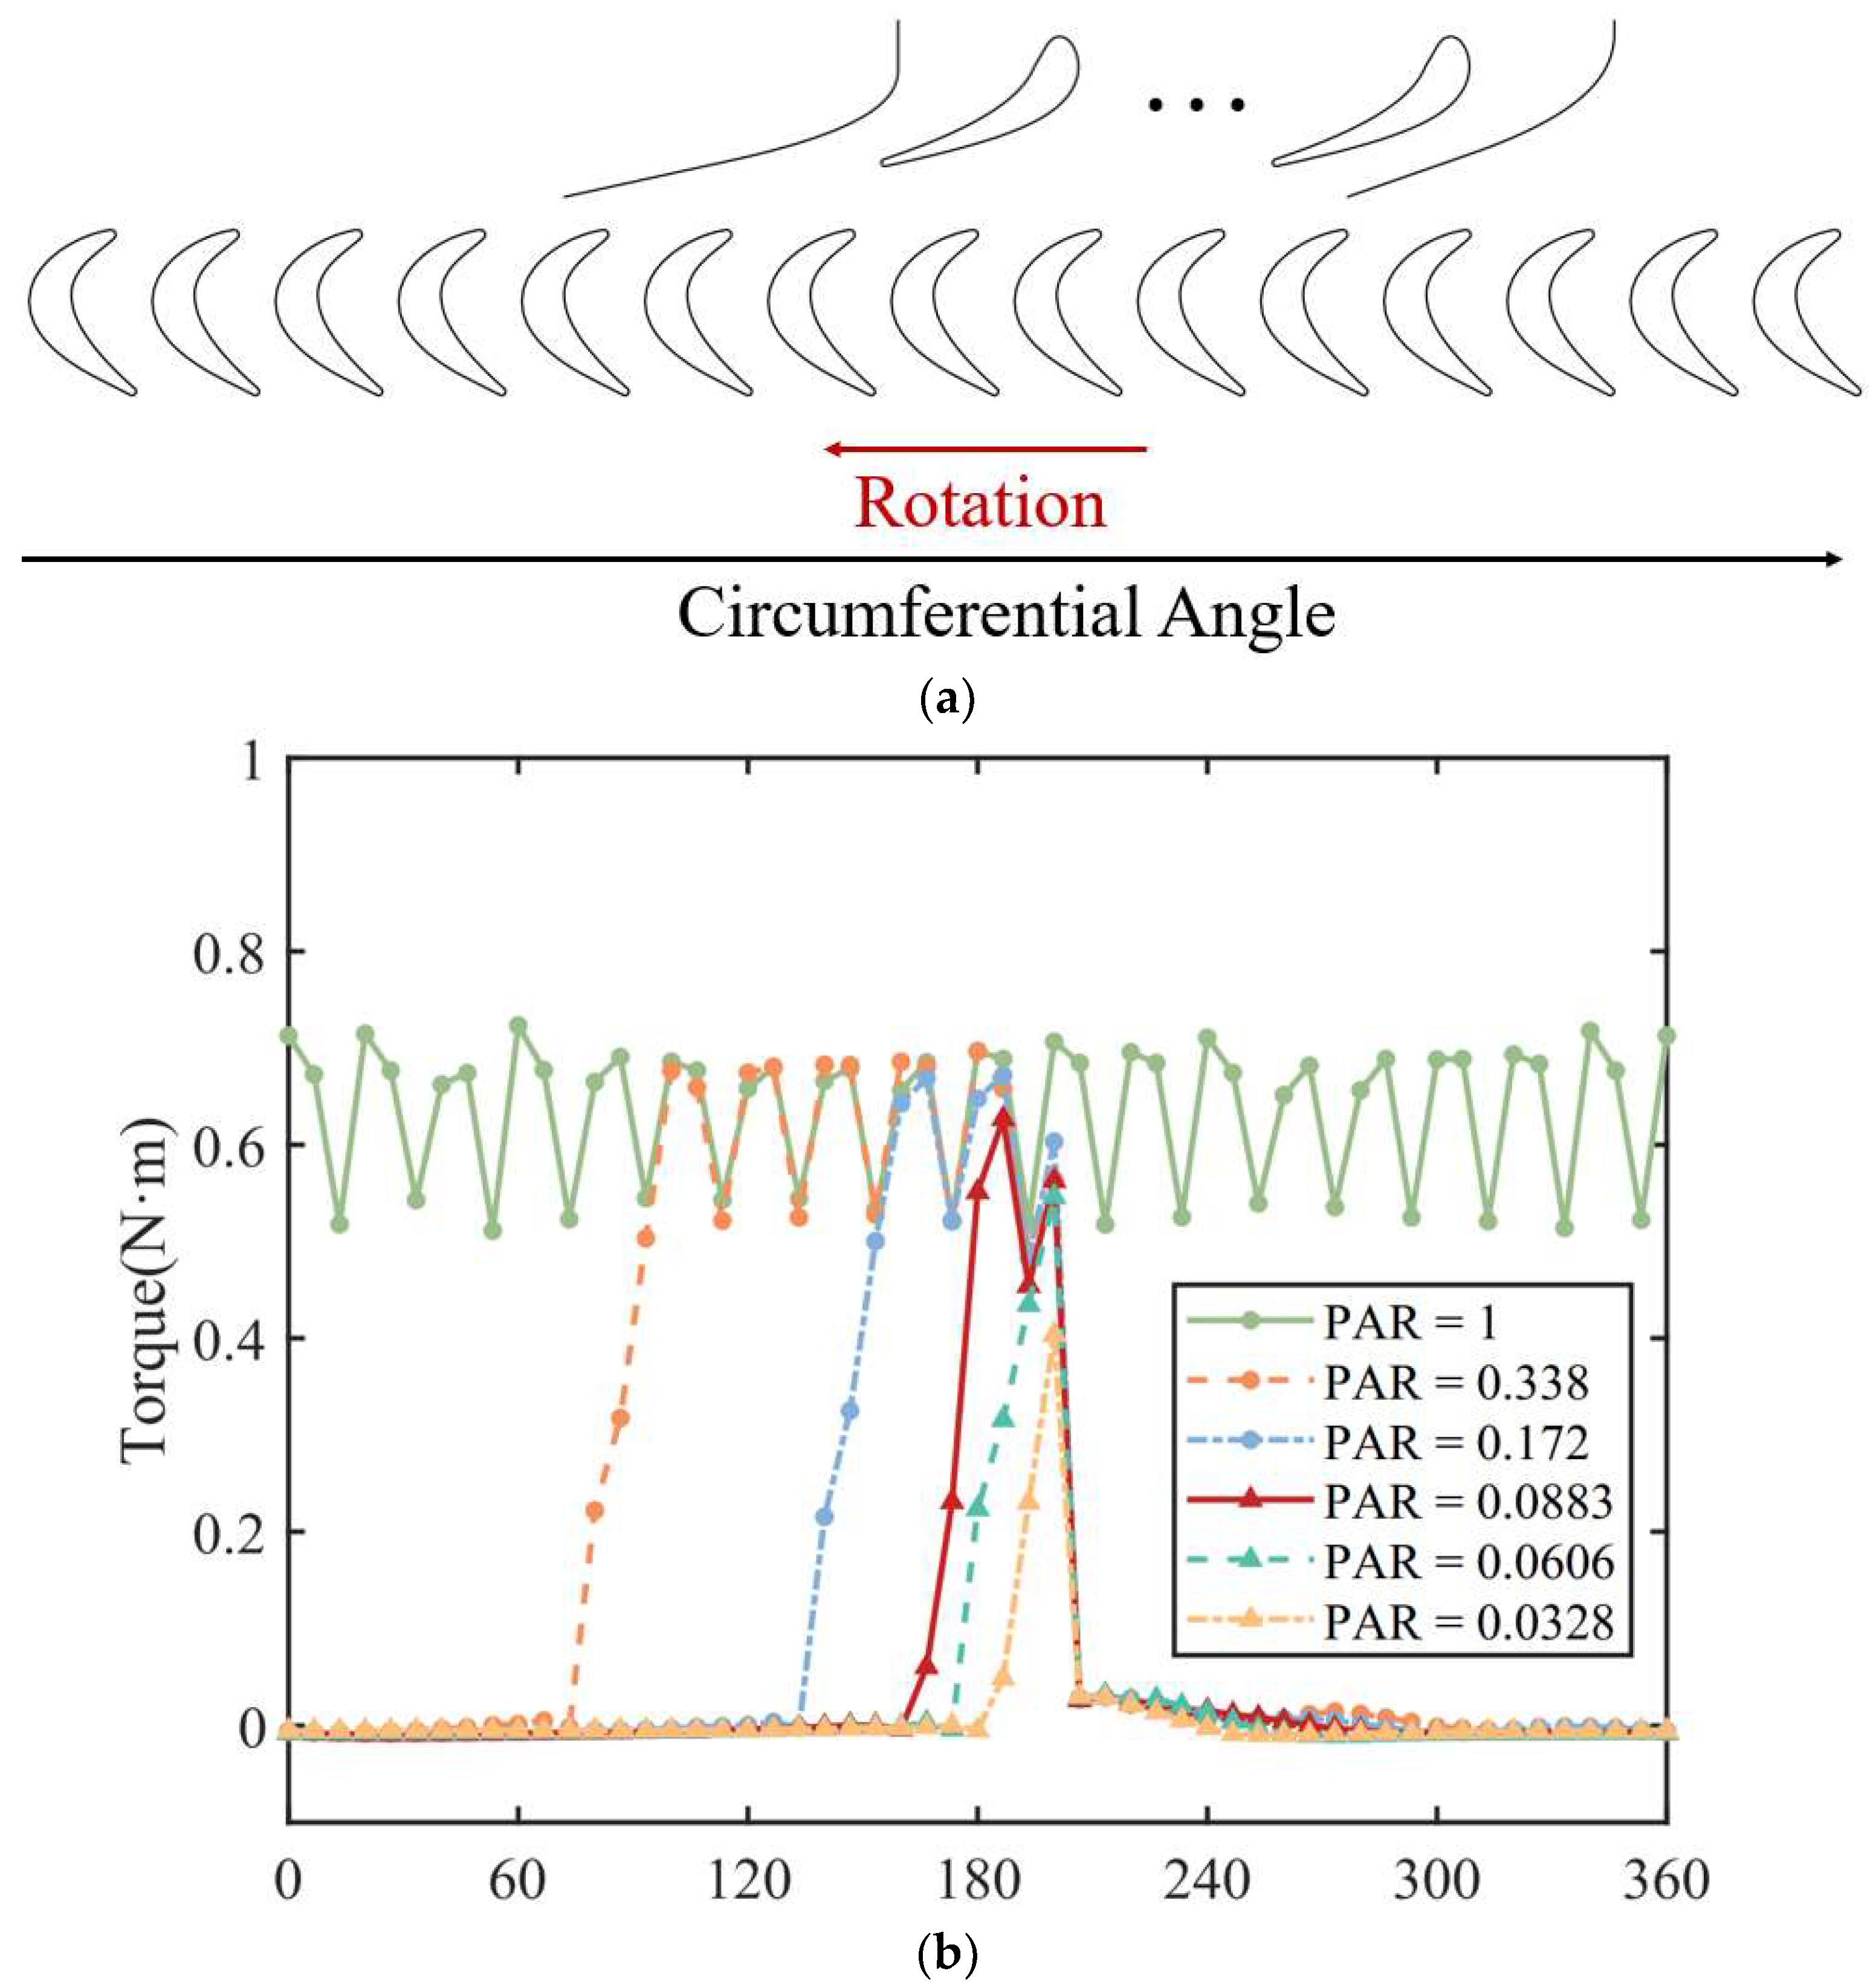
Figure 6 shows the distribution of the blade torque along the circumferential direction at different partial admission ratios. The torque generated by a single turbine rotor blade is calculated in ANSYS CFX-Post using the built-in surface torque function, which sums the torque contributions from pressure and shear stress on the discrete wall mesh elements to obtain the total torque acting on the blade surface. Each curve represents one partial admission ratio. The x-axis, labeled “Circumferential Angle,” corresponds to the circumferential position of each blade. For the full admission turbine, the torque fluctuates around a certain value as the circumferential angle decreases. The fluctuation is due to the use of the frozen rotor model. Since the number of rotor blades and stator blades are different, the rotor and stator are not one-to-one corresponding in the circumferential direction. Therefore, even under full admission condition, different rotor blades exhibit varying torques. The figure also shows the direction of rotor rotation, which is in the direction of decreasing circumferential angle. For the partial admission turbine, the blade torque experiences two sudden changes along the rotation direction: one when entering the active sector and the other when leaving the active sector. When the blades are outside the active sector, the torque is close to zero but negative, indicating that the stagnation fluid filling the casing creates resistance on the rotor. As shown by the curve for PAR = 0.338, when the partial admission ratio is relatively large, the blade torque in the middle of the active region exhibits characteristics similar to those of the full admission turbine. However, the blade torques at both sides of the active sector are lower than those under full admission conditions. At the interface where the blades enter the active sector, the torque rapidly increases to a value similar to that of the full admission turbine. At the interface where the blades exit the admission region, the torque decreases relatively slowly, affecting from three to four blades, and exhibits a torque significantly lower than the full admission case. Specifically, for smaller partial admission ratios, such as those represented by the PAR of less than 0.1 curves, the blade torque starts to decrease before it reaches a steady state close to the full admission torque after entering the active sector. The smaller the partial admission ratio, the lower the maximum blade torque. This explains why the turbine efficiency begins to decrease rapidly when the partial admission ratio drops below a certain value.

3.2. Flow Field of the Partial Admission Turbine

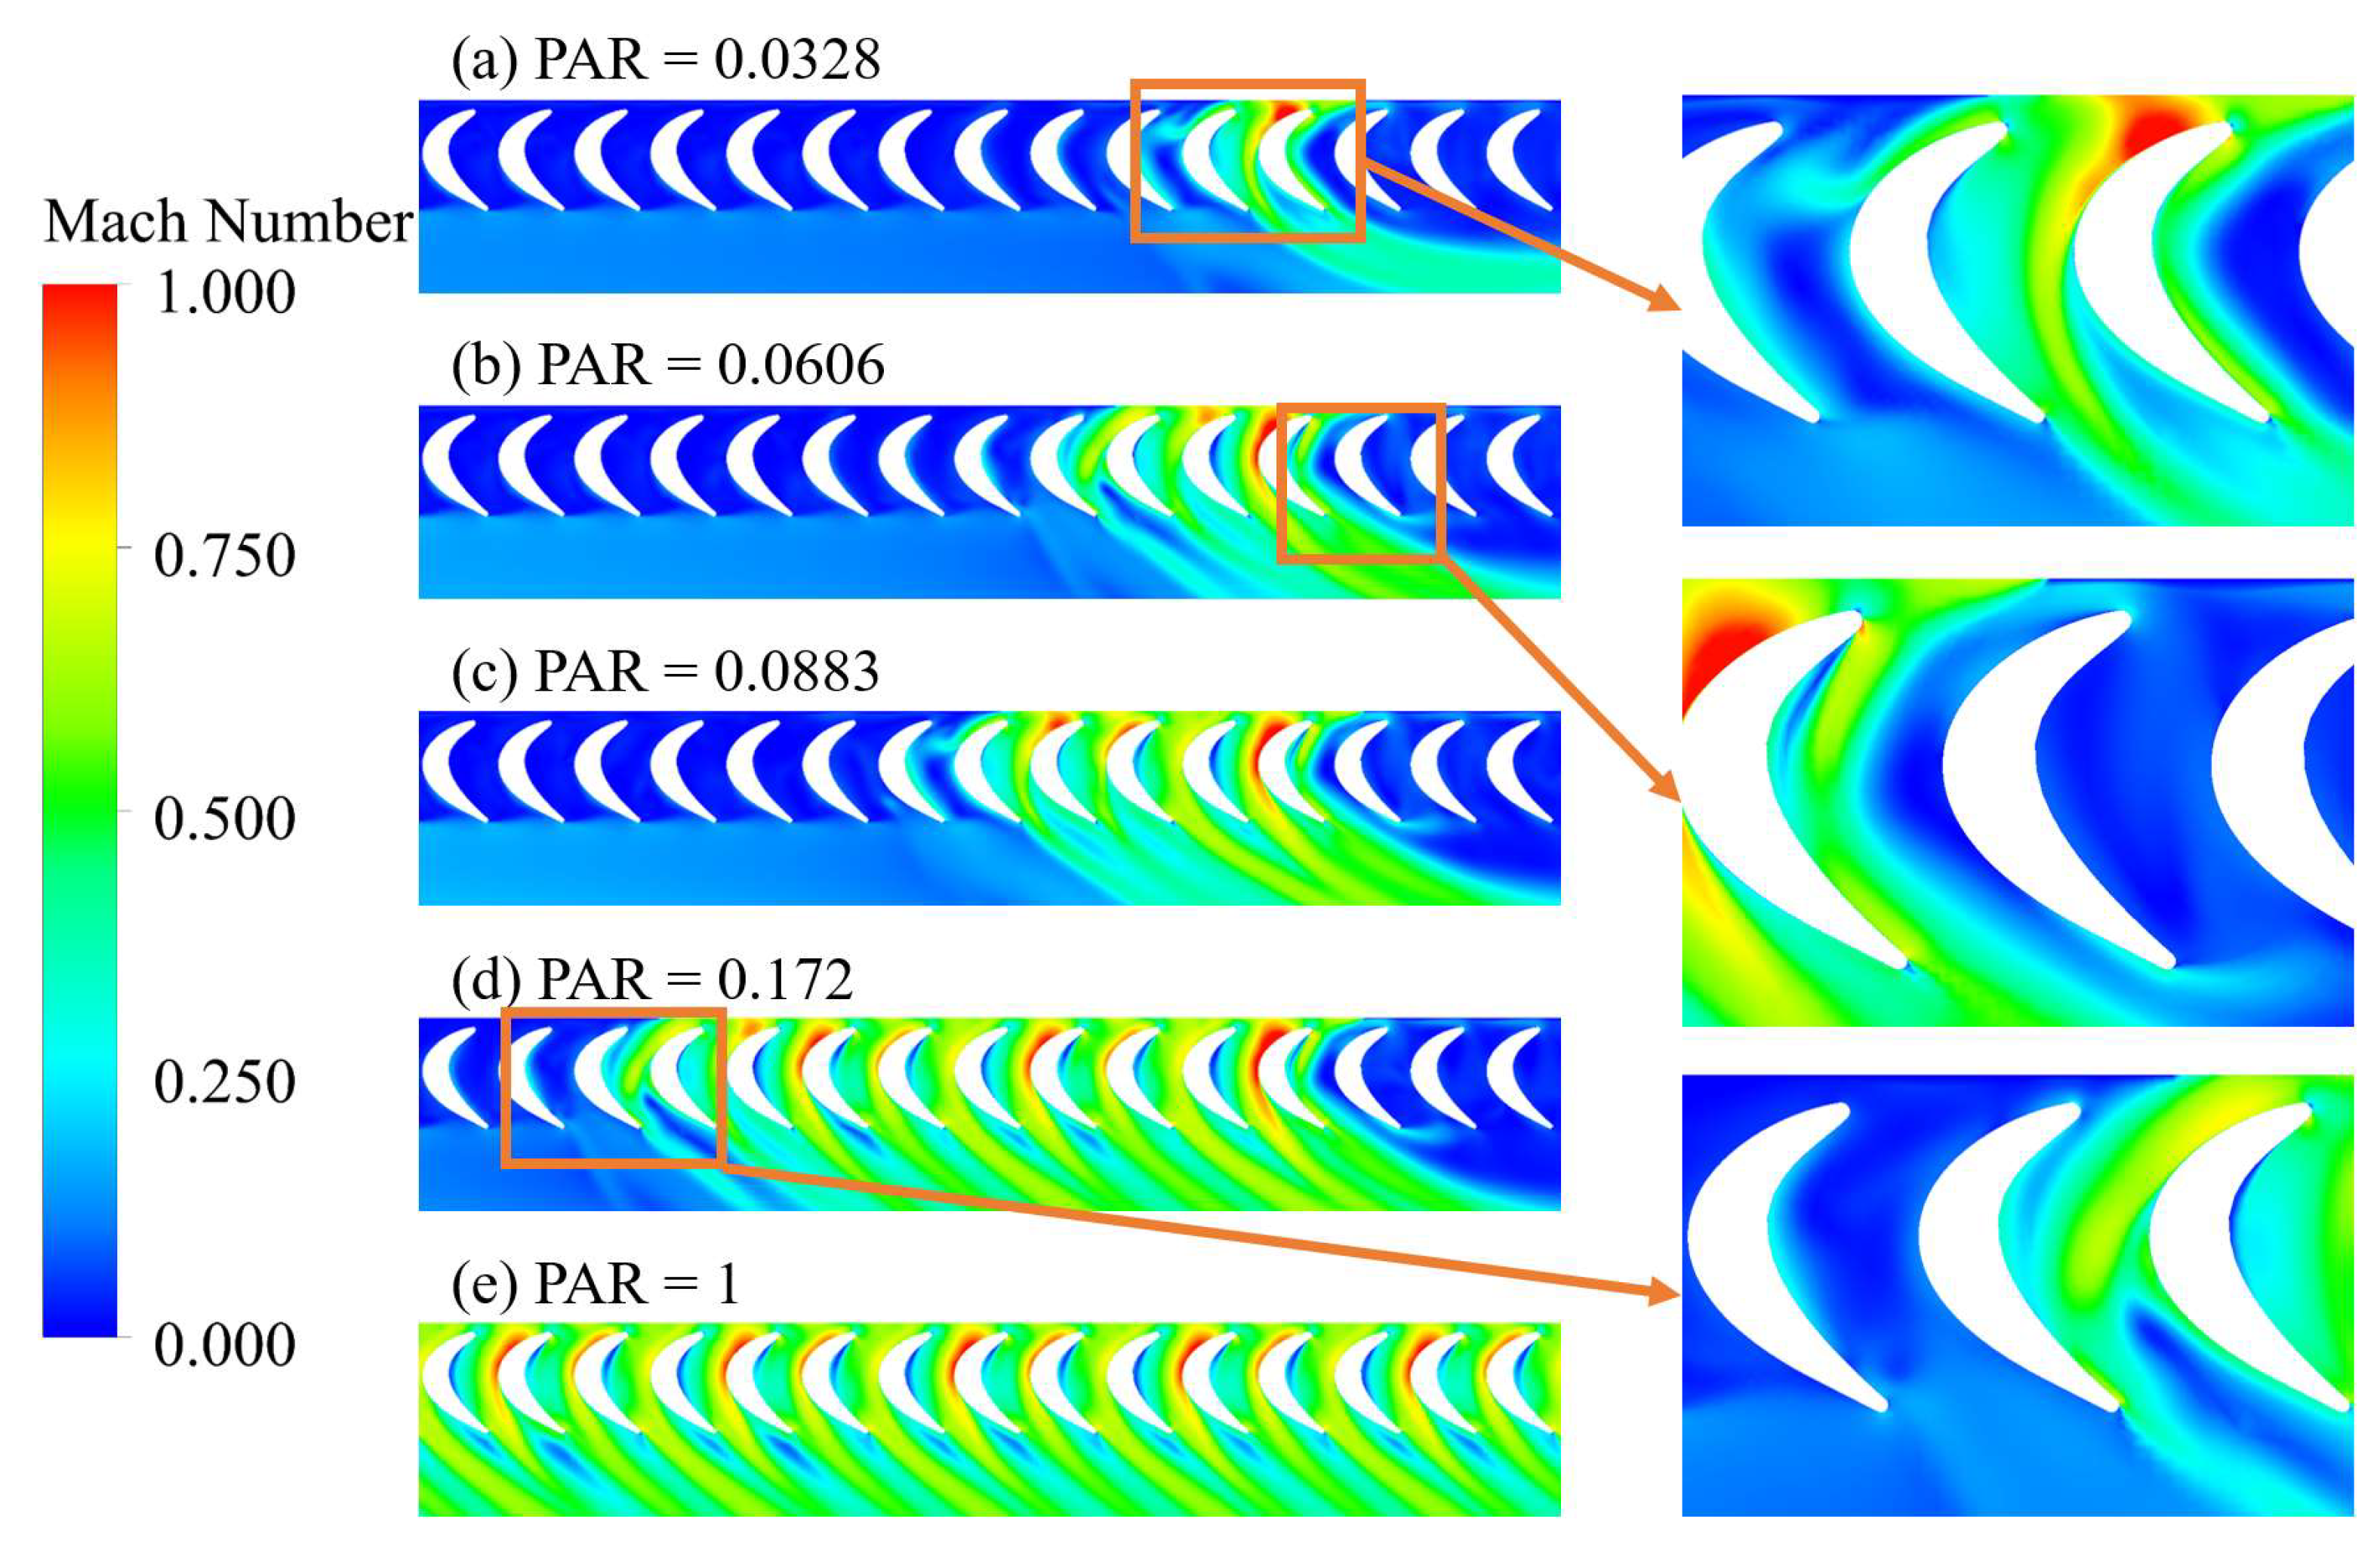
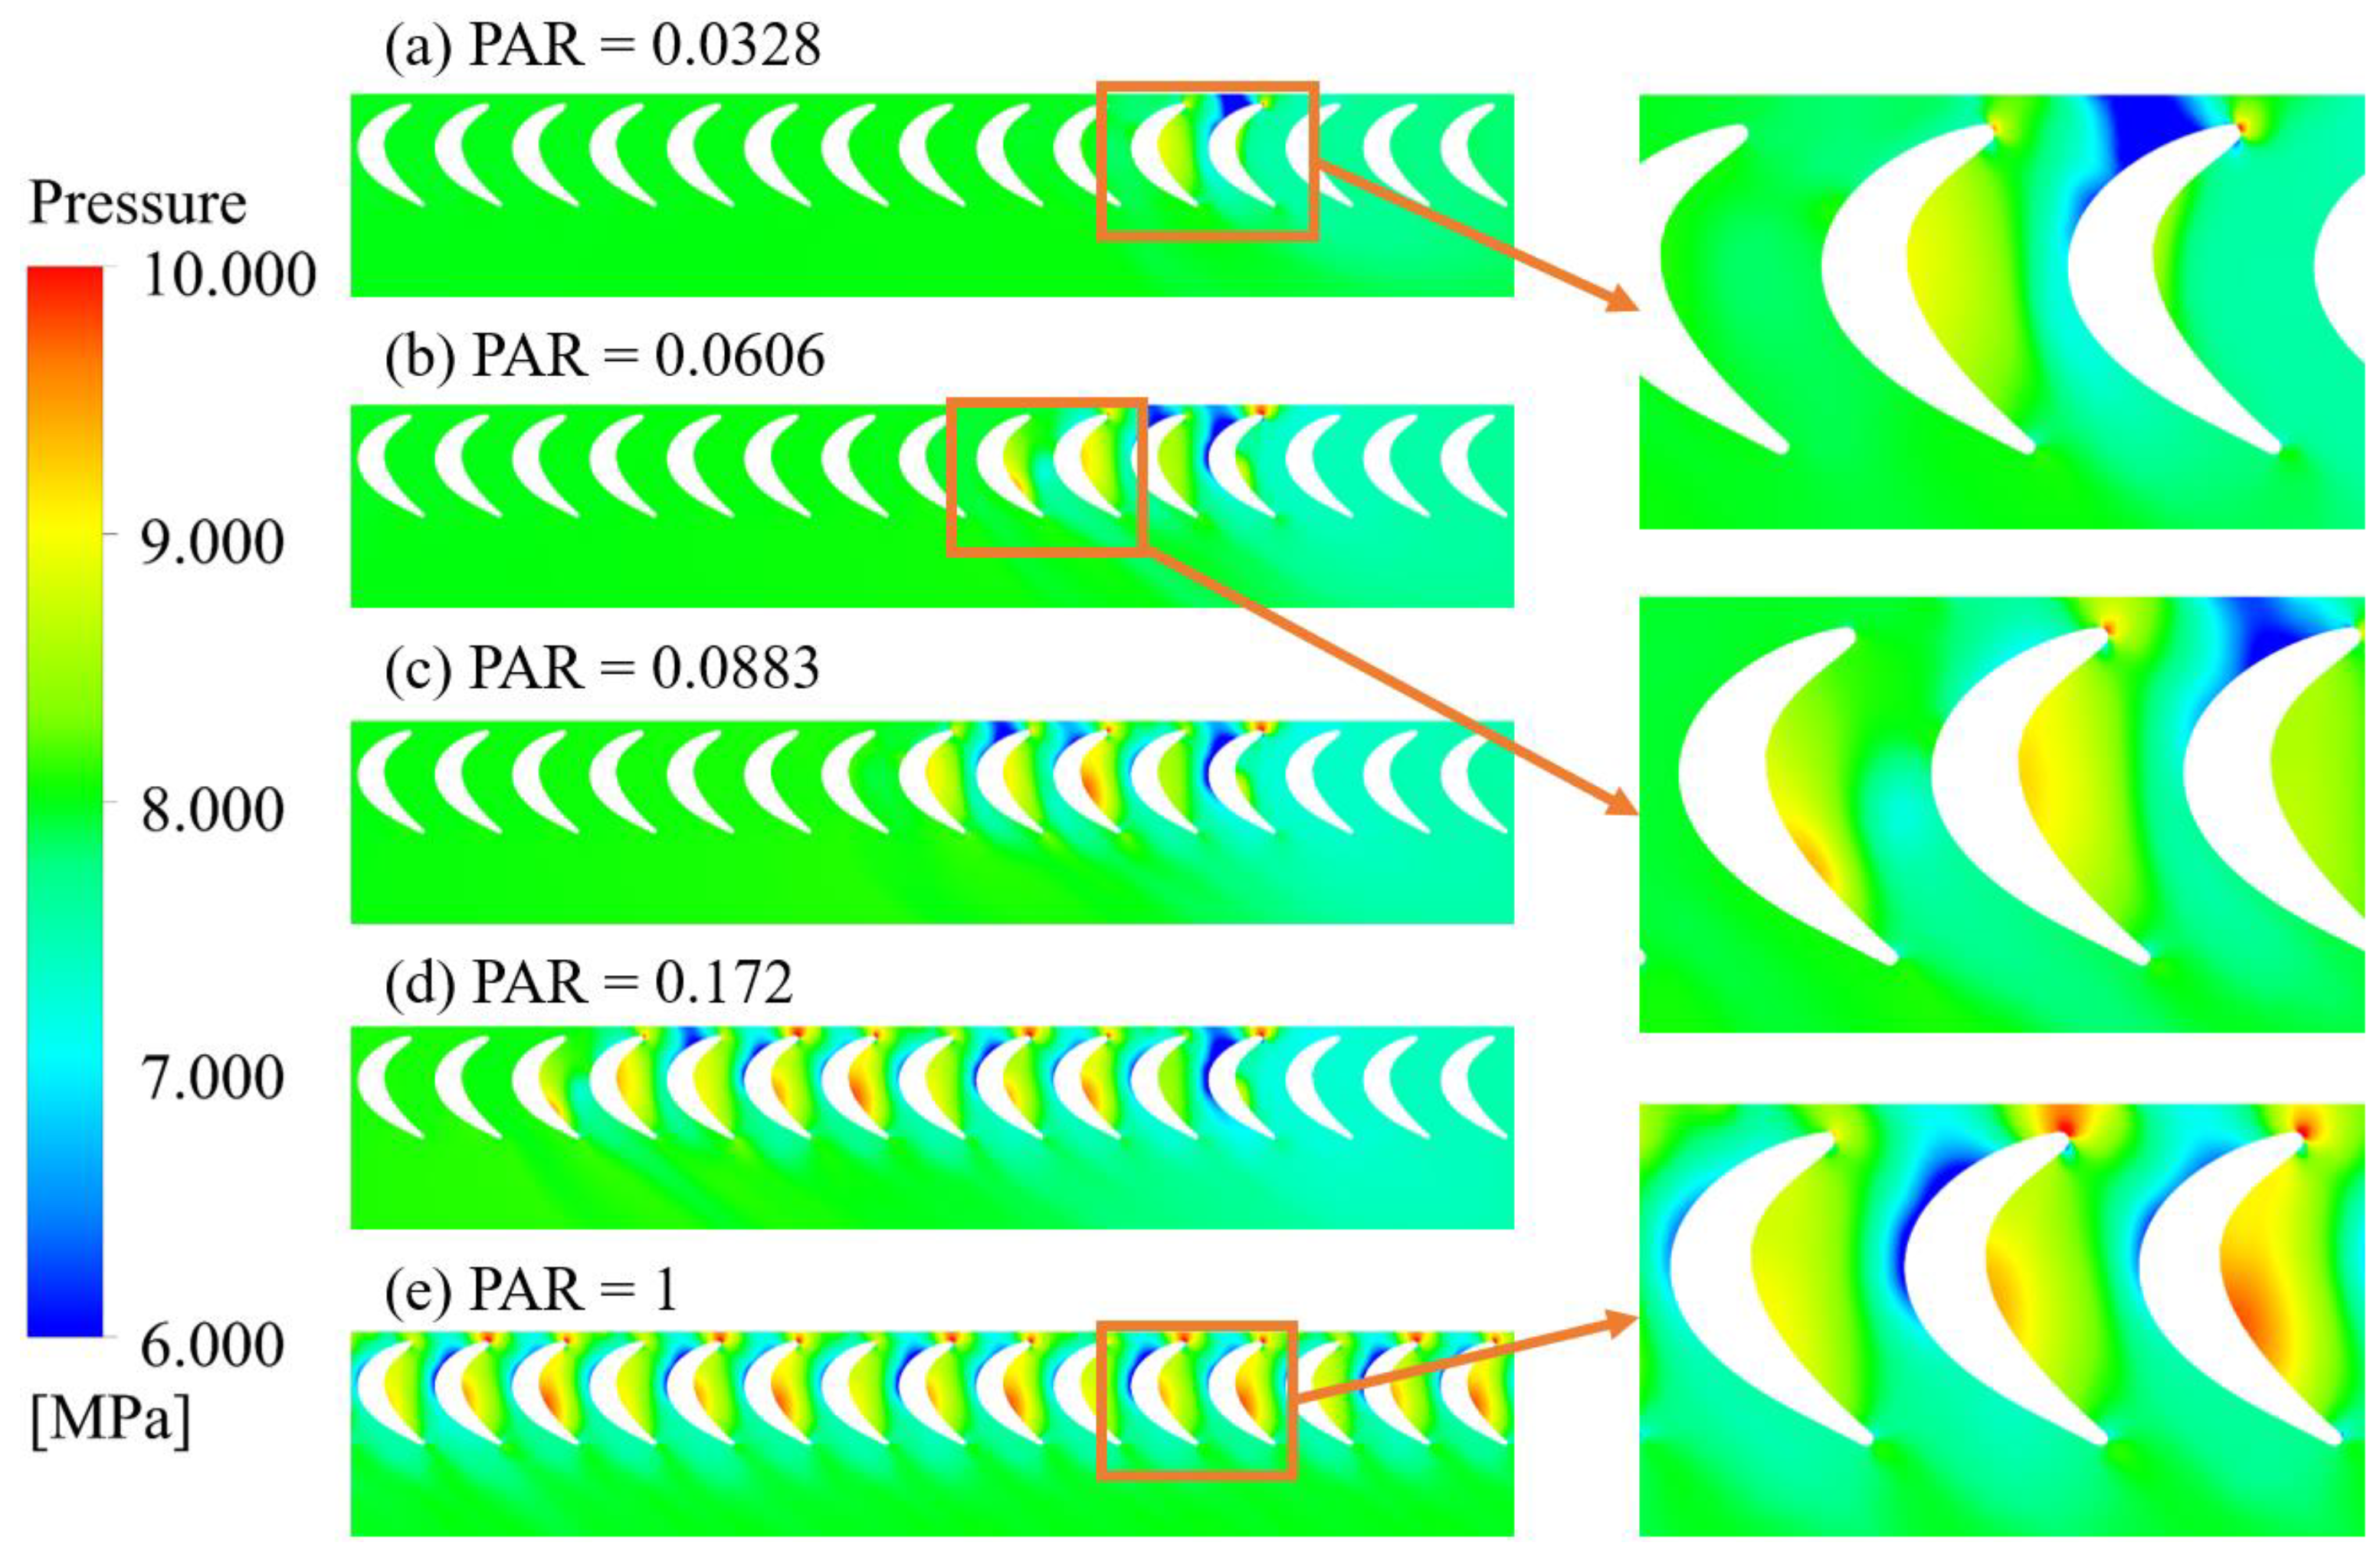
An analysis of the flow field in the rotor domain was conducted. Figure 7 shows the Mach number distribution at the 50% blade height position under different partial admission ratios. Under full admission conditions, the flow through different blade passages is generally the same, with only slight differences arising from the application of the frozen rotor model. Under partial admission conditions, in the blade passage at the far right of the active sector, a mixture of high-momentum fluid leaving the nozzle and stagnation fluid can be observed. In the blade passage at the far left of the active sector, the high-momentum fluid entering the passage starts to decrease, leading to local stagnation. The fluid entering this passage first attaches to the suction side of the rotor blade and then moves to the pressure side of the next blade before exiting the passage. At the smallest partial admission ratio, only one blade passage exhibits a complete flow. Figure 8 shows the static pressure distribution at the 50% blade height under different partial admission ratios. For turbines with larger partial admission ratios, the flow in the active sector is similar to that under full admission. However, under smaller partial admission ratios, the pressure difference between the pressure and suction surfaces of the rotor blades is smaller, resulting in a reduction in the forces on the blades.
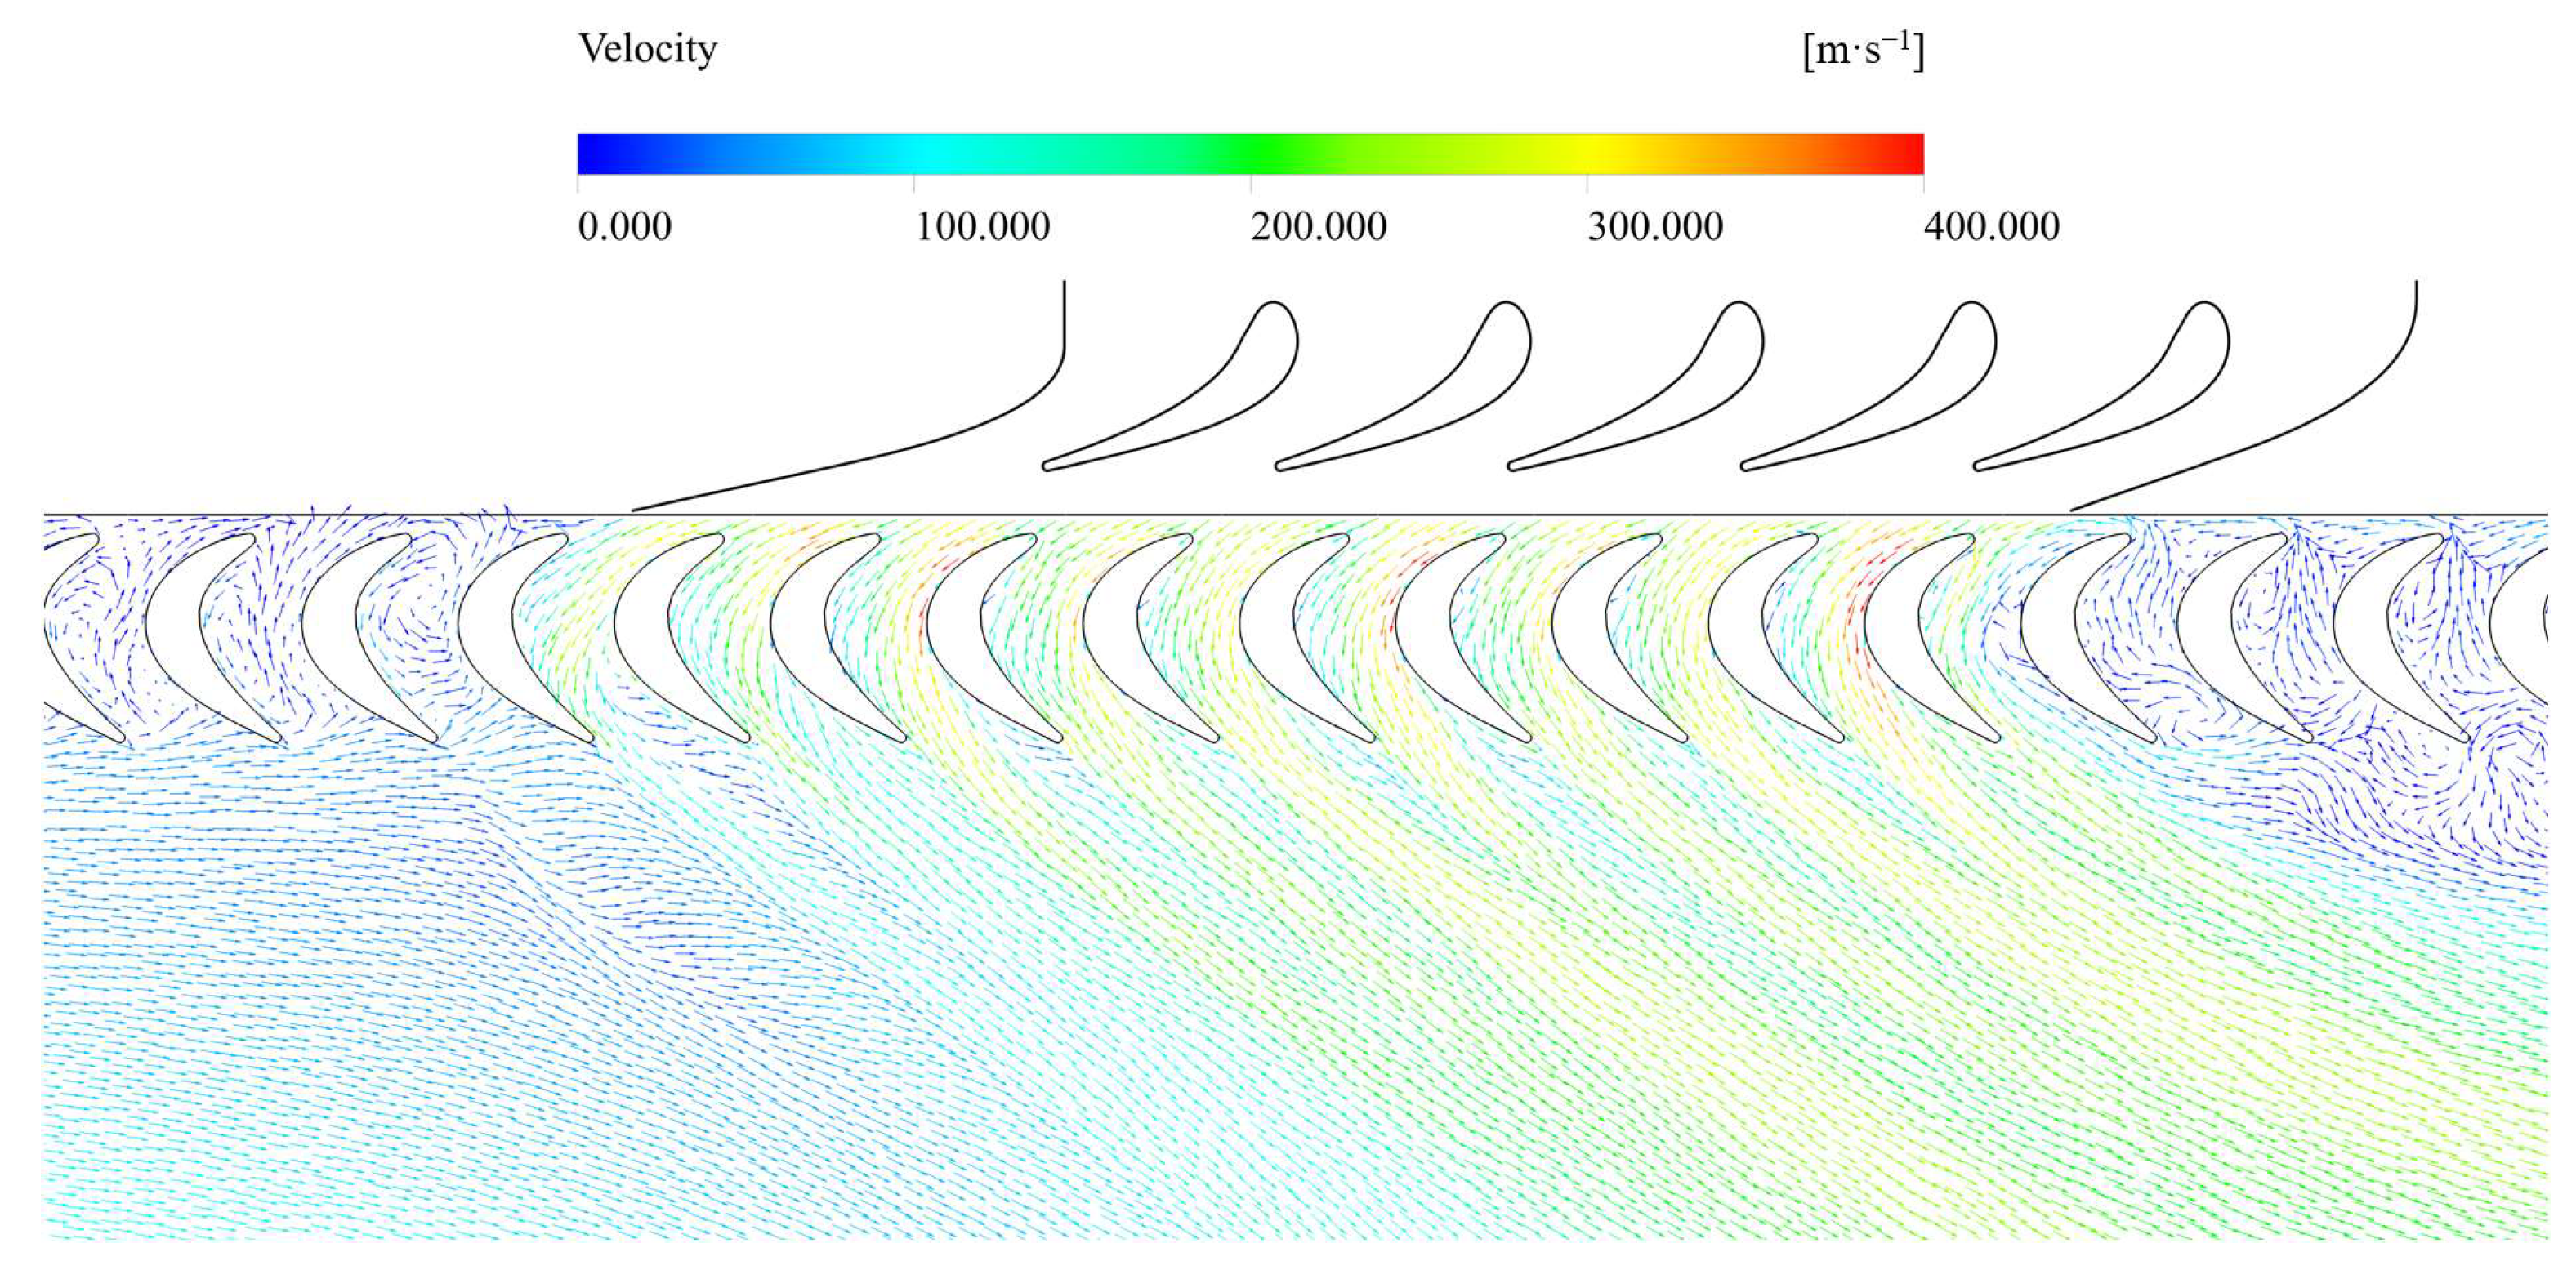
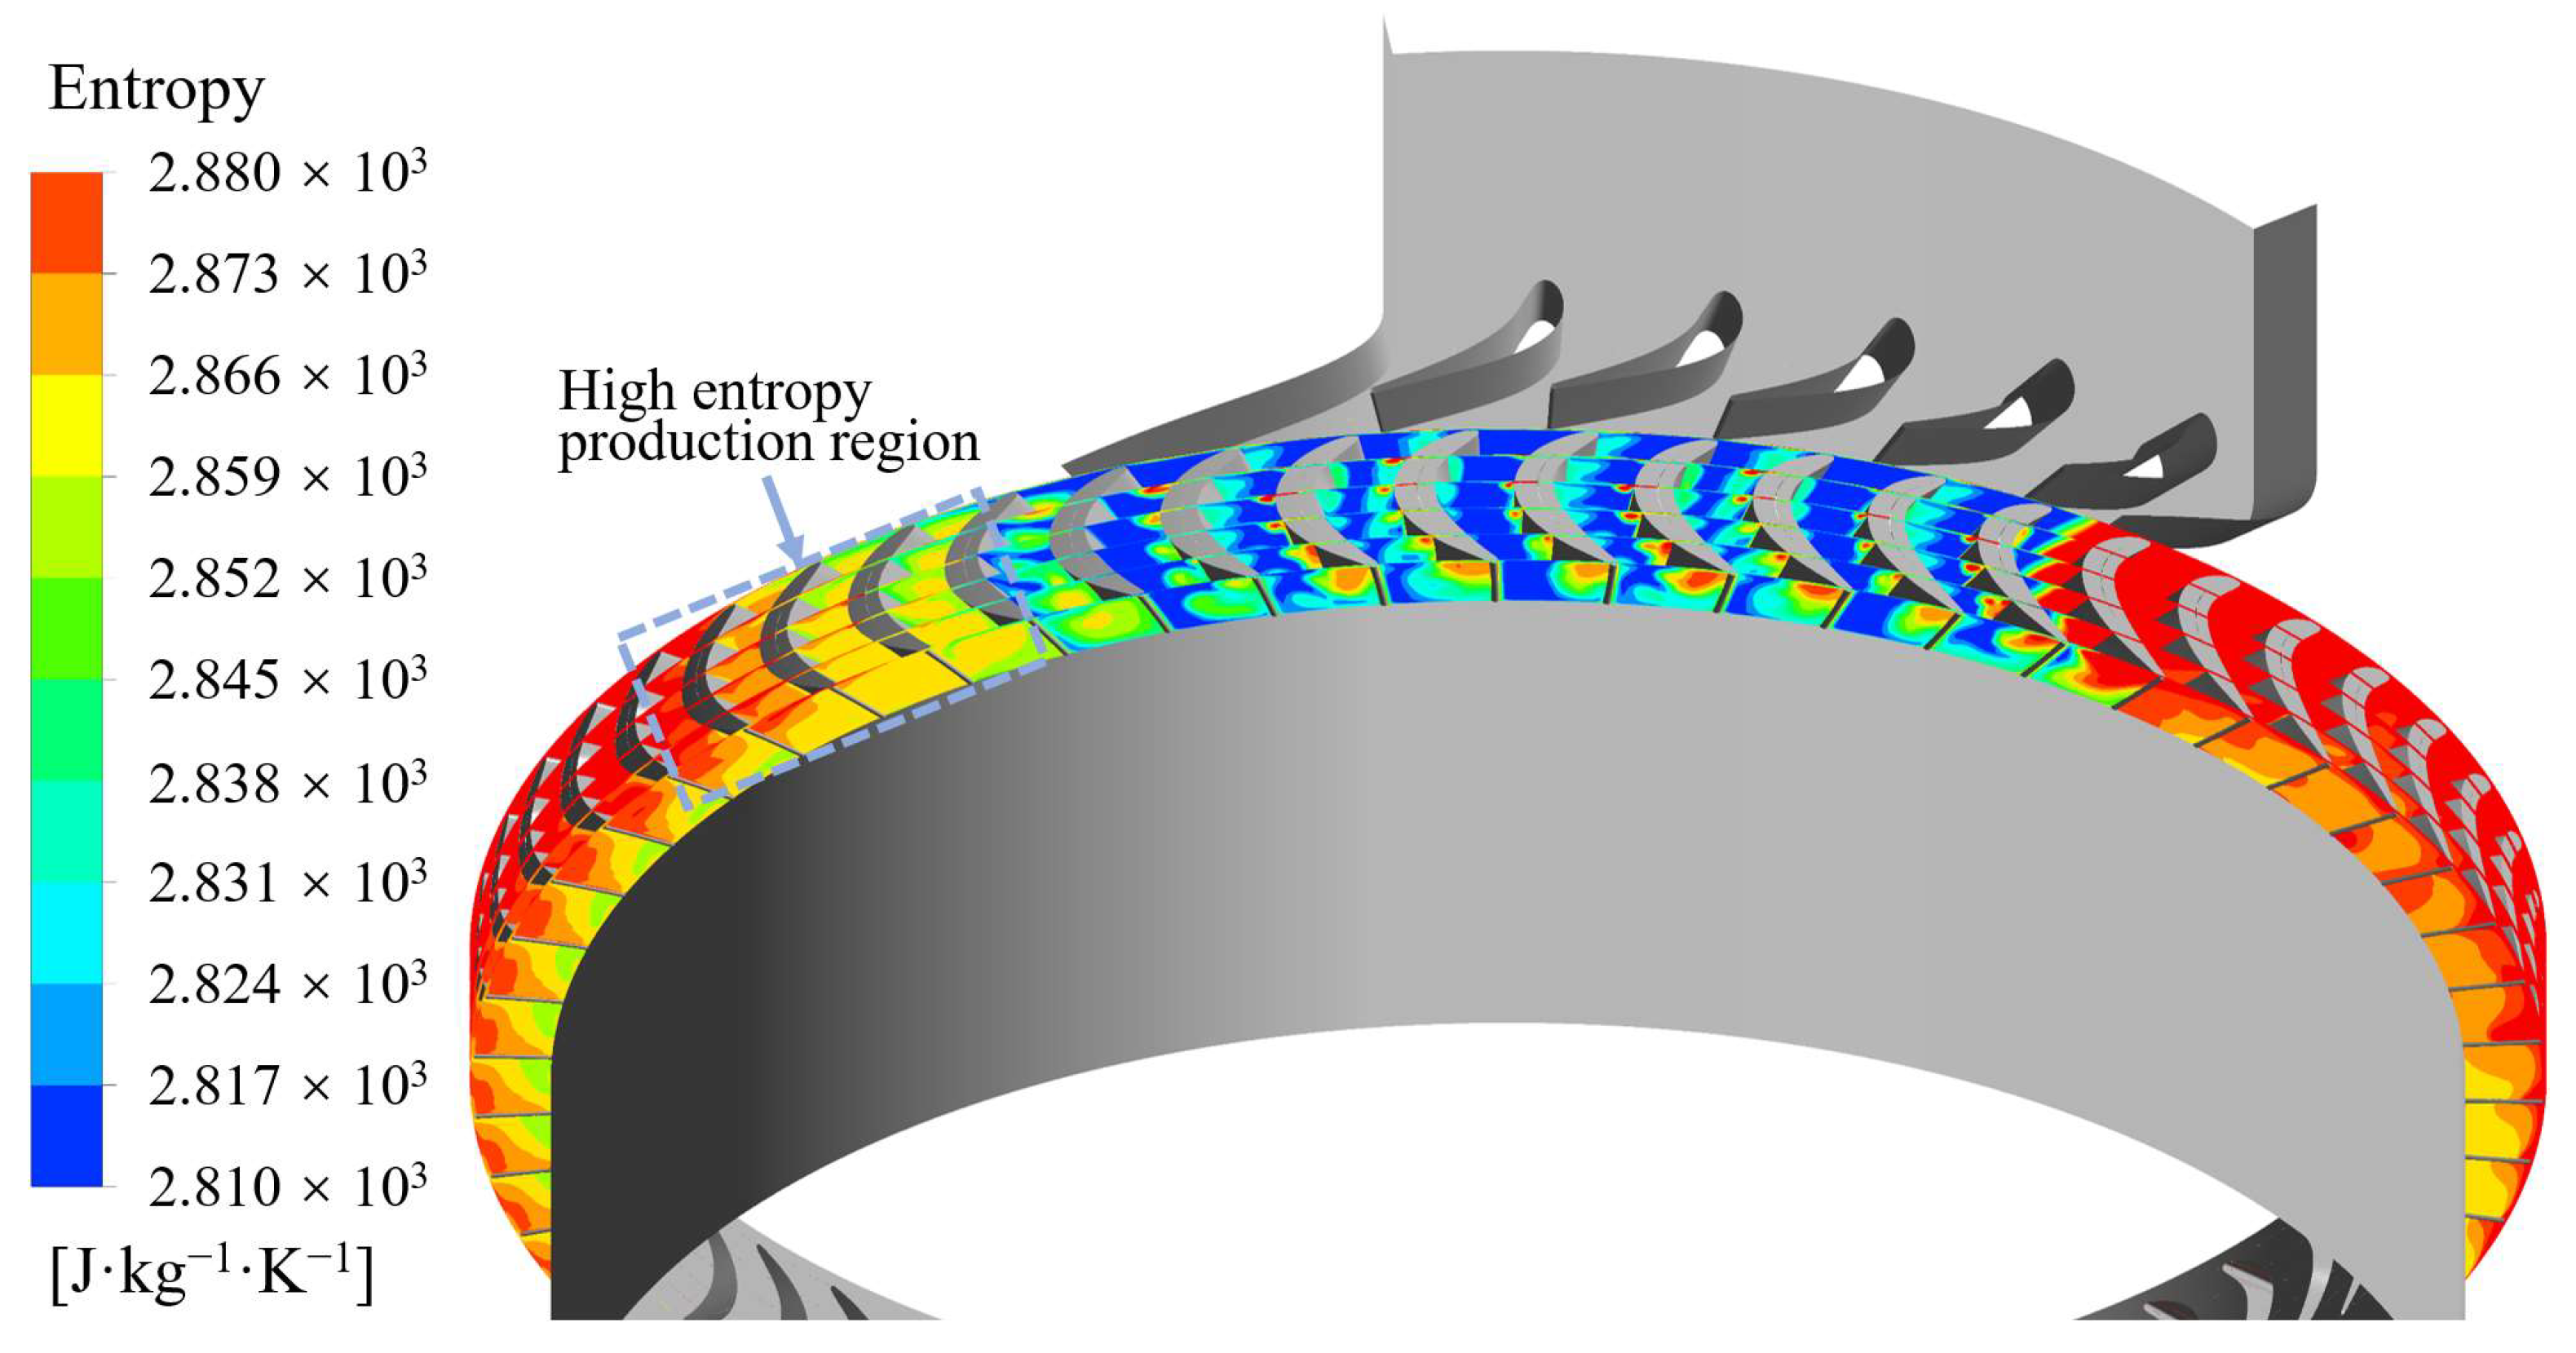
The velocity vector distribution at 50% blade height is shown in Figure 9, using a partial admission ratio of 0.172 as an example. It can be observed that the flow condition in the middle of the active sector is favorable. When the blade passage enters the admission arc, the stagnation fluid is pushed by the high-momentum fluid, forming a vortex structure in the middle of the passage. As the blade passage nears the exit of the admission arc, the flow rate within the passage begins to decrease. The fluid fills the entire passage in the first half of the passage along the flow direction, after which the flow starts to shift towards the pressure surface of the next blade in the rotational direction, causing flow separation on the suction surface. Figure 10 shows the entropy distribution at different axial positions. In the admission arc, regions of higher entropy indicate the location of vortex. The tip passage vortex and tip leakage vortex can be observed at the upper part of the passage, while the hub passage vortex can be seen at the lower part. As the blade passage nears the exit of the admission arc, a large high-entropy region is observed throughout the passage, suggesting the presence of large-scale vortex. In several blade passages leaving the admission arc, significant entropy production is observed, indicating that substantial flow losses occur in this region.

3.3. Effect of Vortex Flow on Turbine Performance

An analysis of the vortex structure within the rotor blade passage is performed. The Q-Criterion, which represents the second invariant of the velocity gradient, is a method for identifying the vortex [47]. The expression for the Q-Criterion is shown in Equation (5):
  Q   =   1 2 Ω 2 S 2
where S and Ω represent the symmetric and antisymmetric parts of the velocity gradient tensor, respectively. Since this study focuses on axial turbines, the vortex rotating around the turbine axis are primarily observed. The turbine axis coincides with the Z-axis. The definition of Qz is shown in Equation (6):
  Q z = k · ω ω × Q + Q 2
where k is the unit vector in the Z-direction, and ω represents the angular velocity. Qz can characterize the direction of vortex rotation.

3.3.1. Vortex Flow Characteristics at High Partial Admission Ratio

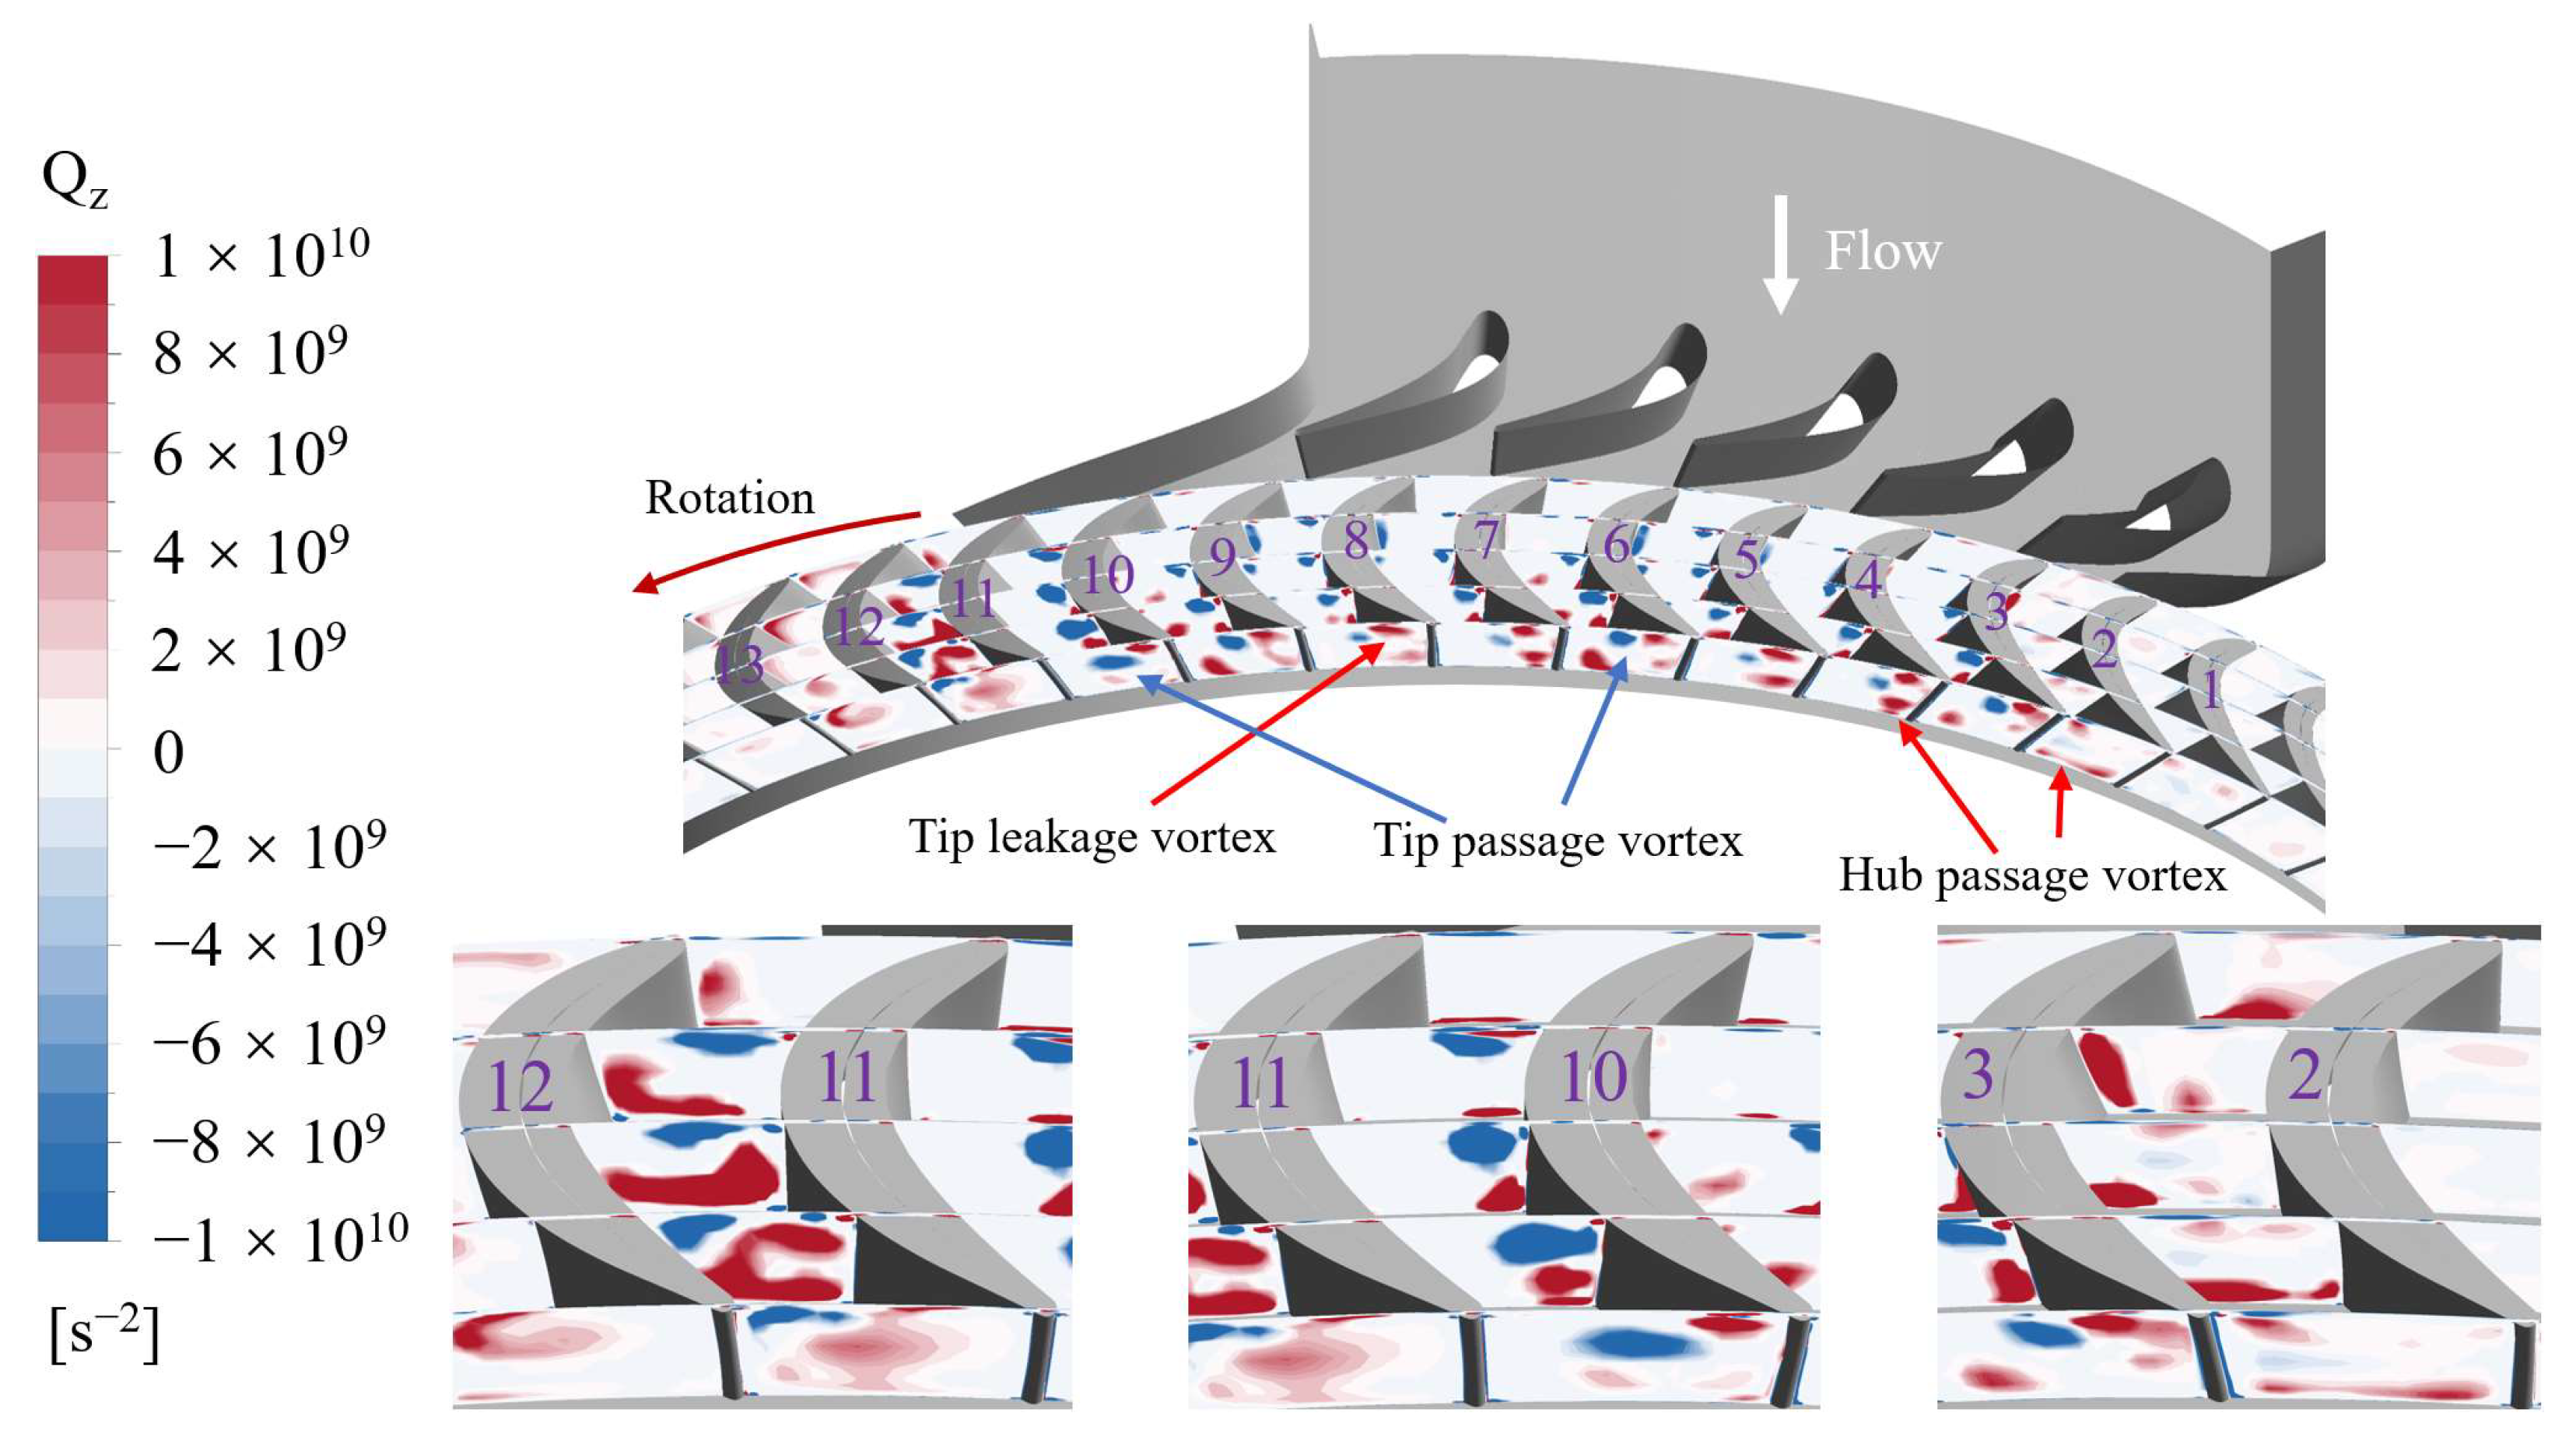
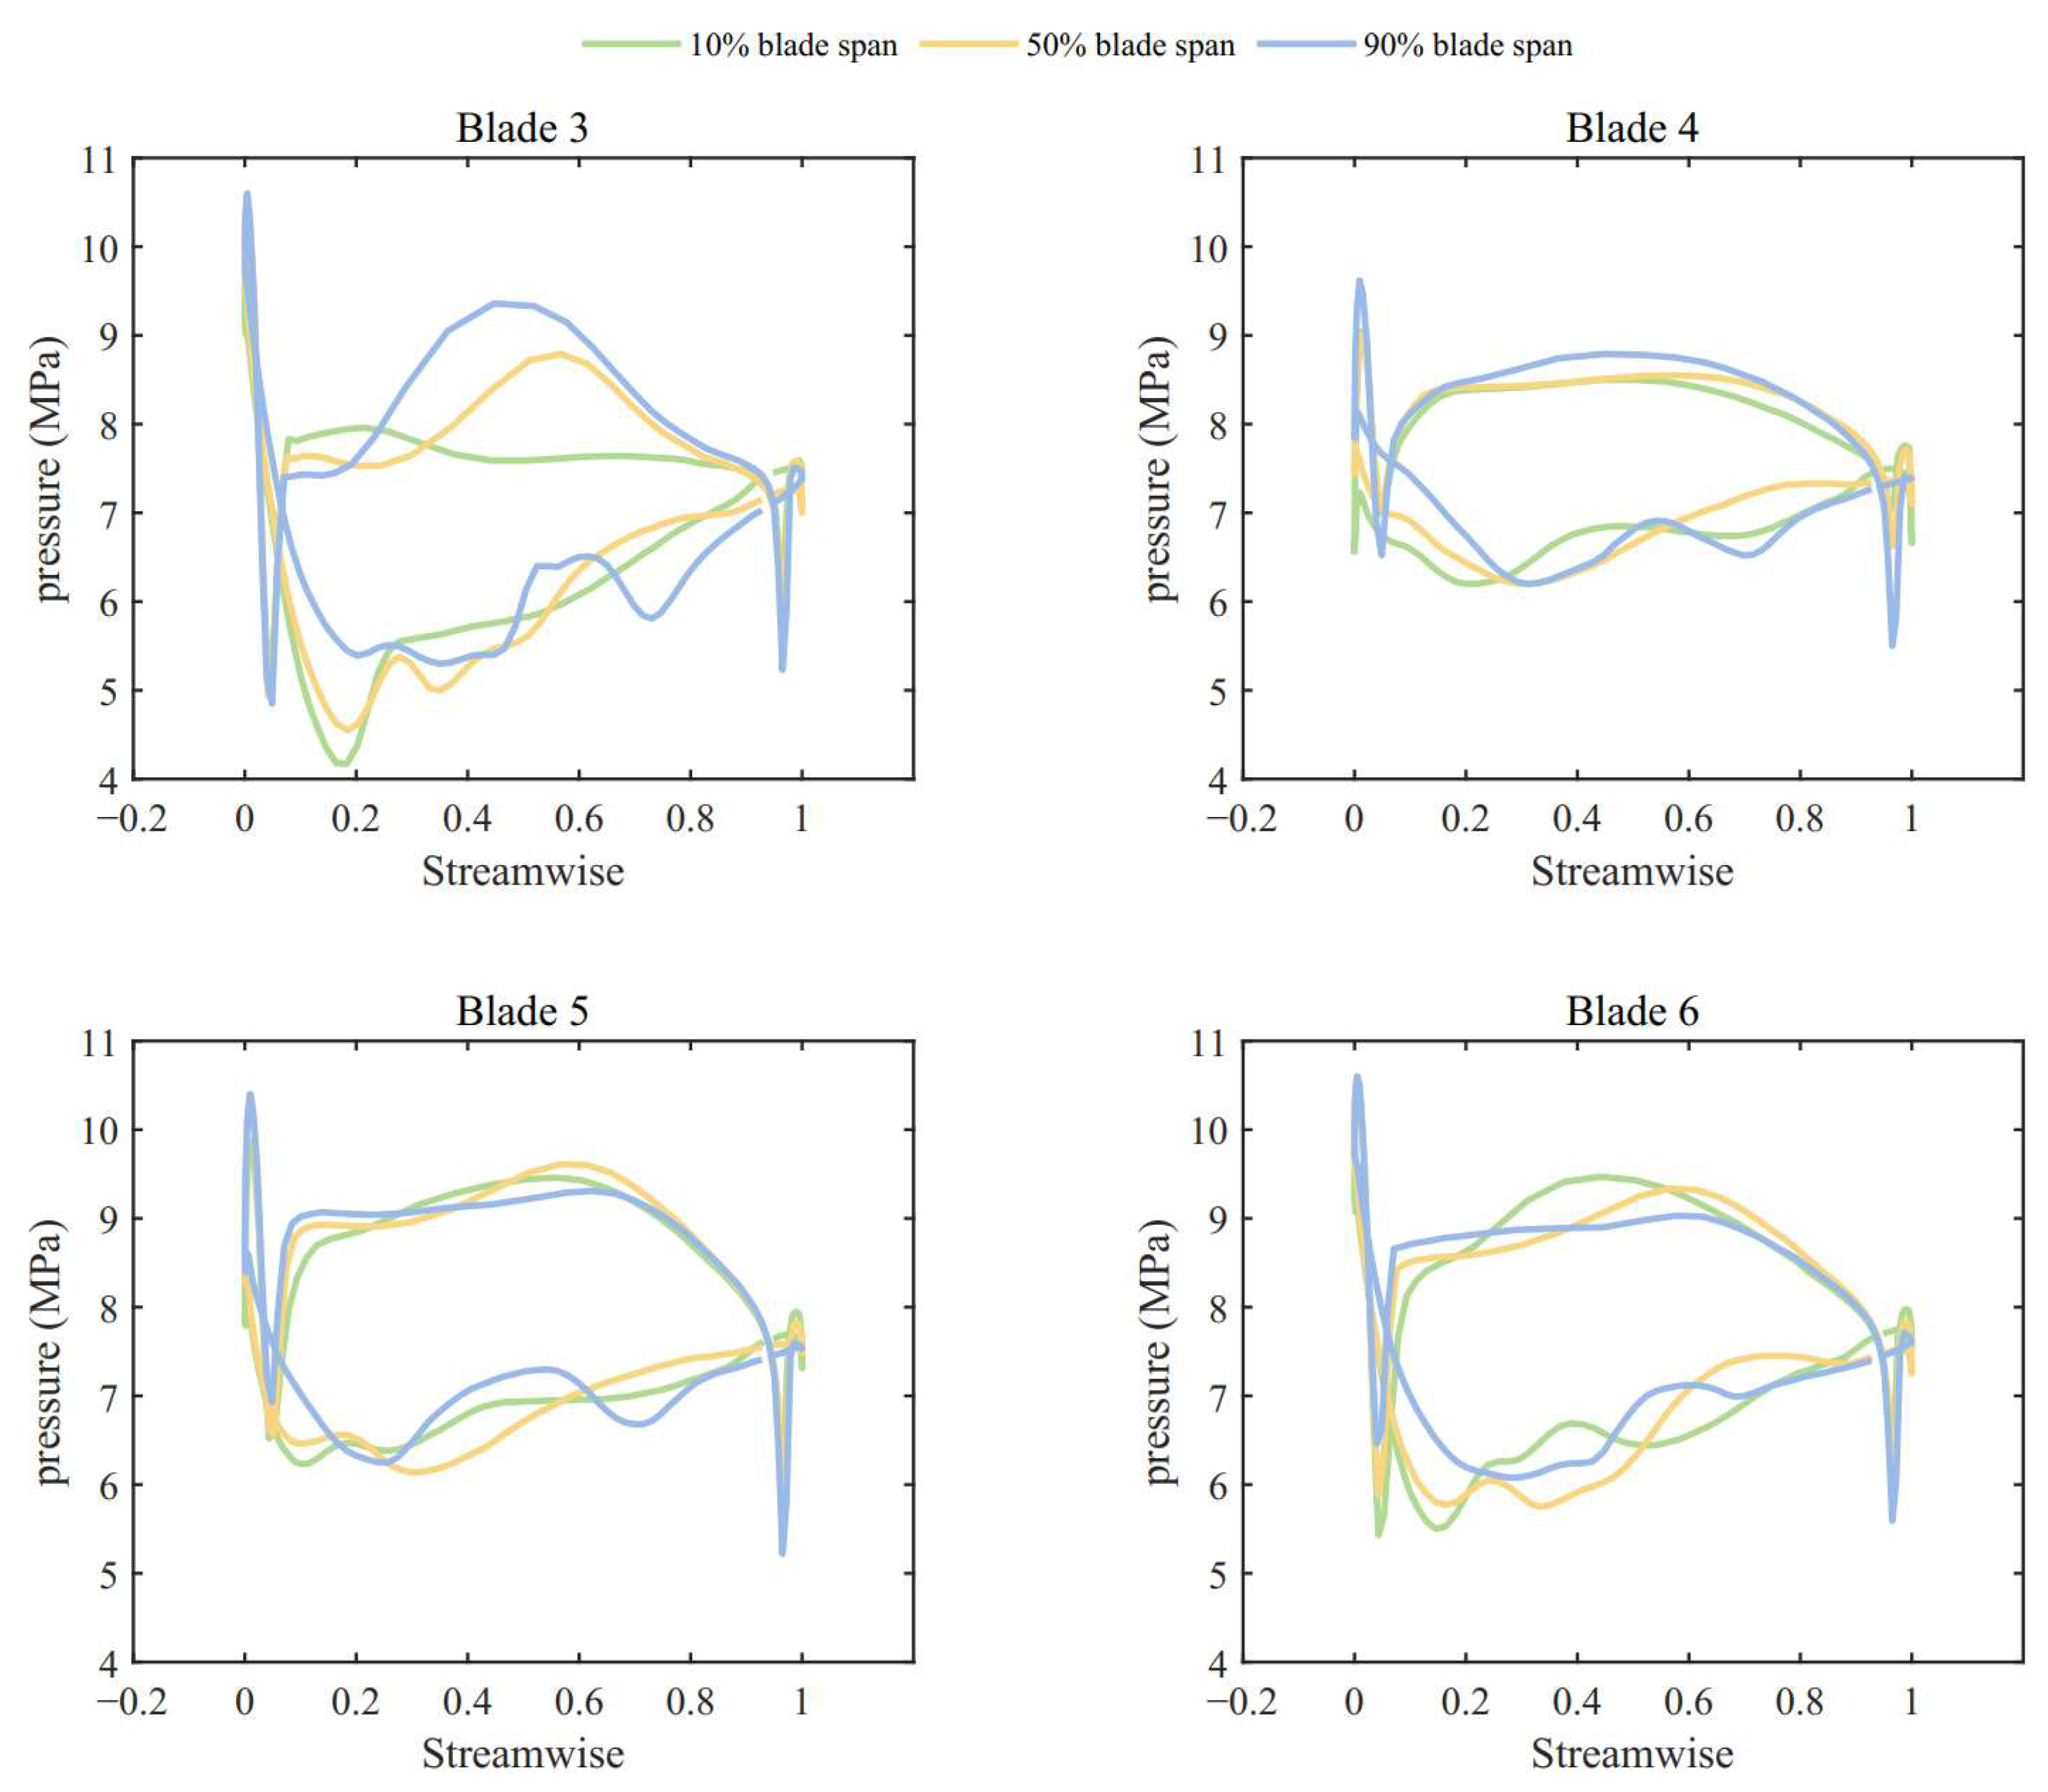
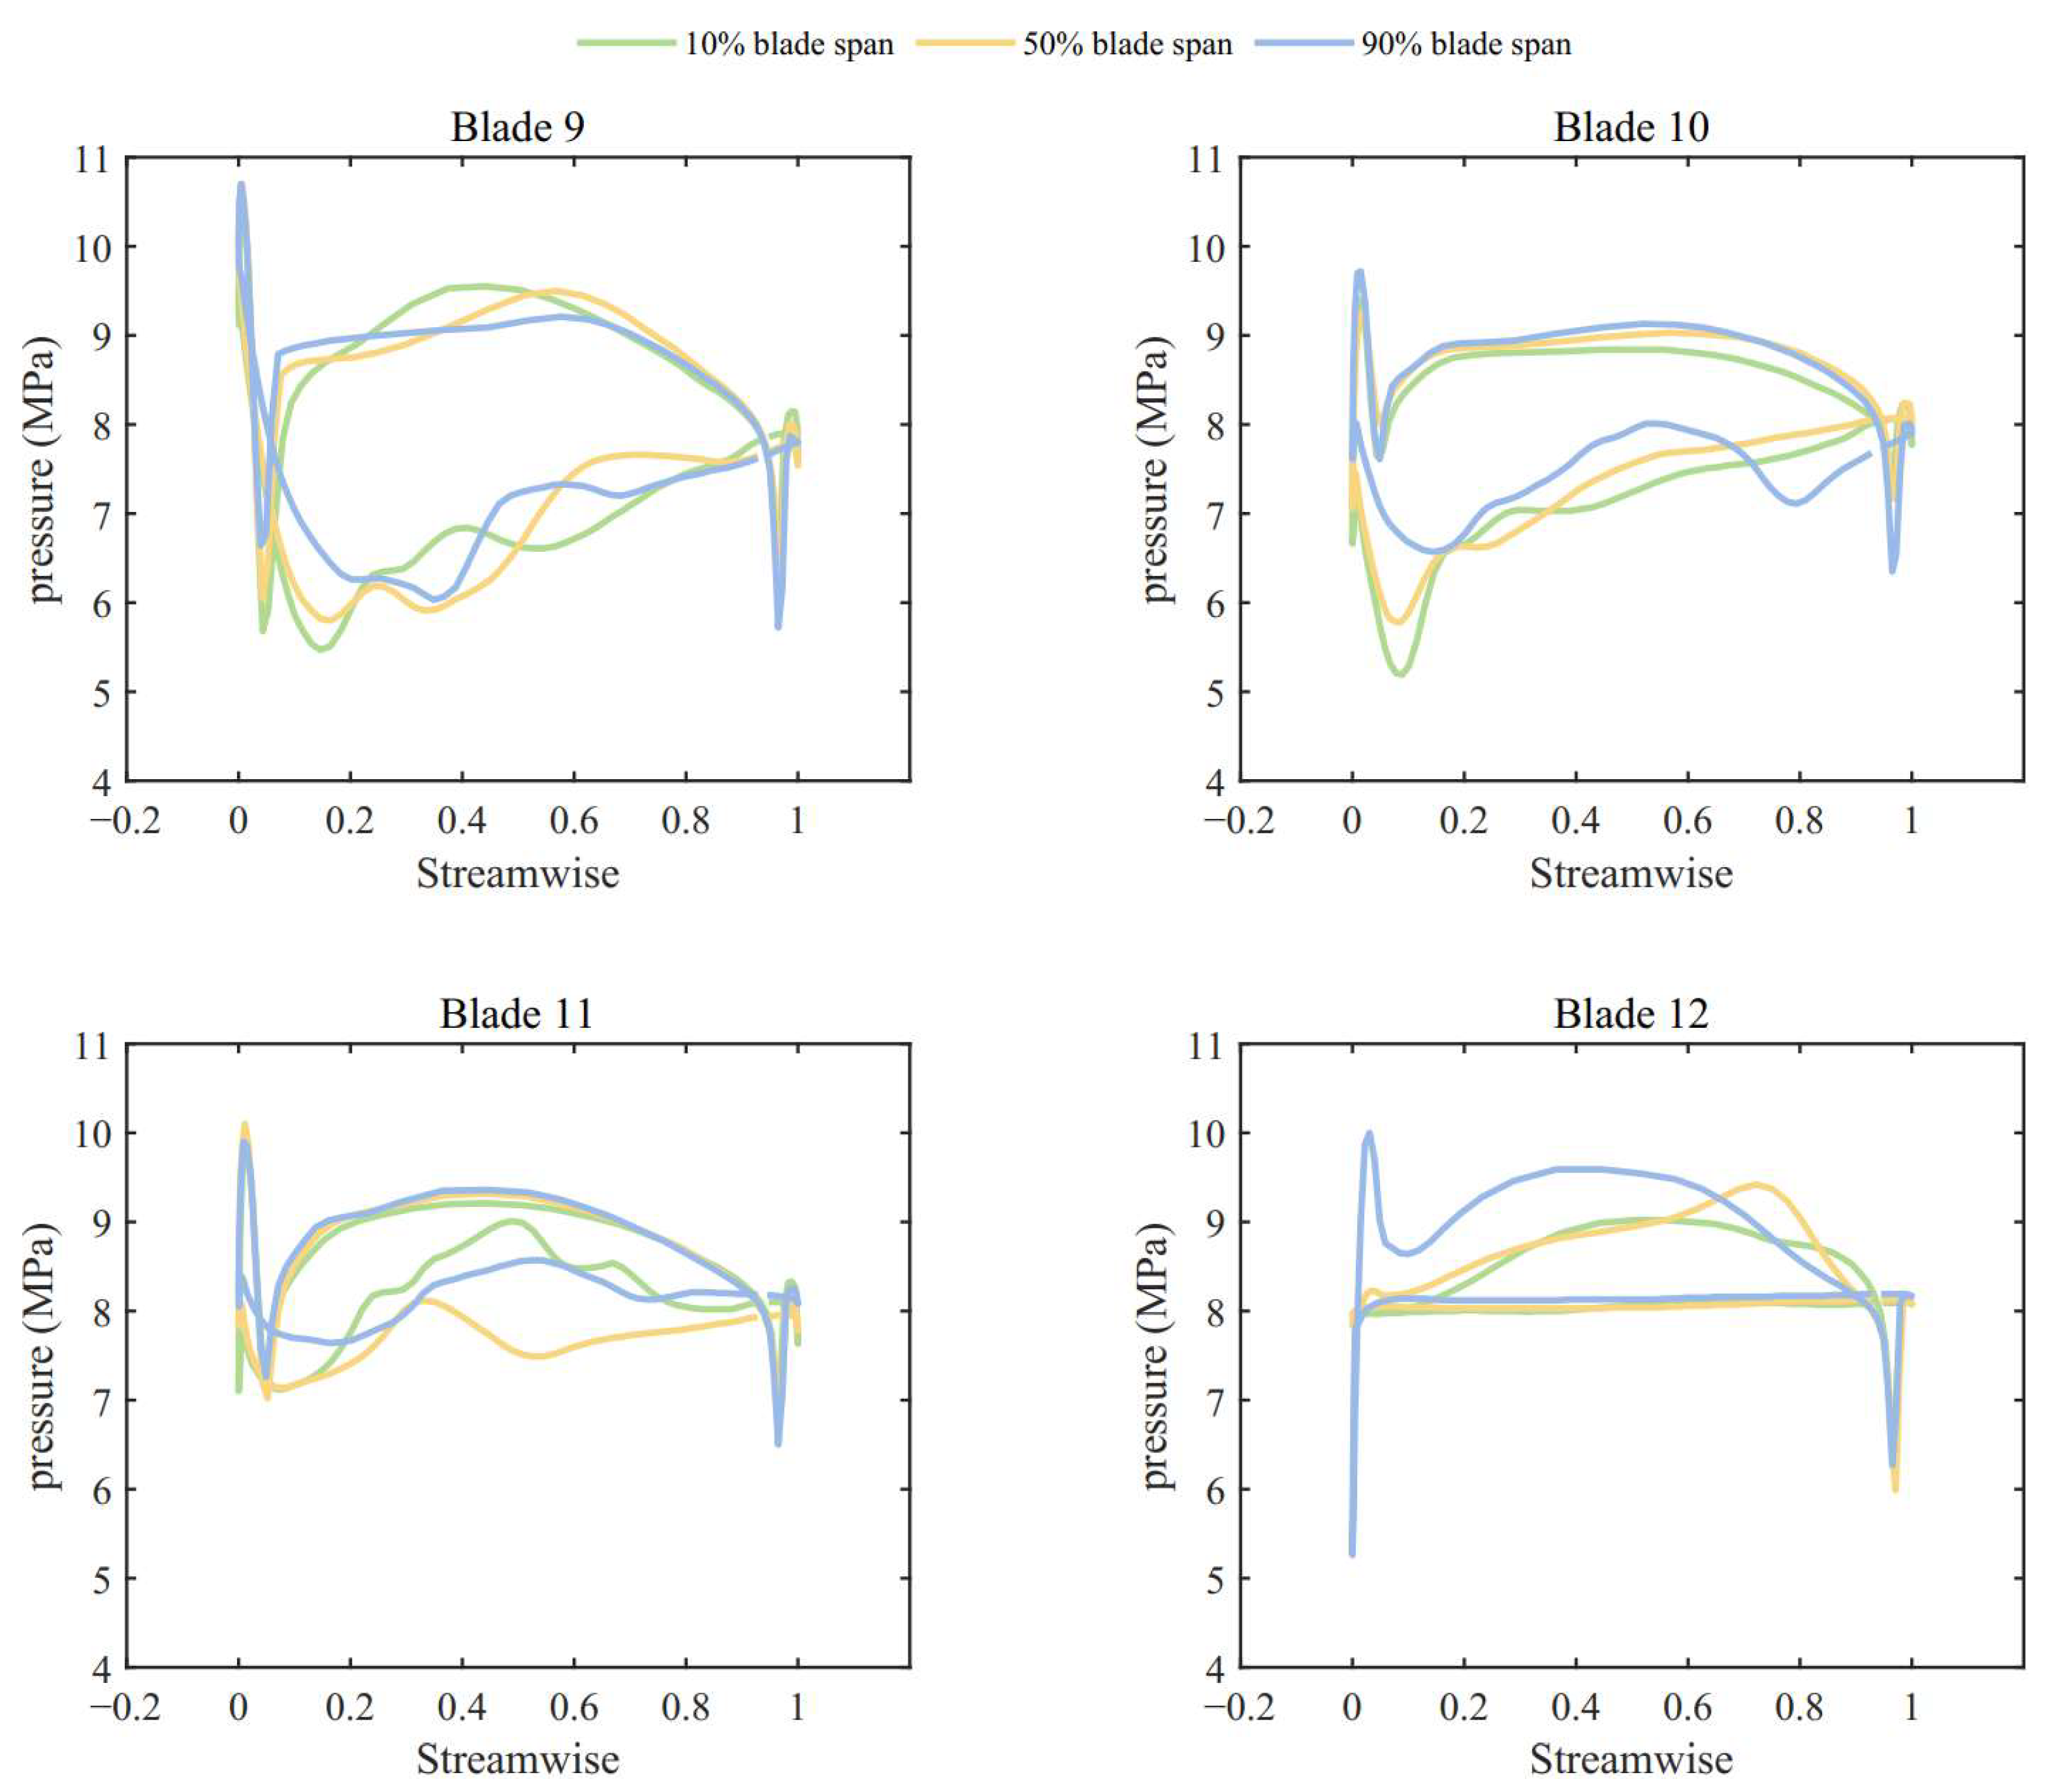
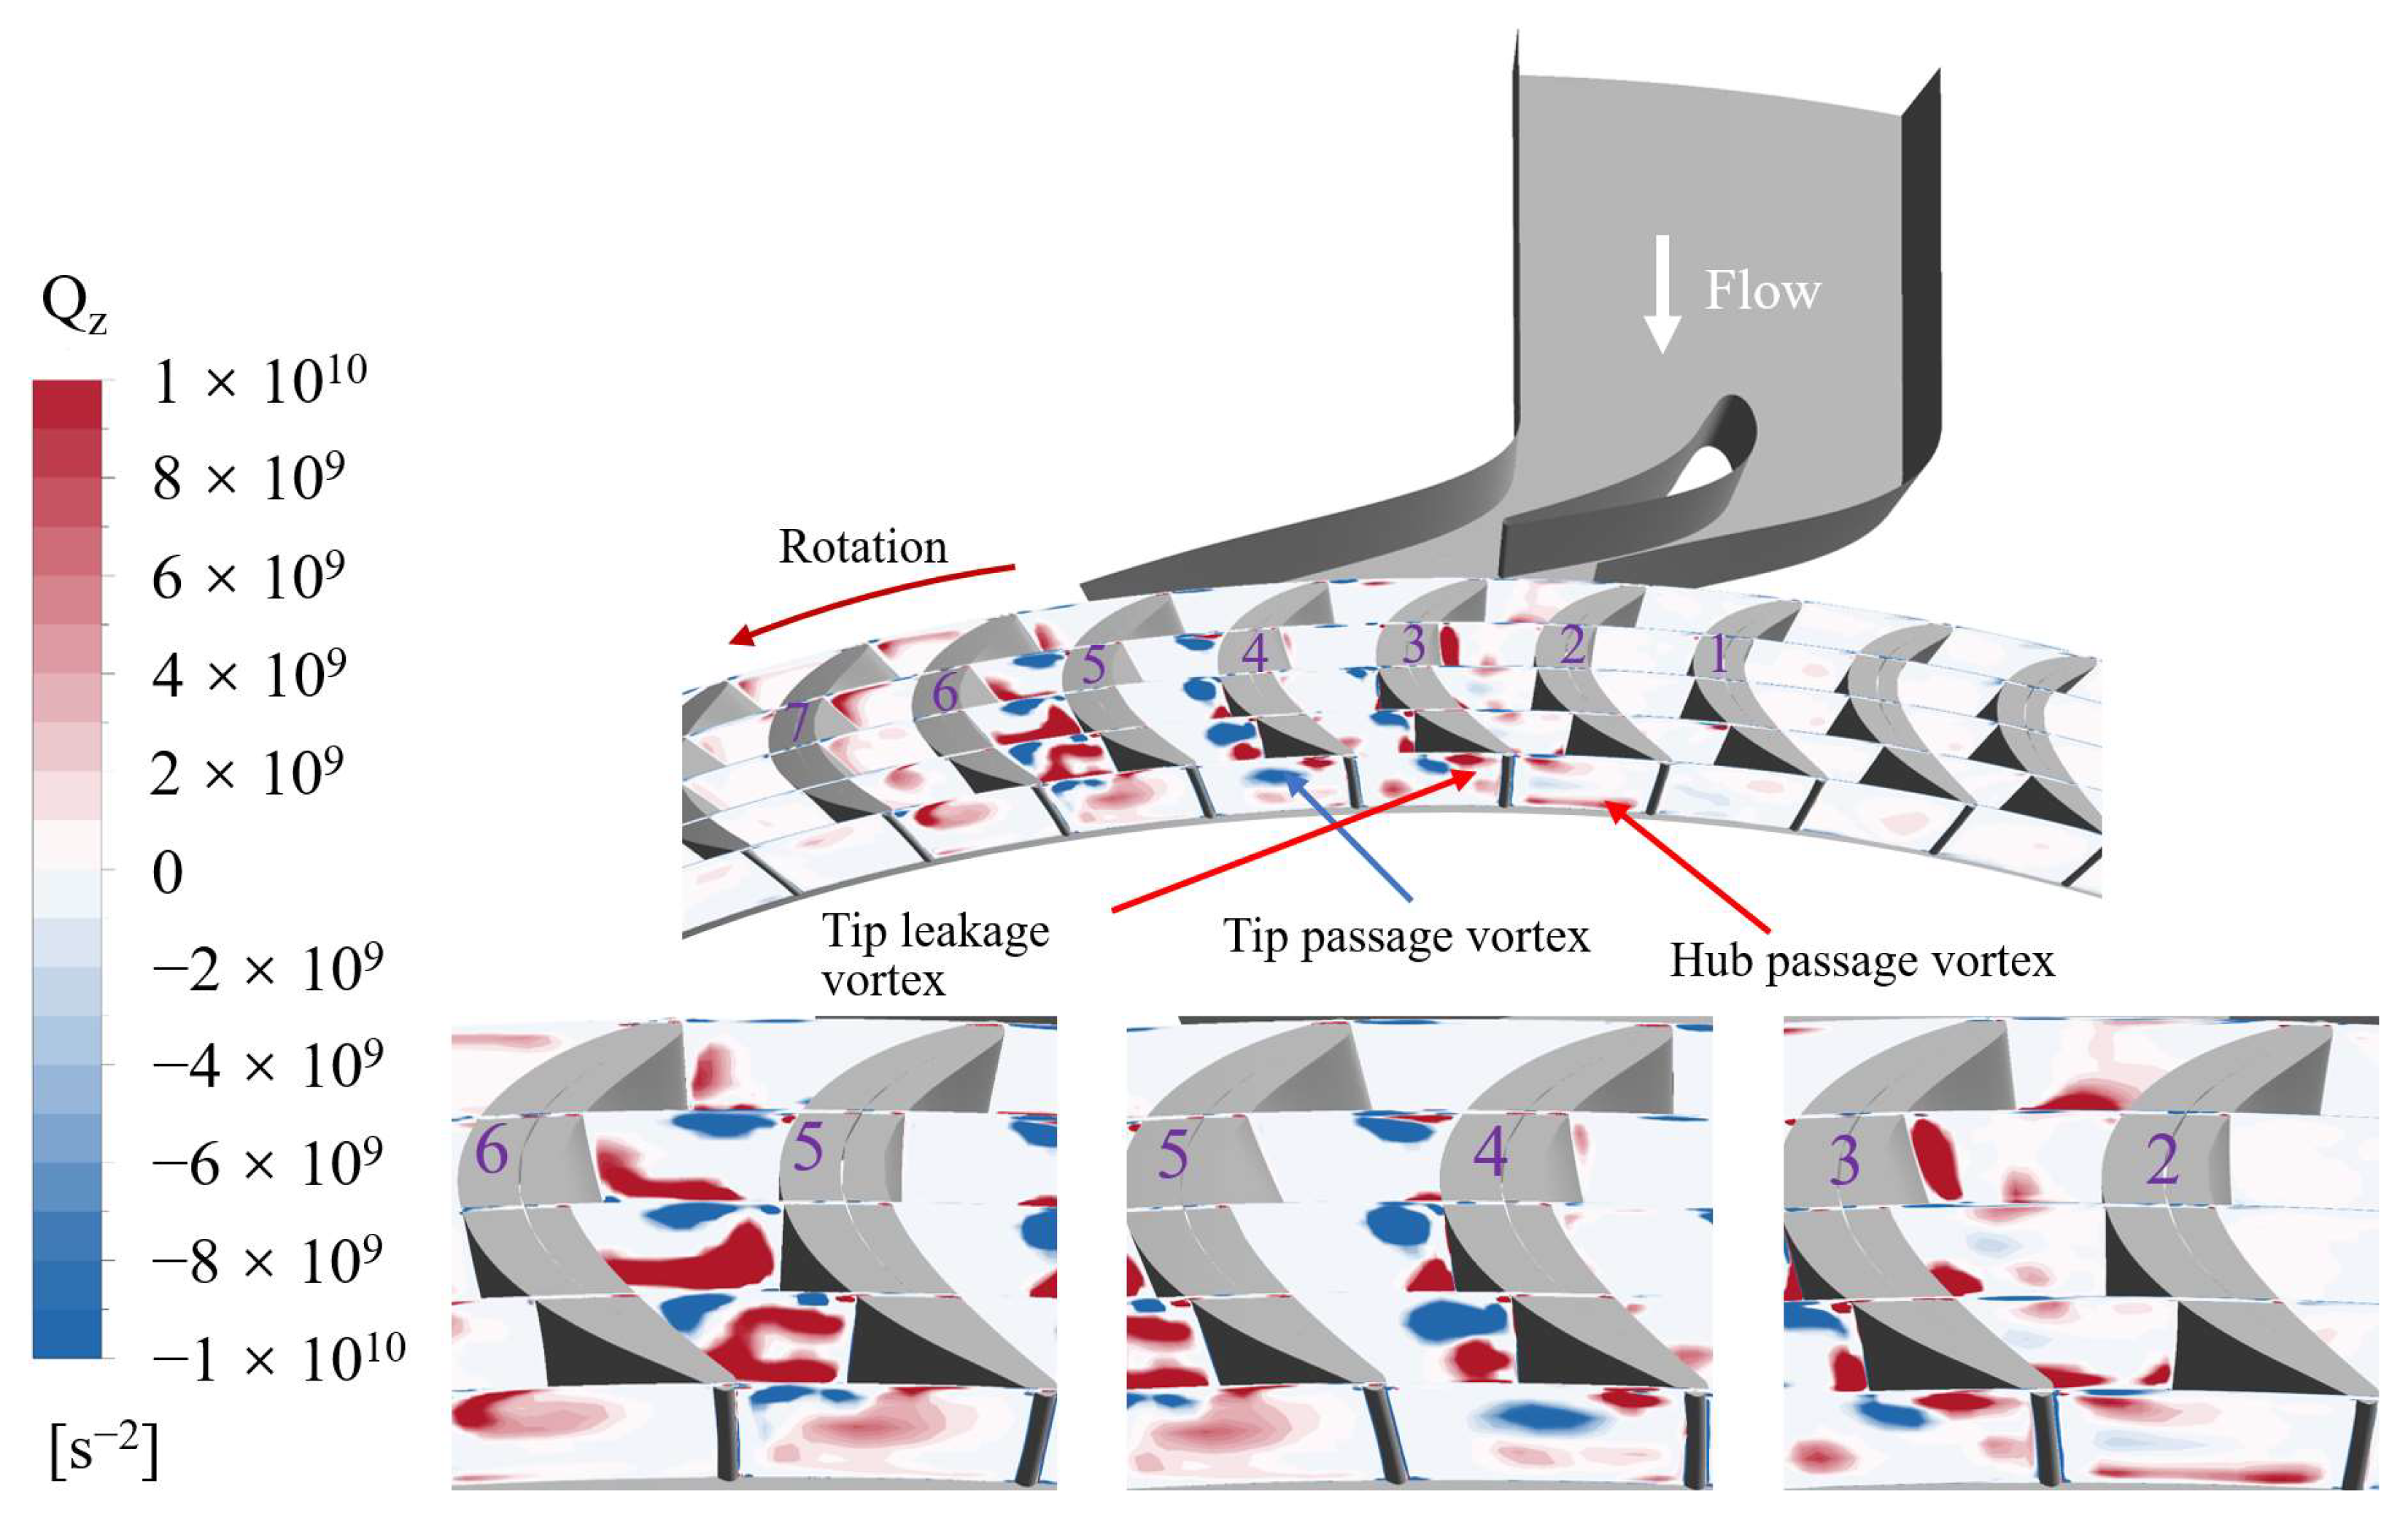
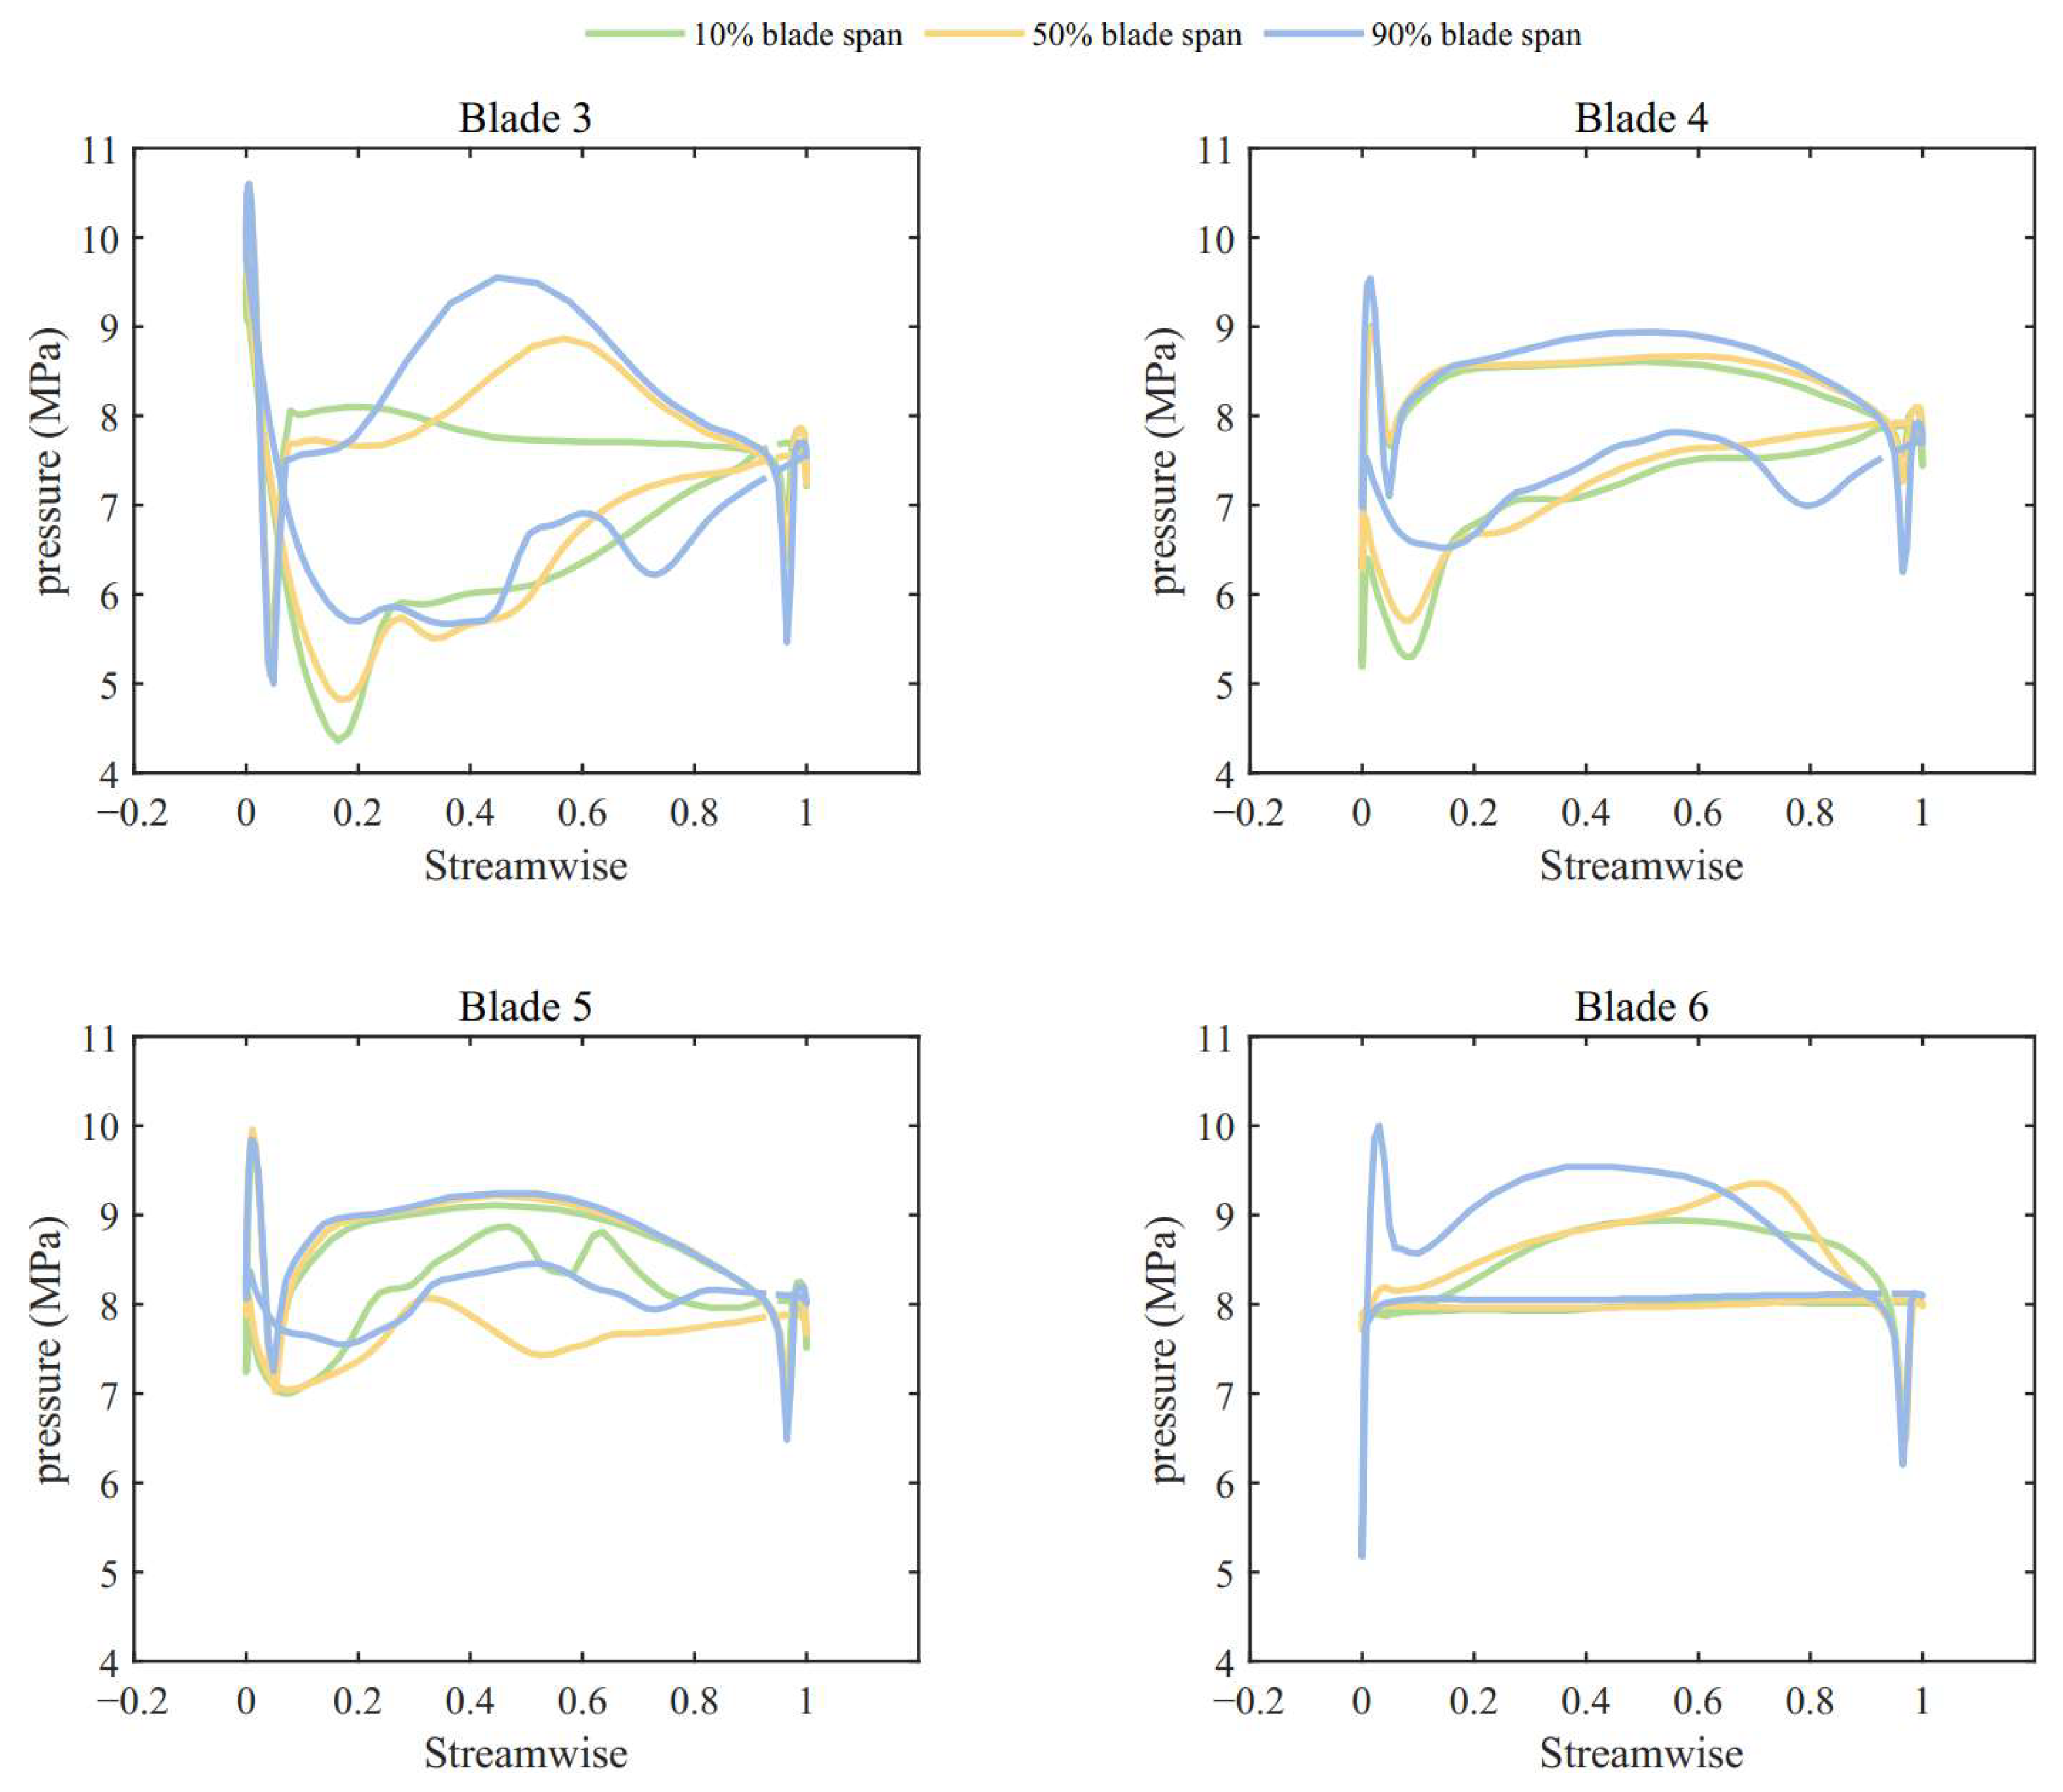
Based on the analysis in the previous subsection, for a partial admission ratio of 0.172, the interaction between the flow within blade passages near the entrance of the active sector and the flow within passages near the exit of the active sector can be largely neglected. Figure 11 presents a schematic of vortex structures for the case with a partial admission ratio of 0.172, viewed from the rotor outlet. The rotor blades are numbered in the figure for reference in the following discussion. According to the definition of Qz introduced earlier, red regions indicate counterclockwise vortices, while blue regions represent clockwise vortices. In the central part of the active sector (between blades 3 and 10), a counterclockwise tip leakage vortex can be observed in the upper part of the rotor passage, along with a clockwise tip passage vortex. In the lower part of these passages, a counterclockwise hub passage vortex is present. The passages at the boundary between the active and inactive sectors are magnified for detailed analysis. Figure 12 and Figure 13 show the blade loading distributions at various spanwise positions for rotor blades entering and exiting the admission sector.
For the rotor blade passage approaching the entrance to the admission sector, the vortex characteristics are shown in the magnified views of blades 2 and 3. A relatively distinct hub passage vortex forms at the passage inlet, while the intensity of the tip passage vortex is lower. Since there is no high-momentum fluid injection from the nozzle on the side near blade 2, no tip leakage vortex is formed. The high-intensity hub passage vortex primarily affects the lower spanwise positions of blade 3 during its development, leading to a significant reduction in pressure compared to the middle and upper spanwise positions. As a result, the torque provided by blade 3, as shown in Figure 6, is slightly lower than that of full admission blades. After entering the active sector, as observed with blades 4, 5, and 6, the torque provided by the blades increases to a higher level.
For the rotor blade passages about to exit the active sector, the vortex characteristics are shown in the magnified views of blade 10 to 12. Between blades 10 and 11, the tip passage vortex is significantly larger than in other blade passages, and its position remains close to the suction surface of blade 10. Between blades 11 and 12, a large counterclockwise vortex is observed at approximately 25% of the axial chord length near the blade root, extending towards the pressure side of blade 11. This vortex occupies almost the entire blade passage during its development. Simultaneously, a clockwise vortex is present at the upper part of the passage, which gradually moves towards the pressure side of blade 12 due to the compression from the large counterclockwise vortex. Between blades 12 and 13, there is no high-momentum fluid input, and the flow within the passage is essentially stagnant. A weaker counterclockwise vortex is observed in this passage. The large-scale counterclockwise vortices in these two passages are caused by the leakage flow in the circumferential direction, which forms when high-momentum fluid from the stator domain enters the rotor domain. Overall, from blade 9 to blade 12, the average pressure difference between the pressure surface and suction surface gradually decreases, which is consistent with the torque pattern. The suction side pressure of blade 10 is significantly higher than that of blade 9, which can be attributed to two factors. On one hand, the passage between blades 10 and 11 is close to the inactive region, where part of the fluid from the nozzle forms circumferential leakage flow due to inertia, reducing the flow rate and velocity within the passage. On the other hand, a large-scale tip passage vortex forms within the passage close to the suction side, affecting the pressure distribution. The pressure on the suction surface of blade 11 increases further, especially at the root location at 50% axial chord length, where the pressure exceeds 8 MPa, while the pressure at the mean radius location at 50% axial chord length is lower. This is caused by the large-scale counterclockwise vortex in the passage between blades 11 and 12. At the 50% axial chord length location, the vortex is mainly located in the lower half of the passage. Due to its counterclockwise direction, there is a velocity component directed towards the suction surface at the blade root location, causing the flow at the blade root to approach a stagnation state, resulting in higher static pressure. Meanwhile, at the average radius location, the velocity component is directed away from the suction surface, leading to lower static pressure. The suction side pressure of blade 12 is approximately equal to the rotor exit pressure, and the flow on this side is essentially stagnant. The pressure on the pressure side is also noticeably lower compared to the previous blades. Comparing different positions along the blade height, the pressure at the blade tip remains relatively high, indicating that the high-momentum fluid leaving the nozzle primarily causes the circumferential leakage flow to be distributed in the upper part of the passage. This portion of the leakage flow allows blade 12 to provide a small amount of torque.

3.3.2. Vortex Flow Characteristics at Low Partial Admission Ratio

Figure 14 shows a schematic of the rotor blade passage vortices at a partial admission ratio of 0.0606. The rotor blades are numbered according to the same convention as before. Figure 15 presents the blade loading distributions at different spanwise positions for the rotor blades within the active sector. The vortex characteristics exhibited by the blade passages when entering and exiting the active sector are similar to the patterns discussed in the previous subsection. In the passage between blades 2 and 3 of Figure 14, high-momentum fluid from the nozzle mixes with the stagnant fluid from the inactive sector. In this passage, the hub passage vortex exhibits relatively high intensity, while the tip passage vortex is weaker. As a result, the pressure near the hub on the pressure side of blade 3 is lower. In the passage between blades 4 and 5, the tip passage vortex exhibits high intensity and influences the pressure distribution on the suction side of blade 4. A large-scale counterclockwise vortex is also observed in the passage between blades 5 and 6, caused by circumferential leakage. This large vortex leads to a higher average pressure on the suction side of blade 5 compared to the others, resulting in reduced torque output from blade 5. The pressure on the suction side of blade 6 is approximately equal to the turbine exit pressure, indicating that the flow downstream of blade 6 essentially co-rotates with the rotor, maintaining a state of near stagnation relative to the rotor blades.
By comparing the vortex flow characteristics in the rotor passages of the two aforementioned cases, it can be observed that, in the first case, the vortex structures in the blade passages between blades 3 and 10 are relatively uniform, which is consistent with the behavior of a full admission turbine. In contrast, in the second case, only the vortex structure between blades 3 and 4 resembles that of a full admission turbine. Moreover, for different partial admission ratios, the torque generated by the blade located at the position of blade 4 in Figure 11 and Figure 14 does not reach the level observed in the full admission turbine. According to the previous analysis, the following pattern emerges: two blades near the entrance of the active sector produce lower torque than in the full admission case, while three blades closer to the exit exhibit a more pronounced reduction in torque. The remaining blades generate torque that is either approximately equal to or slightly less than that of the full admission turbine. When the circumferential extent of the active sector is narrow, even the blades near the center of the active sector can be affected to some extent. This trend is consistent with the torque distribution observed in Figure 6. The analysis of vortex flow behavior in this subsection also helps explain the variation in turbine efficiency with different partial admission conditions, as shown in Figure 5.

4. Conclusions

Partial admission S-CO2 turbines demonstrate significant practical engineering value for compact modular applications such as distributed energy systems. In S-CO2 turbines of small mass flow rates, full admission designs may result in excessively short blade heights due to the working fluid’s high density. Properly designed partial admission configurations can effectively mitigate the dramatic increase in secondary flow losses caused by insufficient blade height, thereby enhancing the efficiency of both the turbine and the overall cycle. Building on this significance, this paper presents a numerical simulation of partial admission S-CO2 turbines, analyzing the effects of partial admission ratio on turbine efficiency and blade torque. The rotor flow characteristics were investigated, with a focus on vortex structures within blade passages near the boundary between active and inactive sectors. The main conclusions are as follows:
  • The turbine efficiency decreases as the partial admission ratio decreases, especially when the partial admission ratio is below 0.3, where the efficiency rapidly drops. For the turbine simulated in this study, a partial admission ratio of 0.338 leads to a 2.71 percentage point reduction in efficiency, and a partial admission ratio of 0.172 results in a 6.07 percentage point efficiency drop.
  • The torque on the rotor blades suddenly increases to a relatively high level upon entering the active sector. As the blades move from the active sector to the inactive sector, the torque gradually decreases, with about three blade passages showing significantly lower torque compared to full admission conditions. When the partial admission ratio is less than 0.1, the maximum blade torque begins to decrease as the partial admission ratio decreases.
  • Vortex structures, including the tip leakage vortex, tip passage vortex, and hub passage vortex, were observed within the rotor passages. As a passage enters the active sector, high-momentum fluid from the nozzle mixes with stagnating fluid. A prominent hub passage vortex develops within the passage. Just before a passage exits the active sector, a tip passage vortex of greater intensity compared to full admission passages is observed, followed by the formation of a large-scale counterclockwise vortex.
  • These vortex patterns significantly influence the blade loading distribution. Compared to full admission conditions, the pressure near the blade root on the pressure side is lower as the blade enters the active sector. Conversely, pressure on the suction side continuously increases as the blade exits the active sector, particularly near the blade root at the 50% axial chord position. These changes in loading contribute to a reduction in the torque generated by the blades. As the partial admission ratio decreases, the flow within blade passages located in the middle of the active sector experiences increased disruption. This effect ultimately leads to a decrease in the maximum blade torque once the partial admission ratio becomes sufficiently small.

Author Contributions

Conceptualization, Z.H. and W.Z.; methodology, Z.H. and W.Z.; software, Z.H.; validation, H.J. and W.Z.; formal analysis, Z.H. and W.Z.; investigation, H.J. and W.Z.; resources, W.Z., Y.Q., and Y.Z.; data curation, Z.H. and W.Z.; writing—original draft preparation, Z.H.; writing—review and editing, W.Z., Y.Q., and Y.Z.; visualization, Z.H.; supervision, W.Z. and Y.Z.; project administration, W.Z. and Y.Z.; funding acquisition, W.Z. and Y.Z. All authors have read and agreed to the published version of the manuscript.

Funding

The authors gratefully acknowledge the support from the Nuclear Technology Research and Development Program of China Atomic Energy Authority (CAEA) [HNKF202301(36)].

Data Availability Statement

The original contributions presented in the study are included in the article, further inquiries can be directed to the corresponding author.

Conflicts of Interest

The authors declare no conflicts of interest. The funders had no role in the design of the study; in the collection, analyses, or interpretation of data; in the writing of the manuscript; or in the decision to publish the results.

Abbreviations

The following abbreviations are used in this manuscript:
CFDComputational fluid dynamics
LELeading edge
PARPartial admission ratio
S-CO2Supercritical carbon dioxide
TETrailing edge

References

  1. Ahn, Y.; Bae, S.J.; Kim, M.; Cho, S.K.; Baik, S.; Lee, J.I.; Cha, J.E. Review of supercritical CO2 power cycle technology and current status of research and development. Nucl. Eng. Technol. 2015, 47, 647–661. [Google Scholar] [CrossRef]
  2. Liu, Y.P.; Wang, Y.; Huang, D.G. Supercritical CO2 Brayton cycle: A state-of-the-art review. Energy 2019, 189, 115900. [Google Scholar] [CrossRef]
  3. Stepanek, J.; Syblik, J.; Entler, S. Axial sCO2 high-performance turbines parametric design. Energy Convers. Manag. 2022, 274, 116418. [Google Scholar] [CrossRef]
  4. Wang, D.; Zhang, Y.X.; Sun, L.F.; Han, X.R.; Zhou, Y.L.; Wang, Y.H.; Sun, L. Multi-objective optimization and dynamic characteristic analysis of solid oxide fuel cell—Supercritical carbon dioxide brayton cycle hybrid system. Energy 2024, 313, 133915. [Google Scholar] [CrossRef]
  5. Zhou, Y.J.; Zhang, Y.F.; Li, H.Z.; Li, K.L.; Yang, Y.; Sun, S.; Wu, S.S. Off-design operation of supercritical CO2 Brayton cycle arranged with single and multiple turbomachinery shafts for lead-cooled fast reactor. Energy 2024, 299, 131384. [Google Scholar] [CrossRef]
  6. Roy, D.; Samanta, S.; Ghosh, S. Performance assessment of a biomass-fuelled distributed hybrid energy system integrating molten carbonate fuel cell, externally fired gas turbine and supercritical carbon dioxide cycle. Energy Convers. Manag. 2020, 211, 112740. [Google Scholar] [CrossRef]
  7. Brun, K.; Friedman, P.; Dennis, R. (Eds.) Fundamentals and Applications of Supercritical Carbon Dioxide; Woodhead Publishing Series in Energy; Woodhead Publ. Ltd.: Cambridge, UK, 2017; pp. 1–433. [Google Scholar]
  8. Qiao, J.X.; Liu, S.H.; Liu, M.Y.; Huang, Y.P.; Yuan, F.X.; Zhu, X.L.; Cui, Y.H. Conceptual design and optimization of heat rejection system for nuclear reactor coupled with supercritical carbon dioxide Brayton cycle used on Mars. Prog. Nucl. Energy 2024, 176, 105364. [Google Scholar] [CrossRef]
  9. Sun, Y.; Li, H.-W.; Wang, D.; Du, C.-H. A novel zero emission combined power and cooling system for concentrating solar power: Thermodynamic and economic assessments and optimization. Case Stud. Therm. Eng. 2024, 58, 104406. [Google Scholar] [CrossRef]
  10. Yang, D.L.; Tang, G.H.; Luo, K.H.; Fan, Y.H.; Li, X.L.; Sheng, Q. Integration and conversion of supercritical carbon dioxide coal-fired power cycle and high-efficiency energy storage cycle: Feasibility analysis based on a three-step strategy. Energy Convers. Manag. 2022, 269, 116074. [Google Scholar] [CrossRef]
  11. Crespi, F.; Gavagnin, G.; Sánchez, D.; Martínez, G.S. Supercritical carbon dioxide cycles for power generation: A review. Appl. Energy 2017, 195, 152–183. [Google Scholar] [CrossRef]
  12. White, M.T.; Bianchi, G.; Chai, L.; Tassou, S.A.; Sayma, A. Review of supercritical CO2 technologies and systems for power generation. Appl. Therm. Eng. 2021, 185, 116447. [Google Scholar] [CrossRef]
  13. Wang, J.F.; Guo, Y.M.; Zhou, K.H.; Xia, J.X.; Li, Y.; Zhao, P.; Dai, Y.P. Design and performance analysis of compressor and turbine in supercritical CO2 power cycle based on system-component coupled optimization. Energy Convers. Manag. 2020, 221, 113179. [Google Scholar] [CrossRef]
  14. Zhou, A.Z.; Song, J.; Li, X.S.; Ren, X.D.; Gu, C.W. Aerodynamic design and numerical analysis of a radial inflow turbine for the supercritical carbon dioxide Brayton cycle. Appl. Therm. Eng. 2018, 132, 245–255. [Google Scholar] [CrossRef]
  15. Xia, L.; Li, X.S.; Song, J.; Ren, X.D.; Gu, C.W. Design and Analysis of S-CO2 Cycle and Radial Turbine for SOFC Vehicle Waste-Heat Recovery. J. Therm. Sci. 2019, 28, 559–570. [Google Scholar] [CrossRef]
  16. Han, W.L.; Wang, Y.M.; Feng, Z.P.; Li, H.Z.; Yao, M.Y.; Zhang, Y.F. Study on Flow Characteristics of a Turbulent Boundary Layer and Vortex Structure of High Pressure Guide Vanes in SCO2 Turbines. J. Therm. Sci. 2019, 28, 571–584. [Google Scholar] [CrossRef]
  17. Ying, Q.Y.; Zhuge, W.L.; Zhang, Y.J.; Ma, C.; Gou, J.L.; Wang, W. Vortex Patterns Investigation and Enstrophy Analysis in a Small Scale S-CO2 Axial Turbine. Energies 2021, 14, 6112. [Google Scholar] [CrossRef]
  18. Uusitalo, A.; Grönman, A. Analysis of Radial Inflow Turbine Losses Operating with Supercritical Carbon Dioxide. Energies 2021, 14, 3561. [Google Scholar] [CrossRef]
  19. Zhao, P.; Wen, Y.; Lou, J.; Yang, P.; Zhou, L.; Zhang, Y.; Wang, J. Design and Thermal-Fluid-Solid Coupling Investigation of Supercritical Carbon Dioxide Radial Inflow Turbine. J. Xi’an Jiaotong Univ. 2022, 56, 83–94. [Google Scholar]
  20. Gunawan, G.; Permana, D.I.; Soetikno, P. Design and numerical simulation of radial inflow turbine of the regenerative Brayton cycle using supercritical carbon dioxide. Results Eng. 2023, 17, 100931. [Google Scholar] [CrossRef]
  21. Al Moghazy, M.E.; Zou, Z.P.; Zhang, S.B.; Yao, L.C. Multi-stage radial-outflow supercritical carbon dioxide turbines: Preliminary design and optimization with insights into 3D design and structural considerations. Appl. Therm. Eng. 2025, 265, 125381. [Google Scholar] [CrossRef]
  22. Guan, Y.; Wang, X.; Li, W.; Li, Y.; Zhu, Y.; Chen, H. Review on Research Progress of Partial Admission Turbine. J. Propuls. Technol. 2023, 44. [Google Scholar] [CrossRef]
  23. Wakeley, G.R.; Potts, I. Origins of loss within a multistage turbine environment under conditions of partial admission. In Proceedings of the 1997 International Gas Turbine & Aeroengine Congress & Exposition, Orlando, FL, USA, 2–5 June 1997; ASME: Little Falls, NJ, USA, 2014. [Google Scholar]
  24. Sakai, N.; Harada, T.; Imai, Y. Numerical study of partial admission stages in steam turbine (Efficiency improvement by optimizing admission arc position). JSME Int. J. Ser. B 2006, 49, 212–217. [Google Scholar] [CrossRef]
  25. Hushmandi, N.B.; Fransson, T.H. Effects of Multiblocking and Axial Gap Distance on Performance of Partial Admission Turbines: A Numerical Analysis. J. Turbomach. 2011, 133, 031028. [Google Scholar] [CrossRef]
  26. Newton, P.; Copeland, C.; Martinez-Botas, R.; Seiler, M. An audit of aerodynamic loss in a double entry turbine under full and partial admission. Int. J. Heat Fluid Flow 2012, 33, 70–80. [Google Scholar] [CrossRef]
  27. Gao, K.K.; Xie, Y.H.; Zhang, D. Effects of rotor solidity and leakage flow on the unsteady flow in axial turbine. Appl. Therm. Eng. 2018, 128, 926–939. [Google Scholar] [CrossRef]
  28. Wang, H.W.; Luo, K.; Huang, C.; Zou, A.H.; Li, D.J.; Qin, K. Numerical investigation of partial admission losses in radial inflow turbines. Energy 2022, 239, 121870. [Google Scholar] [CrossRef]
  29. Abdalhamid, A.M.K.; Eltaweel, A. Design and analysis of a single-stage supersonic turbine with partial admission. Energy 2024, 309, 133100. [Google Scholar] [CrossRef]
  30. Peng, N.J.; Wang, E.H.; Wang, W.L. Design and analysis of a 1.5 kW single-stage partial-admission impulse turbine for low-grade energy utilization. Energy 2023, 268, 126631. [Google Scholar] [CrossRef]
  31. Guan, Y.; Li, W.; Zhu, Y.L.; Wang, X.; Zhang, Y.F.; Chen, H.S. Energy loss analysis in two-stage turbine of compressed air energy storage system: Effect of varying partial admission ratio and inlet pressure. Energy 2024, 305, 132214. [Google Scholar] [CrossRef]
  32. Li, T.X.; Wang, J.K.; Wang, Z.H.; Xi, G. Numerical Study on Unsteady Flow of a Supersonic Partial Admission Impulse Turbine. J. Turbomach. 2025, 147, 071017. [Google Scholar] [CrossRef]
  33. Yang, M.Y.; Cai, R.K.; Zhuge, W.L.; Yang, B.J.; Zhang, Y.J. Influence of Real Gas Properties on Aerodynamic Losses in a Supercritical CO2 Centrifugal Compressor. J. Therm. Sci. 2024, 33, 2032–2046. [Google Scholar] [CrossRef]
  34. Cho, J.; Shin, H.; Ra, H.S.; Lee, G.; Roh, C.; Lee, B.; Baik, Y.J. Development of the supercritical carbon dioxide power cycle experimental loop in kier. In Proceedings of the ASME Turbo Expo: TURBINE Technical Conference and Exposition, Seoul, Republic of Korea, 13–17 June 2016; Volume 9, pp. 433–440. [Google Scholar]
  35. Cho, J.; Shin, H.; Cho, J.; Ra, H.S.; Roh, C.; Lee, B.; Lee, G.; Baik, Y.J. Development of the supercritical carbon dioxide power cycle experimental loop with a turbo-generator. In Proceedings of the ASME Turbo Expo: Turbine Technical Conference and Exposition, Charlotte, NC, USA, 26–30 June 2017; Volume 9. [Google Scholar]
  36. Shin, H.; Cho, J.; Baik, Y.J.; Cho, J.; Roh, C.; Ra, H.S.; Kang, Y.; Huh, J. Partial admission, axial impulse type turbine design and partial admission radial turbine test for SCO2 cycle. In Proceedings of the ASME Turbo Expo: Turbine Technical Conference and Exposition, Charlotte, NC, USA, 26–30 June 2017; Volume 9. [Google Scholar]
  37. Kang, Y.-S.; Huh, J.-S.; Cho, J.; Shin, H.; Baik, Y.-J. Design and Performance Assessments of a Partial Admission Axial Turbine Using Supercritical Carbon Dioxide. In Proceedings of the ASME 2016 Fluids Engineering Division Summer Meeting Collocated with the ASME 2016 Heat Transfer Summer Conference and the ASME 2016 14th International Conference on Nanochannels, Microchannels, and Minichannels, Washington, DC, USA, 10–14 July 2016; Volume 1A. [Google Scholar]
  38. Cho, J.; Shin, H.; Cho, J.; Kang, Y.-S.; Ra, H.-S.; Roh, C.; Lee, B.; Lee, G.; Kim, B.; Baik, Y.-J. Preliminary experimental study of a supercritical CO2 power cycle test loop with a high-speed turbo-generator using R134a under similarity conditions. Front. Energy 2017, 11, 452–460. [Google Scholar] [CrossRef]
  39. Cho, J.; Shin, H.; Cho, J.; Baik, Y.J.; Choi, B.; Roh, C.; Ra, H.S.; Kang, Y.; Huh, J. Design, flow simulation, and performance test for a partial-admission axial turbine under supercritical CO2 condition. In Proceedings of the ASME Turbo Expo: Turbomachinery Technical Conference and Exposition, Oslo, Norway, 11–15 June 2018; Volume 9. [Google Scholar]
  40. Huang, G.D.; Shu, G.Q.; Tian, H.; Shi, L.F.; Zhuge, W.L.; Tao, L. Experiments on a small-scale axial turbine expander used in CO2 transcritical power cycle. Appl. Energy 2019, 255, 113853. [Google Scholar] [CrossRef]
  41. Huang, G.D.; Shu, G.Q.; Tian, H.; Shi, L.F.; Zhuge, W.L.; Zhang, J.; Atik, M.A.R. Development and experimental study of a supercritical CO2 axial turbine applied for engine waste heat recovery. Appl. Energy 2020, 257, 113997. [Google Scholar] [CrossRef]
  42. Li, L.G.; Tian, H.; Lin, X.; Zeng, X.Y.; Wang, Y.R.; Zhuge, W.L.; Shi, L.F.; Wang, X.; Liang, X.Y.; Shu, G.Q. Demonstration of a small-scale power generator using supercritical CO2. Carbon Energy 2024, 6, e428. [Google Scholar] [CrossRef]
  43. ANSYS. ANSYS CFX-Solver Modeling Guide; ANSYS: Canonsburg, PA, USA, 2020. [Google Scholar]
  44. Menter, F.R. 2-equation eddy-viscosity turbulence models for engineering applications. AIAA J. 1994, 32, 1598–1605. [Google Scholar] [CrossRef]
  45. Lemmon, E.W.; Huber, M.L.; McLinden, M.O. Reference fluid thermodynamic and transport properties–refprop. NIST Stand. Ref. Database 2013, 23. Available online: https://www.nist.gov/publications/nist-standard-reference-database-23-reference-fluid-thermodynamic-and-transport (accessed on 30 June 2025).
  46. Sun, H.C.; Li, H.K.; Gao, P.; Hou, F.; Hung, T.-C.; Chang, Y.-H.; Lin, C.-W.; Qin, J. Numerical simulation and low speed experiment of a low partially admitted rate axial turbine for small scale organic Rankine cycle. Appl. Therm. Eng. 2024, 238, 122002. [Google Scholar] [CrossRef]
  47. Hunt, J.C.; Wray, A.A.; Moin, P. Eddies, streams, and convergence zones in turbulent flows. In Studying Turbulence Using Numerical Simulation Databases, 2. Proceedings of the 1988 Summer Program 1988; NASA: Washington, DC, USA, 1988. [Google Scholar]
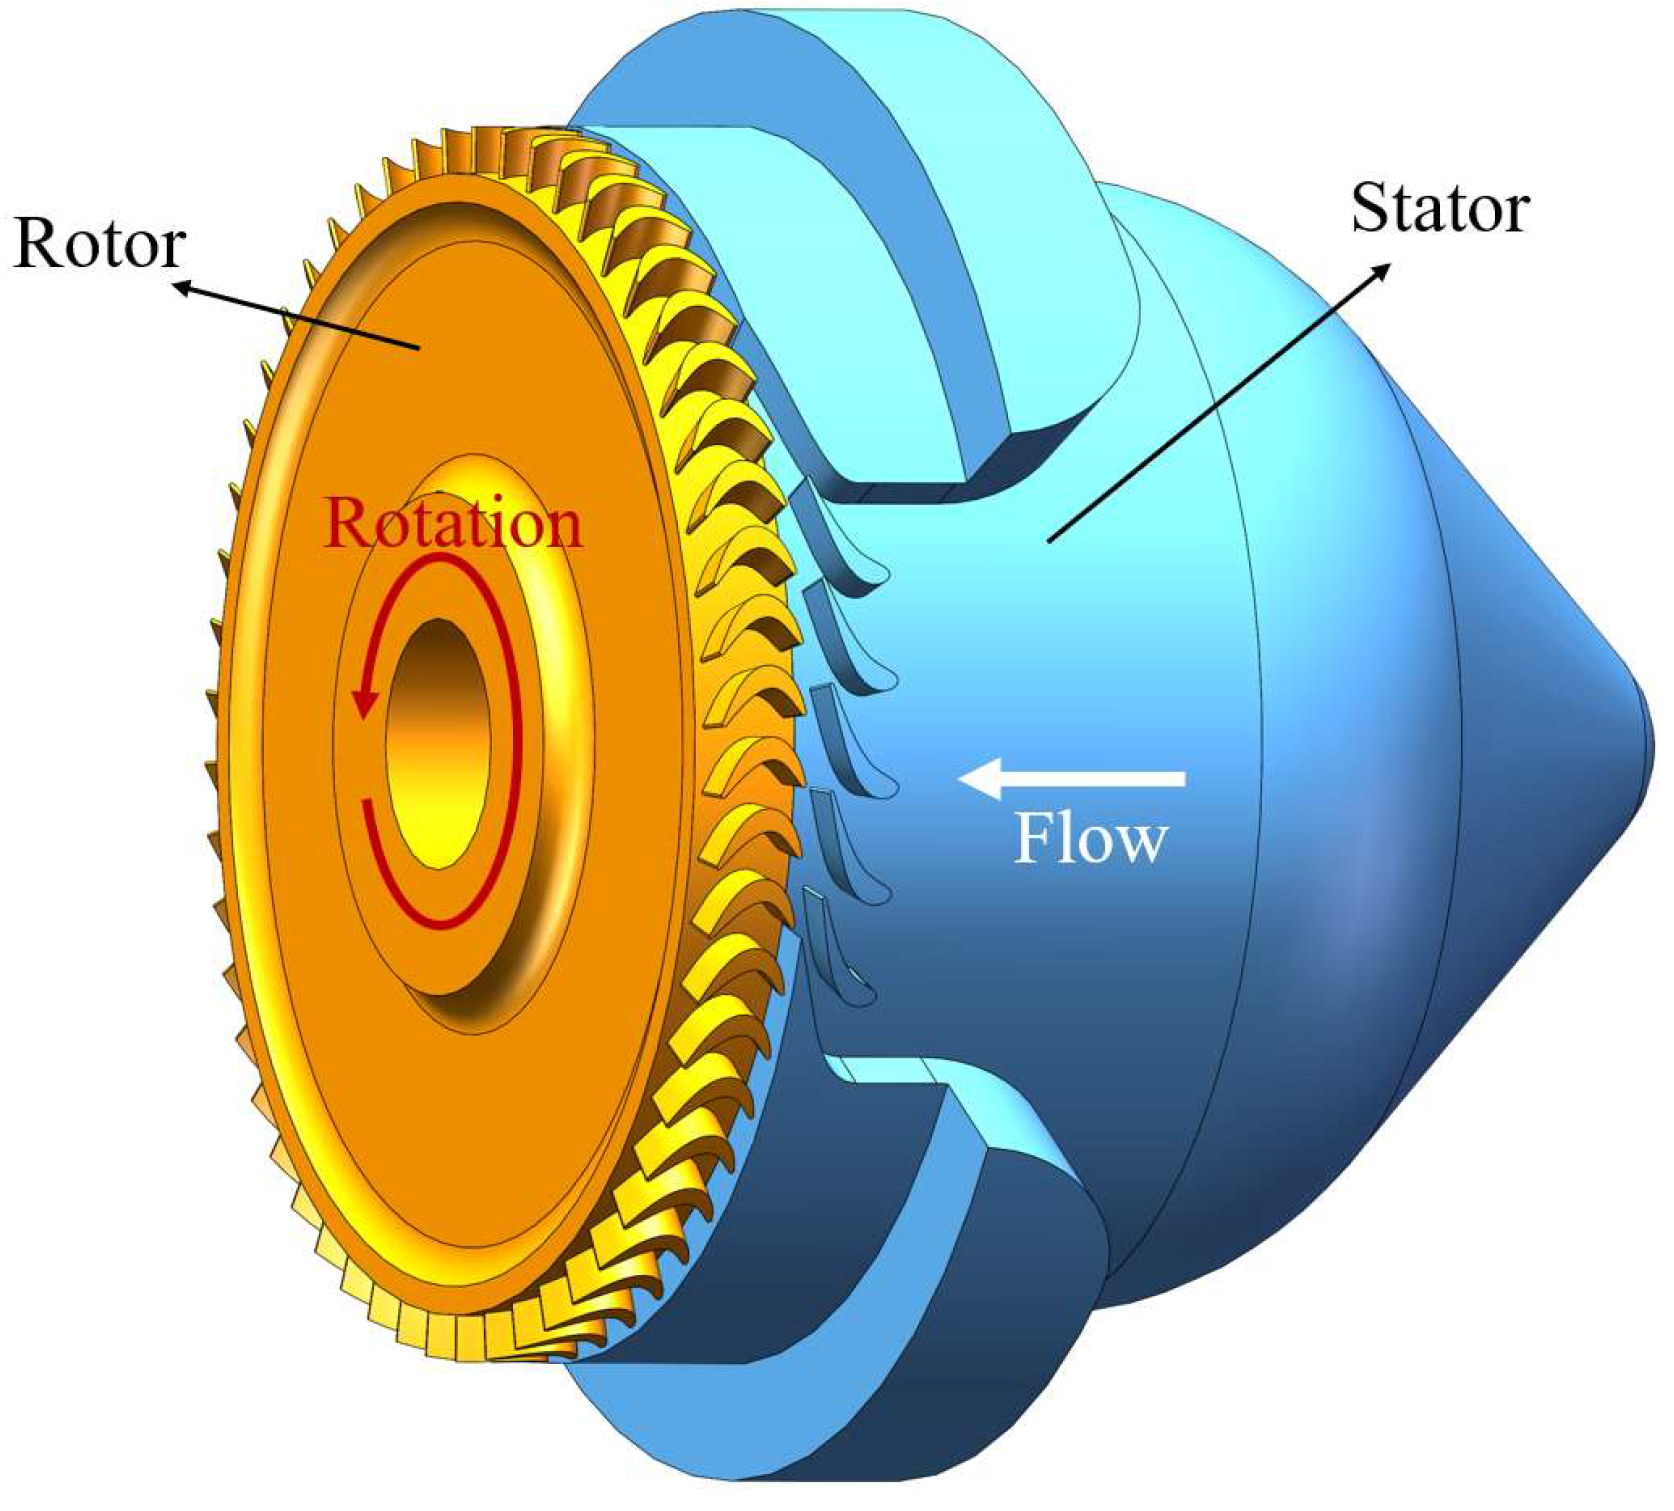
Figure 1. Three-dimensional schematic of the partial admission S-CO2 turbine, illustrating flow direction and impeller rotation.
Energies 18 04259 g001
Figure 2. Computational mesh of the partial admission S-CO2 turbine, with local refinement near walls and tip clearance.
Energies 18 04259 g002
Figure 3. Influence of circumferential relative phase between stator and rotor domains on simulated turbine efficiency.
Energies 18 04259 g003
Figure 4. Comparison of experimentally measured turbine efficiency and numerically predicted turbine efficiency.
Energies 18 04259 g004
Figure 5. Variation of turbine efficiency with the partial admission ratio (CFD results).
Energies 18 04259 g005
Figure 6. Circumferential distribution of rotor blade torque at different PARs: (a) direction of rotation; (b) blade torque (CFD results).
Energies 18 04259 g006
Figure 7. Mach number distribution at 50% blade height.
Energies 18 04259 g007
Figure 8. Pressure distribution at 50% blade height.
Energies 18 04259 g008
Figure 9. Velocity vector at 50% blade height (PAR = 0.172).
Energies 18 04259 g009
Figure 10. Entropy distribution at different axial positions (PAR = 0.172).
Energies 18 04259 g010
Figure 11. Qz distribution at different axial positions within rotor passages. Blades are numbered, with magnified view of edge of active sector (PAR = 0.172). Numbers 1–13 denote the consecutive turbine blades and are used for reference in the text.
Energies 18 04259 g011
Figure 12. Loading distribution on different blades at various spanwise positions (PAR = 0.172, entrance of active sector).
Energies 18 04259 g012
Figure 13. Loading distribution on different blades at various spanwise positions (PAR = 0.172, exit of active sector).
Energies 18 04259 g013
Figure 14. Qz distribution at different axial positions within rotor passages. Blades are numbered, with magnified view of edge of active sector (PAR = 0.0606). Numbers 1–7 denote the consecutive turbine blades and are used for reference in the text.
Energies 18 04259 g014
Figure 15. Loading distribution on different blades at various spanwise positions within the active sector (PAR = 0.0606).
Energies 18 04259 g015
Table 1. Operating conditions and geometric parameters of the partial admission S-CO2 turbine.
ParameterUnitValue
Turbine inlet temperatureK823.15
Turbine inlet pressureMPa14.7
Turbine outlet pressureMPa8.0
Rotational speedrpm55,000
Mass flow ratekg/s3.1
Blade number of the stator-36
Blade number of the rotor-54
Axial chord of the stator blademm3.8
Axial chord of the rotor blademm4.7
Hub radiusmm29.5
Blade spanmm2.5
Table 2. Results of mesh independence analysis.
Number of MeshNumber of Mesh ElementsTurbine Efficiency
Mesh 16.52 million69.43%
Mesh 29.79 million69.68%
Mesh 314.68 million69.93%
Mesh 417.20 million69.99%
Mesh 523.91 million70.02%
Disclaimer/Publisher’s Note: The statements, opinions and data contained in all publications are solely those of the individual author(s) and contributor(s) and not of MDPI and/or the editor(s). MDPI and/or the editor(s) disclaim responsibility for any injury to people or property resulting from any ideas, methods, instructions or products referred to in the content.