Article

Techno-Economic Analysis and Power Take-Off Optimization of a Wave Energy Converter Adjacent to a Vertical Seawall

by
Senthil Kumar Natarajan
and
Il Hyoung Cho
*
Department of Ocean System Engineering, Jeju National University, Jeju 63243, Republic of Korea
*
Author to whom correspondence should be addressed.
Energies 2025, 18(16), 4246; https://doi.org/10.3390/en18164246
Submission received: 16 July 2025 / Revised: 31 July 2025 / Accepted: 7 August 2025 / Published: 9 August 2025
(This article belongs to the Section A3: Wind, Wave and Tidal Energy)

Abstract

Wave energy converters (WECs) that are installed in nearshore environments offer several practical advantages, including easier access, lower maintenance, reduced transmission costs, and potential integration with the existing coastal infrastructure, leading to cost savings and improved commercial viability. This study presents a techno-economic analysis and power take-off (PTO) optimization for a vertical cylindrical WEC positioned adjacent to a vertical seawall under irregular wave conditions. The PTO system is connected via frames and hinges, with one end connected to the vertical seawall and the other end to the arm extending to the oscillating WEC. Hydrodynamic parameters were obtained from WAMIT, incorporating the seawall effect via the image method using linear potential theory. This analysis considers variations in WEC diameter, the lengths of frame segments supporting the PTO system, and the PTO damping. First, the geometric configuration is optimized. The results show that placing the WEC closer to the seawall and positioning the hinge joint of the PTO frame at the midpoint of the actuating arm significantly enhances power extraction, due to intensified hydrodynamic interactions near the seawall. A techno-economic analysis is then conducted using two techno-economic metrics, with one representing device cost and the other a newly introduced metric for PTO cost, combined through the weighted sum model (WSM) within a multi-criteria decision analysis (MCDA) framework. Our findings indicate that a smaller-diameter WEC is more cost-effective within a narrow range of PTO damping, while larger WECs, although requiring higher PTO damping capacity, become more cost-effective at higher PTO damping values, due to increased power absorption. Optimal PTO damping values were identified for each diameter of the WEC, demonstrating the trade-off between power output and system cost. These findings provide practical guidance for optimizing nearshore WEC designs to achieve a balance between performance and cost.

1. Introduction

Transitioning to renewable energy is crucial to reduce greenhouse gas emissions and mitigate the impacts of climate change, because the energy sector is the largest emitter of global greenhouse gas among all sectors. Wave energy, being a clean and renewable source with high power density, has considerable potential for meeting global energy demand. However, despite its great potential, it remains commercially unviable due to its high levelized cost of energy (LCoE) compared to more established renewable energy sources like solar and wind power. Cost savings and improved commercial viability can be achieved by installing WECs nearshore and integrating them with existing onshore structures. This approach provides several benefits, including shared infrastructure costs, easier access for installation, operation, and maintenance compared to offshore deployment, and direct connection to the onshore power grid.
The authors of [1] reviewed the latest developments in the integration of WEC with breakwater structures. This integration allows the two systems to work together, absorbing wave energy and converting it into electricity. Energy absorption also helps to reduce wave forces on breakwaters. Integrating a wave energy device with a breakwater provides several advantages compared to using a standalone device. These benefits include reduced costs for construction, installation, and maintenance; the dual function of energy generation and coastal protection; lower environmental impact through the use of existing infrastructure; improved performance under high wave conditions; and an extended operational lifespan for the device. Despite these potential advantages, several challenges need to be addressed. The primary challenge lies in selecting appropriate breakwater locations, as the WEC must be oriented to effectively face incoming waves. Additionally, the breakwater must accommodate the added load due to its interaction with the WEC. Furthermore, the WEC design should consider wave deformation occurring near the breakwater. The authors of [2] investigated the hydrodynamic response and power efficiency of a heaving WEC that was integrated with a breakwater. Various WEC models with different shapes and spacing were evaluated. The study concluded that integrating the WEC with a breakwater improves its performance.
WECs rely on a power take-off (PTO) system to convert the mechanical energy captured from waves into usable forms, such as electrical power. The efficiency of energy extraction depends on the performance of the PTO system, which can be improved through optimization to maximize conversion efficiency. The PTO system can be connected to the WEC via frames and hinges that are linked to an onshore structure. This setup eliminates the need to install the PTO directly on the WEC, ensuring effective integration between the WEC and the onshore infrastructure. The authors of [3] emphasized that the economic viability of a WEC largely depends on its power take-off (PTO) system. The article analyzed the design, simulation, and testing of a novel hydraulic PTO system for a WEC composed of semi-submerged cylinders connected by hinged joints. It highlighted the use of active control strategies to maximize power capture across varying sea states and to enhance survivability. In [4], the authors investigated the wave power capture potential of two interconnected floats, which utilized their relative rotation to drive a PTO system. The study examined how varying the interconnected float length ratio affects power capture and presented results across different wave periods. A structural optimization study was conducted in [5] on the oscillating-array buoys to enhance wave energy capture efficiency. The authors used simulations with varying buoy spacing, placement configurations, and actuating arm lengths. The buoys, connected to a central platform via actuating arms, showed improved energy capture efficiency when the actuating arm length was increased within a certain range. This improvement was attributed to a staggered placement configuration, which minimized shading effects and reduced mutual interference among the buoys. Power take-off (PTO) optimization was performed in Ref. [6] for a two-body WEC system that harnesses relative heave motion to extract energy. The study focused on a barge-type attenuator composed of bodies linked by frames and hinges. The vertical movement of these bodies caused relative motion that compressed or stretched the PTO system, facilitating power capture. Several studies [7,8,9,10,11,12,13] have investigated PTO systems that use actuating frames and hinges to connect WECs to a central platform or structure.
If the onshore structure integrated with the PTO system is reflective, wave power absorption can be significantly improved. By reflecting the incoming waves, the structure creates standing waves that intensify the wave field around the WEC, enhancing its motion and increasing power extraction. The authors of [14] examined the hydrodynamic performance of an array of truncated cylinders positioned in front of a vertical wall using frequency-domain analysis. Their study focused on understanding the effects of wave reflections from the wall and the interactions between the devices. An experimental study was conducted in [15] to evaluate the hydrodynamic performance of a WEC system integrated with a breakwater, compared to conventional WECs. The study showed that WECs positioned in front of the breakwater exhibited increased heave motion, indicating that integration with the breakwater improved energy extraction performance. A hydrodynamic analysis was performed in [16] of an innovative breakwater with parabolic openings designed for wave energy extraction. Truncated cylinder-type WECs placed in front of these openings benefited from waves converging toward a focal point, leading to a significant increase in wave power extraction. The authors of [17] conducted a theoretical evaluation of the hydrodynamic parameters of an array composed of vertical axisymmetric floaters of various shapes, placed in front of a vertical breakwater. Using an analytical approach, the study employed the image method to account for the influence of the breakwater. Three types of floaters and multiple array configurations were analyzed. The results showed that the configurations’ hydrodynamic coefficients varied, either increasing or decreasing depending on the distance between the floaters and the breakwater. The authors extended their analysis in [18] to evaluate an array of cylindrical WECs positioned in front of a reflective vertical breakwater. The study considered three array configurations, parallel, perpendicular, and rectangular, while varying the distance from the wall, inter-WEC spacing, wave incidence angles, and mooring stiffness. Among the various configurations, the parallel arrangement demonstrated the highest power extraction efficiency. WECs placed closer to the wall exhibited superior performance across most wave frequencies compared to those positioned farther away. Overall, the presence of the vertical breakwater positively influenced power extraction across all configurations, wave angles, and inter-WEC spacings. This amplification effect was most notable in a parallel configuration placed close to the wall under various wave directions.
Optimizing WEC systems for maximum wave energy conversion must also account for their economic viability to ensure successful market adoption. Economics of WECs in reference [19] outlines three key decision-making metrics for WECs: technical metrics to evaluate performance, techno-economic metrics that combine technical performance with cost surrogates such as cubic displacement or surface area, and economic metrics. A comprehensive review in [20] reported that up to 78% of optimization studies have focused primarily on technical criteria, such as average power absorption, annual energy production, capture width ratio, and the response amplitude operator (RAO). In contrast, only a limited number of studies considered techno-economic indicators, such as power or annual energy production per unit volume, surface area, or mass. Notably, just 8% of the reviewed studies incorporated economic criteria into the optimization process. Evaluating economic criteria, such as the levelized cost of energy (LCoE) and net present value (NPV), as objective functions in the optimization process remains challenging, due to the high uncertainty associated with their estimation. It has been argued that performance indicators are most meaningful when based on economic metrics, provided they also account for all relevant technical constraints and characteristics. The findings from several WEC sea trials further suggest that prioritizing technology performance level (TPL) over technology readiness level (TRL) is essential, particularly during the early to mid-stages of development. TRL and TPL scales [19] are used to measure the technical maturity and economic potential of a new technology, respectively. To enter the market successfully, technology must be fully developed and demonstrate commercial viability. Therefore, early techno-economic optimization is critical to balance technical performance with costs by evaluating different technological options and their economic effects. This should be performed at every development stage to ensure successful entry into the renewable energy market. In [21], the comprehensive techno-economic optimization of a floating WEC was performed using a genetic algorithm, considering a broad multivariate design space. This included factors such as the floater’s shape, dimensions, subcomponent configuration, and characteristics. Reference [22] presents a techno-economic performance analysis of the influence on the sizing of WECs. Other articles [23,24] offered economic evaluations and cost estimations for WECs during their early developmental stages. The device cost represents approximately 50% of the total cost of a WEC system, while the PTO contributes around 20%. The remaining costs are attributable to the mooring system, installation, and electrical and mechanical components. The authors of [25] reviewed the levelized cost of wave energy using a techno-economic model and examined the viability of WEC technologies. In a study [26], the techno-economic metric of extracted power per unit mass was used to optimize the performance of hybrid WEC arrays. A multi-objective optimization approach was employed in [27] for nearshore submerged wave energy farms, with objectives including power maximization and the minimization of export cable length, the number of anchors, and anchor design load. In [28], the authors introduced a new cost-effectiveness metric by combining capture width with surface area to assess the relative cost versus performance of WECs. The authors of [29] introduced a cost indicator, defined as the ratio of a WEC’s submerged volume to its extracted power, serving as a proxy for capital cost. A techno-economic metric is used in reference [30], which is based on the ratio of hydrodynamic efficiency to the device scale, assuming that manufacturing cost broadly correlates with device scale.
Multi-criteria decision analysis (MCDA) is a decision-making framework designed to evaluate and prioritize multiple, often conflicting, criteria. It is particularly useful when factors differ in scale, units, or importance, thereby making direct comparison challenging. MCDA is widely applied in fields such as engineering, business, environmental management, government organizations, and policymaking, where complex decisions require balancing diverse trade-offs. The weighted sum model (WSM) is a quantitative decision-making method commonly used within the MCDA framework. The authors of [31] applied the weighted sum model (WSM) for the multi-criteria site selection of offshore renewable energy platforms. They developed specialized decision-support tools to enable flexible, multi-criteria site selection for combined wind–wave energy platforms, emphasizing the availability of energy resources. The authors of [32] employed the WSM to optimize the design of an inclined porous plate wave absorber using an artificial neural network (ANN) model. The optimization aimed to minimize wave reflection and the spatial footprint of the structure. In the WSM framework, weighting factors were assigned based on the relative importance of each criterion, facilitating a balanced evaluation of the multiple design objectives. In [33], the WSM was applied to select recipients of special allocation funds by efficiently ranking the candidate alternatives. The authors of [34] reported the use of the WSM for selecting titanium alloys in biomedical applications, noting that the methodology is applicable to a wide range of fields.
In our previous study [35], we conducted a cost-effective optimization of a WEC array positioned in front of a vertical seawall, accounting for the seawall’s effects using the image method. The optimization employed a previously published metric [29] defined as the ratio of the submerged volume of the WECs to the power they extract. The results showed that cost-effectiveness improves when WECs are positioned near the seawall, with a larger number of devices arranged in an array while reducing the spacing between them. This improvement is attributable to the vertical seawall’s full wave reflection, which creates standing waves that enhance the heave motion of the WECs. Furthermore, placing more WECs closer together leads to stronger device interactions caused by trapped waves.
The literature highlights that WECs have significant potential but remain commercially unviable due to high costs. Several studies show that integrating WECs with nearshore or onshore structures like breakwaters can reduce costs, improve accessibility, and enhance performance due to wave reflections and structural synergies. In this context, the PTO system can be connected to the WEC via frames and hinges linked to an onshore structure, eliminating the need to install the PTO directly on the WEC and enabling effective integration with land-based infrastructure. Prior research also emphasizes the importance of optimizing the power take-off (PTO) system, as it significantly influences energy extraction efficiency and overall economics. However, most of the existing studies focus either on hydrodynamic performance or technical optimization, with limited attention being paid to the techno-economic aspects, particularly under irregular wave conditions.
To bridge these gaps, the present study focuses on techno-economic analysis and power take-off optimization for a WEC integrated with a vertical seawall via a PTO system under irregular wave conditions. It builds on previous work [35] using the image method and introduces a novel techno-economic metric for PTO alongside device cost. The PTO system is connected using frames and hinges, with one end fixed to the seawall and the other end connected to an arm extending outward to attach to the WEC. A vertical cylindrical floater is used as the WEC; this is an axisymmetric floater constrained to heave motions only, which is the dominant mode responsible for energy extraction in the device configuration considered. Other motion modes are constrained, making their effects negligible in this study. Hydrodynamic parameters are obtained using WAMIT, a commercial numerical tool based on linear potential theory. The image method is employed to account for the influence of the vertical seawall. Viscous damping was determined through a heave free-decay test conducted using computational fluid dynamics (CFD) simulations. The PTO system is optimized by varying the lengths of different segments of the connection frame for various WEC diameters to maximize power extraction under irregular wave conditions. The optimal frame configuration is then used in a subsequent techno-economic analysis, where PTO damping is varied for different WEC diameters to identify the most cost-effective setup. Two techno-economic metrics are employed: the first is the ratio of the WEC’s submerged volume to the extracted power, which serves as an indicator of device cost; the second is a newly proposed metric, defined as the ratio of the PTO damping coefficient to extracted power, representing PTO cost, as these are the major contributors to the overall cost of a WEC [23,24]. These two metrics are integrated using the weighted sum model (WSM) within the multi-criteria decision analysis (MCDA) framework to assess overall cost-effectiveness. These are weighted according to their contribution to the total WEC cost. This integrated approach addresses both performance and cost-effectiveness, which is essential for advancing the commercial viability of wave energy systems.

2. Materials and Methods

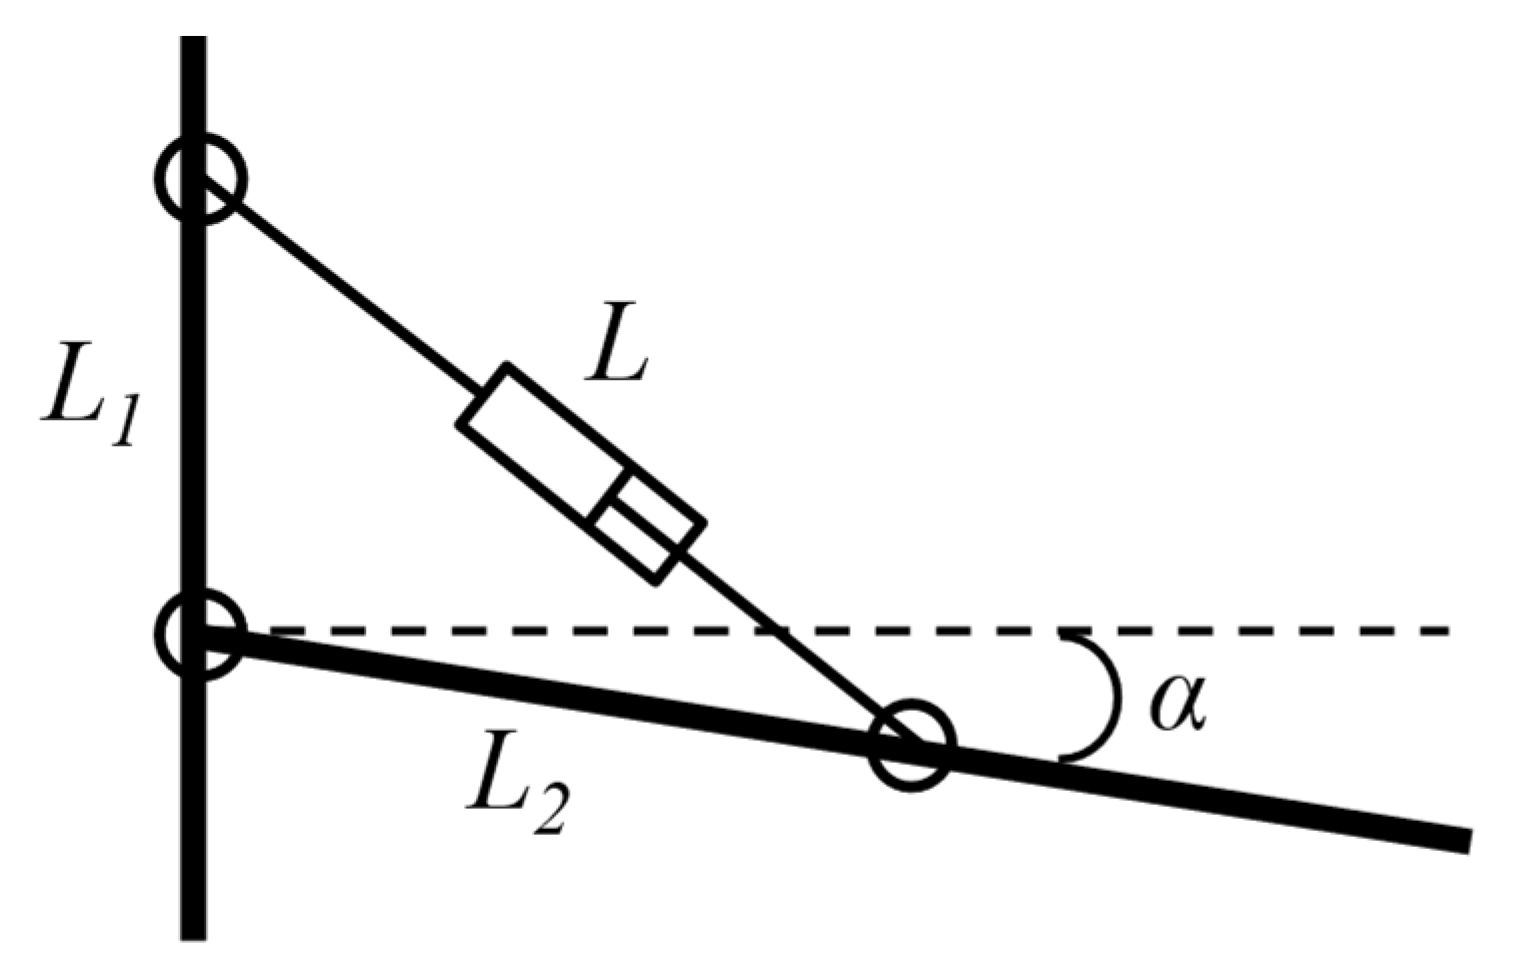
In the studied setup, a vertical cylindrical WEC is placed adjacent to a perfectly reflective vertical seawall in water of constant depth h . The WEC has a diameter of D and a draft of d , and it is located at a distance of L w a l l from the seawall. The WEC oscillates in the vertical mode in response to incident waves, with all other modes of motion constrained. Wave energy is extracted through a power take-off (PTO) system that converts the WEC’s heave motion into electricity. The PTO system is modeled as an equivalent linear damping force and is connected through a frame-and-hinge mechanism, with one end fixed to the vertical seawall and the other end attached to the WEC. Figure 1 shows a schematic of the WEC positioned adjacent to a vertical seawall, with the PTO system connected through frames and hinges. The actuating arm connecting the vertical seawall to the WEC has a length of L w a l l . The hinged joint connecting the PTO system frame to the actuating arm is located at a distance of L 2 from the seawall. The vertical distance between the hinges of the PTO system frame is L 1 . The wave approaches the seawall at a right angle.

2.1. Geometry and Kinematics of the PTO System Frames

As the WEC moves vertically, the connected frames either stretch or compress the PTO system. A mathematical formulation has been developed, based on the frame motion, to determine the equivalent forces acting on the PTO system. A similar formulation for a two-body system with an arrangement of frames, hinges, and a PTO system was previously presented in [6], where power was extracted from the relative heave motion between the two bodies. The formulation is modified to suit the present model by fixing one body, representing the vertical seawall, while the other body represents the WEC, which is moving in a vertical direction.
In still water, the frame structures L 1 and L 2 form a right-angled triangle, and the length of the PTO structure L 0 is defined as:
L 0 = L 1 2 + L 2 2
If the WEC oscillates in waves, the PTO system frame takes the configuration shown in Figure 2, with the length of the PTO structure denoted as L . If the WEC’s heave motion is small, the angle α is approximated as:
α z L w a l l
where z is the heave motion response of the WEC.
Now, the length of the PTO system can be calculated as follows:
L = L 1 2 + L 2 2 2 L 1 L 2 cos π 2 + α = L 0 2 + 2 L 1 L 2 sin α L 0 1 + 2 L 1 L 2 α L 0 2
by ignoring higher-order terms after expanding Taylor’s series:
L 0 1 + L 1 L 2 α L 0 2 = L 0 + L 1 L 2 α L 0
Thus, the increment of the PTO length is written as:
Δ L = L L 0 = L 1 L 2 α L 0 = L 1 L 2 L 0 L w a l l z
The velocity of the PTO due to the stretching and compressing is:
d ( Δ L ) d t = L 1 L 2 L 0 L w a l l z ˙
Assuming a linear PTO damping coefficient b P T O ( Ns / m ) , which is consistent with the linear potential theory adopted in this study, and neglecting the mass of the frame and hinge friction, the PTO damping force can be calculated as follows:
F P T O = b P T O L 1 L 2 L 0 L w a l l z ˙
Since the WEC undergoes a heave motion, only the vertical component of the PTO force is considered. It is expressed as:
F v e r t i c a l = b P T O L 1 2 L 2 L 0 2 L w a l l z ˙ = b P T O z ˙
where b P T O is the equivalent PTO damping coefficient.
By adjusting the actual PTO damping b P T O , the equivalent PTO damping can be maintained at the desired target value, regardless of variations in the lengths of the different segments of the PTO frames.
b P T O = L 0 2 L w a l l L 1 2 L 2 b P T O

2.2. Hydrodynamic Modeling

The hydrodynamic force (added mass and radiation damping coefficient) and wave excitation force on the WEC are numerically obtained using WAMIT (Version 7.1), a panel-based commercial software used for hydrodynamic analysis. WAMIT computes wave–structure interactions, motions, and forces on offshore and floating structures based on linear potential theory, which assumes small-amplitude waves, an incompressible and inviscid fluid, and irrotational flow.

2.3. Image Method

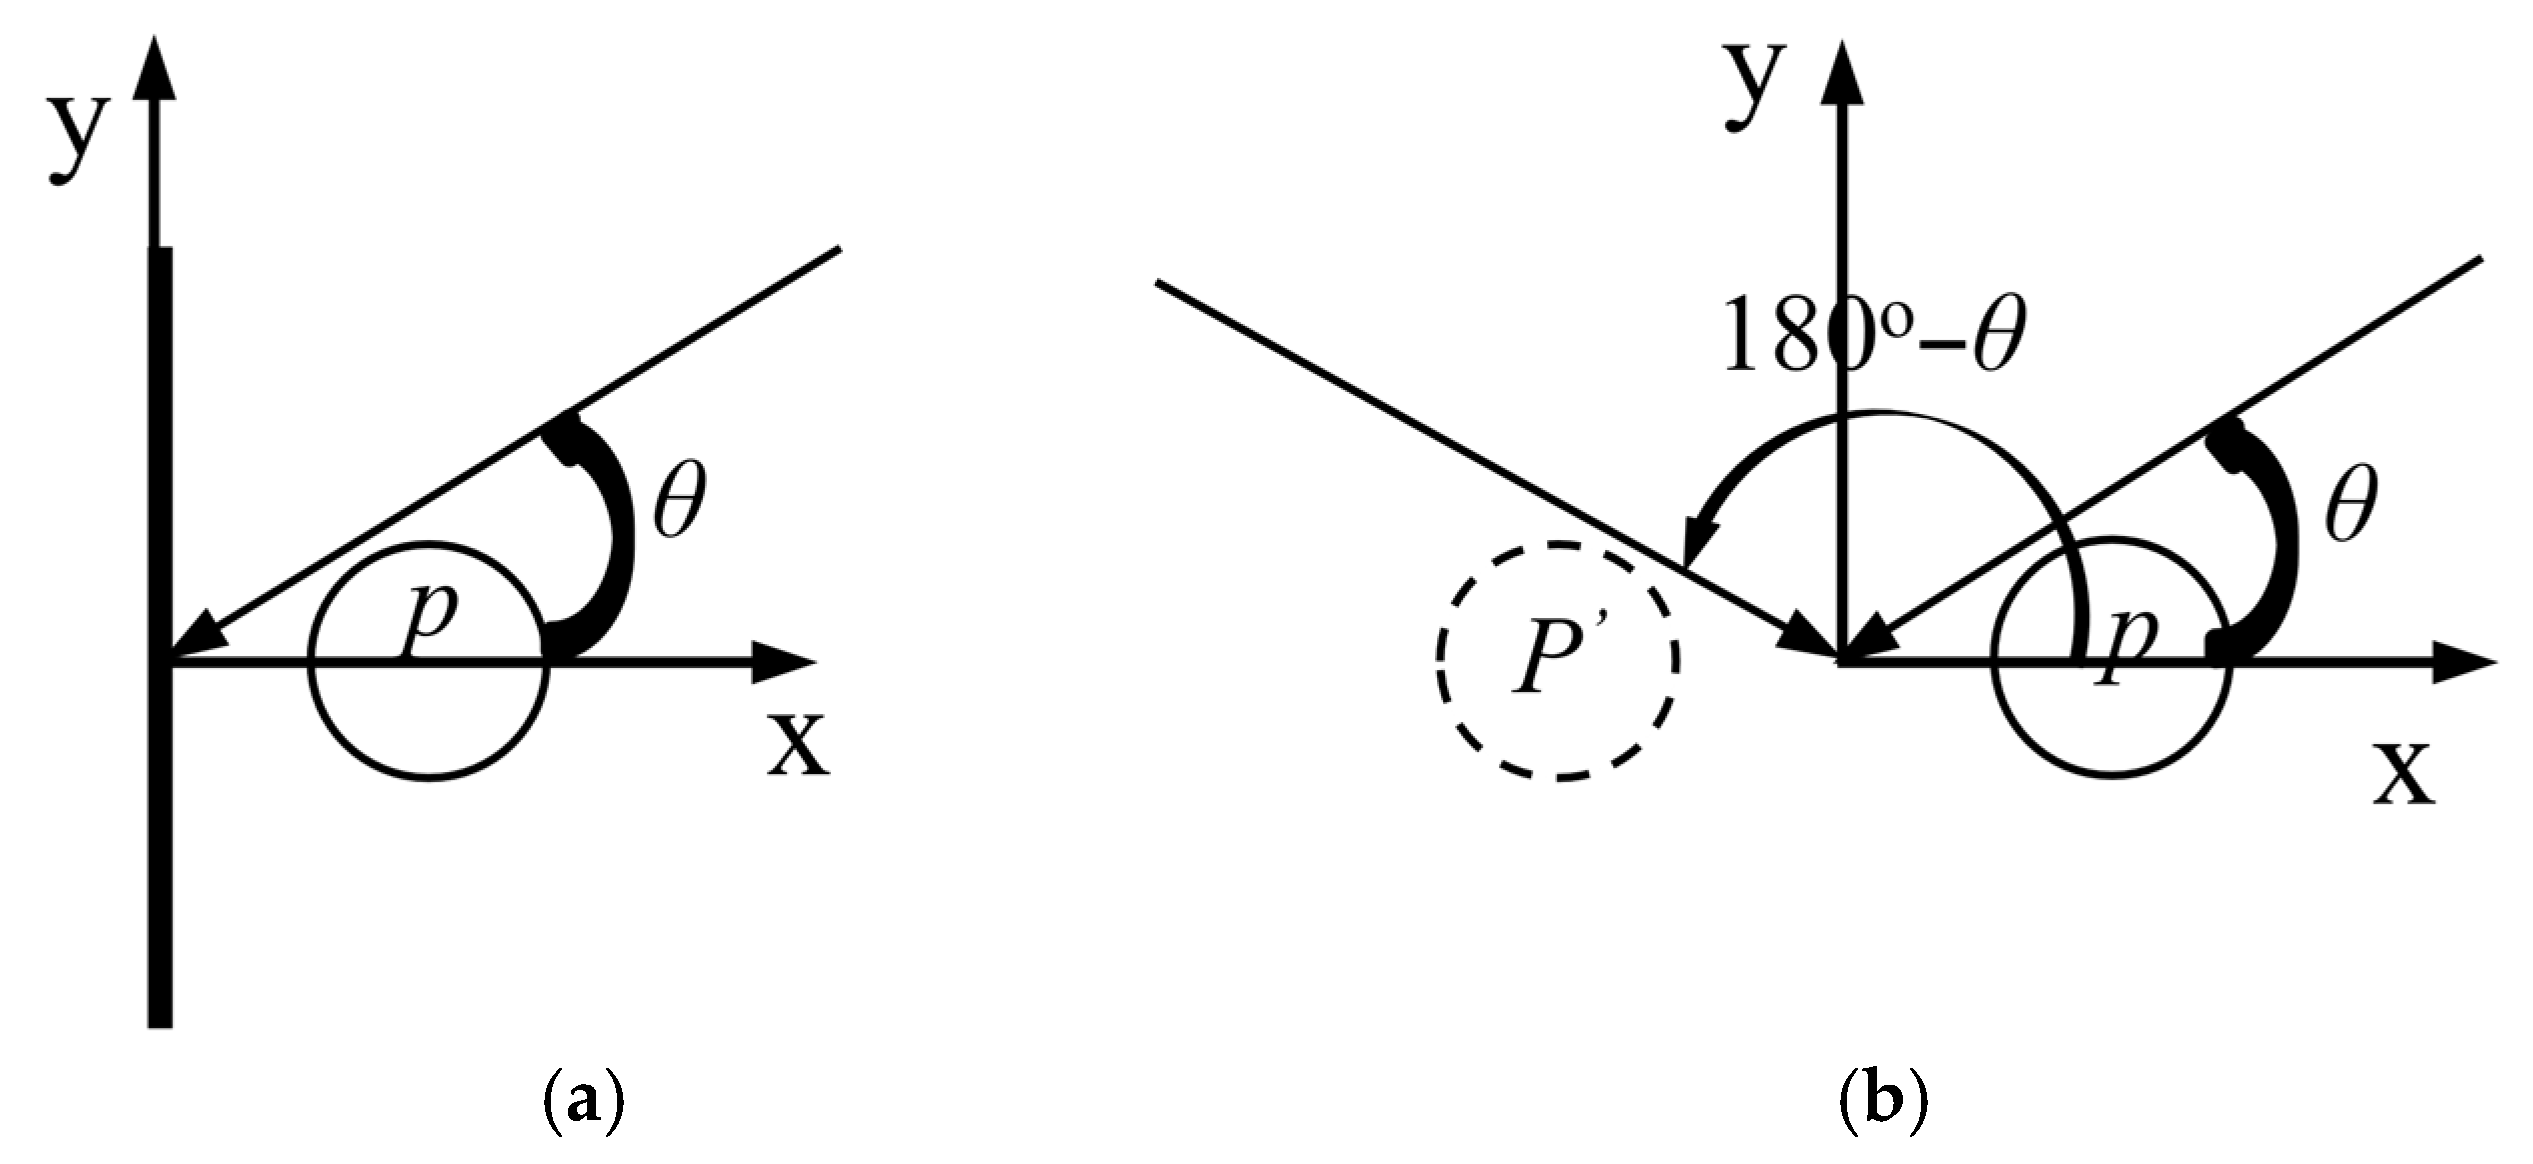
When a floating body oscillates near a rigid lateral boundary such as a vertical seawall, the interaction between the floating body and the seawall must be accounted for. In this study, the image method [17] is employed to represent the effect of the seawall. This approach replaces the vertical seawall with a mirrored image ( p ) of the WEC, placed symmetrically on the opposite side of the seawall alongside the actual WEC ( p ), with bi-directional incident waves, one propagating at an incidence angle θ and another incident at an angle 180 ° θ , with a prescribed motion to ensure that the no-flux boundary condition on the seawall is satisfied. Figure 3 shows the top view of a WEC placed in front of a vertical seawall, which is replaced with an image body.
The hydrodynamic parameters of the WEC p , accounting for the influence of the vertical seawall, can be obtained by combining the hydrodynamic parameters of the forced oscillation of the WEC p and its image WEC p , in the respective mode of motion. For example, the heave hydrodynamic added mass, radiation damping, and wave excitation force can be calculated as a 33 p + a 33 p , b 33 p + b 33 p and f 3 p + f 3 p . a i j p , b i j p and f i p are the hydrodynamic parameters of the WEC p in the i -th direction due to the j -th mode of motion, where the subscript 3 denotes the heave motion.

2.4. Equation of Heave Motion

The equation of heave motion of the WEC is given by [35,36,37,38,39]:
( m + a 33 ) z ¨ + ( b 33 + b v i s + b P T O ) z ˙ + c 33 z = f 3
where m (kg) is the mass of the WEC, a 33 (kg), b 33 (Ns/m), and f 3 (N), are the frequency-dependent added mass, radiation damping coefficient, and wave excitation force, respectively, c 33 (N/m) is the heave restoring force coefficient. b v i s = 2 κ c 33 ω N b 33 ( ω N ) (Ns/m) is the heave viscous damping coefficient, where ω N (rad/s) is the undamped heave natural frequency, defined as ω N = c 33 m + a 33 , and κ is the viscous damping factor determined from a free-decay test in still water. b P T O (Ns/m) is the equivalent PTO damping coefficient, and z is the heave motion response of the WEC. Viscous damping was determined through a heave free-decay test, conducted using a CFD simulation [35].

2.5. Wave Power Extraction

The wave power extracted by the WEC depends on both the PTO damping and the WEC’s velocity. For regular waves, the time-averaged power extracted by the WEC per-unit wave amplitude is expressed as [35,36,37,38,39]:
P ¯ ( ω ) = 1 2 b P T O ω 2 z 2
The extracted power from regular waves can be extended to irregular waves. The mean extracted power of the WEC under the irregular waves can be determined by [35,36,37,40,41]:
P ¯ i r r = 0 S ς ( ω ) P ¯ ( ω ) d ω
where the incident wave spectrum S ς ( ω ) is characterized by significant wave height H 1 / 3 and peak frequency ω P ( = 2 π T P ) . We used the JONSWAP spectrum, which is obtained by [42]:
S ς ( ω ) = β H 1 / 3 2 ω P 4 ω 5 exp - 1.25 ω ω P 4 γ exp ( ω ω P ) 2 2 σ 2 ω P 2
with:
β = 0.0624 0.23 + 0.0336 γ 0.185 ( 1.9 + γ ) 1 ( 1.094 0.01915 ln γ )
where the peakedness factor γ = 3.3 , σ = 0.07 for ω < ω P and σ = 0.09 for ω ω P .
The methodology used in the present study is similar to that of our previous work [35] for modeling WEC hydrodynamics, estimating power extraction, and accounting for the influence of a vertical seawall using the image method. In that study, the image method was validated in detail by comparing the numerical results with analytical solutions. Additionally, a CFD-based heave free-decay test was conducted to estimate viscous damping. Since these procedures have already been thoroughly established and validated, readers are referred to Ref. [35] for detailed descriptions and validation results.

2.6. PTO Damping

2.6.1. Optimal PTO Damping

Based on Equation (10), the extracted power will be maximum under the condition of:
d P ¯ d b P T O = 0
which leads to a derivation of the frequency-dependent optimal PTO damping [43]. This derivation is inherently based on the heave motion equation (Equation (9)) applied within the power extraction equation for regular waves (Equation (10)). Taking the derivative with respect to the PTO damping coefficient then leads to:
b ˜ P T O ( ω ) = ( b 33 + b v i s ) 2 + c 33 ω ω ( m + a 33 ) 2
In the above equation, the optimal PTO damping varies according to incoming wave frequency. This frequency-dependent PTO damping coefficient can be used to theoretically obtain higher power extraction. The optimal PTO damping has the lowest value of b 33 ( ω N ) + b v i s ( ω N ) when the incoming frequency is identical to the WEC’s natural frequency and increases substantially at frequencies away from the natural frequency.

2.6.2. A Fixed PTO Damping

Although using a frequency-dependent optimal PTO damping coefficient b ˜ P T O could theoretically enhance power extraction, adjusting the PTO damping in real sea conditions based on the incoming wave frequency is often impractical. Moreover, this approach requires a large PTO device, as PTO damping should cope with variations over a wide range, from relatively small values near the natural frequency to significantly larger values at off-resonant frequencies. Hence, it is more practical to maintain a fixed value of PTO damping coefficient, regardless of incident wave frequencies. For varying PTO damping belonging to the range of PTO damping values [39,44] that are suitable for the available magnitude of the PTO device, we calculate the corresponding extracted power under irregular wave conditions and select the PTO damping value that yields the maximum power. In a fixed PTO damping approach, an increase in the PTO damping leads to a reduction in heave motion, with this reduced heave motion being converted into absorbed power. However, the extracted power initially increases with PTO damping but eventually reaches a maximum and then begins to decrease, despite further increases in PTO damping.

2.7. Techno-Economic Metrics

Techno-economic metrics integrate technical performance and economic considerations to evaluate the cost-effectiveness of WEC configurations, with the goal of minimizing energy production costs while maximizing wave energy capture. As highlighted in [23,24], the device accounts for approximately 50% of the total cost of a WEC system, while the PTO contributes around 20%. The remaining costs are attributed to the mooring system, installation, and electrical and mechanical components. Therefore, in this study, two techno-economic metrics are employed, one representing the device cost and the other representing the PTO cost, as these are the major contributors to the overall cost of a WEC.
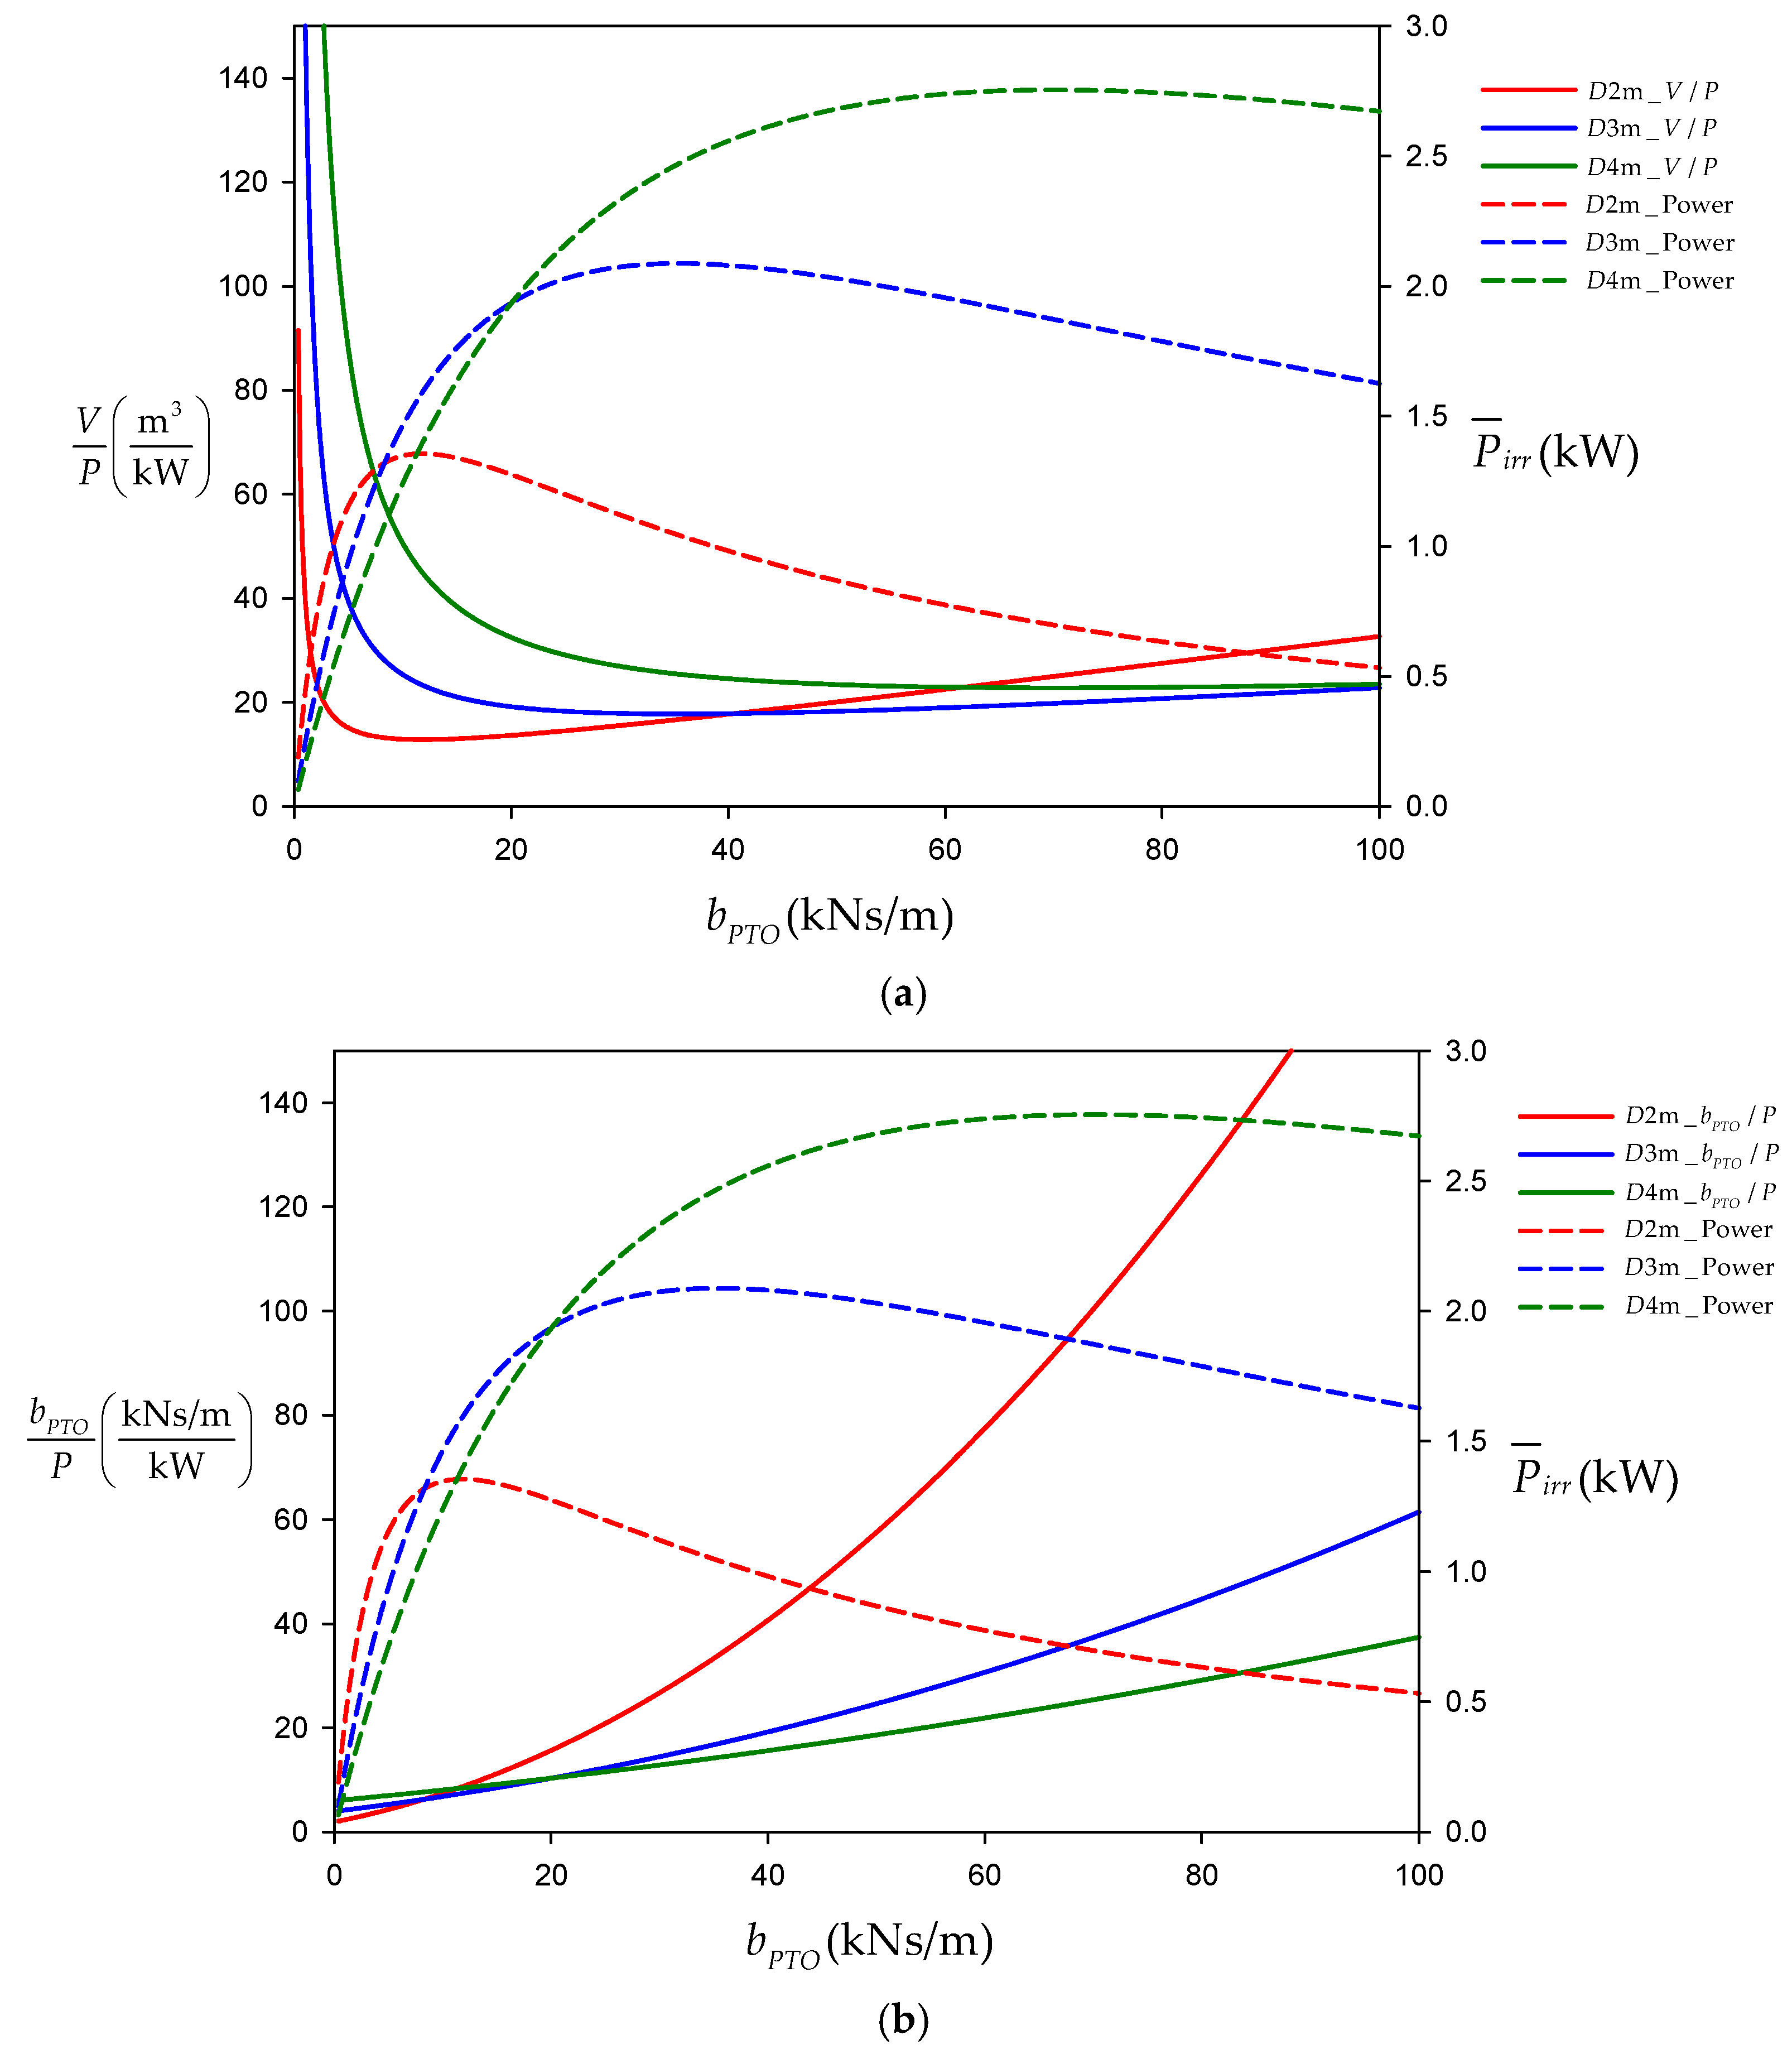
The first metric [29], representing the device cost, is defined as the ratio of the WEC’s submerged volume to its extracted power.
V P = WEC s   submerged   volume   ( m 3 ) Power   capture   ( kW )
The submerged volume of the WEC serves as a surrogate for its manufacturing cost. A higher value of this metric indicates higher fabrication costs for producing a unit of electricity.
This study introduces a second metric, representing the PTO cost, which is defined as the ratio of the PTO damping coefficient to the extracted power of the WEC.
b P T O P = PTO   damping   coefficient   ( kNs / m ) Power   capture   ( kW )
The PTO damping coefficient serves as an indicator of the PTO system’s size and power capacity. The cost function and metrics for the PTO system proposed in [24] indicate that the cost is proportional to the power size of the PTO. A higher value of PTO damping coefficient generally corresponds to higher power capacity, with the ability to resist larger forces and absorb more energy, implying the need for stronger components, a larger control system, and increased material usage. The PTO damping coefficient serves as a surrogate for the size and power capacity of the PTO, and, consequently, the PTO cost. Therefore, a higher value of this metric indicates that a larger and more expensive PTO system is required to extract a unit of electricity.

2.8. Weighted Sum Model (WSM)

The two techno-economic metrics can be combined by assigning weights according to their respective contributions to the total cost of the WEC. This is achieved using the weighted sum model (WSM), which incorporates weighting factors to represent the relative contribution of each metric. The WSM is a widely used and straightforward multi-criteria decision-making method that evaluates multiple alternatives based on a set of decision criteria. These criteria represent the attributes or factors considered during the evaluation process. In the present study, the two techno-economic metrics serve as the decision criteria. Each criterion may have a different level of importance or weight, depending on the specific context. The alternatives refer to the different options or solutions under consideration, with each being evaluated based on how well it satisfies the defined criteria. Weighting assigns a relative level of importance to each criterion, reflecting its significance in the decision-making process. Scoring involves assessing each alternative against these criteria, producing numerical values that indicate how effectively each alternative meets the respective criterion. Finally, the scores and weights are combined through aggregation to produce an overall evaluation for each alternative. The formula is provided below:
S i = w 1 V P i + w 2 b P T O P i
where S i is the overall score of the alternative i , w 1 is the weighting factor for V P , w 2 is the weighting factor for b P T O P , and V P i and b P T O P i are the normalized values of alternative i . The normalization is performed using the MinMax Scaler, as given below:
X scale = X X min X max X min ( max min ) + min
where ‘min’ and ‘max’ denote the minimum and maximum values of the input feature range. For each feature, the minimum value is scaled to 0 and the maximum to 1, with all other values proportionally adjusted to lie between 0 and 1. This normalization procedure is consistently applied across all variables.
As mentioned, the weighting factors are assigned according to their respective contributions to the overall cost structure of the WEC. The techno-economic metric based on the WEC’s submerged volume represents the device cost, whereas the metric based on the PTO damping coefficient corresponds to the PTO cost. The device cost accounts for about 50%, and the PTO cost accounts for about 20% of the overall cost of the WEC. The remaining contributions correspond to the mooring system, installation, and electrical and mechanical components [23,24]. The present techno-economic analysis focuses only on the device and PTO cost. Therefore, the weighting factors are assigned by normalizing these percentage contributions to a 100% scale, resulting in a weight of w 1 = 50 % / ( 50 % + 20 % ) for the device cost and w 2 = 20 % / ( 50 % + 20 % ) for the PTO cost, respectively.
The overall score ( S i ) defined in Equation (17) represents the normalized cost of extracting a unit of power, incorporating the respective contributions of the device and PTO costs to the total cost of the WEC. Therefore, a lower score indicates a more cost-effective solution.

2.9. Parameters for Analysis

Herein, we consider a prototype WEC, which is exposed to unidirectional irregular waves characterized by a JONSWAP spectrum with a significant wave height ( H 1 / 3 ) of 1 m and a peak period of ( T P ) of 5 s. In the present analysis, a few parametric variations are considered to see the influence of variations and thereby identify the optimal PTO system frame configuration and cost-effective solutions. The analysis considered different diameters of WEC ( D ), which are 2 m, 3 m, and 4 m, with corresponding drafts ( d ) of 5.55 m, 5.25 m, and 5 m, and mass ( m ) of 17,872 kg, 38,038 kg, and 64,403 kg, respectively. These drafts are selected to tune the heave natural period of WEC, aligning it with the peak period of the wave spectrum. This ensures that the heave motion is maximized at the peak frequency where wave energy is most concentrated. The WECs are placed at a water depth ( h ) of 10 m. The non-dimensional damping factors ( κ ) to obtain viscous damping are 0.0289, 0.0455, and 0.0536 for 2 m, 3 m, and 4 m, respectively. These values are from our earlier work [35], which employed a validated CFD-based heave free-decay test. The length of the different segments of actuating frames can be varied to identify the optimal configurations. The length of the actuating arm connecting the vertical seawall and the WEC ( L w a l l ) is varied in increments of D , 1.25 D , 1.50 D , 1.75 D , 2 D . These variations range from the minimum necessary distance to a sufficiently distant placement of the WEC. The position of the hinged joint connecting the PTO system frame to the actuating arm ( L 2 ) is varied within a range of 0.25 L w a l l to 0.75 L w a l l . This range represents practical hinge positions, spanning from near the fixed end of the actuating arm to a position closer to the freely moving WEC. The vertical distance between the hinges of the PTO system frame and the actuating arm ( L 1 ) is fixed at 0.50 L w a l l to maintain a practical geometric configuration.

2.10. Techno-Economic Analysis and PTO Optimization

The present analysis consists of two parts. The first part focuses on optimizing the PTO system frame to maximize power extraction under irregular wave conditions with various WEC diameters and the lengths of different segments of the PTO system frames. The optimal PTO damping method, as described in Section 2.6.1, was utilized for this analysis.
Once the optimal configuration of the PTO system is fixed, the second part focuses on a techno-economic analysis by varying the PTO damping across different WEC diameters to identify the most cost-effective solutions. The fixed PTO damping approach described in Section 2.6.2 is applied for this part of the analysis. As explained before, adjusting the PTO damping according to the incoming wave frequency in irregular waves is impractical. To comprehend the effect of the PTO damping, we calculate the extracted power with the extent of variation differing across WEC diameters for each PTO damping within the prescribed range. These variations of the extracted power and geometry of a WEC provide a basis for conducting a techno-economic analysis aimed at identifying cost-effective configurations, considering different WEC diameters and PTO damping.
This techno-economic analysis employs the weighted sum model (WSM) within the multi-criteria decision analysis (MCDA) framework to combine the techno-economic metrics representing device cost and PTO cost. Here, the variation in PTO damping and the corresponding extracted power produces a results database consisting of multiple entries, each containing a PTO damping value and its associated extracted power. This data set provides a series of alternatives for analysis (see Section 2.8). These values are normalized across different WEC diameters, allowing the overall score to be plotted against the range of PTO damping values for comparing cost-effective configurations among the various WEC diameters.

3. Results and Discussions

The numerical results of the hydrodynamic parameters, which were calculated using WAMIT with the image method to account for the influence of the vertical seawall, were combined with viscous damping from CFD simulation and the equivalent PTO damping. These combined parameters were then used to compute the heave motion of the WEC and the power extracted by the PTO system under irregular wave conditions, as described in the methodology. MATLAB R2025a was used as the main computational platform to integrate the parameters obtained from WAMIT with the image method, viscous damping from CFD, and the equivalent PTO damping, for calculating the heave response of the WEC, along with the extracted power. These outputs were then used to calculate the associated techno-economic metrics across various scenarios under irregular waves. The two techno-economic metrics, representing device cost and PTO cost, were combined using the WSM within the MCDA framework. This approach facilitated parametric analysis based on varying WEC diameters, the segment lengths of the actuating frames, and actual PTO damping values.

3.1. Optimal Hinge Position

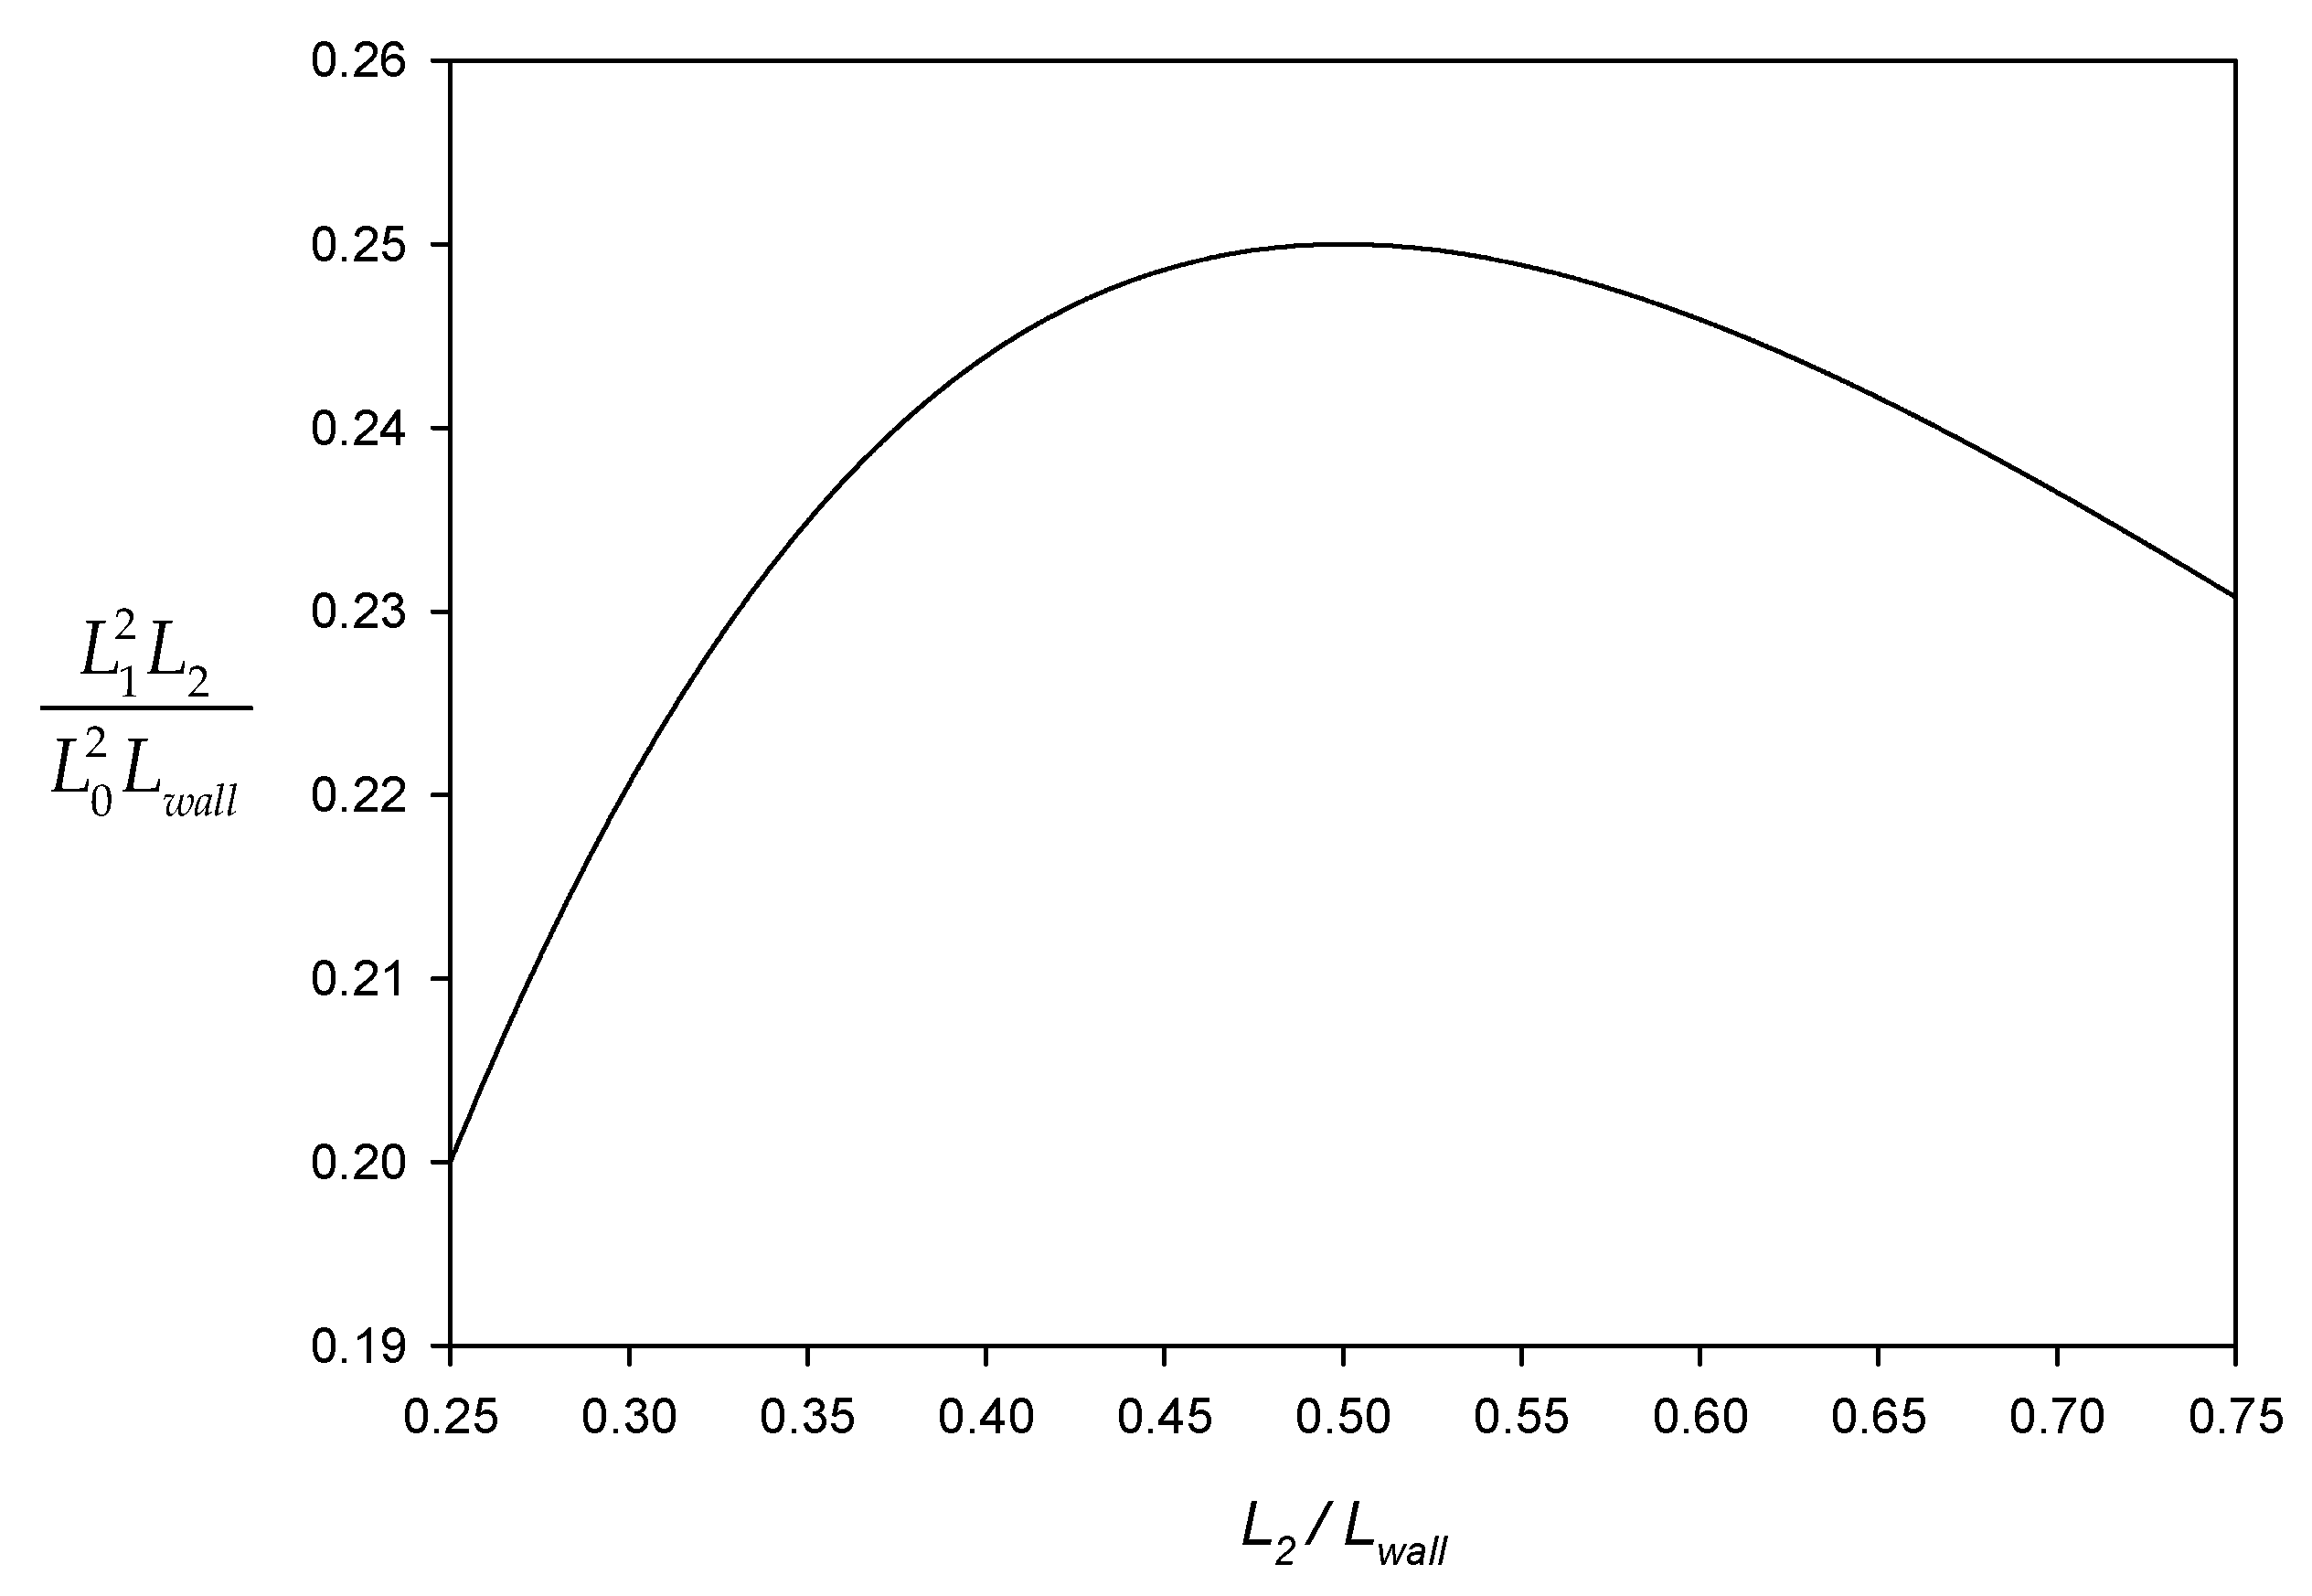
The optimal position ( L 2 ) of the hinge joint connecting the PTO system frame corresponds to the geometric configuration that maximizes the geometric factor ( L 1 2 L 2 L 0 2 L w a l l ). This maximization minimizes the actual PTO damping b P T O required to achieve the desired equivalent PTO damping b P T O according to Equation (8). Figure 4 illustrates the variation of the geometric factor with respect to the different positions of the hinge joint along the actuating arm. The results indicate that the geometric factor is relatively lower when the hinge is positioned near the fixed end. As the hinge moves away from the wall, the geometric factor gradually increases, reaching its maximum at the midpoint of the actuating arm, and then starts to decrease as the hinge position approaches the free end connected to the WEC. This implies that the real PTO damping required to achieve the desired equivalent PTO damping is relatively high when the hinge is near the fixed end, decreases to a minimum at the midpoint of the actuating arm, and then increases again as the hinge approaches the WEC. Based on the results, the hinge position situated at the midpoint of the actuating arm minimizes the actual PTO damping required to achieve the equivalent PTO damping. Therefore, the optimal hinge position is fixed at L 2 = 0.50 L w a l l .

3.2. Optimal Arm Length

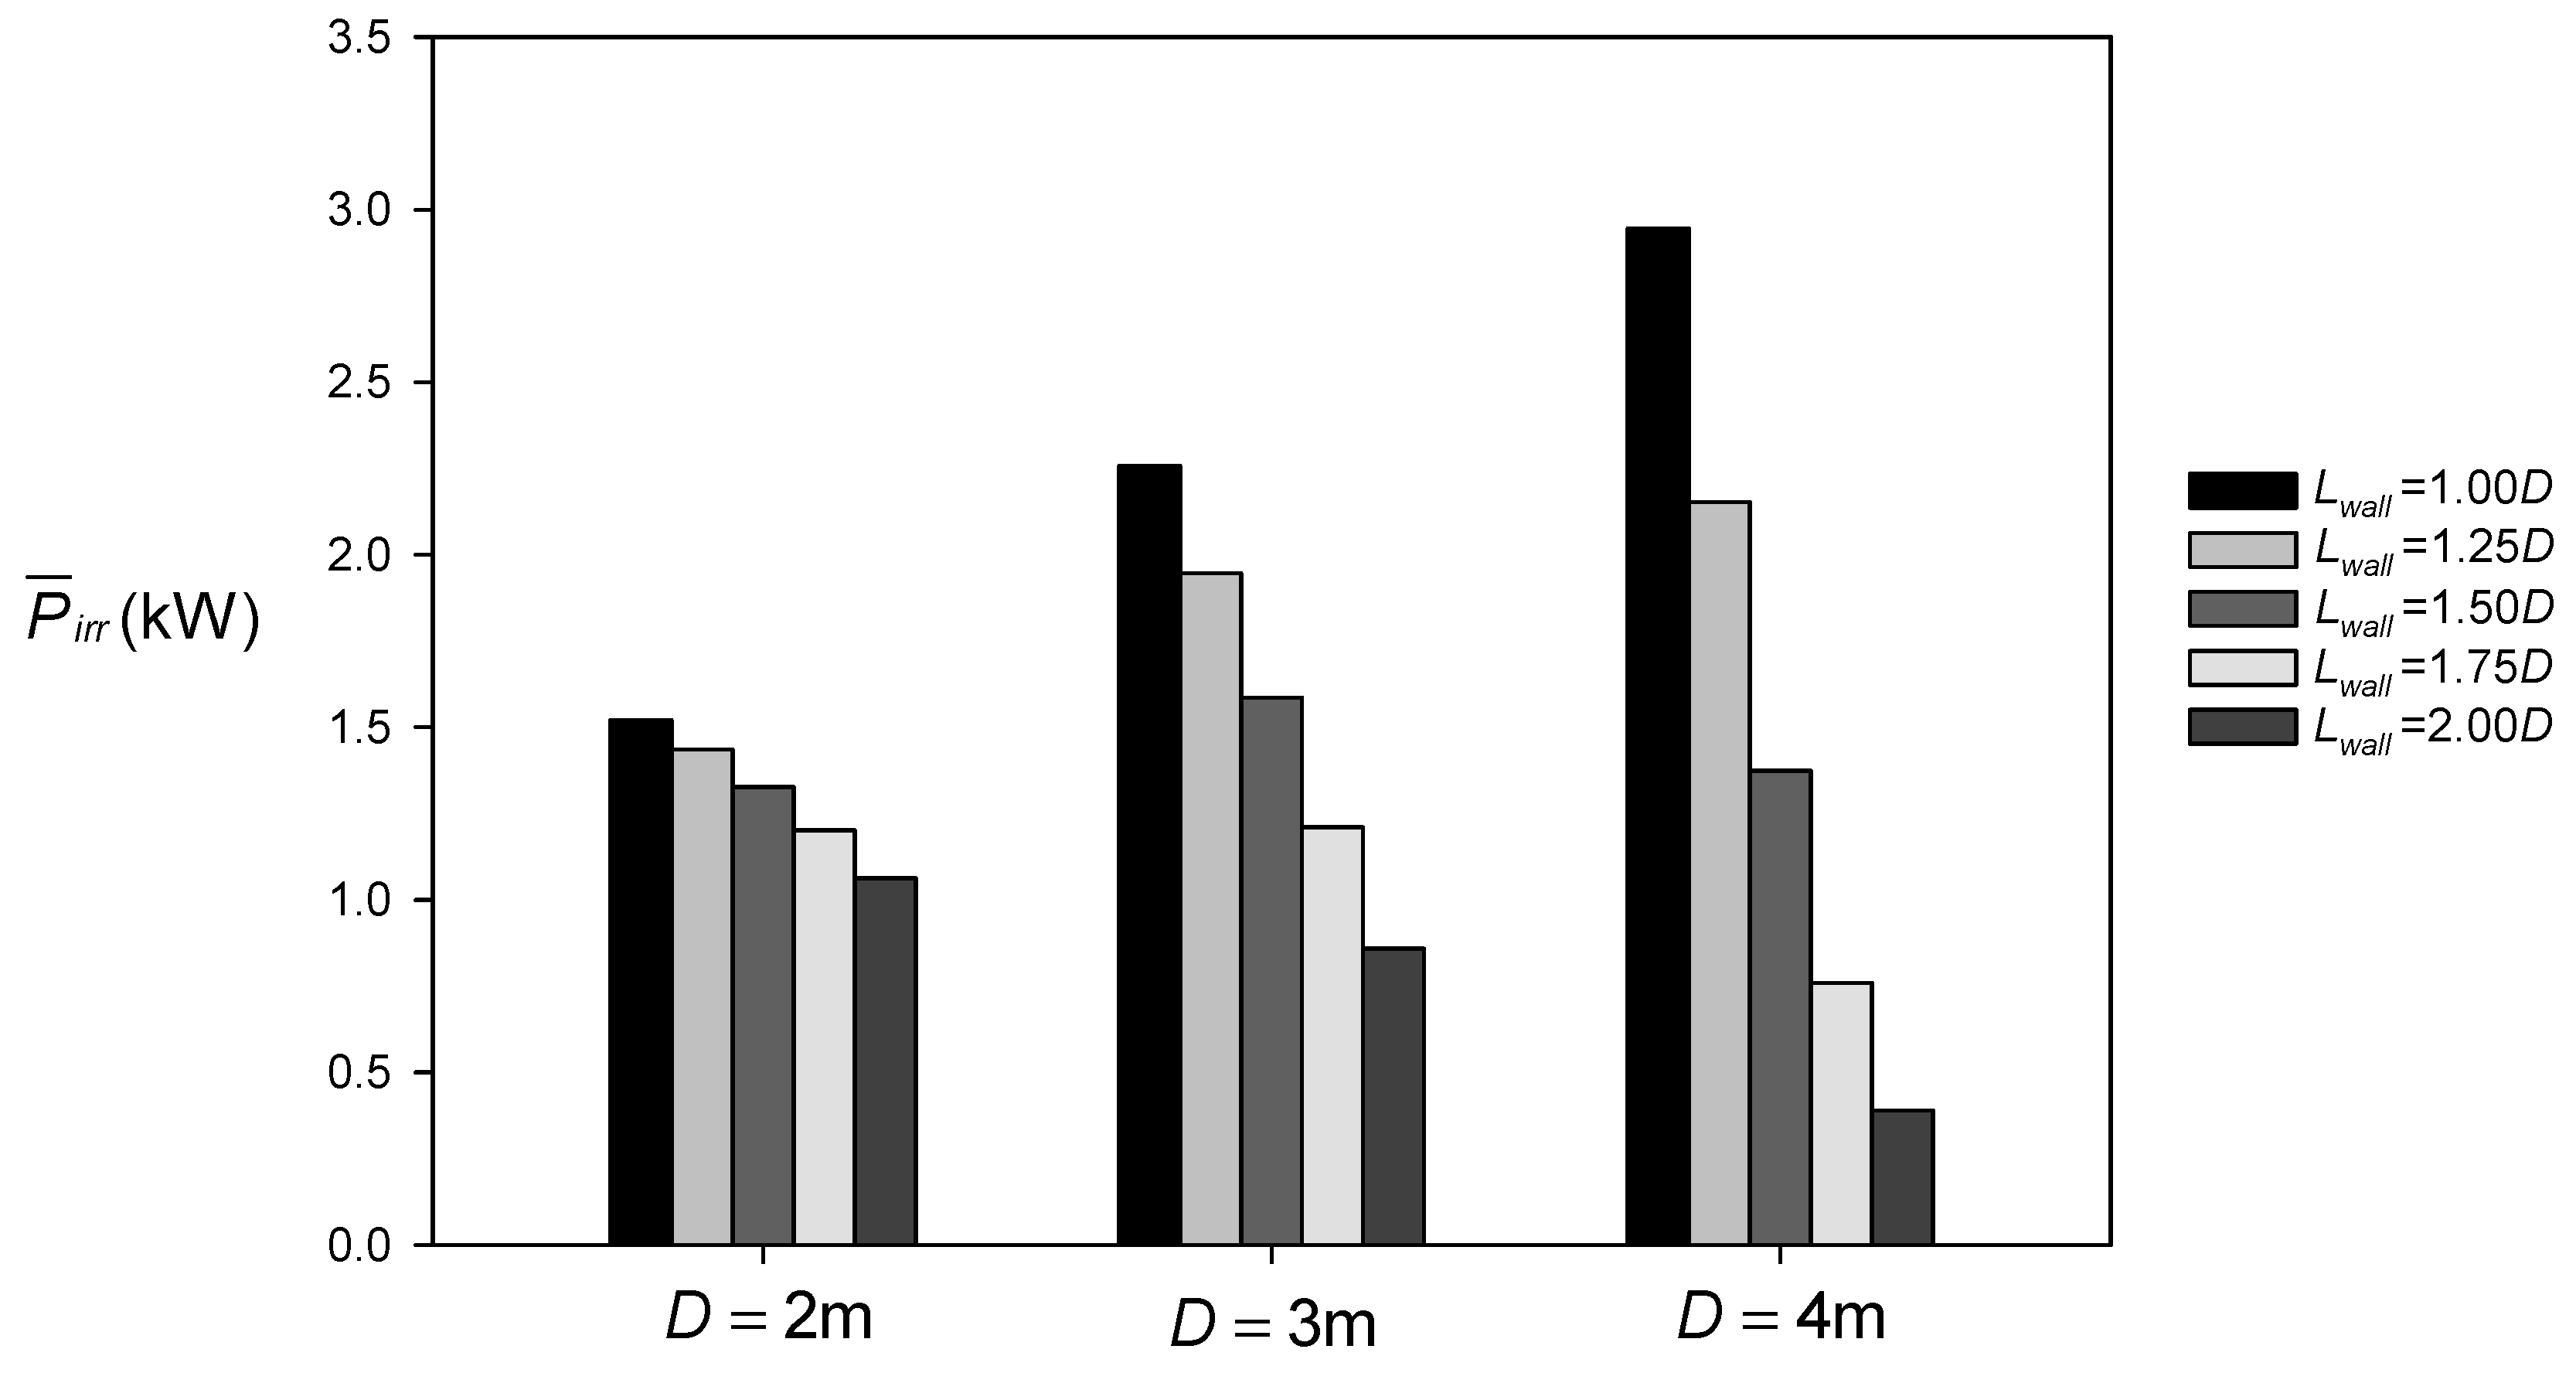
Using the optimal hinge position, the extracted power under irregular wave conditions was calculated for various actuating arm lengths ( L w a l l ) based on the optimal PTO damping approach. The results are graphically illustrated in Figure 5 for each WEC diameter. Herein, we used frequency-dependent optimal PTO damping coefficients.
The bar charts show that the actuating arm lengths that placed the WEC closer to the vertical seawall yielded higher power extraction across all WEC diameters. This result is largely influenced by the hydrodynamic interaction between the WEC and the seawall. As demonstrated in our previous study [35] and as supported by other works [14,15,16,17,18], the standing waves created by the reflection of incident waves from the seawall, combined with the trapped waves between the WEC and the seawall, significantly amplify the wave field around the WEC, particularly at closer distances. In the present study, this effect was systematically investigated by varying the distance between the WEC and the vertical seawall using a PTO system composed of frame structures, in which the actuating arm lengths were adjusted to control the spacing. The magnitude of extracted power increased significantly with the diameter of the WEC. Larger-diameter WECs, with their capacity to accommodate a larger PTO and its higher surface area, enhance power extraction by effectively trapping waves between the seawall and the WEC and interacting with incoming wave energy. Power extraction decreases as the WEC moves away from the wall, with the reduction being significantly higher for larger WEC diameters. Since the distance of the WEC from the wall is determined by its diameter, the larger diameter of a WEC is positioned slightly farther from the wall. This positioning likely reduces hydrodynamic interaction between the WEC and the seawall, leading to a reduction in the wave field around the WEC and increasing the likelihood of it falling within the destructive interference pattern of standing waves. Based on the analysis, the optimal actuating arm length corresponded to the configuration that placed the WEC nearest to the vertical seawall ( L w a l l = 1.00 D ), across different diameters of WEC.

3.3. Techno-Economic Analysis

The optimal configuration of the PTO system placed the hinge joint of the PTO frame at the midpoint of the actuating arm, with the actuating arm positioning the WEC closer to the seawall, as in Section 3.1 and Section 3.2. Based on this optimal configuration, a subsequent techno-economic analysis was carried out. Figure 6 shows the techno-economic metrics, based on the WEC submerged volume ( V / P ) representing the device cost and PTO damping ( b P T O / P ) representing the PTO cost, along with the corresponding extracted power, plotted over a range of PTO damping coefficients. Lower scores in these metrics are associated with better cost-effectiveness. The techno-economic metric representing the device cost, shown in Figure 6a, exhibits a steep decline in the initial range of PTO damping values. It then stabilizes near its minimum level, before gradually increasing with further increases in PTO damping. This trend is consistent across all WEC diameters. The corresponding extracted power shows a similar pattern: it rises sharply at lower PTO damping values, reaches a peak, and then gradually decreases as PTO damping continues to increase. At a lower range of PTO damping, the smaller diameter of the WEC demonstrates greater cost-effectiveness, as indicated by a lower metric value. However, as PTO damping increases, the WECs with a larger diameter become more cost-effective, with their metric scores being comparable between the 3-m and 4-m diameters. The WECs with a smaller diameter reach their maximum power at lower PTO damping values, whereas as the WEC diameter increases, the ability to accommodate higher PTO damping and absorb more power results in greater power extraction at higher damping values, with favorable cost-effectiveness scores. Figure 6b shows the techno-economic metric representing PTO cost, along with the corresponding extracted power. The metric score is lowest for the 2 m WEC at lower PTO damping values, but increases sharply as the PTO damping value increases. A similar trend is observed for the 3 m and 4 m WECs. As with the previous metric, the WECs with a smaller diameter demonstrate better cost-effectiveness at lower PTO damping values, while the WECs with a larger diameter become more cost-effective as the damping value increases.
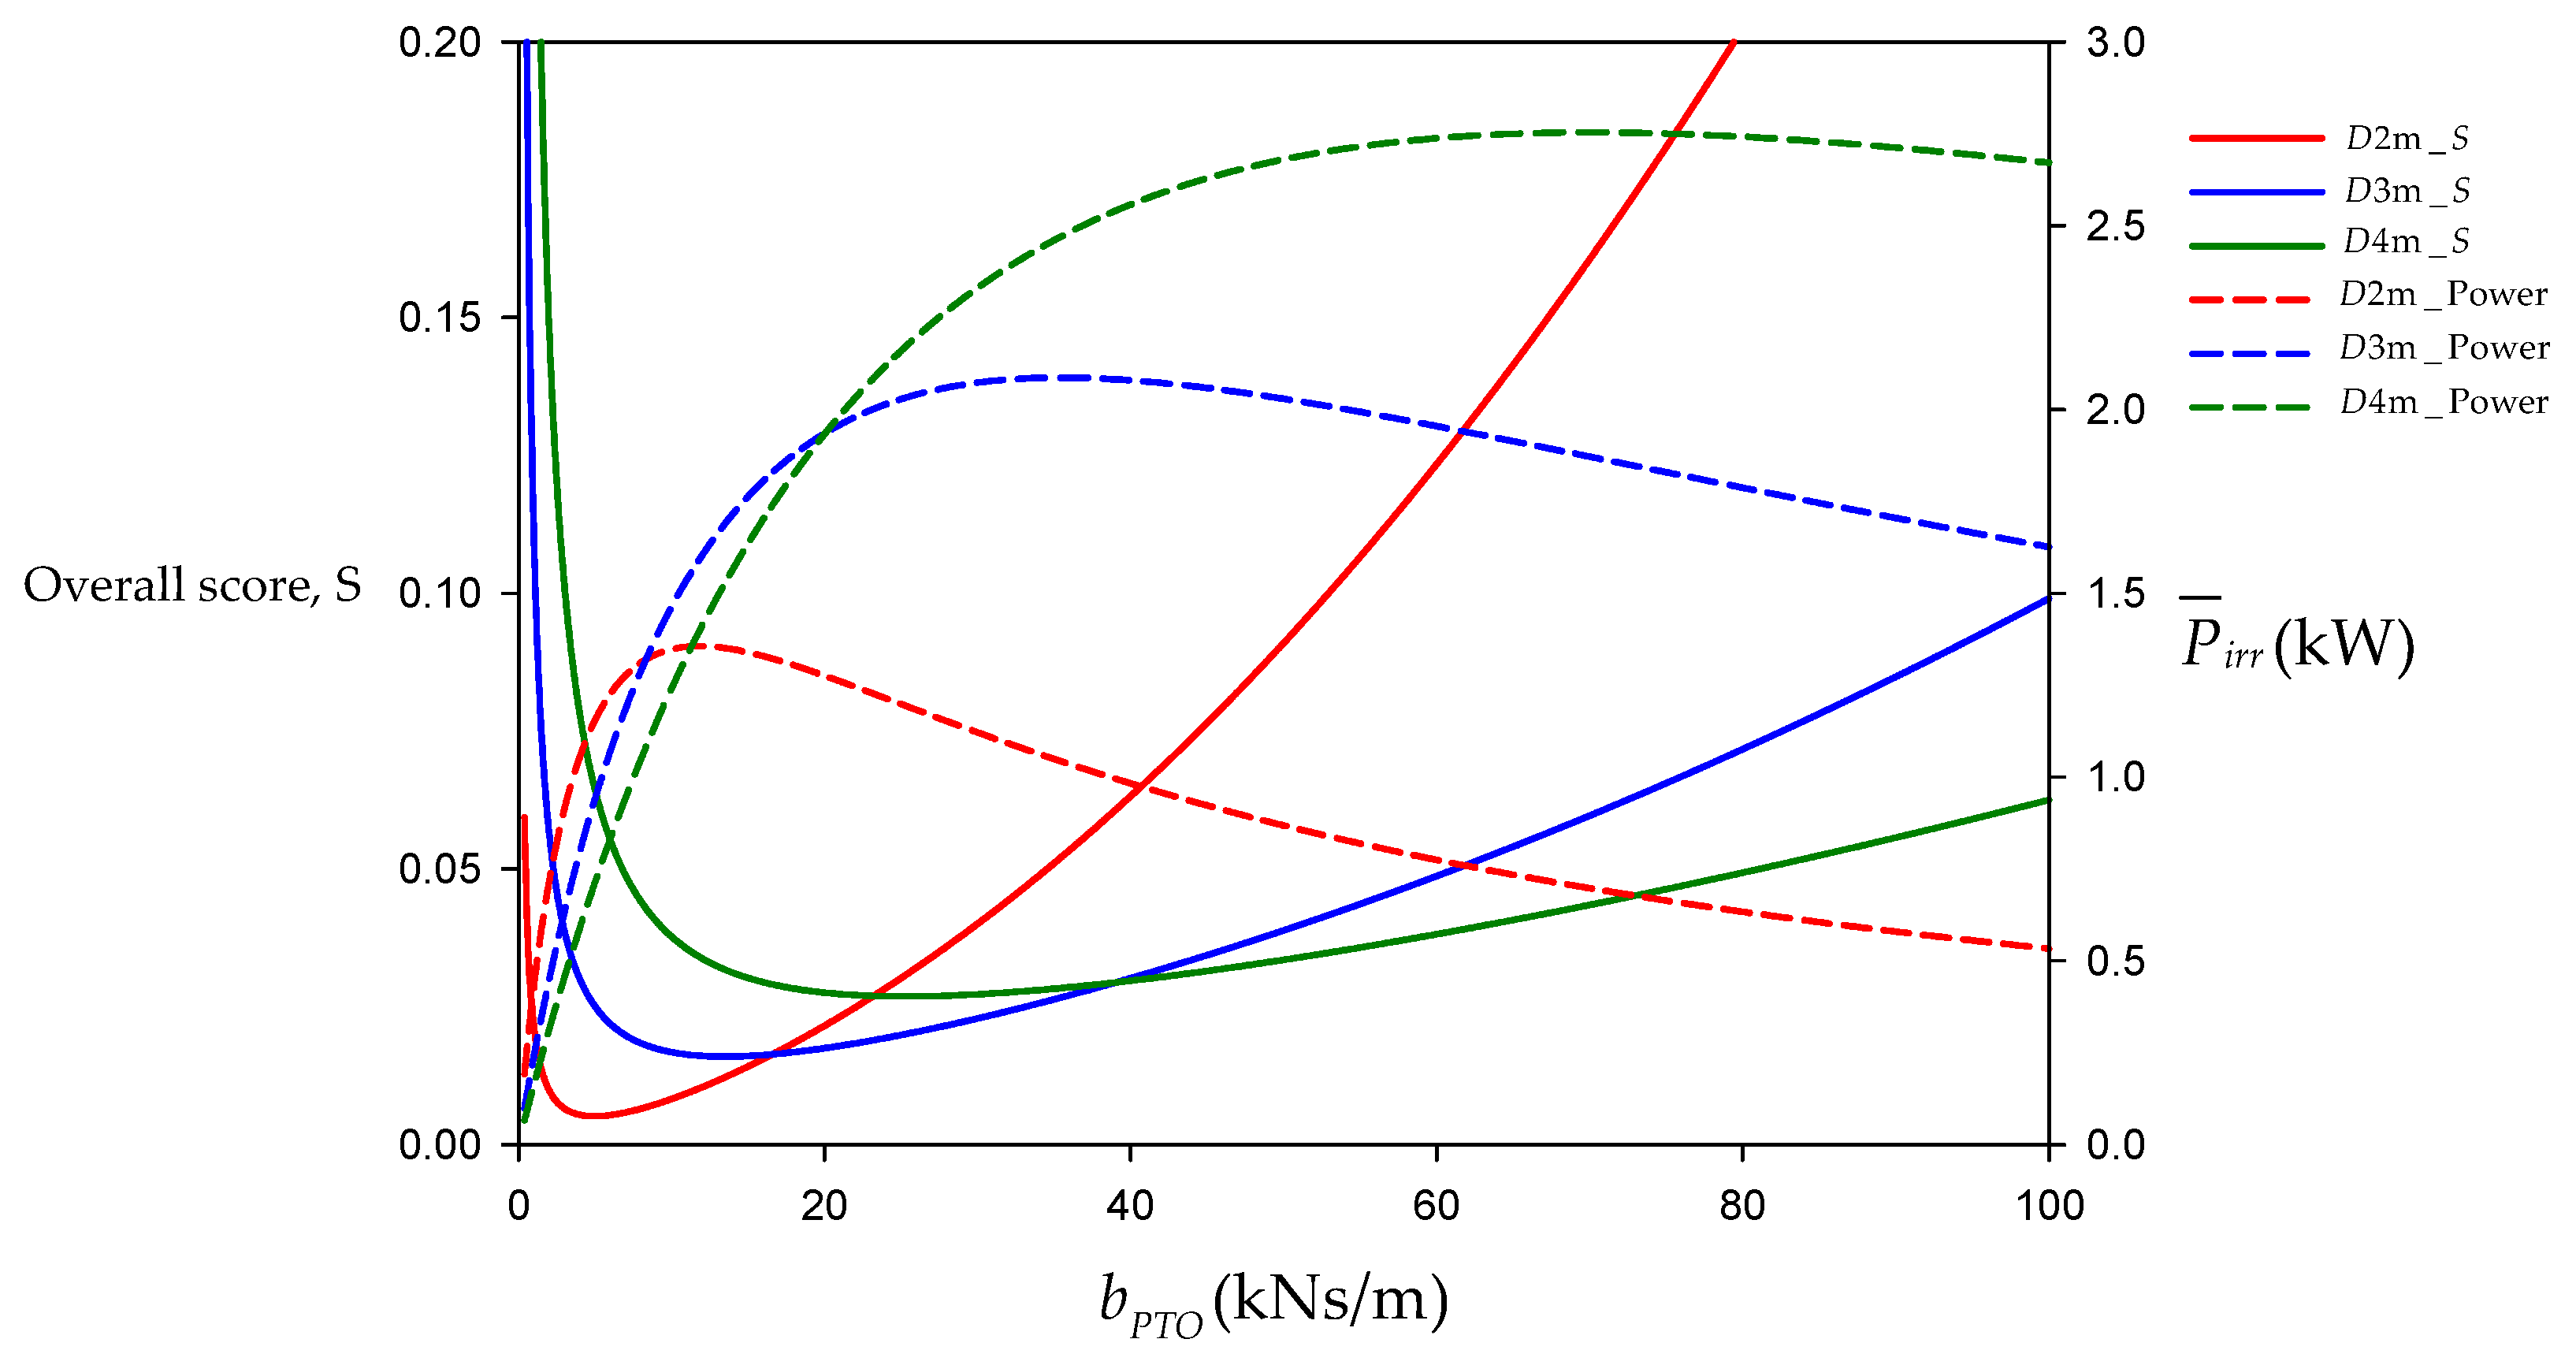
The two techno-economic metrics, representing device cost and PTO cost, were combined using the WSM within the MCDA framework. The resulting overall score, as given in Equation (17), is plotted across a range of PTO damping values for various WEC diameters, along with the corresponding extracted power, in Figure 7. Across all WEC diameters, the overall score initially drops sharply at low PTO damping values, levels off near its minimum, and then increases significantly with an increase in PTO damping. The overall score curves are strongly influenced by the relative weighting of the two metrics, which is particularly evident at the lower and upper extremes of the PTO damping spectrum. When comparing the overall score among different WEC diameters across the range of the PTO damping coefficient and the corresponding extracted power, it can be observed that around the peak extracted power of each WEC diameter, that particular diameter yields the lowest overall score compared to the others at the same PTO damping values, although not necessarily the lowest score for that particular diameter. However, the overall scores corresponding to peak extracted power are not significantly different than the lowest scores of that particular diameter. For instance, the 2 m WEC, when around its maximum power, achieves the lowest score among all diameters at the same PTO damping values. The lowest overall score occurs slightly away from the peak extracted power, but the difference is not large. Similarly, the 3 m and 4 m WECs, when around their respective peak power levels, exhibit the lowest scores among WECs, highlighting the balance between performance and cost-effectiveness. The overall score curves reveal that the WEC with the smallest diameter achieves its lowest score within a relatively narrow range of PTO damping, whereas increasing the WEC diameter results in a relatively broader and flatter score profile, indicating a wider range of PTO damping values associated with favorable cost-effectiveness among WECs. The WEC with the smallest diameter attains the lowest score among all configurations, indicating a highly cost-effective solution. However, this implies that multiple small units may be required to achieve a desirable total power output. Conversely, larger WECs demonstrate improved cost-effectiveness at higher PTO damping levels, where their ability to accommodate larger PTO systems and greater power absorption becomes advantageous.

3.4. Power Take-Off Optimization

Based on the overall score curves, the optimal PTO damping value for each WEC diameter is identified as the value that results in the lowest overall score, indicating the most cost-effective configuration and reflecting the best balance between power extraction and cost. The optimal damping value represents the point at which the combined effect of device and PTO costs is minimized, relative to the power output. Table 1 summarizes the optimal PTO damping values, along with the corresponding extracted power for each WEC diameter. As the WEC diameter increases, both the required PTO damping and the extracted power also increase. However, the increase in power is smaller compared to the increase in damping. This suggests that while larger WECs can generate more power, smaller WECs may be more efficient and cost-effective, especially when considering power output relative to PTO size.

4. Conclusions

The nearshore installation of wave energy converters (WECs) offers several advantages, including easier access, lower maintenance requirements, reduced transmission costs, and the potential for integration with existing infrastructure, all of which contribute to cost savings and offer improved commercial viability. This study focuses on a techno-economic analysis and power take-off (PTO) optimization for a WEC that is placed adjacent to a vertical seawall in irregular wave conditions. The PTO system, connected via frames and hinges, is integrated with the seawall and extends outward to the oscillating vertical cylinder. Hydrodynamic calculations were performed using WAMIT, incorporating the seawall effect with the image method. The analysis considered varying WEC diameters, different lengths of the PTO system frame, and a range of PTO damping values. The first step focused on optimizing the geometric configuration of the PTO system. The results show that positioning the WEC closer to the seawall, while placing the hinge joint of the PTO system frame at the midpoint of the actuating arm, leads to higher power extraction. This improvement is primarily attributable to the hydrodynamic interaction between the WEC and the seawall. Standing waves reflected from the seawall, along with trapped waves between the WEC and the seawall, significantly amplify the wave field around the WEC, especially when it is placed near the seawall. Once the optimal geometric configuration of the PTO system frame was established, the PTO damping was varied to conduct a techno-economic analysis. This study combined two techno-economic metrics representing device cost and PTO cost, using the weighted sum model within a multi-criteria decision analysis framework to evaluate cost-effectiveness across various WEC diameters and PTO damping values. Smaller-diameter WECs achieved cost-effectiveness over a narrow PTO damping range but may require multiple units for higher power output. Larger WECs, while demanding higher PTO damping, demonstrated improved cost-effectiveness at these higher damping levels, due to their greater power absorption capacity. Optimal PTO damping values corresponding to the lowest overall scores were identified for each WEC diameter, showing that although power extraction increases with size, the relative increase in PTO damping is greater, indicating that smaller WECs may offer more efficient power generation relative to PTO system size.
The present study developed a novel framework for techno-economic analysis and the PTO optimization of a WEC placed adjacent to a vertical seawall, connected via frame-based PTO systems, within a multi-criteria decision analysis (MCDA) approach. A case study was presented, involving a parametric analysis of varying WEC diameters, lengths of segments of PTO system frames, and PTO damping values with a specific wave condition. This study introduced a new metric representing the PTO cost, which is one of the major contributors to the overall WEC system cost. These findings, especially for prototype WECs under irregular wave conditions, offer valuable insights for optimizing WEC configurations to achieve a balance between performance and cost. While this preliminary analysis, based on linear potential theory and indicative cost estimates, provides a useful initial estimate, it should be followed by more detailed and comprehensive investigations. The methodological framework is flexible and can be extended to accommodate other WEC configurations, including different hull shapes (e.g., spherical, conical, and hourglass), varying environmental conditions, WEC arrays, nearshore and offshore deployments, and alternative PTO systems.

Author Contributions

Conceptualization, S.K.N.; methodology, S.K.N.; software, S.K.N.; validation, S.K.N.; formal analysis, S.K.N.; investigation, S.K.N.; writing—original draft preparation, S.K.N.; writing—review and editing, I.H.C.; supervision, I.H.C.; funding acquisition, I.H.C. All authors have read and agreed to the published version of the manuscript.

Funding

This research was supported by Basic Science Research Program through the National Research Foundation of Korea (NRF) funded by the Ministry of Education (NRF-2022R1I1A3066608) and funded by the Ministry of Oceans and Fisheries, Korea (20160240).

Data Availability Statement

Data are contained within the article.

Conflicts of Interest

The authors declare no conflicts of interest.

Abbreviations

The following abbreviations are used in this manuscript:
ANNArtificial neural network
CFDComputational fluid dynamics
LCoELevelized cost of energy
MCDAMulti-criteria decision analysis
PTOPower take-off
RAOResponse amplitude operator
TPLTechnology performance level
TRLTechnology readiness level
WECWave energy converter
WSMWeighted sum model

References

  1. Mustapa, M.A.; Yaakob, O.B.; Ahmed, Y.M.; Rheem, C.K.; Koh, K.K.; Adnan, F.A. Wave energy device and breakwater integration: A review. Renew. Sustain. Energy Rev. 2017, 77, 43–58. [Google Scholar] [CrossRef]
  2. Reabroy, R.; Zheng, X.; Zhang, L.; Zang, J.; Yuan, Z.; Liu, M.; Sun, K.; Tiaple, Y. Hydrodynamic response and power efficiency analysis of heaving wave energy converter integrated with breakwater. Energy Convers. Manag. 2019, 195, 1174–1186. [Google Scholar] [CrossRef]
  3. Henderson, R. Design, simulation, and testing of a novel hydraulic power take-off system for the Pelamis wave energy converter. Renew. Energy 2006, 31, 271–283. [Google Scholar] [CrossRef]
  4. Zheng, S.; Zhang, Y. Analysis for wave power capture capacity of two interconnected floats in regular waves. J. Fluids Struct. 2017, 75, 158–173. [Google Scholar] [CrossRef]
  5. Sun, P.; Hu, S.; He, H.; Zheng, S.; Chen, H.; Yang, S.; Ji, Z. Structural optimization on the oscillating-array-buoys for energy-capturing enhancement of a novel floating wave energy converter system. Energy Convers. Manag. 2021, 228, 113693. [Google Scholar] [CrossRef]
  6. Sheng, W.; Lewis, A. Power takeoff optimization for maximizing energy conversion of wave-activated bodies. IEEE J. Ocean. Eng. 2016, 41, 529–540. [Google Scholar] [CrossRef]
  7. Binh, P.C.; Dang, T.D.; Ahn, K.K. Assessment of a Hybrid Wind–Wave Energy Converter System in Nearshore Deployment. J. Mar. Sci. Eng. 2024, 12, 1093. [Google Scholar] [CrossRef]
  8. Ferri, F.; Ambühl, S.; Fischer, B.; Kofoed, J.P. Balancing power output and structural fatigue of wave energy converters by means of control strategies. Energies 2014, 7, 2246–2273. [Google Scholar] [CrossRef]
  9. Heo, S.; Koo, W. Dynamic response analysis of a wavestar-type wave energy converter using augmented formulation in Korean nearshore areas. Processes 2021, 9, 1721. [Google Scholar] [CrossRef]
  10. Hu, Y.; Yang, S.; He, H.; Chen, H. Influence of Central Platform on Hydrodynamic Performance of Semi-Submerged Multi-Buoy Wave Energy Converter. J. Mar. Sci. Eng. 2019, 8, 12. [Google Scholar] [CrossRef]
  11. Jusoh, M.A.; Ibrahim, M.Z.; Daud, M.Z.; Yusop, Z.M.; Albani, A. An estimation of hydraulic power take-off unit parameters for wave energy converter device using non-evolutionary NLPQL and evolutionary GA approaches. Energies 2020, 14, 79. [Google Scholar] [CrossRef]
  12. Sun, P.; He, H.; Chen, H.; Zhang, J.; Li, H. Sensitivity analysis of geometric characteristics on the cavity-buoy for energy capture efficiency enhancement of a semi-submersible floating-array-buoy wave energy converter system. Ocean Eng. 2024, 294, 116735. [Google Scholar] [CrossRef]
  13. Wang, Y.; Huang, S.; Xue, G.; Liu, Y. Influence of hydraulic PTO parameters on power capture and motion response of a floating wind-wave hybrid system. J. Mar. Sci. Eng. 2022, 10, 1660. [Google Scholar] [CrossRef]
  14. Loukogeorgaki, E.; Chatjigeorgiou, I.K. Hydrodynamic performance of an array of truncated cylinders in front of a vertical wall. Ocean Eng. 2019, 189, 106407. [Google Scholar] [CrossRef]
  15. Zhao, X.L.; Ning, D.Z.; Liang, D.F. Experimental investigation on hydrodynamic performance of a breakwater-integrated WEC system. Ocean Eng. 2019, 171, 25–32. [Google Scholar] [CrossRef]
  16. Zhang, C.; Ning, D. Hydrodynamic study of a novel breakwater with parabolic openings for wave energy harvest. Ocean Eng. 2019, 182, 540–551. [Google Scholar] [CrossRef]
  17. Konispoliatis, D.N.; Mavrakos, S.A.; Katsaounis, G.M. Theoretical evaluation of the hydrodynamic characteristics of arrays of vertical axisymmetric floaters of arbitrary shape in front of a vertical breakwater. J. Mar. Sci. Eng. 2020, 8, 62. [Google Scholar] [CrossRef]
  18. Konispoliatis, D.N.; Mavrakos, S.A. Wave power absorption by arrays of wave energy converters in front of a vertical breakwater: A theoretical study. Energies 2020, 13, 1985. [Google Scholar] [CrossRef]
  19. Pecher, A.; Kofoed, J.P. Handbook of Ocean Wave Energy; Springer Nature: Berlin/Heidelberg, Germany, 2017. [Google Scholar]
  20. Guo, B.; Ringwood, J.V. Geometric optimisation of wave energy conversion devices: A survey. Appl. Energy 2021, 297, 117100. [Google Scholar] [CrossRef]
  21. Sirigu, S.A.; Foglietta, L.; Giorgi, G.; Bonfanti, M.; Cervelli, G.; Bracco, G.; Mattiazzo, G. Techno-Economic optimisation for a wave energy converter via genetic algorithm. J. Mar. Sci. Eng. 2020, 8, 482. [Google Scholar] [CrossRef]
  22. Tan, J.; Polinder, H.; Laguna, A.J.; Wellens, P.; Miedema, S.A. The influence of sizing of wave energy converters on the techno-economic performance. J. Mar. Sci. Eng. 2021, 9, 52. [Google Scholar] [CrossRef]
  23. Têtu, A.; Fernandez Chozas, J. A proposed guidance for the economic assessment of wave energy converters at early development stages. Energies 2021, 14, 4699. [Google Scholar] [CrossRef]
  24. Giglio, E.; Petracca, E.; Paduano, B.; Moscoloni, C.; Giorgi, G.; Sirigu, S.A. Estimating the Cost of Wave Energy Converters at an Early Design Stage: A Bottom-UP Approach. Sustainability 2023, 15, 6756. [Google Scholar] [CrossRef]
  25. Guo, C.; Sheng, W.; De Silva, D.G.; Aggidis, G. A review of the levelized cost of wave energy based on a techno-economic model. Energies 2023, 16, 2144. [Google Scholar] [CrossRef]
  26. Giassi, M.; Göteman, M.; Thomas, S.; Engström, J.; Eriksson, M.; Isberg, J. Multi-parameter optimization of hybrid arrays of point absorber wave energy converters. In Proceedings of the 12th European Wave and Tidal Energy Conference (EWTEC), Cork, Ireland, 27–31 August 2017. [Google Scholar]
  27. David, D.R.; Kurniawan, A.; Wolgamot, H.; Hansen, J.E.; Rijnsdorp, D.; Lowe, R. Nearshore submerged wave farm optimisation: A multi-objective approach. Appl. Ocean Res. 2022, 124, 103225. [Google Scholar] [CrossRef]
  28. Yusov, M.A.; Thwaites, J.; Kurniawan, A.; Orszaghova, J.; Wolgamot, H. New cost-effectiveness metric for wave energy converters: Extensive database and comparisons. In Proceedings of the 14th European Wave and Tidal Energy Conference. Technical Committee of the European Wave and Tidal Energy Conference, Plymouth, UK, 5–9 September 2021; p. 2188-1-2188-10. [Google Scholar]
  29. He, Z.; Ning, D.; Gou, Y.; Zhou, Z. Wave energy converter optimization based on differential evolution algorithm. Energy 2022, 246, 123433. [Google Scholar] [CrossRef]
  30. Zhang, Y.; Zhao, Y.; Sun, W.; Li, J. Ocean wave energy converters: Technical principle, device realization, and performance evaluation. Renew. Sustain. Energy Rev. 2021, 141, 110764. [Google Scholar] [CrossRef]
  31. Cradden, L.; Kalogeri, C.; Barrios, I.M.; Galanis, G.; Ingram, D.; Kallos, G. Multi-criteria site selection for offshore renewable energy platforms. Renew. Energy 2016, 87, 791–806. [Google Scholar] [CrossRef]
  32. Natarajan, S.K.; Cho, S.; Cho, I.H. The Optimal Design of an Inclined Porous Plate Wave Absorber Using an Artificial Neural Network Model. Appl. Sci. 2025, 15, 4895. [Google Scholar] [CrossRef]
  33. Handoko, D.; Mesran, M.; Nasution, S.D.; Yuhandri, Y.; Nurdiyanto, H. Application of Weight Sum Model (WSM) in determining special allocation funds recipients. Int. J. Inform. Comput. Sci. 2017, 1, 31–35. [Google Scholar] [CrossRef]
  34. Pesode, P.; Barve, S.; Wankhede, S.V.; Jadhav, D.R.; Pawar, S.K. Titanium alloy selection for biomedical application using weighted sum model methodology. Mater. Today: Proc. 2023, 72, 724–728. [Google Scholar] [CrossRef]
  35. Natarajan, S.K.; Cho, I.H. Cost-Effective Optimization of an Array of Wave Energy Converters in Front of a Vertical Seawall. Energies 2023, 17, 128. [Google Scholar] [CrossRef]
  36. Babarit, A. Impact of long separating distances on the energy production of two interacting wave energy converters. Ocean Eng. 2010, 37, 718–729. [Google Scholar] [CrossRef]
  37. Cho, I.H.; Kim, M.H. Hydrodynamic performance evaluation of a wave energy converter with two concentric vertical cylinders by analytic solutions and model tests. Ocean Eng. 2017, 130, 498–509. [Google Scholar] [CrossRef]
  38. Zhou, B.Z.; Hu, J.J.; Sun, K.; Liu, Y.; Collu, M. Motion response and energy conversion performance of a heaving point absorber wave energy converter. Front. Energy Res. 2020, 8, 553295. [Google Scholar] [CrossRef]
  39. Natarajan, S.K.; Cho, I. New Strategy on Power Absorption of a Concentric Two-Body Wave Energy Converter. Energies 2023, 16, 3791. [Google Scholar] [CrossRef]
  40. Bhattacharyya, R. Dynamics of Marine Vehicles; John Wiley & Sons Incorporated: Hoboken, NJ, USA, 1978; Chapter 6. [Google Scholar]
  41. Newman, J.N. Marine Hydrodynamics, 40th Anniversary Edition; The MIT Press: London, UK, 2018; Chapter 6. [Google Scholar]
  42. Goda, Y. Statistical variability of sea state parameters as a function of a wave spectrum. Coast. Eng. Jpn. 1988, 31, 39–52. [Google Scholar] [CrossRef]
  43. Cho, I.H. Latching control technology for improvement of extracted power from wave energy converter. J. Korean Soc. Mar. Environ. Energy 2015, 18, 282–290. [Google Scholar] [CrossRef]
  44. Hong, Y.; Temiz, I.; Pan, J.; Eriksson, M.; Boström, C. Damping studies on PMLG-based wave energy converter under oceanic wave climates. Energies 2021, 14, 920. [Google Scholar] [CrossRef]
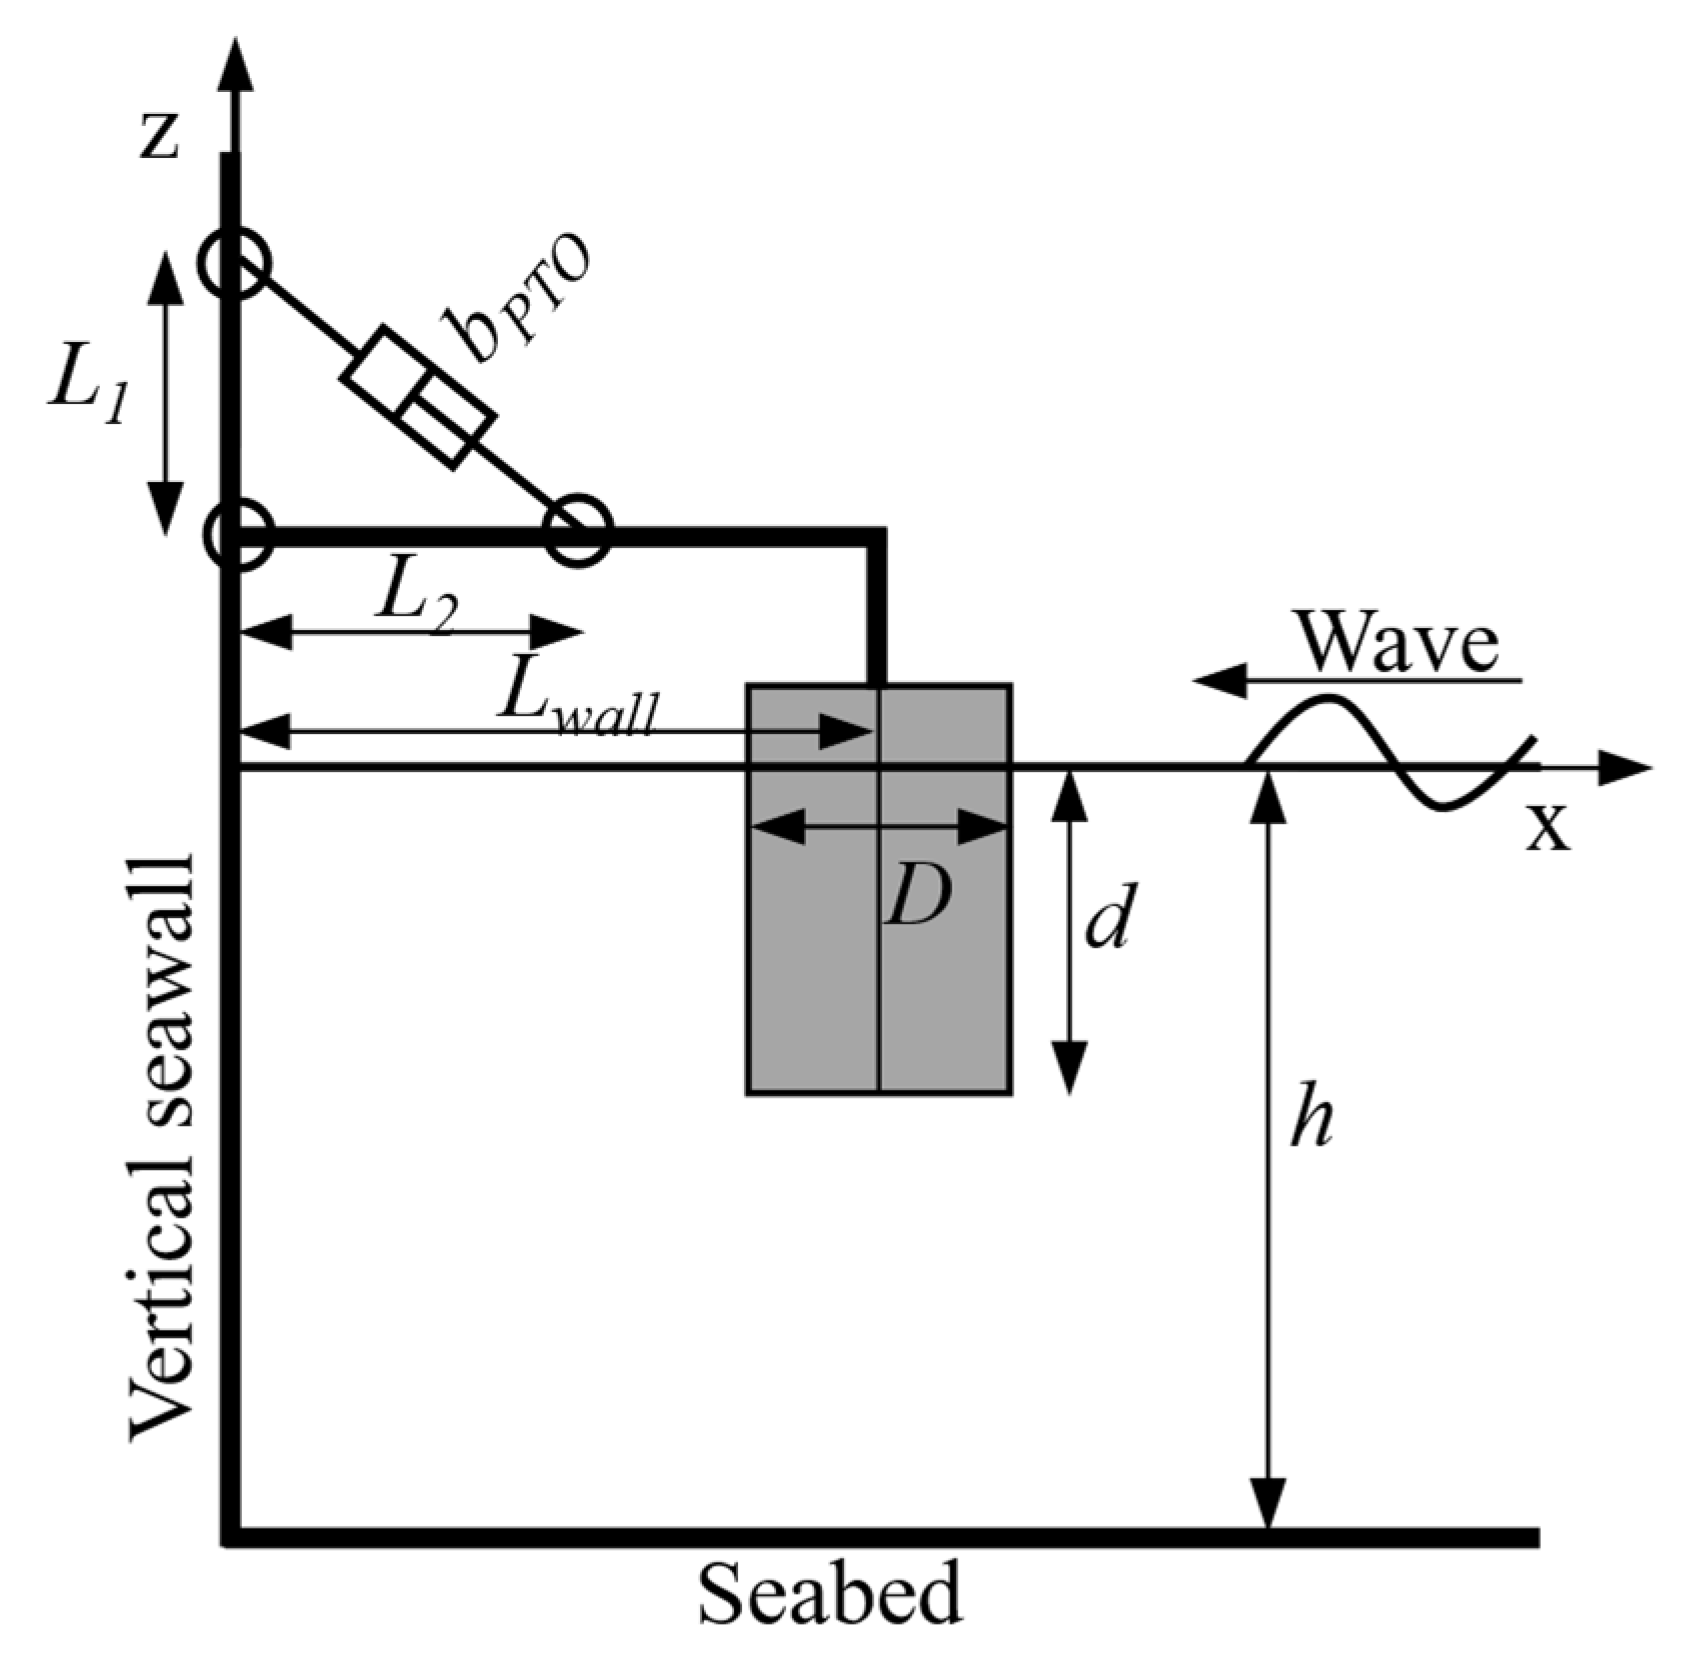
Figure 1. Schematic of a WEC positioned near a vertical seawall with a PTO system linked through frames and hinges.
Energies 18 04246 g001
Figure 2. Movement of frames with PTO due to WEC oscillation.
Energies 18 04246 g002
Figure 3. Top view of (a) WEC in front of a vertical seawall and (b) WEC and image body, denoted by a dashed line to replace the vertical seawall.
Energies 18 04246 g003
Figure 4. The real PTO damping, with parametric variations.
Energies 18 04246 g004
Figure 5. Bar chart of the extracted power for various actuating arm lengths.
Energies 18 04246 g005
Figure 6. Techno-economic metrics representing (a) device cost and (b) PTO cost, along with the corresponding extracted power.
Energies 18 04246 g006
Figure 7. Overall score of WSM, along with the corresponding extracted power.
Energies 18 04246 g007
Table 1. Optimal PTO damping values and the corresponding extracted power.
b P T O ( kNs / m ) P ¯ i r r ( kW )
D = 2 m4.991.15
D = 3 m13.571.69
D = 4 m25.352.17
Disclaimer/Publisher’s Note: The statements, opinions and data contained in all publications are solely those of the individual author(s) and contributor(s) and not of MDPI and/or the editor(s). MDPI and/or the editor(s) disclaim responsibility for any injury to people or property resulting from any ideas, methods, instructions or products referred to in the content.