Abstract
This study aims to examine the impact of compressor station availability on the techno-economic aspects of natural gas pipeline transportation, using the proposed Trans-Saharan Gas Pipeline (TSGP) project as a case study. A scenario-based technical and economic analysis was conducted to highlight the economic sensitivities of the systems to availability. The economic assessment of the project was performed using a discounted cash flow method, considering lifecycle costs. The techno-economic model was developed using MATLAB R2020b, accounting for variations in ambient temperatures at the compressor station under different flow conditions. Findings indicate an 8.41% increase in project lifecycle cost in one scenario compared to the baseline, assuming a 15% discount rate. However, the baseline case with a 100% compressor station availability assumption appears unrealistic, as shown by its lifecycle cost and net present value estimates. This is because constant operating conditions throughout the project lifecycle are impossible. Additionally, when station availability increases by 7.87% and the cost of standby units rises by 10.24%, avoided income loss due to station unavailability increases by 14.06%. This reveals a trade-off between the extra capital expenditure on standby units and the savings from avoiding income loss. Furthermore, the impact of 2% and 4% escalation rates of fuel and maintenance costs on lifecycle costs results in a rise of 2.70% and 6.15%, respectively, in one scenario compared to the 0% escalation rate. The results demonstrate the significant influence of compressor station availability analysis on pipeline projects, particularly in reducing engine downtime costs and enhancing project revenue. Therefore, the methods presented here help in understanding the importance of compressor station availability in pipeline techno-economics, leading to more effective resource and financial management.
1. Introduction
An efficient and reliable transmission system is needed to meet the demand for natural gas from locations with abundant reserves to consumption areas [1,2,3]. This transmission system requires the installation of compressor stations at appropriate distances along the pipeline to ensure the required pressure is maintained for gas transportation [4,5]. In many cases, the continuous operation of this system will require the availability of the equipment used in the compressor stations, including the gas compressors and gas turbines that drive them. The size and complexity of natural gas pipeline networks have increased in response to growing demand. Consequently, decisions regarding the design of a new natural gas transmission network or the expansion of an existing one must be made about their long-term benefits [6,7,8]. This is in terms of the availability of compression stations, considering the economic impact on pipeline transportation. Centrifugal Compressors are used for gas transmission to boost pipeline pressure to the required operating pressure. They are usually driven by gas turbines or electric motors [9]. However, this study considers gas turbine-driven centrifugal compressors as recommended by Nasir [10] as the main station components in transmission pipelines. Compressor stations can contain more than one gas turbine-driven compressor to boost the pipeline flow rate. The compressors in the pipeline are evenly spaced and typically positioned to optimise pressure ratios [11,12]. The selection of an appropriate compressor for a particular application will partly depend on its availability and reliability, which can influence the lifecycle costs of pipeline systems. A gas compression system can consume about fifty per cent of the available energy [13]. According to Kurz et al. [14], gas compression is an energy-intensive process with more than 67 per cent of annual operating costs spent on energy. Therefore, reducing compressor station and pipeline systems operating costs without reducing availability and reliability is essential [15]. Thus, small improvements in efficiency by considering the effects of compressor station availability will significantly impact operating costs [11,16,17].
Engine availability is crucial in the economics of the compressor station and pipeline system. The unavailability of the plant to generate power can be very costly in terms of the compressor station’s operation. This is reduced if scheduled outages are planned for non-peak periods. The increase in plant efficiency, from seven to ten per cent, between smaller capacity units and larger units has led to an equivalent reduction in plant availability, as larger plants take more time to repair. This will have a significant impact on the plant’s economy. A 1% reduction in the engine availability could cost a yearly income loss of USD 500,000 on larger capacity plants [18]. The loss of income can be due to the unavailability of the commodity, penalties estimated because contractual agreements are not met, or the pipeline flow rate reduction [14]. However, when denoted as a reduction in system unavailability, the potential cost savings could exceed one thousand per cent [19]. Therefore, compressor station availability must be considered in pipeline planning and CAPEX analyses to give a better understanding of pipeline capacity [20].
There are minimal studies on the techno-economic and environmental risk analysis (TERA) techniques used in gas turbine applications for transporting natural gas via pipelines. The only known work on this area of research was performed by Nasir [10], Tukur [21], Aziaka [22] and Ojo [23] at Cranfield University, United Kingdom. Nasir [10] examined the TERA of electric motor drives and gas turbines in pipeline applications. His study concluded that while electric motor drives may initially seem more environmentally friendly, a closer look at the electricity generation sources for these drives, both now and in the future, reveals that they contribute more to environmental pollution than gas turbines do. Consequently, electric motor drives may not be a feasible option for interstate pipelines in areas with an insufficient electricity supply. Additionally, the study indicates that increasing the size of the pipeline reduces compression costs due to higher pressure, which in turn decreases the power required for compression. However, the study does not consider the impact of engine availability on investment. Tukur [21] researched the techno-economics of gas turbine compressor stations used in natural gas pipelines. His economic model was based on a life-cycle cost analysis, assuming constant annual values for maintenance and fuel costs, while taking into account local conditions at the stations. However, he did not consider the availability of turbo-compressors and their effect on the lifecycle costs. Aziaka [22] investigated the techno-economics of degraded gas turbines in compressor station locations along a pipeline. Nonetheless, he did not look at the impact of compressor station availability on pipeline techno-economics. Ojo et al. [24] carried out a techno-economic optimisation of the compressor station and pipeline segments for the proposed Trans-Saharan Gas Pipeline (TSGP) project. The 4180 km pipeline would carry natural gas from Nigeria to Algeria’s export terminal on the Mediterranean Sea and eventually supply natural gas to Europe. Recently, the TSGP was mentioned in planning documents. The Nigeria National Petroleum Cooperation affirmed its commitment to the project to continue the ongoing Trans Nigeria Gas Pipeline, which has already reached an advanced stage of its development. The optimisation problems were formulated with the goal of minimising the lifecycle cost, taking the location of the compressor stations as the decision variable. The baseline case consists of eighteen compressor stations located at fixed points along the pipeline route. A compressor station and pipe segment location identification system were incorporated into the optimisation scheme. This was connected to the distance from the source of the natural gas being transported. The complete natural gas pipeline consists of pipe segments each 10 km long. The results showed twelve compressor station locations along the pipeline route in one of the optimised cases. The optimised lifecycle cost reduces by 12.95 percent compared to the baseline case. The optimised compressor station locations were at 1, 38, 76, 113, 150, 186, 222, 260, 296, 332, 368, and 408 segments of the pipeline. However, the study did not show the impact of engine availability on the investment. El-Suleiman [25] investigated TERA regarding the power requirements for CO2 compression in gas turbine-driven pumps and compressors. The economic model was developed based on net present value. However, neither natural gas pipeline nor compressor station availability were considered in his study.
The increase in the equivalent operating hours (EOH) of a compressor is primarily due to a rise in the number of machine start-ups. Each start-up reduces the interval between maintenance inspections, which moves the compressor closer to needing an overhaul. As a result, this leads to a decrease in the time between overhauls or repairs, ultimately reducing the availability of both the compressor station and the pipeline system [23,26,27,28]. Regular maintenance can appreciably affect the degree of availability and consequently, the time between overhauls or repairs of turbo-compressor unit in the compressor station and pipeline system. This is because any non-performance of the turbo-compressor unit within the pipeline system could increase the operation and maintenance cost. After all, maintenance decisions are usually made by considering economic risk [23,29]. Safie et al. [19] presented a report on an assessment conducted to aid the renovation of the air compressor at NASA’s Langley Research Centre. The findings indicated that the air compressors had surpassed their design life. This raises concerns about the potential for costly failures after compressor overhauls if the compressors are not replaced. To address this issue, a compressor replacement strategy was proposed. This strategy aims to ensure sustainable operations by enhancing reliability and availability, as well as increasing the likelihood of meeting air demand, all while maintaining an acceptable investment cost and generating cost savings. However, while the report anticipated improvement in reliability and availability through investment cost, the effects of station availability on the techno-economics of gas transportation was not assessed. More so, the report did not consider natural gas compressor stations. Li et al. [15] proposed a reliability-based approach to determine the number and placement of standby compressors, aiming to minimise investment costs while ensuring reliability. The case study results indicated that the number of standby compressors could be reduced by seven, achieving a pipeline reliability of 0.9686. Nevertheless, while the study focuses on reliability, compressor stations availability and their impacts on investments were not considered. Jiao et al. [30] proposed a multi-objective optimisation model to evaluate the reliability and operating costs of a natural gas pipeline network. The reliability of the pipeline network was assessed by taking into account the potential failures of its components and the network’s condition during these failure events. The results demonstrated that the proposed model effectively illustrates the relationship between reliability and operating costs across different flow rates, informing the development of an optimal operational scheme. Zhou et al. [31] developed a maintenance model that takes into account the economics and reliability of a compressor unit system arranged in a series-parallel layout. This proposed model was compared with two traditional methods to assess its economic viability and efficiency in the series-parallel pipeline system. The method, which focuses on optimising the maintenance time window, can reduce maintenance costs by 27.7% and 25.1%, respectively. However, these studies did not account for the availability of compressor stations regarding investment impact.
Research has been conducted on the techno-economic analysis of compressor stations and pipeline systems [32,33,34,35,36,37,38,39,40,41,42,43]. Wen et al. [44] analysed the net present value of the costs associated with gas transmission through pipeline networks, including relevant gas storage costs, over different periods. He conducted a case study with varying characteristics to examine the effects on decision-making. The results of the case study revealed that economic efficiency was optimised by 15.58 per cent, effectively compensating for the excess demand generated during the initial stage. The researchers concluded that this approach could yield significant economic benefits while meeting the needs of downstream users. Shan et al. [45] proposed a method to assess the reliability of natural gas supply in pipeline systems through cost–benefit analysis. The objective function was designed to maximise the difference between the benefits of improved reliability and the associated investment costs. This study considered both the investment required and the benefits gained from reducing costs due to unreliability as a result of implementing various reliability improvement measures. The results indicated that for the scenario with the lowest operational age, the difference between benefits and investment for optimal solutions was 1.9 × 10⁴ CNY. Xenos et al. [26] presented an optimisation framework which integrates maintenance and optimal operation of compressors. The outcome of the framework is a multiperiod plan which provides the schedule of the operation of the compressors that gives the best decision alternative. These decision leads to the minimisation of the operational costs of the compressors while meeting plant’s demand. Nevertheless, these studies did not examine the impact of compressor station availability on pipeline techno-economics using the TERA approach. Therefore, there exists a gap in knowledge in the literature that this research aims to cover. For the first time, this study examines the impact of compressor station availability on the techno-economic aspects of natural gas transportation in pipelines. As evident from the information available in the public domain, this is the first study of its kind to be conducted on a natural gas pipeline using the TERA approach. Consequently, this study looks at the following objectives for the first time:
- (1)
- What are the concept and implication of availability on compressor station and pipeline system operations and techno-economics?
- (2)
- What is the lifecycle cost for different considered compressor station availability scenarios?
- (3)
- Which compressor station availability scenario have the lowest lifecycle cost and highest net present value?
The rest of this paper is organised as follows. Section 2 presents and describes the methodology and the various modules that make up the TERA framework. Section 3 discusses the results of the study. Section 4 provides the study’s conclusions, while Section 5 outlines the limitations and suggests directions for future research.
2. Methodology
The TERA framework employed in this research constitutes an integrated computational architecture, designed to comprehensively evaluate the impact of compressor station availability on natural gas pipeline economics. As illustrated in Figure 1, this framework synthesises five interdependent yet interlocking analytical modules that systematically process physical, operational, and economic parameters. The novelty of this approach lies in its innovative integration of an availability quantification module within the TERA paradigm—a significant advancement for pipeline analysis. Outlined below are the details of each module’s structure, governing equations, interconnections with other modules and data exchange protocols.
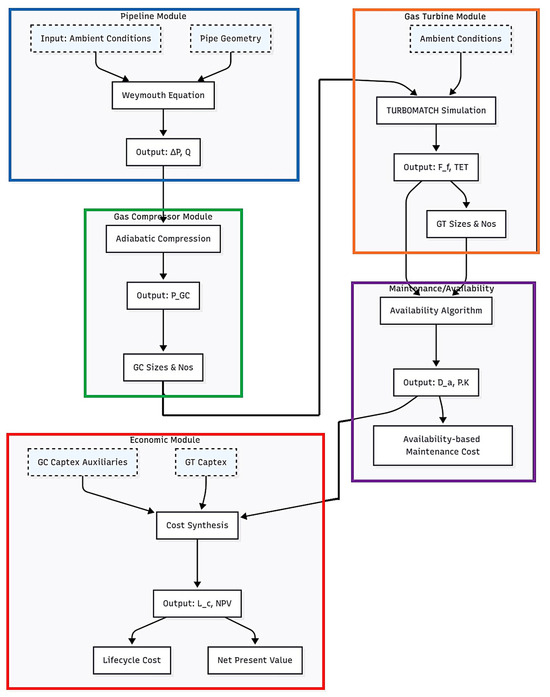
Figure 1.
Integrated TERA (Techno-Economic and Environmental Risk Analysis) framework for natural gas pipeline systems used in the present study. Arrows indicate critical data exchange pathways. Dashed boxes denote external inputs.
The figure illustrates the five interconnected computational modules:
- Pipeline Module (Blue): Computes pressure drops (ΔP) and flow rate () using the Weymouth equation, ingesting ambient conditions and pipe geometry.
- Gas Compressor Module (Green): Calculates drive power () via adiabatic compression, determining compressor sizing/number.
- Gas Turbine Module (Orange): Simulates fuel consumption () and turbine entry temperature (TET) using TURBOMATCH, incorporating ambient conditions.
- Maintenance/Availability Module (Purple): Quantifies downtime () and availability () via reliability algorithms, generating availability-based maintenance costs.
- Economic Module (Red): Synthesises lifecycle cost () and net present value () from capital expenditures ( Captex, auxiliaries) and operational outputs.
2.1. Pipeline Module: Hydraulic Characterisation and Flow Dynamics
The first module within the TERA framework considers the hydraulic modelling of natural gas transit through the pipeline network. It simulates the thermodynamic and fluid mechanical behaviour of the gas mixtures under transient operational regimes, accounting for spatial and temporal variations in ambient temperature, pipeline topography, and gas composition. The computational core of this module is the Weymouth equation, an industry-standard empirical correlation for high-pressure gas flow that has been implemented within a MATLAB environment.
The governing equation is expressed as:
where () is the volumetric flow rate (m3/day), (E) is the pipeline efficiency factor, () and () are the standard base temperature (K) and pressure values (kPa), () and () are the inlet and outlet pressure values (kPa), () is the pipe segment equivalent length (km), () is the elevation adjustment parameter-dimensionless, () is the gas specific gravity (dimensionless), () is the flowing gas temperature (K), () is the compressibility factor (dimensionless), and () is the pipe diameter (mm).
The computed outputs of this module are the daily pressure gradients (ΔP) and flow rates (). These outputs, generated for each 10 km pipeline segment, are subsequently relayed to the Gas Compressor Module to determine compression power requirements.
2.2. Gas Compressor Module: Thermodynamic Power Demand Estimation
The Gas Compressor Module translates hydraulic outputs from the Pipeline Module into mechanical power prerequisites for gas recompression. It employs adiabatic compression thermodynamics to calculate the drive power (PGC) demanded by centrifugal compressors to restore pipeline pressure to operational thresholds. The governing equation is expressed as:
where (m) is the compressor actual mass flow rate at suction conditions (kg/s), (n) denotes the polytropic exponent, (R) is the gas constant (KJ kg−1 K−1), () is the average flowing gas temperature (K), (P1/P2) is the pressure ratio across the compressor, and (ηpoly) is the polytropic efficiency (calibrated between 0.75 and 0.85 based on OEM data).
This module evaluates (PGC) under three distinct flow regimes: isothermal, intermediate, and non-isothermal, to capture seasonal and daily ambient variations. This MATLAB-implemented algorithm was validated against Aspen HYSYS V14 [23], maintaining <2% deviation across operating conditions. Outputs guide gas turbine selection and feed the performance simulation module.
2.3. Gas Turbine Performance Module: Prime Mover Energy Conversion Simulation
The Gas Turbine Performance Module simulates the operational characteristics of turbine-driven compressors under design and off-design conditions. Utilising TURBOMATCH—a zero-dimensional thermodynamic performance code developed at Cranfield University [23]—this module resolves mass and energy balances across turbine components (compressor, combustor, power turbine) to predict fuel consumption rates (Ff) and turbine entry temperatures (TET). The computational procedure involves
- Component Matching: Solving continuity and energy equations at component interfaces;
- Characteristic Maps: Interpolating compressor/turbine performance maps (pressure ratio, efficiency vs. corrected flow);
- Ambient Corrections: Adjusting ISO conditions to site-specific temperatures via scaling laws.
The module receives (PGC) from the preceding module and ambient temperature data, to simulate part-load performance. Outputs include fuel flow (kg/s) and TET (°C), where these parameters are channelled to the Maintenance/Availability Module for downtime quantification.
2.4. Maintenance/Availability Module: Reliability-Informed Downtime Economics
This innovative module of the TERA framework introduces a mathematically robust protocol to quantify compressor station availability (P(K)) and its economic consequences. Availability is computed via a reliability-centred algorithm that synthesises Mean Time Between Failures (MTBF), Mean Time To Repair (MTTR), and scheduled maintenance intervals as follows:
where (λi) represents the failure rate of subsystem i (e.g., compressor bearings, turbine blades) and (ti) is the exposure duration. MTBF/MTTR values were sourced from field data collated by Ojo [23]. The algorithm further incorporates
- Creep Life Consumption: Estimated from TET deviations using Larson-Miller parameter correlations;
- Start-Up Degradation: Quantified via Equivalent Operating Hours (EOH) models.
Availability directly modulates maintenance expenditures through two principal cost vectors: the Variable Maintenance Costs, and the Major Overhaul Costs, as detailed and quantified (via equations) in the next section.
The outputs of this module (the annual downtime (Da) and availability () are both fed to the Economic Module for lifecycle cost integration.
2.5. Economic Module: Lifecycle Value Integration
The last module synthesises all preceding outputs into techno-economic metrics. It employs a discounted cash flow (DCF) methodology to compute
- Lifecycle Cost (): Aggregating capital, operational, and maintenance expenditures;
- Net Present Value (): Evaluating profitability through discounted cash flows.
Capital costs are estimated using OEM quotes and scaling laws (Equations (4)–(13)), while operational expenditures (fuel, maintenance) derive from module outputs. Critical computations include Fuel Costs and Revenue Losses (both of which are detailed in the following subsections), and NPV Sensitivity (considered across discount rates (10–15%) and availability scenarios).
2.6. Details and Specifics of the Framework
2.6.1. Economic Assumptions
The economic assumptions are shown in Table 1. The economic input data are based on the United States currency in dollars with a 2020 base year.

Table 1.
Economic Assumptions.
A maintenance factor 1 was assumed in the major maintenance cost evaluation. This is utilised by [22,23,52] to estimate the cost of maintenance of gas turbines. The major maintenance cost is a turbine entry temperature-based cost where the shaft power was constant during operation with variation in the engine TET and the fuel consumed.
2.6.2. Pipeline Cost Estimate
Pipeline cost consists of the costs of pipeline material, coatings, wrappings, and pipeline installation [47].
The pipeline material cost , is estimated using the following equation:
where
= Pipe length, km
= Pipe outside diameter, mm
= Pipe wall thickness, mm
= Pipe material cost (USD/metric ton).
The average value of the pipe material cost estimates from 2010 to 2016 for line pipe greater than 24 inches based on the report prepared by Inner City Fund and submitted to American Petroleum Institute and others in the United States [46] was assumed in this research.
Pipeline installation cost was estimated based on the Institute of Transportation studies [53] generalised estimate. A quadratic best-fit curve was obtained for the installation cost; this is expressed in the following equation:
where
= Installation cost (USD/km)
= Outer diameter.
It is assumed that the pipe is externally coated and wrapped at an extra cost of in USD/km. The total pipeline cost in USD is estimated using the following equation:
2.6.3. Gas Compressor Cost
The gas compressor purchased, and installation costs are estimated using the following equations:
where
= Gas compressor purchased cost (USD)
= Gas compressor installation cost (USD)
= Marshall and Swift cost index, equivalent to 1638.2 for 2018 [54]
= Correction factor, equivalent to 1.15 for gas turbine-driven centrifugal compressors
= Gas compressor power, kW.
The total cost of the gas compressor , is the sum of the purchased and installation costs given by
2.6.4. Gas Turbine Cost
Equation (7) shows the equipment cost of gas turbine . It was estimated using the best-fit curve equation developed for gas turbine cost estimation [55] and is given by
where is the gas turbine power in kW. Assuming factors of 2 and 1.38 to cater for installation and shipping cost, respectively [21], gas turbine capital cost , is estimated using the following equation:
where is the number of gas turbine installed per compressor station location.
The pipeline project initial cost is given by
2.6.5. Auxiliaries Cost
Pipeline accessories are estimated as percentages of the pipeline project initial cost , as recommended by [47]. Table 2 shows the assumed percentages based on [47] recommendations for pipeline accessories.

Table 2.
Pipeline Accessories Assumptions.
The auxiliaries’ cost , is the algebraic sum of each accessory cost as shown in Table 2.
The total project capital expenditure , is given by
2.7. Operation and Maintenance Cost
The operation and maintenance costs refer to the expenses associated with running and maintaining the compressor station and pipeline system under varying operating conditions, comprising both fixed and variable costs. As with other pipeline projects, after the construction and installation of the pipeline project, there will be operation and maintenance costs over the project’s duration. In this study, the operational lifespan of the compressor station and pipeline system is projected to be 30 years. The operating conditions of the compressor station equipment and fuel consumption expenses influence the operating costs. The fuel consumption cost is an essential component of the variable cost. It contributes to one of the project’s highest operating costs. It is usually evaluated separately from the maintenance cost. The gas turbines shaft powers, fuel flows and turbine entry temperatures required to drive the gas compressors at varying ambient conditions have been obtained from the gas turbine performance simulation using TURBOMATCH 3.0 software. They are applied to evaluate the operation and maintenance costs. These costs were assessed by compressor station availability analysis in terms of the following scenarios:
- (1)
- Scenario 1, Baseline case: Availability is 100% or 1. This is an ideal case defined as a theoretical upper limit of the availability analysis.
- (2)
- Scenario 2: No standby unit installed at all compressor station locations (No standby unit).
- (3)
- Scenario 3: One standby unit installed at all compressor station locations, giving a total of eighteen installed standby units (18 standby units).
The baseline scenario features eighteen compressor stations located at fixed positions along the pipeline route. The selected scenarios are justified because the baseline scenario represented an idealised case with a theoretical upper limit. Additionally, scenarios 2 and 3 illustrate typical configurations of compressor stations and the range of availability commonly seen in natural gas transmission pipelines.
2.7.1. Fuel Cost
The fuel cost is the most important cost factor in the operational cost incurred during the operation of the compressor station and pipeline system. It could influence the overall project profitability to a great extent. This study assumed a fixed value for the fuel cost per unit weight of fuel over the project lifecycle. The fuel consumption cost is estimated based on the variation in compressor station locations ambient temperature at varying flow conditions. The fuel flow results at varying flow conditions obtained from the gas turbine performance analysis enables the evaluation of the annual and lifecycle fuel consumption cost for each gas turbine at each compressor station location.
The annual and lifecycle fuel consumption costs at each compressor station location at varying flow conditions are evaluated using the following equations:
where
= Annual fuel consumption cost, USD
= Fuel cost per kg of fuel, (USD/kg)
= Fuel Flow at varying flow conditions (kg/s)
= Operational period at varying flow conditions (hrs)
= Lifecycle fuel consumption cost, USD
= Project lifecycle
= Number of installed units
2.7.2. Maintenance Cost
These costs result from engine downtime due to overhauls and replacements. They depend on the maintenance pattern adopted, whether scheduled or unscheduled maintenance, operating ambient conditions, compressor station availability, type of technology employed, and station location. This includes the overall decision made in the design and development of the proposed Trans-Saharan gas pipeline project. The availability of the compressor station, particularly in relation to maintenance costs, will impact the viability of the project. Therefore, this study evaluates maintenance costs by taking into account the availability of the compressor station. This availability is used to assess these costs over the project’s lifecycle.
Fixed Maintenance Cost
These cost estimates are based on the 2019 Annual Technology Baseline data retrieved from [50]. The annual and lifecycle fixed maintenance costs at each compressor station location at varying flow conditions are evaluated using the following equations:
where
= Annual fixed maintenance cost, USD
= Gas turbine power at varying flow conditions, (MW)
= Fixed maintenance cost factor, (USD/kW-year)
= Lifecycle fixed maintenance cost, USD
= Project lifecycle
= Number of installed units
Availability-Based Variable Maintenance Cost
The availability-based variable maintenance cost estimates are based on the evaluated compressor station availability [23] and 2020 cost data estimated by [51] for the United States Energy Information Administration. The operation and maintenance costs were evaluated based on compressor station availability analysis in terms of the scenarios highlighted in Section 2.7.
The baseline includes eighteen fixed compressor station locations along the pipeline route.
The annual and lifecycle availability-based variable maintenance costs at each compressor station location at varying flow conditions are evaluated using the following equations:
where
= Annual availability-based variable maintenance cost, USD
= Variable maintenance cost factor, (USD/MWh)
= Lifecycle availability-based variable maintenance cost, USD
= Compressor station availability
= Project lifecycle
= Number of installed units
= Gas turbine power at varying flow conditions, (MW)
= Operational period at varying flow conditions (hrs)
Reference [23] give further information on the compressor station availability analysis. Nasir [10] and Tukur [21] assumed an annual value of USD 30 per kW for the maintenance cost in their pipeline TERA. Aziaka et al. [56] in their economic evaluation, attempted to incorporate availability but they were not able to do so and only assumed availability of unity. This research utilises the actual compressor station availability values based on the developed maintenance schedule and failure rates to evaluate the actual availability-based maintenance cost in the pipeline TERA [23].
Availability-Based Major Maintenance Cost
The creep life values of the engine at varying flow conditions corresponding to the location ambient temperatures were estimated using a simple relationship between the engine turbine entry temperatures and the engine creep life [23,52]. According to this relationship, the creep life reduces by half for every 20 K increase in turbine entry temperature and vice versa [57]. The turbine entry temperature at the design condition was taken as the baseline with a creep life of 25,000 h. These estimated values were then used to compute the availability-based major maintenance cost based on the scenarios highlighted in Section Availability-Based Variable Maintenance Cost.
In this study, the gas turbine engine operates at constant shaft power at all flow conditions. Therefore, a fixed shaft power under varying ambient conditions will have a major effect on the engine TET and thus the fuel consumed. Consequently, this will affect the engine life. Therefore, it is necessary to consider this as major maintenance. The annual and lifecycle availability-based major maintenance costs at each compressor station locations at varying flow conditions are evaluated using the following equations:
where
= Annual availability-based major maintenance cost, USD
= maintenance cost factor 2, (USD/MWh)
= maintenance cost factor 1, (USD/MWh)
= Lifecycle availability-based major maintenance cost, USD
= Compressor station availability
= Expected engine life, hours
= Engine creep life, hours
= Project lifecycle
= Number of installed units
= Gas turbine power at varying flow conditions, (MW)
= Operational period at varying flow conditions (hrs)
The expected engine life used in Equation (22) [52] is the assumed engine creep life at design point. A maintenance factor 1 was assumed in the major maintenance cost evaluation. This is utilised by [22,23,52] to estimate the cost of maintenance of gas turbines. The major maintenance cost is a turbine entry temperature-based cost where the shaft power was constant during operation with variation in the engine TET and the fuel consumed.
The total annual and lifecycle maintenance cost , and respectively, is given by
where
Total annual maintenance cost, USD
= Annual fixed maintenance cost, USD
= Annual availability-based variable maintenance cost, USD
= Annual availability-based major maintenance cost, USD
= Total lifecycle maintenance cost, USD
= Lifecycle fixed maintenance cost, USD
= Lifecycle availability-based variable maintenance cost, USD
= Lifecycle availability-based major maintenance cost, USD
The steps in which the maintenance cost analysis could be improved are explained in the conclusion section.
2.8. Project Lifecycle Cost
The lifecycle cost is the total cost incurred during the construction, operation, installation, and maintenance of the pipeline system. This cost consists of the gas compressor cost, gas turbine cost, pipeline cost, auxiliaries, fuel, and total maintenance costs. The lifecycle cost , for the techno-economic study in this research can be written as
where
= Techno-economic lifecycle cost, USD
= Total pipeline cost, USD
= Gas compressor cost, USD
= Gas turbine cost, USD
= Auxiliaries cost, USD
= Lifecycle fuel consumption cost, USD
= Total lifecycle maintenance cost, USD
2.9. Net Present Value Analysis
This is typically used to assess the economic viability of projects. It can be calculated using the following equation:
where
= Net cash flow for year j
= Year of project cash flow
= Assumed discount rate
= Initial Capital Investment
n = Total project duration
The annual net cash flow is the net sum of the project’s annual cash inflow and outflow. The yearly cash outflows are the operation and maintenance costs, including fuel costs. The annual cash inflow is the annual revenue generated from selling natural gas to the end-users. A negative net present value suggests that the project may not break even and thus, economically not viable. The converse is the case for a feasible project. The rate used to convert future cash flows into present values is the discount rate. The discount rate is usually set in such a way as to generate a net positive value in the project’s worth based on the expected project profitability. The gross annual revenue , generated from the project is estimated using the following equation:
where
= Gas price, (USD/J)
= Gas higher heating value, (MJ/m3)
= Annual gas production, (MMm3)
The lost annual revenue , from the project due to engine downtime is estimated using the following equation:
where
= Total annual downtime, hours
= Estimated lost revenue per hour
The net annual revenue , from the project is the algebraic difference between the gross annual revenue and the lost annual revenue. It is evaluated as
The annual cash outflow , is given by
The annual cash flow , is written as
3. Results and Discussion
The results obtained were based on comparisons between the compressor station system availability analysis which was performed in terms of the scenarios highlighted in Section 2.7.
The baseline case consists of eighteen compressor station locations, fixed along the pipeline route.
3.1. The Impact of Turbo-Compressor Availability on Capital Cost
Figure 2 shows the effect of station availability on capital cost for the three availability scenarios. The project capital cost is USD 18.23 billion for scenario 1, consisting of the baseline case with 100% availability. The capital cost remains constant in scenario 2, consisting of no standby turbo-compressor units at all compressor station locations. This case yields a compressor station availability of 92.67% [23]. However, the capital cost increases by 10.24% in scenario 3, consisting of one standby turbo-compressor unit at all compressor station locations. This scenario yields a compressor station availability of 99.96% [23]. Availability directly impacts the project’s capital cost in terms of the additional first cost incurred from the installed standby units. An increase in compressor station availability in terms of the number of installed standby unit leads to a corresponding increase in the capital cost estimate.
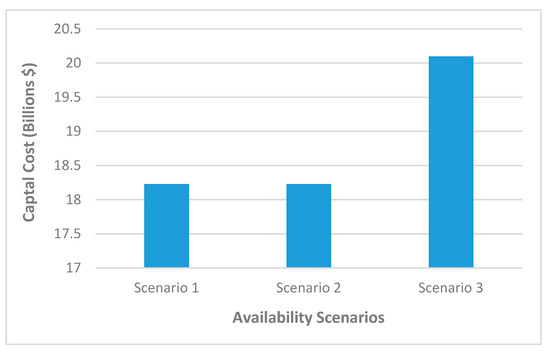
Figure 2.
Impact of availability on capital cost on different availability scenarios.
3.2. The Impact of Turbo-Compressor Availability on Fuel Cost
Figure 3 shows that the fuel cost is the same for each availability scenario, irrespective of an increase in the compressor station availability. There is no additional cost related to the standby unit’s fuel consumption. Consequently, availability has no direct impact on the fuel cost since the fuel cost is identical for all scenarios and the spare units are in standby mode.
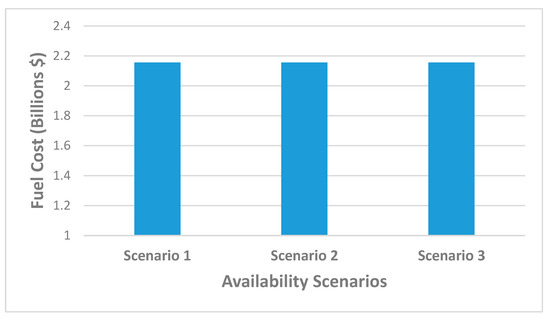
Figure 3.
Impact of availability on fuel cost.
3.3. The Impact of Turbo-Compressor Availability on Maintenance Cost
Figure 4 shows that the maintenance cost is USD 1.86 billion in scenario 1, assuming a discount rate of 15%. At the same discount rate, the maintenance cost decreases by 0.944% in scenario 2 with 92.67% station availability. Similarly, the maintenance cost decreases by 0.005% in scenario 3 with 99.96% station availability. The operational cost of the project is impacted by the decrease in maintenance cost with a decrease in compressor station system availability. Therefore, a decrease in the compressor station availability leads to a corresponding decrease in the maintenance cost and vice versa.
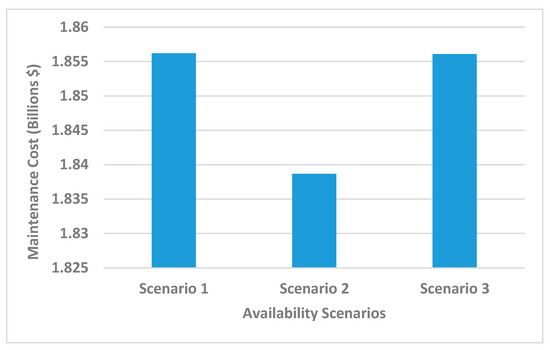
Figure 4.
Impact of availability on maintenance cost.
3.4. The Impact of Turbo-Compressor Availability on Lifecycle Cost
Figure 5 and Figure 6 show the breakdown of project cost for the baseline case and one of the availability scenarios.
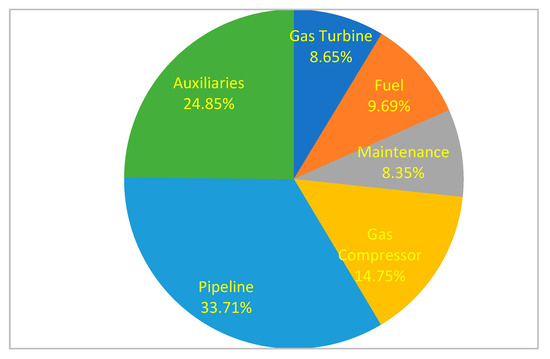
Figure 5.
Breakdown of Project Cost for Scenario 1.
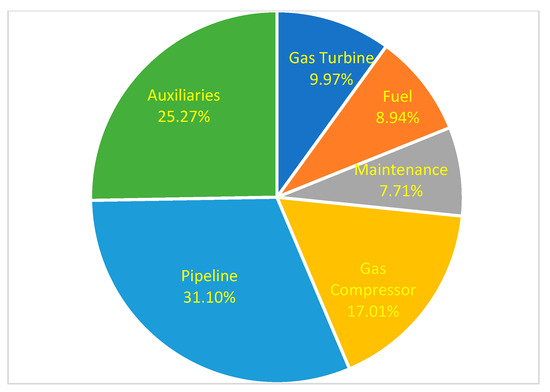
Figure 6.
Breakdown of Project Cost for Availability Scenario 3.
The lifecycle cost of the proposed Trans-Saharan gas pipeline project consists of compressor-turbine, auxiliaries, fuel, pipeline, and maintenance costs. The maintenance costs accounted for 8.35% and 7.70% of the project lifecycle costs for scenarios 1 and 3, respectively. The fuel cost, pipeline, gas compressor, gas turbine and auxiliaries’ costs accounted for 8.94%, 31.10%, 17.01%, 9.97% and 25.27%, respectively, of the lifecycle cost for scenario 3.
Figure 7 shows that at a 15% discount rate, the project lifecycle cost is USD 22.24 billion for scenario 1. At the same discount rate, the project lifecycle cost decreases by 0.09% in scenario 2 where the availability is 92.67% and increases by 8.41% in scenario 3 with a 99.96% station availability compared to scenario 1, respectively. Availability significantly impacts the lifecycle cost. These are confirmed from scenarios 1 and 2 with the same number of operational turbo-compressor units but different availability. Both have the same capital cost estimate but different maintenance costs due to their different availability values, as reflected in their lifecycle cost estimate.
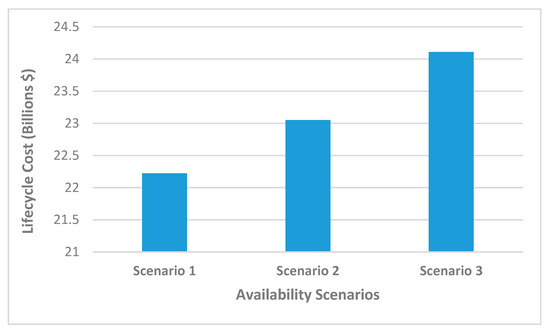
Figure 7.
Impact of availability on lifecycle cost.
Therefore, an increase in availability results in a corresponding rise in the lifecycle cost estimate. This arises from the increase in capital cost due to additional installed standby units and increased maintenance cost due to increased availability. However, the increase in compressor station availability is more reflected in the high capital cost, a major component of the lifecycle cost due to the additional standby units.
3.5. The Impact of Turbo-Compressor Availability on Net Revenue
The unavailability of compressor station components can lead to a significant loss in revenue. Figure 8 shows the impact of availability on net revenue generated from the project for the three availability scenarios. The net revenue generated from the project is USD 51.54 billion for scenario 1 assuming a continuous operation of the compressor stations with 100% availability. The net revenue generated from the project decreases by 31.12% in scenario 2 with 92.67% station availability compared to scenario 1. Similarly, it decreases by 26.74% in scenario 3 with 99.96% station availability compared to scenario 1. Scenario 3 has high amount of revenue generated from the project than scenario 2. This is due to its higher availability value. Therefore, the increase in compressor station availability leads to a corresponding increase in the income or revenue generated from the project. When the units are available, the compressor station operates continuously to meet its required throughput and supply of natural gas to end-users.
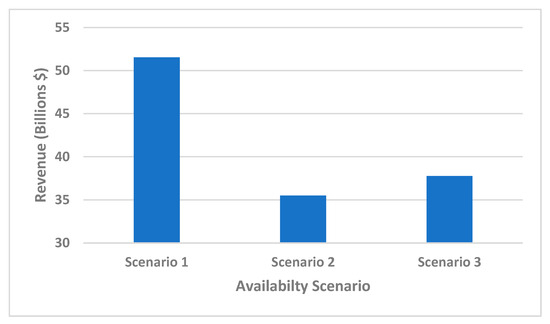
Figure 8.
Impact of availability on net revenue.
In contrast, the impact of the compressor station components and subsystem unavailability may be the reduction in the engine power or the expected volume flow rate through the pipeline systems. In some cases, total shutdown of the compressor stations. This unavailability usually arises from scheduled or unscheduled maintenance downtime, thus leading to the loss of income. Figure 9 shows the lost income while the pipeline is not running due to unavailability. Table 3 compares the additional cost of standby equipment with income loss.
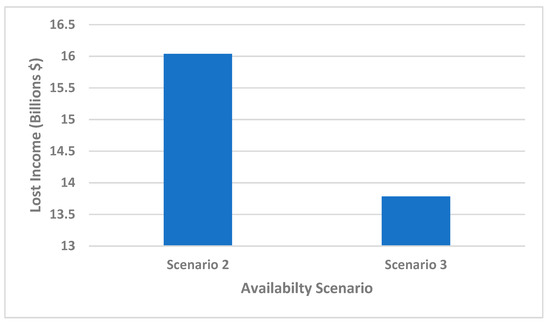
Figure 9.
Impact of Availability on lost income.

Table 3.
Comparison of standby units’ additional cost with income loss.
There is no standby unit installed at each compressor station location for the baseline case of scenario 1 and scenario 2. Thus, there is no additional cost for installing standby units in these scenarios. However, for scenario 3, the cost of installing a standby unit at each compressor station location increases by 10.24%. This cost represents the additional capital investment for scenario 3 to ensure the pipeline keeps running and available. Table 3 shows that there is no income loss for the baseline case of scenario 1 with an assumed availability of 100%. Realistically, this is not achievable in a real-life scenario as this would mean a perfect system with no losses. The reason for this will become apparent in the next section. Therefore, the avoided loss of income due to unavailability and subsequent net present value were not considered for this scenario. Nevertheless, the lost income while the pipeline is not running due to station unavailability is about USD 16.04 billion for scenario 2 and USD 13.78 billion for scenario 3, respectively, as shown in Figure 9 and Table 3. Scenario 3 has a lower income loss than scenario 2. Therefore, the avoided loss of income due to station unavailability increases by 14.06% in scenario 3 compared to scenario 2. This value represents the additional revenue that would be accumulated when the station availability increases by 7.87% in scenario 3 compared to scenario 2 due to the installation of additional standby units. More so, the results in Table 3 reveal that there is a trade-off between the extra capital investment in terms of the additional cost of standby units with the avoided loss of income due to station unavailability as reflected in the additional net revenue obtained in scenario 3. Therefore, the benefits associated with the installation of additional standby unit at each compressor station location are demonstrated through an increase in the income generated and the reduction in the station unavailability. This will allow the reclamation of the additional capital investment in standby units.
Furthermore, since there is no additional capital investment in terms of standby unit installation for scenario 2, the net present value for scenario 2 is equivalent to the present value of loss income due to unavailability as shown in Table 3. Hence, the results show that scenario 3 has a higher positive net present value compared to scenario 2. Therefore, it is advantageous to consider the scenario of installing standby units at each compressor station location. This is due to the resulting higher positive net present value for this scenario.
3.6. Sensitivity Analysis on Net Present Value
This approach enhances better comprehension of the relationship between the revenues accrued from the project and the cash outflows. Including selecting the best alternatives among the considered scenarios. The results obtained for the NPV analysis show that scenario 1 with an assumed 100% availability value at a 15% discount rate, has a net present value of USD 29.30 billion. At the same discount rate, the NPVs are USD13.28 billion for scenario 2 and USD 13.65 billion for scenario 3. All project alternatives have positive net present value. However, there is high margins in the NPV of scenario 1 compared to scenarios 2 and 3. This indicates that scenario 1 is unrealistic in real-life situation with perpetual operating conditions. Consequently, at a 15% discount rate, scenario 3, consisting of one standby turbo-compressor unit at all compressor station locations, should be selected. This is due to its higher NPV and thus is associated with a lower risk in investments in the project.
Figure 10 illustrates how the NPV changes with different discount rates for the availability scenarios.
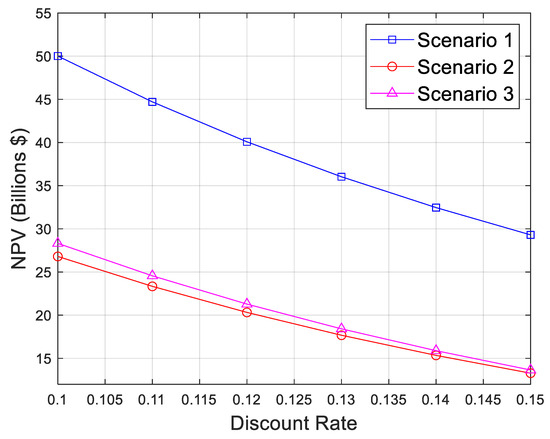
Figure 10.
Variation in NPV with discount rates for availability scenarios.
Sensitivity analysis shows a rise in NPV with a decreasing discount rate for all scenarios. Scenario 3 has the highest net present value at all discount rates. Results show that the most economically viable alternative is scenario 3, consisting of a standby turbo-compressor unit at all station locations. Consequently, scenario 3 is expected to produce the lowest risk associated with an investment in the project. The results further confirm that assuming a 100% availability value, as seen in the baseline case of scenario 1, is not realistic because it is nearly impossible to achieve perfect operating conditions throughout the project life.
Sensitivity analyses evaluate the effect of station availability on the pipeline project’s techno-economics. Three different values of compressor station availability of 98%, 94%, and 90%, respectively, were considered for these analyses. If all other conditions remain the same and considering standby units at each station location. Table 4 shows the results of the analyses.

Table 4.
Comparison of station availability with pipeline project techno-economics.
The maintenance cost increases by 0.52% and 1.04% when station availability increases from 90% to 94% and 98%, respectively. Therefore, a rise in station availability results in a corresponding rise in the maintenance cost. Similarly, the net revenue generated from the project increases by 42.2% and 97.2% when the station availability increases from 90% to 94% and 98%, respectively. Consequently, a rise in station availability results in a corresponding rise in the income generated from the project. Furthermore, the avoided loss of income due to station unavailability increases by 17.36% and 40.0% when the station availability rises from 90% to 94% and 98%, respectively. Therefore, the rise in the cost of maintenance due to a rise in the station availability yields an increase in the avoided income loss in terms of the additional income that is accrued during the project lifecycle. Thus, given the same number of stations and spare units and assuming all other conditions remain the same. The trade-off between extra investment in terms of a rise in maintenance cost due to a rise in the station availability with the avoided loss of income due to station unavailability is compensated with an increase in the net income obtained from the project. Thus, ensuring that the extra investment in the station operating cost is fully recovered.
The results of the NPV analysis show that negative net present values are obtained at a 15% discount rate when the station availabilities are 90% and 94%, respectively, as shown in Figure 11. However, a station availability of 98% yields a positive net present value for the project. Consequently, a 98% station availability is more economically viable among the three different values of availability. It will lead to a lower risk and uncertainty in investment in the compressor station and pipeline project. The results obtained have shown the importance of incorporating an availability analysis into the pipeline TERA.
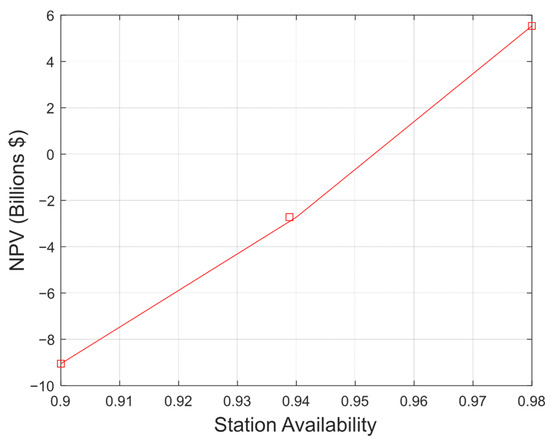
Figure 11.
Variation in NPV with station availability.
3.7. The Effects of Inflation on the Lifecycle Cost
Economic sensitivity analysis was carried out to assess the effect of inflation on the fuel cost, maintenance cost, and the project lifecycle cost using annual escalation rates of 0%, 2%, and 4%. The escalated annual fuel consumption cost for the scenarios is illustrated in Figure 12. The annual fuel cost remains constant each year because the engine is assumed to operate under clean conditions over its lifecycle. Therefore, these costs were discounted with the assumed discount rate of 15% to their present values to obtain the equivalent base cost for the reference year. Subsequently, annual escalation rates of 0%, 2%, and 4% were utilised to estimate the escalated fuel cost.
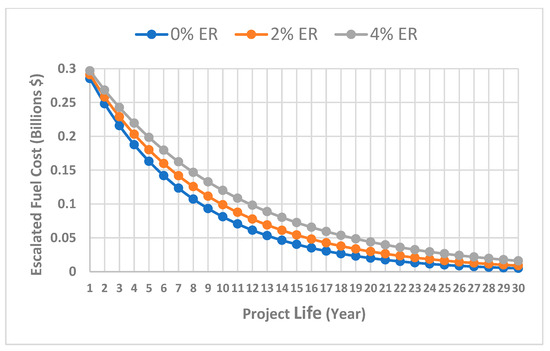
Figure 12.
Annual escalated fuel cost.
The results show an increase in fuel cost with increasing escalation rates due to the positive effect of annual inflation compared to the 0% escalation rate. However, the yearly decrease in fuel cost reveals the influence of the fluctuating natural gas prices in subsequent years.
Figure 13 illustrates the annual escalated maintenance cost for one of the scenarios. The annual maintenance cost remains constant each year because the engine is assumed to operate under clean conditions over its lifecycle. Therefore, these costs were discounted using an assumed discount rate of 15% to their present values to obtain the equivalent base cost for the reference year. Subsequently, annual escalation rates of 0%, 2%, and 4% were utilised to estimate the escalated maintenance cost.
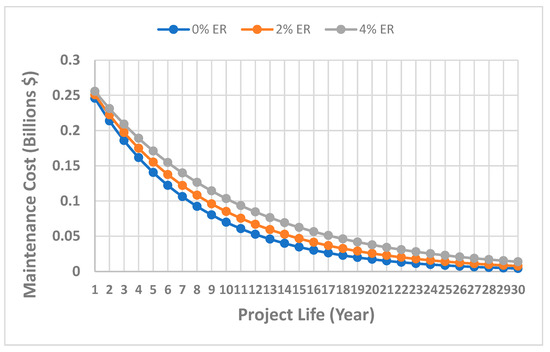
Figure 13.
Escalated maintenance cost for scenario 3.
The results show an increase in maintenance costs with increasing escalation rates due to the positive effect of annual inflation compared to the 0% escalation rate. The decrease in the maintenance costs is due to the discounted constant future yearly values to their present cost to obtain the equivalent base cost, thus reflecting the fluctuating costs in the following years. Hence, ensuring internal consistency of the discounting, inflation, and escalation assumptions utilised in this study.
The lifecycle cost at different escalation rates for the scenarios is illustrated in Figure 14. The lifecycle cost for scenario 1 was USD 22.24 billion for the 0% escalation rate. The lifecycle cost increases by 2.92% and 6.66% assuming 2% and 4% escalation rates, respectively. Similarly, the lifecycle cost for scenario 2 was USD 22.22 billion for the 0% escalation rate. The lifecycle cost increases by 2.92% and 6.64% assuming escalation rates of 2% and 4%, respectively.
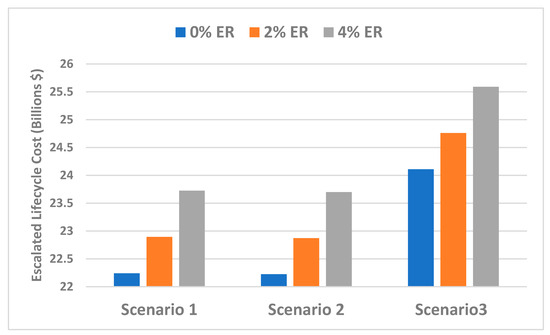
Figure 14.
Lifecycle cost for availability scenarios at different escalation rates.
Additionally, the lifecycle cost for scenario 3 was USD 24.11 billion for the 0% escalation rate. The lifecycle cost increases by 2.70% and 6.15% assuming 2% and 4% escalation rates, respectively, over the project life. Thus, illustrating the influence of inflation on the project lifecycle cost.
4. Conclusions
This study assessed how compressor station availability affects the techno-economics of natural gas pipeline transportation. The following was established:
- The capital cost increased by 10.24% in scenario 3 compared to scenarios 1 and 2. Compressor station availability has a direct impact on the project’s capital cost in terms of the additional first cost incurred from the installed standby units.
- The maintenance costs decrease by 0.94% in scenario 2 and 0.005% in scenario 3, compared to scenario 1. The operational cost of the project is impacted by the decrease in maintenance costs with a decrease in compressor station availability due to the installation of standby units and vice versa.
- At a 15% discount rate, the project lifecycle cost decreases by 0.09% in scenario 2 and increases by 8.41% in scenario 3, compared to scenario 1. Compressor station availability has a significant impact on the lifecycle cost. A rise in compressor station availability results in a corresponding rise in the lifecycle cost estimate. This arises from an increase in capital cost due to additional installed standby units and an increase in maintenance cost due to the increased availability.
- Scenario 3 is the most economically viable alternative among the considered scenarios. This is due to its high compressor station availability and high net present value.
- When the station availability increases by 7.87% with a corresponding increase in additional cost of standby units by 10.24%, the avoided income loss due to station unavailability increases by 14.06% in scenario 3 compared to scenario 2.
- There is a trade-off between the extra capital investment in terms of the additional cost of standby units and operational cost with the avoided loss of income due to station unavailability. More so, the baseline case with a hundred percent compressor station availability is observed to be unrealistic. This is because perpetual operating conditions, even throughout the project lifecycle, are impossible.
The findings have shown the significant impact compressor station availability has on various components of the project lifecycle cost. More so, its importance in minimising engine downtime and improving the revenue generated from the project. The authors could not find any information available in the public domain that has adapted TERA through the inclusion of maintenance/availability modules to assess the effects of station availability on a natural gas pipeline system investment. Consequently, the findings show the significance of this research work as a major contribution to knowledge in this study.
Therefore, compressor station availability analysis could be beneficial in the technical and economic assessment of any transmission pipeline project. This is because the profitability of the project is greatly dependent on compressor station availability. Its ability to minimise engine downtime could mitigate risk or uncertainties associated with the proposed Trans-Saharan gas pipeline or any gas pipeline project. Consequently, the adopted methodology will provide the decision-makers with better insight into the expected risks associated with investment into the proposed Trans-Saharan gas pipeline and any gas pipeline project. The findings in this study could help in forecasting the lifecycle cost and expected performance of the compressor station systems. Furthermore, it could assist in predicting the techno-economic impact that could assist policy makers in decision-making and on the feasibility of the proposed Trans-Saharan gas pipeline and any gas pipeline project. Therefore, the proposed approach utilised in this study will guide decision-makers in the better understanding of the importance of compressor station availability on pipeline techno-economics, thus leading to effective resource and financial management.
5. Limitations and Future Research Directions
Although this study has made some progress to assess the impact of compressor station availability on pipeline techno-economics, some aspects of the economic analysis, particularly the maintenance cost, could be improved in future studies. Future research could focus on finding the correlations between engine availability and maintenance cost for different fleets of engine models. Availability and maintenance databases could be retrieved from either further literature studies or the developed maintenance schedule from [23] while incorporating unplanned downtimes. The outcomes of these further studies would be some developed trendline equations or curves to estimate maintenance cost. These equations could be included in the availability-based maintenance cost models developed in this study. Therefore, future studies should focus on these issues to further improve the accuracy of the analysis.
Author Contributions
Conceptualization, O.B.O.; Methodology, O.B.O.; Software, O.B.O.; Validation, O.B.O., A.H. and P.P.; Formal analysis, O.B.O. and A.H.; Investigation, O.B.O. and A.H.; Resources, O.B.O. and P.P.; Data curation, O.B.O.; Writing—original draft, O.B.O.; Writing—review & editing, O.B.O., A.H. and P.P.; Visualization, O.B.O.; Supervision, A.H. and P.P.; Project administration, O.B.O., A.H. and P.P.; Funding acquisition, O.B.O. All authors have read and agreed to the published version of the manuscript.
Funding
This research was funded by [The Petroleum Technology Development Fund] grant number [PTDF/ED/PHD/OOB/1386/18] And The APC was funded by [Oluwatayo Babatope Ojo].
Data Availability Statement
The original contributions presented in this study are included in the article. Further inquiries can be directed to the corresponding author.
Acknowledgments
The authors are grateful to the Petroleum Technology Development Fund of Nigeria (PTDF/ED/PHD/OOB/1386/18), for funding the PhD research that has led to the publication of this paper.
Conflicts of Interest
The authors declare no conflict of interest.
Nomenclature
| C | Pipe material cost (USD/metric ton); Engine creep life (hours) | Mlmc | Lifecycle availability-based major maintenance cost (USD) |
| Cdp | Expected engine life (hours) | Mlvc | Lifecycle availability-based variable maintenance cost (USD) |
| Co | Initial capital investment | mv | Variable maintenance cost factor (USD/MWh) |
| CF | Annual net cash flow (USD) | mv1 | Maintenance cost factor 1 (USD/MWh) |
| CFa | Annual cash outflow (USD) | mv2 | Maintenance cost factor 2 (USD/MWh) |
| CFj | Net cash flow for year j (USD) | n | Project duration |
| CS | Compressor station | N | Number, Number of installed units |
| D | Pipe diameter (mm) | NPV | Net present value |
| Da | Total Annual downtime (hours) | Of | Operational period (hours) |
| EOH | Equivalent operating hour | O&M | Operation and Maintenance |
| Fac | Annual fuel consumption cost (USD) | Paux | Auxiliaries cost (USD) |
| FC | Compressor correction factor | Pc_w | Pipe coatings and wrapping cost (USD/km) |
| Ff | Fuel flow (kg/s) | Pg | Annual gas production (MMm3) |
| Flc | Lifecycle fuel consumption cost (USD) | PGC | Gas compressor power (kW) |
| Fu | Fuel cost per kg of fuel (USD/kg) | Pi | Pipeline initial project cost (USD) |
| Gp | Gas price USD/MMBtu | PI | Gas compressor installation cost (USD) |
| GC | Gas Compressor | P(K) | Compressor station availability |
| GCC | Gas Compressor cost (USD) | Pmat | Pipeline material cost (USD) |
| GT | Gas turbine | Pp | Gas compressor purchased cost (USD) |
| GTC | Gas turbine capital cost (USD) | Pt | Pipeline cost (USD) |
| GTeq | Gas turbine equipment cost (USD) | PT | Gas turbine power (kW) |
| Hv | Gas higher heating value (Btu/m3) | Pto | Total project capital expenditure |
| j | Year of project cash flow | r | Discount rate |
| L | Pipe length (km) | rl | Lost revenue per hour |
| LC | Techno-economic lifecycle cost (USD) | Rg | Gross annual revenue (USD) |
| M | Marshall & Swift cost index | Rl | Lost annual revenue (USD) |
| MAOP | Maximum allowable operating pressure | Rnet | Net revenue (USD) |
| Mac | Total annual maintenance cost (USD) | t | Project lifecycle |
| Mafc | Annual fixed maintenance cost (USD) | T | Pipe wall thickness (mm) |
| Mamc | Annual availability-based major maintenance cost (USD) | TERA | Techno-economic environmental risk analysis |
| Mavc | Annual availability-based variable maintenance cost (USD) | TET | Turbine entry temperature |
| mf | Fixed maintenance cost factor (USD/kW-year) | TSGP | Trans-Saharan gas pipeline |
| Mlc | Total lifecycle maintenance cost (USD) | x | Outer diameter |
| Mlfc | Lifecycle fixed maintenance cost (USD) | y | Pipeline installation cost (USD/km) |
| Subscripts | |||
| a | Annual | lc | Lifecycle cost |
| ac | Annual cost | lmc | Lifecycle maintenance cost |
| afc | Annual fixed cost | lvc | Lifecycle variable cost |
| amc | Annual maintenance cost | mat | material |
| aux | Auxiliary | o | operation |
| avc | Annual variable cost | p | purchase |
| c | Cost | to | Total |
| dp | Design point | T | Turbine |
| eq | Equipment | u | unit |
| f | Flow, factor | v | Variable |
| g | Gas, gross | ||
| i | Initial | ||
| I | Installation | ||
| j | Year | ||
| l | Lifecycle, lost | ||
References
- Zhou, J.; Qin, C.; Fu, T.; Liu, S.; Liang, G.; Li, C.; Hong, B. Automatic response framework for large complex natural gas pipeline operation optimization based on data-mechanism hybrid-driven. Energy 2024, 307, 132610. [Google Scholar] [CrossRef]
- Liu, Z.E.; Long, W.; Chen, Z.; Littlefield, J.; Jing, L.; Ren, B.; Masnadi, M.S. A novel optimization framework for natural gas transportation pipeline networks based on deep reinforcement learning. Energy AI 2024, 18, 100434. [Google Scholar] [CrossRef]
- Sharma, B.; Khare, S.K. Optimizing Multi-Product Pipeline Network Configuration Design: A Comprehensive Framework With Objective Function Sensitivity Analysis. IEEE Access 2024, 12, 18804–18820. [Google Scholar] [CrossRef]
- Wei, X.; Qiu, R.; Zhang, B.; Liu, C.; Wang, G.; Wang, B.; Liang, Y. Operation optimization of large-scale natural gas pipeline networks based on intelligent algorithm. Energy 2024, 310, 133258. [Google Scholar] [CrossRef]
- Ghilardi, L.M.P.; Casella, F.; Barbati, D.; Palazzo, R.; Martelli, E. A detailed MILP model and an ad hoc decomposition algorithm for the operational optimization of gas transport networks. Comput. Chem. Eng. 2025, 195, 109006. [Google Scholar] [CrossRef]
- Üster, H.; Dilaveroǧlu, Ş. Optimization for design and operation of natural gas transmission networks. Appl. Energy 2014, 133, 56–69. [Google Scholar] [CrossRef]
- Hong, B.; Gao, W.; Yang, M.; Zhou, B.; Lu, Y.; Gong, J.; Wen, K. Balancing economy, user guarantee, and carbon emissions towards sustainable natural gas pipeline network planning. Comput. Ind. Eng. 2025, 200, 110858. [Google Scholar] [CrossRef]
- Liang, G.; Li, C.; Zhou, J.; Liu, S.; Li, Z.; Fu, W.; Peng, J. Multi-period expansion optimization model and algorithm considering the diameter discrete characteristics and hydraulic condition. Geoenergy Sci. Eng. 2025, 246, 213581. [Google Scholar] [CrossRef]
- Rigatos, G.; Abbaszadeh, M.; Sari, B.; Siano, P.; Cuccurullo, G.; Zouari, F. Nonlinear optimal control for a gas compressor driven by an induction motor. Results Control. Optim. 2023, 11, 100226. [Google Scholar] [CrossRef]
- Nasir, A. Techno-Economic Study of Gas Turbine in Pipeline Applications. Ph.D. Thesis, Cranfield University, Bedford, UK, 2013. [Google Scholar]
- Rasmussen, P.; Kurz, R. Centrifugal compressor applications—Upstream and midstream. In Proceedings of the Thirty-Eight Turbomachinery Symposium, Houston, TX, USA, 14–17 September 2009; Turbomachinery Laboratory, Texas A & M University. pp. 169–186. [Google Scholar]
- Xiong, Z.; Liu, Y.; Cai, Y.; Chang, W.; Wang, Z.; Li, Z.; Peng, S. Research on the effect of green hydrogen blending on natural gas centrifugal compressor performance. Renew. Energy 2025, 242, 122378. [Google Scholar] [CrossRef]
- Sutoyo, H.R.D.; Angga, I.G.A.G.; Schümann, H.; Berg, C.F. Energy efficiency of oil and gas production plant operations. Geoenergy Sci. Eng. 2023, 226, 211759. [Google Scholar] [CrossRef]
- Kurz, R.; Lubomirsky, M.; Brun, K. Gas compressor station economic optimization. Int. J. Rotating Mach. 2012, 2012, 1–9. [Google Scholar] [CrossRef]
- Li, X.; Xue, Y.; Li, Y.; Feng, Q. An Optimization Method for a Compressor Standby Scheme Based on Reliability Analysis. Energies 2022, 15, 8305. [Google Scholar] [CrossRef]
- Al Zawaideh, A.; Al Hosani, K.; Boiko, I.; Hammadih, M.L. Minimum Energy Adaptive Load Sharing of Parallel Operated Compressors. IEEE Open J. Ind. Appl. 2022, 3, 178–191. [Google Scholar] [CrossRef]
- Arya, A.K.; Kumar, A.; Pujari, M.; Pacheco, D.A.D.J. Improving natural gas supply chain profitability: A multi-methods optimization study. Energy 2023, 282, 128659. [Google Scholar] [CrossRef]
- Boyce, M.P. Gas Turbine Engineering Handbook, 4th ed.; Elsevier: Oxford, UK, 2012. [Google Scholar]
- Safie, F.M.; Ring, R.W.; Cole, S.K. Reliability and Maintainability analysis of a high air pressure compressor facility. In Proceedings of the 2013 Proceedings Annual Reliability and Maintainability Symposium (RAMS), Orlando, FL, USA, 28–31 January 2013; pp. 1–6. [Google Scholar] [CrossRef][Green Version]
- Allen, C.W.; Lubomirsky, M. Risk modeling of gas pipeline availability. Appl. Math. Model. 2025, 144, 116091. [Google Scholar] [CrossRef]
- Tukur, N. Techno-Economics of Natural Gas Pipeline Compression System. Ph.D. Thesis, Cranfield University, Bedford, UK, 2018. [Google Scholar]
- Aziaka, D. Techno-Economic Study of Degraded Gas Turbine and Centrifugal Compressor on Pipeline Application in the Oil and Gas Industry. Ph.D. Thesis, Cranfield University, Bedford, UK, 2020. [Google Scholar]
- Ojo, O.B. Introduction of Social Benefits to the TERA—Gas Turbines and Pipelines. Ph.D. Thesis, Cranfield University, Bedford, UK, 2023. [Google Scholar]
- Ojo, O.B.; Igie, U.; Pilidis, P. Techno-Economic Optimisation of Gas Compressor Station Location as a Decision Variable. In Proceedings of the ASME Turbo Expo: Power for Land, Sea and Air, 2024, No. GT2024-126805, American Society of Mechanical Engineers, London, UK, 24–28 June 2024; pp. 1–13. [Google Scholar]
- El-Suleiman, A. Gas Turbine Application to CO2 Pipeline: A Techno-Economic and Environmental Risk Analysis. Ph.D. Thesis, Cranfield University, Bedford, UK, 2014. [Google Scholar]
- Xenos, D.P.; Lunde, E.; Thornhill, N.F. Optimal operation and maintenance of gas compressor stations: An integrated framework applied to a large-scale industrial case. J. Eng. Gas. Turbine Power 2016, 138, 4. [Google Scholar] [CrossRef]
- Bohlin, M.; Wärja, M. Optimizing maintenance for multi-unit industrial gas turbine installations. In Proceedings of the ASME Turbo Expo 2010: Power for Land, Sea, and Air, ASME, Glasgow, UK, 14–18 June 2010; pp. 1–10. [Google Scholar] [CrossRef]
- Aretakis, N.; Roumeliotis, I.; Doumouras, G.; Mathioudakis, K. Compressor washing economic analysis and optimization for power generation. Appl. Energy 2012, 95, 77–86. [Google Scholar] [CrossRef]
- Kurz, R.; Brun, K. Degradation of gas turbine performance in natural gas service. J. Nat. Gas. Sci. Eng. 2009, 1, 95–102. [Google Scholar] [CrossRef]
- Jiao, K.; Wang, P.; Wang, Y.; Yu, B.; Bai, B.; Shao, Q.; Wang, X. Study on the multi-objective optimization of reliability and operating cost for natural gas pipeline network. Oil Gas. Sci. Technol. 2021, 76, 42. [Google Scholar] [CrossRef]
- Zhou, D.; Huang, D.; Jia, X.; Li, T.; Wang, C.; Wang, D.; Ren, Y. Study on the maintenance scheduling model for compressor units of long-distance natural gas networks considering actual maintenance demands. J. Nat. Gas. Sci. Eng. 2021, 94, 104065. [Google Scholar] [CrossRef]
- Zhao, Z.; Kumar, D.; Zhang, C.; Li, H.; Timalsina, S. Techno-economic analysis of green hydrogen integration into existing pipeline infrastructure: A case study of Wyoming. Int. J. Hydrogen Energy 2024, 93, 574–584. [Google Scholar] [CrossRef]
- Wolf, N.; Kühn, L.; Höck, M. International supply chains for a hydrogen ramp-up: Techno-economic assessment of hydrogen transport routes to Germany. Energy Convers. Manag. X 2024, 23, 100682. [Google Scholar] [CrossRef]
- Solomon, M.D.; Scheffler, M.; Heineken, W.; Ashkavand, M.; Birth-Reichert, T. Pipeline Infrastructure for CO2 Transport: Cost Analysis and Design Optimization. Energies 2024, 17, 11. [Google Scholar] [CrossRef]
- Mohammad Sakhai, A.; Salimi, M.; Amidpour, M. Techno-economic evaluation for development of onshore carbon dioxide pipeline networks. Gas Process. J. 2022, 10, 45–66. [Google Scholar]
- Di Lullo, G.; Giwa, T.; Okunlola, A.; Davis, M.; Mehedi, T.; Oni, A.O.; Kumar, A. Large-scale long-distance land-based hydrogen transportation systems: A comparative techno-economic and greenhouse gas emission assessment. Int. J. Hydrogen Energy 2022, 47, 35293–35319. [Google Scholar] [CrossRef]
- Huang, H.; Sun, X.; Li, J.; Yu, B.; Wang, X.; Pu, M.; Ma, L. Economic analysis of blending hydrogen into natural gas pipelines: Supply chain and station modification. Int. J. Hydrogen Energy 2025, 118, 300–311. [Google Scholar] [CrossRef]
- Cheng, W.; Cheng, Y.F. A techno-economic study of the strategy for hydrogen transport by pipelines in Canada. J. Pipeline Sci. Eng. 2023, 3, 3. [Google Scholar] [CrossRef]
- Chen, Q.; Zhang, T.; Qadrdan, M. Assessing Techno-Economic and Environmental Impacts of Gas Compressor Fleet as a Source of Flexibility to the Power System. IEEE Trans. Energy Mark. Policy Regul. 2023, 1, 274–285. [Google Scholar] [CrossRef]
- Alhassan, F.; Zahid, U. Economic feasibility of hydrogen transportation network in Saudi Arabia. Int. J. Hydrogen Energy 2025, 98, 454–466. [Google Scholar] [CrossRef]
- Yu, Q.; Hao, Y.; Ali, K.; Hua, Q.; Sun, L. Techno-economic analysis of hydrogen pipeline network in China based on levelized cost of transportation. Energy Convers. Manag. 2024, 301, 118025. [Google Scholar] [CrossRef]
- Miao, H.; Yu, Y.; Wan, Y.; Zhang, Y.; Ma, T. Levelized cost of long-distance large-scale transportation of hydrogen in China. Energy 2024, 310, 133201. [Google Scholar] [CrossRef]
- Dukku, H.B.; Arnaut, J.; Johnstone, C.; Riccardi, A.; Sanchez, S.O. Techno-Economic Feasibility Study of Hydrogen Transportation in Greenland Using Pipeline and Maritime Routes. J. Ocean. Eng. Technol. 2025, 39, 122–132. [Google Scholar] [CrossRef]
- Wen, K.; Qiao, D.; Nie, C.; Lu, Y.; Wen, F.; Zhang, J.; Hong, B. Multi-period supply and demand balance of large-scale and complex natural gas pipeline network: Economy and environment. Energy 2023, 264, 126104. [Google Scholar] [CrossRef]
- Shan, X.; Yu, W.; Hu, B.; Wen, K.; Ren, S.; Men, Y.; Hong, B. A methodology to determine target gas supply reliability of natural gas pipeline system based on cost-benefit analysis. Reliab. Eng. Syst. Saf. 2024, 251, 110364. [Google Scholar] [CrossRef]
- Inner City Fund. Feasibility and Impacts of Domestic Content Requirements for U.S. Oil and Gas Pipelines; Inner City Fund: Fairfax, VA, USA, 2017. [Google Scholar]
- Menon, E.S. Gas Pipeline Hydraulics; Taylor and Francis: Boca Raton, FL, USA, 2005. [Google Scholar] [CrossRef]
- Directorate-General for Energy European Gas Market Report, Market Observatory for Energy. Available online: https://ec.europa.eu/energy/sites/ener/files/quarterly_report_on_european_gas_markets_q4_2019_final.pdf (accessed on 5 July 2020).
- ESSOM Co. LTD. Heating Values of Hydrogen and Fuels. Available online: https://chemeng.queensu.ca/courses/CHEE332/files/ethanol_heating-values.pdf (accessed on 5 July 2020).
- National Renewable Energy Laboratory. Annual Technology Baseline (ATB) Data. Available online: https://atb.nrel.gov/electricity/2019/data.html (accessed on 3 June 2020).
- Sargent and Lundy. Capital Cost and Performance Characteristic Estimates for Utility Scale Electric Power Generating Technologies. Available online: https://www.eia.gov/analysis/studies/powerplants/capitalcost/pdf/capital_cost_AEO2020.pdf (accessed on 25 April 2020).
- Obhuo, M. Techno-Economic and Environmental Risk Assessment of Gas Turbines for Use with Flared Associated Gases. Ph.D. Thesis, Cranfield University, Bedford, UK, 2017. [Google Scholar]
- Parker, N. Using Natural Gas Transmission Pipeline Costs to Estimate Hydrogen Pipeline Costs. California. 2004. Available online: http://escholarship.org/uc/item/9m40m75r (accessed on 27 July 2019).
- Marshall Swift Valuation Services. Report—Inventory Index Factors. 2018. Available online: https://www.freestonecad.org/home/DataRecords (accessed on 7 February 2025).
- Gas Turbine World. Gas Turbine World; Pequot Publishing: Fairfield, CT, USA, 2018; Volume 33. [Google Scholar]
- Aziaka, D.; Tukur, N.; Pilidis, P. Techno-economic evaluation of pipeline compression system: Economic evaluation of the natural gas pipeline compression system. Int. J. Mech. Eng. Technol. (IJMET) 2019, 10, 133–154. [Google Scholar]
- Gad-Briggs, A.; Haslam, A.; Laskaridis, P. Effect of change in role of an aircraft on engine life. Aeronaut. J. 2013, 117, 1053–1070. [Google Scholar] [CrossRef][Green Version]
Disclaimer/Publisher’s Note: The statements, opinions and data contained in all publications are solely those of the individual author(s) and contributor(s) and not of MDPI and/or the editor(s). MDPI and/or the editor(s) disclaim responsibility for any injury to people or property resulting from any ideas, methods, instructions or products referred to in the content. |
© 2025 by the authors. Licensee MDPI, Basel, Switzerland. This article is an open access article distributed under the terms and conditions of the Creative Commons Attribution (CC BY) license (https://creativecommons.org/licenses/by/4.0/).