Article

Sampling-Based Next-Event Prediction for Wind-Turbine Maintenance Processes

1
School of Electrical and Electronic Engineering, Shandong University of Technology, Zibo 255000, China
2
NOVA Information Management School, Nova University of Lisbon, 1070-312 Lisbon, Portugal
3
College of Computer Science and Engineering, Shandong University of Science and Technology, Qingdao 266590, China
4
School of Control Science and Engineering, Shandong University, Jinan 250100, China
5
Department of Computer Science and Engineering, Southern University of Science and Technology, Shenzhen 518055, China
6
School of Control and Computer Engineering, North China Electric Power University, Beijing 102206, China
*
Author to whom correspondence should be addressed.
Energies 2025, 18(16), 4238; https://doi.org/10.3390/en18164238 (registering DOI)
Submission received: 6 July 2025 / Revised: 30 July 2025 / Accepted: 4 August 2025 / Published: 9 August 2025
(This article belongs to the Section A3: Wind, Wave and Tidal Energy)

Abstract

Accurate and efficient next-event prediction in wind-turbine maintenance processes (WTMPs) is crucial for proactive resource planning and early fault detection. However, existing deep-learning-based prediction approaches often encounter performance challenges during the training phase, particularly when dealing with large-scale datasets. To address this challenge, this paper proposes a Sampling-based Next-event Prediction (SaNeP) approach for WTMPs. More specifically, a novel event log sampling technique is proposed to extract a representative sample from the original WTMP training log by quantifying the importance of individual traces. The trace prefixes of the sampled logs are then encoded using one-hot encoding and fed into six deep-learning models designed for next-event prediction. To demonstrate the effectiveness and applicability of the proposed approach, a real-life WTMP event log collected from the HuangYi wind farm in Hebei Province, China, is used to evaluate the prediction performance of various sampling techniques and ratios across six predictive models. Experimental results demonstrate that, at a 30% sampling ratio, SaNeP combined with the LSTM model achieves a 3.631-fold improvement in prediction efficiency and a 6.896% increase in prediction accuracy compared to other techniques.

1. Introduction

Global low-carbon policies are accelerating the development of new energy sources as non-renewable energy sources become increasingly scarce. Among various renewable and clean energy sources, wind-energy resources are abundant and widely distributed across the globe. Wind turbines convert wind power into electricity and have become a key focus in the development of sustainable energy applications. With the increase in the installed scale of wind turbines, efficient and intelligent operation and maintenance (O&M) of wind turbines have attracted widespread attention from both industry and academia in [1]. Wind turbines are usually installed in remote areas and have been exposed to wind and the sun for a long time. This often leads to frequent equipment failures and high maintenance costs. To reduce maintenance costs and improve the maintenance efficiency of wind turbines, predictive monitoring of wind-turbine maintenance processes (WTMPs) has become increasingly important. In general, process predictive monitoring (PPM) enhances processes by predicting the future state of running processes [2,3].
As a typical approach to PPM, the next-event prediction for WTMPs enables proactive resource planning and potential fault detection, contributing significantly to the sustainability of the modern wind-energy industry. Existing next-event prediction approaches [4,5,6], such as Markov chain approaches, random forests, and probabilistic finite automata, typically rely on manual feature extraction, which is highly computationally expensive. In recent years, next-event prediction approaches using deep-learning models, e.g., LSTM [7], GRU [8], Bi-LSTM [9], Bi-GRU [10], RNN [11], and Transformer [12], have received widespread attention from both academia and industry due to their superior prediction accuracy. However, existing deep-learning-based prediction approaches typically suffer performance challenges during the model training phase when faced with large-scale datasets. To address this challenge, this paper proposes a Sampling-based Next-event Prediction (SaNeP) approach for WTMPs. The main contributions of this paper can be summarized as follows.
  • This paper presents an approach for obtaining sampled logs based on trace importance values. First, the importance of each trace in the event log is quantified, and traces with higher importance are selected to form the sampled log. This approach effectively reduces the computational resources required for next-event prediction in wind turbines, enhances experimental efficiency, and mitigates the risk of overfitting. Unlike commonly used approaches such as random and stratified sampling, the proposed approach treats the complete trace as the basic unit, thereby preserving the temporal order and dependencies of events, while effectively capturing the primary execution paths;
  • This approach utilizes one-hot encoding to recode the trace prefixes, where each activity is represented as an independent ternary vector, offering a straightforward and unambiguous representation. Based on these encoded sequences, six prediction models are designed to capture the temporal dependencies between events and the underlying causal structure of the process, thereby enhancing next-event prediction performance in wind turbines. Moreover, the use of one-hot encoding enables the models to better learn the logical flow and sequence characteristics of WTMPs, which improves generalization and reduces the risk of overfitting.
The rest of this paper is organized as follows. Section 2 presents a review of related work. Section 3 introduces preliminaries. Section 4 details the proposed SaNeP approach. Section 5 presents the experimental results, and finally Section 6 concludes the paper.

2. Relation Work

2.1. Wind-Turbine Maintenance Management

Enhancing the reliability, availability, maintainability, and safety of wind turbines is crucial for improving the overall efficiency and cost-effectiveness of the wind-energy industry. Edson et al. [13] applied process mining techniques to develop a predictive model that integrates probabilistic reasoning within a Bayesian network, aiming to reduce maintenance costs and improve equipment availability. The model enables dynamic simulation of incident probabilities and supports managers in formulating optimized maintenance plans. Dong et al. [14] established an efficiency cloud model for wind-energy conversion and a performance cloud model for electric energy production to evaluate the operational efficiency and performance of wind turbines. This approach not only assesses the running state of wind turbines but also provides a theoretical foundation for achieving efficient O&M in wind farms. Rocchetta et al. [15] developed a power grid O&M management system optimized by a reinforcement learning framework, which includes generator control, maintenance delay, and prediction. The framework leverages the operational status and environmental data of power grid components to determine the optimal actions for maximizing expected profit.
So far, there has been a significant increase in related research on artificial intelligence in wind-turbine maintenance management (WTMM). It mainly includes statistical approaches, trend analysis, and Fourier transform techniques to model system behavior and optimize maintenance strategies [16,17,18]. For instance, the statistical approaches use large-scale data to evaluate relevant statistical features and support decision-making in various predictive tasks. The common techniques include Bayesian analysis [19], Markov processes [20], and Monte Carlo simulation [21]. In general, AI-based WTMM research has mainly focused on decision-making, predictive maintenance [18], and fault detection. In contrast to existing works, this paper focuses on the maintenance process of wind turbines, aiming to improve the efficiency and intelligence of next-event prediction within WTMPs.

2.2. Business Process Next-Event Prediction

Inspired by advances in the field of natural language processing, various deep-learning approaches have been applied to next-event prediction in business processes. For example, Everman et al. [7] predicted the next event by re-encoding the event attributes embedded in the LSTM. Hussain et al. present an algorithm for hyperparameter tuning and sliding window step optimization based on the GRU model in [22]. The optimized model demonstrated improves prediction accuracy and stability. Most deep-learning approaches only use the event sequence as input to build the prediction model, without considering the influence of the event attributes. In addition, RNNs such as LSTM and GRU tend to lose feature information when processing long event sequences. Directly incorporating all event attributes into model training may introduce noise and reduce prediction accuracy.
Jalayer et al. [9] proposed an enhanced Bi-LSTM model with a two-layer attention mechanism to improve next-event prediction performance, demonstrating superior accuracy compared to existing approaches. However, as the complexity of the network structure increases, thousands of parameters are needed in the training phase, which leads to a long model training time. More recently, Mohammdi et al. [23] employed a Transformer model with a self-attention mechanism to improve prediction performance accuracy and decrease computational complexity in time series prediction problems. To evaluate and validate the impact of different deep-learning models on predicting the next event in the WTMPs, six deep-learning models are designed and compared. In summary, existing deep-learning-based prediction approaches have the following two limitations: (1) most existing work focuses on modifying model architectures to improve the accuracy of the next-event prediction while neglecting the importance of the data; and (2) the computational cost is high and the training time is long for most existing approaches.

2.3. Business Process Event Log Sampling

Event log sampling techniques offer a novel way to speed up process discovery efficiency. Mohammadreza et al. [24,25,26] proposed various sampling strategies based on the simple trace-level features such as frequency, length, and similarity. These approaches can efficiently handle large-scale event logs. However, the quality of the resulting sample logs is low. Alessandro Berti et al. [27] proposed a sampling technique that randomly selects traces based on activity dependencies. However, this approach is only theoretically described and lacks empirical validation, limiting its practical applicability. Martin Baur et al. [28] proposed an advanced statistical sampling technique that reduces both running time and memory occupation of the algorithm. Nevertheless, the order of the traces will have an effect on the sampling results. Although these approaches are effective for handling large event logs, they often compromise the quality and representativeness of the sampled logs.
To further improve sample log quality, the well-known LogRank sampling technique [29] first obtains a small representative sample log from a large-scale one, then the sample log is used instead of the original one. However, the sampling time required by the LogRank may be much longer for complex event logs. To improve sampling efficiency, the LogRank+ [30] sampling technique was proposed by calculating the similarity value between the trace and the remaining trace in the log. Considering the impact of both activities and variants in the log, Fani et al. [31] proposed sampling techniques such as Variant-last and Trace-last. These approaches effectively improved the prediction efficiency. However, this approach may result in the loss of certain activities and activity relationship pairs from the original log, leading to incomplete behavioral representations in the sampled log. Nevertheless, most existing sampling techniques are focused on improving the process discovery performance; they cannot be directly applied to the next-event prediction. Furthermore, the overall performance and generalization ability of these sampling techniques remain limited in real-world scenarios.

3. Preliminaries

3.1. Wind-Turbine Maintenance Process Event Logs

An event log is a set of traces where each trace represents a single execution of the process. A trace consists of a sequence of chronologically ordered events, with each event corresponding to the execution of an activity. Each activity represents an operation step in a WTMP. The event log records the specific execution information of the WTMP, including the resources involved and the completion time of each execution event, as shown in Table 1. By analyzing the attributes of each event, maintenance personnel can allocate the appropriate resources more effectively, thereby improving resource utilization and maintenance efficiency.
Definition 1 
(Events, Attributes [32]). Let ε be the event universe, i.e., the set of all possible event identifiers. Let AT be a set of attributes. For any e ε and attribute n AT : # n ( e ) represents the value of attribute n for event e. Let UC be the case id universe, # case ( e ) U C is the case ID associated with event e. Let UA be the activity universe, # act ( e ) U A is the activity name associated with event e. Let UT be the time stamp universe, # time ( e ) U T is the time stamp associated with event e. Let UR be the resource universe, # res ( e ) U R is the resource name associated with event e.
According to Table 1, each row refers to an event that involves four attributes, i.e., Case ID, Activity, Timestamp, Resource. More specifically, # case ( e 1 ) =  102C20200003, # a c t ( e 1 ) =  Work Permit form Completion (WPC), # t i m e ( e 1 )  = 2020/1/20 10:16:00, # r e s ( e 1 ) = P e t e r .
Definition 2 
(Trace, Trace Prefix [29]). A trace is a finite sequence of events, i.e., σ ε * , such that each event appears only once and all events are ordered by the timestamp. t p k ( σ ) is a trace prefix of σ, i.e., the sub-sequence consisting of the first k elements of σ.
Table 1 contains the traces with Case ID 102C20200003 in the WTMP event log, i.e., σ = e 1 , e 2 , e 3 , e 4 , e 5 . The event sequence e 1 , e 2 , e 3 , e 4 is the trace prefix of the event e 5 .
Definition 3 
(Directly follows Relation [29]). In trace σ = e 1 , e 2 , , e n , the event e b immediately follows event e a , and therefore, we define a directly follows relation between e a and e b , which is represented as e a , e b .
As shown in Table 1, the next event of e 2 is e 3 for trace σ = e 1 , e 2 , e 3 , e 4 , e 5 , and its directly follows relation set is [ e 1 , e 2 , e 2 , e 3 , e 3 , e 4 , e 4 , e 5 ] .
Definition 4 
(Event Log Sampling Techniques [33]). An event log is defined as a finite set of traces, i.e., L ε * . A log sampling technique is defined as a function ℘ from an original log L 0 to a subset log L s L 0 such that for any σ L s , we have σ L 0 . L s is named the sample log of L 0 .
For example, the original WTMP event log is represented as L 0 , the sample log L s can be obtained using event log sampling techniques by taking as input the WTMP event log, i.e., ( L 0 ) = L s = { σ n } , n < | L 0 | . | L 0 | is the number of traces contained in the event log L 0 .

3.2. Next-Event Prediction

The input of the next-event prediction is a set of trace prefixes, and the output is the probability that an event may occur next. The event with the highest probability is taken as the prediction result. The specific description of the next-event prediction is as follows.
The next-event prediction process aims to predict the event e k + 1 using the trace prefix t p k ( σ ) . Figure 1 shows the working mechanism. More specifically, the position of the red box is the prediction point for the next-event prediction, and the next event e k + 1 is predicted using the attributes ( n 1 , , n m ) contained in each event in the trace prefix.

4. Sampling-Based Next-Event Prediction for the WTMP

4.1. An Approach Overview

This section introduces an approach overview of the proposed SaNeP for WTMPs, which consists of two main phases as shown in Figure 2.
  • Phase 1. WTMP Event Log Pre-processing and Sampling. The WTMP event log is first divided into a training log and a validation one before the prediction model construction. A novel event log sampling technique is proposed to extract a representative sample from the original WTMP training log by quantifying the importance of individual traces. Please note that all existing sampling techniques can be applied in this phase, and the sampling process reduces the scale of the training log; therefore, the model training time is reduced; and
  • Phase 2. Model Training and Prediction. The trace prefixes of the sampled logs are encoded using one-hot encoding and fed into six deep-learning models designed for next-event prediction. Please note that six state-of-the-art deep-learning prediction models, including LSTM, GRU, Bi-GRU, Bi-LSTM, RNN, and Transformer, are applied as baselines. Accuracy is used to quantify the prediction quality of the sampled log with respect to the original one. As for performance, the sum of the sampling time and the prediction time using the sampled log is compared to the prediction time required by the original WTMP event log.

4.2. WTMP Event Log Sampling

A novel event log sampling technique is proposed to extract a representative subset of traces from the original training log by quantifying the importance of traces, and the sampled log is used to train the prediction model instead of the original one to reduce training time.
The importance of a trace can be quantified by the behavior it contains. Please note that behavior refers to activities and directly follows relations, as these elements are essential for next-event prediction. Therefore, the importance of a trace is quantified by the importance of activities and directly follows relations. The proposed sampling technique, denoted as Trace-Im, first calculates an importance value for each trace and then selects the most important ones to build the sampled log. The formula for calculating the importance of traces is given below, and finally, the trace with the highest importance is selected to form the sampled log.
n u m b ( a , L ) = σ L { σ | 1 i | σ | σ ( i ) = a }
where n u m b ( a , L ) denotes the number of traces that contain activity a in the event log L. The importance of activity a in the L, represented as i m p ( a , L ) , is computed as follows.
i m p ( a , L ) = n u m b ( a , L ) | L |
n u m b ( a , b , L ) = σ L σ 1 i | σ | 1 σ ( i ) = e σ ( i + 1 ) = b
where n u m b ( a , b , L ) denotes the number of traces that contain directly follows relation a , b in the L.
The importance of the directly follows relation a , b in the L, represented as i m p ( a , b , L ) , is computed as follows.
imp ( a , b , L ) = numb ( a , b , L ) | L |
Given a trace σ L , its average activity importance in the L, represented as i m p A c t ( σ , L ) , and its average directly follows relation importance in the L, represented as i m p D f r ( σ , L ) , are computed as follows.
i m p A c t ( a , b , L ) = i = 1 | σ | i m p ( σ ( i ) , L ) | σ |
i m p D f r ( σ , L ) = i = 1 | σ | 1 i m p ( σ ( i ) , σ ( i + 1 ) , L ) | σ | 1
where i = 1 | σ | i m p ( σ ( i ) , L ) denotes the sum importance values of all activities in trace σ , i = 1 | σ | 1 i m p ( σ ( i ) , σ ( i + 1 ) , L ) denotes the sum of importance values of all directly follows relations in trace σ .
The importance of trace σ in the L is computed as follows.
i m p S u m ( σ , L ) = 1 i m p A c t ( σ , L ) + i m p D f r ( σ , L ) 2

4.3. Sampling-Based Prediction Model Training and Next-Event Prediction

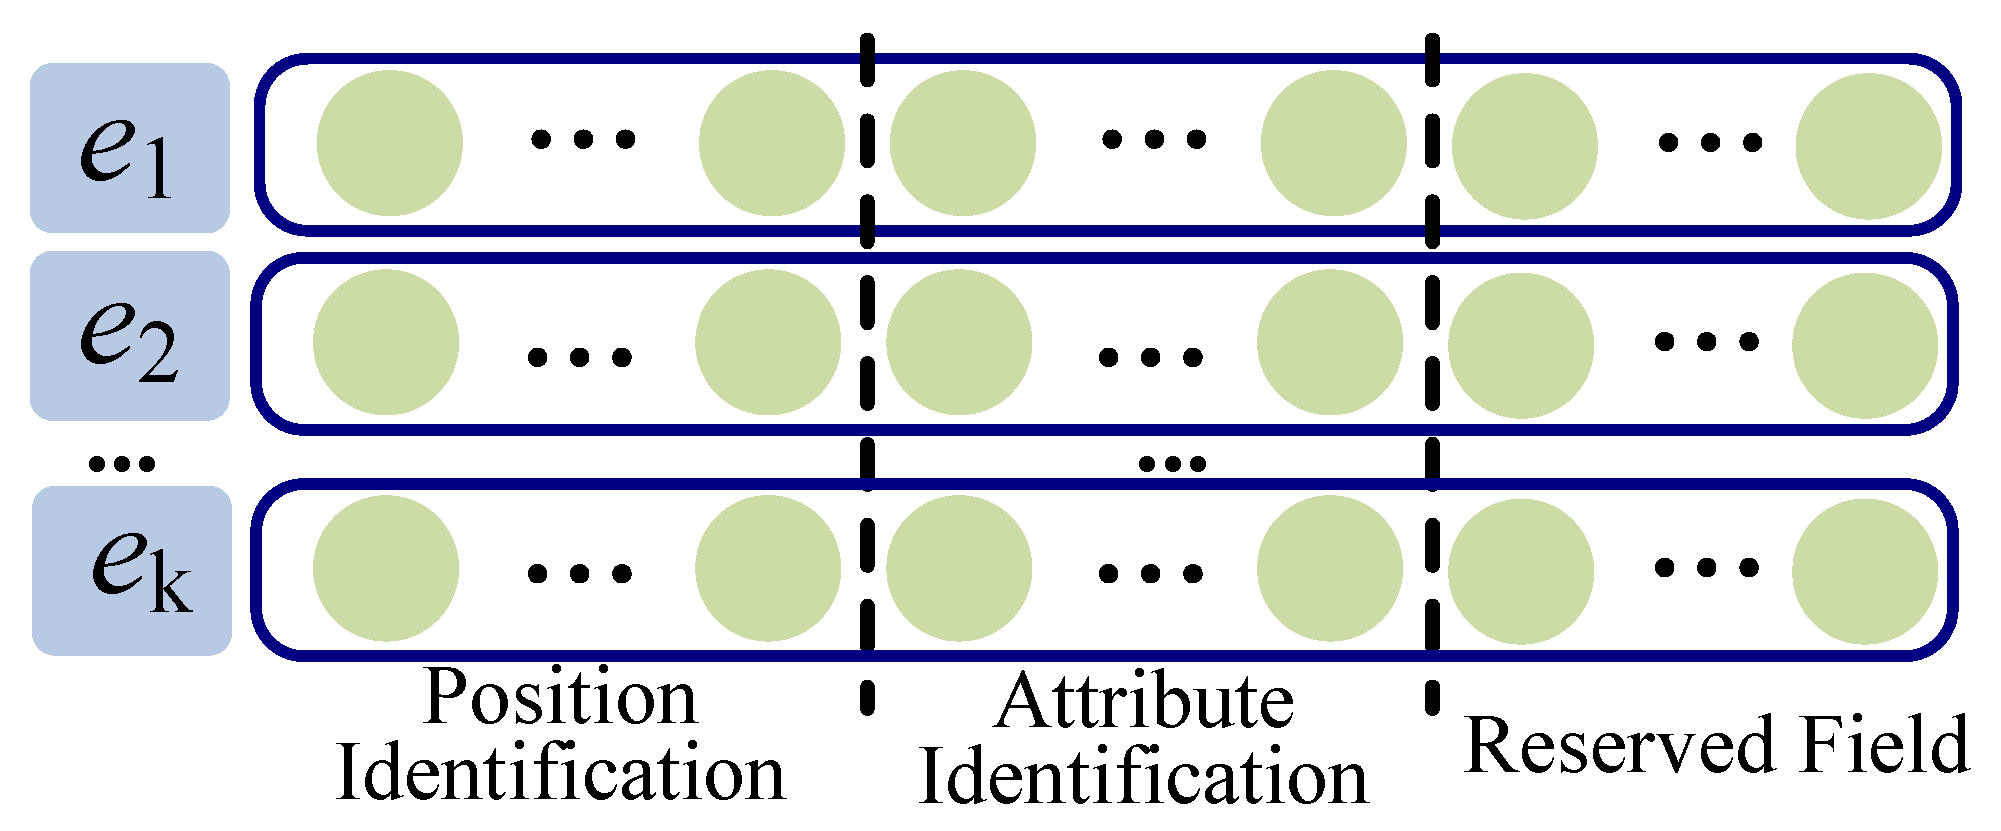
After obtaining the sampled log, the SaNeP approach recodes the corresponding trace prefixes using a one-hot-based encoding scheme, as illustrated in Figure 3. This encoding comprises three components: position identifiers, attribute features, and reserved fields. The position identifiers specify the position of each event within the trace. The attribute features capture temporal characteristics, including the time interval between consecutive events, the offset from the current event to midnight, and the weekly timestamp of the current event. The reserved fields address discrepancies in the number of events between the training and validation logs.
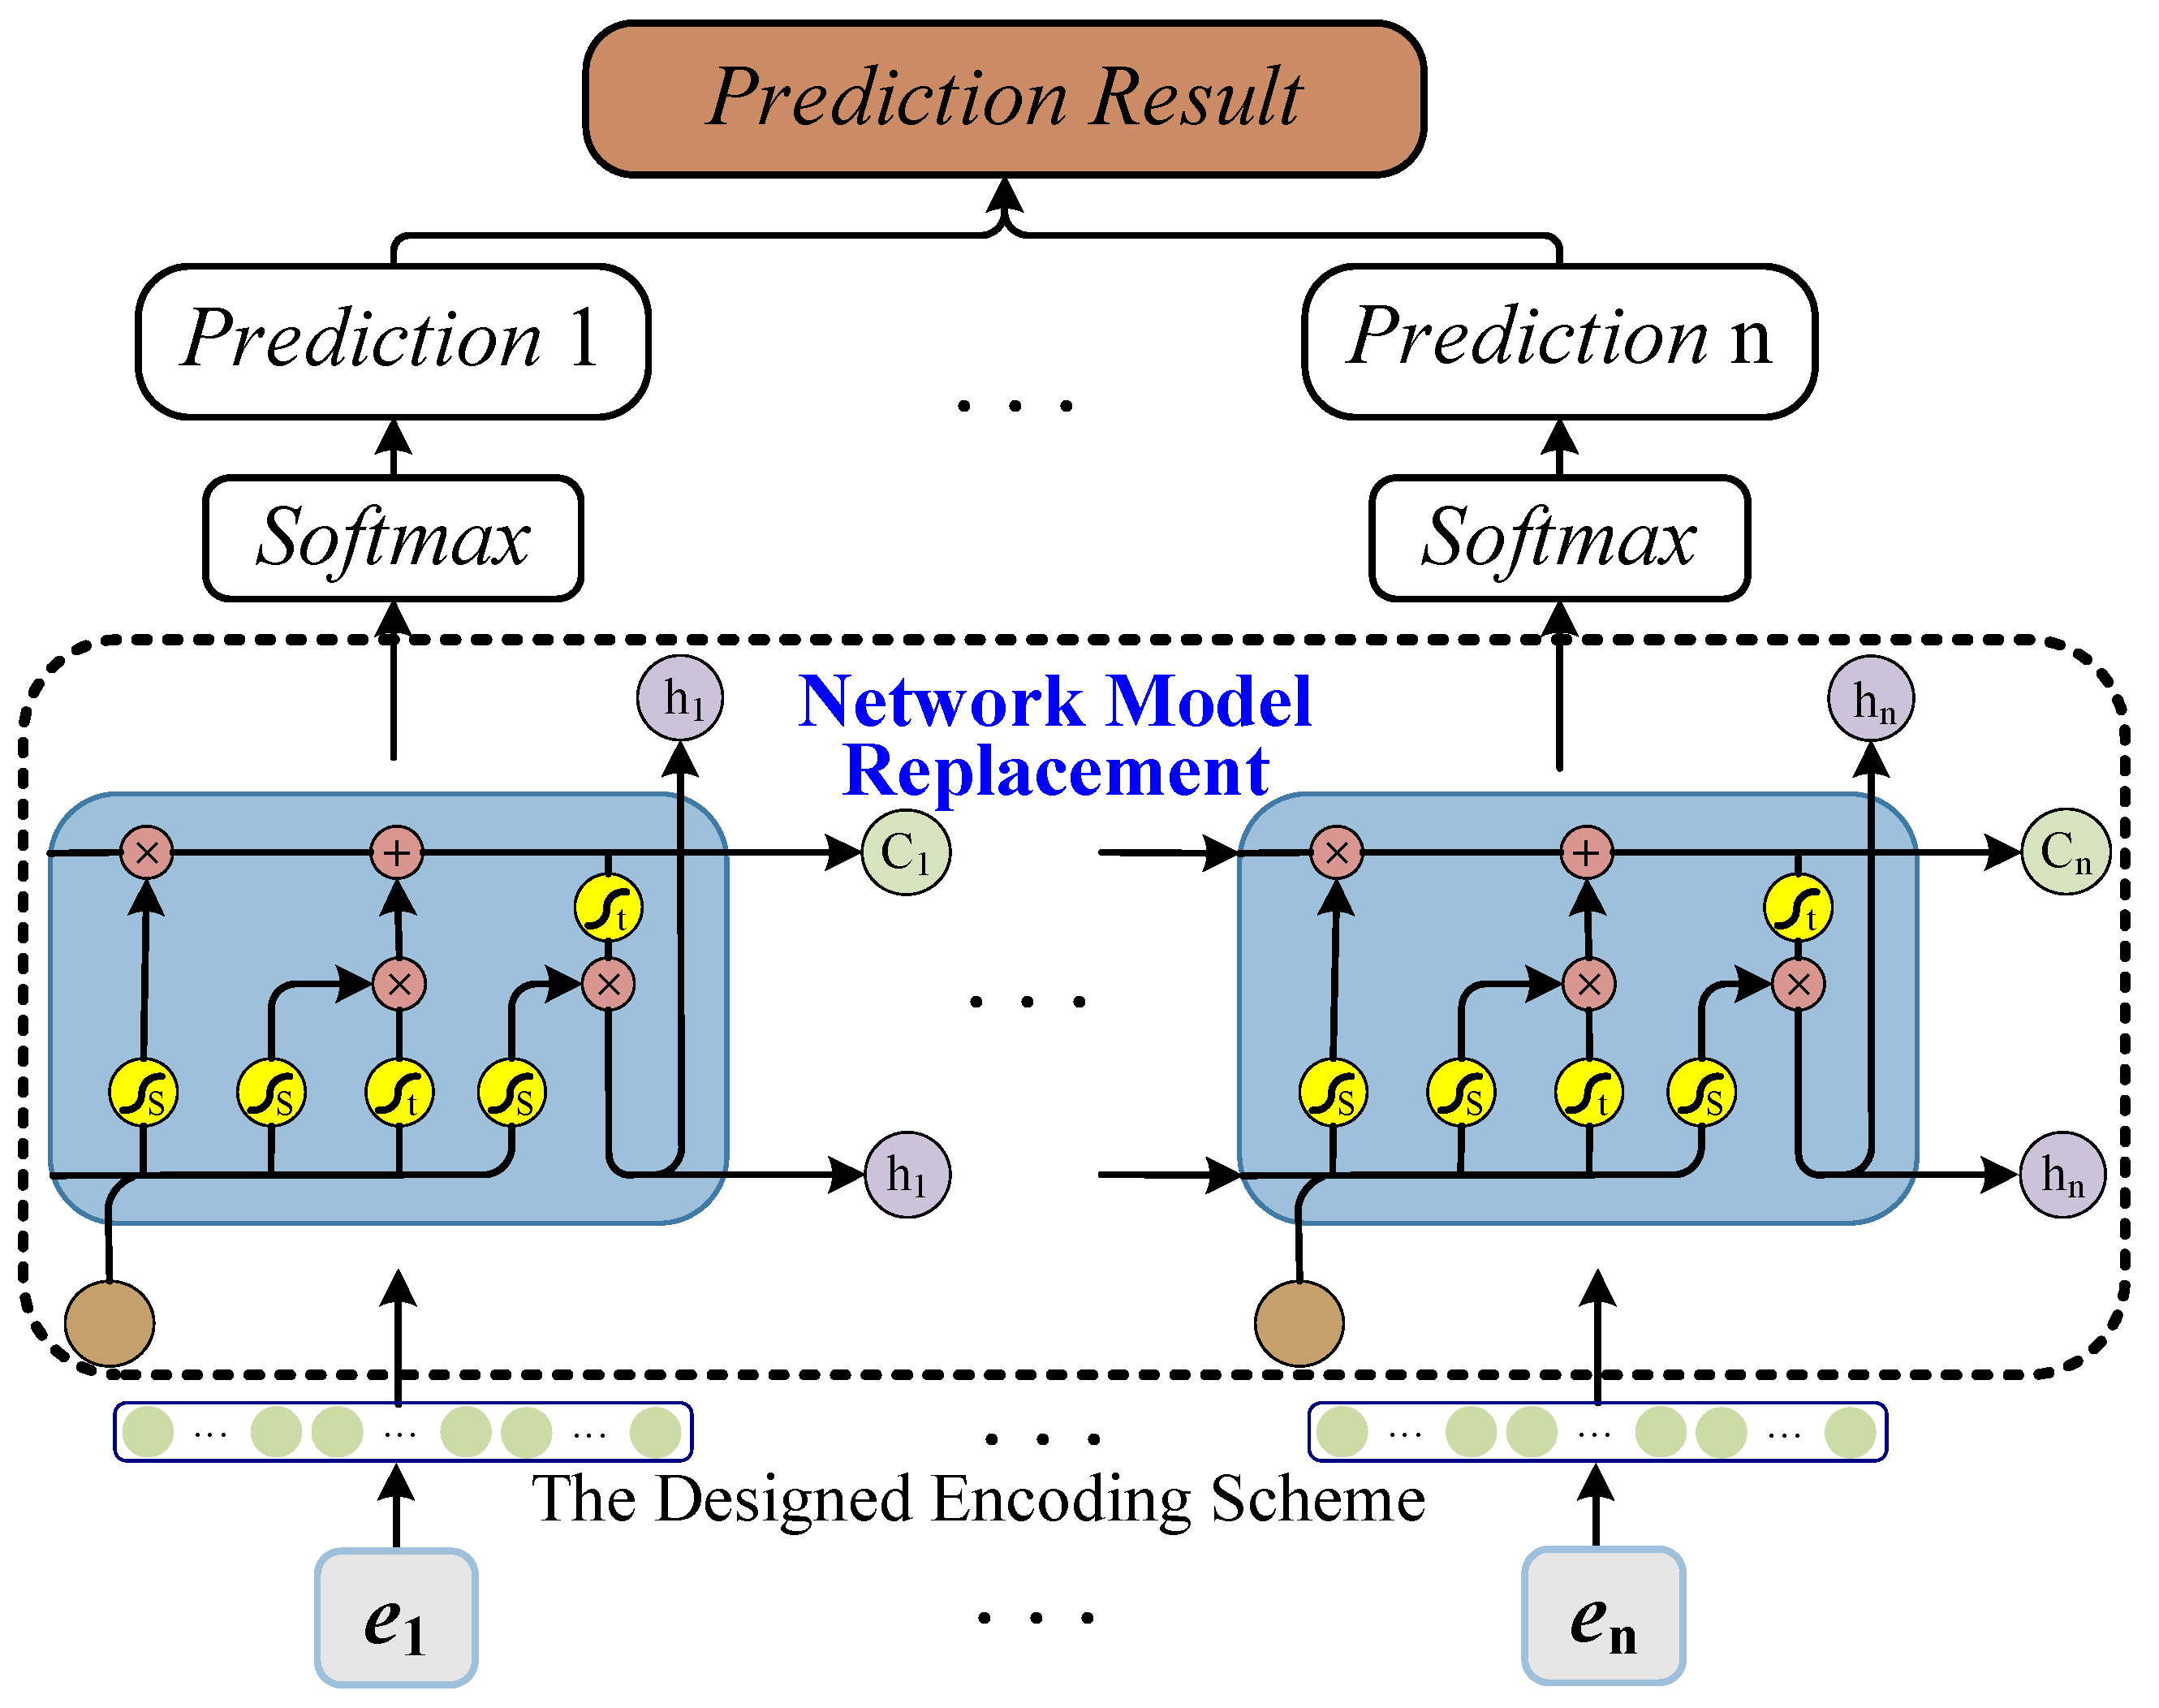
The encoded sampled logs are subsequently fed into six deep-learning models for predictive learning, including LSTM [7], GRU [8], Bi-LSTM [9], Bi-GRU [10], RNN [11], and Transformer [12]. These models process the encoded trace prefixes to learn feature representations for next-event prediction. The output is finally processed through a SoftMax function to compute the probability distribution over the next possible event. This section will explore the LSTM prediction model, using it as a representative example. The parameters of six models are summarized in Table 2.
According to [7], the LSTM is a special type of RNN that is widely used in PPM. LSTM can discover the semantic and temporal information of sequence data by selectively recording and forgetting the feature information of previous moments, forming long-term dependency relations. In the prediction phase, the LSTM model inputs the processed data into the three-layer model, then it extracts various feature information to continuously improve the prediction model. Finally, the probability of the next event is obtained by the Softmax function. The working mechanism is shown in Figure 4, where this model completes the prediction task by adjusting the model parameters through the backpropagation operation.

5. Experimental Evaluation

This section demonstrates that the SaNeP approach can effectively improve the efficiency and accuracy of the next-event prediction in the WTMPs.

5.1. Experimental Setup and Baseline

A real-life WTMP event log https://github.com/LHlingChina/WTMP.git (accessed on 5 June 2025) collected from the HuangYi wind farm in Hebei Province, China, is used to evaluate the effectiveness of the proposed approach. Specifically, the WTMP event log contains 1154 maintenance processes, 14,833 maintenance tasks, and 79 maintenance resources. In the following experiment, the WTMP event log is first divided into a training log and a validation one in a ratio of 7:3. Then, the trace prefixes of the sampled logs are encoded using one-hot encoding and fed into six deep-learning models designed for next-event prediction. This section compares five commonly used sampling techniques to evaluate the impact of different sampling techniques and sampling ratios on next-event prediction in WTMPs.
  • Trace-Im sampling technique. Trace-Im sampling technique is proposed that quantifies the importance of traces based on activity and directly follows relation.
  • LogRank sampling technique [29]. The well-known LogRank-based log sampling technique that implements a graph-based ranking mechanism is proposed. Specifically, it first abstracts an event log into a graph where a node represents a trace and edges represent the similarity between two traces, and then the PageRank algorithm is used to rank all variants iteratively.
  • LogRank+ sampling technique [30]. LogRank+-based sampling technique is proposed by calculating the similarity between a trace and the rest of the log to be used as the importance value.
  • Variant-Last sampling technique [31]. The Variant-Last sampling technique randomly selects traces from the original event log and sets threshold conditions based on the number of variants. Finally, the trace set is continuously updated, and the obtained sampled log contains a specific number of special variants.
  • Trace-Last sampling technique [31]. The Trace-Last sampling technique first randomly selects the trace from the original event log and forms a sampled log after reaching a predetermined number. This strategy assures that the selected traces are diverse and random during the sampling process, and it also prevents repetitive selection.
All experiments are performed on the Windows 10 operating system. The proposed sampling technique is implemented in the open-source process mining tool platform ProM6 http://promtools.org/ (accessed on 3 August 2025).

5.2. Evaluation Metrics

The prediction quality is quantified by the accuracy metric of the prediction model based on the validation log, which is computed as follows.
Accuracy = TP + TN TP + FP + TN + FN
In Equation (8), TP represents True Positive, FP represents False Positive, TN represents True Negative, and FN represents False Negative. Please note that the higher the Accuracy, the more accurate the prediction model.
In addition to quantitatively evaluating prediction efficiency, the performance improvement index, denoted as PII, is introduced and computed as follows.
PII = Time original Time sample
In Equation (9), T i m e o r i g i n a l represents the prediction time based on the original training event log, and T i m e s a m p l e represents the sum of the sampling time to obtain the sampled log and the prediction time based on the sampled log.

5.3. Experimental Results and Analysis

This section presents the main experimental results and assesses the prediction performance of different sampling techniques based on various sampling ratios for the baseline prediction models. To reduce the influence of prediction randomness, all experiments are repeated five times, and the average values are used.

5.3.1. Prediction Accuracy Comparison

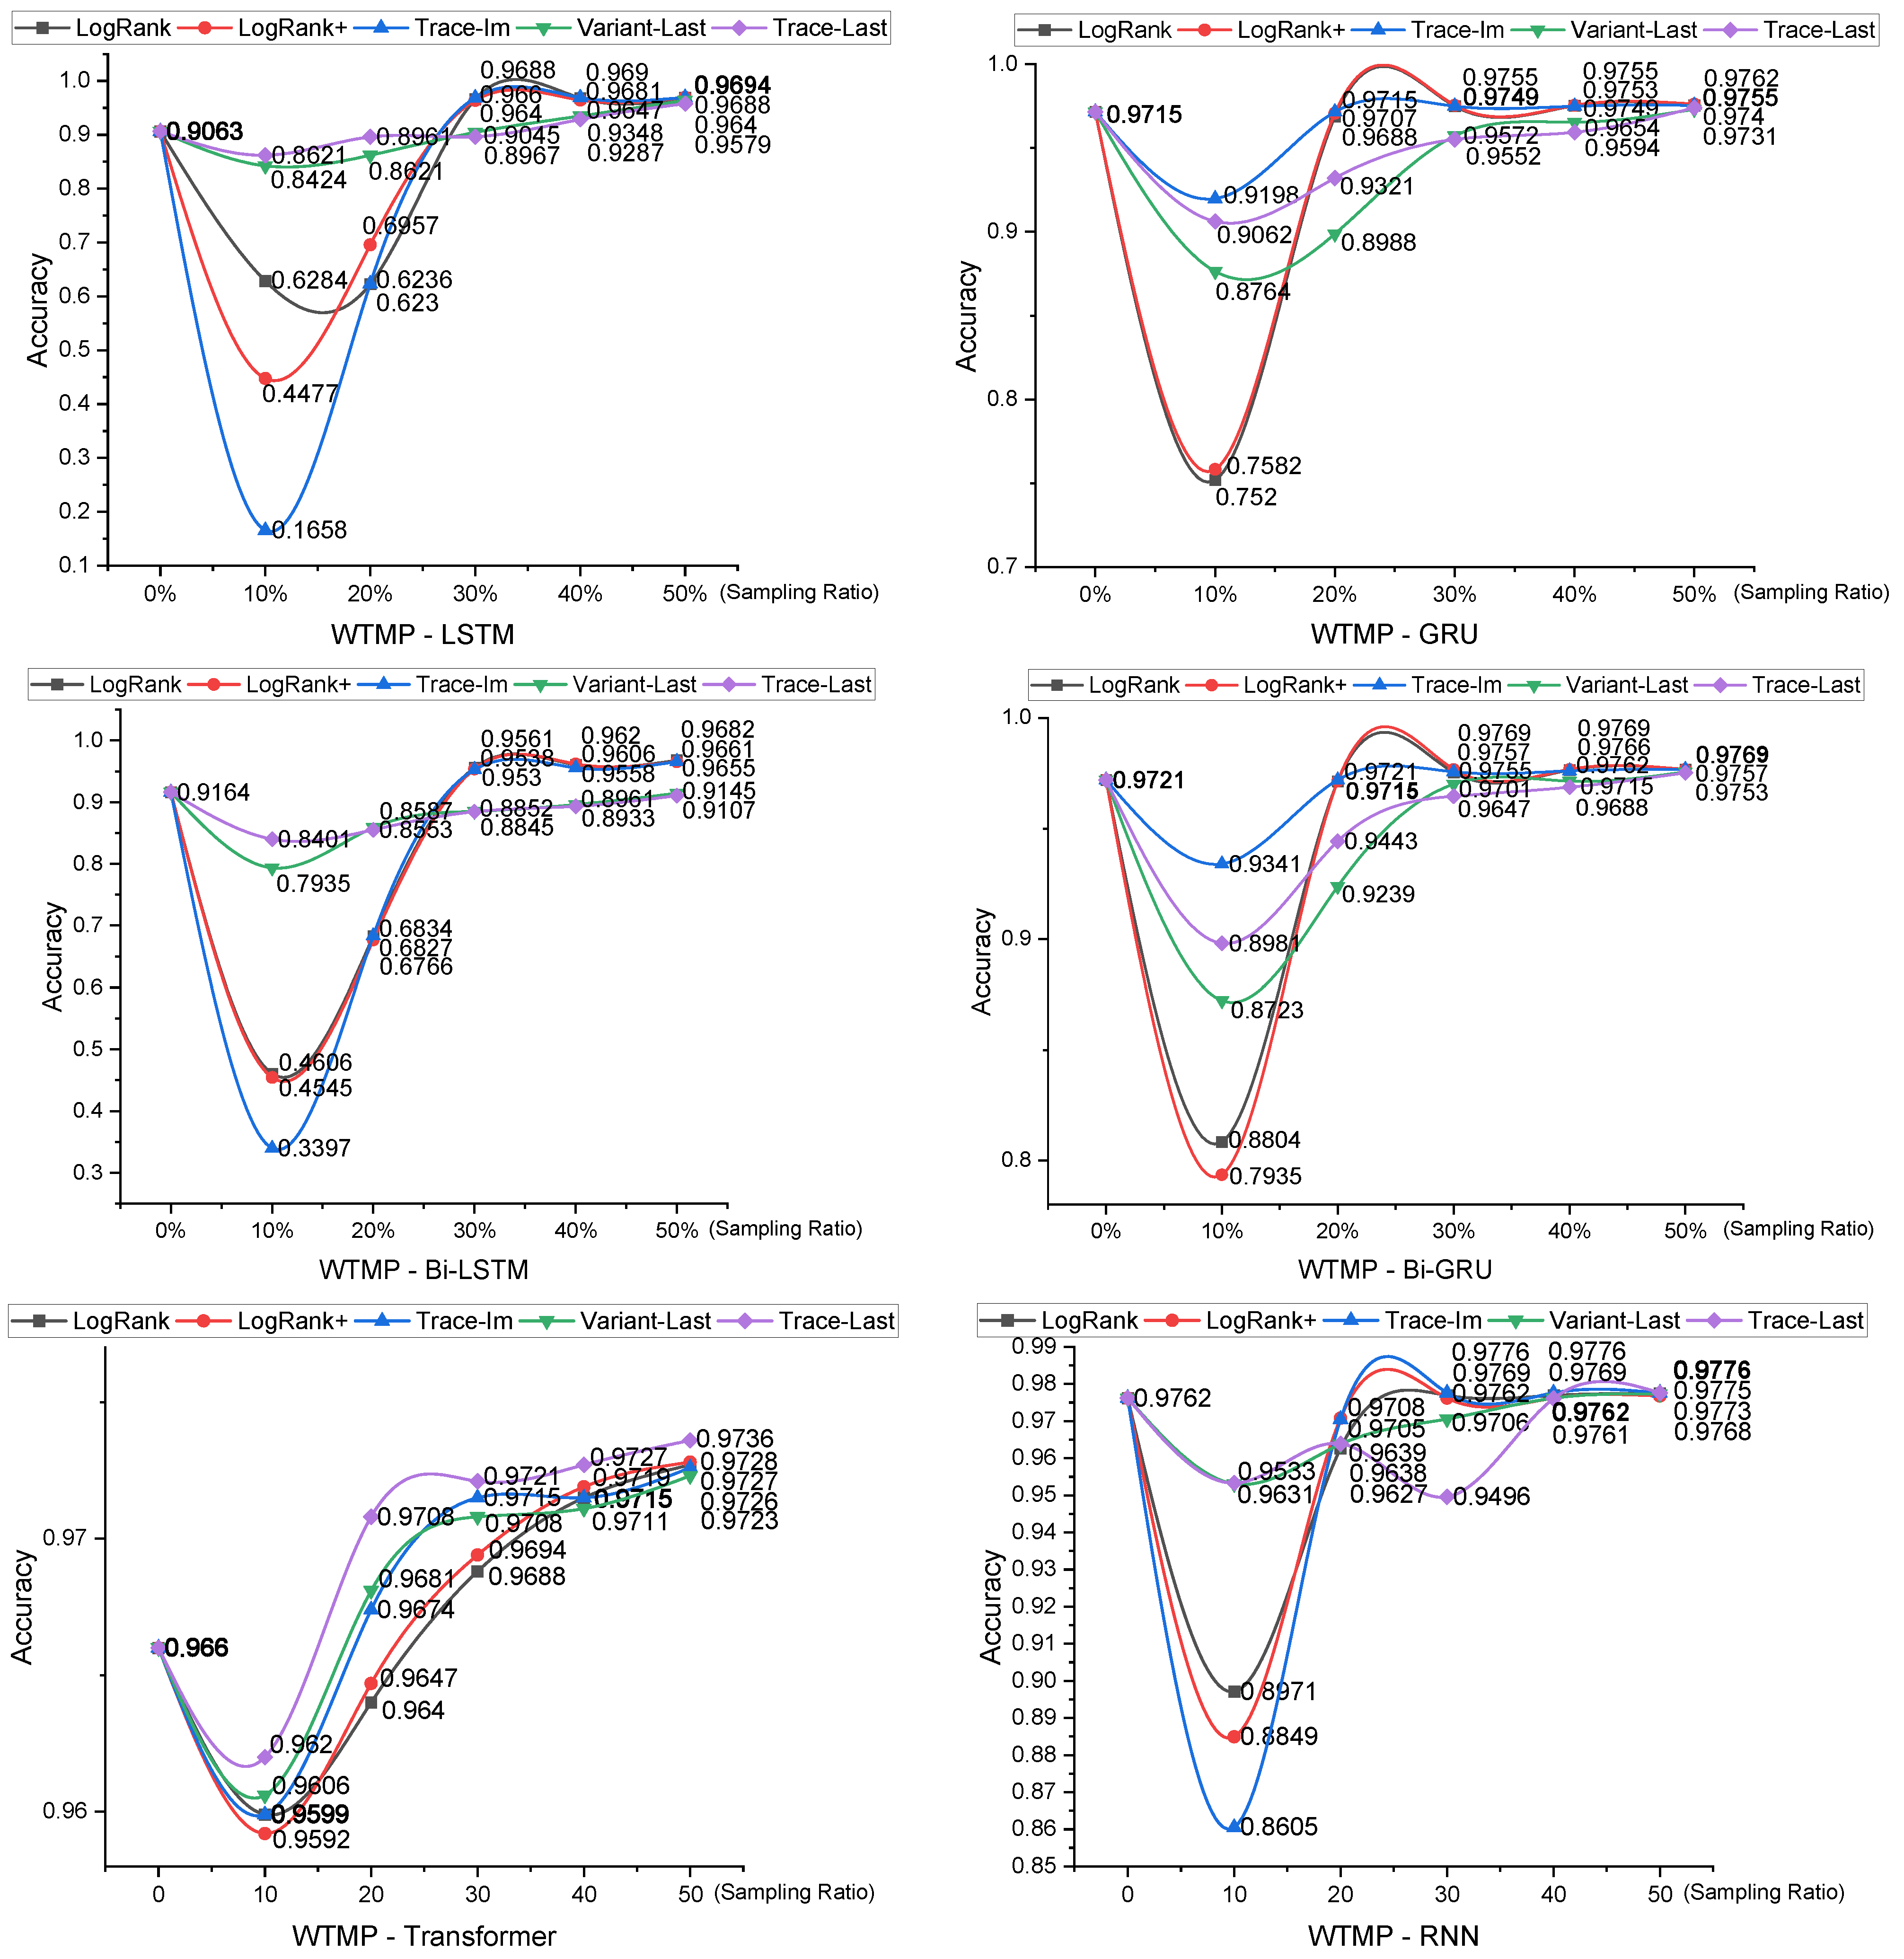
The prediction accuracy and percentage increase results are shown in Figure 5 and Table 3, based on which we have the following observations.
For all prediction models, the prediction accuracy exhibits a steady increase with the sampling ratio. This is because a higher sampling ratio yields a more informative sampled log, thus improving data quality and enhancing model performance. As a result, prediction accuracy is positively correlated with the sampling ratio.
In general, the prediction performance of the five sampling techniques varies in different deep-learning models. More specifically, the sampled log generated by LogRank, LogRank+, and Trace-Im sampling techniques with a 30% sampling ratio achieves higher prediction accuracy than that of the original WTMP event log for baseline prediction models. Specifically, when the sampling ratio is reduced to 20%, the sampled log produced by the Trace-Im still retains higher accuracy for the GRU, Bi-GRU, and Transformer models than that of the original log. These results indicate that a 30% sampling ratio is sufficient to retain the key features of the original event log while improving prediction performance.
The Variant-Last and Trace-Last sampling techniques exhibit significant differences for different prediction models. As the sampling ratio increases from 20% to 50% with a 10% increment, the prediction accuracy of sampled logs for the Transformer, LSTM, RNN, and GRU models gradually surpasses that of the original WTMP event log. However, the prediction accuracy of the sampled logs for the Bi-LSTM model is still lower than that of the original WTMP event log when the sampling ratio is 50%. This is primarily because both Variant-Last and Trace-Last sampling techniques randomly select traces from the original training log, which cannot guarantee that the sampled logs are representative of the overall process behavior. In addition, the Bi-LSTM model considers both forward and backward dependencies. For the next-event prediction task in WTMPs, the inclusion of backward information may lead the model to learn unrealistic dependencies, thereby impairing its generalization ability. These two factors jointly lead to the poor prediction performance of the Bi-LSTM model when trained on sample logs obtained through Variant-Last and Trace-Last sampling approaches.
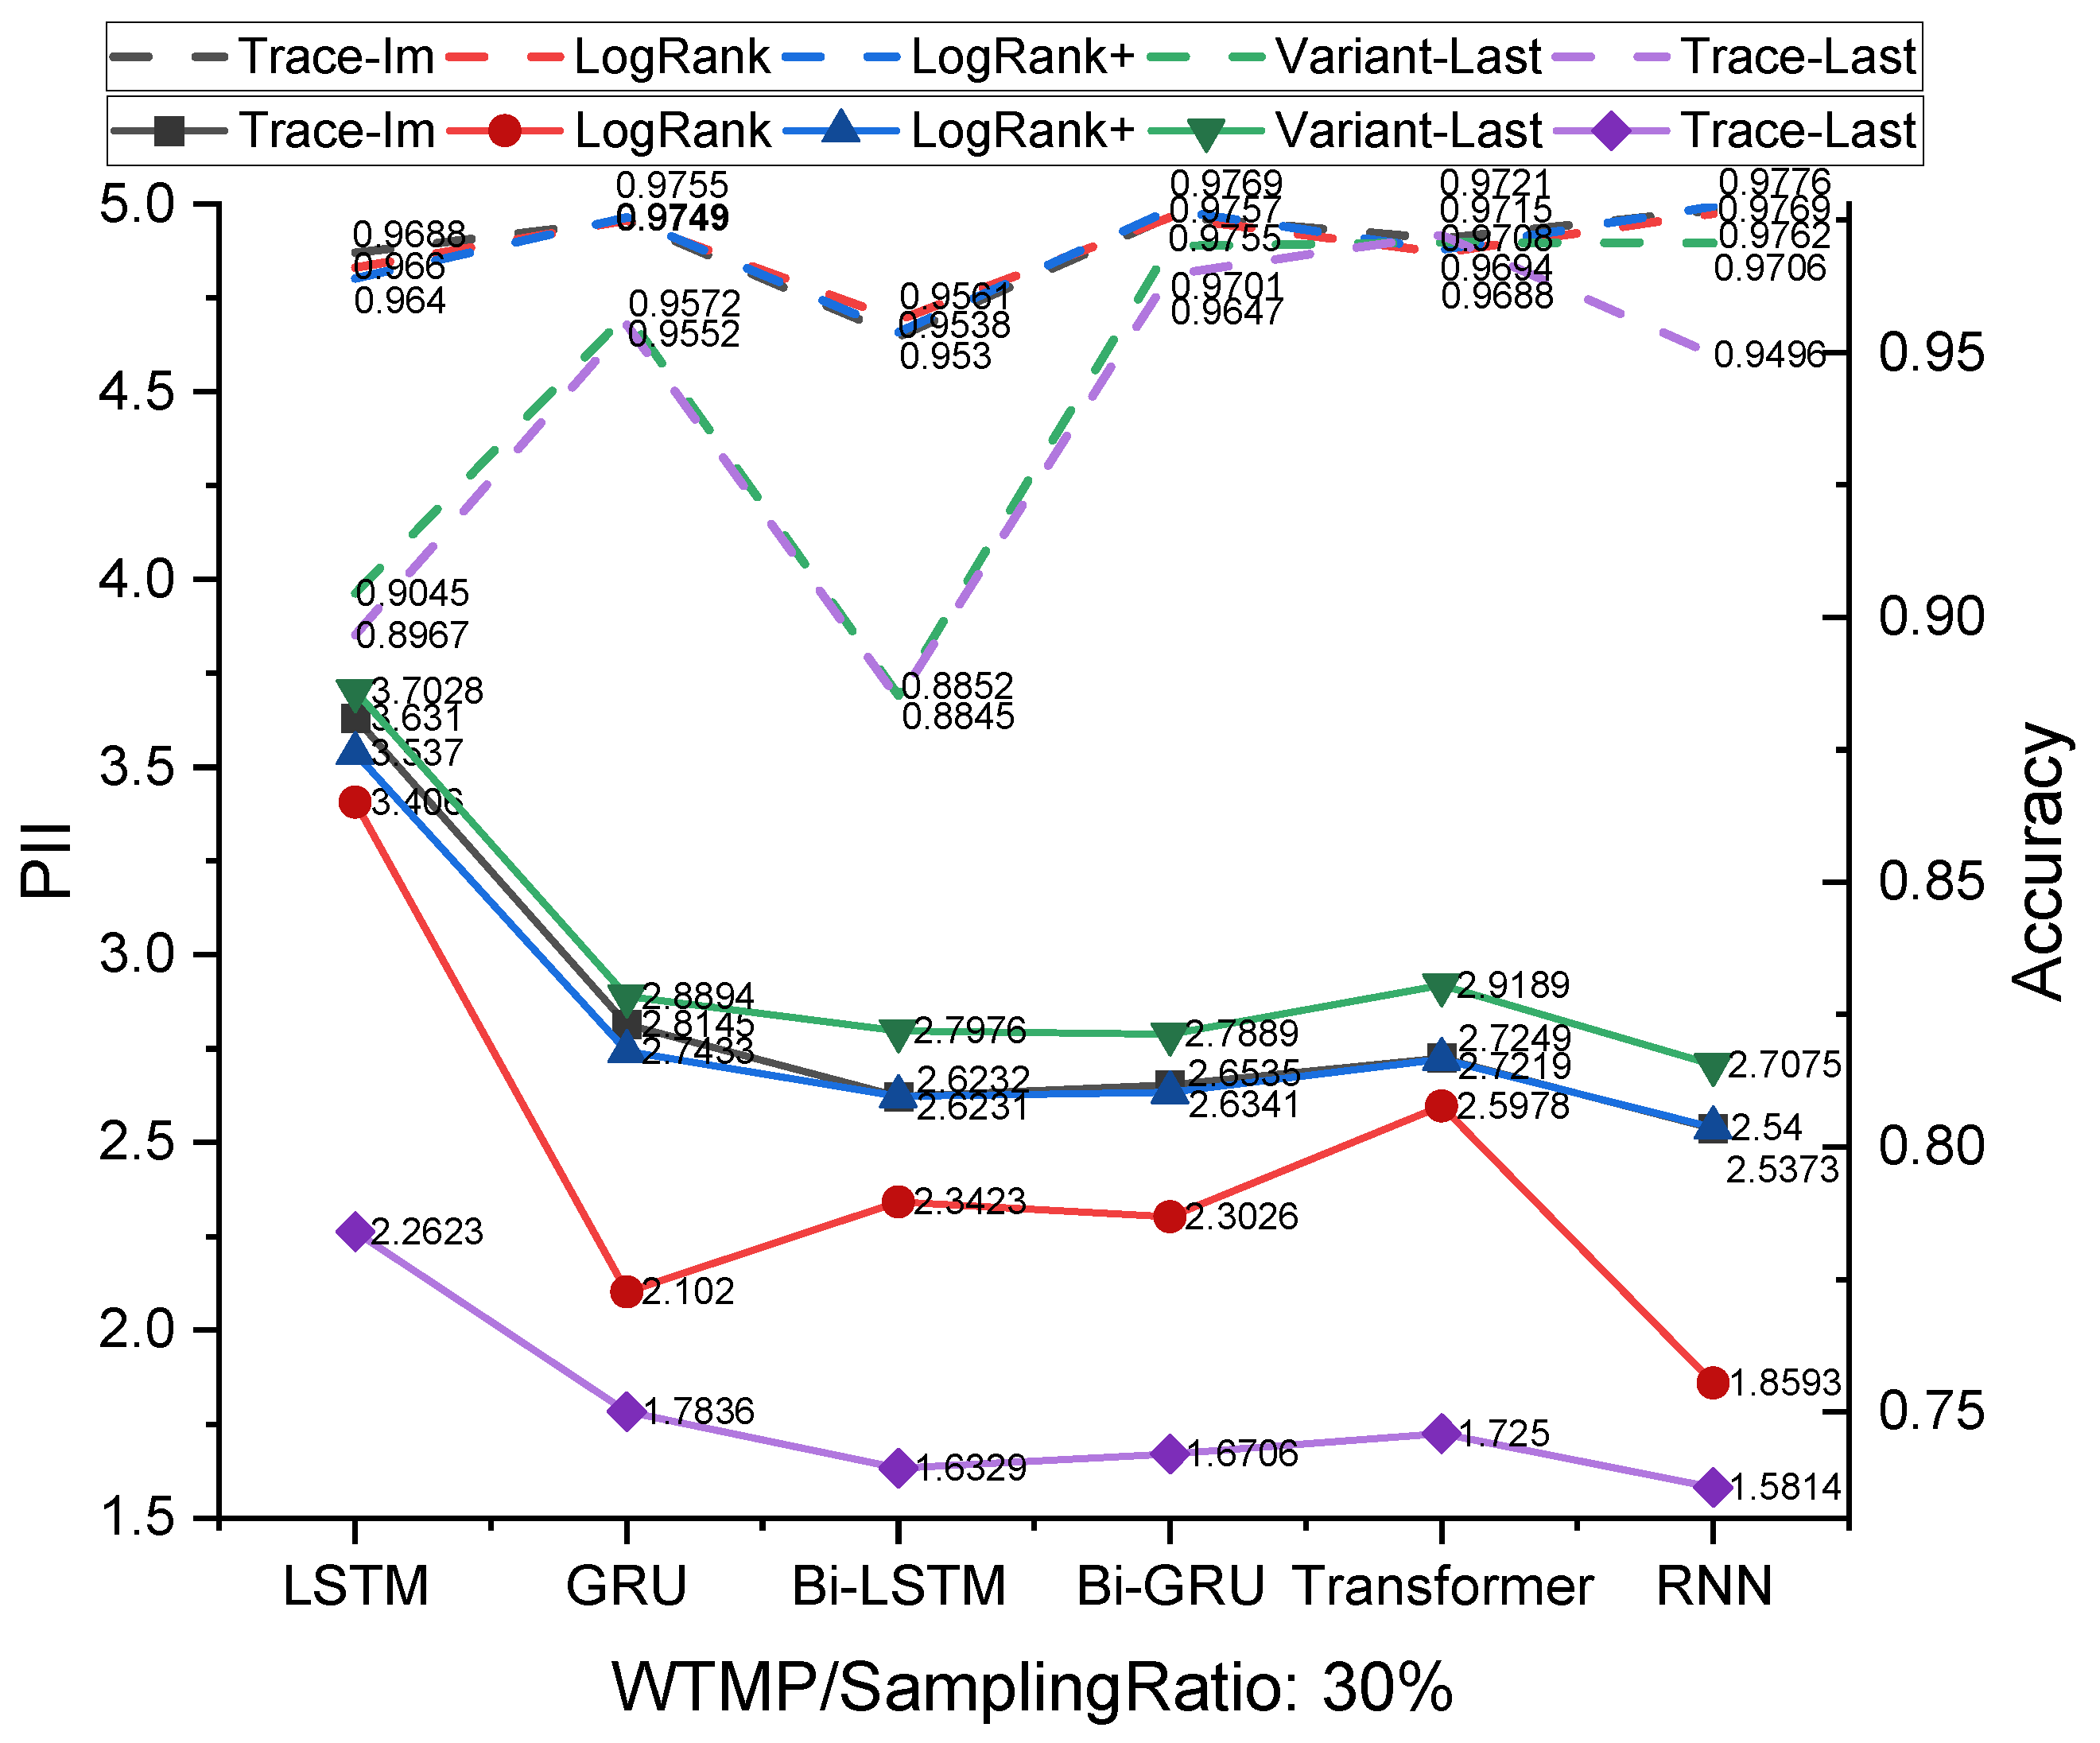
In summary, the prediction accuracy fluctuates significantly when the sampling ratio is between 0% and 30% for all prediction models, and the accuracy gradually stabilizes when the sampling ratio exceeds 30%. Therefore, it is argued that the optimal sampling ratio is 30%, taking into account both efficiency and quality. Compared to other prediction models, the LSTM model achieves the best prediction accuracy, i.e., the prediction accuracy is improved maximally 6.896% (0.9063 vs. 0.9688) compared to the non-sampling techniques, when the sampling ratio is around 30% according to Table 3.

5.3.2. Prediction Efficiency Comparison

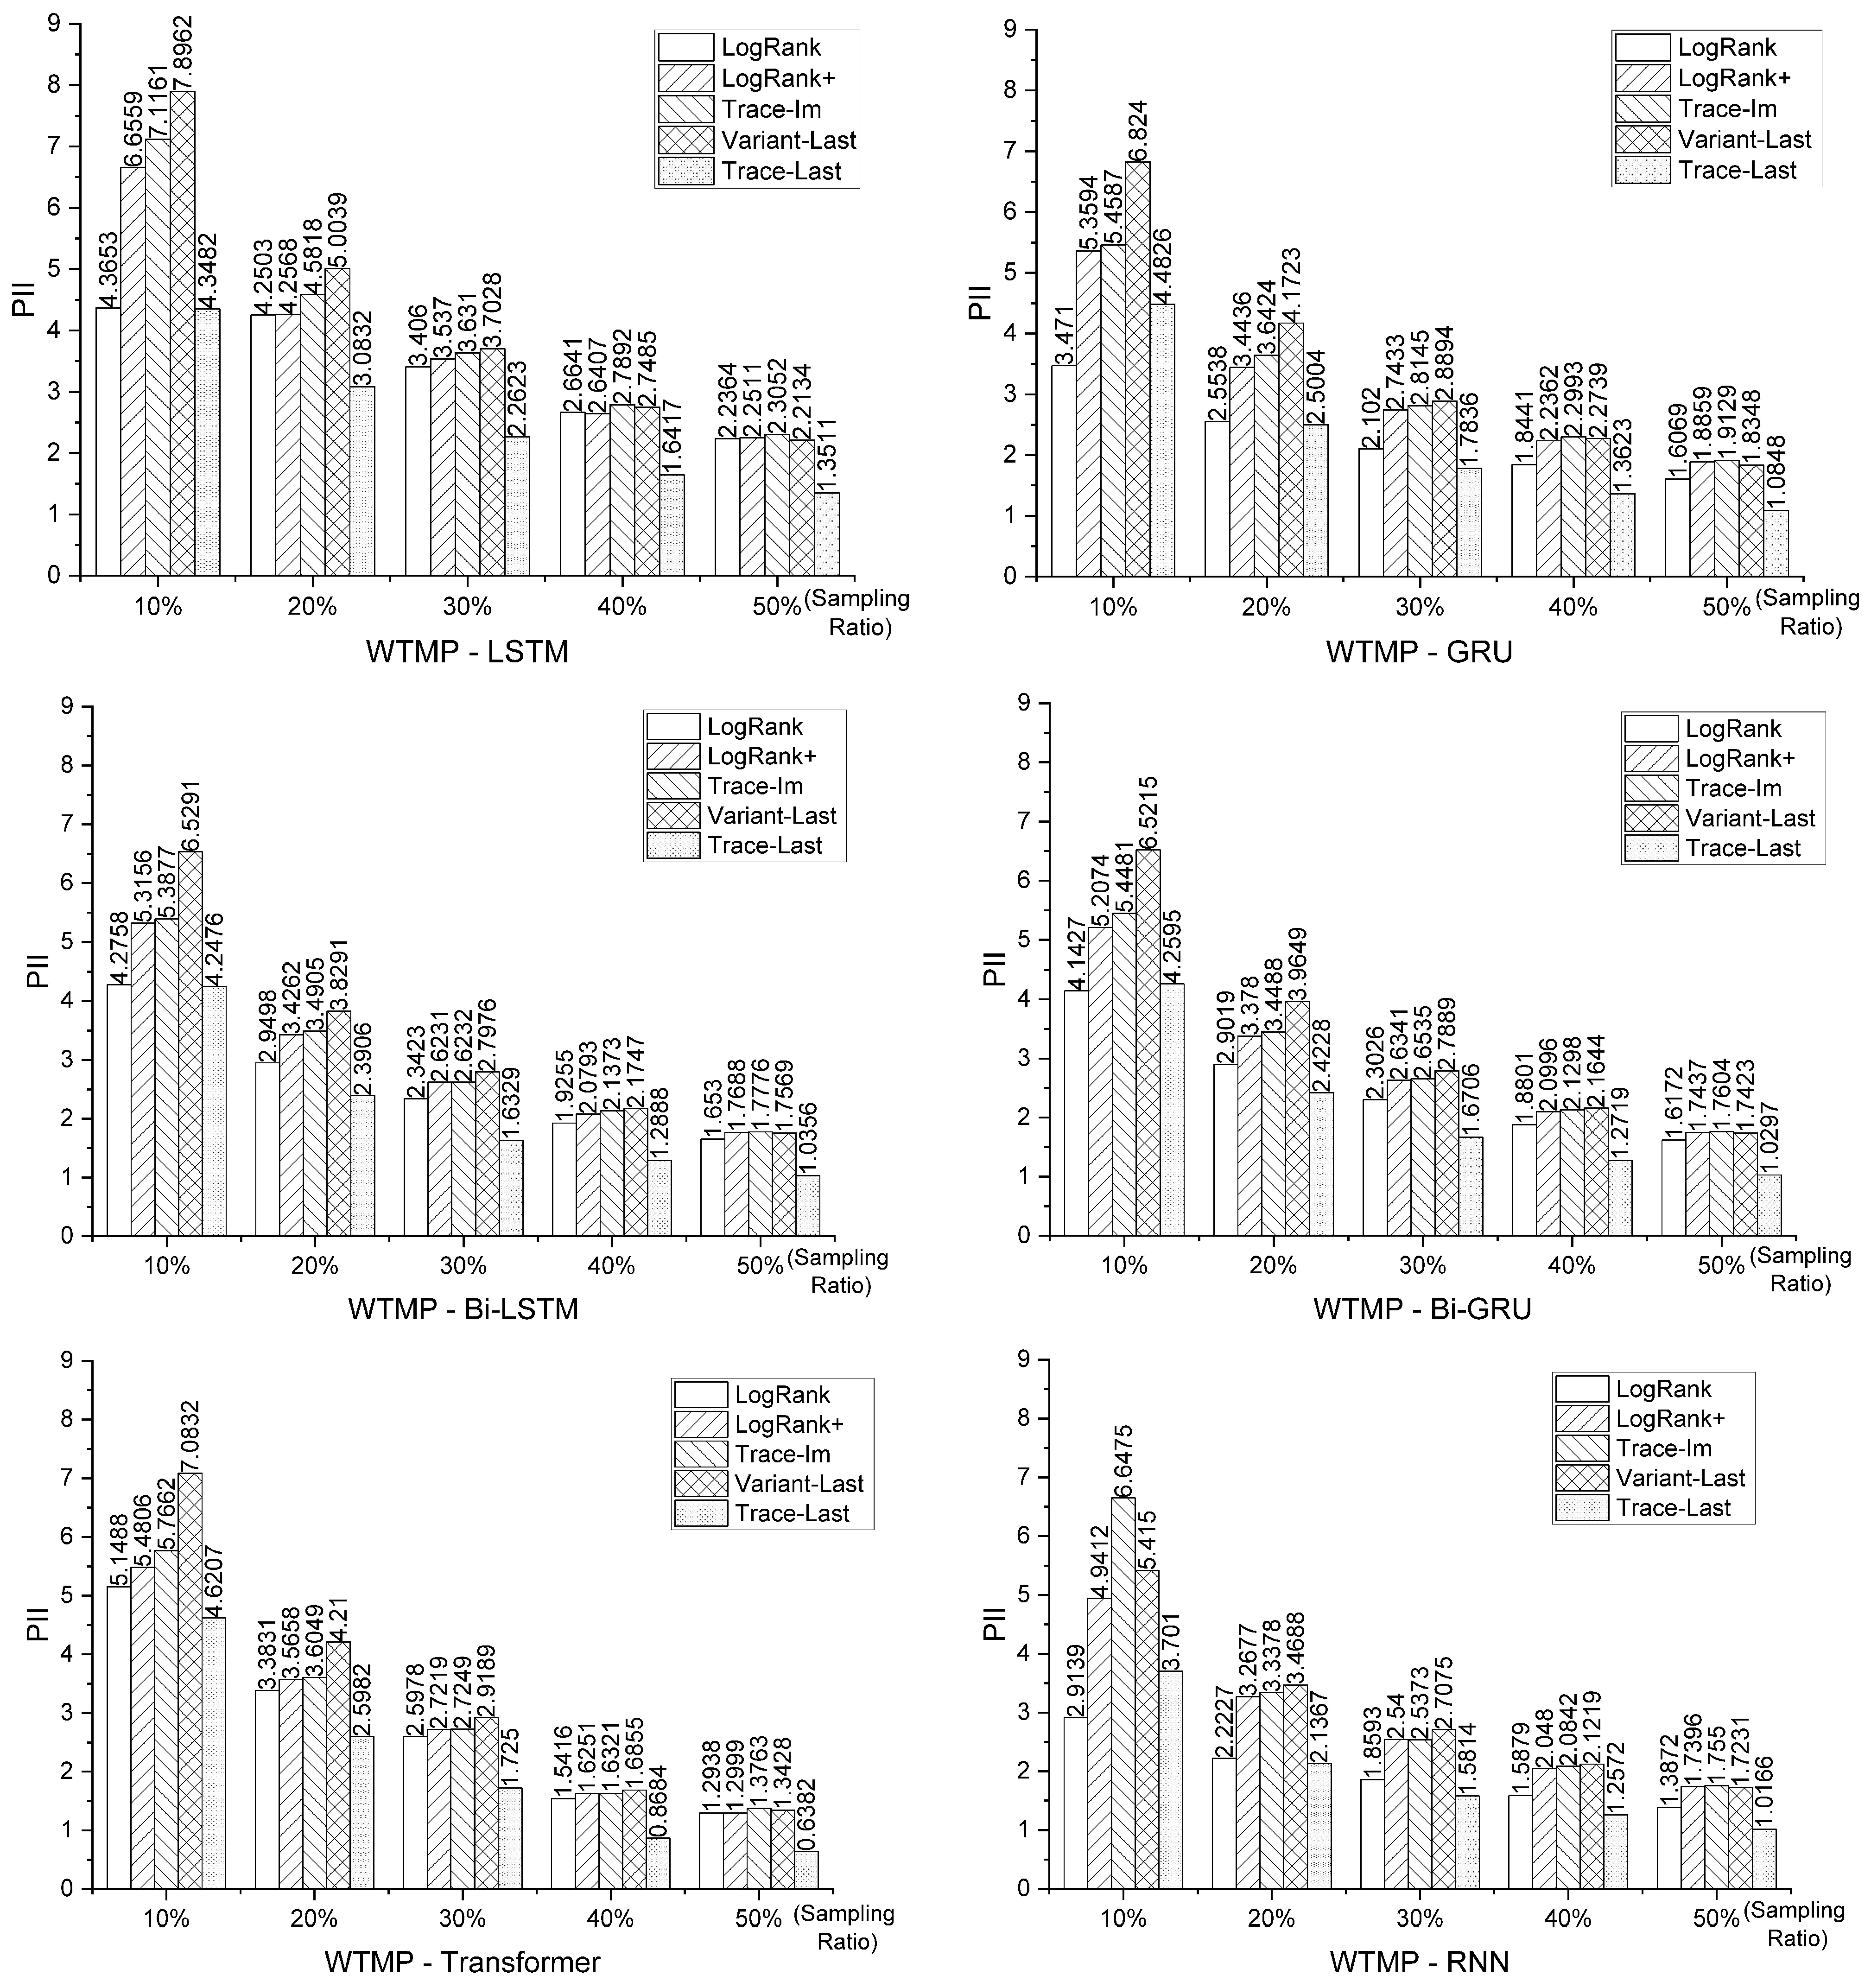
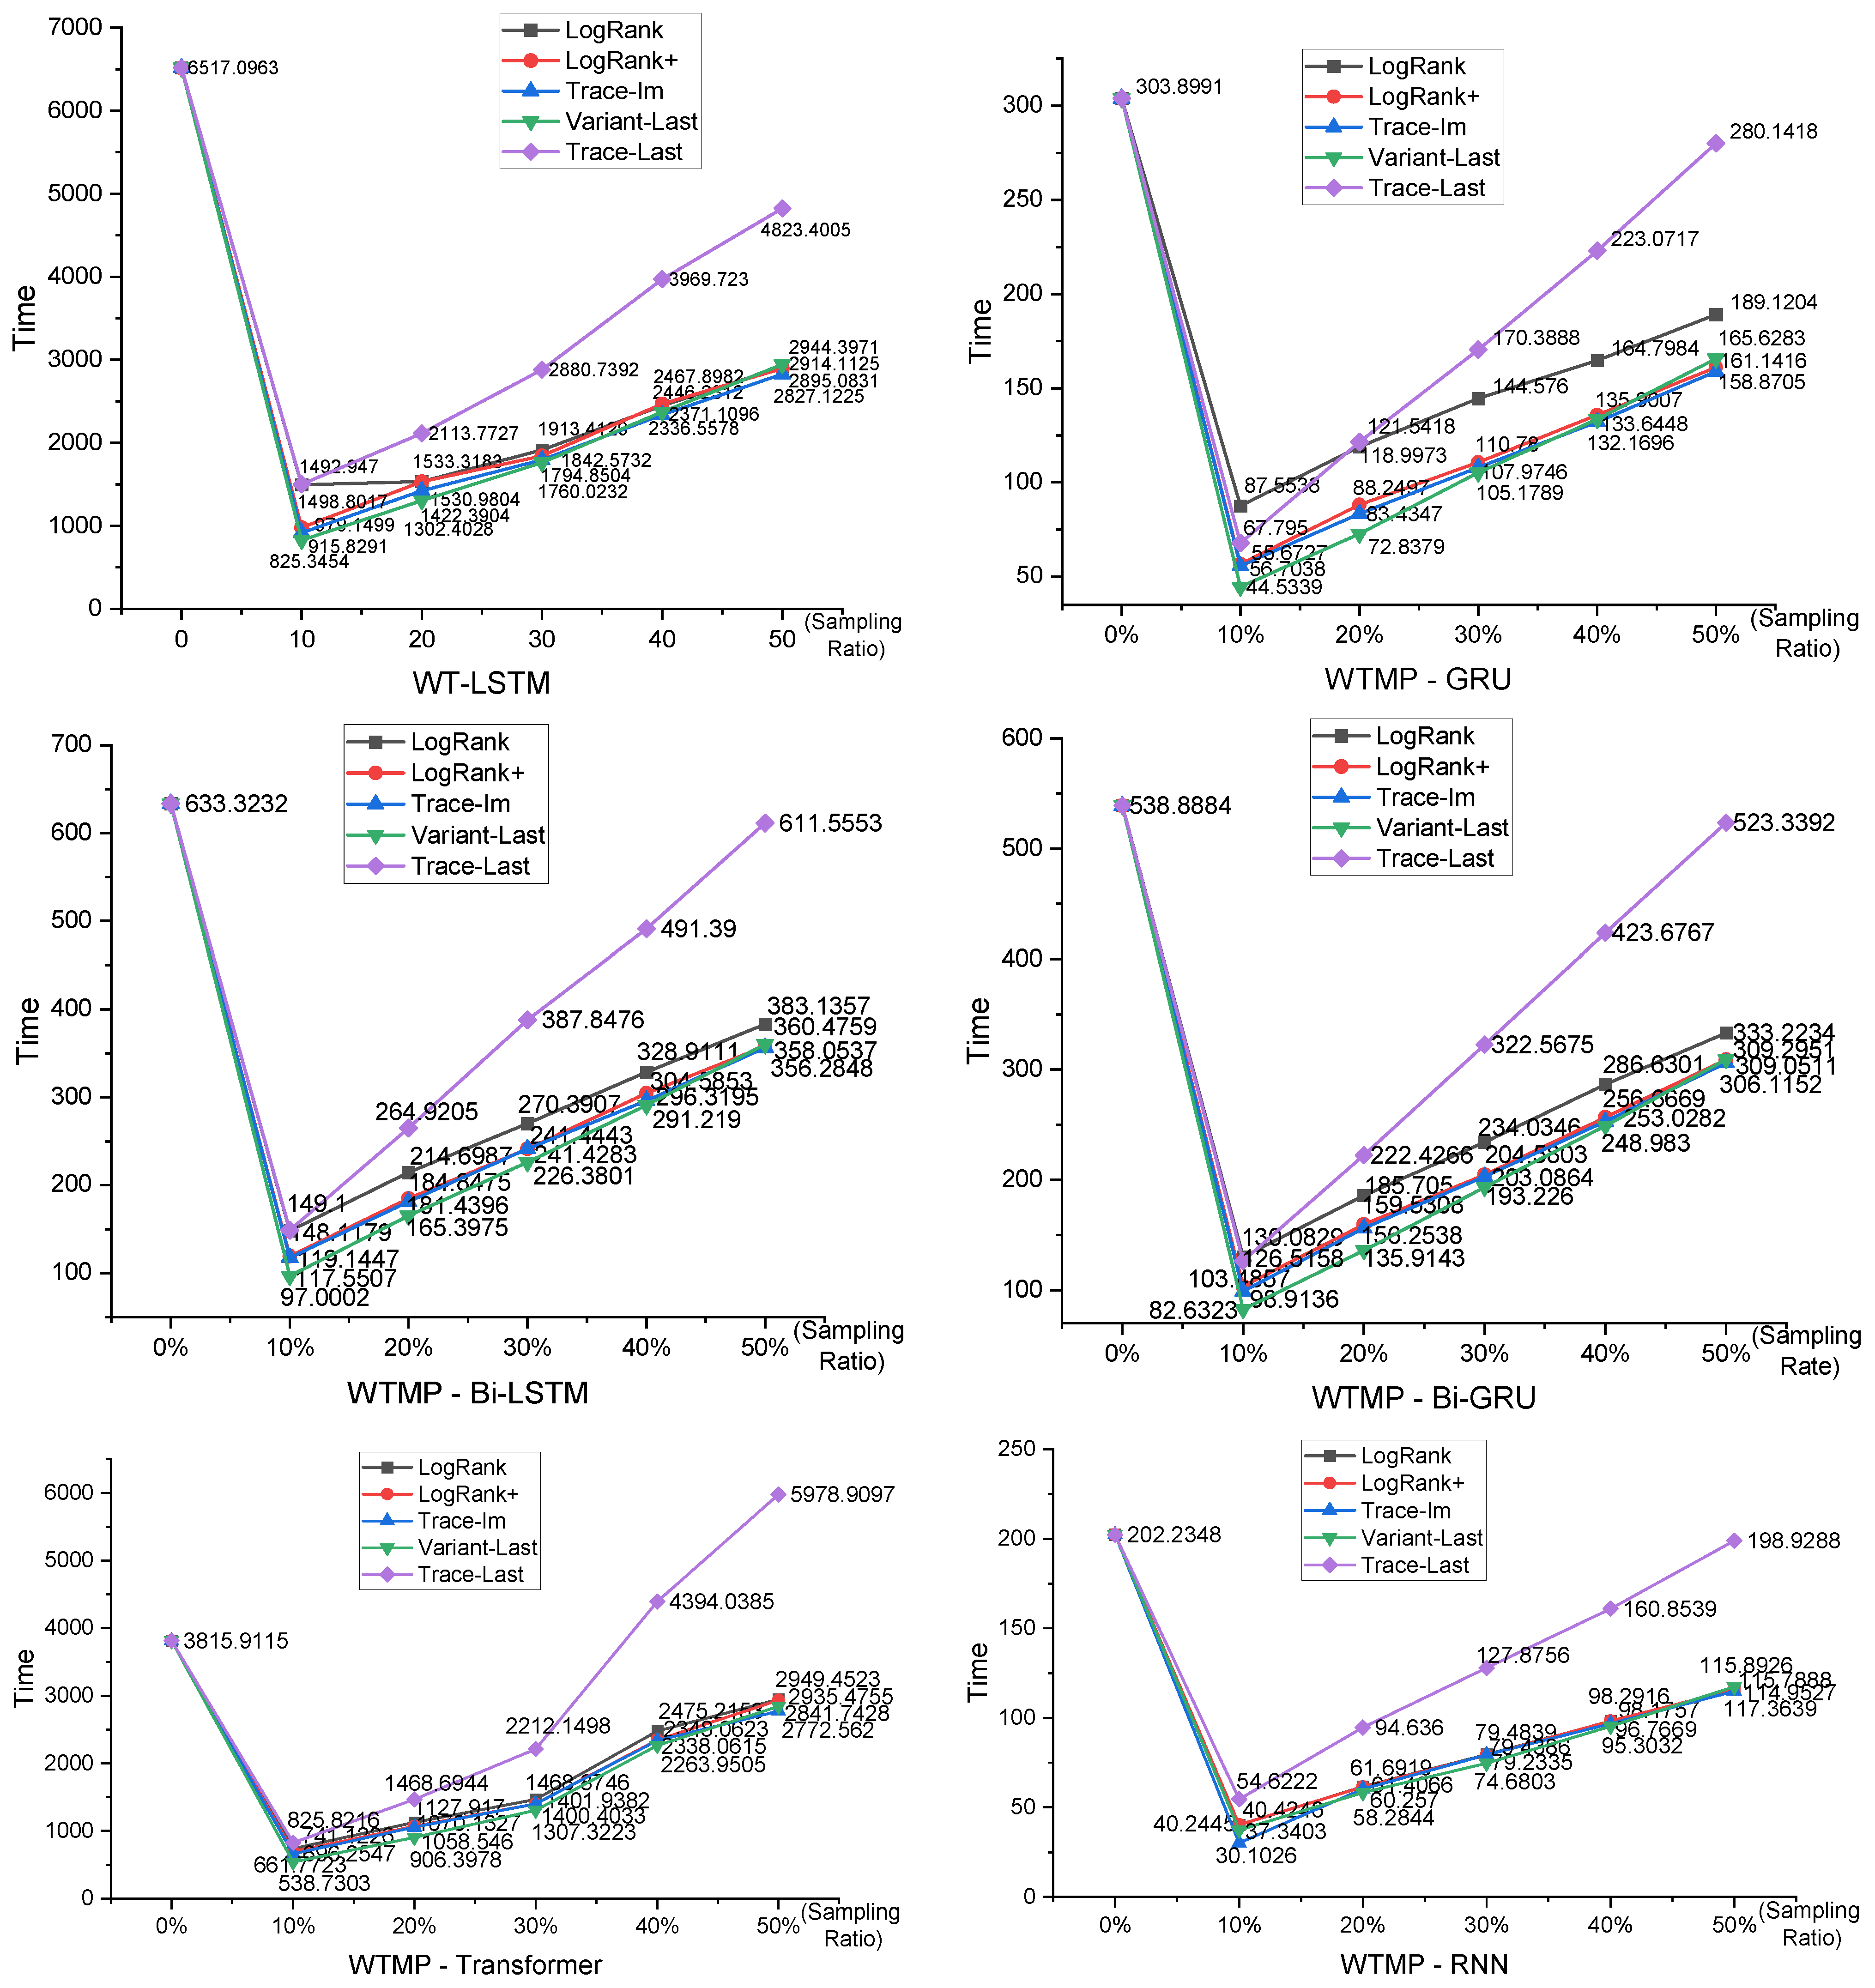
Figure 6 and Figure 7 show the experimental results of the prediction efficiency and prediction time, respectively, based on which we have the following observations.
The prediction efficiency of the five sampling techniques is much better than the non-sampling techniques. This is because the sampled log generated by the sampling technique reduces the feature extraction time and the model training time.
The prediction efficiency of all five sampling techniques reaches its peak at a sampling ratio of 10%, and gradually decreases as the sampling ratio increases. As the sampling ratio increases, the model’s prediction time also increases. The efficiency improvement of the different sampling techniques slows down significantly for all baseline prediction models when the sampling ratio exceeds 30%. In addition, the prediction efficiency gradually approaches 1, indicating that the sampling technique cannot improve the efficiency anymore. It is argued that the optimal sampling ratio is 30%.
Figure 8 shows that the sampled logs obtained by any sampling techniques achieve the highest prediction efficiency when using the LSTM model at the optimal (30%) sampling ratio. The sampled logs obtained by the Variant-Last sampling technique achieve the highest prediction efficiency (3.7028-fold improvement) with the LSTM model, followed by the Trace-Im sampling technique (3.631-fold improvement). However, at this point, the prediction accuracy achieved by the sampled logs generated using the Variant-Last sampling technique with the LSTM model (0.9045-fold improvement) is slightly lower than that obtained from the original WTMP event log (0.9063-fold improvement). Therefore, the Trace-Im sampling technique outperforms the Variant-Last sampling technique. In summary, the proposed SaNeP approach combined with the LSTM model achieves a 3.631-fold improvement in prediction efficiency and a 6.896% increase in prediction accuracy compared to other techniques.

6. Conclusions

To improve the next-event prediction performance for WTMPs, this paper proposes a SaNeP approach. It first proposes a novel event log sampling technique to extract a representative sample from the original training log by quantifying the importance of individual traces (Trace-Im). The trace prefixes of the sampled logs are then encoded using one-hot encoding and fed into six deep-learning models designed for next-event prediction. Based on the real-life WTMP event log collected from the HuangYi wind farm in Hebei Province, China, experimental results demonstrate that. At a 30% sampling ratio, SaNeP combined with the LSTM model achieves a 3.631-fold improvement in prediction efficiency and a 6.896% increase in prediction accuracy compared to other techniques. The next-event prediction for WTMPs is a typical approach to process predictive monitoring. Therefore, the SaNeP approach proposed in this paper can also be applied to other areas of predictive maintenance.
The proposed approach compares six state-of-the-art deep-learning models and extracts temporal features to perform the next-event prediction in WTMPs. However, other temporal-independent attributes, e.g., cost and resources, may have a fundamental effect on the subsequent event prediction [34]. In future work, we would like to explore the impact of additional attributes on next-event prediction by introducing a systematic feature selection technique for complex WTMP prediction. Additionally, we will investigate the prediction performance of different vectorization approaches under various sampling strategies, as well as explore remaining time prediction for WTMP.

Author Contributions

Conceptualization, C.L. and Q.D.; methodology, H.L.; software, Q.Z.; validation, H.L., J.Z. and L.C.; formal analysis, H.L.; investigation, G.T.; data curation, Q.D.; writing—original draft preparation, H.L.; writing—review and editing, H.L. and C.L.; project administration, Q.Z.; funding acquisition, C.L. All authors have read and agreed to the published version of the manuscript.

Funding

This paper is supported by the National Natural Science Foundation of China (No. 62472264 and 52374221).

Data Availability Statement

We provided as much of our data as possible and uploaded it. (https://github.com/LHlingChina/WTMP.git, accessed on 5 June 2025).

Conflicts of Interest

The authors declare that there are no conflicts of interest regarding the publication of this paper.

References

  1. Bashir, M.B.A. Principle parameters and environmental impacts that affect the performance of wind turbine: An overview. Arab. J. Sci. Eng. 2022, 47, 7891–7909. [Google Scholar] [CrossRef] [PubMed]
  2. Márquez-Chamorro, A.E.; Resinas, M.; Ruiz-Cortes, A. Predictive monitoring of business processes: A survey. IEEE Trans. Serv. Comput. 2017, 11, 962–977. [Google Scholar] [CrossRef]
  3. Maggi, F.M.; Di Francescomarino, C.; Dumas, M.; Ghidini, C. Predictive monitoring of business processes. In Proceedings of the CAiSE 2014, Thessaloniki, Greece, 16–20 June 2014; Springer: Cham, Switzerland, 2014; pp. 457–472. [Google Scholar]
  4. Lakshmanan, G.T.; Shamsi, D.; Doganata, Y.N.; Unuvar, M.; Khalaf, R. A markov prediction model for data-driven semi-structured business processes. Knowl. Inf. Syst. 2015, 42, 97–126. [Google Scholar] [CrossRef]
  5. Leontjeva, A.; Conforti, R.; Di Francescomarino, C.; Dumas, M.; Maggi, F.M. Complex symbolic sequence encodings for predictive monitoring of business processes. In Proceedings of the BPM 2015, Innsbruck, Austria, 31 August–3 September 2015; Springer: Cham, Switzerland, 2015; pp. 297–313. [Google Scholar]
  6. Breuker, D.; Matzner, M.; Delfmann, P.; Becker, J. Comprehensible predictive models for business processes. MIS Q. 2016, 40, 1009–1034. [Google Scholar] [CrossRef]
  7. Evermann, J.; Rehse, J.R.; Fettke, P. Predicting process behaviour using deep learning. Decis. Support Syst. 2017, 100, 129–140. [Google Scholar] [CrossRef]
  8. Chen, J.X.; Jiang, D.; Zhang, Y.N. A Hierarchical Bidirectional GRU Model With Attention for EEG-Based Emotion Classification. IEEE Access 2019, 7, 118530–118540. [Google Scholar] [CrossRef]
  9. Jalayer, A.; Kahani, M.; Pourmasoumi, A.; Beheshti, A. HAM-Net: Predictive Business Process Monitoring with a hierarchical attention mechanism. KBS 2022, 236, 107722. [Google Scholar] [CrossRef]
  10. Niu, D.; Yu, M.; Sun, L.; Gao, T.; Wang, K. Short-term multi-energy load forecasting for integrated energy systems based on CNN-BiGRU optimized by attention mechanism. Appl. Energy 2022, 313, 118801. [Google Scholar] [CrossRef]
  11. Elman, J.L. Finding structure in time. Cogn. Sci. 1990, 14, 179–211. [Google Scholar] [CrossRef]
  12. Vaswani, A.; Shazeer, N.; Parmar, N. Attention is all you need. Adv. Neural Inf. Process. Syst. 2017, 30, 6000–6010. [Google Scholar]
  13. Ruschel, E.; Santos, E.A.P.; Loures, E.d.F.R. Establishment of maintenance inspection intervals: An application of process mining techniques in manufacturing. J. Intell. Manuf. 2020, 31, 53–72. [Google Scholar] [CrossRef]
  14. Dong, X.; Gao, D.; Li, J.; Li, S. Evaluation model on uncertainty of the wind turbine state. Sustain. Energy Technol. Assess. 2021, 46, 101303. [Google Scholar] [CrossRef]
  15. Rocchetta, R.; Bellani, L.; Compare, M.; Zio, E.; Patelli, E. A reinforcement learning framework for optimal operation and maintenance of power grids. Appl. Energy 2019, 241, 291–301. [Google Scholar] [CrossRef]
  16. Garcia Marquez, F.P.; Peinado Gonzalo, A. A comprehensive review of artificial intelligence and wind energy. Arch. Comput. Method Eng. 2022, 29, 2935–2958. [Google Scholar] [CrossRef]
  17. Gonzalo, A.P.; Benmessaoud, T.; Entezami, M.; Márquez, F.P.G. Optimal maintenance management of offshore wind turbines by minimizing the costs. Sustain. Energy Technol. Assess. 2022, 52, 102230. [Google Scholar]
  18. Guo, N.; Liu, C.; Mo, Q.; Cao, J.; Ouyang, C.; Lu, X.; Zeng, Q. Business Process Remaining Time Prediction Based on Incremental Event Logs. IEEE Trans. Serv. Comput. 2025, 18, 1308–1320. [Google Scholar] [CrossRef]
  19. Gómez Muñoz, C.Q.; García Márquez, F.P.; Arcos, A.; Cheng, L.; Kogia, M.; Papaelias, M. Calculus of the defect severity with EMATs by analysing the attenuation curves of the guided waves. Smart. Struct. Syst. 2017, 19, 195–202. [Google Scholar] [CrossRef]
  20. Yang, Y.; Sørensen, J.D. Cost-optimal maintenance planning for defects on wind turbine blades. Energies 2019, 12, 998. [Google Scholar] [CrossRef]
  21. Mensah, A.F.; Dueñas-Osorio, L. A closed-form technique for the reliability and risk assessment of wind turbine systems. Energies 2012, 5, 1734–1750. [Google Scholar] [CrossRef]
  22. Hussain, B.; Afzal, M.K.; Ahmad, S.; Mostafa, A.M. Intelligent traffic flow prediction using optimized GRU model. IEEE Access 2021, 9, 100736–100746. [Google Scholar] [CrossRef]
  23. Mohammadi Farsani, R.; Pazouki, E. A transformer self-attention model for time series forecasting. JECEI 2020, 9, 1–10. [Google Scholar]
  24. Fani Sani, M.; van Zelst, S.J.; van der Aalst, W.M.P. The impact of event log subset selection on the performance of process discovery algorithms. In Proceedings of the ADBIS 2019, Bled, Slovenia, 8–11 September 2019; Springer: Cham, Switzerland, 2019; pp. 391–404. [Google Scholar]
  25. Wen, L.; Van Der Aalst, W.M.; Wang, J.; Sun, J. Mining process models with non-free-choice constructs. Data Min. Knowl. Discov. 2007, 15, 145–180. [Google Scholar] [CrossRef]
  26. Leemans, S.J.; Fahland, D.; van der Aalst, W.M.P. Discovering block-structured process models from event logs containing infrequent behaviour. In Proceedings of the BPM 2013, Beijing, China, 26–30 August 2013; Springer: Cham, Switzerland, 2014; pp. 66–78. [Google Scholar]
  27. Berti, A. Statistical sampling in process mining discovery. In Proceedings of the IARIA eKNOW 2017, Nice, France, 19–23 March 2017; pp. 41–43. [Google Scholar]
  28. Bauer, M.; Senderovich, A.; Gal, A.; Grunske, L.; Weidlich, M. How much event data is enough? A statistical framework for process discovery. In Proceedings of the CAiSE 2018, Tallinn, Estonia, 11–15 June 2018; Springer: Cham, Switzerland, 2018; pp. 239–256. [Google Scholar]
  29. Liu, C.; Pei, Y.; Zeng, Q.; Duan, H. LogRank: An approach to sample business process event log for efficient discovery. In Proceedings of the KSEM 2018, Changchun, China, 17–19 August 2018; Springer: Cham, Switzerland, 2018; pp. 415–425. [Google Scholar]
  30. Liu, C.; Pei, Y.; Zeng, Q.; Duan, H.; Zhang, F. LogRank+: A Novel Approach to Support Business Process Event Log Sampling. In Proceedings of the WISE 2020, Amsterdam, The Netherlands, 20–24 October 2020; pp. 417–430. [Google Scholar]
  31. Fani Sani, M.; Vazifehdoostirani, M.; Park, G.; Pegoraro, M.; van Zelst, S.J.; van der Aalst, W.M.P. Event log sampling for predictive monitoring. In Proceedings of the ICPM 2021, Eindhoven, The Netherlands, 31 October–4 November 2021; Springer International Publishing: Cham, Switzerland, 2021; pp. 154–166. [Google Scholar]
  32. Liu, C.; Huiling, L.; Zhang, S.; Cheng, L.; Zeng, Q. Cross-department collaborative healthcare process model discovery from event logs. IEEE Trans. Autom. Sci. Eng. 2022, 20, 2115–2125. [Google Scholar] [CrossRef]
  33. Su, X.; Liu, C.; Zhang, S.; Zeng, Q. Sampling business process event logs with guarantees. Concurr. Comput. Pract. Exp. 2024, 36, e8077. [Google Scholar] [CrossRef]
  34. Guo, N.; Cong, L.; Li, C.; Zeng, Q.; Ouyang, C.; Liu, Q. Explainable and effective process remaining time prediction using feature-informed cascade prediction model. IEEE Trans. Serv. Comput. 2024, 17, 949–962. [Google Scholar] [CrossRef]
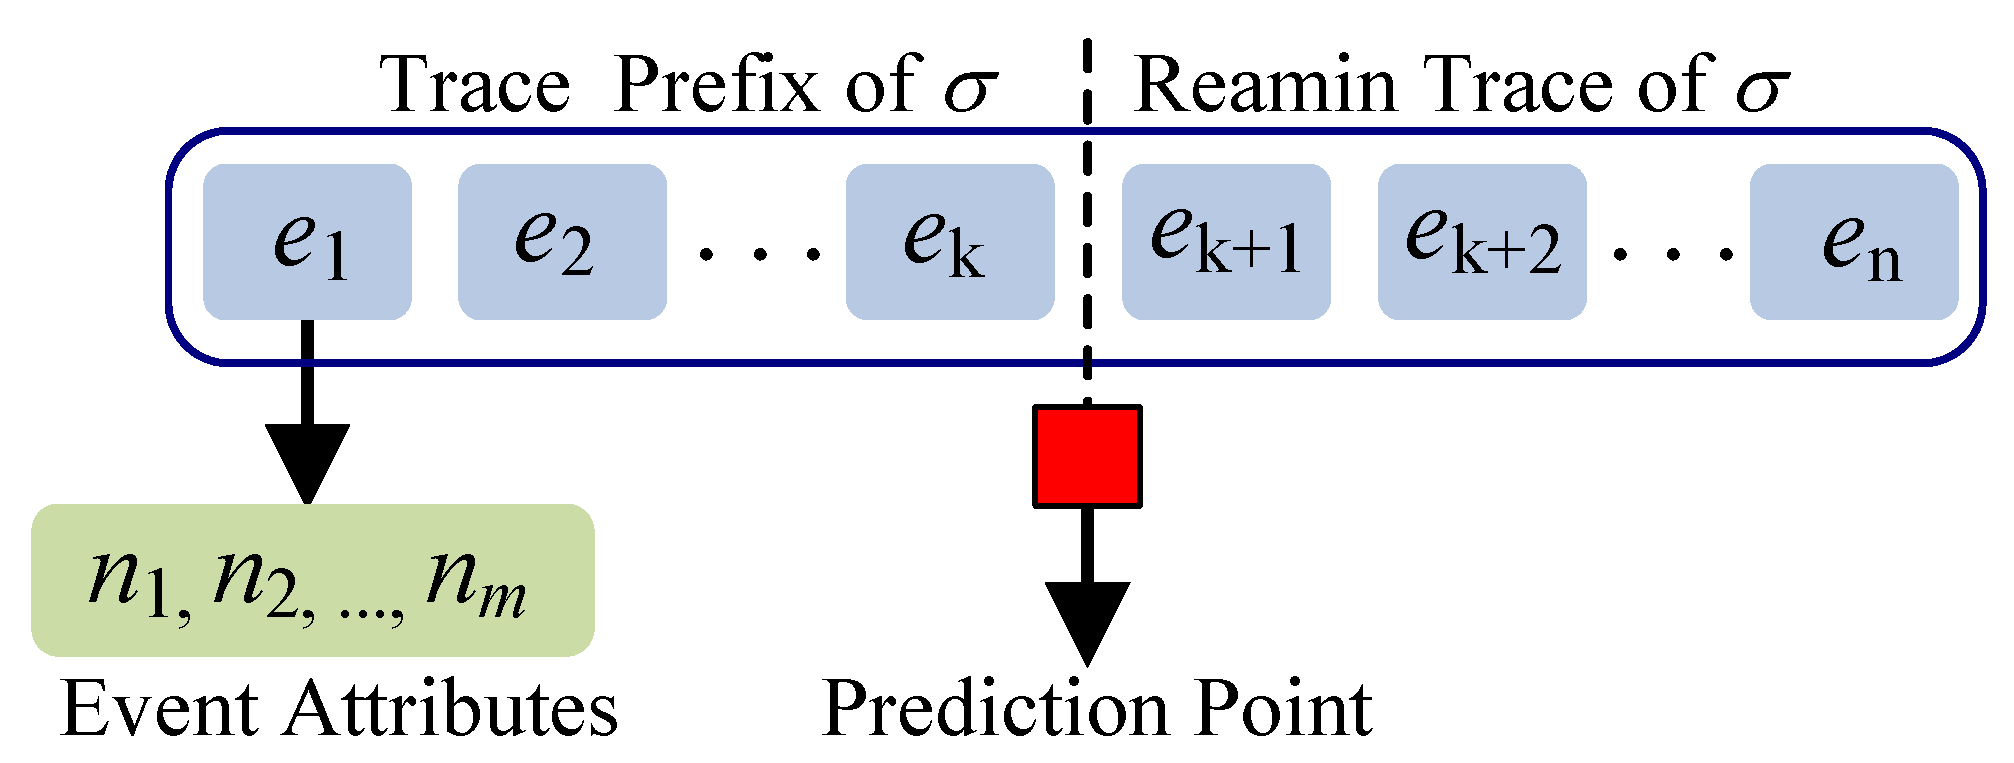
Figure 1. Next-event prediction framework.
Energies 18 04238 g001
Figure 2. An approach overview of the SaNeP.
Energies 18 04238 g002
Figure 3. The designed encoding scheme.
Energies 18 04238 g003
Figure 4. Network structure of the LSTM model-based prediction model.
Energies 18 04238 g004
Figure 5. Experimental results of prediction accuracy.
Energies 18 04238 g005
Figure 6. Experimental results of prediction performance.
Energies 18 04238 g006
Figure 7. Experimental results of prediction time.
Energies 18 04238 g007
Figure 8. Prediction performance comparison with the 30% ratio.
Energies 18 04238 g008
Table 1. Fragment of wind-turbine maintenance event log.
EventCase IDAttribute
ActivityTimestampResource
e1102C20200003Work Permit form Completion (WPC)2020/1/20 10:16:00Peter
e2102C20200003Issuance of Work Permit (IWP)2020/1/20 10:18:00David
e3102C20200003Approval for Work Permit (AWP)2020/1/20 17:07:00Aidan
e4102C20200003Arrangement of Safety Measures (ASM)2020/1/20 17:36:00Bertie
e5102C20200003Confirmation (CON)2020/1/20 17:41:00Eric
Table 2. Parameter settings of the deep-learning models.
ModelInput_SizeHidden_SizeNum_LayersDropoutBatch_SizeLearning_RateActivation Function
LSTM2012830.1640.001softmax
GRU2012830.1640.001softmax
Bi-LSTM2012830.1640.001softmax
Bi-GRU2012830.1640.001softmax
RNN2012830.1640.001softmax
Transformer3025640.1640.001softmax
Table 3. Accuracy improvement ratio.
Sampling ConfigurationImprovement Ratio (%)
TechniquesRatioLSTMGRUBi-LSTMBi-GRUTransformerRNN
Trace-Im10%−81.706−5.322−62.931−3.909−0.632−11.852
20%−31.1930−25.42600.145−0.584
30%6.8960.3503.99403700.5690.143
40%6.9180.3504.3000.4220.5690.143
50%6.9620.4125.4230.4940.6830.143
Log-Rank10%−30.663−22.594−49.738−16.84−0.632−8.103
20%−31.259−0.278−25.502−0.062−0.207−1.383
30%6.5870.3504.3320.3500.2900.072
40%6.8190.3914.8230.4630.5690.072
50%6.8960.4125.6530.4940.6940.133
Log-Rank+10%−50.601−21.956−50.404−18.373−0.704−9.353
20%−23.237−0.082−26.168−0.062−0.135−0.553
30%6.3670.4124.0810.4940.3520
40%6.4440.4124.9760.4940.6110
50%6.9620.4845.3580.4940.7040.062
Variant-Last10%−7.051−9.789−13.411−10.266−0.559−2.366
20%−4.877−7.483−6.296−4.9580.217−1.270
30%−0.199−1.472−3.405−0.2060.497−0.574
40%3.145−0.628−2.215−0.0620.5280
50%6.3670.165−0.2070.3700.6520.112
Trace-Last10%−4.877−6.722−8.326−7.612−0.414−2.346
20%−1.126−4.056−6.667−2.8600.497−1.26
30%−1.059−1.678−3.481−0.7610.631−2.725
40%2.472−1.246−2.521−0.3400.694−0.010
50%5.6940.257−0.6220.3290.7870.143
Disclaimer/Publisher’s Note: The statements, opinions and data contained in all publications are solely those of the individual author(s) and contributor(s) and not of MDPI and/or the editor(s). MDPI and/or the editor(s) disclaim responsibility for any injury to people or property resulting from any ideas, methods, instructions or products referred to in the content.