Article

Battery SOH Estimation Based on Dual-View Voltage Signal Features and Enhanced LSTM

by
Shunchang Wang
1,2,
Yaolong He
3 and
Hongjiu Hu
1,2,*
1
Shanghai Institute of Applied Mathematics and Mechanics, School of Mechanics and Engineering Science, Shanghai University, Shanghai 200072, China
2
Shanghai Key Laboratory of Mechanics in Energy Engineering, Shanghai 200072, China
3
Shanghai Frontier Science Center of Mechanoinformatics, Shanghai 200072, China
*
Author to whom correspondence should be addressed.
Energies 2025, 18(15), 4016; https://doi.org/10.3390/en18154016
Submission received: 20 June 2025 / Revised: 21 July 2025 / Accepted: 25 July 2025 / Published: 28 July 2025
(This article belongs to the Section D: Energy Storage and Application)

Abstract

Accurate assessment of the state of health (SOH) of lithium-ion batteries (LIBs) is fundamental to ensuring safe operation. However, due to the complex electrochemical processes during battery operation and the limited availability of training data, accurate estimation of the state of health remains challenging. To address this, this paper proposes a prediction framework based on dual-view voltage signal features and an improved Long Short-Term Memory (LSTM) neural network. By relying solely on readily obtainable voltage signals, the data requirement is greatly reduced; dual-view features, comprising kinetic and aggregated aspects, are extracted based on the underlying reaction mechanisms. To fully leverage the extracted feature information, Scaled Dot-Product Attention (SDPA) is employed to dynamically score all hidden states of the long short-term memory network, adaptively capturing key temporal information. The experimental results based on the NASA PCoE battery dataset indicate that, under various operating conditions, the proposed method achieves an average absolute error below 0.51% and a root mean square error not exceeding 0.58% in state-of-health estimation, demonstrating high predictive accuracy.

1. Introduction

The intensification of environmental degradation and energy shortages has led to a rapid increase in demand for clean energy and energy storage [1,2]. In this context, lithium-ion batteries (LIBs) have been widely adopted in electric vehicles and energy storage systems owing to their high energy density, long cycle life, and environmental friendliness [3,4,5,6]. However, battery lifespan declines as cycle count increases, which not only affects routine device operation but may also induce abnormal temperature rises and safety hazards [7,8]. State of health (SOH) is typically defined as the ratio of current available capacity to rated capacity, directly reflecting battery aging and serving as a crucial indicator of safety [9,10]. Accurate SOH estimation guides routine maintenance and can effectively mitigate the risk of extreme events such as thermal runaway, which is critical for ensuring the reliable operation of LIBs [11]. Nevertheless, because the degradation process involves interactions among multiple factors, such as solid electrolyte interphase (SEI) film growth, side reactions, and mechanical structural changes, the mechanisms of capacity fade are complex and highly nonlinear, and thus, precise SOH assessment remains challenging [12,13,14].
Currently, SOH estimation methods can generally be classified into two categories: model-based methods and data-driven methods [15]. In model-based approaches, electrochemical models characterize the battery’s behavior during operation; for example, the pseudo-two-dimensional (P2D) model [16] accounts for electrochemical reactions, ion transport, and so on, with its accuracy depending strongly on model fidelity. In addition to electrochemical models, equivalent circuit models (ECM) are also common. Huang et al. [17] proposed an adaptive segmented ECM based on the extended Kalman filter (EKF). This model can efficiently adapt to varying operating conditions without relying on prior testing, offering high flexibility and accuracy. Xu et al. [18] combined a minimal electrochemical model (MEM) with an ECM; the experimental results indicate that this method achieves an average SOH prediction error of approximately 2%. These approaches demonstrate high precision in SOH estimation. The ECM simplifies the battery into electrical components to simulate its operation, facilitating the approximation of dynamic characteristics; however, it may encounter challenges in parameter identification.
Recent years have witnessed growing interest in data-driven SOH estimation because of its flexibility and high predictive accuracy. Such methods typically employ signals closely related to battery degradation and use appropriate algorithms to learn aging patterns from data, thereby enabling accurate SOH prediction [19]. Researchers have made significant progress in SOH prediction using data-driven approaches. Jorge et al. [20] extracted features from circuit, voltage, and temperature curves and employed a window-exogenous Long Short-Term Memory (LSTM), which markedly reduced prediction error and achieved favorable results; Zhou et al. [21] used the sparrow search algorithm to optimize a CNN-Bi-LSTM, improving model accuracy. Currently, a substantial portion of existing research on lithium-ion battery SOH prediction relies on multiple signal channels such as voltage, current, and temperature sensor data. However, in many industrial applications, the addition of extra sensors is constrained by cost, power consumption, and wiring issues, making voltage-only measurements more common. Voltage signal acquisition entails low power consumption, simple wiring, and low acquisition cost; under an equivalent hardware budget, it more readily achieves higher measurement accuracy, whereas current and temperature measurements sometimes lack sufficient precision due to sensor limitations. For example, current sensors are more susceptible to thermal drift compared to voltage sensors, and temperature sensors are prone to deviations caused by sub-optimal thermal coupling during installation. To address this issue, this work focuses on strategies for accurately estimating battery SOH using only readily obtainable charge-discharge voltage signals when current and temperature information are limited.
Furthermore, with respect to specific algorithms, methods such as Extreme Learning Machine (ELM) [22,23], eXtreme Gradient Boosting (XGBoost) [24,25], and various neural networks [26,27,28] have been widely applied. Lin et al. [29] proposed an adaptive, tunable hybrid RBF network and validated its reliability. Wang et al. [30] employed a hybrid model named Multi-Feature Extraction and Temporal Convolutional Attention Gated Recurrent Units (MFE-GRU-TCA) to improve prediction accuracy. LSTM, as an excellent time-series prediction model, can capture temporal dependencies in the lithium-ion battery degradation process through its gating mechanism and has attracted attention in SOH prediction. Zhang et al. [31] constructed an LSTM model for battery capacity to extract intrinsic aging patterns and accurately estimate SOH. Zhao et al. [32] used a PSO-optimized LSTM to learn capacity degradation and, in comparison with other conventional models, demonstrated superior performance. As a variant of RNNs, LSTM effectively addresses the gradient explosion and vanishing gradient issues of traditional RNNs and is better able to capture long-range dependencies. Its superior performance in SOH prediction has been validated [33,34,35]. However, in conventional practice, LSTM uses the hidden state at the final time step for regression, potentially overlooking intermediate-step information. When only voltage signals are available, discarding intermediate hidden states and retaining only the final hidden state may limit the model’s representational capacity and thus present certain limitations.
To address the aforementioned challenges, this paper proposes an SOH prediction framework that relies solely on voltage-domain signals and an improved LSTM network. The framework uses only voltage sampling data without relying on current or temperature measurements, thereby significantly reducing dependence on sensor inputs and enabling accurate SOH prediction, even when other signals are unavailable. To fully exploit the voltage signal, this study extracts four dynamic features from an electrochemical-mechanism perspective, including Interval Kinetic Response Time (IKRT). To enhance voltage feature representation and better capture degradation patterns, we apply feature aggregation methods to extract health features that reflect underlying electrochemical degradation mechanisms. The dynamic features and aggregation features are then fused to form dual-view features as network inputs. Standard LSTMs typically use only the final hidden state as the sequence representation, which risks discarding valuable long-term temporal information. To overcome this limitation, an improved LSTM architecture is proposed. All historical hidden states are fed into a Scaled Dot-Product Attention (SDPA) mechanism with learnable query vectors, enabling the network to focus on hidden states at different encoder time steps and assign higher weights to the most informative parts. This approach alleviates the vanishing-gradient problem and prevents the loss of key intermediate temporal information caused by hidden state update mechanisms, thus enabling more comprehensive analysis of the dual-view signals and achieving better prediction performance. The main contributions of this study are as follows:
(1)
To address the issue of limited information, this paper proposes an SOH prediction method that relies exclusively on readily available voltage-domain signals containing electrochemical reaction mechanism information. This approach offers a novel perspective for battery lifespan prediction when current and temperature data are unavailable. Since only voltage signals are required, this method is straightforward to deploy.
(2)
Based on the electrochemical degradation mechanism, four kinetic features and two aggregated features are extracted to distill aging information, and their significant correlations with SOH are validated using the Pearson correlation coefficient. The resulting feature set is then fed into a neural network for prediction.
(3)
Owing to the constrained-signal scenario, higher demands are placed on the network’s ability to learn from the available features. In this study, the LSTM output mechanism is reexamined by discarding the conventional practice of using only the last hidden state. Instead, all historical hidden states are treated as the key and value matrices in a scaled dot-product attention mechanism. A learnable parameter α is employed to dynamically generate the query matrix, which significantly enhances the model’s expressive capacity and thus yields superior prediction performance.
(4)
An SOH prediction framework is constructed by combining dual-view features extracted solely from voltage-domain signals with the improved LSTM network, thus obviating the need for current, temperature, or other sensor inputs. High prediction accuracy is achieved using only a small amount of easily obtainable information. Ablation analyses are conducted on the NASA battery dataset, and comparisons with conventional methods demonstrate the framework’s effectiveness.
The remainder of this paper is organized as follows: Section 2 provides a detailed description of the feature extraction methods and the Pearson validation process, and gives a detailed introduction to the neural network used; Section 3 presents the evaluation metrics and compares training results under different conditions; Section 4 concludes the study and proposes directions for future research.

2. Methods

The overall framework is illustrated in Figure 1 and consists of four parts. First, considering scenarios with hardware constraints, only readily available voltage signals are used for information extraction and prediction. To fully utilize voltage data, four features are extracted from a kinetic perspective. In addition, two aggregation features are derived, forming a comprehensive feature set for subsequent training. Next, correlation analysis is conducted to verify that each feature has a significant relationship with SOH. Then, the features are fed into the improved LSTM model. Scaled dot-product attention is applied to the LSTM hidden states to assign adaptive weights, with the query matrix provided by a learnable parameter α . The resulting representation is passed to a fully connected predictor to generate the output. Finally, error analysis is performed on the results.

2.1. Feature Engineering

This section first outlines the dataset’s provenance and principal characteristics. It then details the voltage-derived features, explains how each feature maps onto specific electrochemical mechanisms, and describes the corresponding extraction procedures. Finally, the correlation between these features and SOH is assessed through correlation-coefficient analysis.

2.1.1. Dataset Description

The study employs the battery aging dataset from the NASA Ames Prognostics Center [36] to validate the effectiveness of the proposed prediction framework. Cells B0005, B0006, B0007, and B0018 from this dataset were selected; each is an 18,650 lithium-ion battery with a rated capacity of 2 Ah. The four selected cells are early-stage, research-grade units ideally suited for SOH prediction research. These cells underwent charge and discharge operations under various conditions with signal sampling. During charging, a constant current of 1.5 A was applied until the cell voltage reached 4.2 V, after which a constant voltage stage was maintained until the current decreased to 20 mA; charging was then terminated, and a rest period followed. During discharge, cells B0005, B0006, B0007, and B0018 were discharged at a constant current of 2 A until the measured voltage reached 2.7 V, 2.5 V, 2.2 V, and 2.5 V, respectively. A remaining capacity of 70% of the rated capacity was defined as the end-of-life threshold; when capacity fell below 1.4 Ah, the cell was considered to have reached end of life. Figure 2 shows the capacity degradation curves.
The four curves represent the capacity degradation of the four batteries, and the dash-dot line denotes the critical capacity threshold. Signals closely associated with capacity fade include voltage, current, and temperature. In [37,38], voltage, current, and temperature signals from this dataset are used for prediction, which is a conventional approach. Here, we employ only the voltage signal. For battery B0005 as an example, the charge and discharge voltage curves are shown in Figure 3.

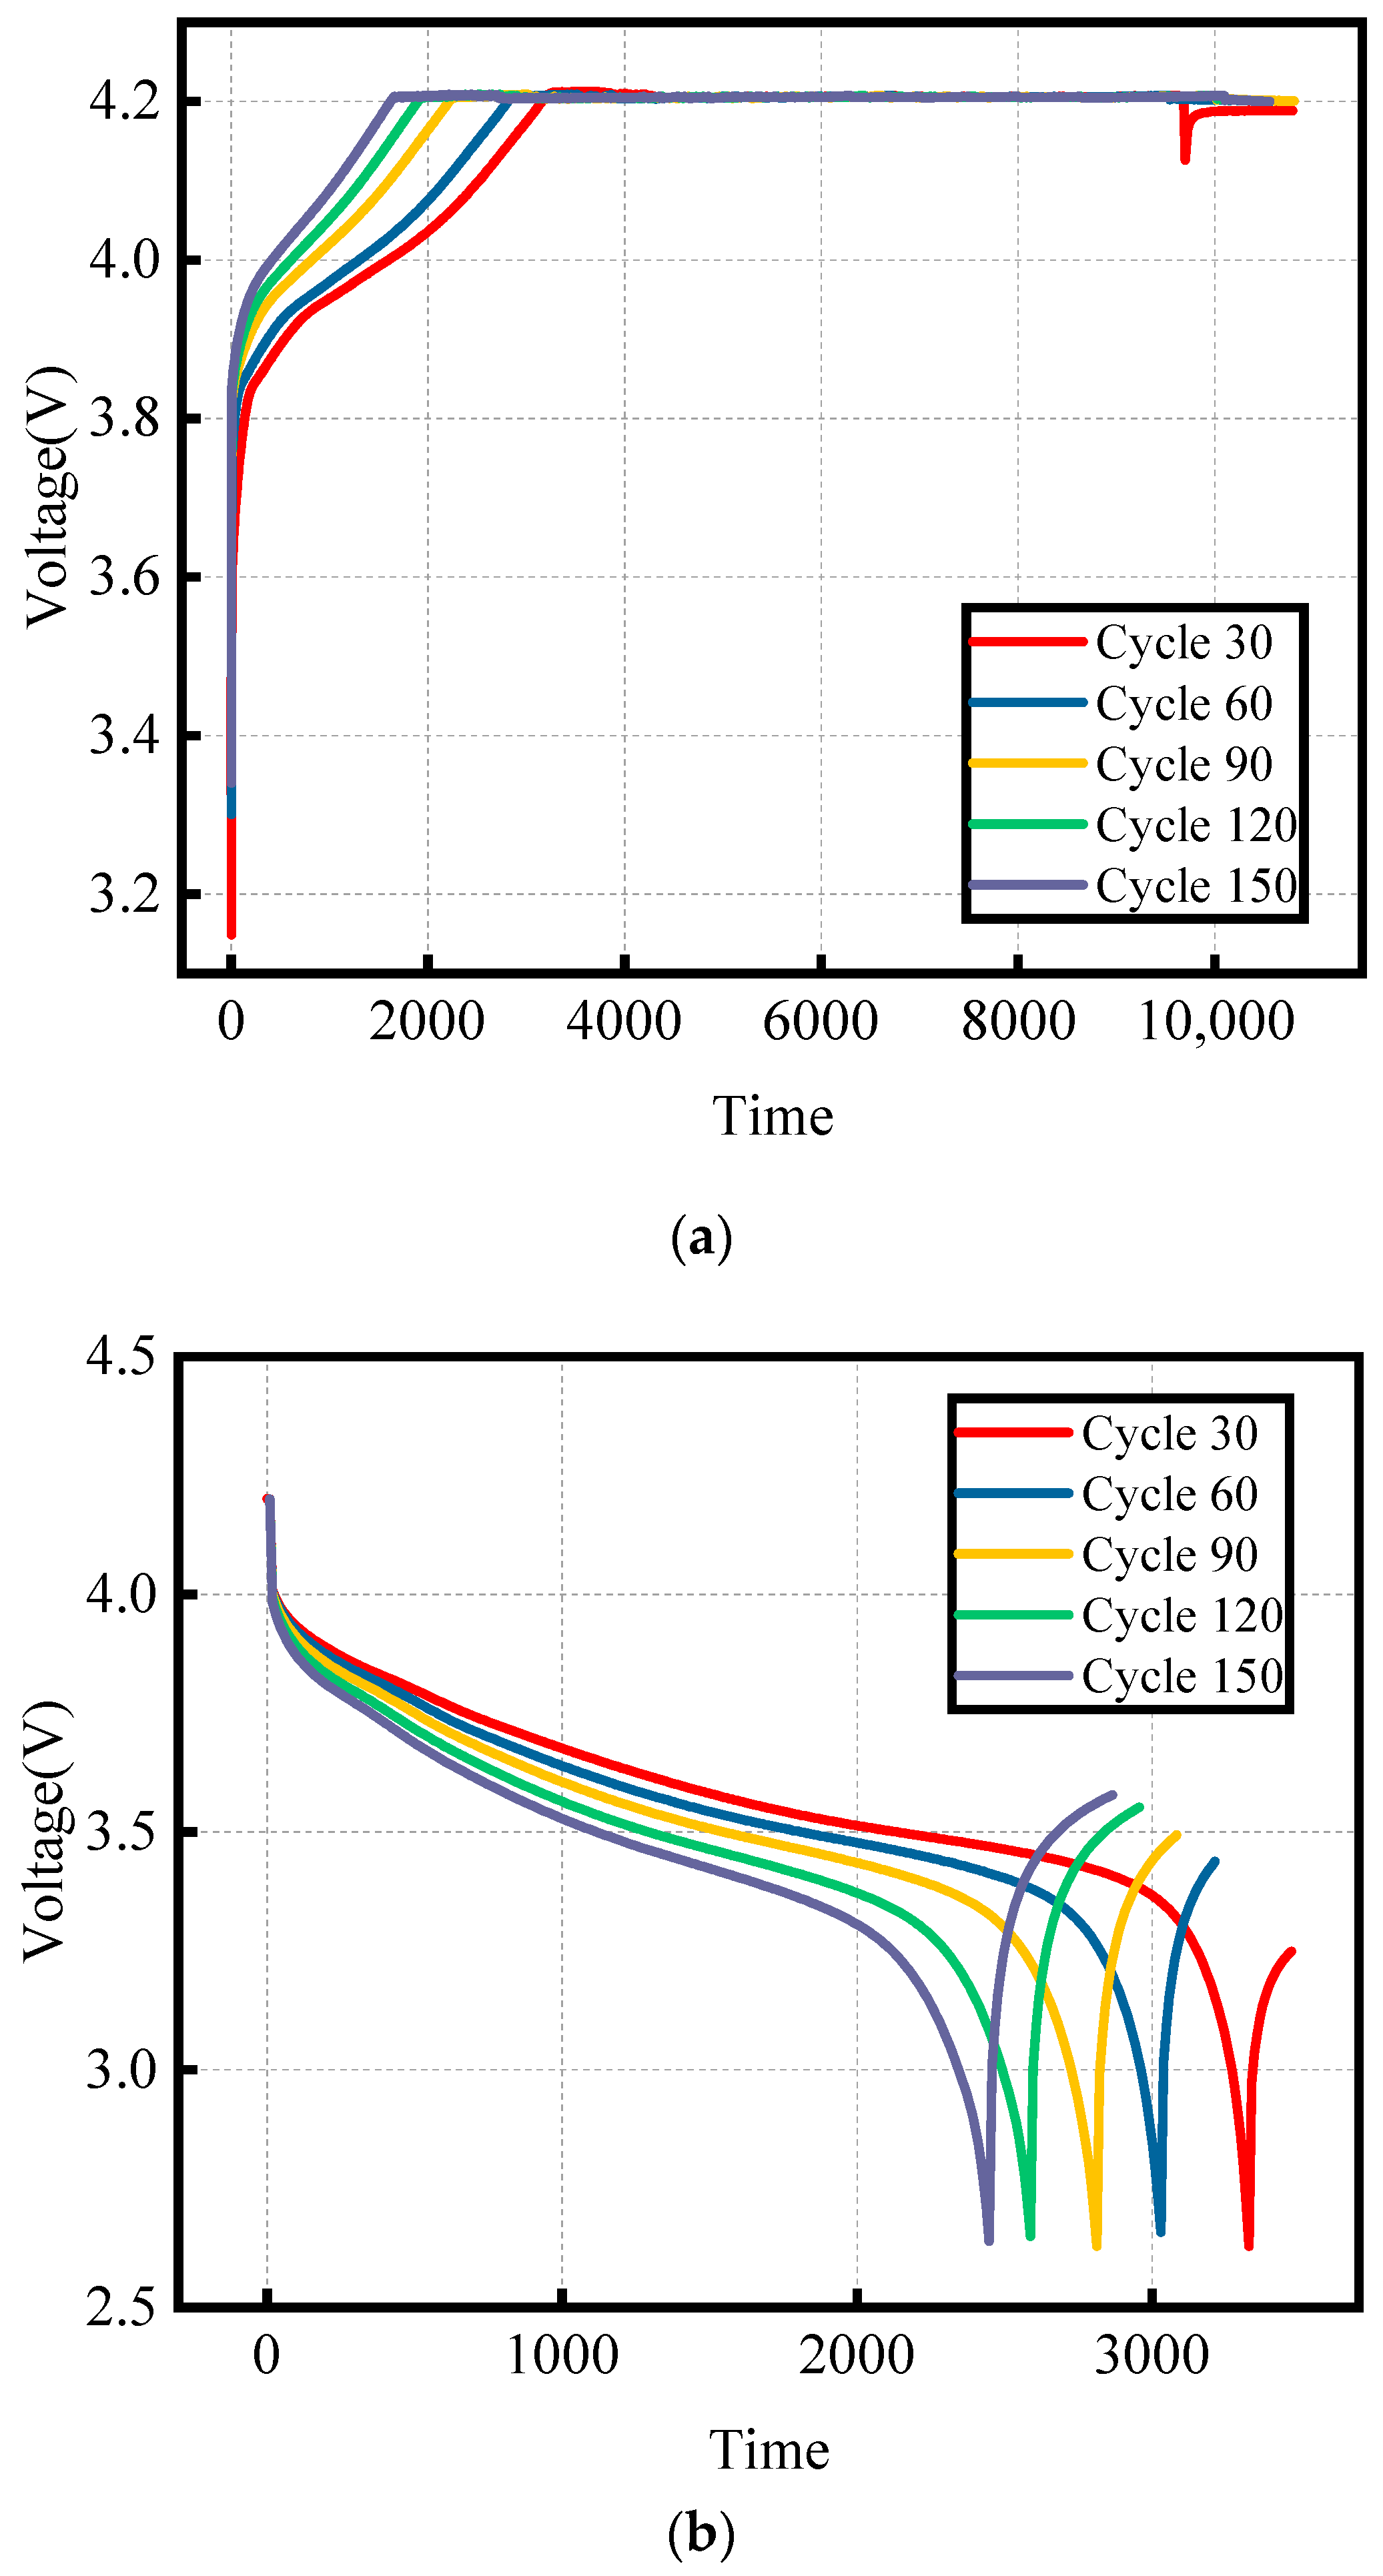
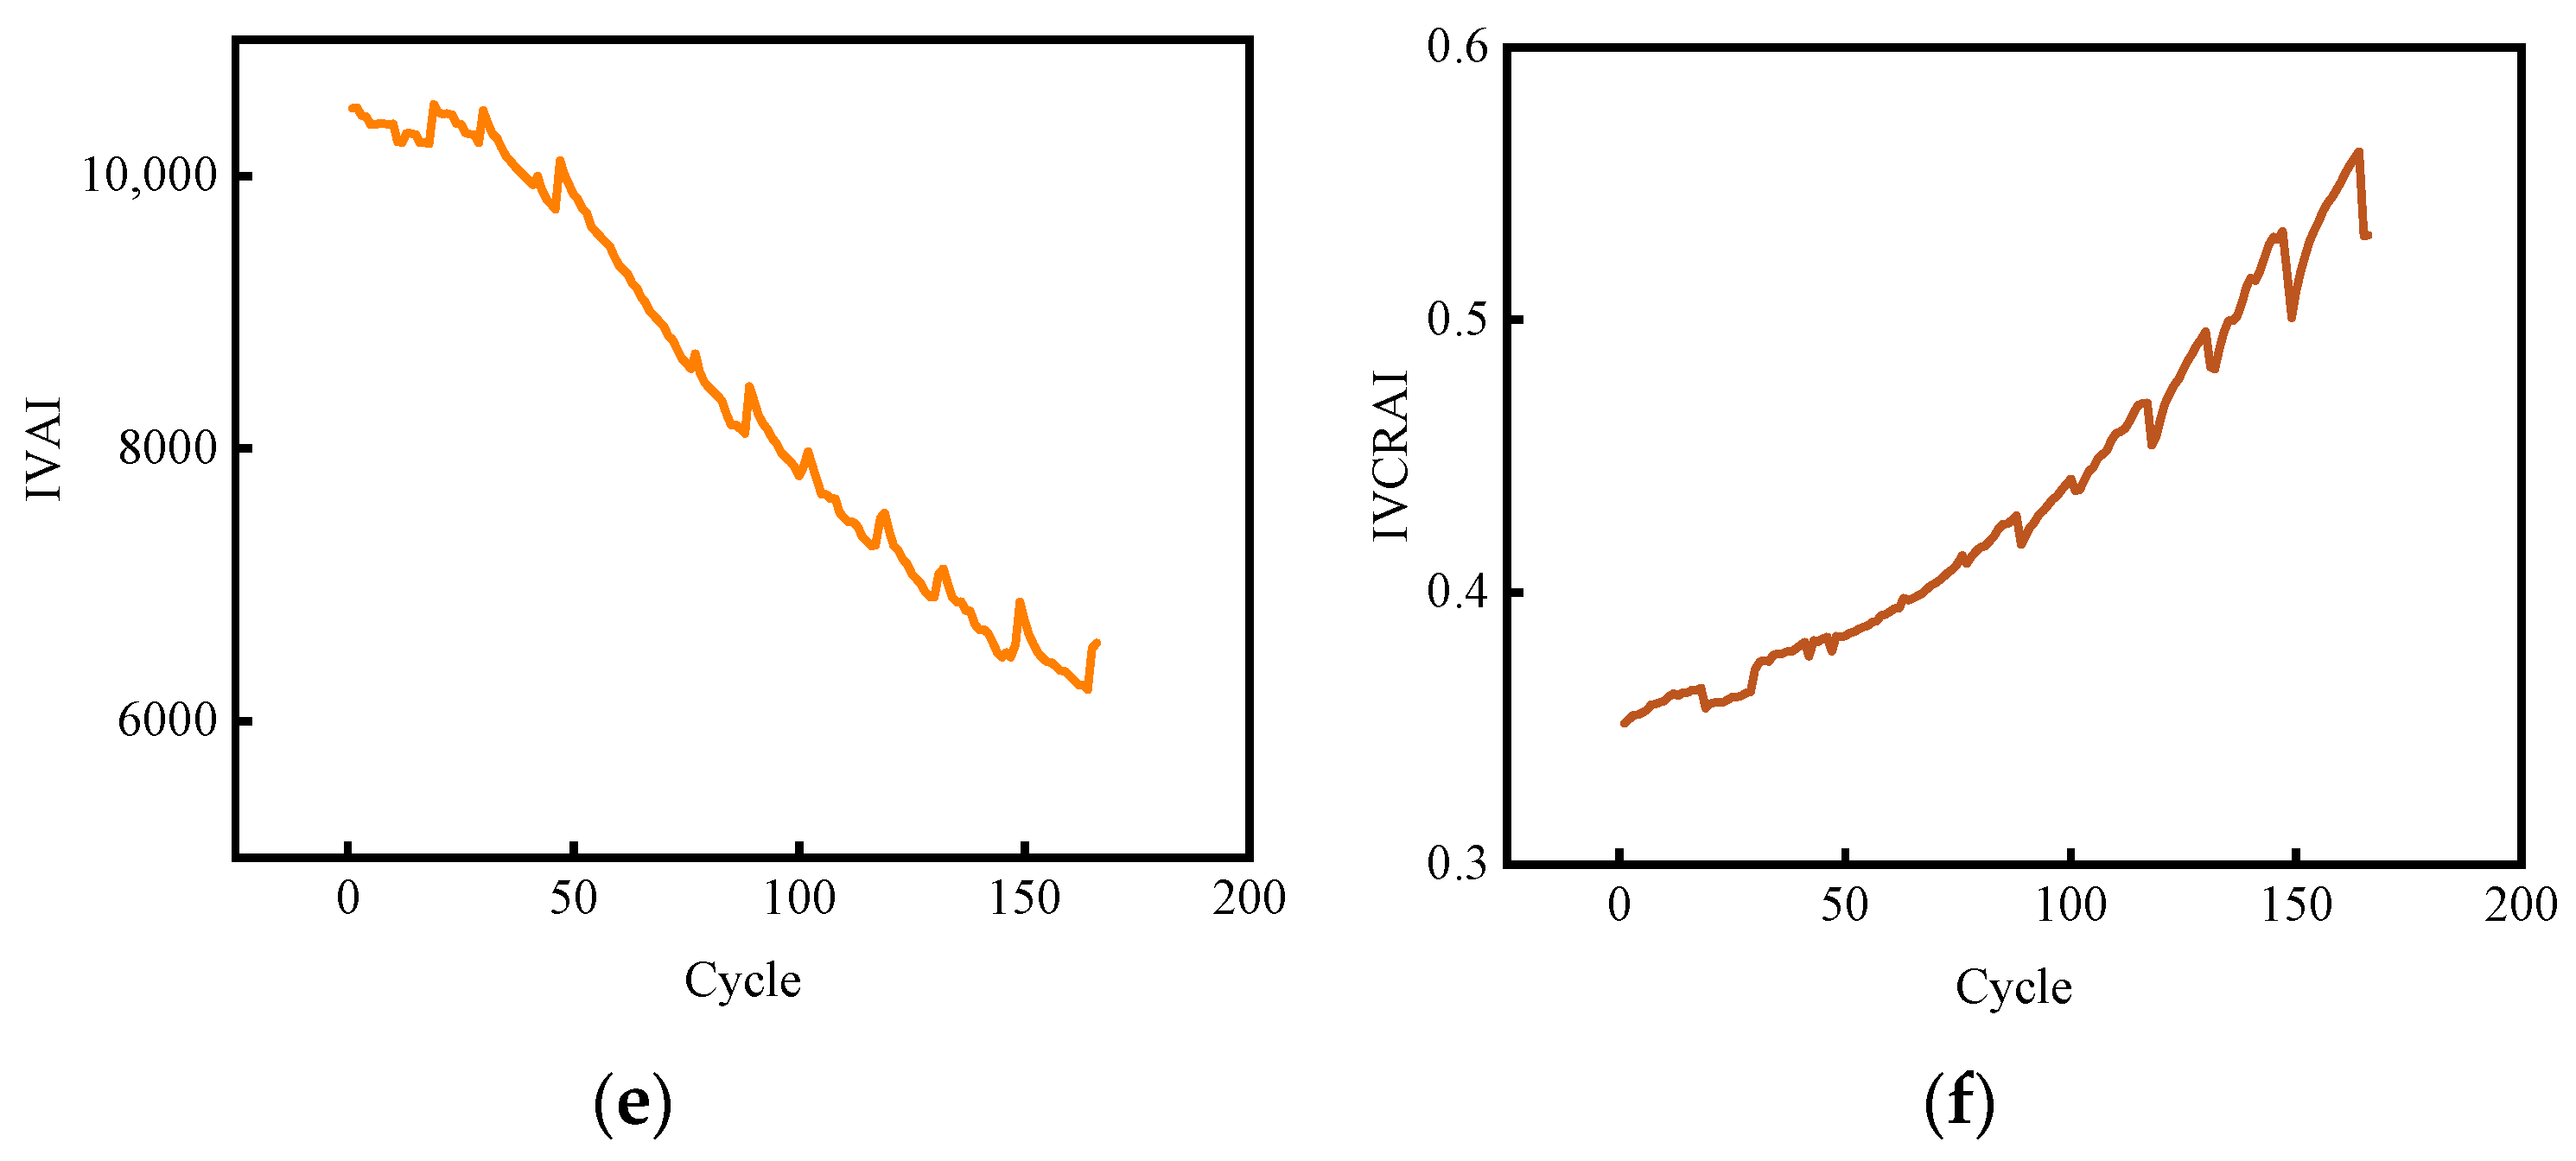
2.1.2. Dual-View Feature Extraction and Analysis of Voltage Signals

Charge-discharge voltage signals closely reflect changes in battery electrochemical performance and internal dynamic characteristics. First, in the voltage profile, as cycling proceeds, electrochemical processes such as lithium-ion intercalation/deintercalation in the electrode material and growth of the solid electrolyte interphase (SEI) cause variations in the rates of voltage rise or drop. Consequently, different cycles exhibit distinct kinetic response delays within specific voltage intervals. To characterize this phenomenon, we introduced two Interval Kinetic Response Time (IKRT) metrics: the Charging Interval Kinetic Response Time for a 0.2 V window (CIKRT) and the Discharging Interval Kinetic Response Time for a 0.1 V window (DIKRT). Specifically, for each charging cycle, we recorded the time difference between when the cell voltage reaches 3.9 V and when it reaches 4.1 V; for each discharging cycle, we recorded the time difference between when the voltage reaches 4.0 V and when it reaches 3.9 V. These metrics reflect the diffusion-kinetics rate within those voltage windows. Compared to the total cycling duration, CIKRT and DIKRT capture subtle evolution signals of internal electrode dynamics at a finer granularity. It is worth noting that the selection of these intervals is not unique but rather subjective.
During charging, the polarization process governs the electrode surface reaction kinetics. At the onset of constant-current charging, the current is held constant while the voltage rises. Charge accumulation at the electrode surface intensifies polarization effects. We define this duration as the Charge-Transfer Polarization Kinetic Time (CTPKT). In practice, CTPKT is represented by the time required for the constant-current stage from the initial voltage to the cutoff voltage, serving as a proxy for charge-transfer dynamics and the accumulation of initial polarization. CTPKT is directly correlated with the currently accessible charge capacity and simultaneously subject to the combined influences of interfacial polarization impedance and solid-state diffusion impedance. Consequently, CTPKT reflects the superposition of these two effects. Compared to metrics based on local windows, CTPKT smooths out point-wise noise and minor fluctuations, thereby capturing variations in the battery’s overall health state. Local kinetic response information is obtained via features such as CIKRT, whereas global kinetic response time is characterized by CTPKT. These complementary descriptors form a more comprehensive feature set for SOH prediction, enhancing the accuracy of SOH estimates.
At the transition from constant-current to constant-voltage charging, the polarization process gradually approaches a steady state, and the overall reaction rate becomes primarily determined by the mass-transfer rate of lithium ions diffusing from the electrolyte to the electrode active material. We extracted the duration of this steady-state phase and defined it as the Mass Transfer Polarization Steady-State Time (MTPST). During MTPST, the decay pattern of current is influenced by factors such as mass transfer limitations at the electrode–electrolyte interface and increasing solid-phase diffusion impedance. Although directly computing MTPST from first principles is challenging, we used the duration of the constant-voltage stage, from the moment the voltage enters the constant-voltage regime until the end of charging, as a practical surrogate for MTPST. This duration correlates strongly with SEI growth and ion-diffusion resistance. As the SEI evolves over repeated cycles and ion-diffusion resistance increases, the mass-transfer rate decreases, and the steady-state phase lengthens. Accordingly, MTPST reflects the rate limitation of lithium-ion transport from the electrolyte to the active material at high voltage.
During battery aging, certain aggregation features reflect the aging characteristics of the cell. To more fully exploit voltage-domain signals, we performed deep feature mining on the discharge voltage signal. First, the voltage at each time point on the discharge voltage curve corresponds to the electrochemical potential level of the battery at that instant. We defined the Interval Voltage Accumulation Index (IVAI) to quantify the cumulative voltage level that the battery can maintain within a specified interval. Its definition is given by the following formula:
IVAI = t ( V = V 1 ) t ( V = V 2 ) V ( t ) d t
For example, considering the interval from 3.3 V to 3.9 V, when SOH is relatively high, the battery can sustain a relatively flat voltage plateau for a longer duration. As it degrades, impedance rises, and active material mass decreases, so under constant-current discharge, a larger overpotential develops, causing the voltage curve to drop sharply toward 3.9 V rather than remain stable within the interval. Hence, IVAI sensitively reflects degradation signals.
Next, considering the characteristic of voltage decay rate over time, we computed, for each discharge cycle, the integral of the absolute value of the instantaneous voltage change rate over the interval. This metric is termed the Interval Voltage Change Rate Accumulation Index (IVCRAI). Its definition is given by:
IVCRAI = t 1 t 2 d V ( t ) d t d t
For example, considering a discharge time interval from 20 s to 2000 s, in the late degradation stage, polarization intensifies, and the voltage decays more rapidly over time, exhibiting a larger absolute decay rate; therefore, this feature assumes a higher value. Conversely, when the battery’s SOH is relatively high, the discharge voltage decays more slowly over time, and thus, this feature is smaller.
Based on the raw voltage signal, six features were extracted. Specifically, features were jointly derived from two complementary perspectives: the kinetic perspective, which focuses on the transient electrochemical response during battery cycling, and the aggregation perspective, which addresses statistical cumulative changes across time windows. The kinetic features concentrate on the dynamic response characteristics of the process, whereas the aggregate features emphasize summarization within a defined interval, thereby revealing cumulative effects and long-term trends. In total, four kinetic features and two aggregate features were obtained. The complementary combination of kinetic and aggregate features facilitates a more comprehensive elucidation of degradation mechanisms and SOH evolution. The variation of these features with cycle number is depicted in Figure 4.
As shown in Figure 4, there is a relationship between the features and the cycle number: CIKRT, DIKRT, CTPKT, and IVAI exhibit an overall decreasing trend as the cycle count increases, whereas MTPST and IVCRAI show an overall increasing trend.
The Pearson correlation coefficient is an important method for analyzing feature correlations; in general, a higher absolute value indicates that the feature is more valuable for SOH prediction. The Pearson correlation coefficient is defined as follows:
r = i = 1 n ( X i X ¯ ) ( Y i Y ¯ ) i = 1 n ( X i X ¯ ) 2 i = 1 n ( Y i Y ¯ ) 2
Here, n denotes the number of sample pairs, and X i and Y i represent the values of variables X and Y in the i -th observation. The Pearson correlation coefficient ranges from −1 to 1; an r value of 1 indicates a perfect positive linear relationship between the variables, whereas a value of −1 indicates a perfect negative linear relationship. We adopted r > 0.6 as the criterion for high correlation. The results of the Pearson correlation analysis between battery features and SOH are presented in Table 1.
As shown in Table 1, both the dynamic features and the aggregation features exhibit strong correlation with SOH. In particular, the IVAI and the Interval IVCRAI yield correlation coefficients above 0.94 across the four battery groups. Even for battery B0018, where the correlations of other features are comparatively lower, the absolute values of these two aggregation features’ correlation coefficients exceed 0.98. This high relevance arises because these features are constructed based on the dynamic processes or window-accumulation operations, serving as numerical mappings of the battery’s intrinsic degradation mechanisms and thus more accurately reflecting the degradation progression.

2.2. Neural Network

Considering that features are extracted solely from voltage sampling data, the limited availability of information imposes higher demands on the feature representation capability of the neural network. Conventional LSTM networks typically use only the hidden state at the final time step for prediction. In this study, all hidden states are fed into a scaled dot-product attention mechanism as keys and values. By adaptively calibrating attention weights, the model captures temporally significant historical processes. Finally, a fully connected layer produces the output, enabling the network to learn electrochemical mechanism information from the signal with greater subtlety and thereby yield more precise predictions.

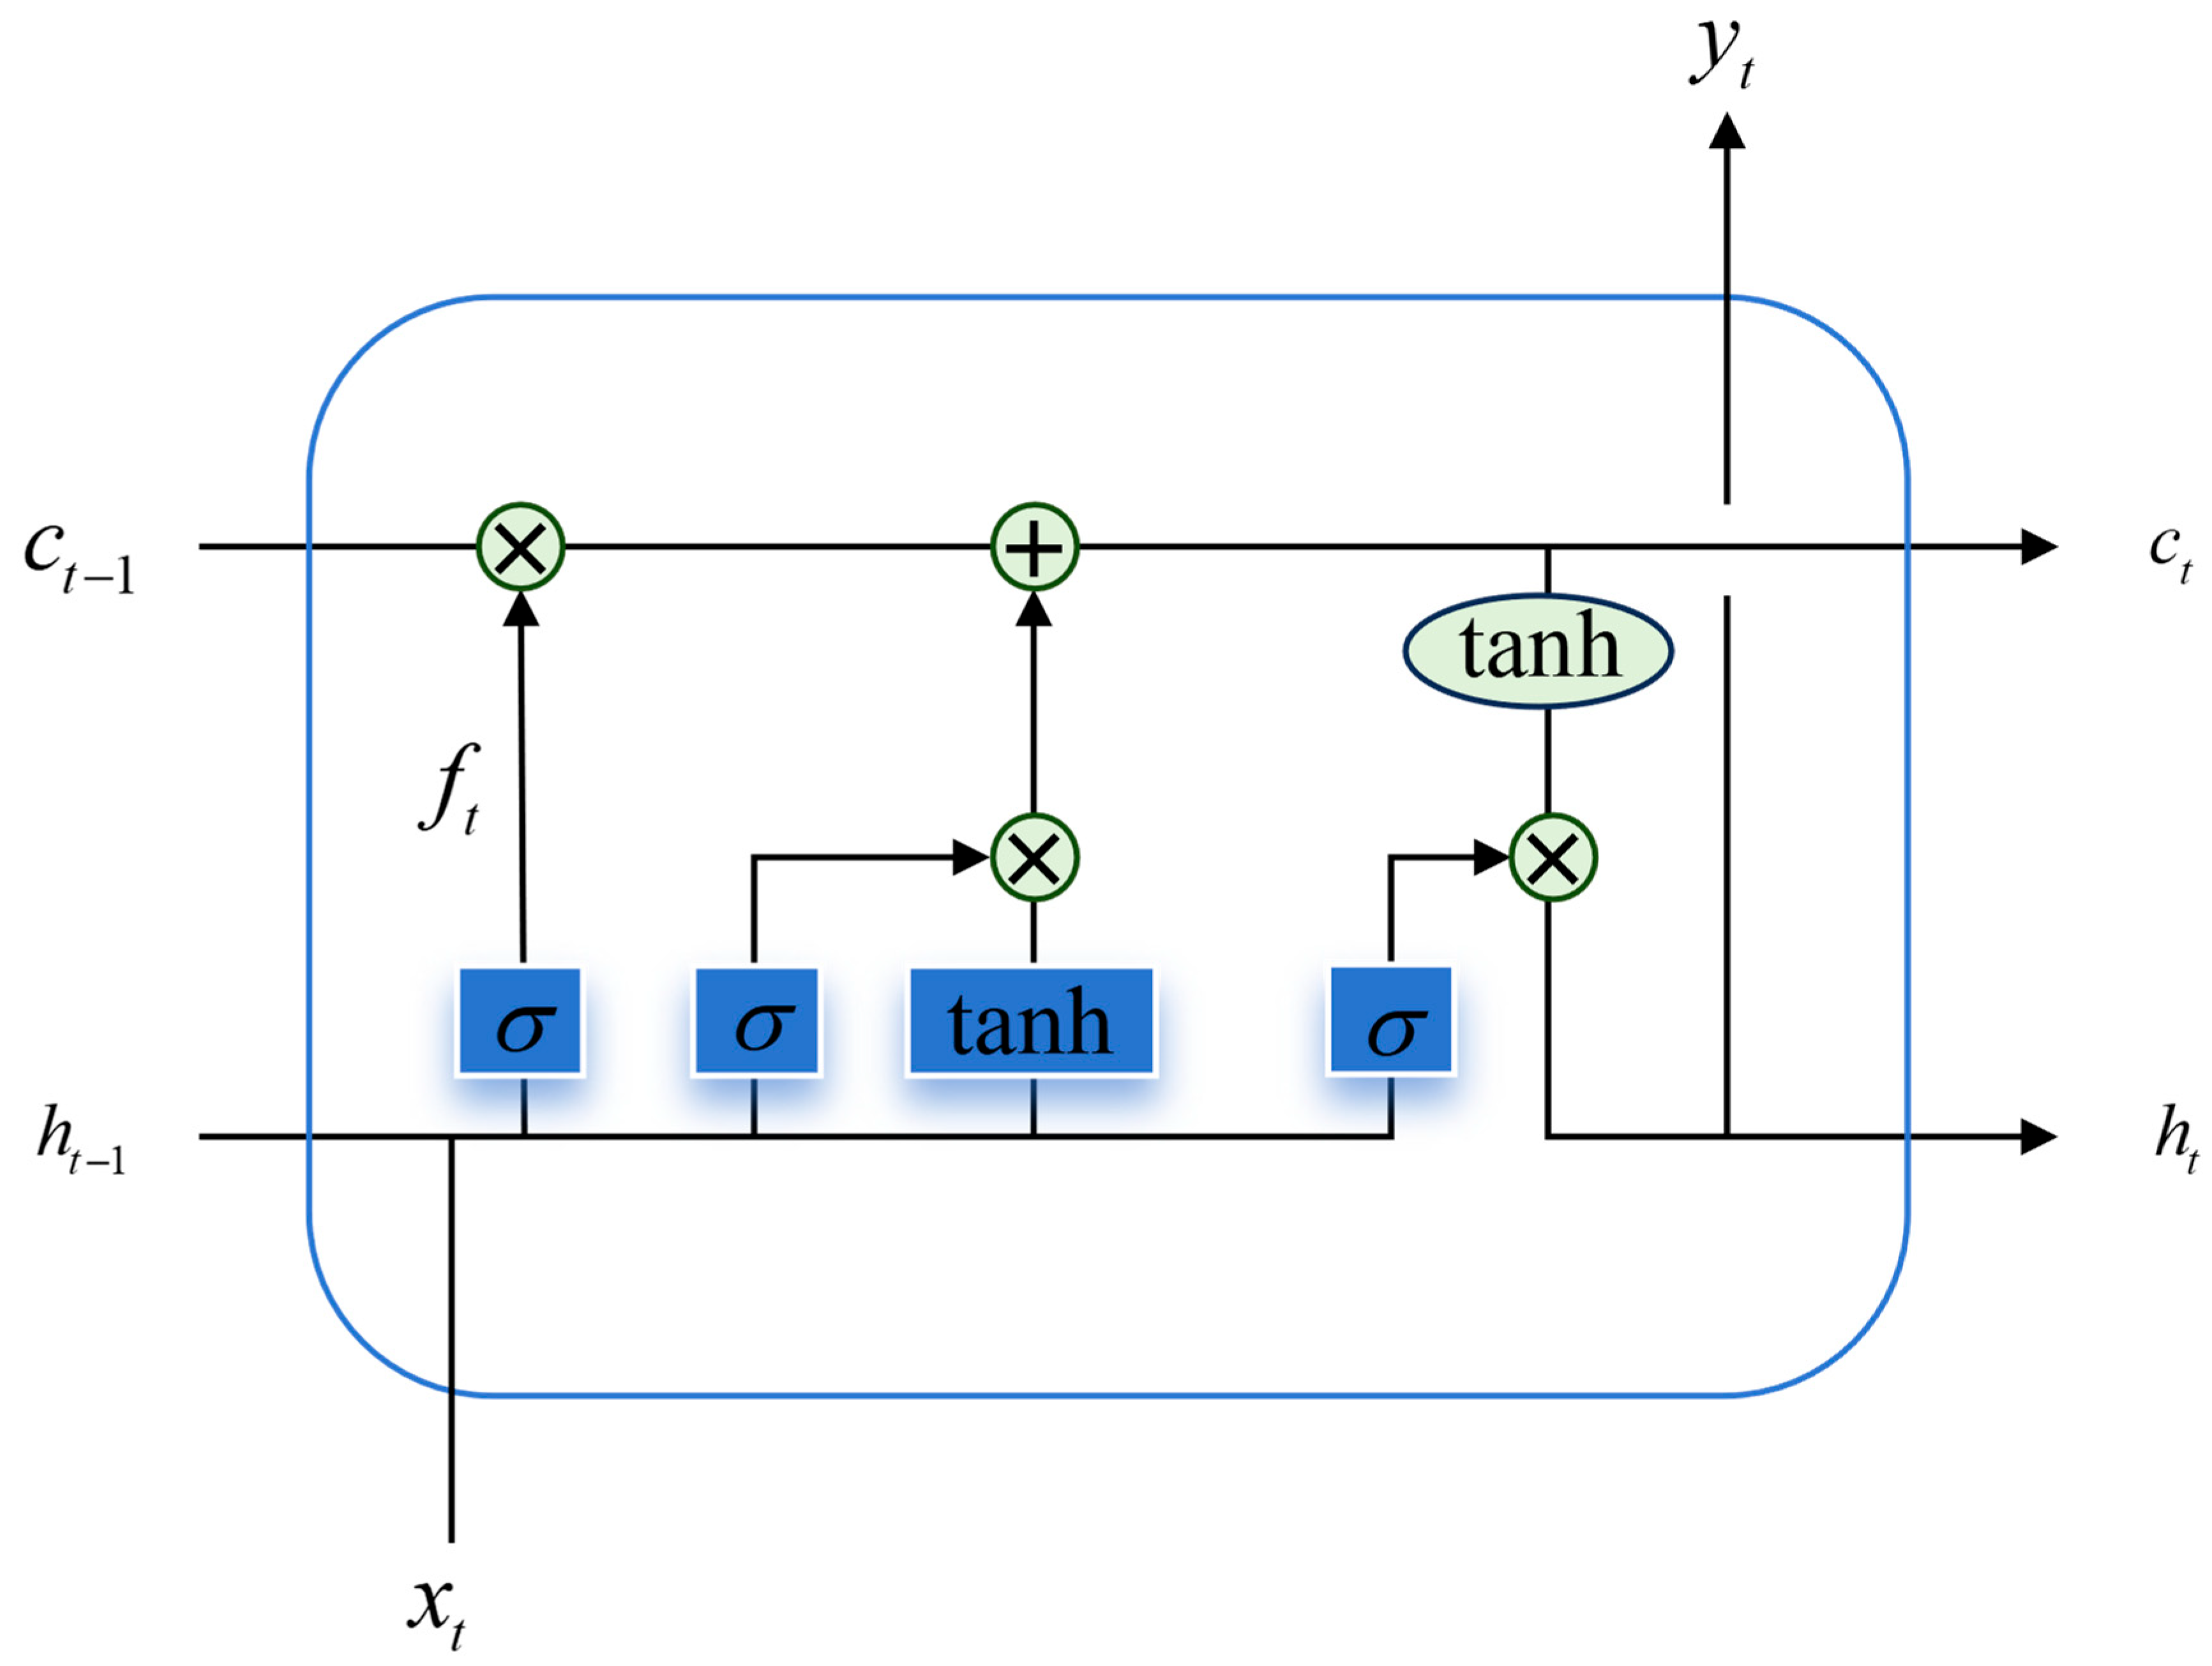
2.2.1. Long Short-Term Memory Neural Network

LSTM is a neural network improved on the basis of recurrent neural networks (RNNs). It is a specialized RNN with the capability to effectively capture historical information in sequences. Its original design aim was to alleviate the vanishing gradient problem encountered when training traditional RNNs on long sequences. The basic unit of LSTM is the LSTM cell, whose structure is shown in Figure 5.
The LSTM cell controls the flow of information through three gates, the input gate, forget gate, and output gate, selectively retaining, updating, or discarding information, thereby effectively addressing the vanishing gradient problem of traditional RNNs. Specifically, the forget gate determines which information should be discarded, the input gate determines the extent to which the current input influences the memory cell, and the output gate determines how much the memory cell contributes to the current hidden state. When using LSTM, the input is processed through these three gates and the memory cell computations to update the state step by step. In single-output tasks such as sequence regression, it is common to use the final time step as the output. The basic computation formulas of this network are as follows:
Forget Gate:
f t = σ ( W f [ h t 1 , x t ] + b f )
Input Gate:
i t = σ ( W i [ h t 1 , x t ] + b i )
Candidate Cell State:
c ˜ t = tanh ( W c [ h t 1 , x t ] + b c )
Cell State Update:
c t = f t c t 1 + i t c ˜ t
Output Gate:
o t = σ ( W o [ h t 1 , x t ] + b o )
Hidden State:
h t = o t tanh ( c t )
Here, x t denotes the input at the current time step, and h t 1 is the hidden state from the previous time step. W f , W i , W c , and W o are weight matrices, and b f , b i , b c , and b o are bias vectors. σ denotes the sigmoid function, and tanh denotes the hyperbolic tangent function. Features extracted from the voltage domain can provide information closely related to battery degradation. After these features are fed into the LSTM network, the standard processing flow is that the LSTM processes the input sequentially, producing hidden states at each time step; at the final time step, the last hidden state is used for prediction. Although this final state generally contains extrapolated information from earlier hidden states, an inevitable information-compression issue arises: if only the final hidden state is used, information from early time steps may not be fully utilized. This limitation is especially pronounced when the sequence length is large or when degradation patterns are complex, since long-term dependencies may be diluted. Denote the hidden states at all time steps t = 1 , 2 , , T as h 1 , h 2 , , h T . To allow the network to more flexibly leverage hidden-state information, one can collect all hidden states and apply a dynamic-weighting pooling rule for processing. Employing an attention mechanism addresses the insufficient information utilization that arises when a conventional LSTM relies solely on the final hidden state.

2.2.2. Scaled Dot-Product Attention Mechanism

The attention mechanism’s design is inspired by the human cognitive ability to focus selectively on key information while ignoring less relevant details during perception and reasoning. It achieves a similar selective focus via learned weights. The SDPA mechanism was proposed in [39], introducing a scaling factor to mitigate the impact of input vector dimensionality on attention weights. Multi-head SDPA maps the input sequence into multiple subspaces and computes attention weights within each subspace, thereby capturing dependencies among different time steps from diverse perspectives and enhancing feature representation capability. Its structure is shown in Figure 6, where h denotes the number of attention heads.
The core computation formula of SDPA is as follows:
Attention ( Q , K , V ) = softmax ( Q K T d k ) V
Here, Q denotes the query matrix, K denotes the key matrix, V denotes the value matrix, and d k is the dimensionality of the key vectors. In this mechanism, the dot product between the query matrix and the transpose of the key matrix is divided by the scaling factor d k . This reduces the magnitude fluctuations of the result and balances the dot-product output. Such scaling prevents the dot products of high-dimensional vectors from becoming excessively large, which would otherwise make the input to the softmax function too large, leading to an overly sharp output distribution or excessively small gradients, and thus negatively affect training stability.
In SDPA, multi-head parallelism can be employed. The multi-head mechanism enables simultaneous capture of dependencies among different time steps in the sequence. The outputs from all attention heads are concatenated and then passed through a linear projection to produce the final output, as formulated in Equation (11):
MultiHead ( Q , K , V ) = Concat ( h e a d 1 , h e a d 2 , , h e a d h ) W O
where each h e a d i for i = 1 , 2 , , h is computed by the attention function, and W o is the projection matrix for the concatenated multi-head output. Each attention head has its own learned projection matrices, given by Equation (12):
h e a d i = Attention ( Q W i Q , K W i K , V W i V )
where W Q , W K , and W V denote the query, key, and value projection matrices for the i -th attention head. These map the hidden states into the corresponding subspace. We randomly initialized a vector and optimized it during training to serve as part of the query matrix. A similar approach was adopted in prior work [40].
The multi-head scaled dot-product attention mechanism can capture multiple pattern types across different attention heads, which not only improves the model’s predictive accuracy and enhances its adaptability but, thanks to the scaling factor, also effectively avoids gradient saturation or vanishing issues. By feeding the full sequence of LSTM hidden states h 1 , h 2 , , h T into the multi-head self-attention mechanism, the model aggregates key information via attention weights. Finally, a fully connected layer produces the output, enabling more effective utilization of temporal information for precise prediction.

2.2.3. Long Short-Term Memory Network with Scaled Dot-Product Attention

In SOH prediction, LSTM networks can provide essential sequential information. However, conventional LSTM models typically use only the hidden state at the final time step for prediction, without fully leveraging intermediate hidden states, which may lead to the loss of critical information. Especially when available information is limited, it is necessary to exploit all feature information. SDPA can assign a score to each hidden state and employs a scaling factor to prevent excessively large dot-product values in high-dimensional spaces. To fully utilize all hidden states, this work integrates SDPA after the LSTM. A randomly initialized learnable query vector is used to generate the SDPA query matrix, while the LSTM’s encoded hidden states serve as the key and value matrices. The attention mechanism dynamically assigns weights to each hidden state, and the resulting weighted representation is passed through a fully connected predictor to produce the final output.

3. Results and Discussion

3.1. Evaluation Metrics

To comprehensively evaluate and validate the effectiveness of the proposed method, this study employs two common metrics: Mean Absolute Error (MAE) and Root Mean Squared Error (RMSE). Smaller MAE and RMSE values indicate that the model’s predictions are closer to the true values and thus represent better estimation performance. The formulas are as follows:
MAE = 1 n i = 1 n y i y ^ i
RMSE = 1 n i = 1 n ( y i y ^ i ) 2
where n denotes the number of samples, i is the true value for the i -th sample, and y ^ i is the corresponding model prediction.

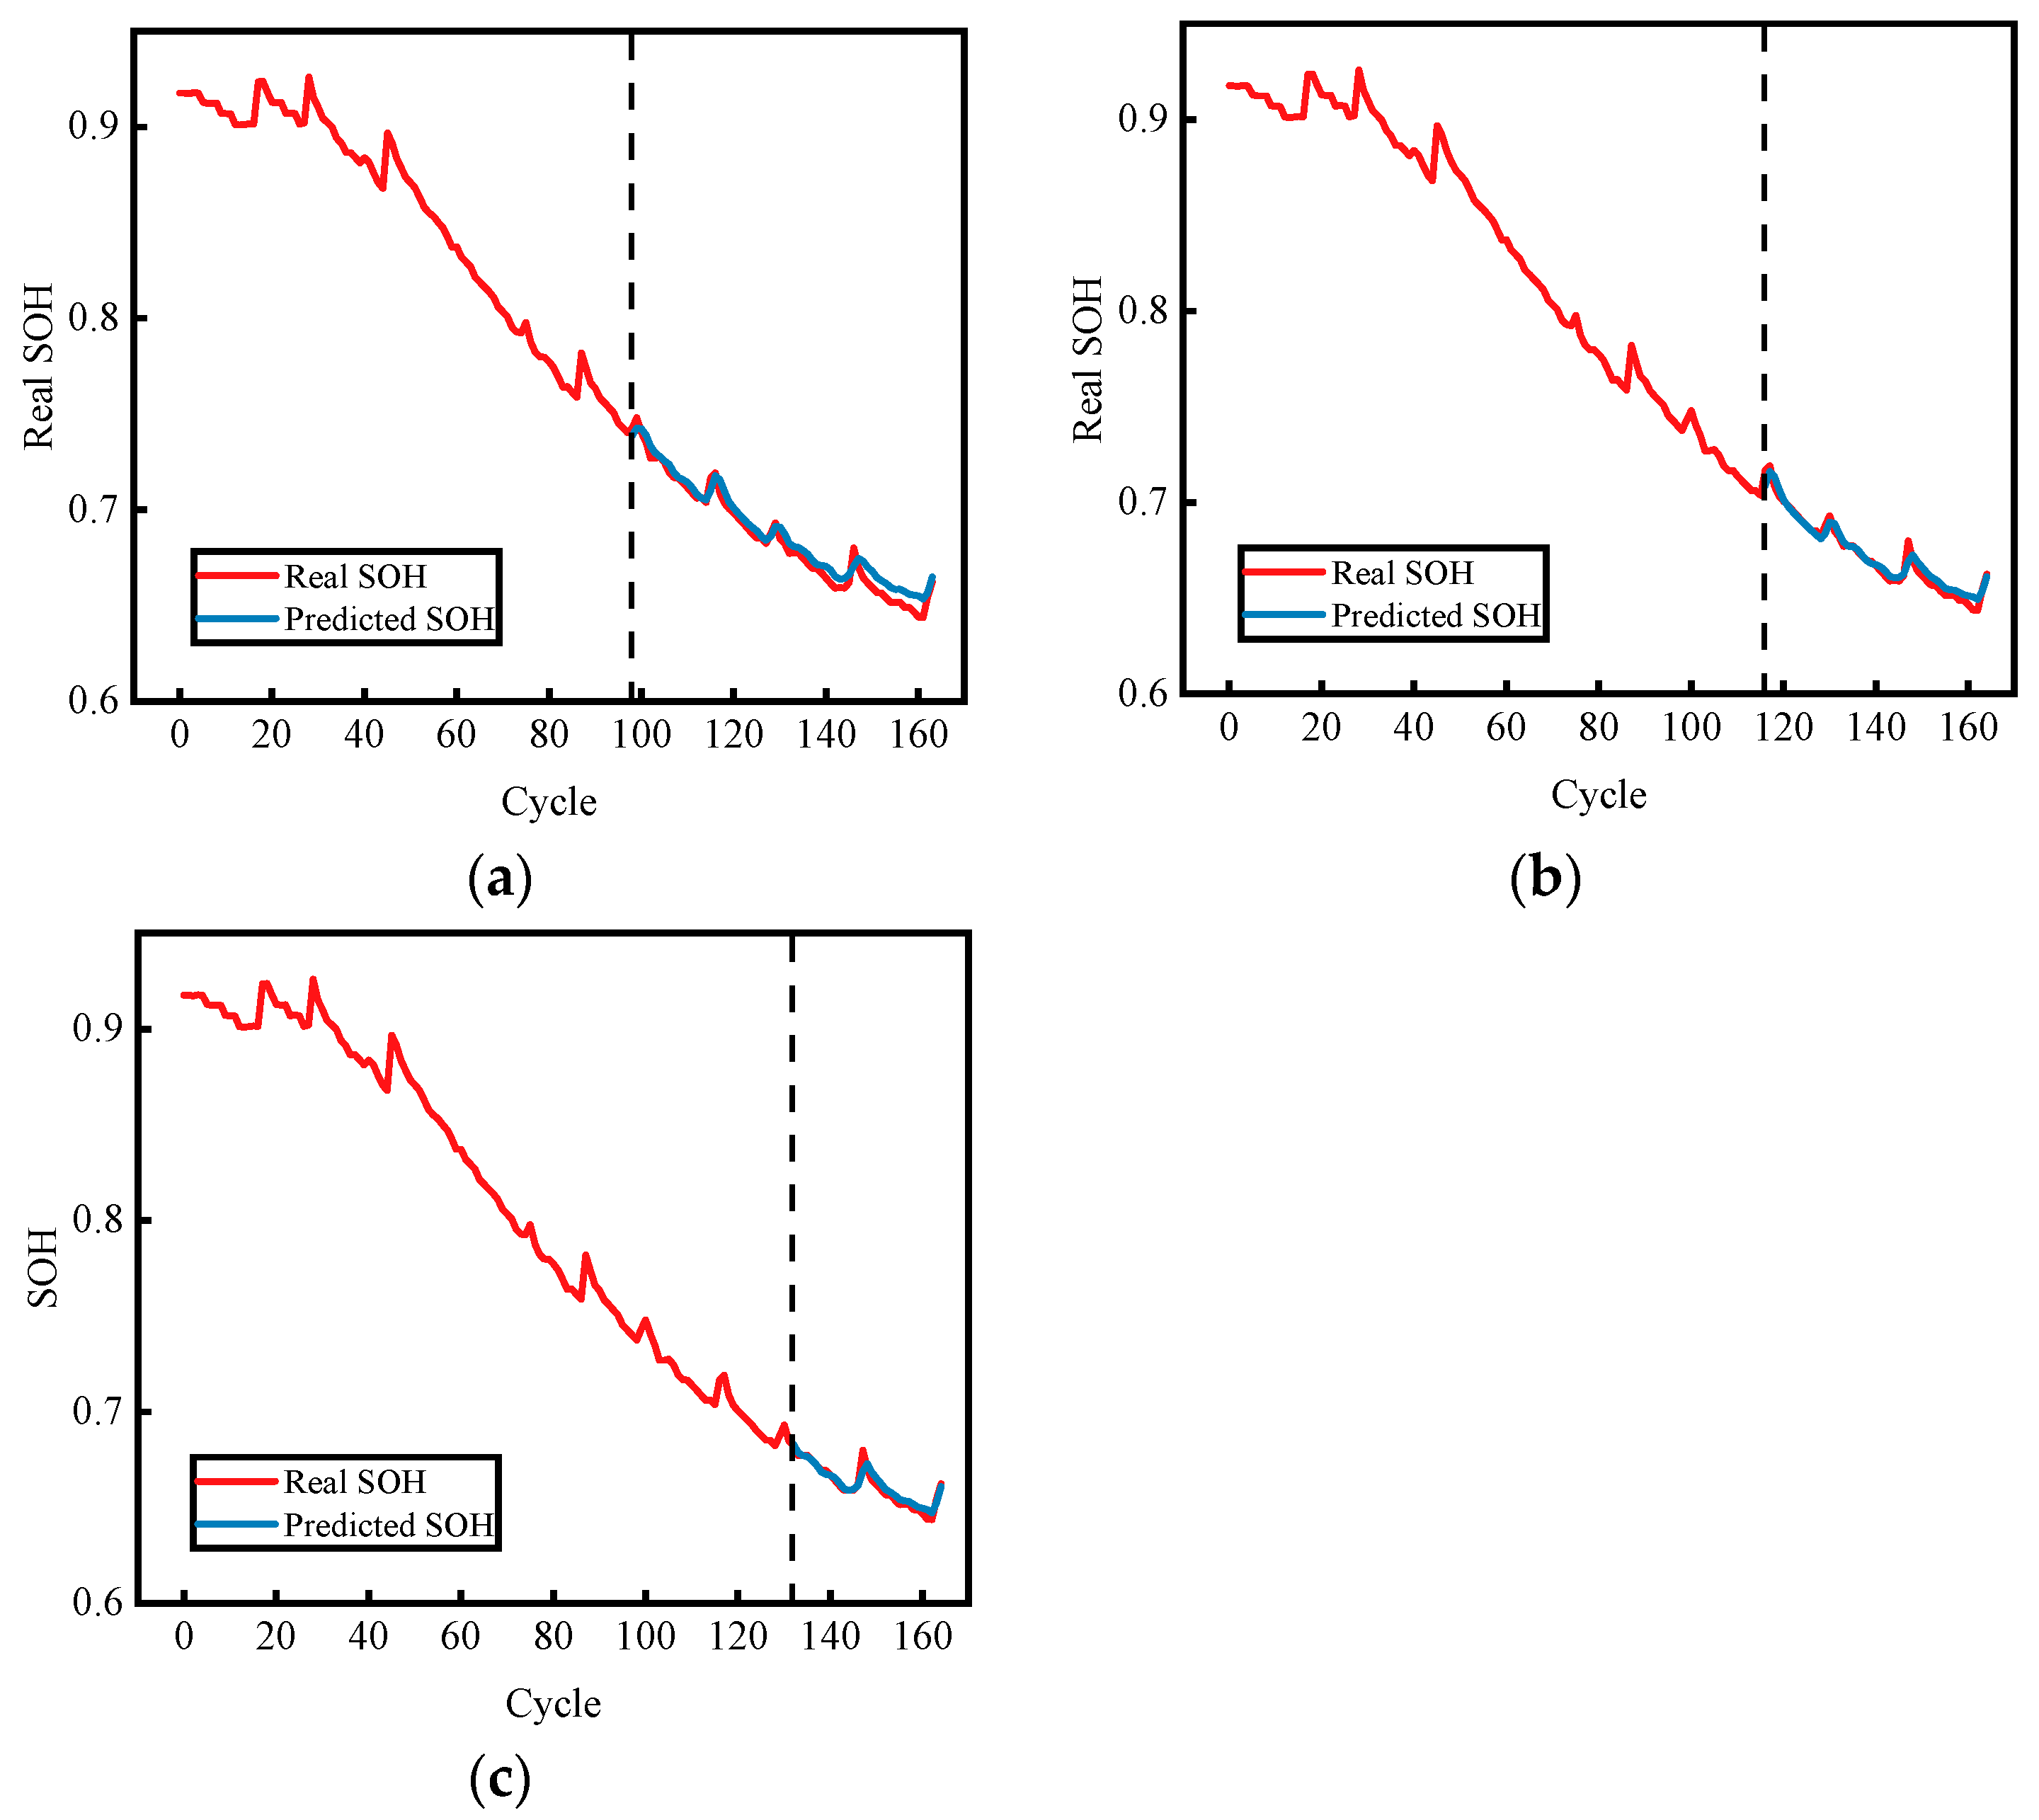
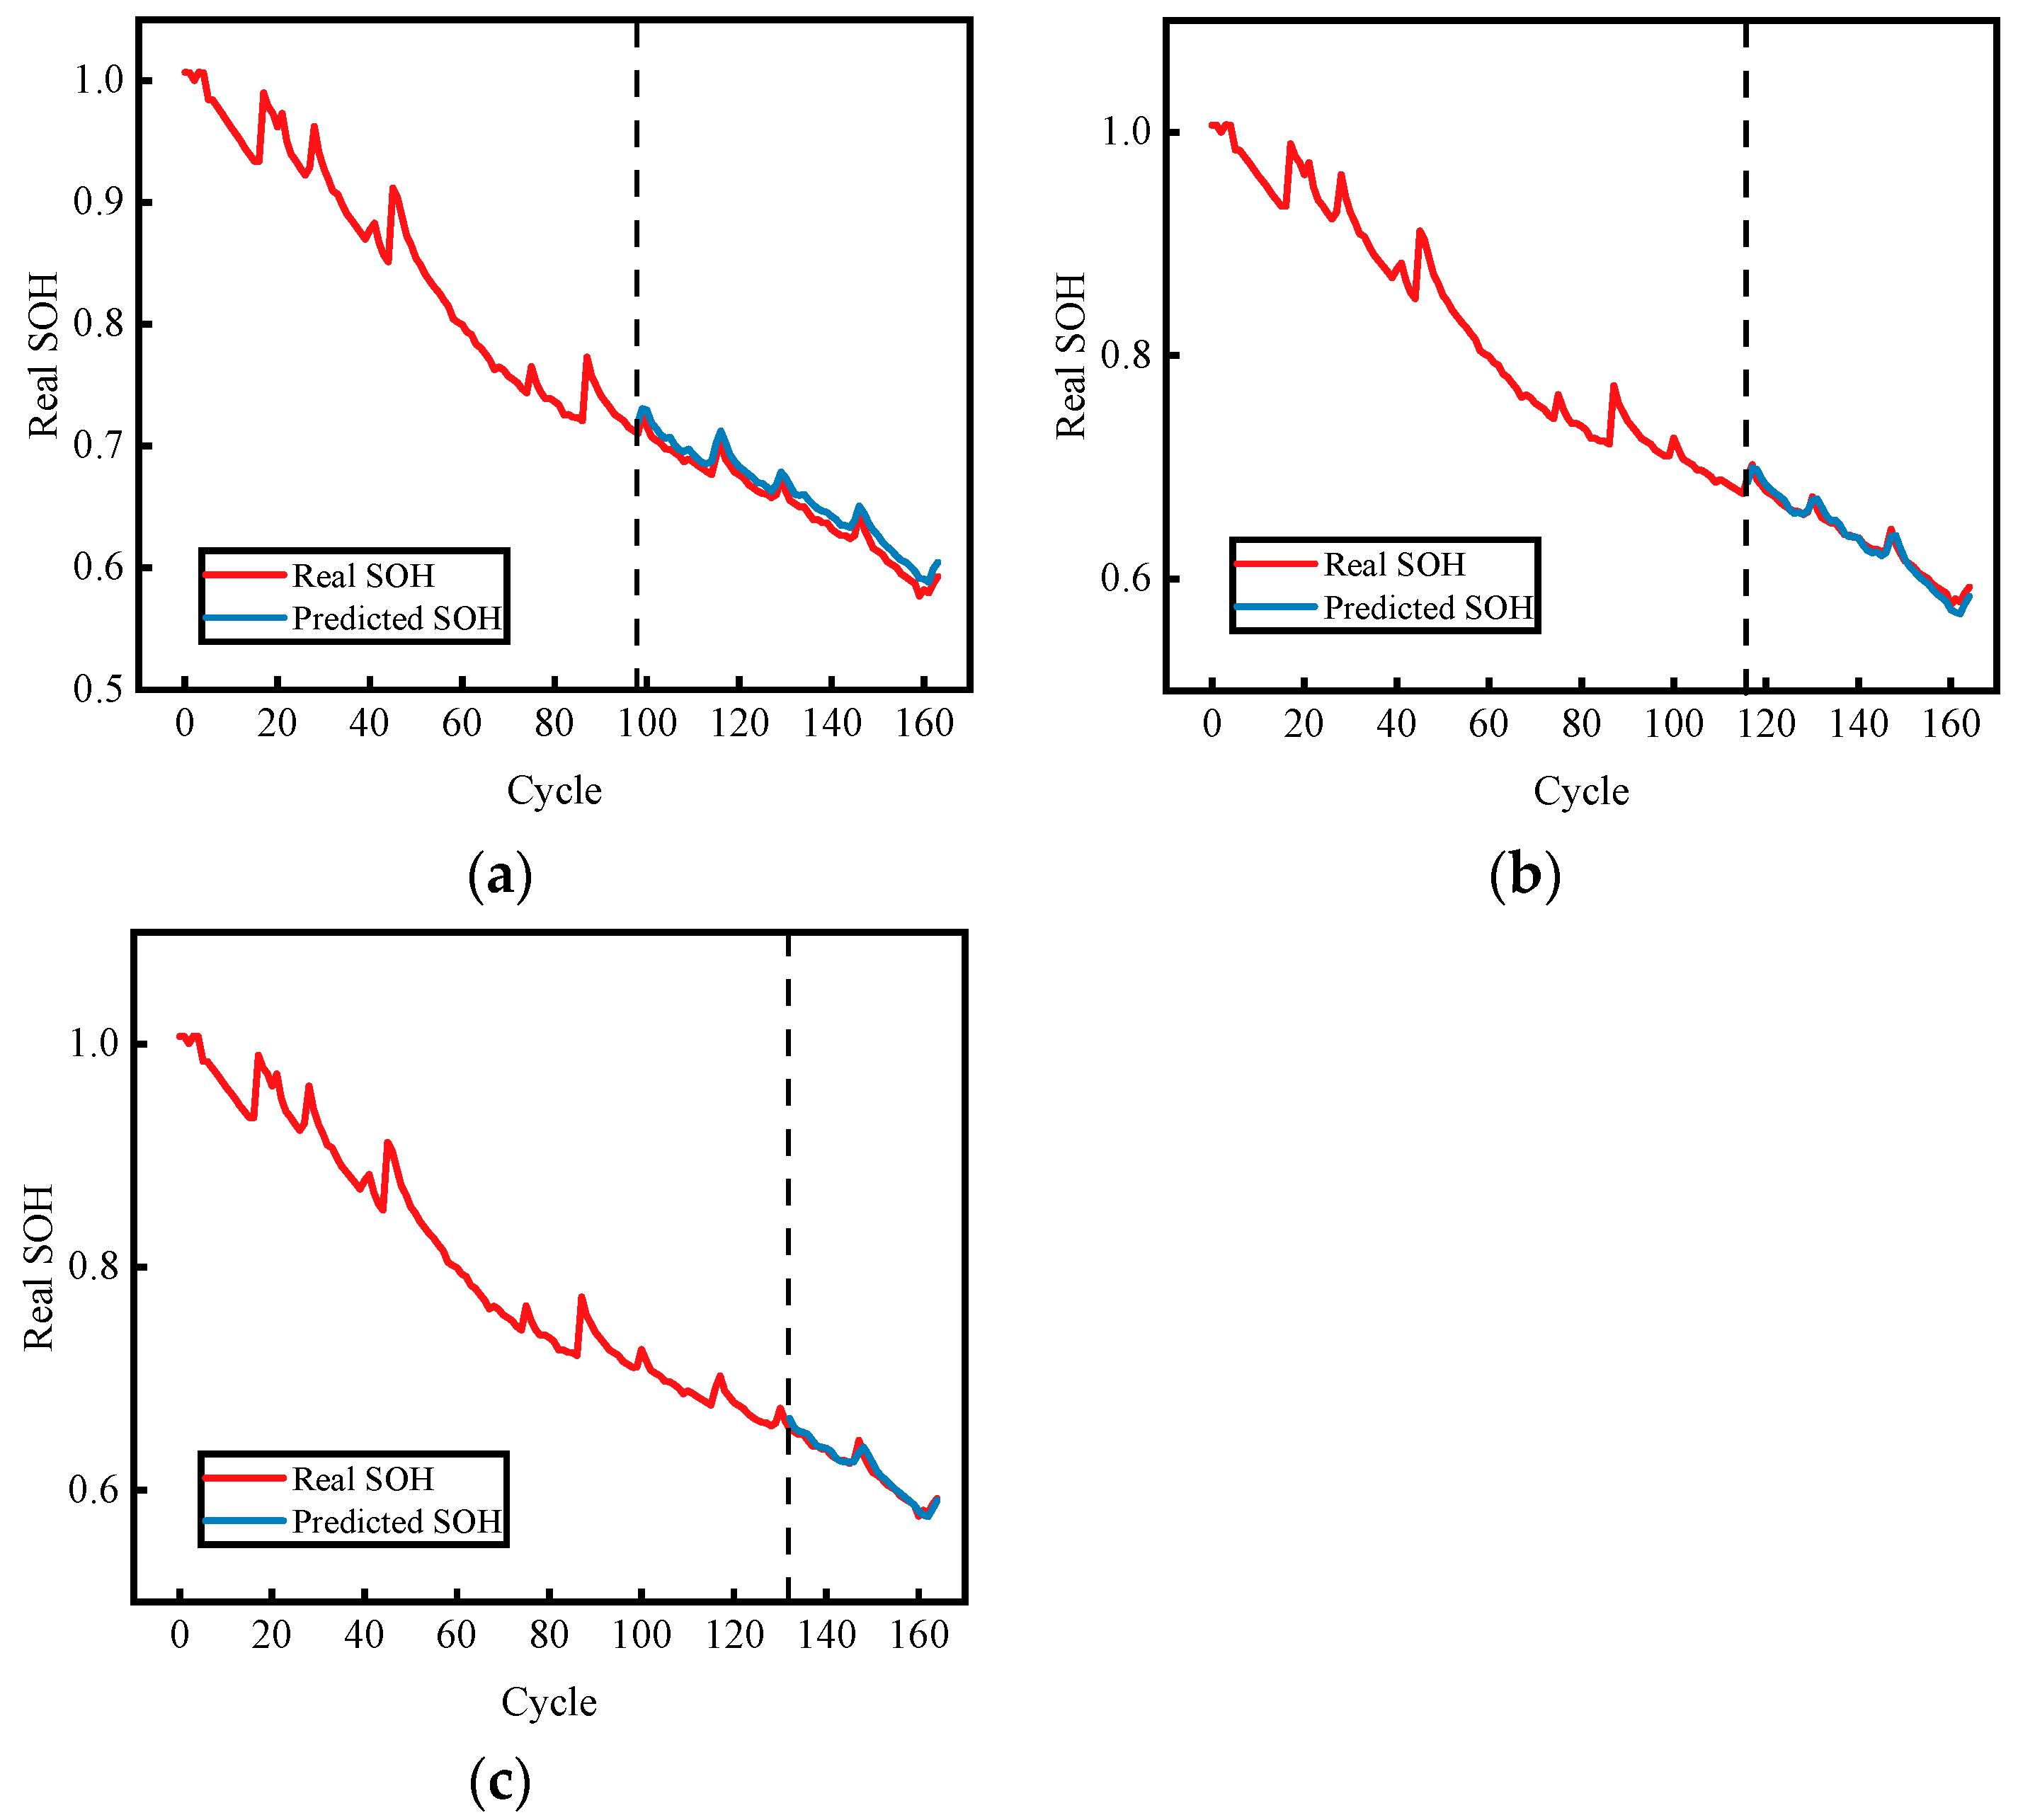
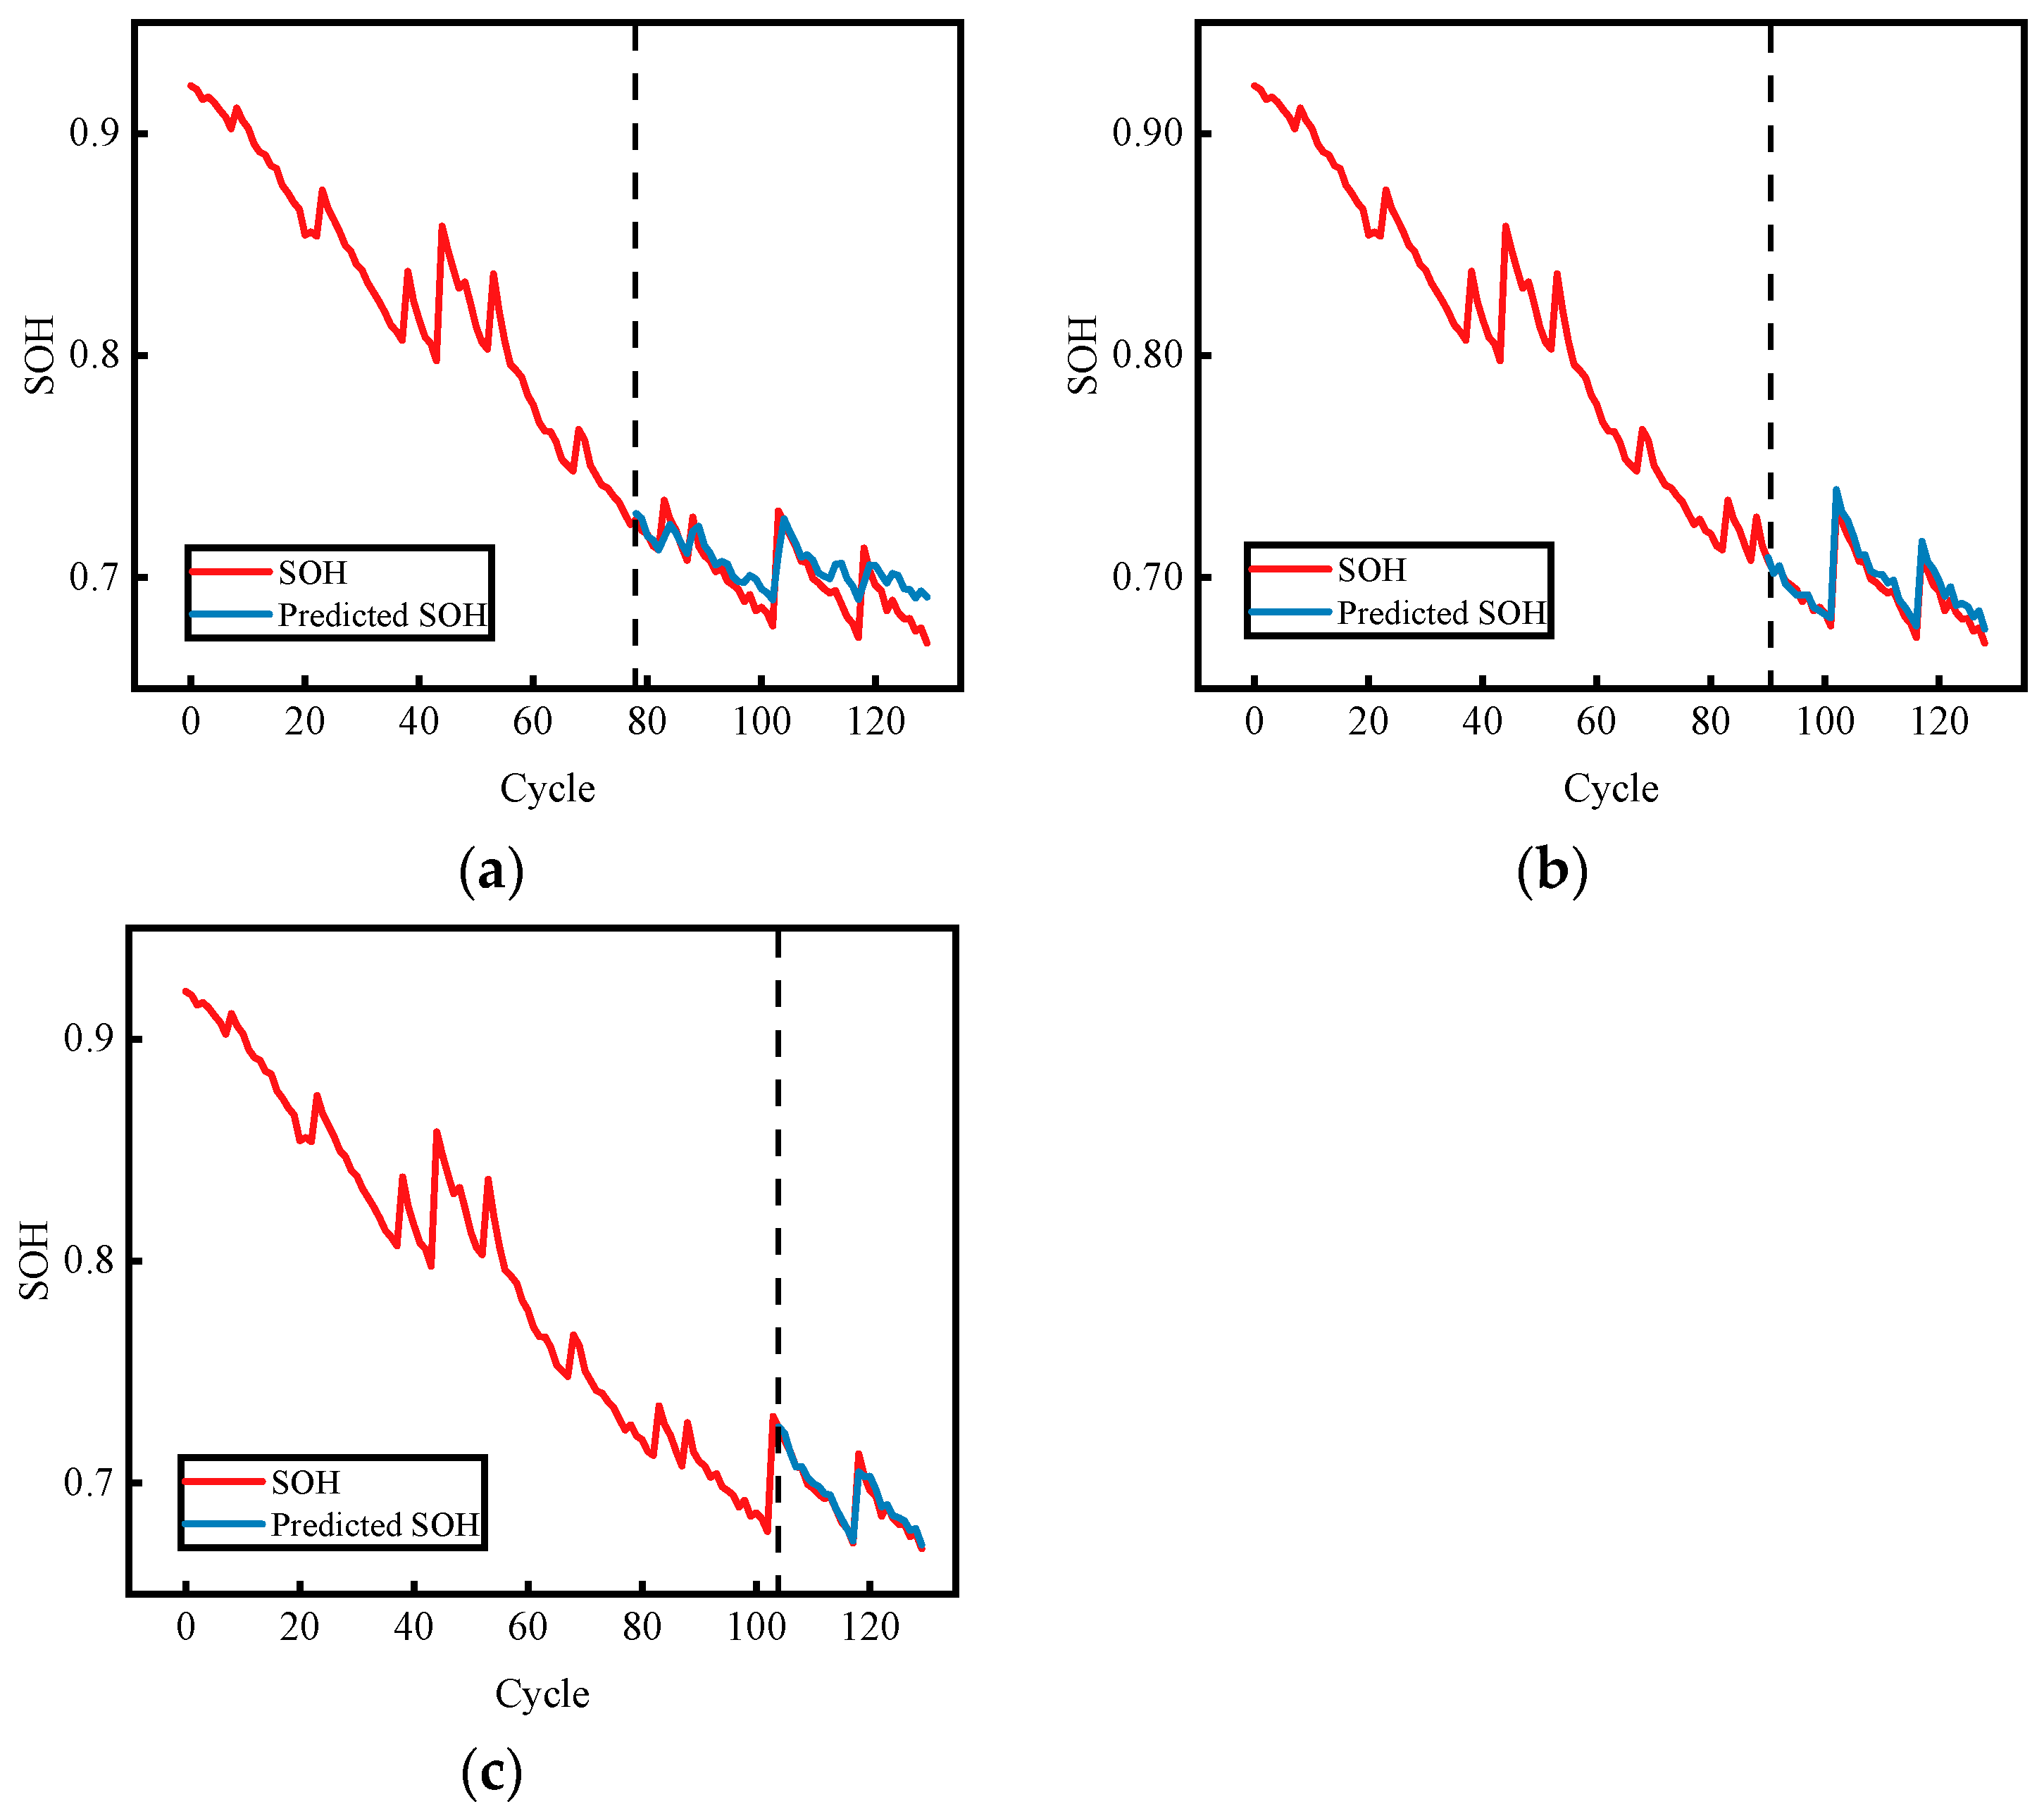
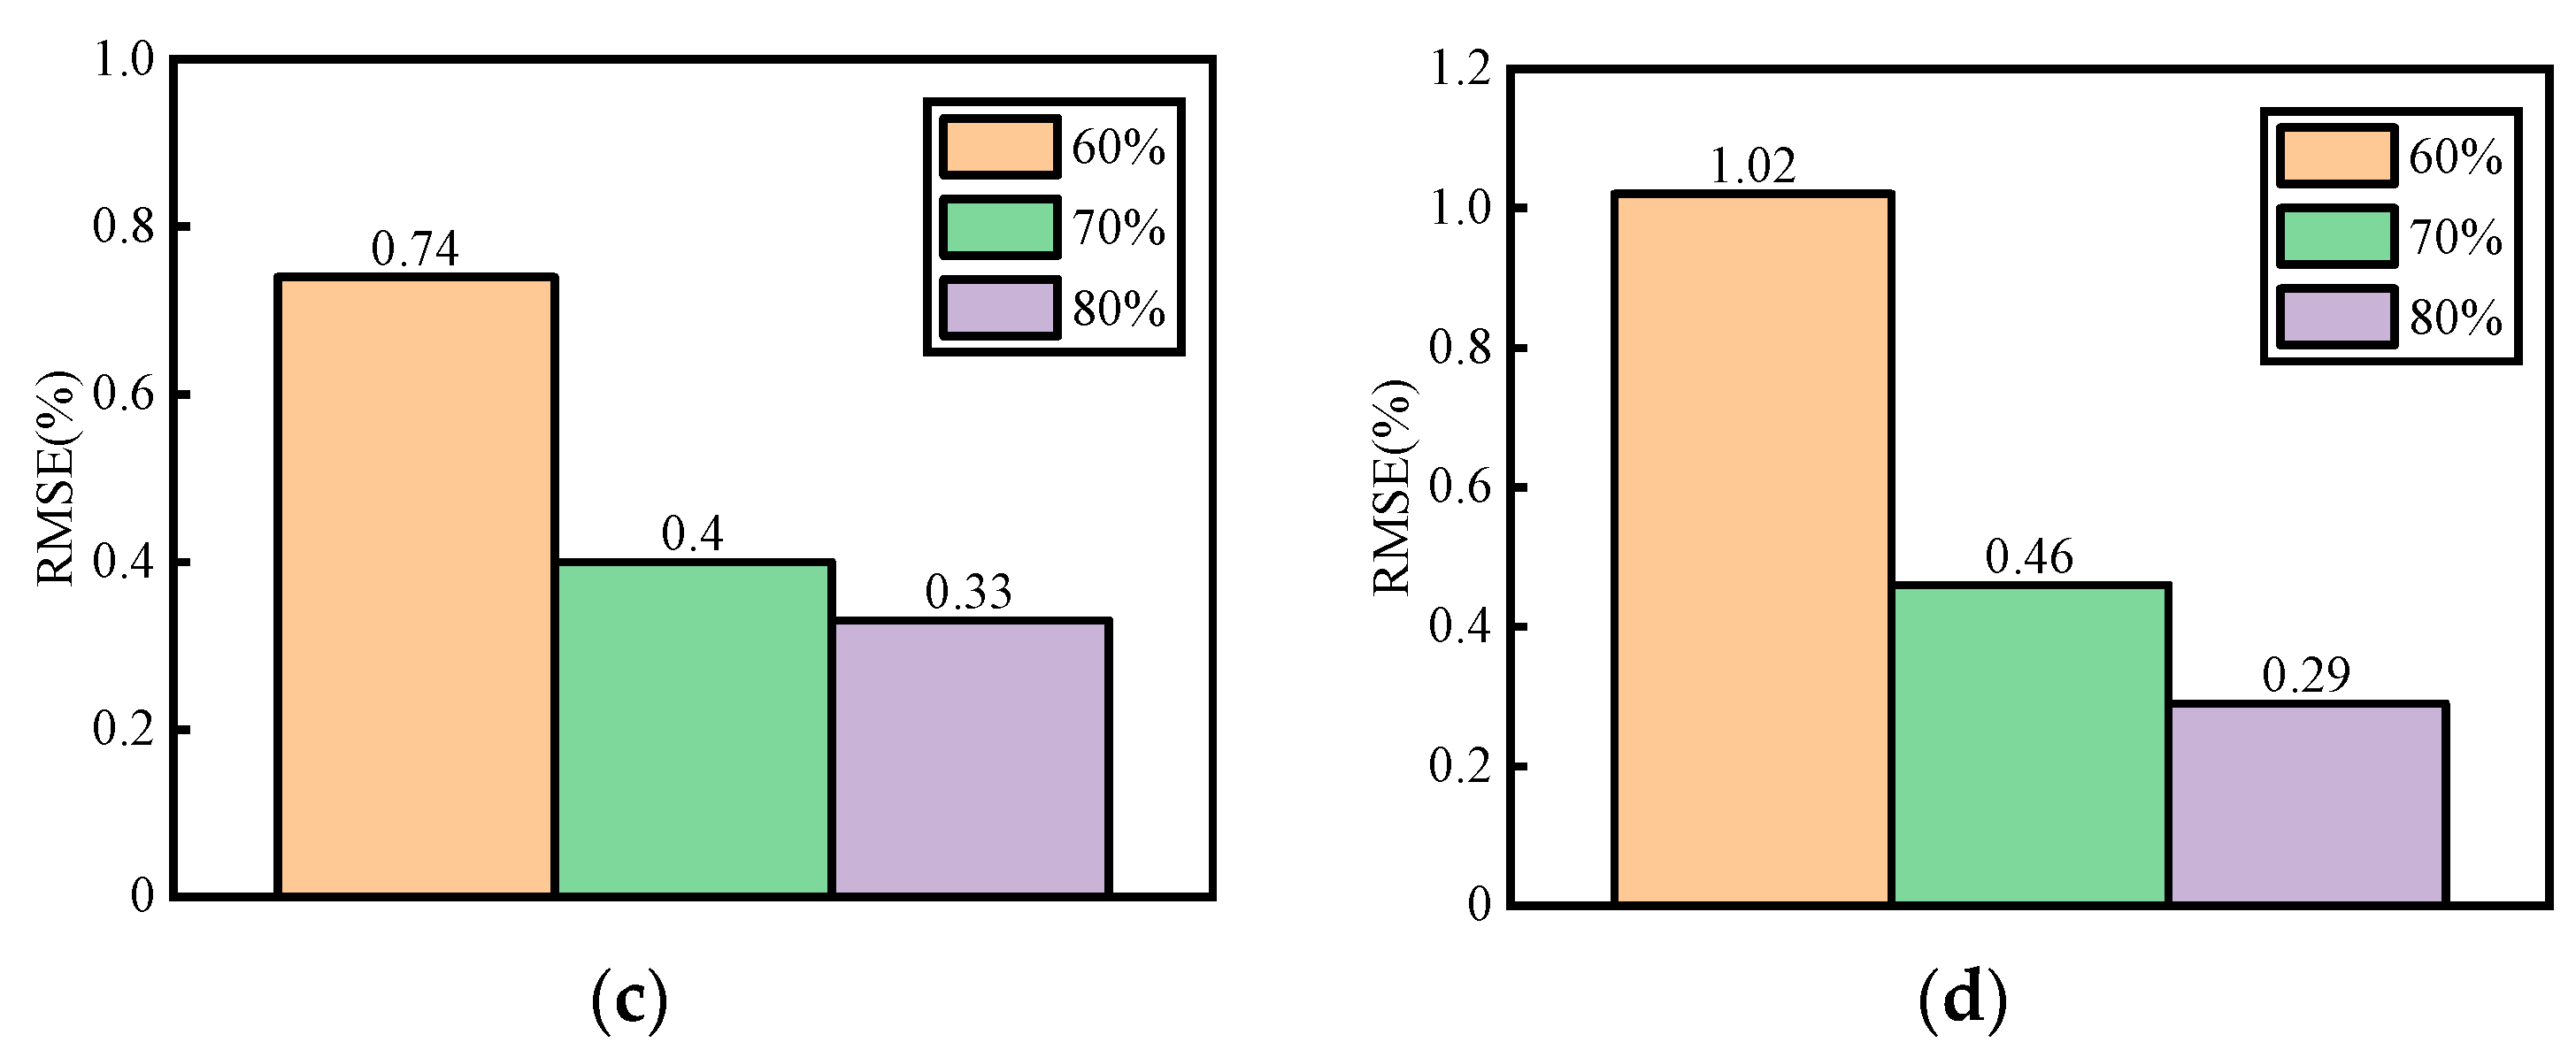
3.2. Study of Different Split Ratios

We conducted experiments on four distinct cells, B0005, B0006, B0007, and B0018, from the NASA battery aging dataset. Table 2 shows one representative set of parameters. All code was developed in Visual Studio Code 1.98.0.
Different dataset split ratios can yield varying training outcomes. In this section, following [41], three common split ratios are adopted, using 60%, 70%, and 80% of the historical degradation data to predict the remaining 40%, 30%, and 20% of SOH, respectively. Figure 7, Figure 8, Figure 9 and Figure 10 present the predictions under these different split ratios. Here, the dashed lines represent the split ratios.
The horizontal axis represents the number of charge-discharge cycles, and the vertical axis denotes the SOH. Taking B0018 as an example, as shown in Figure 10, increasing the size of the training set generally helps the model learn more critical feature information, thereby yielding higher prediction accuracy. When using a 60/40 split, the features learned are not sufficiently comprehensive; with a 70/30 split, the model training is relatively complete and demonstrates good predictive performance. Figure 11 presents the specific prediction accuracy under different split ratios. From Figure 11, it can be observed that as the data volume increases, SOH prediction accuracy improves. Using 60% of the degradation data to predict the remaining 40% yields the lowest accuracy, whereas using an 80/20 split does not result in a significant change in accuracy, a phenomenon similarly reported in [41]. Notably, for certain cells such as B0005 and B0007, increasing the split ratio to 80% provides only limited improvement in accuracy. Overall, using 70% of the data already meets high-accuracy requirements. Based on this analysis, this study adopts the common 70/30 dataset split.

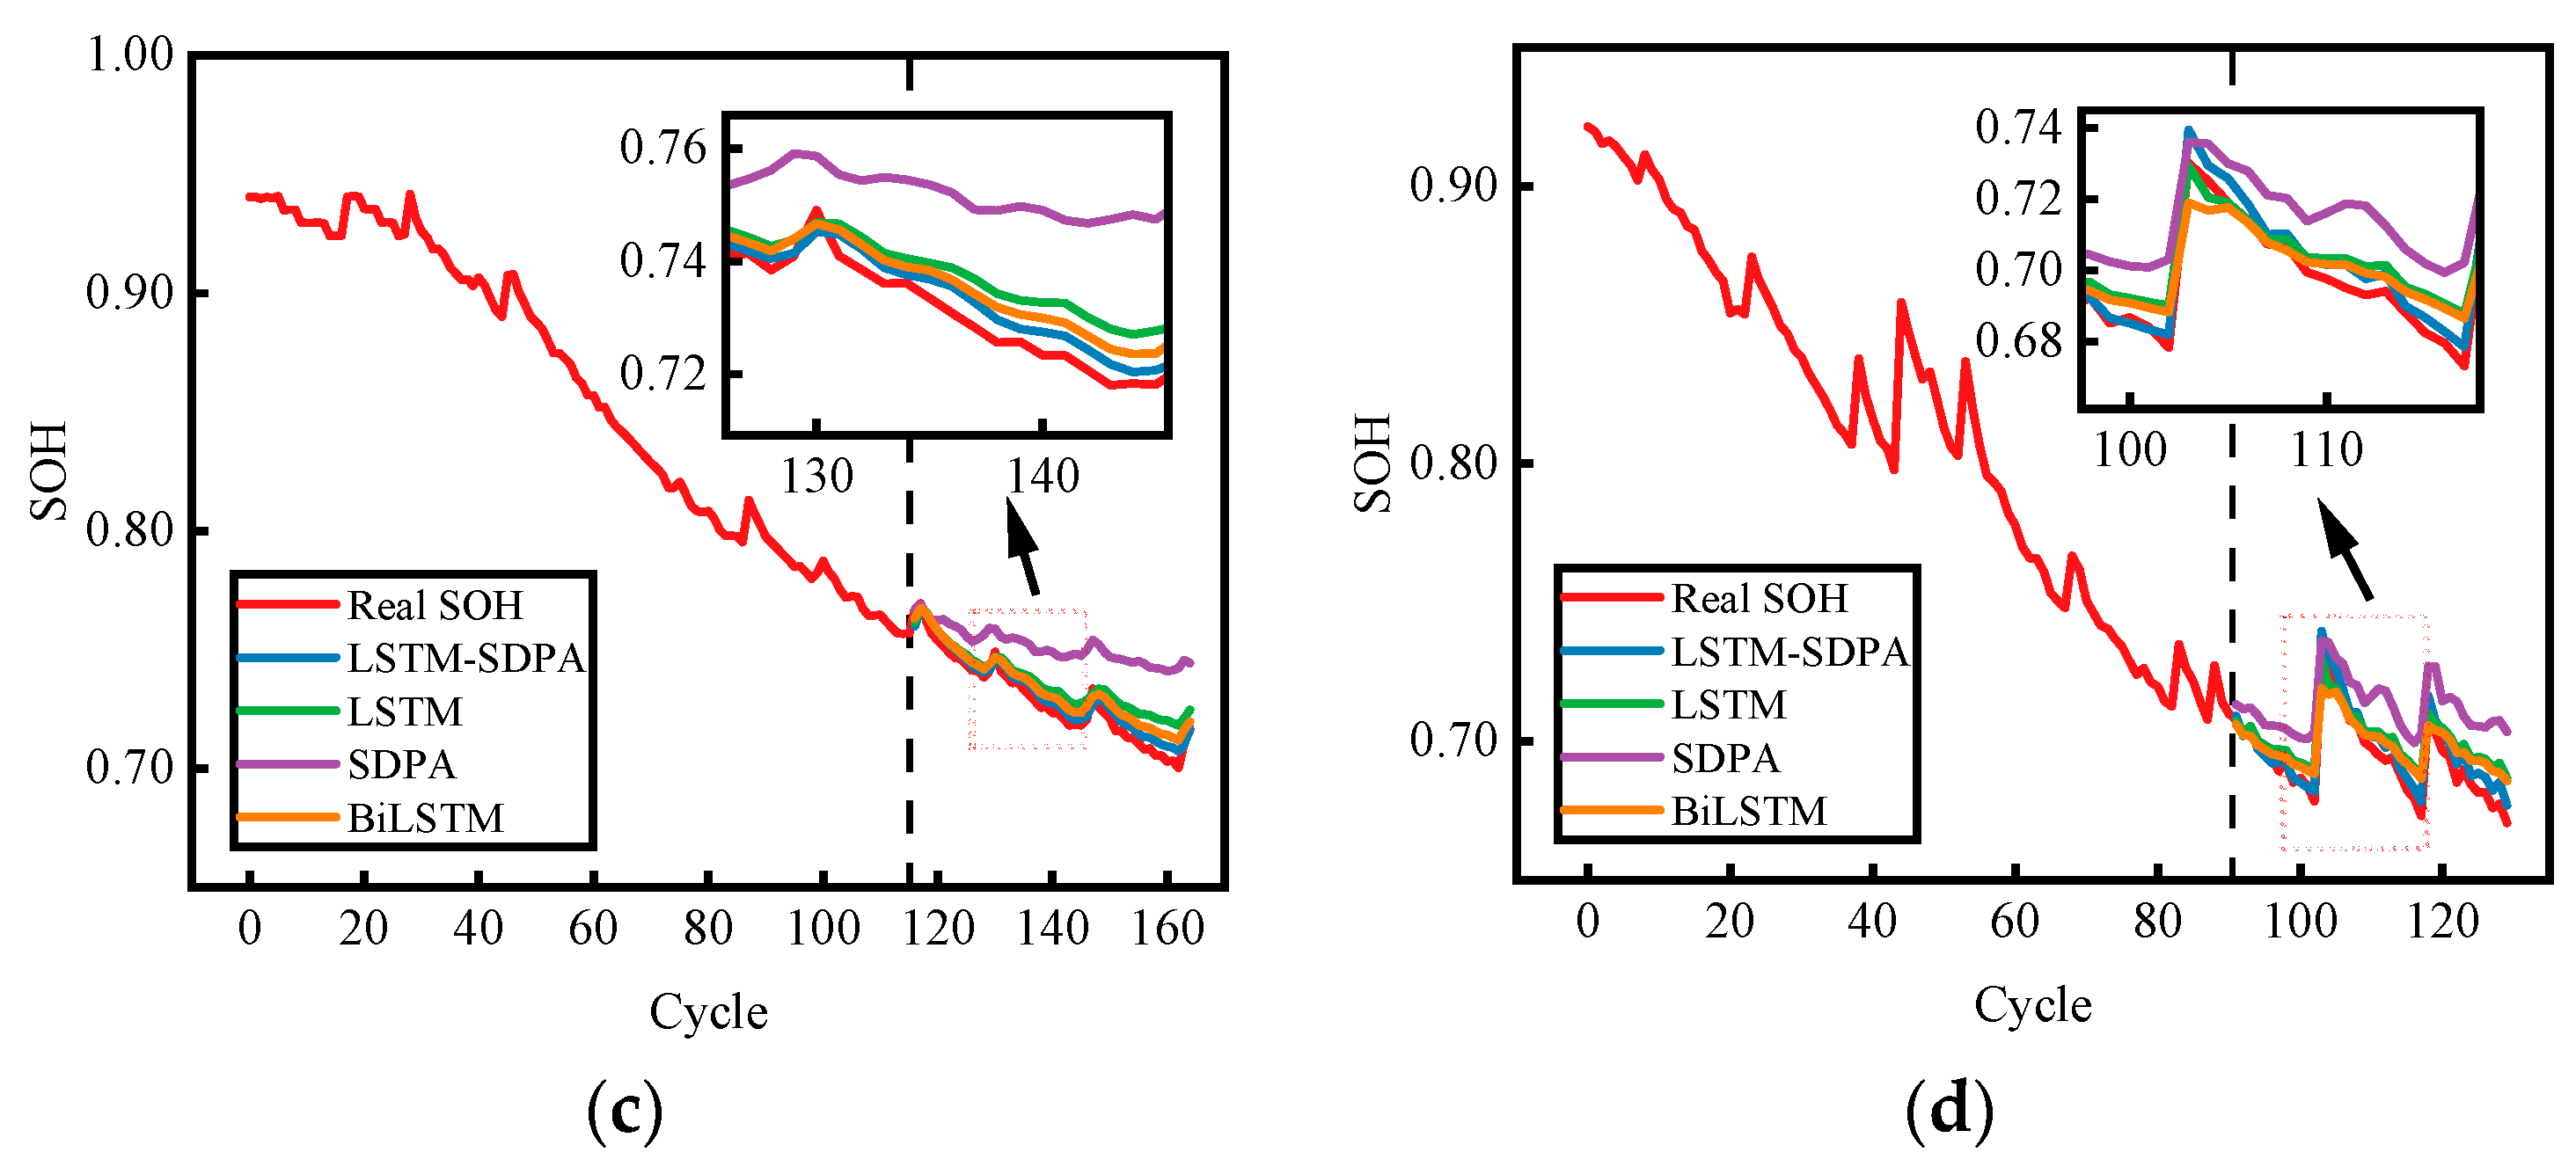
3.3. Structural Ablation Study

To demonstrate that the improved LSTM exhibits enhanced representational capacity compared to the conventional LSTM and to validate the effect of our modification, we performed ablation studies on several model variants. We examined the following models: First, we investigated the classic LSTM that uses only the hidden state at the final time step for prediction. Second, we examined the SDPA-only variant, obtained by removing the LSTM from the LSTM-SDPA model; in this configuration, the temporal sequence features are fed directly into the SDPA mechanism and then passed through a fully connected layer to produce the output, thereby evaluating the prediction performance of SDPA when processing unencoded sequential information. Third, we used a Bi-LSTM variant as a comparative baseline: Bi-LSTM extends the LSTM by incorporating a bidirectional mechanism, concatenating forward and backward hidden states for regression prediction. Finally, the LSTM-SDPA model, which builds upon the standard LSTM by applying scaled dot-product attention to dynamically weight all hidden states, was examined. In this model, the key and value matrices in SDPA are derived from hidden states at all time steps, while the query matrix is generated from a learnable query vector.
Experiments were conducted on B0005, B0006, B0007, and B0018 from the NASA battery aging dataset. The aging data were split in a 70/30 ratio, with the final 30% of cycles used for SOH prediction.
Figure 12a, b, c, and d, respectively, present the ablation results of the LSTM-SDPA model on batteries B0005, B0006, B0007, and B0018. Here, the dashed lines represent the split ratios. The corresponding error plots are shown in Figure 13. Table 3 presents the detailed comparison results.
As shown in Figure 12 and Figure 13, the proposed LSTM achieves superior prediction accuracy on all four batteries compared to the conventional LSTM and the Bi-LSTM that leverages bidirectional information, with its prediction curves more closely matching the ground truth. The error plots indicate that, relative to the conventional LSTM, the improved model exhibits significantly reduced error fluctuations and lower error levels during the later cycle stages, demonstrating that the dynamic scoring mechanism of scaled dot-product attention helps focus on salient temporal features and effectively enhances the model’s representational capacity. The LSTM-SDPA attains a minimum MAE of 0.26% and a minimum RMSE of 0.34%, with the maximum error among these metrics not exceeding 0.58%. Relying solely on voltage-domain signals, the model still achieves relatively precise predictions. Moreover, when the SDPA mechanism is applied without the LSTM encoder, there is no sequential information provided by the encoder, and the unencoded inputs are fed directly into the attention module. Since the scaled dot-product attention itself treats inputs as unordered, using SDPA without an encoder, such as LSTM, has a limited effect on SOH prediction. This indicates that, in the absence of effective temporal encoding, the model struggles to stably capture degradation patterns. By contrast, LSTM-SDPA weights the LSTM’s historical hidden states, reinforcing prediction accuracy and thus yielding better performance. The ablation results show that introducing the SDPA mechanism leads to improved performance of the enhanced LSTM in the prediction task, validating the effectiveness of this modification. Using only the SDPA mechanism or employing a bidirectionally encoded LSTM alone cannot achieve the same effect, which demonstrates the significance of combining temporal encoding with weighted full hidden-state representation.
Moreover, comparisons against different models intuitively illustrate performance. We chose the Temporal Convolutional Network (TCN) and the Echo State Network (ESN). The TCN is a sequence-modeling network based on one-dimensional causal and dilated convolutions. By employing dilated convolutions across multiple layers, it progressively expands its receptive field to capture long-range temporal dependencies. The ESN is a reservoir-computing model whose core component is a high-dimensional recurrent neural network known as the reservoir, which is randomly initialized with fixed weights. The reservoir projects the input signal into a high-dimensional space, and a trainable linear output layer called the readout then generates the predictions. Table 4 summarizes the performance of these models in comparison with our proposed method.
As shown in Table 4, LSTM-SDPA achieves superior predictive accuracy. This improvement arises because all historical hidden states of the LSTM are fed into the SDPA mechanism, which dynamically weights these states and thereby enhances the model’s expressive capacity. In addition, to demonstrate the model’s generalizability, we present its performance on the CALCE dataset in the Supplementary File (see Supplementary Figure S1 and Table S1 for details).

3.4. Comparison with Previous Studies

To demonstrate the performance of the proposed prediction framework, this study compares its results with those reported by other researchers. Reference [42] proposed a GRU-CNN network capable of learning temporal dependencies within sequences. In recent studies over the past three years, Reference [43] presented an improved radial basis function neural network (RBFNN) for SOH prediction, effectively mitigating poor predictive performance in late aging stages; Reference [44] employed a Vision Transformer (ViT)-based approach for SOH prediction, achieving favorable accuracy; and Reference [45] proposed an SOH prediction algorithm based on an Online Sequential Extreme Learning Machine (OS-ELM) optimized by the standard Hunter-Prey Optimization (HPO) algorithm, validating its effectiveness. Owing to the comprehensive feature information extracted from voltage signals and the use of an improved LSTM, our framework performs well in prediction tasks, achieving high accuracy across four batteries. The detailed prediction results are shown in Table 5.

3.5. Practical Deployment Considerations

In practical deployment, a multitude of factors must be taken into account. Regarding the influence of current and temperature, the voltage-time curve inherently embeds information about both parameters. For example, the IR drop is directly proportional to I*R_int, causing an instantaneous voltage sag at the start of discharge; the open-circuit voltage (OCV) shifts with temperature; and time compression or expansion occurs, since high C-rates shorten the charging and discharging durations. In practical EV and BESS applications, where current and temperature fluctuate significantly, the voltage curve responds sensitively, and these effects are reflected in our manually extracted features.
Furthermore, Lu et al. [46] employed the FALNet framework, which applies STL + FFT decomposition at the input to separate trend, seasonal, and residual components, feeding only the denoised residual into an LSTM network. On a public PM2.5 dataset, this approach reduced the MAE by 15–20%. Such a strategy suggests that, in the battery domain, appropriate feature engineering, such as isolating residual voltage fluctuation, can similarly attenuate the influence of current and temperature noise.
Finally, from a modeling perspective, our LSTM-SDPA assigns dynamic weights to each hidden state. When an input segment is corrupted by noise or baseline drift, its attention weight is automatically reduced, achieving a form of soft masking. In other fields, attention-augmented LSTMs have been shown to significantly reduce positioning errors in UWB/INS systems under NLOS conditions [47]. Therefore, the LSTM-SDPA architecture we adopt inherently confers noise robustness. Under 2% Gaussian white noise, the noise-resistance levels of the four cells are shown in Table 6.
As the noise comparison shows, the LSTM-SDPA model indeed exhibits strong noise robustness.
The four cells in the NASA dataset (B0005, B0006, B0007, and B0018) were characterized at 24 °C using a constant-current–constant-voltage charging protocol and constant-current discharging. By contrast, electric vehicles and battery energy storage system battery packs experience dynamic C-rates of the order of −5C to +5C and temperature swings from −20 °C to 55 °C. Moreover, electric vehicles and grid-scale storage systems typically operate within a shallow-cycle window of 20% to 80% state of charge (SOC), whereas the NASA data are collected over full 0–100% charge-discharge cycles. Although the NASA dataset is more idealized, its voltage-time curves comprehensively record IR-drop, open-circuit voltage variations, and capacity-fade mechanisms, processes that likewise dominate aging in battery packs. Therefore, the proposed prognostic framework retains strong practical relevance. Within a battery pack, operating conditions are both intricate and variable. To address the heterogeneity among individual cells during the practical deployment of our method, the following supplementary strategies can be adopted. First, a hierarchical transfer learning scheme can be applied, whereby a small set of in situ measurements from the pack is used to fine-tune only the final layer of the pre-trained network. Second, a multi-task learning architecture may be constructed in which all cells share a dual-view feature encoder, while each cell retains its own attention weights. This design enables accurate discrimination of cell-to-cell variations without increasing the number of sensors. We believe that these strategies constitute a highly valuable direction for future exploration.
Additionally, in practical applications, to enhance the robustness of the method, we propose the following two strategies: Firstly, at the hardware level, install two analog-to-digital converters (ADCs) on the same sampling board if budget allows, and trigger an alarm when their differential exceeds 2 mV. Secondly, embed a sliding Hampel filter and a Z-score anomaly detector within the battery management system (BMS) microcontroller unit (MCU). If N consecutive samples deviate from the window median by more than 5 σ , flag a fault, and initiate downgrade control. We have added this discussion to demonstrate how these measures can mitigate the vulnerability of the proposed prediction scheme in real-world applications.

4. Conclusions

Considering the cost of acquiring additional signals and enhancing practical applicability, we selected only the most readily obtainable voltage signal and proposed a voltage-signal-based SOH prediction method. An improved LSTM network processed the input features, and we examined the influence of different train-test split ratios on prediction performance, validated the effectiveness of our modifications via ablation studies, and demonstrated the model’s performance through comparisons with other researchers’ work. Specifically, this study has the following characteristics:
(1)
To address SOH prediction under constrained information, such as limited access to temperature or current data, this work leverages easily accessible voltage measurements, significantly lowering hardware requirements. Voltage data do not require additional sampling channels, making the method cost-effective and providing a high-accuracy SOH prediction solution even when current or temperature sensors fail or drift.
(2)
To fully exploit only the voltage signal, four kinetic features and two aggregated features were extracted based on electrochemical principles, comprehensively constructing a feature information network from dual perspectives. Correlation analysis verifies the importance of these features: each extracted feature shows high correlation with SOH, with the aggregated features exhibiting correlation exceeding 94%, thereby laying a solid foundation for subsequent prediction.
(3)
Relying solely on voltage information demands a stronger capability to learn aging-related patterns. To prevent conventional LSTM from overlooking intermediate key information when using only the final hidden state, all hidden states generated during the LSTM’s operation are preserved. A scaled dot-product attention mechanism scores these hidden states and dynamically assigns weights, with the query vector defined by a learnable parameter α so the model can adaptively focus on critical time steps.
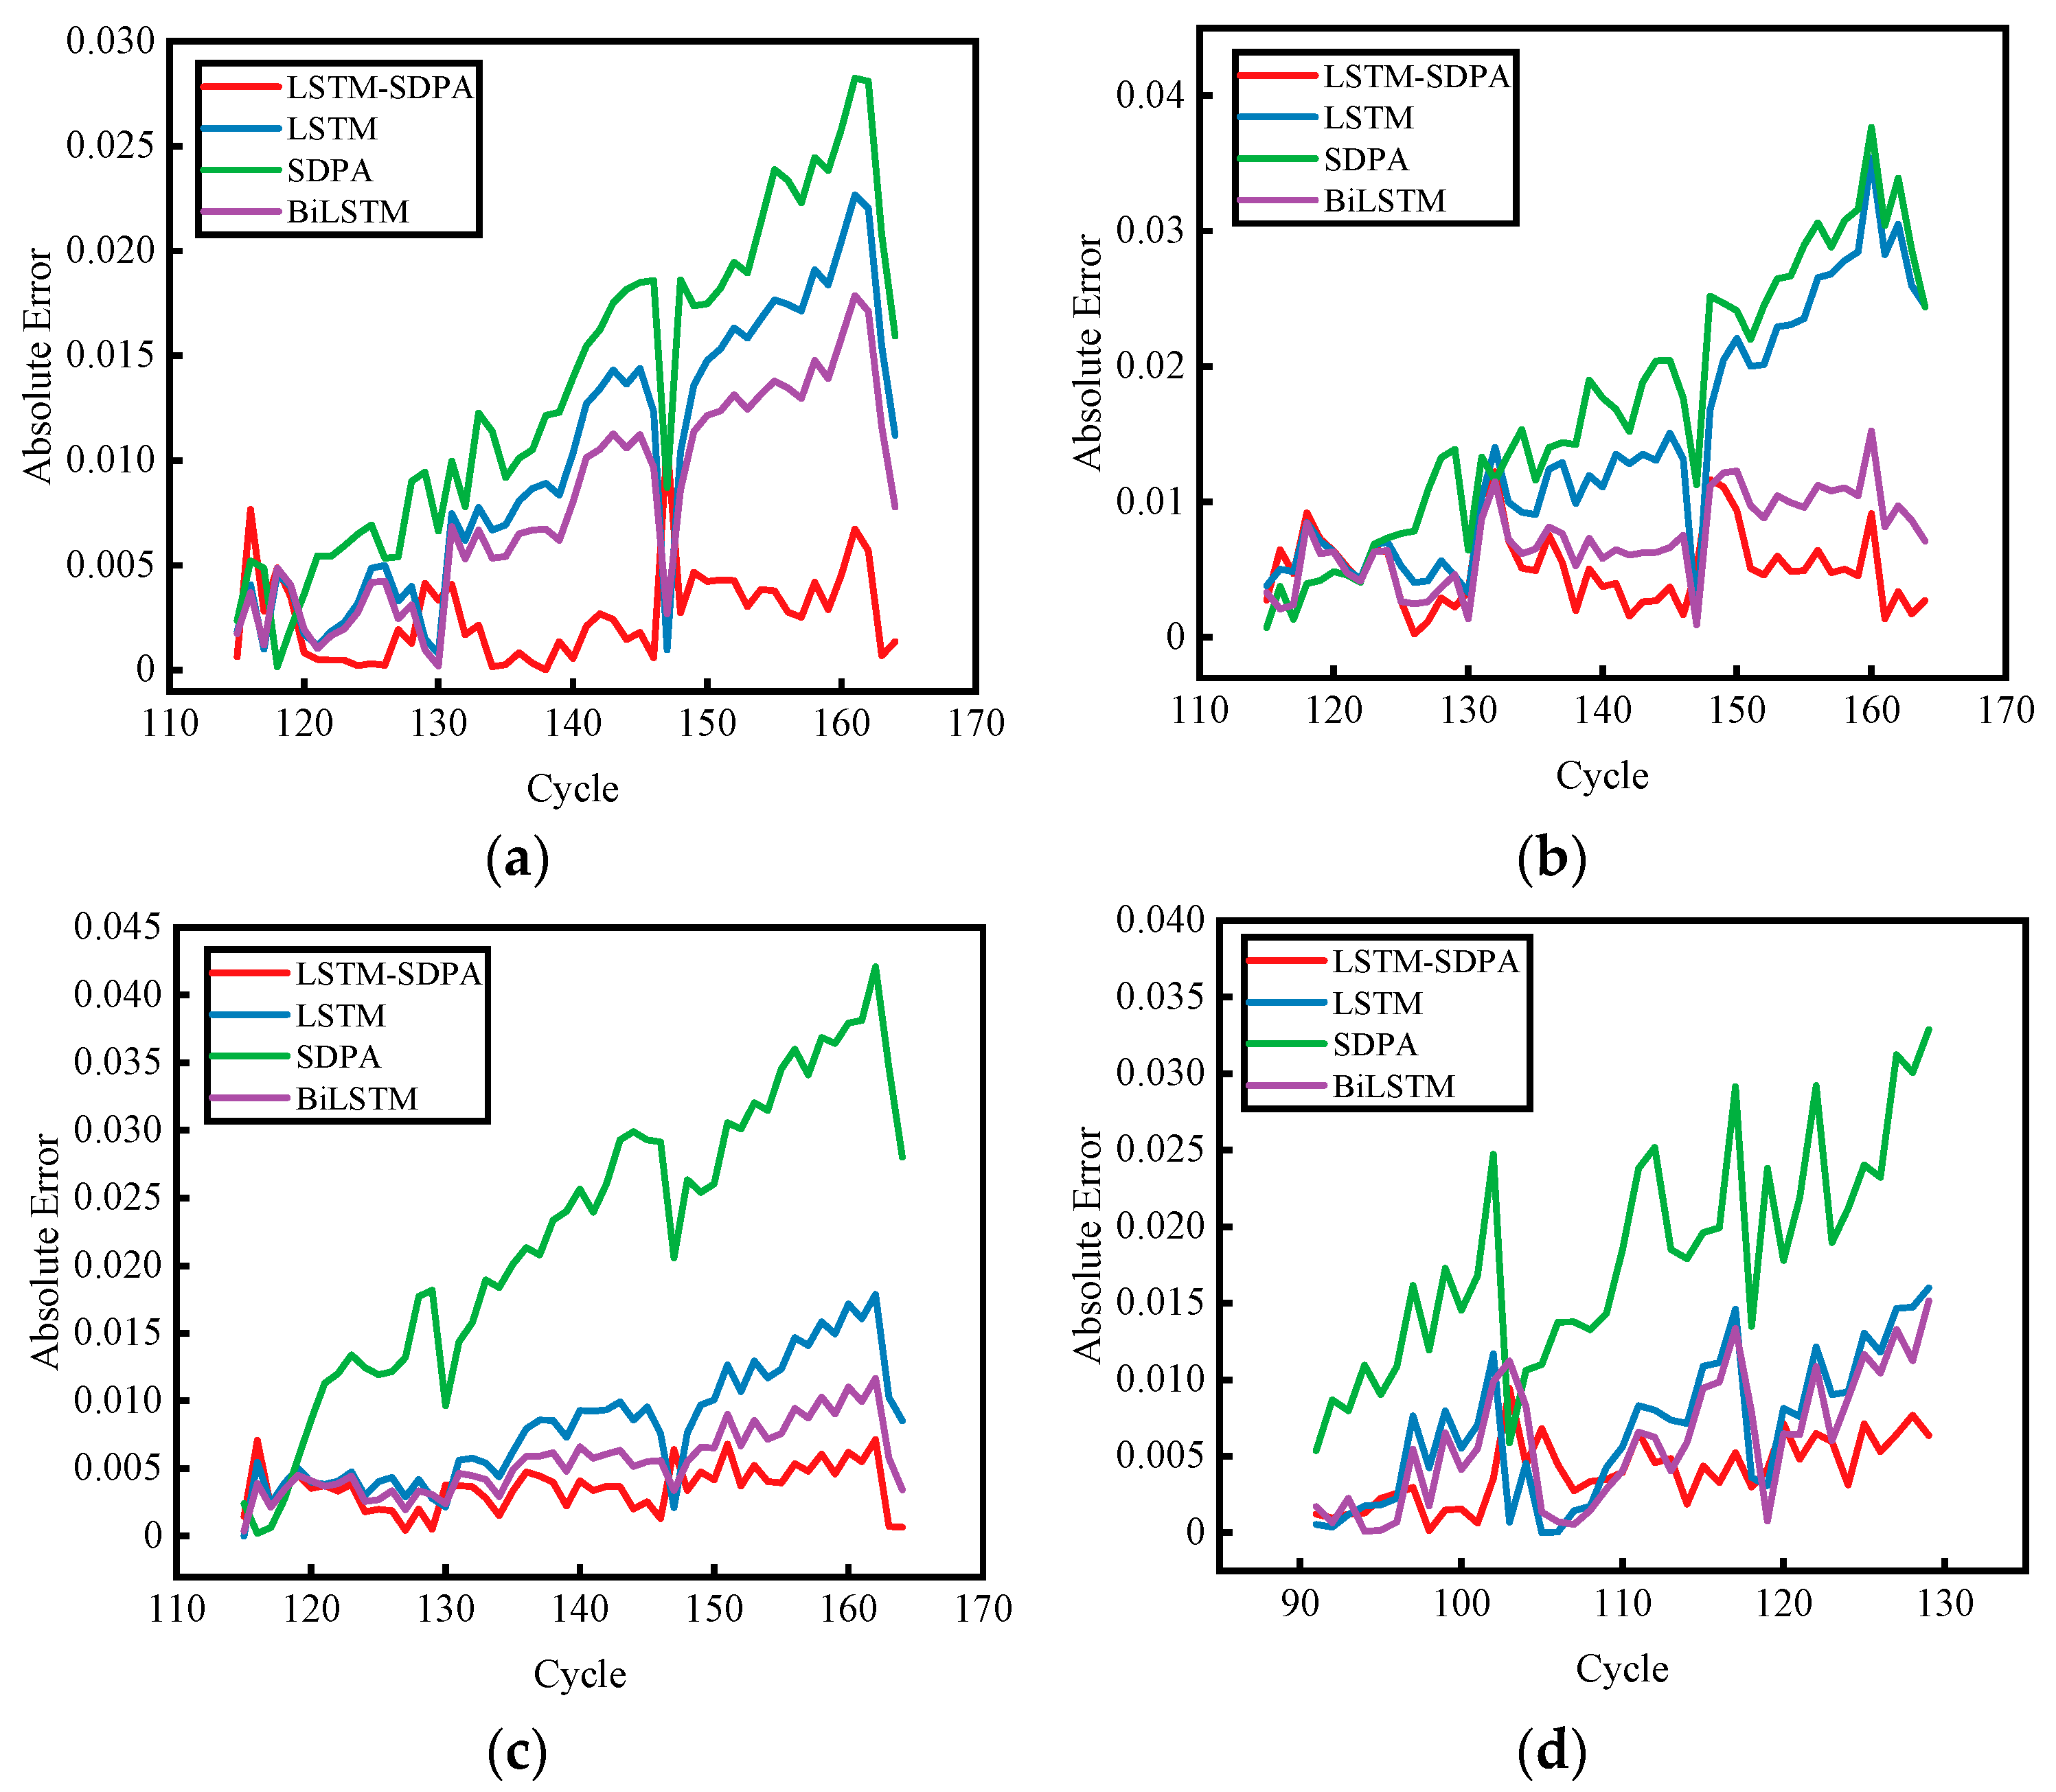
(4)
Comparisons among LSTM, SDPA, Bi-LSTM, and the combined LSTM-SDPA model show that the proposed modification enhances performance. The ablation results demonstrate this improvement. The LSTM-SDPA model achieves an RMSE below 0.58%, and error-distribution plots indicate a narrower error range. Comparisons with other models confirm that this approach attains high prediction accuracy.
Overall, this prediction framework relies solely on voltage signals and fully exploits dual-view features, comprising dynamic features and aggregated features that are highly correlated with SOH, and employs an SDPA-enhanced LSTM to achieve superior prediction accuracy.
It is noteworthy that, in general, under non-resting or non-ultra-low-rate conditions, elevated temperatures induce only a slight drift in the OCV curve, while the concomitant reduction in internal resistance predominantly drives an overall upward shift of the voltage profile; conversely, low temperatures amplify the IR drop. Although this study relies solely on voltage measurements, these thermal effects are inherently encoded in the voltage-time waveform, and the LSTM-SDPA model can automatically focus on aging-related salient features. Therefore, the approach retains its utility under both high- and low-temperature environments.
Specifically, our evaluation shows that the current model comprises fewer than 20,000 parameters and requires less than 100 kB of FP32 storage, making it fully deployable on typical automotive-grade microcontrollers. For example, on a 1 GOPS MCU, performing inference over a 100-step sequence conservatively incurs a latency of less than 20 ms, which is substantially below the typical 100 ms sampling interval real-time requirement of a BMS. Furthermore, the inference pipeline primarily consists of matrix multiply-accumulate operations and a limited number of activation function evaluations, enabling full utilization of the MCU’s on-chip digital signal processing (DSP) acceleration instructions and hardware multipliers. This design ensures that high prediction accuracy is preserved while restricting total power consumption to the tens of milliwatt range. To further reduce power consumption, we plan to employ model pruning and structured sparsity, as well as knowledge distillation to derive a compact student network, thereby minimizing computational demands while preserving prediction accuracy.

Supplementary Materials

The following supporting information can be downloaded at: https://www.mdpi.com/article/10.3390/en18154016/s1, Figure S1: Prediction results of the proposed model: (a) CS2_35, (b) CS2_36; Table S1: Detailed prediction results.

Author Contributions

S.W.: Writing—original draft, Visualization, Software, Methodology, Investigation, Formal analysis, Data curation, Validation. Y.H.: Methodology, Investigation, Validation, Data curation. H.H.: Conceptualization, Methodology, Writing—review and editing, Supervision, Project administration, Funding acquisition. All authors have read and agreed to the published version of the manuscript.

Funding

This work is supported by the National Natural Science Foundation of China (Nos. 12272213 and 11872235) and the Natural Science Foundation of Shanghai (No. 23ZR1421800).

Data Availability Statement

The data presented in this study are available on request from the corresponding author.

Conflicts of Interest

The authors declare no conflicts of interest.

References

  1. Wang, Y.; Yu, Y.; Ma, Y.; Shi, J. Lithium-ion battery health state estimation based on improved snow ablation optimization algorithm-deep hybrid kernel extreme learning machine. Energy 2025, 323, 135772. [Google Scholar] [CrossRef]
  2. Zhang, C.; Zhang, Y.; Li, Z.; Zhang, Z.; Nazir, M.S.; Peng, T. Enhancing state of charge and state of energy estimation in Lithium-ion batteries based on a TimesNet model with Gaussian data augmentation and error correction. Appl. Energy 2024, 359, 122669. [Google Scholar] [CrossRef]
  3. Khan, F.N.U.; Rasul, M.G.; Sayem, A.; Mandal, N.K. Design and optimization of lithium-ion battery as an efficient energy storage device for electric vehicles: A comprehensive review. J. Energy Storage 2023, 71, 108033. [Google Scholar] [CrossRef]
  4. Xu, J.; Cai, X.; Cai, S.; Shao, Y.; Hu, C.; Lu, S.; Ding, S. High-energy lithium-ion batteries: Recent progress and a promising future in applications. Energy Environ. Mater. 2023, 6, e12450. [Google Scholar] [CrossRef]
  5. Wang, Y.; Wang, H. Wavelet attention-powered neural network framework with hierarchical dynamic frequency learning for lithium-ion battery state of health prediction. J. Energy Storage 2023, 61, 106697. [Google Scholar] [CrossRef]
  6. Yao, L.; Xu, S.; Tang, A.; Zhou, F.; Hou, J.; Xiao, Y.; Fu, Z. A review of lithium-ion battery state of health estimation and prediction methods. World Electr. Veh. J. 2021, 12, 113. [Google Scholar] [CrossRef]
  7. Wang, M.; Wu, S.; Chen, Y.; Wang, S.; Chen, H.; Luan, W. Quantitative safety assessment of lithium-ion batteries: Integrating abuse risks and intrinsic safety. J. Power Sources 2025, 640, 236789. [Google Scholar] [CrossRef]
  8. Chen, Y.; Huang, X.; He, Y.; Zhang, S.; Cai, Y. Edge–cloud collaborative estimation lithium-ion battery SOH based on MEWOA-VMD and Transformer. J. Energy Storage 2024, 99, 113388. [Google Scholar] [CrossRef]
  9. Li, X.; Ju, L.; Geng, G.; Jiang, Q. Data-driven state-of-health estimation for lithium-ion battery based on aging features. Energy 2023, 274, 127378. [Google Scholar] [CrossRef]
  10. Zhao, X.; Liu, S.; Li, E.; Wang, Z.; Gu, F.; Ball, A.D. A hybrid intelligent model using the distribution of relaxation time analysis of electrochemical impedance spectroscopy for lithium-ion battery state of health estimation. J. Energy Storage 2024, 84, 110814. [Google Scholar] [CrossRef]
  11. Pang, Z.; Yang, K.; Song, Z.; Niu, P.; Chen, G.; Meng, J. A new method for determining SOH of lithium batteries using the real-part ratio of EIS specific frequency impedance. J. Energy Storage 2023, 72, 108693. [Google Scholar] [CrossRef]
  12. Zhang, S.; Zhu, H.; Wu, J.; Chen, Z. Voltage relaxation-based state-of-health estimation of lithium-ion batteries using convolutional neural networks and transfer learning. J. Energy Storage 2023, 73, 108579. [Google Scholar] [CrossRef]
  13. Lin, M.; Wu, D.; Meng, J.; Wang, W.; Wu, J. Health prognosis for lithium-ion battery with multi-feature optimization. Energy 2023, 264, 126307. [Google Scholar] [CrossRef]
  14. Li, X.; Yuan, C.; Wang, Z.; He, J.; Yu, S. Lithium battery state-of-health estimation and remaining useful lifetime prediction based on non-parametric aging model and particle filter algorithm. eTransportation 2022, 11, 100156. [Google Scholar] [CrossRef]
  15. Ge, D.; Jin, G.; Wang, J.; Zhang, Z. A novel data-driven IBA-ELM model for SOH/SOC estimation of lithium-ion batteries. Energy 2024, 305, 132395. [Google Scholar] [CrossRef]
  16. Doyle, M.; Fuller, T.F.; Newman, J. Modeling of galvanostatic charge and discharge of the lithium/polymer/insertion cell. J. Electrochem. Soc. 1993, 140, 1526. [Google Scholar] [CrossRef]
  17. Huang, Z.; Best, M.; Knowles, J.; Fly, A. Adaptive piecewise equivalent circuit model with SOC/SOH estimation based on extended Kalman filter. IEEE Trans. Energy Convers. 2022, 38, 959–970. [Google Scholar] [CrossRef]
  18. Xu, Z.; Wang, J.; Lund, P.D.; Zhang, Y. Co-estimating the state of charge and health of lithium batteries through combining a minimalist electrochemical model and an equivalent circuit model. Energy 2022, 240, 122815. [Google Scholar] [CrossRef]
  19. Obregon, J.; Han, Y.-R.; Ho, C.W.; Mouraliraman, D.; Lee, C.W.; Jung, J.-Y. Convolutional autoencoder-based SOH estimation of lithium-ion batteries using electrochemical impedance spectroscopy. J. Energy Storage 2023, 60, 106680. [Google Scholar] [CrossRef]
  20. Jorge, I.; Mesbahi, T.; Samet, A.; Boné, R. Time series feature extraction for lithium-ion batteries state-of-health prediction. J. Energy Storage 2023, 59, 106436. [Google Scholar] [CrossRef]
  21. Zhou, J.; Wang, S.; Cao, W.; Xie, Y.; Fernandez, C. State of health prediction of lithium-ion batteries based on SSA optimized hybrid neural network model. Electrochim. Acta 2024, 487, 144146. [Google Scholar] [CrossRef]
  22. Ge, D.; Jin, G.; Wang, J.; Zhang, Z. A novel BA-ABC-ELM model for estimating state of health of lithium-ion batteries. Energy Rep. 2025, 13, 465–476. [Google Scholar] [CrossRef]
  23. Fan, Y.; Yang, H.; Ye, C.; Yang, W.; Panchal, S.; Fraser, R.; Fowler, M.; Dong, H. State of health estimation of lithium-ion batteries based on the fusion of aging feature extraction and SSA-ELM machine learning algorithms. Ionics 2025, 31, 7897–7915. [Google Scholar] [CrossRef]
  24. An, J.; Guo, W.; Lv, T.; Zhao, Z.; He, C.; Zhao, H. Joint prediction of the state of charge and the state of health of lithium-ion batteries based on the PSO-XGBoost algorithm. Energies 2023, 16, 4243. [Google Scholar] [CrossRef]
  25. Sun, J.; Fan, C.; Yan, H. SOH estimation of lithium-ion batteries based on multi-feature deep fusion and XGBoost. Energy 2024, 306, 132429. [Google Scholar] [CrossRef]
  26. Lin, C.; Wu, L.; Tuo, X.; Liu, C.; Zhang, W.; Huang, Z.; Zhang, G. A lightweight two-stage physics-informed neural network for SOH estimation of lithium-ion batteries with different chemistries. J. Energy Chem. 2025, 105, 261–279. [Google Scholar] [CrossRef]
  27. Dai, Y.; Yu, A. Combined CNN-LSTM and GRU based health feature parameters for lithium-ion batteries SOH estimation. Energy Storage Sci. Technol. 2022, 11, 1641. [Google Scholar]
  28. Zhao, F.-M.; Gao, D.-X.; Cheng, Y.-M.; Yang, Q. Estimation of lithium-ion battery health state using MHATTCN network with multi-health indicators inputs. Sci. Rep. 2024, 14, 18391. [Google Scholar] [CrossRef]
  29. Lin, M.; Zeng, X.; Wu, J. State of health estimation of lithium-ion battery based on an adaptive tunable hybrid radial basis function network. J. Power Sources 2021, 504, 230063. [Google Scholar] [CrossRef]
  30. Wang, X.; Dai, K.; Hu, M.; Ni, N. Lithium-ion battery health state and remaining useful life prediction based on hybrid model MFE-GRU-TCA. J. Energy Storage 2024, 95, 112442. [Google Scholar] [CrossRef]
  31. Zhang, L.; Ji, T.; Yu, S.; Liu, G. Accurate prediction approach of SOH for lithium-ion batteries based on LSTM method. Batteries 2023, 9, 177. [Google Scholar] [CrossRef]
  32. Zhao, S.; Luo, L.; Jiang, S.; Zhang, C. Lithium-Ion Battery State-of-Health Estimation Method Using Isobaric Energy Analysis and PSO-LSTM. J. Electr. Comput. Eng. 2023, 2023, 5566965. [Google Scholar] [CrossRef]
  33. Yayan, U.; Arslan, A.T.; Yucel, H. A novel method for SoH prediction of batteries based on stacked LSTM with quick charge data. Appl. Artif. Intell. 2021, 35, 421–439. [Google Scholar] [CrossRef]
  34. Peng, S.; Wang, Y.; Tang, A.; Jiang, Y.; Kan, J.; Pecht, M. State of health estimation joint improved grey wolf optimization algorithm and LSTM using partial discharging health features for lithium-ion batteries. Energy 2025, 315, 134293. [Google Scholar] [CrossRef]
  35. Vakharia, V.; Shah, M.; Nair, P.; Borade, H.; Sahlot, P.; Wankhede, V. Estimation of lithium-ion battery discharge capacity by integrating optimized explainable-AI and stacked LSTM model. Batteries 2023, 9, 125. [Google Scholar] [CrossRef]
  36. Saha, B. Battery Data Set. In NASA AMES Progmostics Data Repository; NASA Ames Research Center: Moffett Field, CA, USA, 2007. [Google Scholar]
  37. Tang, R.; Zhang, P.; Ning, S.; Zhang, Y. Prediction of battery SOH and RUL based on cooperative characteristics in voltage-temperature-time dimensions. J. Electrochem. Soc. 2023, 170, 060535. [Google Scholar] [CrossRef]
  38. Gu, X.; See, K.W.; Li, P.; Shan, K.; Wang, Y.; Zhao, L.; Lim, K.C.; Zhang, N. A novel state-of-health estimation for the lithium-ion battery using a convolutional neural network and transformer model. Energy 2023, 262, 125501. [Google Scholar] [CrossRef]
  39. Vaswani, A. Attention is all you need. In Advances in Neural Information Processing Systems; Neural Information Processing Systems Foundation: South Lake Tahoe, NV, USA, 2017. [Google Scholar]
  40. Carion, N.; Massa, F.; Synnaeve, G.; Usunier, N.; Kirillov, A.; Zagoruyko, S. End-to-end object detection with transformers. In Proceedings of the European Conference on Computer Vision, Glasgow, UK, 23–28 August 2020; pp. 213–229. [Google Scholar]
  41. Xu, H.; Wu, L.; Xiong, S.; Li, W.; Garg, A.; Gao, L. An improved CNN-LSTM model-based state-of-health estimation approach for lithium-ion batteries. Energy 2023, 276, 127585. [Google Scholar] [CrossRef]
  42. Fan, Y.; Xiao, F.; Li, C.; Yang, G.; Tang, X. A novel deep learning framework for state of health estimation of lithium-ion battery. J. Energy Storage 2020, 32, 101741. [Google Scholar] [CrossRef]
  43. Wu, J.; Fang, L.; Dong, G.; Lin, M. State of health estimation of lithium-ion battery with improved radial basis function neural network. Energy 2023, 262, 125380. [Google Scholar] [CrossRef]
  44. Chen, L.; Xie, S.; Lopes, A.M.; Bao, X. A vision transformer-based deep neural network for state of health estimation of lithium-ion batteries. Int. J. Electr. Power Energy Syst. 2023, 152, 109233. [Google Scholar] [CrossRef]
  45. Li, Z.; Zhang, F.; Cai, Z.; Xu, L.; Shen, S.; Yu, P. State of health estimation of lithium-ion batteries based on interval voltage features. J. Energy Storage 2024, 102, 114112. [Google Scholar] [CrossRef]
  46. Lu, J.; Wu, S.; Qin, Z.; Yang, G. Frequency-Aware Attention-LSTM for PM2.5 Time Series Forecasting. arXiv 2025, arXiv:2503.24043. [Google Scholar]
  47. Ren, M.; Wei, J.; Qin, J.; Guo, X.; Wang, H.; Li, S. Attention based LSTM framework for robust UWB and INS integration in NLOS environments. Sci. Rep. 2025, 15, 21637. [Google Scholar] [CrossRef]
Figure 1. The overall prediction framework.
Energies 18 04016 g001
Figure 2. Capacity degradation curves of different batteries.
Energies 18 04016 g002
Figure 3. (a) Charge voltage curve. (b) Discharge voltage curve.
Energies 18 04016 g003
Figure 4. Variation in various features with cycle number. (a) CIKRT, (b) DIKRT, (c) CTPKT, (d) MTPST, (e) IVAI, (f) IVCRAI.
Energies 18 04016 g004aEnergies 18 04016 g004b
Figure 5. Structure of LSTM.
Energies 18 04016 g005
Figure 6. Structure of the scaled dot-product self-attention mechanism.
Energies 18 04016 g006
Figure 7. SOH prediction for B0005 under different split ratios: (a) 60%, (b) 70%, (c) 80%.
Energies 18 04016 g007
Figure 8. SOH prediction for B0006 under different split ratios: (a) 60%, (b) 70%, (c) 80%.
Energies 18 04016 g008
Figure 9. SOH prediction for B0007 under different split ratios: (a) 60%, (b) 70%, (c) 80%.
Energies 18 04016 g009
Figure 10. SOH prediction for B0018 under different split ratios: (a) 60%, (b) 70%, (c) 80%.
Energies 18 04016 g010
Figure 11. The specific prediction errors of SOH under different split ratios: (a) B0005, (b) B0006, (c) B0007, (d) B0018.
Energies 18 04016 g011aEnergies 18 04016 g011b
Figure 12. Ablation results of the proposed model: (a) B0005, (b) B0006, (c) B0007, (d) B0018.
Energies 18 04016 g012aEnergies 18 04016 g012b
Figure 13. Line plot of absolute errors in the ablation analysis of the proposed model: (a) B0005, (b) B0006, (c) B0007, (d) B0018.
Energies 18 04016 g013
Table 1. Correlation between features and SOH.
CIKRTDIKRTCTPKTMTPSTIVAIIVCRAI
B00050.99470.97140.9980−0.91350.9994−0.9669
B00060.99290.96680.9948−0.93970.9974−0.9448
B00070.98860.97850.9980−0.88450.9994−0.9877
B00180.98870.94820.9821−0.74020.9982−0.9808
Table 2. Hyperparameter settings.
ParameterSetting
Number of LSTM layers2
LSTM hidden size 132
LSTM hidden size 232
Attention heads2
OptimizerAdam
Loss functionMSE
Batch size4
Learning rate0.0007
Epoch200
Table 3. Comparison of model ablation results.
ModelBatteryMAE (%)RMSE (%)
LSTM-SDPAB00050.260.34
B00060.510.58
B00070.370.40
B00180.400.46
LSTMB00051.001.18
B00061.431.67
B00070.820.92
B00180.670.82
SDPAB00051.371.56
B00061.731.97
B00072.252.48
B00181.791.92
Bi-LSTMB00050.800.93
B00060.730.79
B00070.560.61
B00180.600.73
Table 4. Comparison with other models.
ModelBatteryMAE (%)RMSE (%)
LSTM-SDPAB00050.260.34
B00060.510.58
B00070.370.40
B00180.400.46
TCNB00050.600.66
B00061.271.42
B00070.720.75
B00180.690.78
ESNB00051.211.34
B00061.381.82
B00070.961.07
B00180.901.04
Table 5. Comparison of the specific predictive results of different models.
ModelBatteryMAE (%)RMSE (%)
LSTM-SDPAB00050.260.34
B00060.510.58
B00070.370.40
B00180.400.46
[42]B00052.532.71
B00060.740.88
B00070.740.97
B00180.560.71
[43]B00050.360.52
B00060.740.93
B00070.440.59
B0018--
[44]B00050.310.43
B00060.400.51
B00070.300.39
B00180.430.54
[45]B00050.700.82
B00061.191.69
B00070.410.52
B00180.690.79
Table 6. Noise comparison.
BatteryMAE (%)RMSE (%)
Without NoiseB00050.260.34
B00060.510.58
B00070.370.40
B00180.400.46
With NoiseB00050.350.47
B00060.750.90
B00070.560.64
B00180.590.73
Disclaimer/Publisher’s Note: The statements, opinions and data contained in all publications are solely those of the individual author(s) and contributor(s) and not of MDPI and/or the editor(s). MDPI and/or the editor(s) disclaim responsibility for any injury to people or property resulting from any ideas, methods, instructions or products referred to in the content.

