
PV System Design in Different Climates: A BIM-Based Methodology


Abstract
1. Introduction
- -
- Usually limited accuracy in calculations, resulting from stationary analyses which do not consider the variation in data over time;
- -
- Simplified estimation of losses (e.g., losses from mismatch, wiring, etc.);
- -
- Lack of graphical visualization of the complex structures of the roof, the context, and the conceived system;
- -
- High time consumption;
- -
- Significant difficulty in rapidly testing and comparing multiple intervention strategies;
- -
- Strong predisposition to calculation errors.
2. Materials and Methods
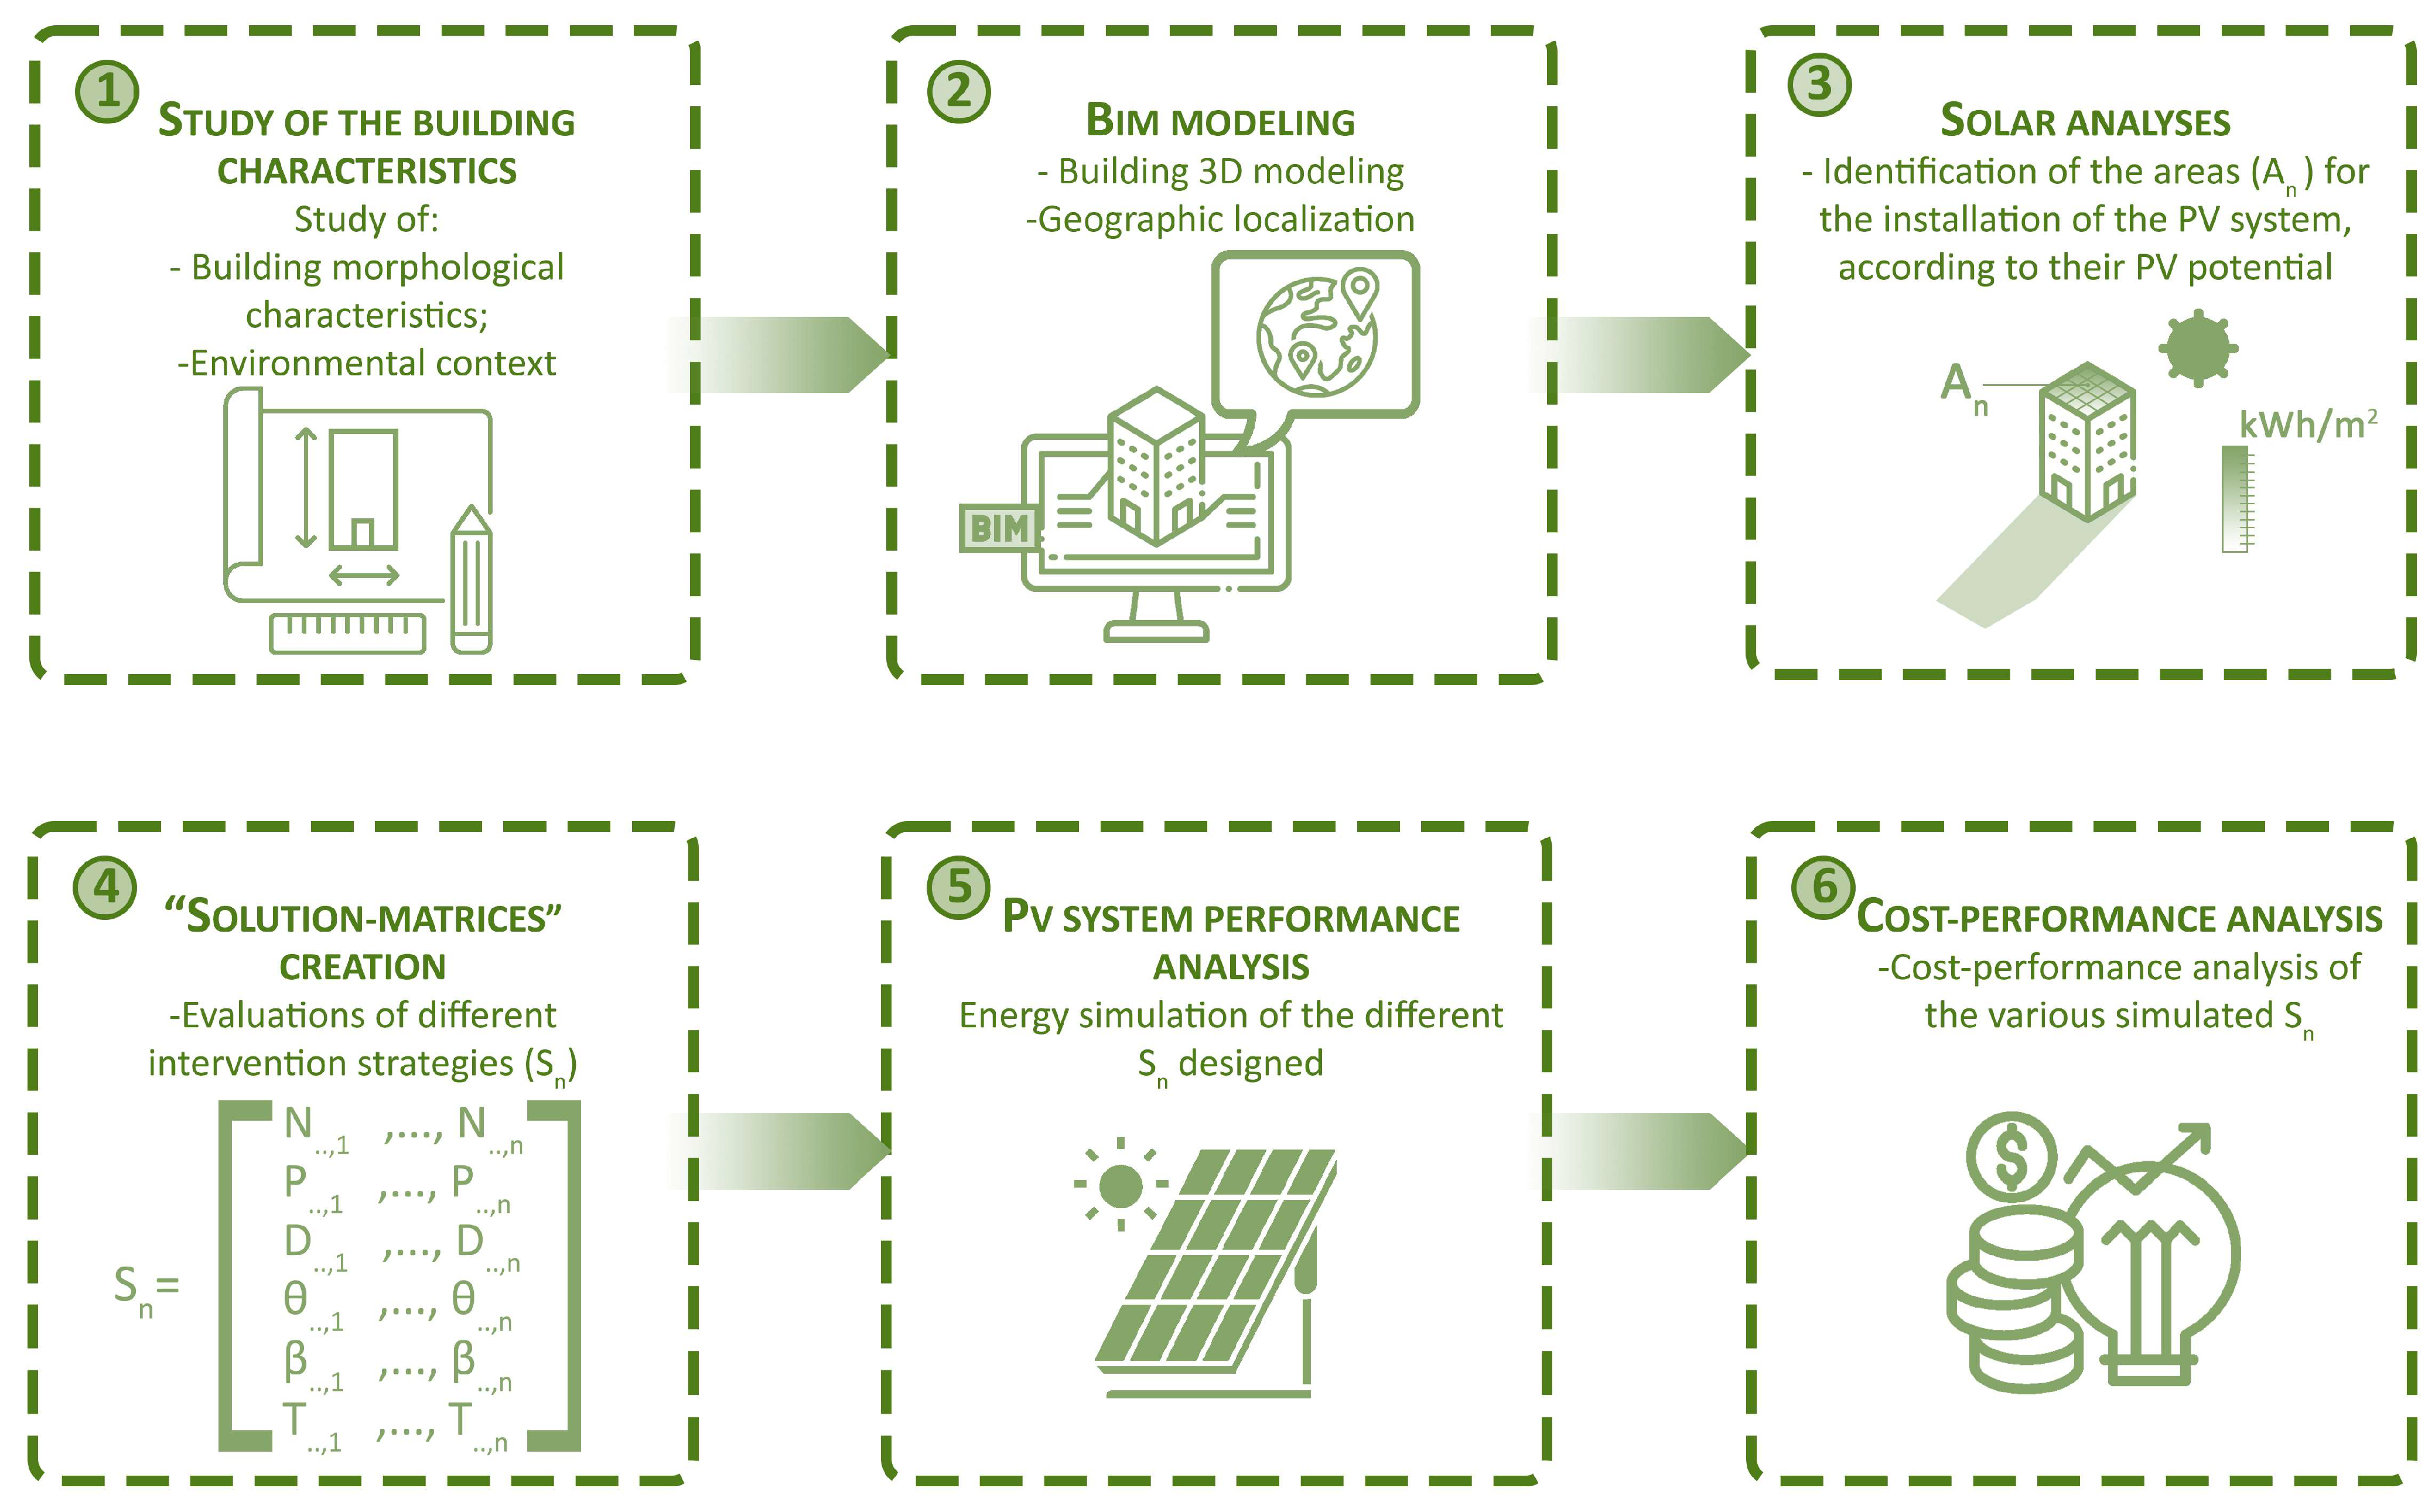
2.1. Workflow Definition
2.2. Software Tools
2.2.1. Autodesk Revit
- -
- The three-dimensional geometric modeling of the building and the context in which it is located;
- -
- A preliminary study of the solar radiation incident on the roof surfaces.
- -
- Dc is the diffuse irradiance received by a tilted surface of slope S,
- -
- Db is the horizontal diffuse irradiance,
- -
- F1 and F2 are, respectively, the circumsolar and horizon “reduced” brightness coefficients,
- -
- a and b are two terms describing the incidence-weighted solid angle sustained by the circumsolar region as seen by the tilted surface and the horizontal, respectively.
2.2.2. Photovoltaic Geographical Information System (PVGIS)
2.2.3. Solarius-PV
- -
- The value of incident solar radiation (derived from the installation site, exposure θ, and inclination β of the modules);
- -
- Any shading;
- -
- Characteristics of the modules (nominal power, efficiency, temperature coefficient, losses due to decoupling or mismatch);
- -
- Characteristics of the balance of system (BOS).
- -
- Losses due to reflection;
- -
- Losses due to shading;
- -
- Losses due to mismatching;
- -
- Losses due to temperature;
- -
- Losses in inverters;
- -
- Losses in AC circuits.
- -
- E is the energy produced;
- -
- Gi is the solar radiation on the module surface;
- -
- Ap is the panel surface;
- -
- ηp is the panel efficiency;
- -
- Csh is the shading coefficient;
- -
- BOS is the balance of system, mentioned above.
2.3. PV System-Sizing Criteria
- Maximizing rooftop potential [44]
- 2.
- Contribution to grid decarbonization [6]
- 3.
- Economies of scale and cost decline [45]
- 4.
- Regulatory and market incentives [46]
- 5.
- Support for energy communities or virtual net metering (VNM) [47]
- 6.
- Future-proofing against growing demand [48]
2.4. Presentation of Case Studies
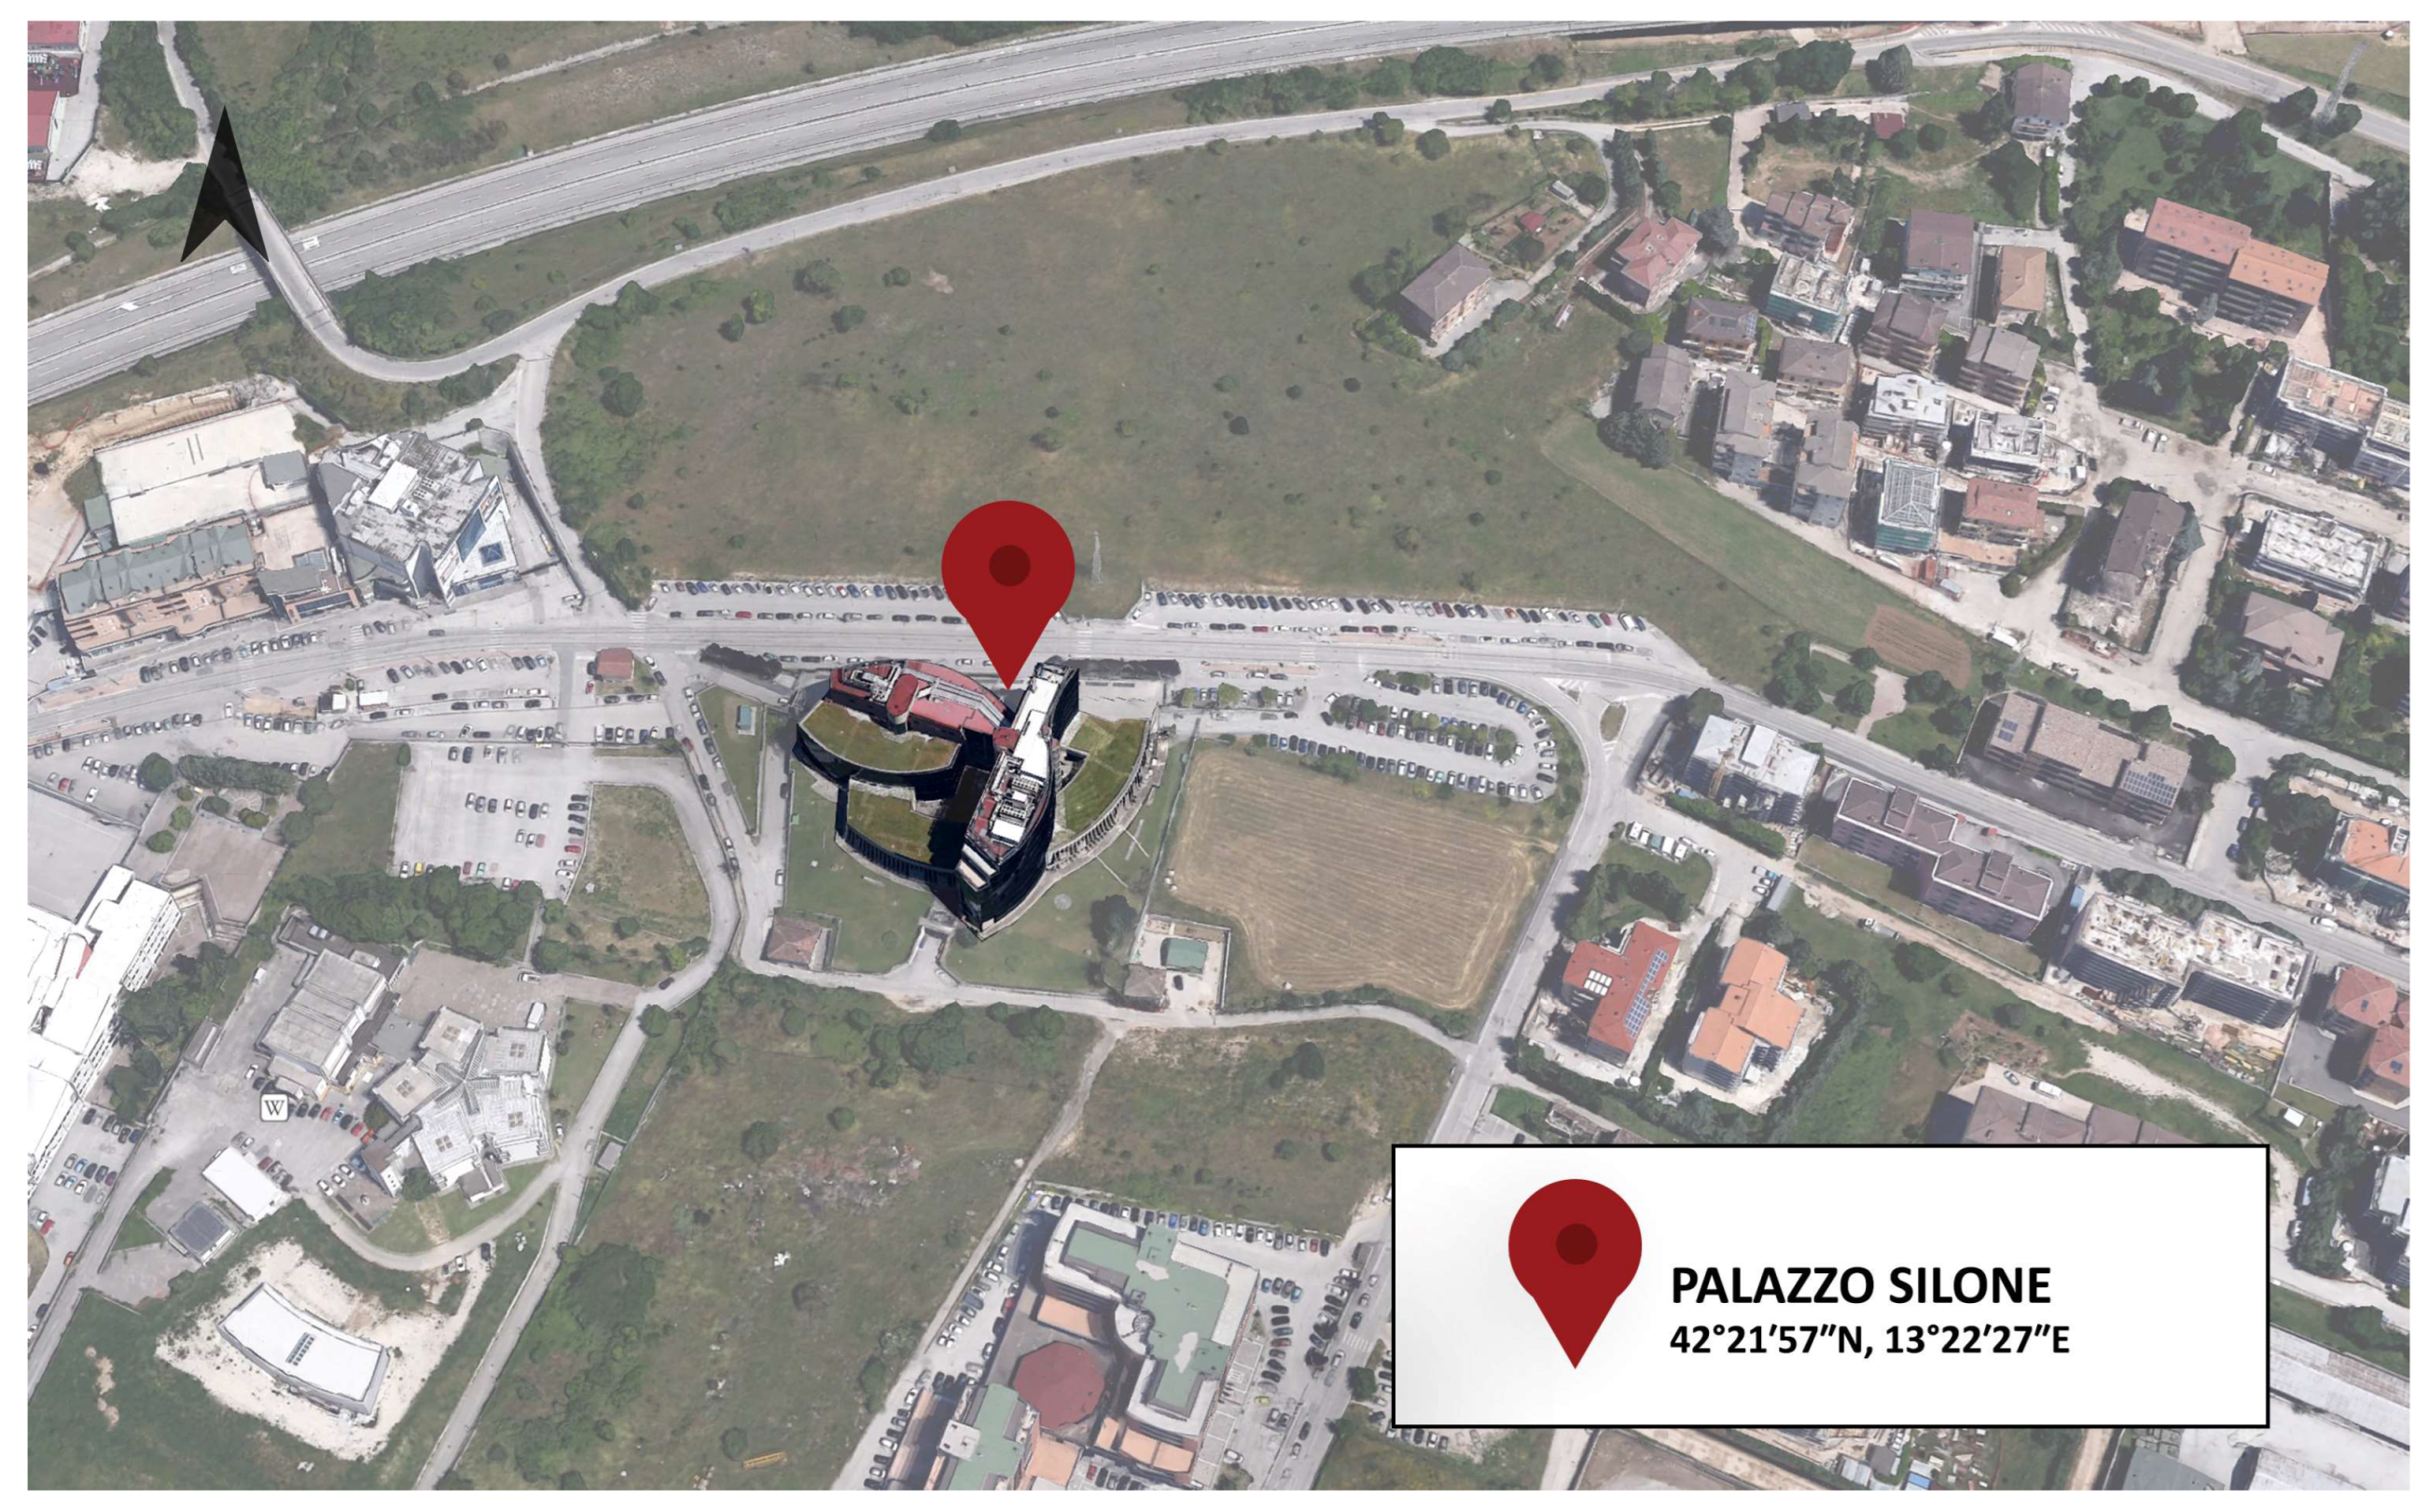
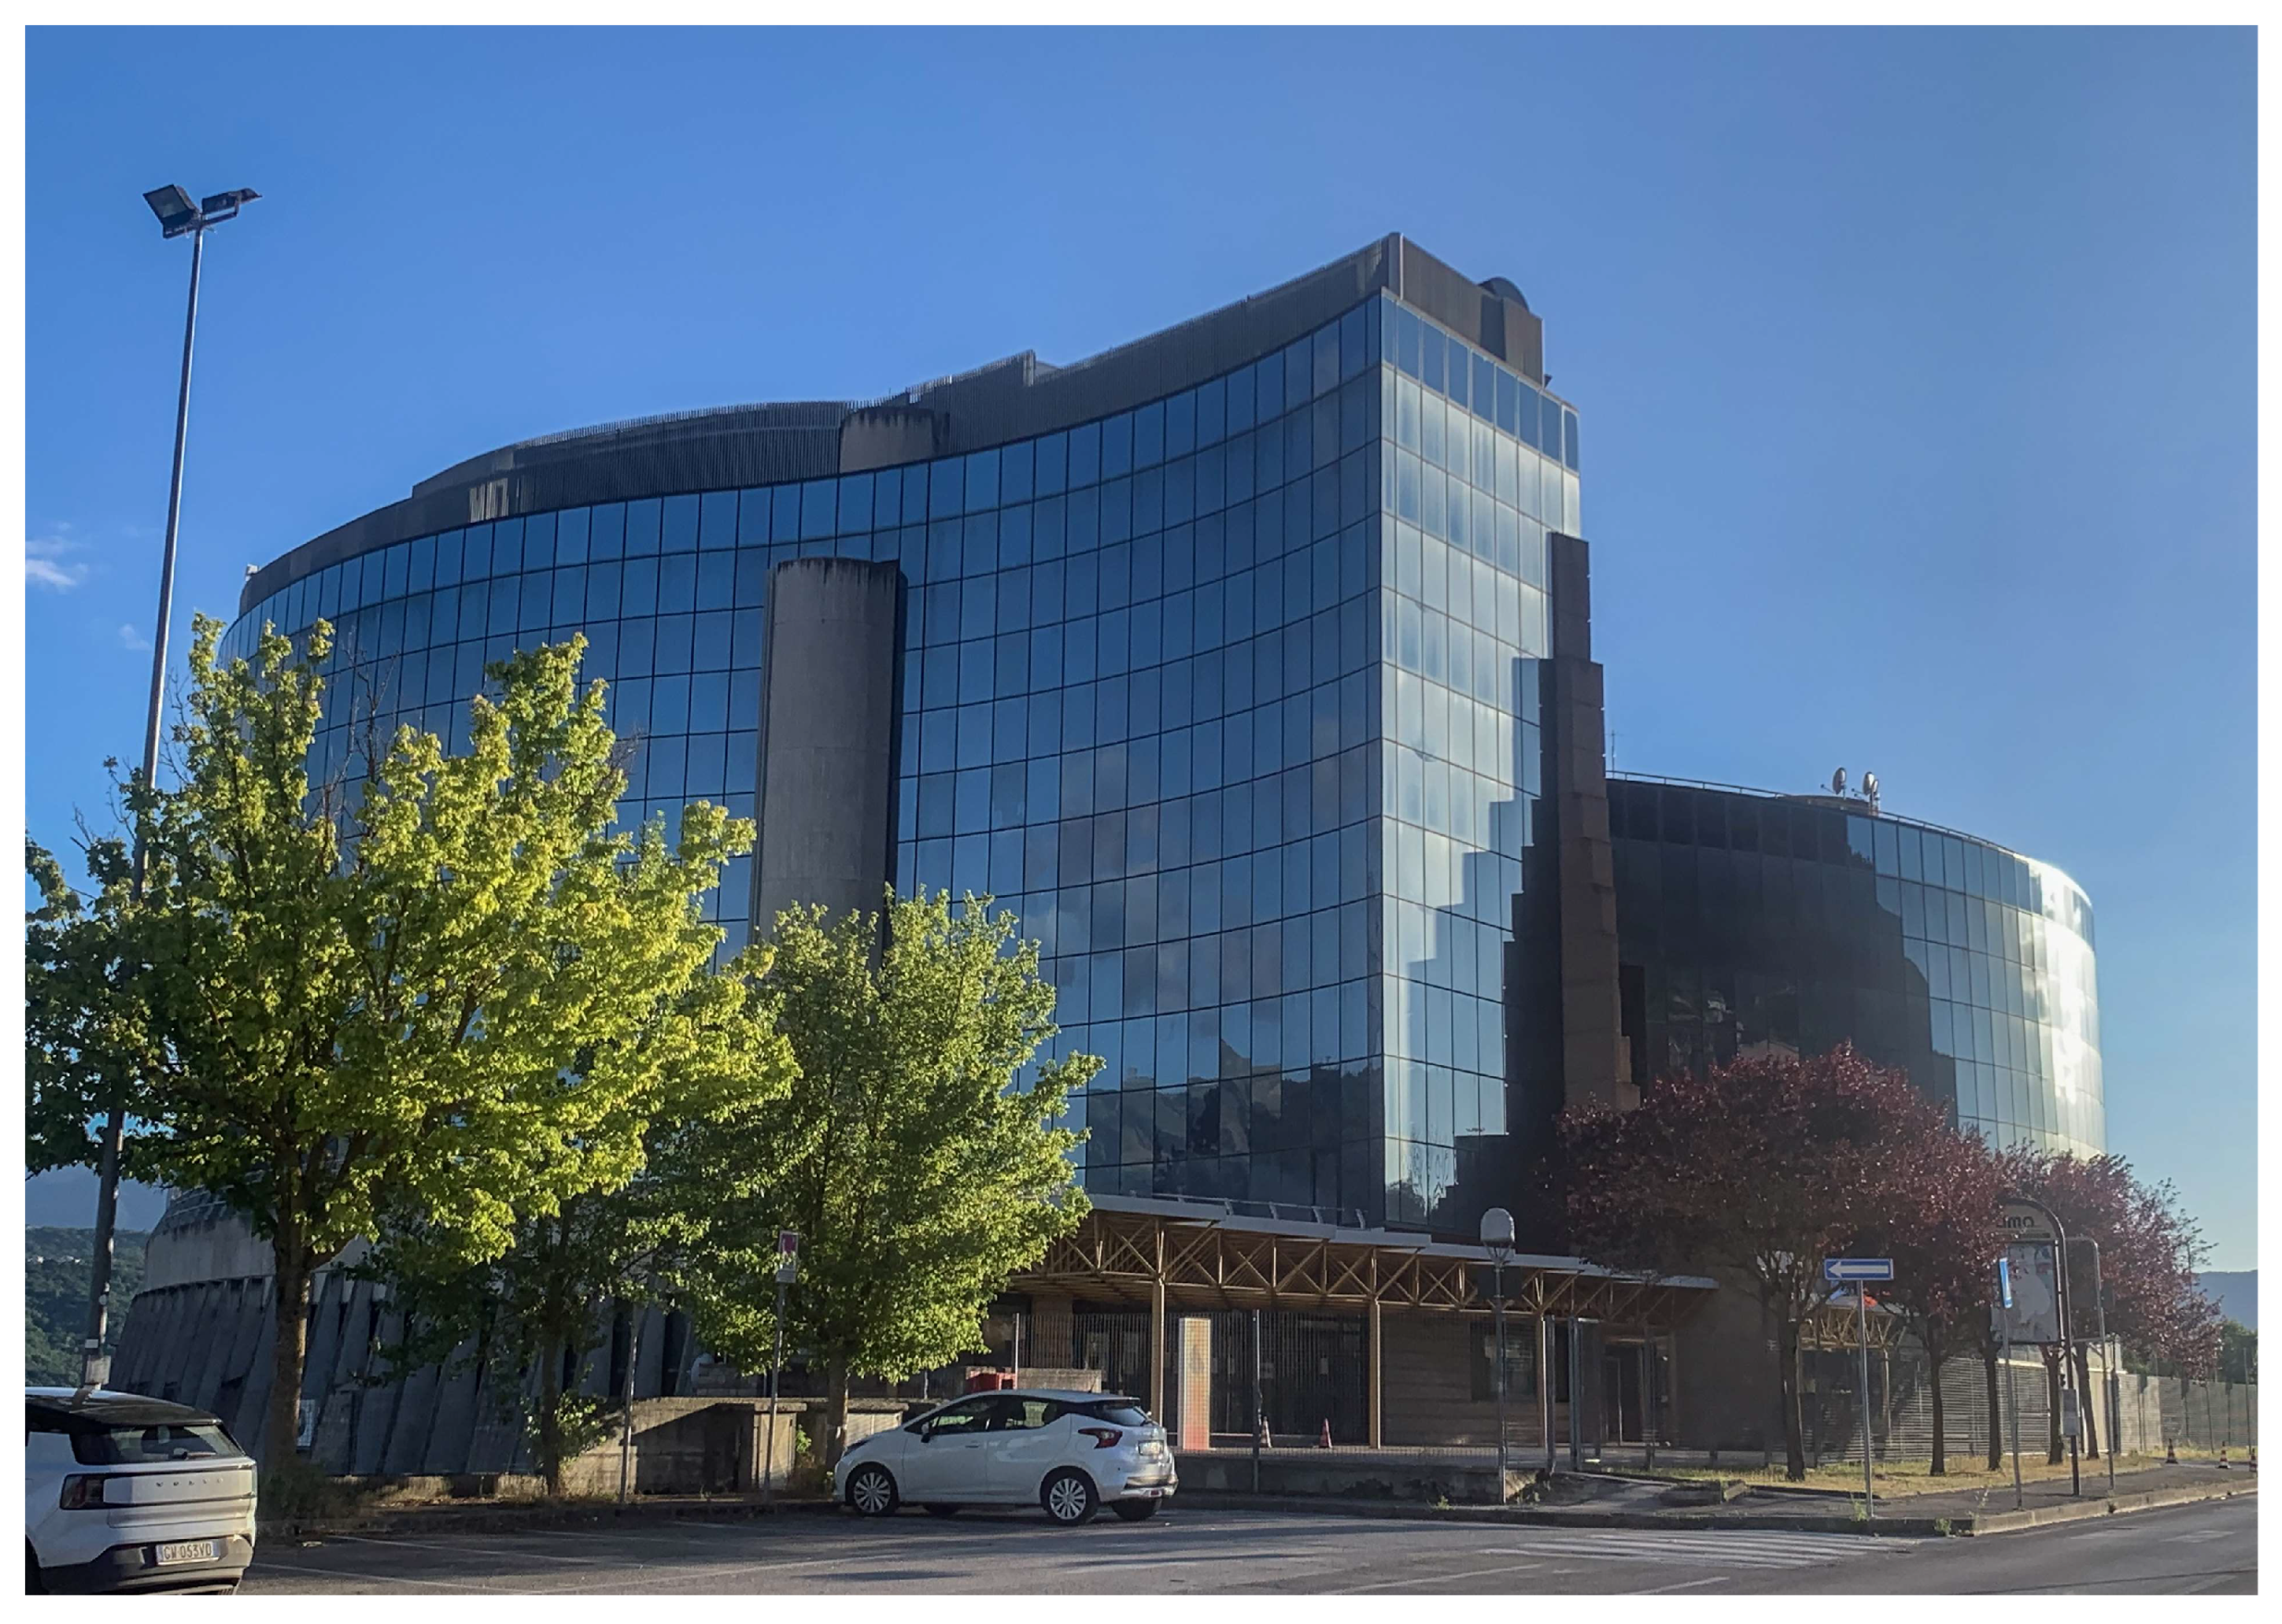
2.4.1. B1: “Palazzo Silone”, L’Aquila (IT)
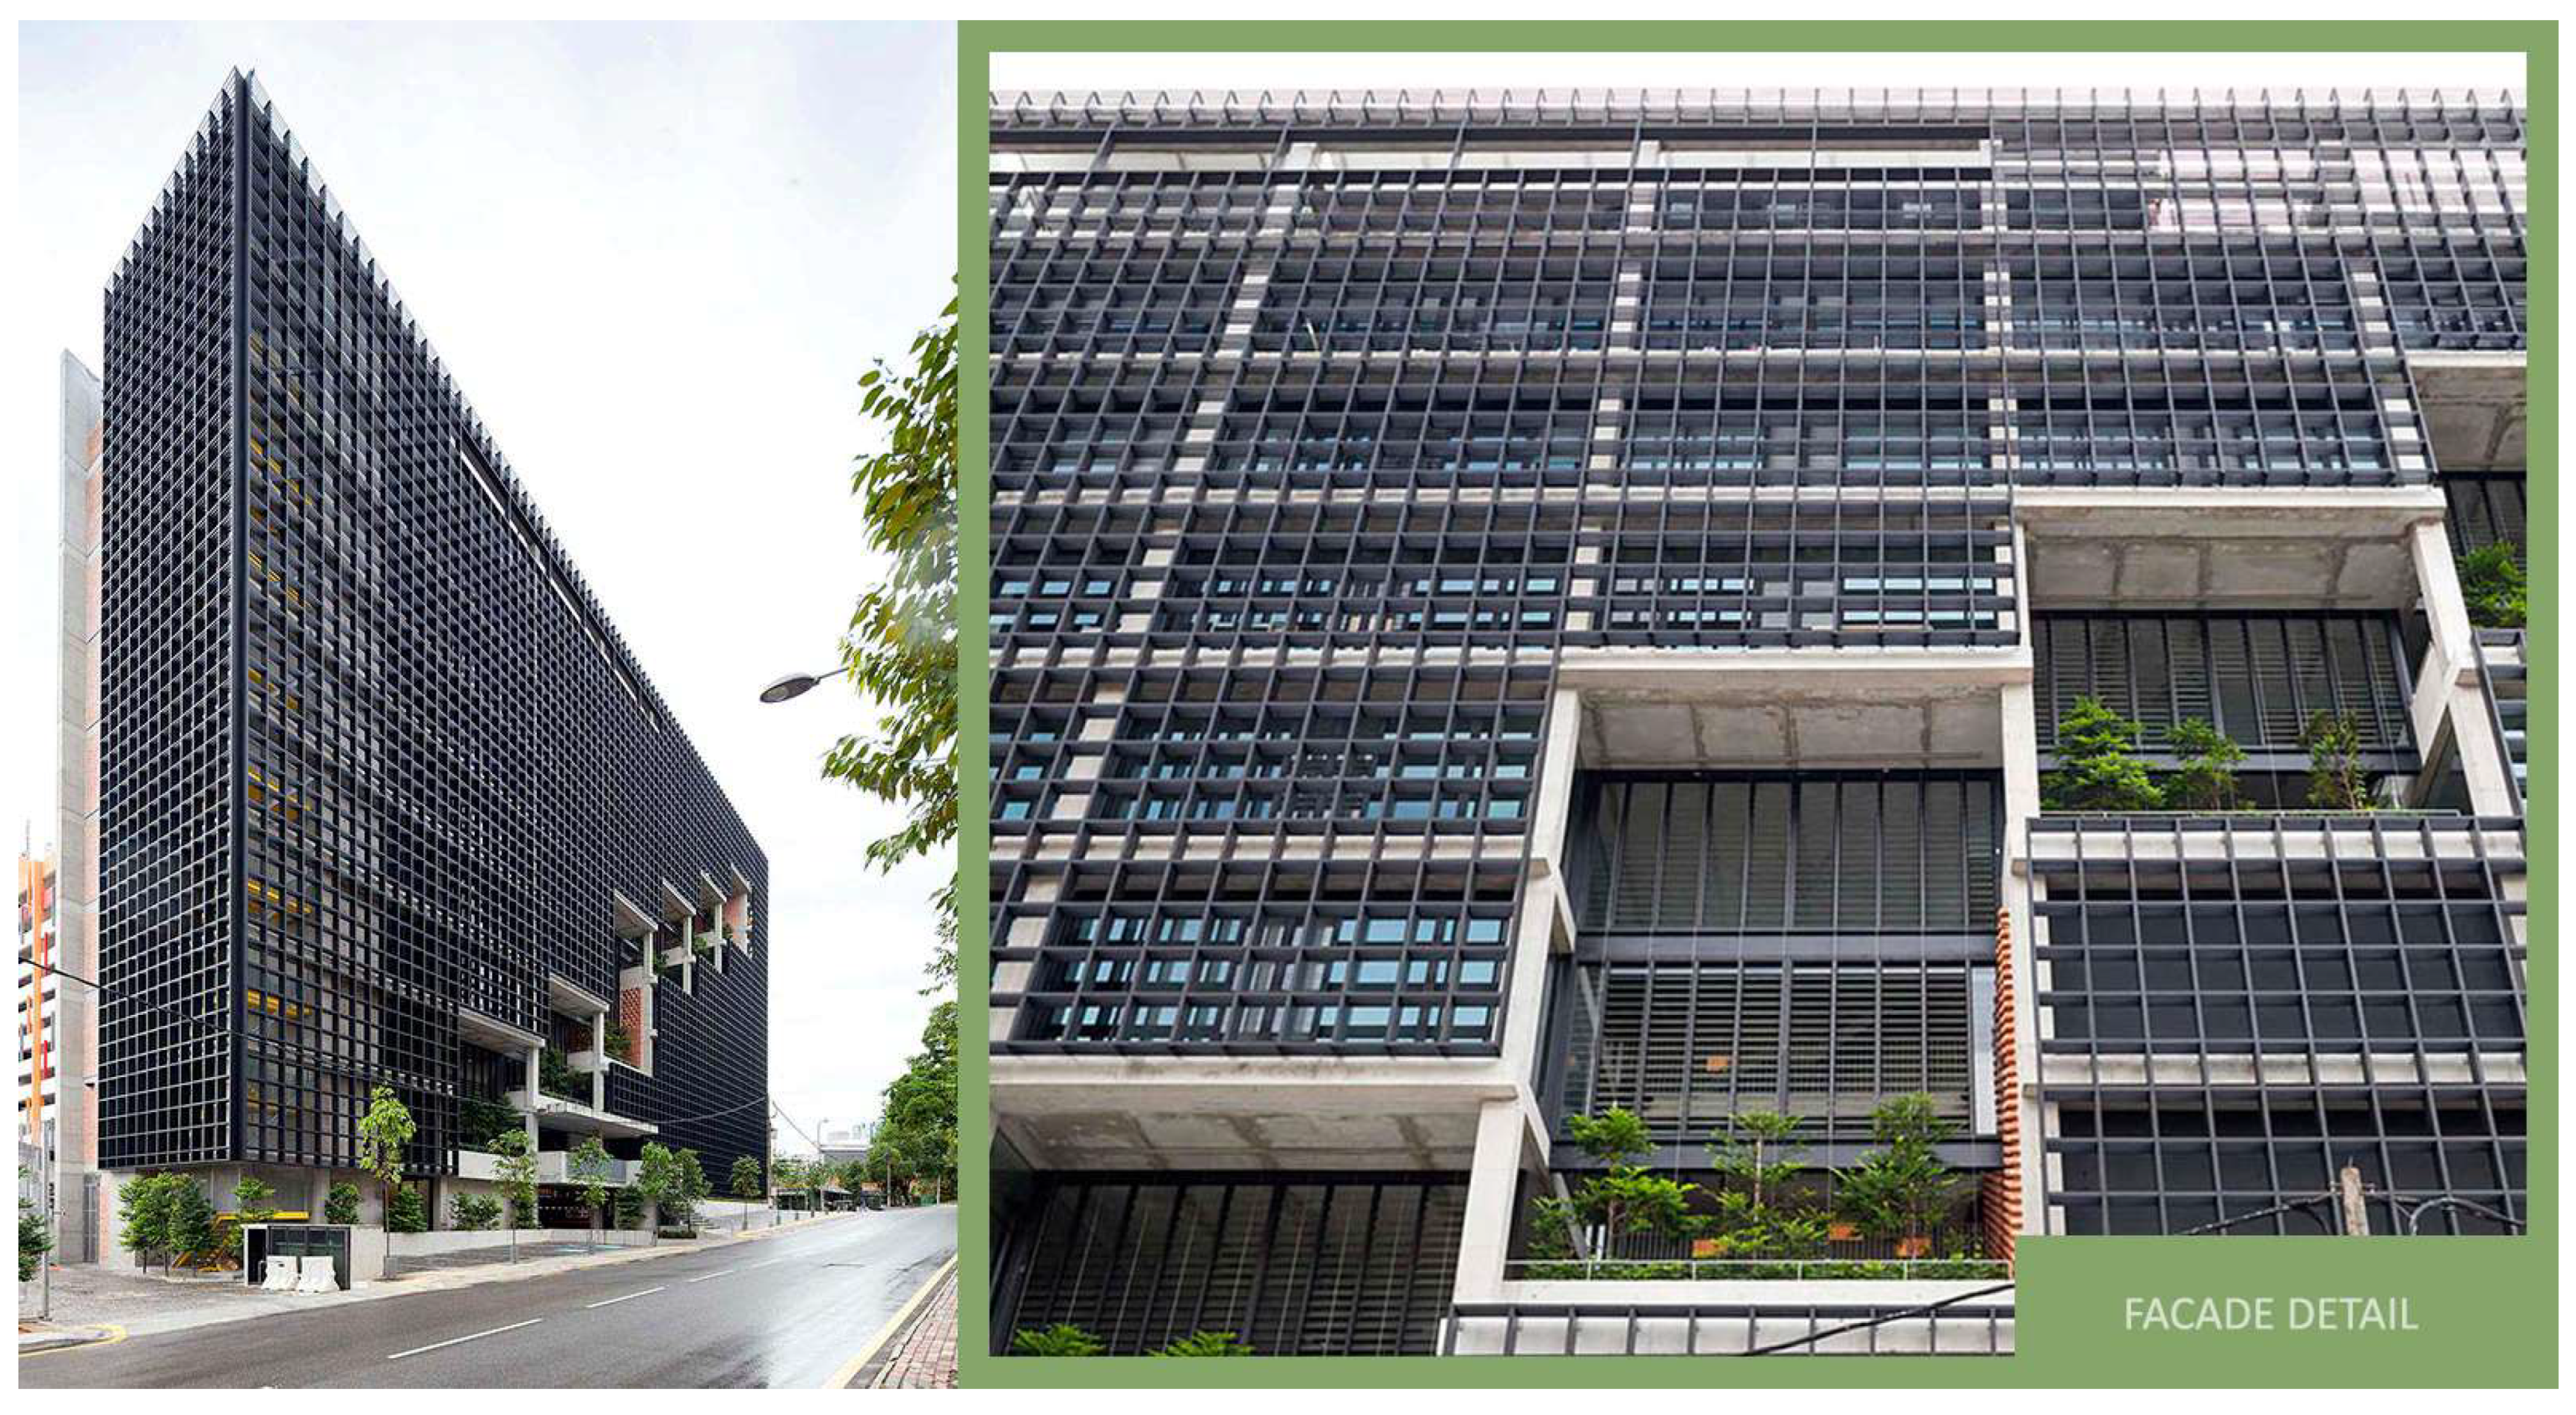
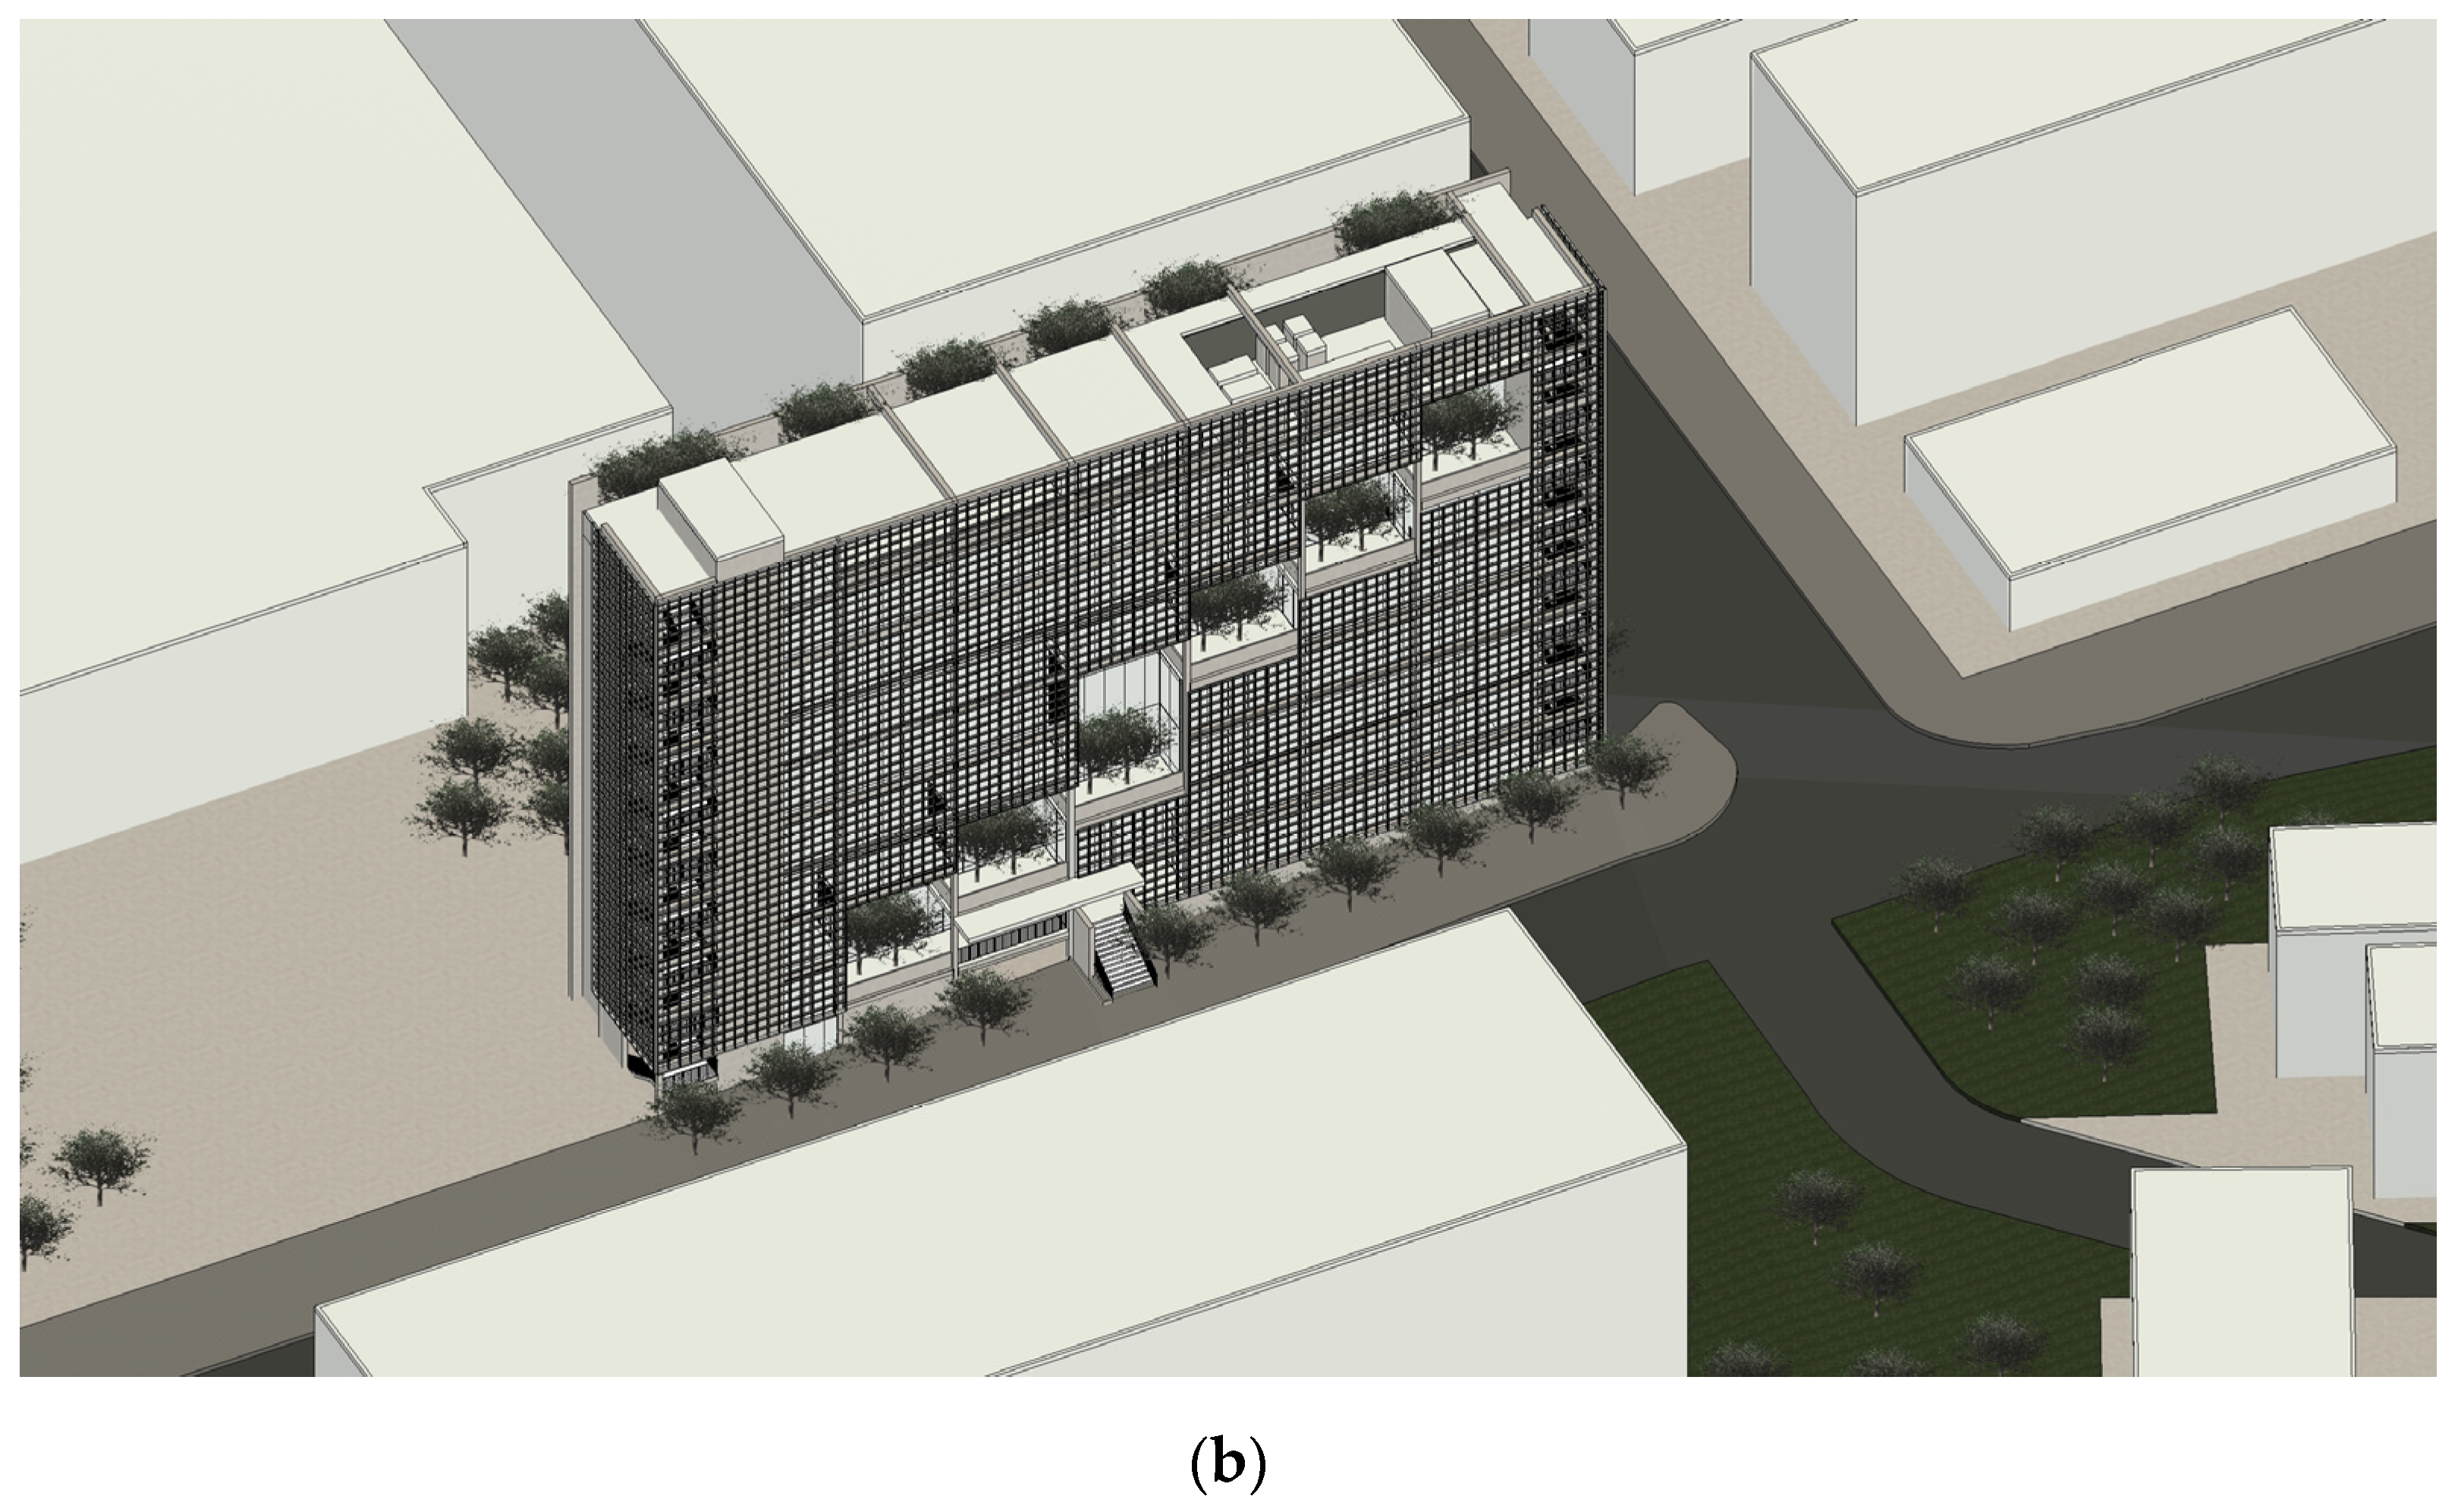
2.4.2. B2: “Malaysian Institute of Architects”, Kuala Lumpur (MY)
2.5. BIM Modeling
3. Results and Discussion
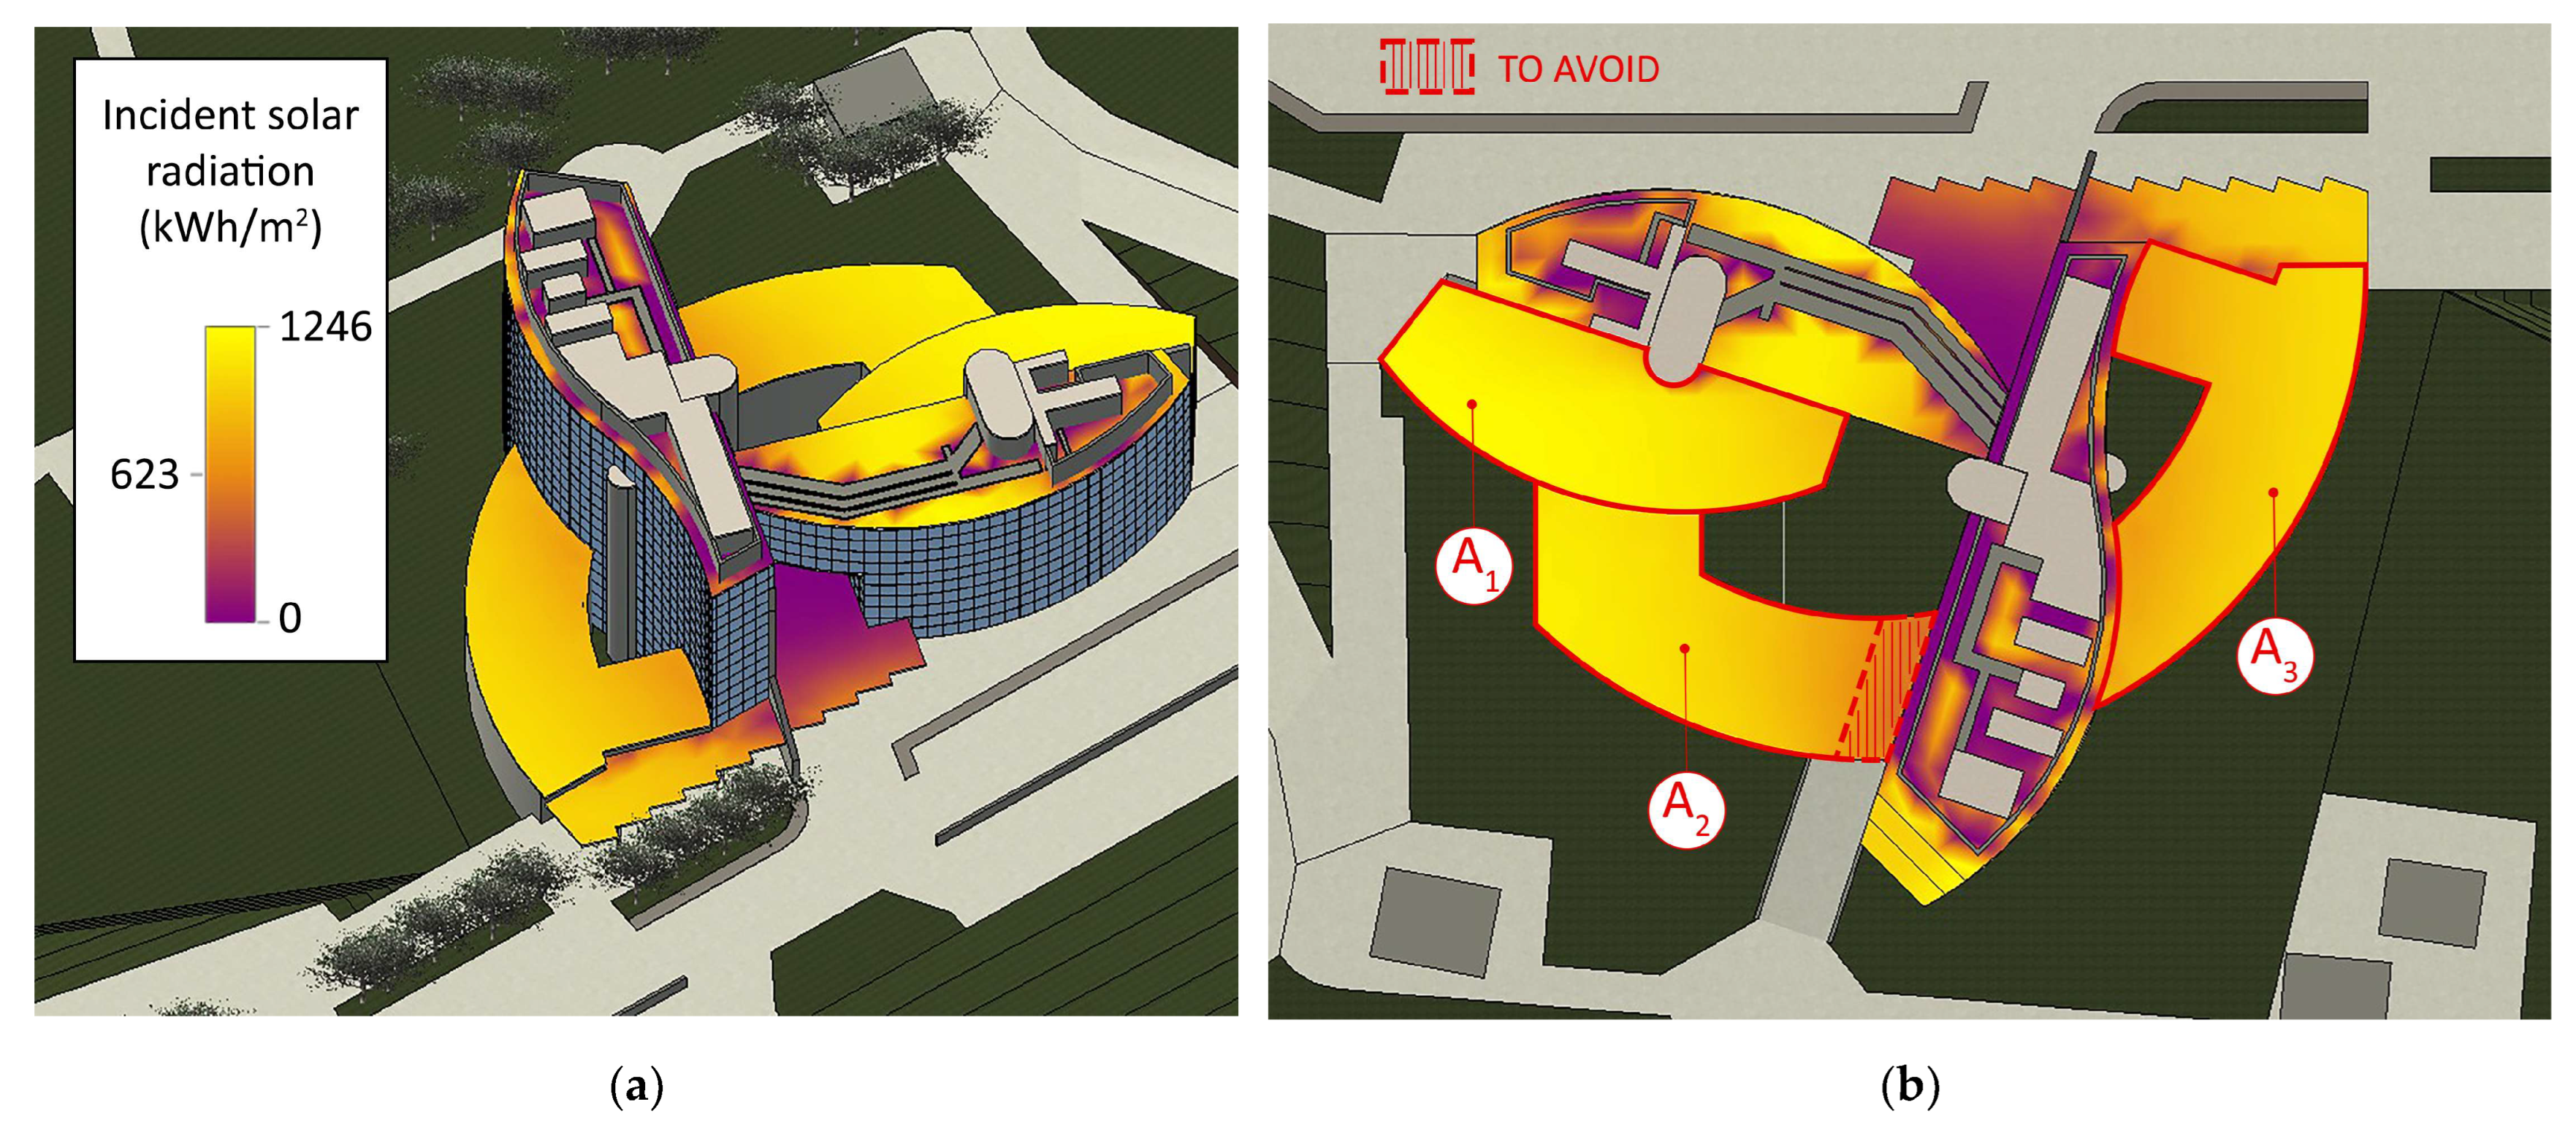
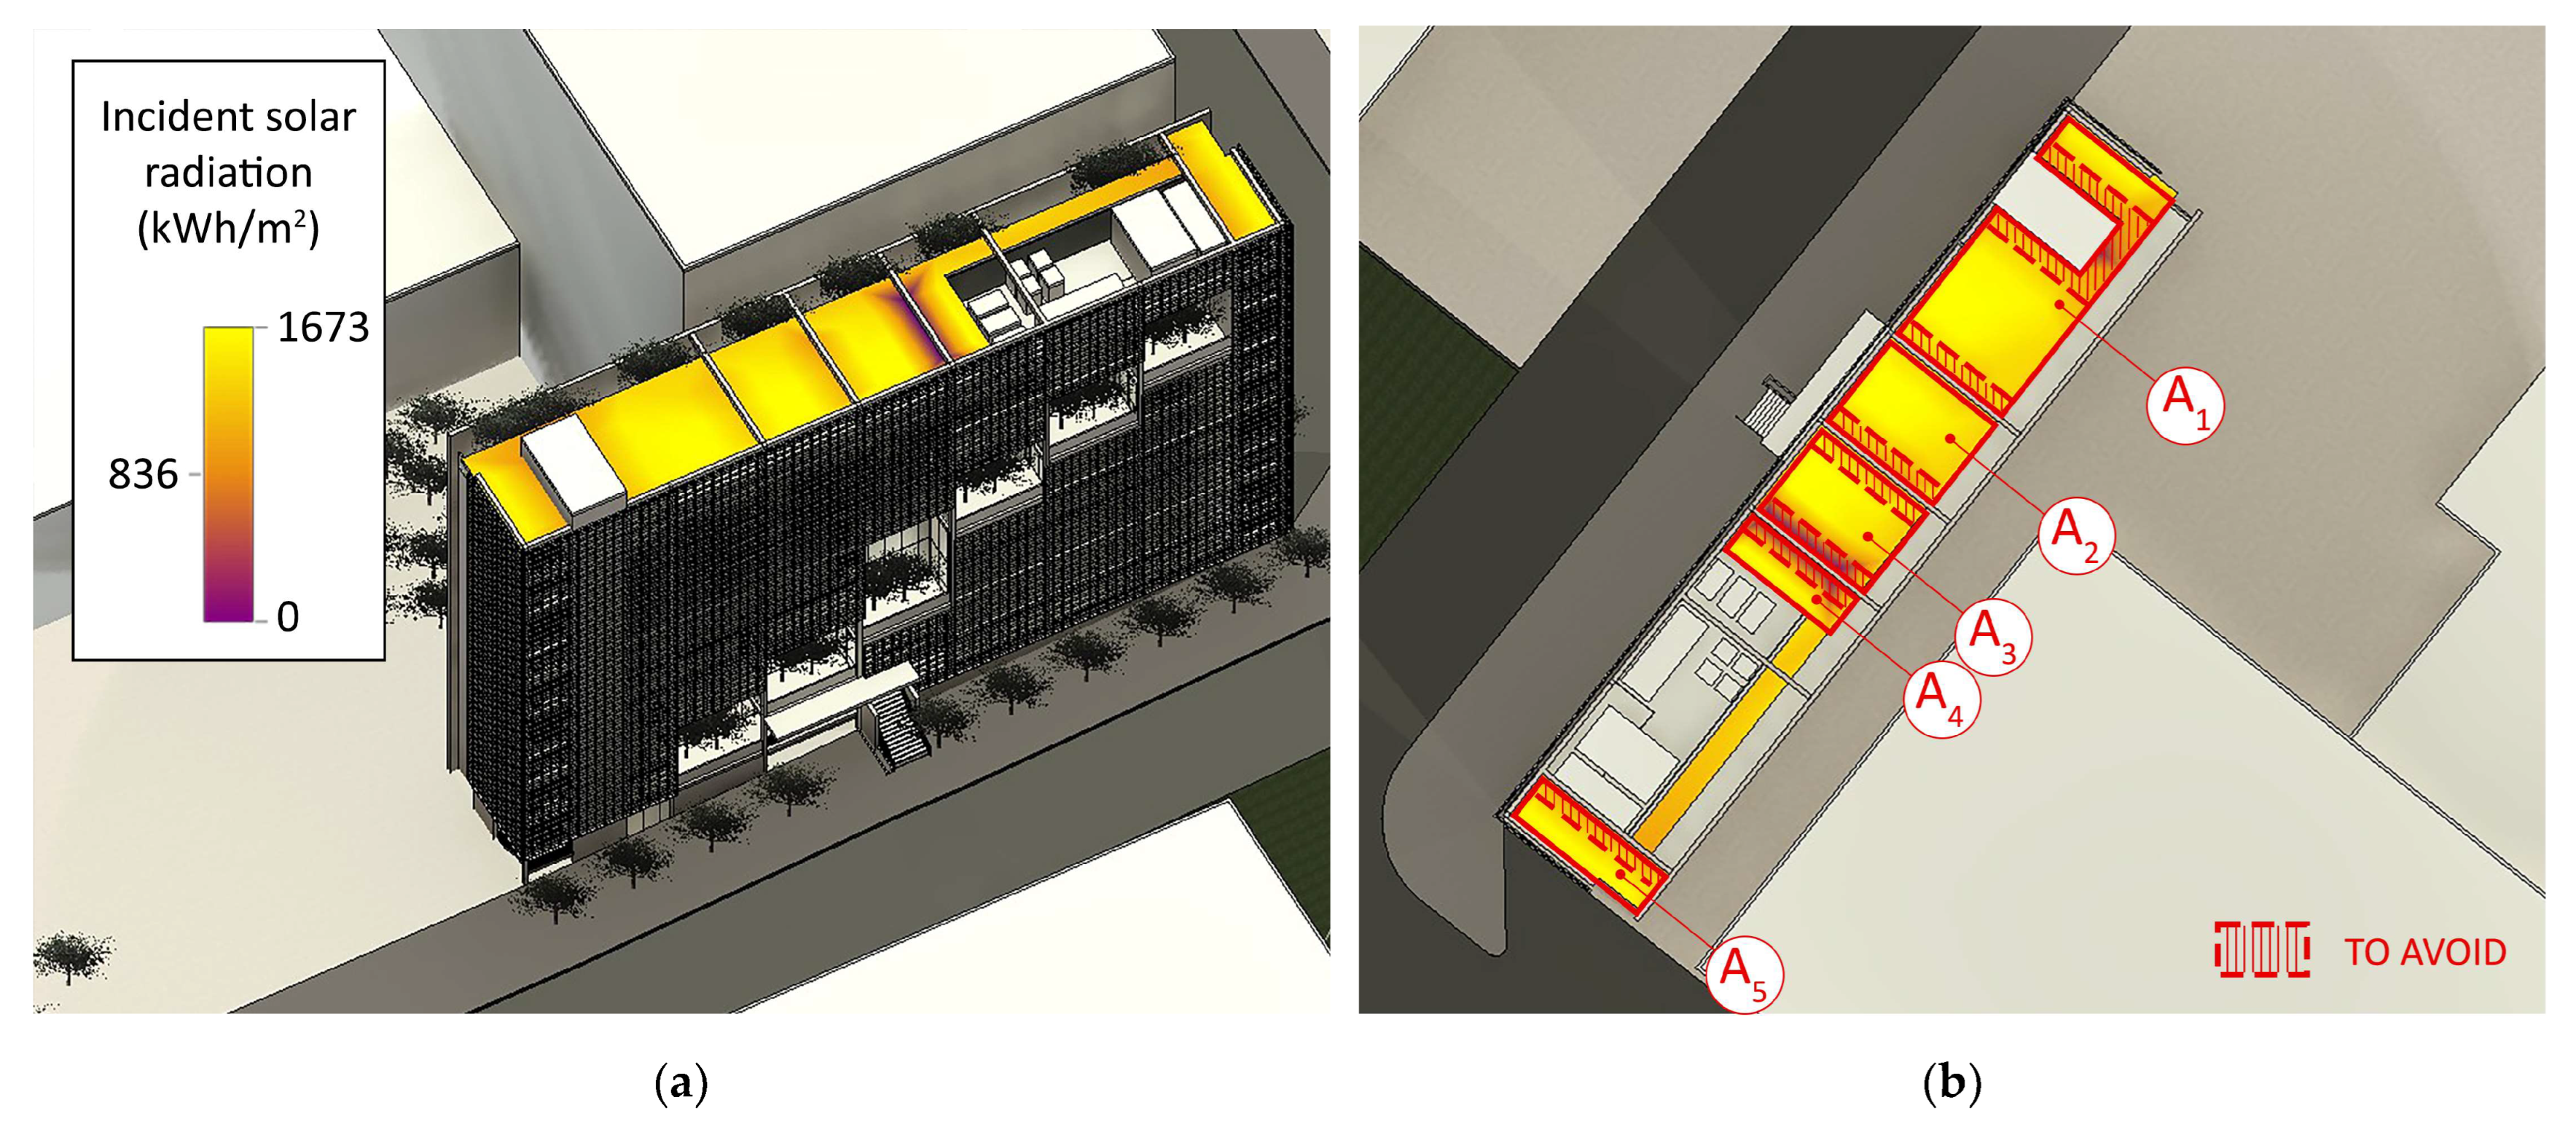
3.1. Solar Analyses
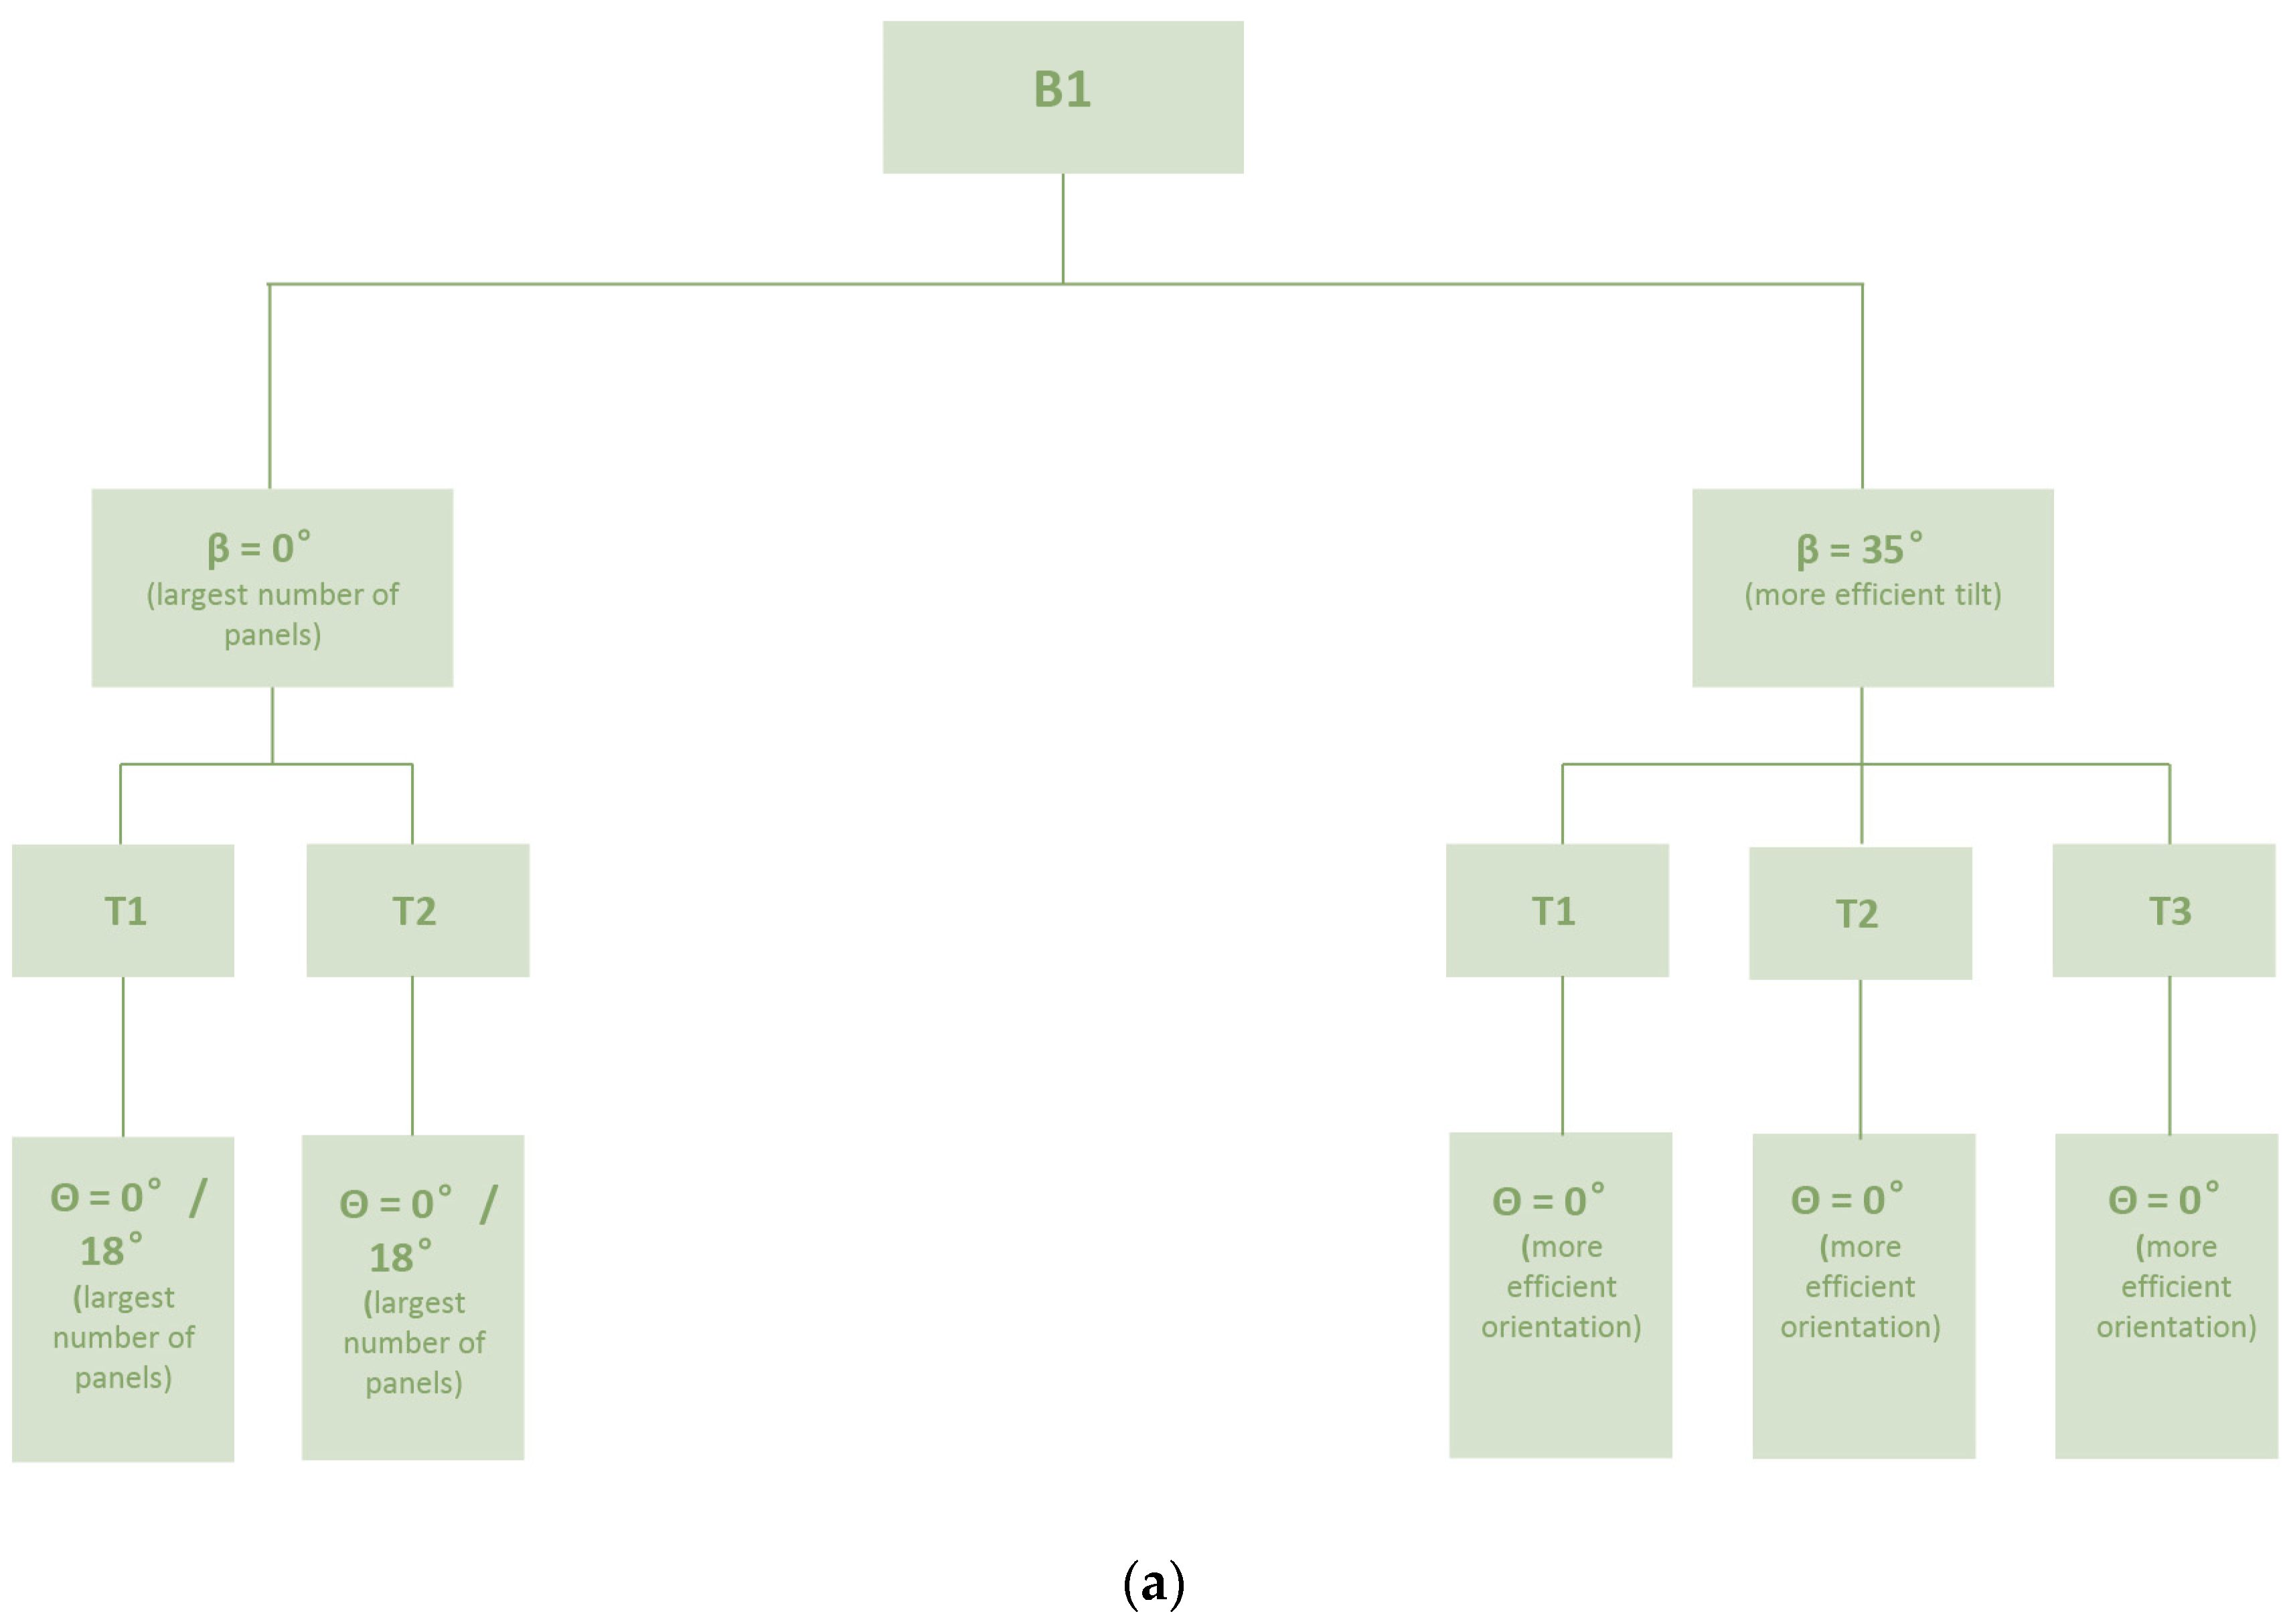
3.2. “Solution-Matrices” Creation
- -
- A represents each analyzed parameter, i.e., N = number of panels, P = power of the panels (W), D = distance between panels (cm), Θ = azimuth of panels (°), β = tilt of panels (°), T = PV technology (1 = HCC, 2 = PERC, 3 = Bifacial HCC);
- -
- i represents the value of the analyzed parameter;
- -
- j indicates the area for installation of the panels, based on the solar analyses (3 for building B1, 5 for B2).
3.3. PV System Performance Analysis
3.4. Cost–Performance Analysis
3.5. Final Remarks
4. Conclusions
- A favorable climate can increase energy production by up to 18%;
- An optimal inclination can bring benefits of up to 10%;
- The possibility of orienting the panels to the south guarantees greater system performance, but if this is not possible, it is necessary to compare several hypotheses to identify the most convenient one;
- It is not a given that the most energy-performing solution is the most convenient: it is essential to perform a cost–performance analysis to identify the most advantageous strategy.
Author Contributions
Funding
Data Availability Statement
Conflicts of Interest
References
- Emissions Grew in 2023, But Clean Energy Is Limiting the Growth. Available online: https://www.iea.org/reports/co2-emissions-in-2023/emissions-grew-in-2023-but-clean-energy-is-limiting-the-growth (accessed on 10 December 2024).
- Pathways for the Energy Mix. Available online: https://www.iea.org/reports/world-energy-outlook-2024/pathways-for-the-energy-mix (accessed on 10 December 2024).
- Massive Expansion of Renewable Power Opens Door to Achieving Global Tripling Goal Set at COP28. Available online: https://www.iea.org/news/massive-expansion-of-renewable-power-opens-door-to-achieving-global-tripling-goal-set-at-cop28 (accessed on 10 December 2024).
- Masters, G.M. Photovoltaic Systems. In Renewable and Efficient Electric Power Systems, 1st ed.; John Wiley & Sons, Inc., Ed.; John Wiley & Sons, Inc.: Hoboken, NJ, USA, 2004; pp. 505–604. [Google Scholar]
- Quaschning, V. Photovoltaic. In Understanding Renewable Energy Systems, 2nd ed.; Routledge, Ed.; Routledge: London, UK, 2016; pp. 156–239. [Google Scholar]
- Serat, Z.; Chen, X.; Zuo, H.; Li, J. Design strategies for building rooftop photovoltaic systems: Efficiency and grid integration. J. Build. Eng. 2025, 100, 111693. [Google Scholar] [CrossRef]
- Zhi, Y.; Sun, T.; Yang, X. A physical model with meteorological forecasting for hourly rooftop photovoltaic power prediction. J. Build. Eng. 2023, 75, 106997. [Google Scholar] [CrossRef]
- Perez Palha, R.; Hüttl, R.M.C.; e Silva, A.J.d.C. BIM interoperability for small residential construction integrating warranty and maintenance management. Autom. Constr. 2024, 166, 105639. [Google Scholar] [CrossRef]
- Alves, J.L.; Palha, R.P.; de Almeida Filho, A.T. BIM-Based Framework for Photovoltaic Systems: Advancing Technologies, Overcoming Challenges, and Enhancing Sustainable Building Performance. Sustainability 2025, 17, 3695. [Google Scholar] [CrossRef]
- Ning, G.; Kan, H.; Zhifeng, Q.; Weihua, G.; Geert, D. e-BIM: A BIM-centric design and analysis software for Building Integrated Photovoltaics. Autom. Constr. 2018, 87, 127–137. [Google Scholar] [CrossRef]
- Ciccozzi, A.; de Rubeis, T.; Paoletti, D.; Ambrosini, A. BIM to BEM for Building Energy Analysis: A Review of Interoperability Strategies. Energies 2023, 16, 7845. [Google Scholar] [CrossRef]
- Ciccozzi, A.; Santavicca, A.; de Rubeis, T.; Ambrosini, A. BIM-BEM interoperability for energy analysis: A comparative study of different strategies. Energy Rep. 2025, 13, 4705–4718. [Google Scholar] [CrossRef]
- Overen, O.K.; Meyer, E.L.; Makaka, G. Daylighting Assessment of a Heritage Place of Instruction and Office Building in Alice, South Africa. Buildings 2023, 13, 1932. [Google Scholar] [CrossRef]
- Ning, G.; Junnan, L.; Yansong, D.; Zhifeng, Q.; Qingshan, J.; Weihua, G.; Geert, D. BIM-based PV system optimization and deployment. Energy Build. 2017, 150, 13–22. [Google Scholar] [CrossRef]
- Maglad, A.M.; Houda, M.; Alrowais, R.; Khan, A.M.; Jameel, M.; Rehman, S.K.U.; Khan, H.; Javed, M.F.; Rehman, M.F. Bimbased energy analysis and optimization using insight 360 (a case study). Case Stud. Constr. Mater. 2023, 18, e01755. [Google Scholar]
- Overen, O.K.; Meyer, E.L. Solar Energy Resources and Photovoltaic Power Potential of an Underutilised Region: A Case of Alice, South Africa. Energies 2022, 15, 4646. [Google Scholar] [CrossRef]
- Mcingani, I.; Meyer, E.L.; Overen, O.K. The Impact of Ambient Weather Conditions and Energy Usage Patterns on the Performance of a Domestic Off-Grid Photovoltaic System. Energies 2024, 17, 5013. [Google Scholar] [CrossRef]
- Lin, Q.; Kensek, K.; Schiler, M.; Choi, J. Streamlining sustainable design in building information modeling BIM-based PV design and analysis tools. Archit. Sci. Rev. 2021, 64, 467–477. [Google Scholar] [CrossRef]
- Salimzadeh, N.; Vahdatikhaki, F.; Hammad, A. Parametric modeling and surface-specific sensitivity analysis of PV module layout on building skin using BIM. Energy Build. 2020, 216, 109953. [Google Scholar] [CrossRef]
- Hamzah, A.H.; Go, Y.I. Design and assessment of building integrated PV (BIPV) system towards net zero energy building for tropical climate. e-Prime-Adv. Electr. Eng. Electron. 2023, 3, 100105. [Google Scholar] [CrossRef]
- Tiagarajan, T.; Go, Y.I. Integration of BIPV design and energy efficient technologies for low energy building in meeting net zero target. e-Prime-Adv. Electr. Eng. Electron. 2024, 8, 100554. [Google Scholar] [CrossRef]
- di Giovanni, G.; Rotilio, M.; Giusti, L.; Muhammad, E. Exploiting building information modeling and machine learning for optimizing rooftop photovoltaic systems. Energy Build. 2024, 133, 114250. [Google Scholar] [CrossRef]
- Lucchi, E.; Agliata, R. HBIM-based workflow for the integration of advanced photovoltaic systems in historical buildings. J. Cult. Herit. 2023, 64, 301–314. [Google Scholar] [CrossRef]
- Vahdatikhaki, F.; Salimzadeh, N.; Hammad, A. Optimization of PV modules layout on high-rise building skins using a BIM-based generative design approach. Energy Build. 2022, 258, 111787. [Google Scholar] [CrossRef]
- de Rubeis, T.; Ciccozzi, A.; Ragnoli, M.; Stornelli, V.; Brusaporci, S.; Tata, A.; Ambrosini, D. A Workflow for a Building Information Modeling-Based Thermo-Hygrometric Digital Twin: An Experimentation in an Existing Building. Sustainability 2024, 16, 10281. [Google Scholar] [CrossRef]
- Macas-Espinosa, V.; Portilla-Sanchez, I.; Gomez, D.; Hidalgo-Leon, R.; Barzola-Monteses, J.; Soriano, G. Assessment of the Energy Efficiency and Cost of Low-Income Housing Based on BIM Considering Material Properties and Energy Modeling in a Tropical Climate. Energies 2025, 18, 1500. [Google Scholar] [CrossRef]
- Yang, R.J.; Zhao, Y.; Jayakumari, S.D.S.; Schneider, A.; Rajan, S.P.; Leloux, J.; Alamy, P.; Raharjo, G.P.; Rende, F.; Samarasinghalage, T.; et al. Digitalising BIPV energy simulation: A cross tool investigation. Energy Build. 2024, 318, 114484. [Google Scholar] [CrossRef]
- Banti, N.; Ciacci, C.; Bazzocchi, F.; Di Naso, V. Enhancing Industrial Buildings’ Performance through Informed Decision Making: A Generative Design for Building-Integrated Photovoltaic and Shading System Optimization. Solar 2024, 4, 401–421. [Google Scholar] [CrossRef]
- Shehata, A.O.; Hassan, A.M.; Shahda, M.M.; Megahed, N.A. Green retrofitting of heritage buildings based on (3Ts) framework: An applied case study. Front. Archit. Res. 2024, 13, 776–798. [Google Scholar] [CrossRef]
- Ji, Y.; Lv, J.; Li, H.X.; Liu, Y.; Yao, F.; Liu, X.; Wang, S. Improving the performance of prefabricated houses through multi-objective optimization design. J. Build. Eng. 2024, 84, 108579. [Google Scholar] [CrossRef]
- Abouelaziz, I.; Jouane, Y. Photogrammetry and deep learning for energy production prediction and building-integrated photovoltaics decarbonization. Build. Simul. 2024, 17, 189–205. [Google Scholar] [CrossRef]
- Homood, A.R.; Albarazanch, S.H.N.; Ekici, S.; Ekici, B.B. Comparison of Performance Evaluation of Grid-Connected PV System for 3D Single Family House Using Building Information Modeling (BIM) Technology: A Case Study in Elazig, Turkey. Int. J. Renew. Energy Res. 2020, 10, 1783–1792. [Google Scholar]
- Emeara, M.S.; AbdelGawad, A.F.; El Abagy, A.H. A Novel Renewable Energy Approach for Cairo International Airport “CIA” based on Building Information Modeling “BIM” with Cost Analysis. J. Adv. Res. Fluid Mech. Therm. Sci. 2021, 85, 80–106. [Google Scholar] [CrossRef]
- Spasevski, S.; Stoilkov, V. Estimating rooftop photovoltaics placement on administrative building using Building Information Modelling. RE&PQJ 2022, 20, 429–433. [Google Scholar]
- Enabling Framework for the Development of BIPV. Available online: https://iea-pvps.org/research-tasks/enabling-framework-for-the-development-of-bipv/ (accessed on 11 December 2024).
- Autodesk Revit. Available online: https://www.autodesk.com/it/products/revit/overview (accessed on 4 July 2025).
- Photovoltaic Geographical Information System (PVGIS). Available online: https://re.jrc.ec.europa.eu/pvg_tools/it/ (accessed on 19 May 2025).
- Solarius-PV. Available online: https://www.acca.it/software-fotovoltaico (accessed on 4 July 2025).
- Perez, R.; Stewart, R.; Seals, R.; Guertin, T. The Development and Verification of the Perez Diffuse Radiation Model; Report Number SAND88-7030; Sandia National Laboratories: Albuquerque, NM, USA; Livermore, CA, USA, 1988. [Google Scholar]
- Surface Radiation Data Set—Heliosat (SARAH)—Edition 3. Available online: https://navigator.eumetsat.int/product/EO:EUM:DAT:0863 (accessed on 19 May 2025).
- ECMWF Reanalysis v5 (ERA5). Available online: https://www.ecmwf.int/en/forecasts/dataset/ecmwf-reanalysis-v5 (accessed on 19 May 2025).
- PVGIS User Manual. Available online: https://joint-research-centre.ec.europa.eu/photovoltaic-geographical-information-system-pvgis/getting-started-pvgis/pvgis-user-manual_en#ref-4-calculating-grid-connected-pv-system-performance (accessed on 4 July 2025).
- UNI 10349-1:2016; Heating and Cooling of Buildings—Climate Data—Part 1: Monthly Averages for the Evaluation of the Thermo-Energy Performance of the Building and Methods for the Distribution of Solar Irradiance into Direct and Diffuse Fractions and for the Calculation of Solar Irradiance on an Inclined Surface. Italian Standardization Body: Milan, Italy, 2016.
- Yu, Q.; Dong, K.; Guo, Z.; Xu, J.; Li, J.; Tan, H.; Jin, Y.; Yuan, J.; Zhang, H.; Liu, J.; et al. Global estimation of building-integrated facade and rooftop photovoltaic potential by integrating 3D building footprint and spatio-temporal datasets. Nexus 2025, 2, 100060. [Google Scholar] [CrossRef]
- Rahdan, P.; Zeyen, E.; Gallego-Castillo, C.; Victoria, M. Distributed photovoltaics provides key benefits for a highly renewable European energy system. Appl. Energy 2024, 360, 122721. [Google Scholar] [CrossRef]
- Trends in PV Applications 2024. Available online: https://iea-pvps.org/trends_reports/trends-in-pv-applications-2024/ (accessed on 2 July 2025).
- Khamharnphol, R.; Kamdar, I.; Waewsak, J.; Chiwamongkhonkarn, S.; Khunpetcha, S.; Kongruang, C.; Gagnon, Y. Techno-Economic Assessment of a 100 kWp Solar Rooftop PV System for Five Hospitals in Central Southern Thailand. International Int. J. Renew. Energy Dev. 2023, 12, 77–86. [Google Scholar] [CrossRef]
- Ren, H.K.; McCulloch, M.; Wallom, D. Optimal Sizing of Solar Photovoltaic and Lithium Battery Storage to Reduce Grid Electricity Reliance in Buildings. In Proceedings of the ECEEE 2022 Summer Study on Energy Efficiency: Agents of Change, Hyères, France, 6–11 June 2022; pp. 1199–1208. [Google Scholar]
- Ciranna, S.; Di Florio, V. Abruzzo: Architetture a Confronto XIX e XX Secolo; Gangemi Editore: Rome, Italy, 2005. [Google Scholar]
- The Climate of L’Aquila. Available online: http://meteorema.aquila.infn.it/tempaq/MR/articoliMR/climalaquila.html (accessed on 13 December 2024).
- The Malaysian Institute of Architects (PAM) Centre. Available online: https://apsda.org/competition/apsda-awards-2021/winner-list/the-malaysian-institute-of-architects-pam-centre/ (accessed on 18 May 2025).
- The New Architecture Icon in Malaysia//The New PAM Centre. Available online: https://livingasean.com/culture/design/architecture-icon-in-malaysia/ (accessed on 18 May 2025).
- Lekbir, A.; Hassani, S.; Mohamad Radzi, P.N.L.; Mekhilef, S.; Tey, K.S.; Abdullahi Mohamed Samatar, A.M.; Alshammari, O. Comprehensive investigation of rooftop photovoltaic power plants with monocrystalline polycrystalline and thin-film technologies for exergy economic and environmental assessments. Sci. Rep. 2025, 15, 15517. [Google Scholar] [CrossRef] [PubMed]
- Basak, A.; Chakraborty, S.; Behura, A.K. Tilt angle optimization for bifacial PV module: Balancing direct and reflected irradiance on white painted ground surfaces. Appl. Energy 2025, 377, 124525. [Google Scholar] [CrossRef]
- FuturaSun Silk Pro. Available online: https://www.futurasun.com (accessed on 4 July 2025).
- CSPL72 MonoPERC 360–375W. Available online: https://www.enfsolar.com/pv/panel-datasheet/crystalline/54014 (accessed on 4 July 2025).
- BN72 Bifacial Modules 375–385W. Available online: https://www.enfsolar.com/pv/panel-datasheet/crystalline/51618 (accessed on 4 July 2025).
- Hanifi, H.; Jaeckel, B.; Pander, M.; Dassler, D.; Kumar, S.; Schneider, J. Techno-Economic Assessment of Half-Cell Modules for Desert Climates: An Overview on Power, Performance, Durability and Costs. Energies 2022, 15, 3219. [Google Scholar] [CrossRef]
- IEA PVPS Country Updates 2024. Available online: https://iea-pvps.org/annual-reports/annual-report-2024-country-updates/ (accessed on 6 June 2025).
- Rodríguez-Gallegos, C.D.; Bieri, M.; Gandhi, O.; Singha, J.P.; Reindl, T.; Panda, S.K. Monofacial vs bifacial Si-based PV modules: Which one is more costeffective? Sol. Energy 2018, 176, 412–438. [Google Scholar] [CrossRef]
- U.S. General Services Administration—3D-4D Building Information Modeling. Available online: https://www.gsa.gov/real-estate/design-and-construction/3d4d-building-information-modeling (accessed on 8 June 2025).
- CORENET X. Available online: https://info.corenet.gov.sg/ (accessed on 8 June 2025).
- Directive 2014/24/EU. Available online: https://eur-lex.europa.eu/eli/dir/2014/24/oj/eng (accessed on 8 June 2025).
- Decree 10.306 of 2020. Available online: https://www.planalto.gov.br/ccivil_03/_ato2019-2022/2020/decreto/D10306.htm (accessed on 8 June 2025).
- Directive 2018/2001/EU. Available online: https://eur-lex.europa.eu/eli/dir/2018/2001/oj/eng (accessed on 8 June 2025).
- Directive 2010/31/EU. Available online: https://eur-lex.europa.eu/eli/dir/2010/31/oj/eng (accessed on 8 June 2025).
- Net Energy Metering (NEM) 3.0. Available online: https://www.seda.gov.my/reportal/nem/ (accessed on 8 June 2025).


| Ref. | Year | Research Topic | Tools |
|---|---|---|---|
| Salimzadeh et al. [19] | 2020 | Parametric modeling for the arrangement of photovoltaic modules based on the surface area. | Revit, CityGML |
| Hamzah et al. [20] | 2023 | Design and evaluation of a BIPV system for a net zero energy building for tropical climates. | Revit, PVsyst |
| Tiagarajan et al. [21] | 2024 | Integration of BIPV design and energy efficiency technologies for low-energy buildings. | Revit Insight 360 |
| Di Giovanni et al. [22] | 2024 | BIM and machine learning integration for rooftop photovoltaic system optimization. | Revit, Solarius-PV |
| Lucchi et al. [23] | 2023 | Development of a collaborative HBIM-based workflow for the integration of PV systems into building stock. | Revit |
| Vahdatikhaki et al. [24] | 2022 | Development of a BIM-based generative design framework for the layout design of photovoltaic modules on the entire external façade of tall buildings. | Revit, CityGML |
| Macas-Espinosa et al. [26] | 2025 | Energy analysis of a residential building. | Revit Insight 360 |
| Yang et al. [27] | 2024 | Evaluation of existing simulation tools for BIPV. | SAM, PV*SOL premium, PVsyst, BIMsolar, Solarius PV, Revit Insight 360, Grasshopper, Skelion for Sketchup |
| Banti et al. [28] | 2024 | Evaluation of retrofit interventions for existing industrial buildings integrating PV solutions into the building envelope. | Grasshopper |
| Shehata et al. [29] | 2024 | Evaluations of different types of eco-sustainable redevelopments to reduce energy consumption and CO2 emissions. | Revit, DesignBuilder, Skelion for Sketchup |
| Ji et al. [30] | 2024 | Proposal of energy efficiency solutions for prefabricated houses. | Revit, DesignBuilder, JEPlus |
| Abouelaziz et al. [31] | 2024 | Photovoltaic production forecasting using BIM and machine learning. | - |
| Homood [32] | 2020 | Performance evaluation of grid-connected PV system for 3D single family house. | Revit, PVsyst, PV*SOL |
| Emeara et al. [33] | 2021 | Energy and economic analysis of a photovoltaic system for an airport | Revit, Green Building Studio, PVsyst |
| Spasevski et al. [34] | 2022 | Analysis of the optimal positioning of photovoltaic modules on the roof of an administrative building. | Solarius-PV |
| Technology | Panel Type | Nominal Power | Efficiency | Temperature | Operating Temperature Range | Temperature Coefficient of Pmax |
|---|---|---|---|---|---|---|
| T1 | FU375M Silk Pro | 375 Wp | 20.59% | 45 °C | ~40~85 °C | −0.35%/°C |
| T2 | CSPL72-MonoPerc375W | 375 Wp | 19.20% | 45 ± 2 °C | ~40~85 °C | −0.38%/°C |
| T3 | BN72 Bifacial Modules375W | 375 Wp | 19.05% | 43.78 ± 2 °C | ~40~85 °C | −0.38%/°C |
| Solution | Matrix | |
|---|---|---|
| S1,B1 | 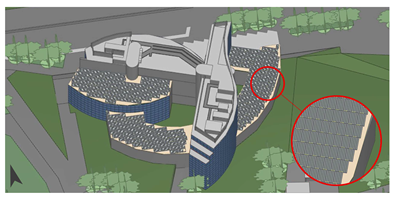 | 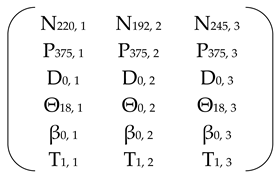 |
| S2,B1 | 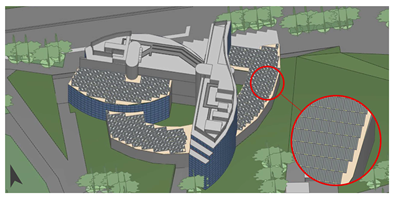 |  |
| S3,B1 | 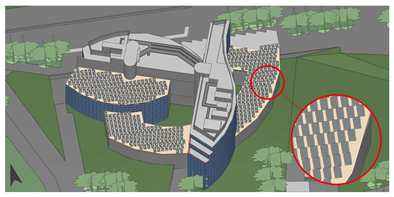 | 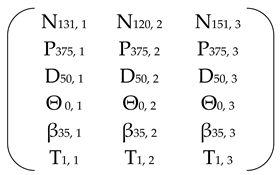 |
| S4,B1 |  | 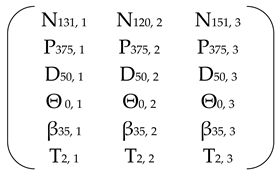 |
| S5,B1 |  | 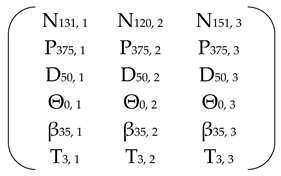 |
| S1,B2 |  | 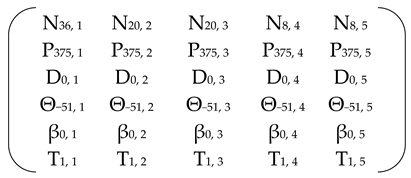 |
| S2,B2 |  | 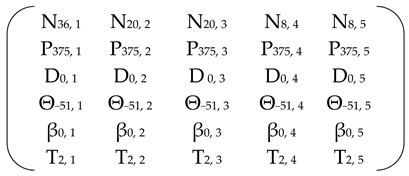 |
| S3,B2 |  | 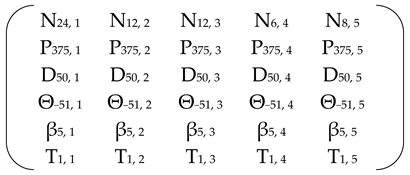 |
| S4,B2 |  |  |
| S5,B2 |  |  |
| S6,B2 | 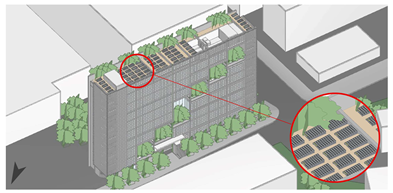 | 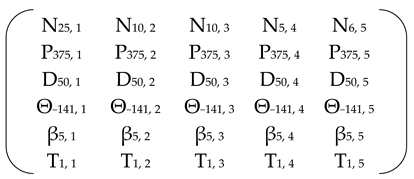 |
| S7,B2 | 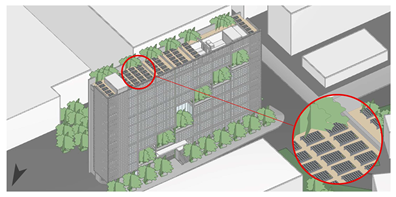 | 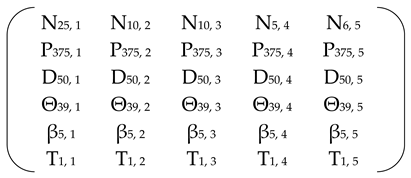 |
| S8,B2 |  | 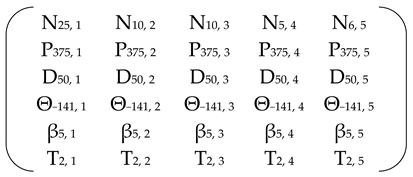 |
| S9,B2 | 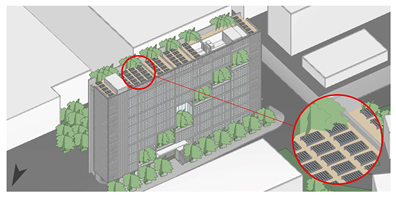 | 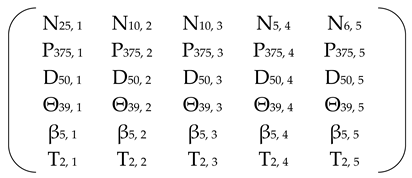 |
| S10,B2 | 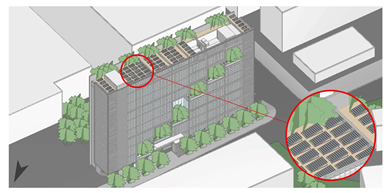 | 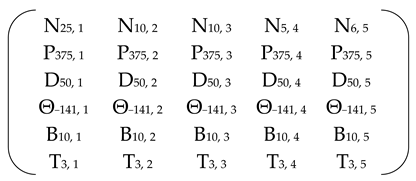 |
| S11,B2 | 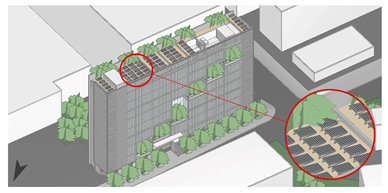 | 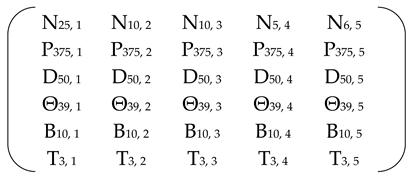 |
| Solution Matrix | Total Installed Power | Energy per kW | Energy Produced Monthly | Total Annual Energy |
|---|---|---|---|---|
| S1,B1 | 246.38 kW | 1119.29 kWh/kW | 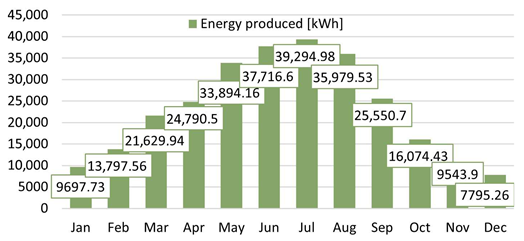 | 275,765.29 kWh |
| S2,B1 | 246.38 kW | 1110.99 kWh/kW |  | 273,720.56 kWh |
| S3,B1 | 150.75 kW | 1250.37 kWh/kW |  | 188,493.54 kWh |
| S4,B1 | 150.75 kW | 1240.39 kWh/kW |  | 186,988.89 kWh |
| S5,B1 | 150.75 kW | 1250.73 kWh/kW |  | 188,547.15 kWh |
| S1,B2 | 34.50 kW | 1357.05 kWh/kW |  | 46,818.08 kWh |
| S2,B2 | 34.50 kW | 1347.26 kWh/kW |  | 46,480.58 kWh |
| S3,B2 | 23.25 kW | 1355.13 kWh/kW |  | 31,506.69 kWh |
| S4,B2 | 23.25 kW | 1345.80 kWh/kW |  | 31,289.78 kWh |
| S5,B2 | 23.25 kW | 1347.25 kWh/kW |  | 31,323.47 kWh |
| S6,B2 | 21.00 kW | 1353.87 kWh/kW |  | 28,431.18 kWh |
| S7,B2 | 21.00 kW | 1355.10 kWh/kW |  | 28,457.04 kWh |
| S8,B2 | 21.00 kW | 1343.04 kWh/kW |  | 28,203.89 kWh |
| S9,B2 | 21.00 kW | 1344.50 kWh/kW |  | 28,234.57 kWh |
| S10,B2 | 21.00 kW | 1343.80 kWh/kW |  | 28,219.90 kWh |
| S11,B2 | 21.00 kW | 1346.48 kWh/kW |  | 28,276.15 kWh |
| Solution Matrix | Energy Produced per kW [kWh/kW] | Cost per kW [USD/kW] | Cost per kWh of Energy Produced [USD/kWh] |
|---|---|---|---|
| S1,B1 | 1119.29 kWh/kW | 250 USD/kW | 0.22 USD/kWh |
| S2,B1 | 1110.99 kWh/kW | 180 USD/kW | 0.16 USD/kWh |
| S3,B1 | 1250.37 kWh/kW | 250 USD/kW | 0.20 USD/kWh |
| S4,B1 | 1240.39 kWh/kW | 180 USD/kW | 0.15 USD/kWh |
| S5,B1 | 1250.73 kWh/kW | 280 USD/kW | 0.22 USD/kWh |
| S1,B2 | 1357.05 kWh/kW | 250 USD/kW | 0.18 USD/kWh |
| S2,B2 | 1347.26 kWh/kW | 180 USD/kW | 0.13 USD/kWh |
| S3,B2 | 1355.13 kWh/kW | 250 USD/kW | 0.18 USD/kWh |
| S4,B2 | 1345.80 kWh/kW | 180 USD/kW | 0.13 USD/kWh |
| S5,B2 | 1347.25 kWh/kW | 280 USD/kW | 0.21 USD/kWh |
| S6,B2 | 1353.87 kWh/kW | 250 USD/kW | 0.18 USD/kWh |
| S7,B2 | 1355.10 kWh/kW | 250 USD/kW | 0.18 USD/kWh |
| S8,B2 | 1343.04 kWh/kW | 180 USD/kW | 0.13 USD/kWh |
| S9,B2 | 1344.50 kWh/kW | 180 USD/kW | 0.13 USD/kWh |
| S10,B2 | 1343.80 kWh/kW | 280 USD/kW | 0.21 USD/kWh |
| S11,B2 | 1346.48 kWh/kW | 280 USD/kW | 0.21 USD/kWh |
Disclaimer/Publisher’s Note: The statements, opinions and data contained in all publications are solely those of the individual author(s) and contributor(s) and not of MDPI and/or the editor(s). MDPI and/or the editor(s) disclaim responsibility for any injury to people or property resulting from any ideas, methods, instructions or products referred to in the content. |
© 2025 by the authors. Licensee MDPI, Basel, Switzerland. This article is an open access article distributed under the terms and conditions of the Creative Commons Attribution (CC BY) license (https://creativecommons.org/licenses/by/4.0/).
Share and Cite
Ciccozzi, A.; de Rubeis, T.; Go, Y.I.; Ambrosini, D. PV System Design in Different Climates: A BIM-Based Methodology. Energies 2025, 18, 3866. https://doi.org/10.3390/en18143866
Ciccozzi A, de Rubeis T, Go YI, Ambrosini D. PV System Design in Different Climates: A BIM-Based Methodology. Energies. 2025; 18(14):3866. https://doi.org/10.3390/en18143866
Chicago/Turabian StyleCiccozzi, Annamaria, Tullio de Rubeis, Yun Ii Go, and Dario Ambrosini. 2025. "PV System Design in Different Climates: A BIM-Based Methodology" Energies 18, no. 14: 3866. https://doi.org/10.3390/en18143866
APA StyleCiccozzi, A., de Rubeis, T., Go, Y. I., & Ambrosini, D. (2025). PV System Design in Different Climates: A BIM-Based Methodology. Energies, 18(14), 3866. https://doi.org/10.3390/en18143866