Article

Evaluation Method of Gas Production in Shale Gas Reservoirs in Jiaoshiban Block, Fuling Gas Field

1
Sinopec Matrix Co., Ltd., Qingdao 266075, China
2
Department of Geography, Hong Kong Baptist University, Hong Kong 999077, China
3
School of Energy Resources, China University of Geosciences, Beijing 100083, China
*
Author to whom correspondence should be addressed.
Energies 2025, 18(14), 3817; https://doi.org/10.3390/en18143817
Submission received: 19 June 2025 / Revised: 10 July 2025 / Accepted: 16 July 2025 / Published: 17 July 2025

Abstract

The gas-production potential of shale gas is a comprehensive evaluation metric that assesses the reservoir quality, gas-content properties, and gas-production capacity. Currently, the evaluation of gas-production potential is generally conducted through qualitative comparisons of relevant parameters, which can lead to multiple solutions and make it difficult to establish a comprehensive evaluation index. This paper introduces a gas-production potential evaluation method based on the Analytic Hierarchy Process (AHP). It uses judgment matrices to analyze key parameters such as gas content, brittleness index, total organic carbon content, the length of high-quality gas-layer horizontal sections, porosity, gas saturation, formation pressure, and formation density. By integrating fuzzy mathematics, a mathematical model for gas-production potential is established, and corresponding gas-production levels are defined. The model categorizes gas-production potential into four levels: when the gas-production index exceeds 0.65, it is classified as a super-high-production well; when the gas-production index is between 0.45 and 0.65, it is classified as a high-production well; when the gas-production index is between 0.35 and 0.45, it is classified as a medium-production well; and when the gas-production index is below 0.35, it is classified as a low-production well. Field applications have shown that this model can accurately predict the gas-production potential of shale gas wells, showing a strong correlation with the unobstructed flow rate of gas wells, and demonstrating broad applicability.

1. Introduction

Shale gas, a highly efficient clean energy source, has gained significant attention in the international energy market [1,2]. In recent years, China has also placed a high emphasis on the exploration and development of shale gas. Currently, the large-scale development of shale in China is primarily marine shale, mainly from the Upper Ordovician Wufeng Formation to the Lower Silurian Longmaxi Formation in the Sichuan Basin [3]. The successful development of this shale has spurred the transformation and growth of Chinese oil companies, gradually reshaping China’s energy structure. Jin Zhijun et al. [4]. conducted research on the factors controlling shale gas enrichment and high production, proposing that shale gas exhibits a “five-character integrated” dual sweet spot characteristic; Liang Xing et al. [5]. proposed an evaluation index system for complex mountainous shale gas selection areas in southern China, outlining ten key indicators for shale gas evaluation. Xu Bingxiang et al. developed a production prediction model based on reservoir gas content, shale gas seepage mechanisms, and reservoir fracturing characteristics. Previous evaluation methods have primarily focused on enrichment models and reservoir index evaluations, but there has been relatively less research on the gas-producing properties of shale.
Shale gas-production potential is a comprehensive evaluation of reservoir quality, the gas content of reservoir fluids, and their gas-production capacity [6,7,8]. It provides a clear indication of the potential for shale gas well development. Therefore, evaluating gas-production potential is a crucial part of shale gas assessment, helping geologists and petroleum engineers better understand the gas-production capabilities of the wells being developed. Despite significant advancements in the mechanisms of shale gas formation, resource potential, and reservoir evaluation, the analysis of horizontal well gas-production potential is still in its early stages. Currently, gas-production potential evaluations often rely on vague qualitative comparisons of influencing parameters, making it difficult to establish a comprehensive evaluation index. Thus, there is a need for a method to comprehensively quantify these evaluation parameters, thereby enhancing the reliability of the assessments.
Therefore, based on previous studies on shale gas reservoir evaluation, this study uses the Analytic Hierarchy Process to establish the judgment matrix and fuzzy matrix model to discuss the classification of shale gas-production evaluation level, so as to provide a reference for shale gas-production evaluation and enrich the existing shale gas-production evaluation methods.

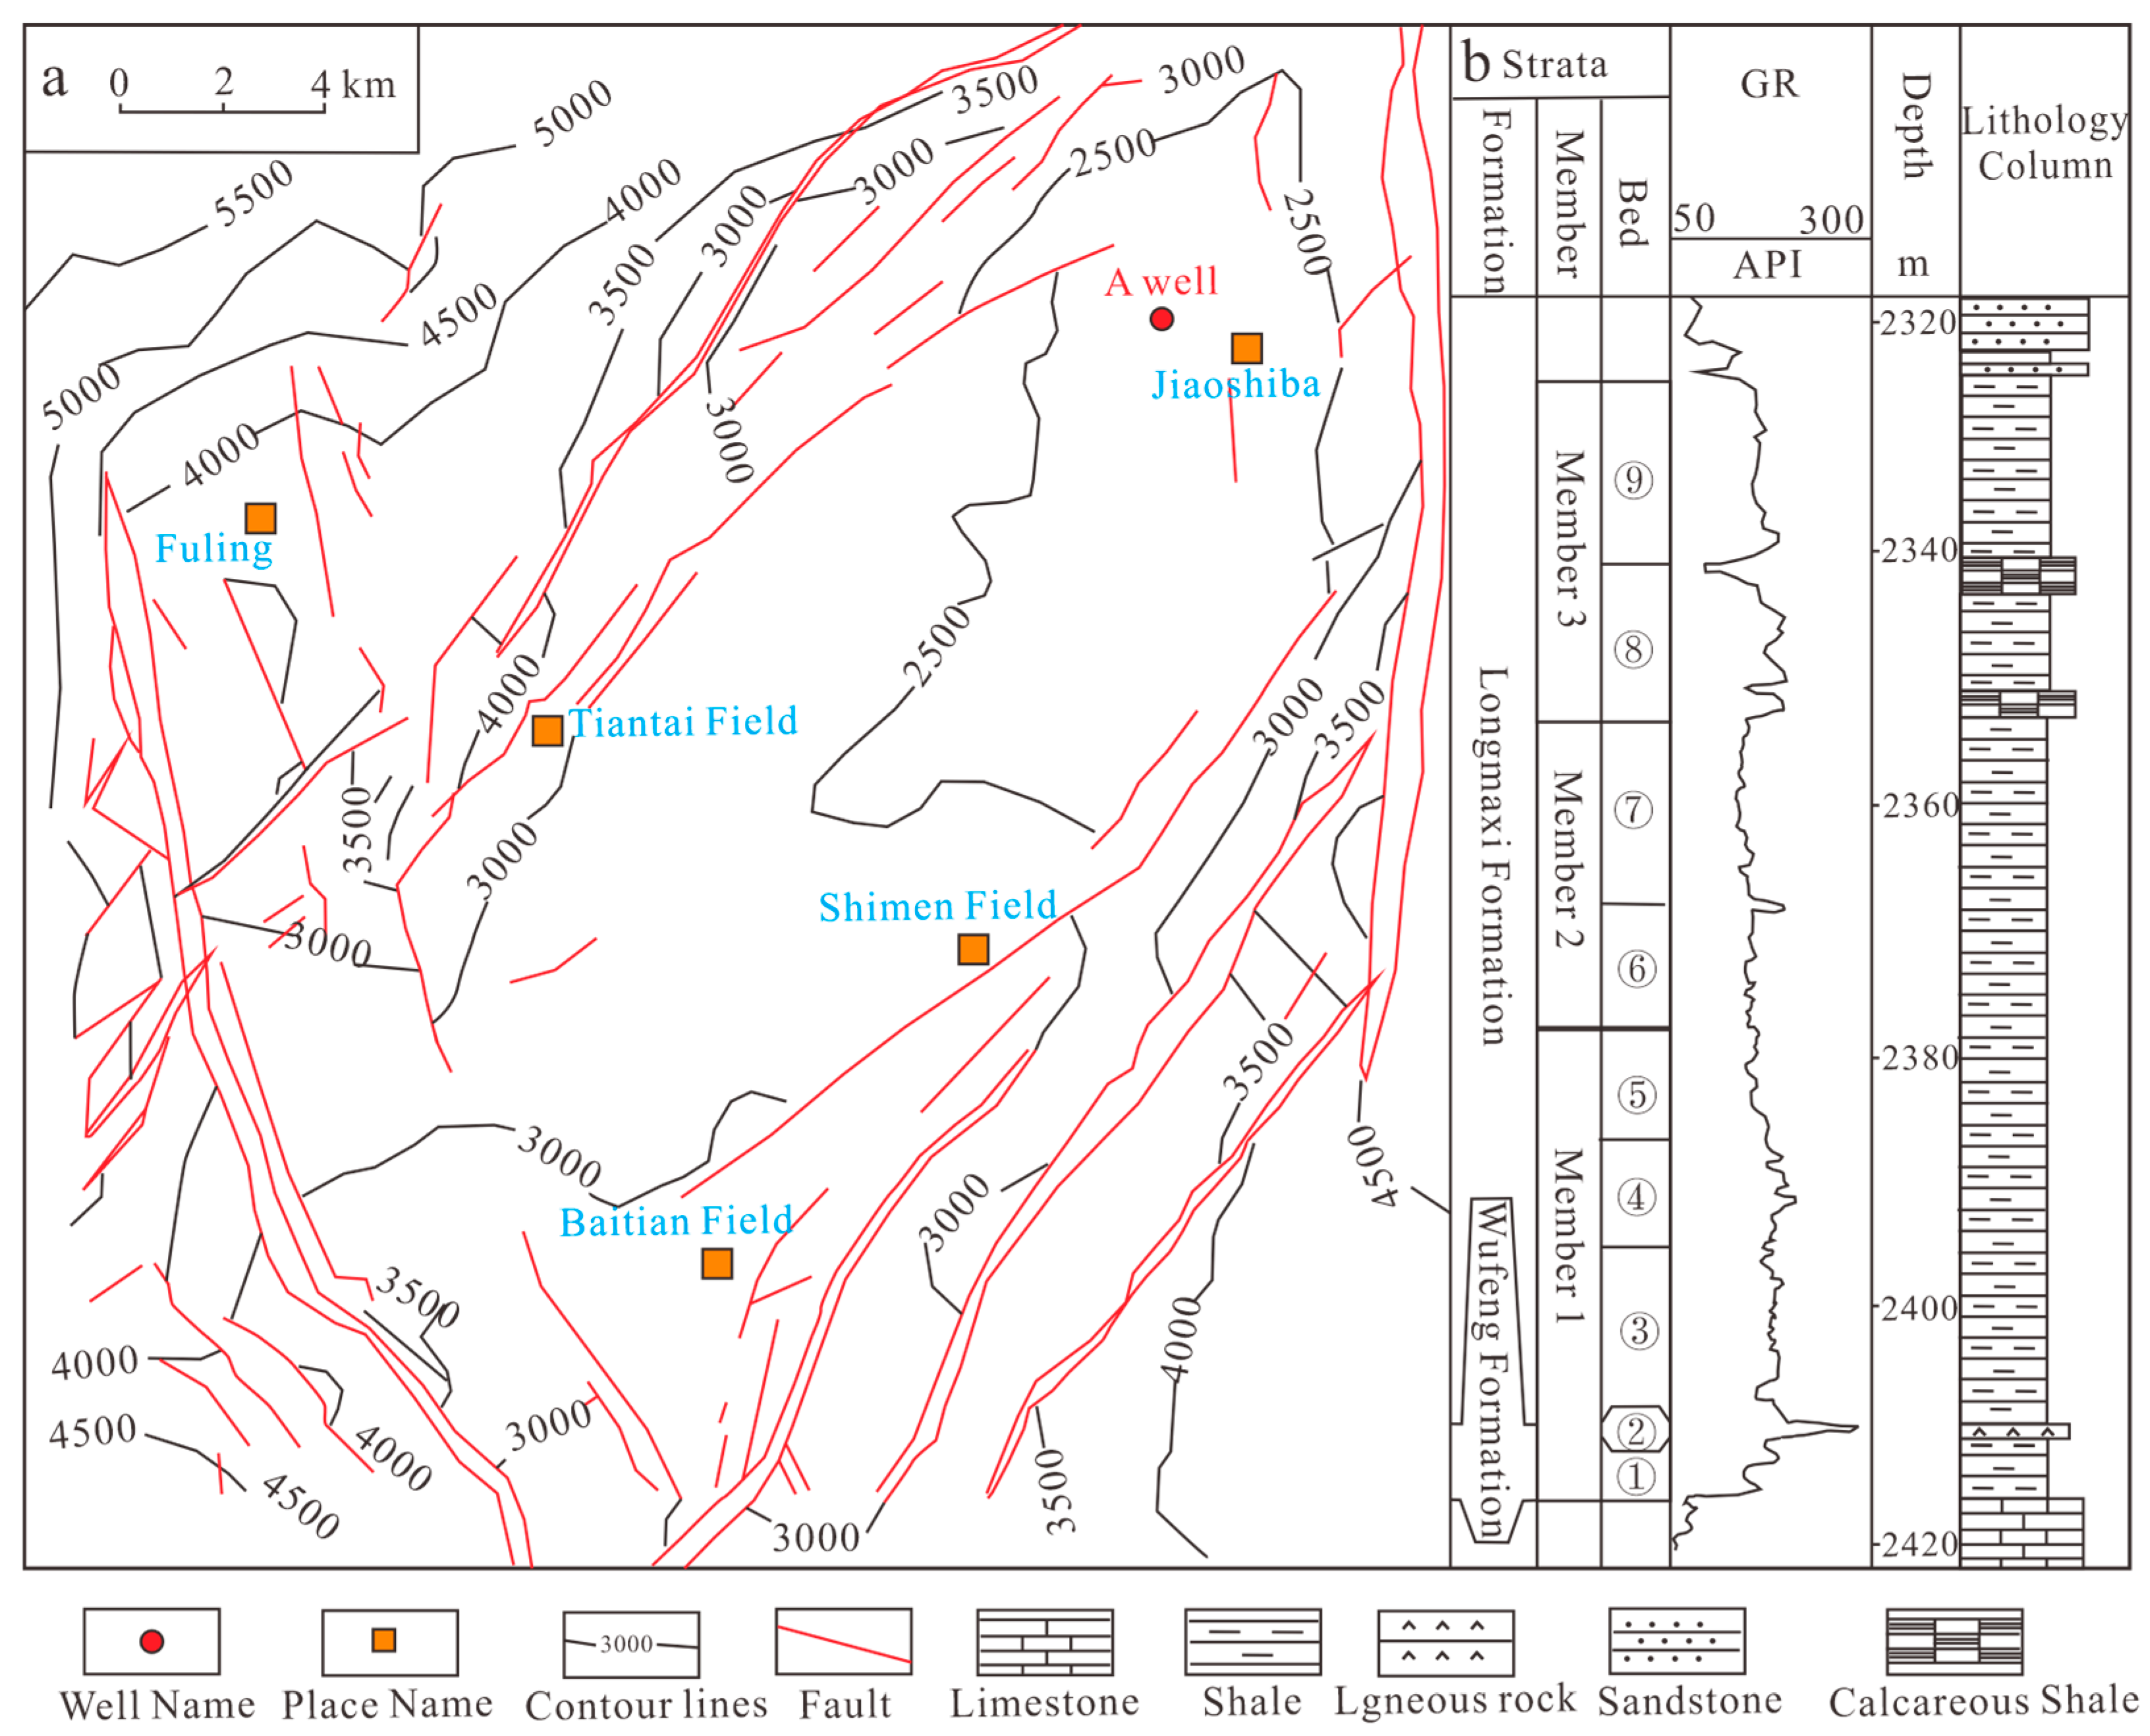
2. Overview of the Research Area

The Fuling shale gas field is China’s first large-scale shale gas field to achieve commercial development and is also a national-level shale gas demonstration area [9,10,11]. To date, the Fuling shale gas field has accumulated nearly 900 billion cubic meters of proven reserves, accounting for 34% of the country’s total proven shale gas reserves [11,12]. The Jiaoshiban block, the main area of the Fuling shale gas field, is in Jiaoshi Town, Fuling District, Chongqing City, and is part of the southeastern Baguan–Jiaoshiban anticline zone of the eastern Sichuan high-steep fold belt. The primary target strata are the Ordovician Wufeng Formation and the Silurian Longmaxi Formation (Figure 1a). Based on geological data from drilling, logging, recording, and core observations in the study area, the shale layer is divided into three sections and nine sub-sections from bottom to top (Figure 1b). Among these, the 1st to 5th sub-sections have excellent overall reservoir conditions and are the primary shale gas layers for horizontal well drilling.

3. Methodology

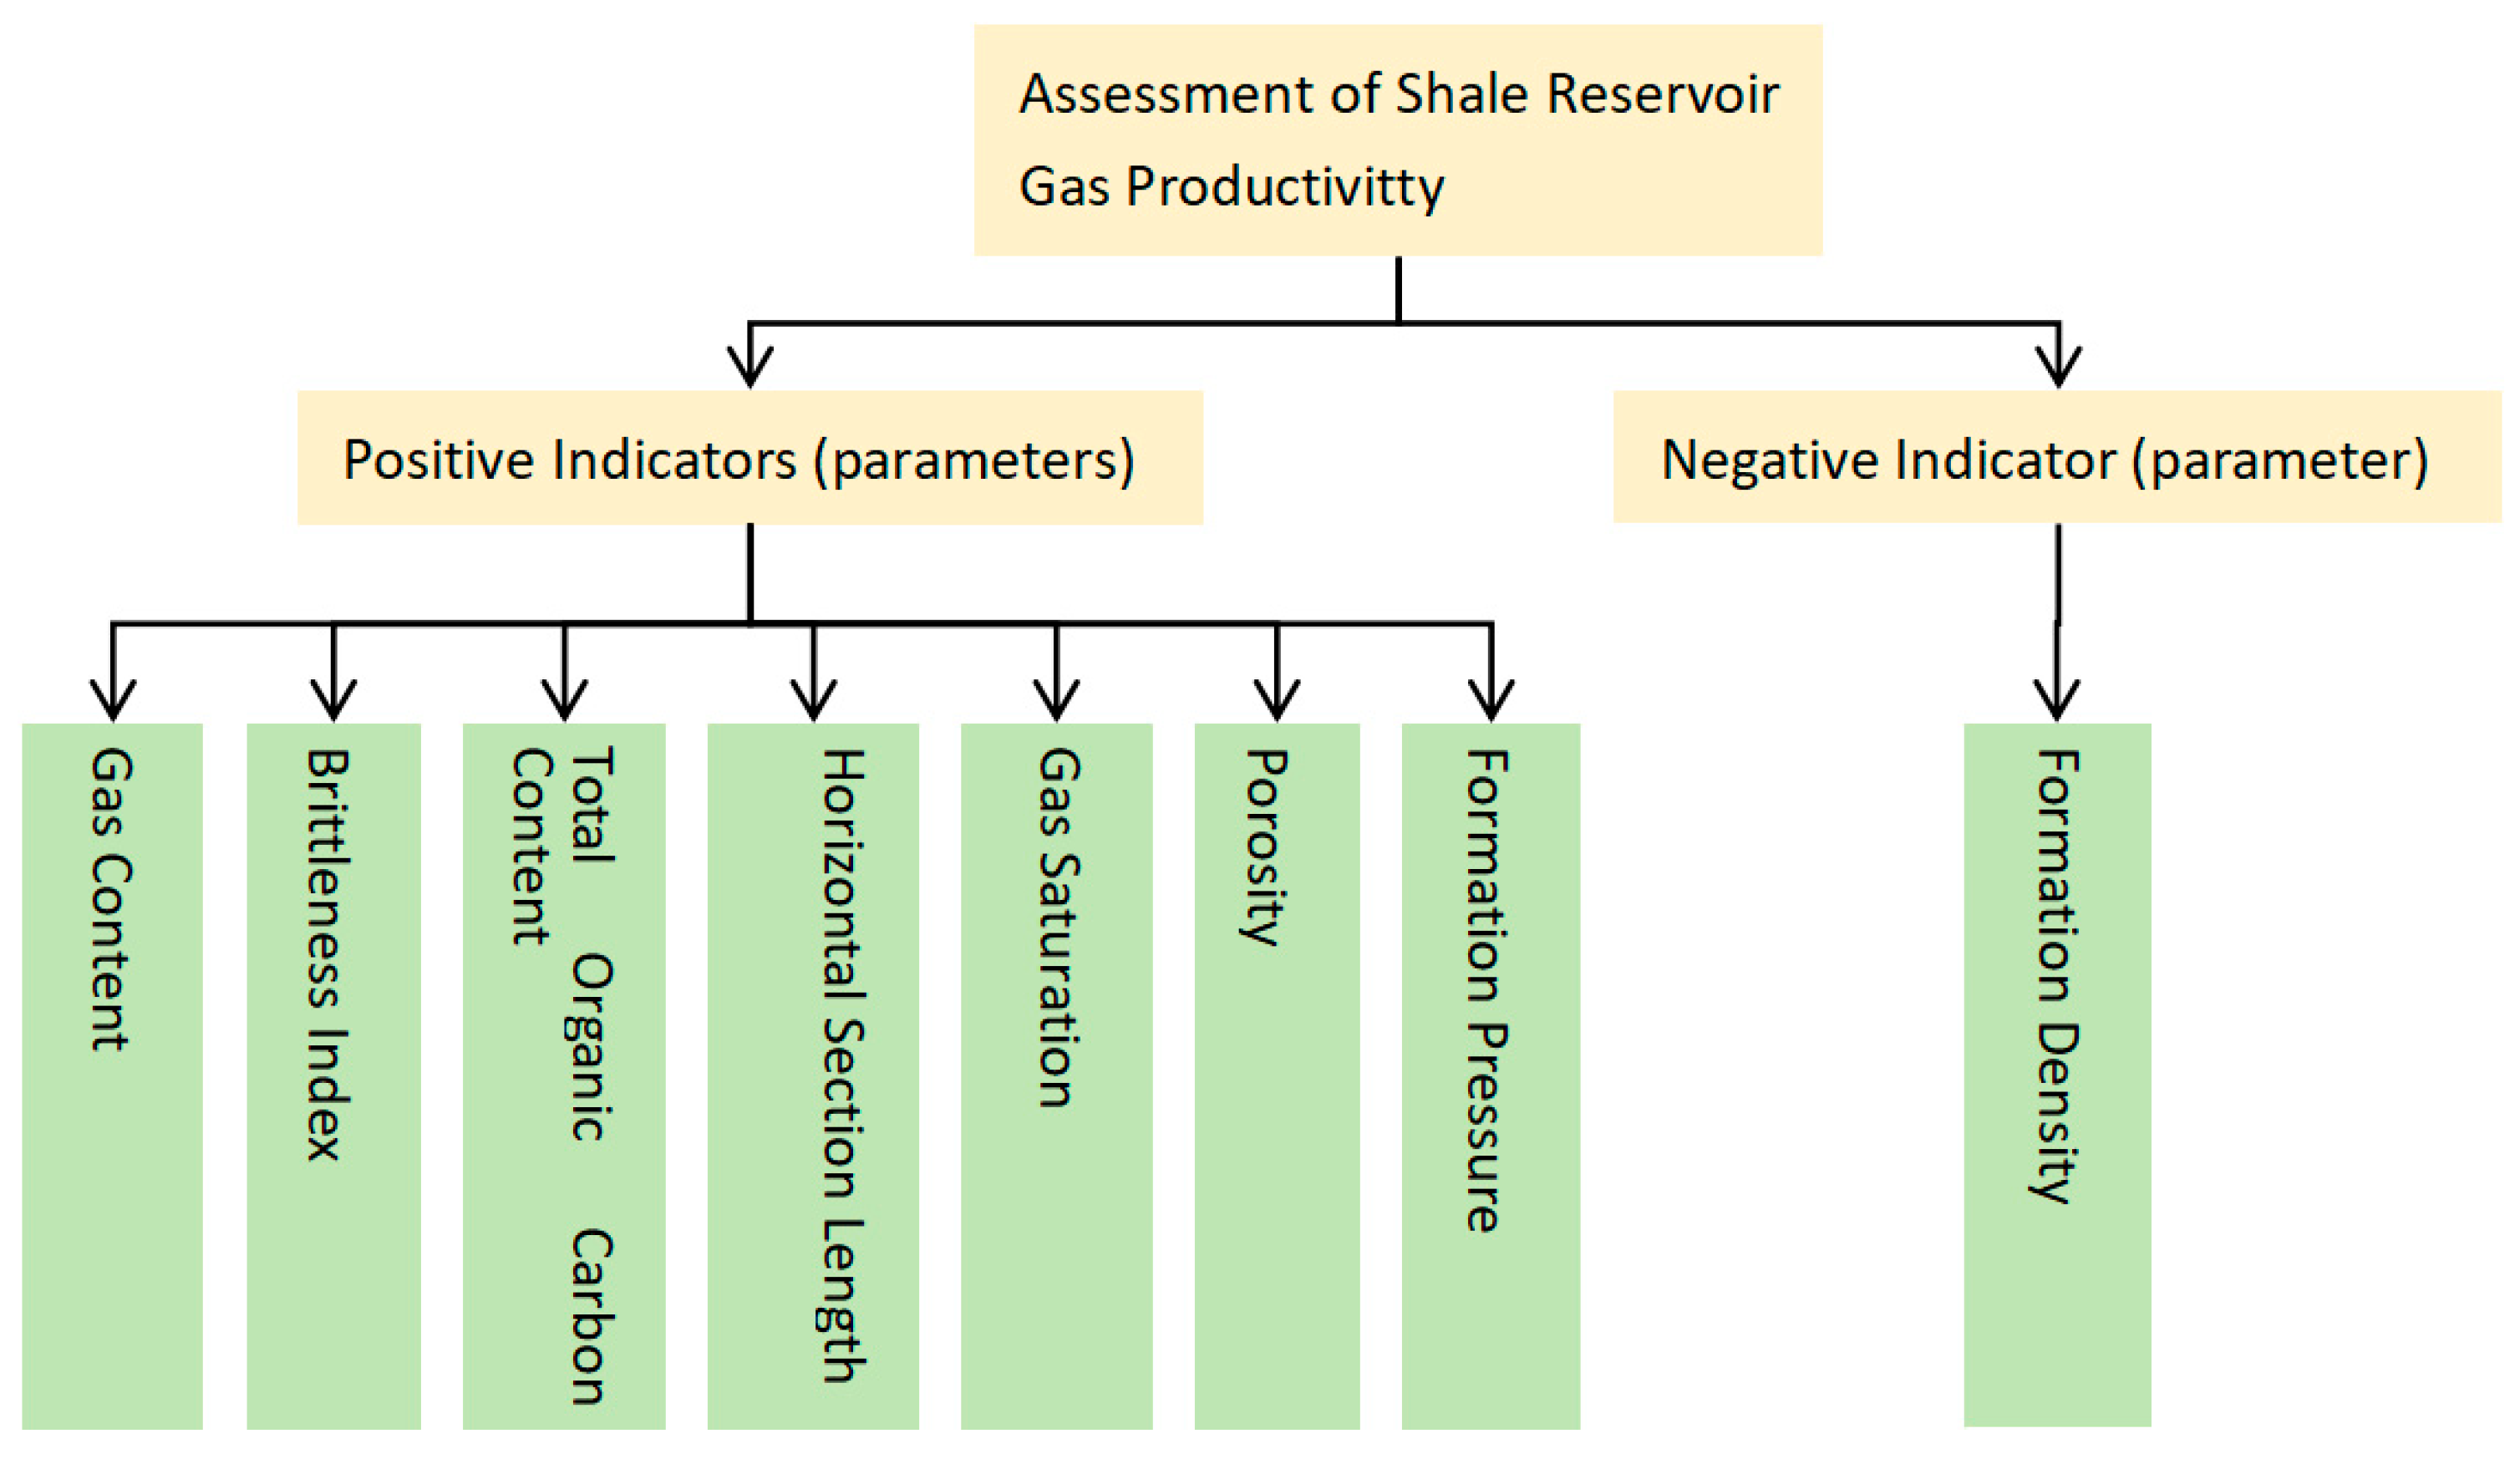
3.1. Selection of Shale Gas-Production Evaluation Parameters

When selecting the parameters affecting shale gas production, the key reservoir evaluation parameters, namely porosity (POR) and gas saturation (Sg) [13,14], should be considered first. Next, the main controlling factor of shale gas enrichment [15]: total organic carbon (TOC), which is a critical indicator for evaluating organic matter abundance, can measure the hydrocarbon generation intensity and quantity of source rocks. As a “self-generated, self-stored, and self-preserved” reservoir, the TOC level in the reservoir indirectly reflects the potential of the reservoir, making it one of the parameters affecting gas production. Organic matter density is generally low, around 1.0 g/cm3. The typical clay mineral framework density is about 2.7 g/cm3. Therefore, when the formation is rich in organic matter, the rock density decreases, and the formation density (DEN) can clearly distinguish between reservoir and non-reservoir formations, as well as indirectly indicate the development of organic matter, which is also an important indicator for evaluating the potential of shale gas production. Formation pressure (PP) is another indicator for assessing the preservation conditions of shale gas. Overpressure in shale reservoirs indicates better preservation conditions for marine shale gas reservoirs, while low pressure suggests poor preservation conditions, making formation pressure another important evaluation indicator. Shale gas primarily exists in adsorbed and free states in low-porosity, low-permeability shale, and its gas content (Gt) directly affects the gas well’s production capacity, cumulative output, and well life [8,16], making it the most intuitive indicator for evaluating shale gas production.
Furthermore, shale gas extraction requires segmented fracturing using ultra-long horizontal wells. The Brittle Index (BRIT) is a key indicator for assessing whether shale can be successfully fractured and whether the gas well can achieve high production [17]. Therefore, the Brittle Index is also an important metric for evaluating gas-production potential. The length (L) of the horizontal section that the well penetrates through high-quality gas layers is another critical external factor affecting shale gas-production capacity, and thus should also be considered an important metric for gas-production evaluation [18]. This paper selects eight parameters—gas content, Brittle Index, Total Organic Carbon (TOC), the length of the horizontal section through high-quality gas layers, porosity, gas saturation, formation pressure, and density—to evaluate gas-production potential.

3.2. Establishment of Gas-Production Evaluation Model

3.2.1. The Weight of Gas-Production Evaluation Parameters Is Determined by the Analytic Hierarchy Process

The weight of gas-production evaluation parameters is determined by the Analytic Hierarchy Process (AHP). This method is a multi-indicator (parameter) weight analysis method, which comprehensively determines qualitative and quantitative analysis, represents complex problems through a hierarchical structure, hierarchizes them, and finally provides a basis for decision-making by mathematical methods [19,20].
(1)
Judgment Matrix is Established
Before establishing the judgment matrix, the gas-producing issues should be hierarchized. Based on the relationship between shale gas production and relevant evaluation parameters, these parameters are categorized into positive indicators and negative indicators. Among them, the seven parameters of gas content, total organic carbon content (TOC), porosity, gas saturation, formation pressure, brittleness index, and horizontal length of high-quality gas reservoirs are positive indicators; formation density is categorized as a negative indicator (Figure 2).
The judgment matrix represents the degree of importance between elements at a certain layer relative to elements at the upper layer [19], and uses the proportion scale of 1–5 to represent this degree of importance (Table 1). Before establishing the judgment matrix, researchers need to subjectively judge the importance of pairwise parameter comparisons based on their experience. We refer to the idea of the Delphi method (expert evaluation method) and ask several researchers with shale gas research experience to judge the scale of pairwise parameter importance. Finally, these researchers reached a consensus and established the judgment matrix A (Table 2).
(2)
Weight Calculation
The maximum eigenvalue and its corresponding eigenvector of matrix A are calculated using the sum method to determine the weight of each evaluation parameter of gas production, and the equation is as follows:
a i j ¯ = a i j / k = 1 n a k j ( i , j = 1 , 2 , , n )
w i ¯ = j = 1 n a i j ¯ ( i , j = 1 , 2 , , n )
w i = w i ¯ / j = 1 n w i ¯ ( i , j = 1 , 2 , , n )
w = w 1 , w 2 , , w n T
where aij is the element of the judgment matrix A; w is the sought eigenvector (that is, the weight value of each element).
The eigenvectors are obtained by calculation as w = [0.328, 0.199, 0.127, 0.127, 0.072, 0.072, 0.045, 0.029]T. The corresponding weights for gas content, brittleness index, total organic carbon content, length, porosity, gas saturation, formation pressure, and density are 0.328, 0.199, 0.127, 0.127, 0.072, 0.072, 0.045, and 0.029, respectively.
(3)
Consistency Check
Due to various factors such as the complexity of objective things and the diversity of subjective cognition, it is necessary to conduct consistency checks on the judgment matrix to prevent contradictory situations among parameters and to avoid interference from other factors. The verification equation is:
λ max = 1 / n i = 1 n ( j = 1 n a i j × w j / w i ) ( i , j = 1 , 2 , , n )
C I = ( λ max n ) / ( n 1 )
C R = C I / R I
where λmax is the characteristic root of the judgment matrix, dimensionless; CI is the general consistency index of the judgment matrix, dimensionless; RI is the average random consistency index of the judgment matrix, dimensionless, specific values are shown in Table 3; CR is the tandem consistency ratio of the judgment matrix, dimensionless.
Generally, CR ≤ 0.1, which indicates that the consistency of the judgment matrix can be accepted; CR > 0.1, which indicates that the judgment matrix needs to be appropriately modified. Using Equations (5)–(7), calculate the consistency ratio CR = 0.061 < 0.1 for the judgment matrix, which is consistent with the consistency check.

3.2.2. Fuzzy Mathematics Method to Determine the Fuzzy Matrix of Gas-Production Evaluation Parameters

(1)
Establishment of Factor Set
Based on the gas-production evaluation parameters, a factor set is established:
U = {gas content, brittleness index, total organic carbon content, length, porosity, gas saturation, formation pressure, density}.
(2)
Establishment of Evaluation Sets
Shale gas horizontal wells in the selected block were taken as the evaluation objects, and the relative exploitation potential of shale gas production of different wells was quantitatively evaluated. The evaluation set is a collection of various possible evaluation objects, and the evaluation set of gas production is V = {well No. 1, well No. 2, well No. 3,…, well No. m}.
(3)
Data Normalization
Due to the different units, dimensions, and numerical ranges of various evaluation parameters for gas production, it is necessary to normalize these parameters for easier comparison. Generally, higher gas content, a higher Brittle Index, total organic carbon content, the length of high-quality gas-bearing sections, porosity, gas saturation, and formation pressure in shale can enhance its gas-production capacity, which are positive indicators. Conversely, higher density and tighter reservoirs may reduce gas-production capacity, which makes them negative indicators (Figure 2).
Normalization of positive indicators, equation:
S = I I min I max I min
Normalization of negative indicators, equation:
S = I max I I max I min
where S is the standard value of the evaluation parameter; I is the actual value of the evaluation parameter; Imin is the minimum value of the evaluation parameter; Imax is the maximum value of the evaluation parameter.
The normalized result is taken as the membership degree, and the membership degree of the n-th element in the factor set to the m-th element in the evaluation set is expressed as Rmn. The fuzzy matrix R (Table 4) is established.

3.2.3. Establishment of Comprehensive Gas-Production Evaluation Model

In order to comprehensively evaluate the gas production of shale gas reservoirs, based on single parameter evaluation, the method combining hierarchical analysis and fuzzy mathematics is used to establish a mathematical model of multi-parameter comprehensive evaluation of the relative size of gas production of shale gas through fuzzy matrix. We define it as the gas-production index Igp, and the equation is:
I gp = R w = R 11 R 17 R m i R m 5 0.328 , 0.199 , 0.127 , 0.127 , 0.072 , 0.072 , 0.045 , 0.029 T
The higher the gas-production index Igp, the better the gas production, and the higher the development capacity is usually. Therefore, we divide the gas-production level by combining the gas-production index Igp with the unobstructed flow of a single well test.

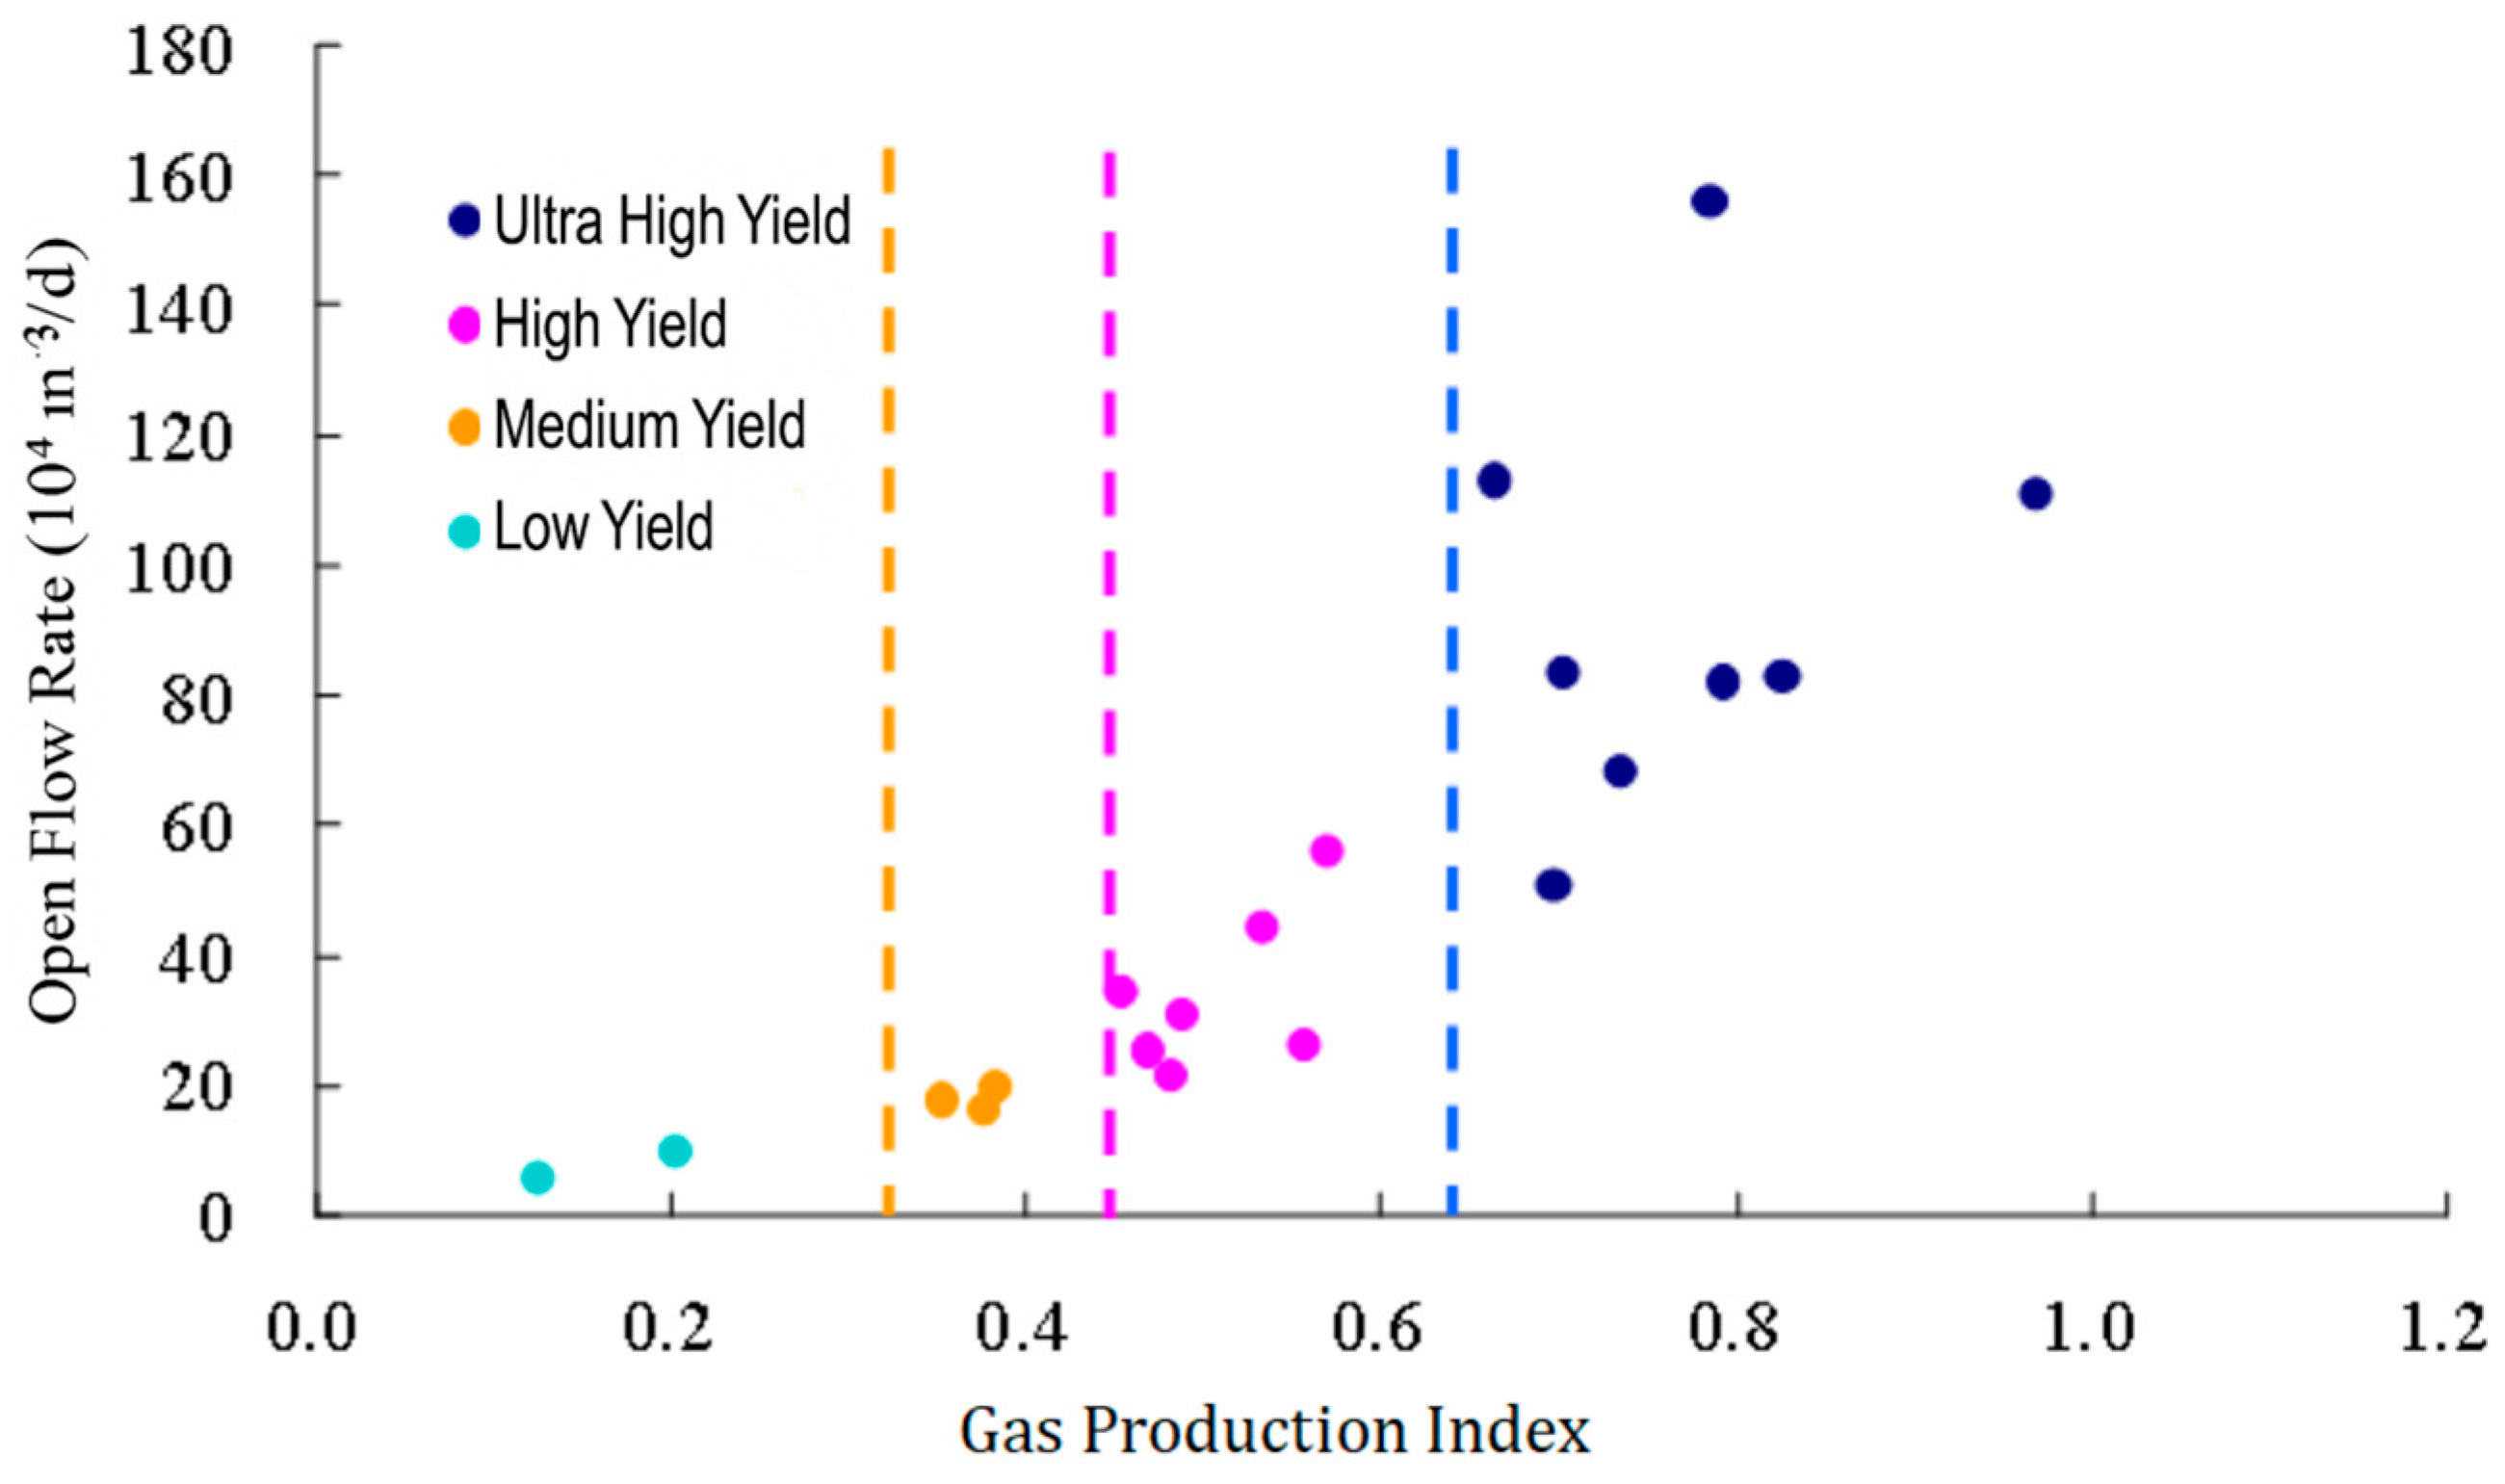
3.3. Classification of Gas-Production Level of Shale in the Study Area

The Jiaoshiba block of the Fuling shale gas field in the Sichuan Basin was selected as the research area for gas-production evaluation. Under the premise of ensuring that the horizontal well section is far away from the large fault, 20 wells that have been tested for gas development were randomly selected as research wells. The logging data of these wells were standardized accordingly, and the calculation model suitable for the Fuling shale gas field was used to calculate the total organic carbon content, porosity, gas saturation, formation pressure, and gas content. The gas production of shale gas is analyzed using the aforementioned model. After normalizing the parameters, a fuzzy matrix R (Table 5) is established.
The data of the fuzzy matrix in Table 5 are brought into Equation (10) to obtain the gas-production index of 20 wells, that is:
Igp = [0.70, 0.47, 0.79, 0.38, 0.78, 0.12, 0.55, 0.66, 0.82, 0.97, 0.45, 0.48, 0.57, 0.53, 0.35, 0.73, 0.70, 0.49, 0.20, 0.34]T
Based on the calculation results, a gas-production index versus unobstructed flow rate intersection chart (Figure 3) for different wells was created. Typically, in shale gas extraction, an unobstructed flow rate of 50 × 104 m3/d or more is considered ultra-high production; 20 × 104 to 50 × 104 m3/d is high production; 10 × 104 to 20 × 104 m3/d is medium production; and less than 10 × 104 m3/d is low production. The open flow rate of 20 horizontal wells has a good linear correlation with the gas-production index (Igp), with a determination coefficient R2 of 0.70. By comparing the calculated gas-production indices of 20 horizontal wells in the study area with actual test results, it was found that: the gas-production index Igp for ultra-high-production wells is generally above 0.65, for high-production wells it ranges from 0.45 to 0.65, for medium-production wells it ranges from 0.35 to 0.45, and for low-production wells it is below 0.35 (Figure 1, Table 6).
Based on the analysis and comparison results, gas production is categorized into four levels: when the gas-production index exceeds 0.65, shale gas wells can achieve ultra-high production; when the gas-production index ranges from 0.45 to 0.65, shale gas wells may achieve high production; when the gas-production index is between 0.35 and 0.45, shale gas wells may achieve medium production; when the gas-production index is below 0.35, shale gas wells may achieve low production.

4. Results and Discussion
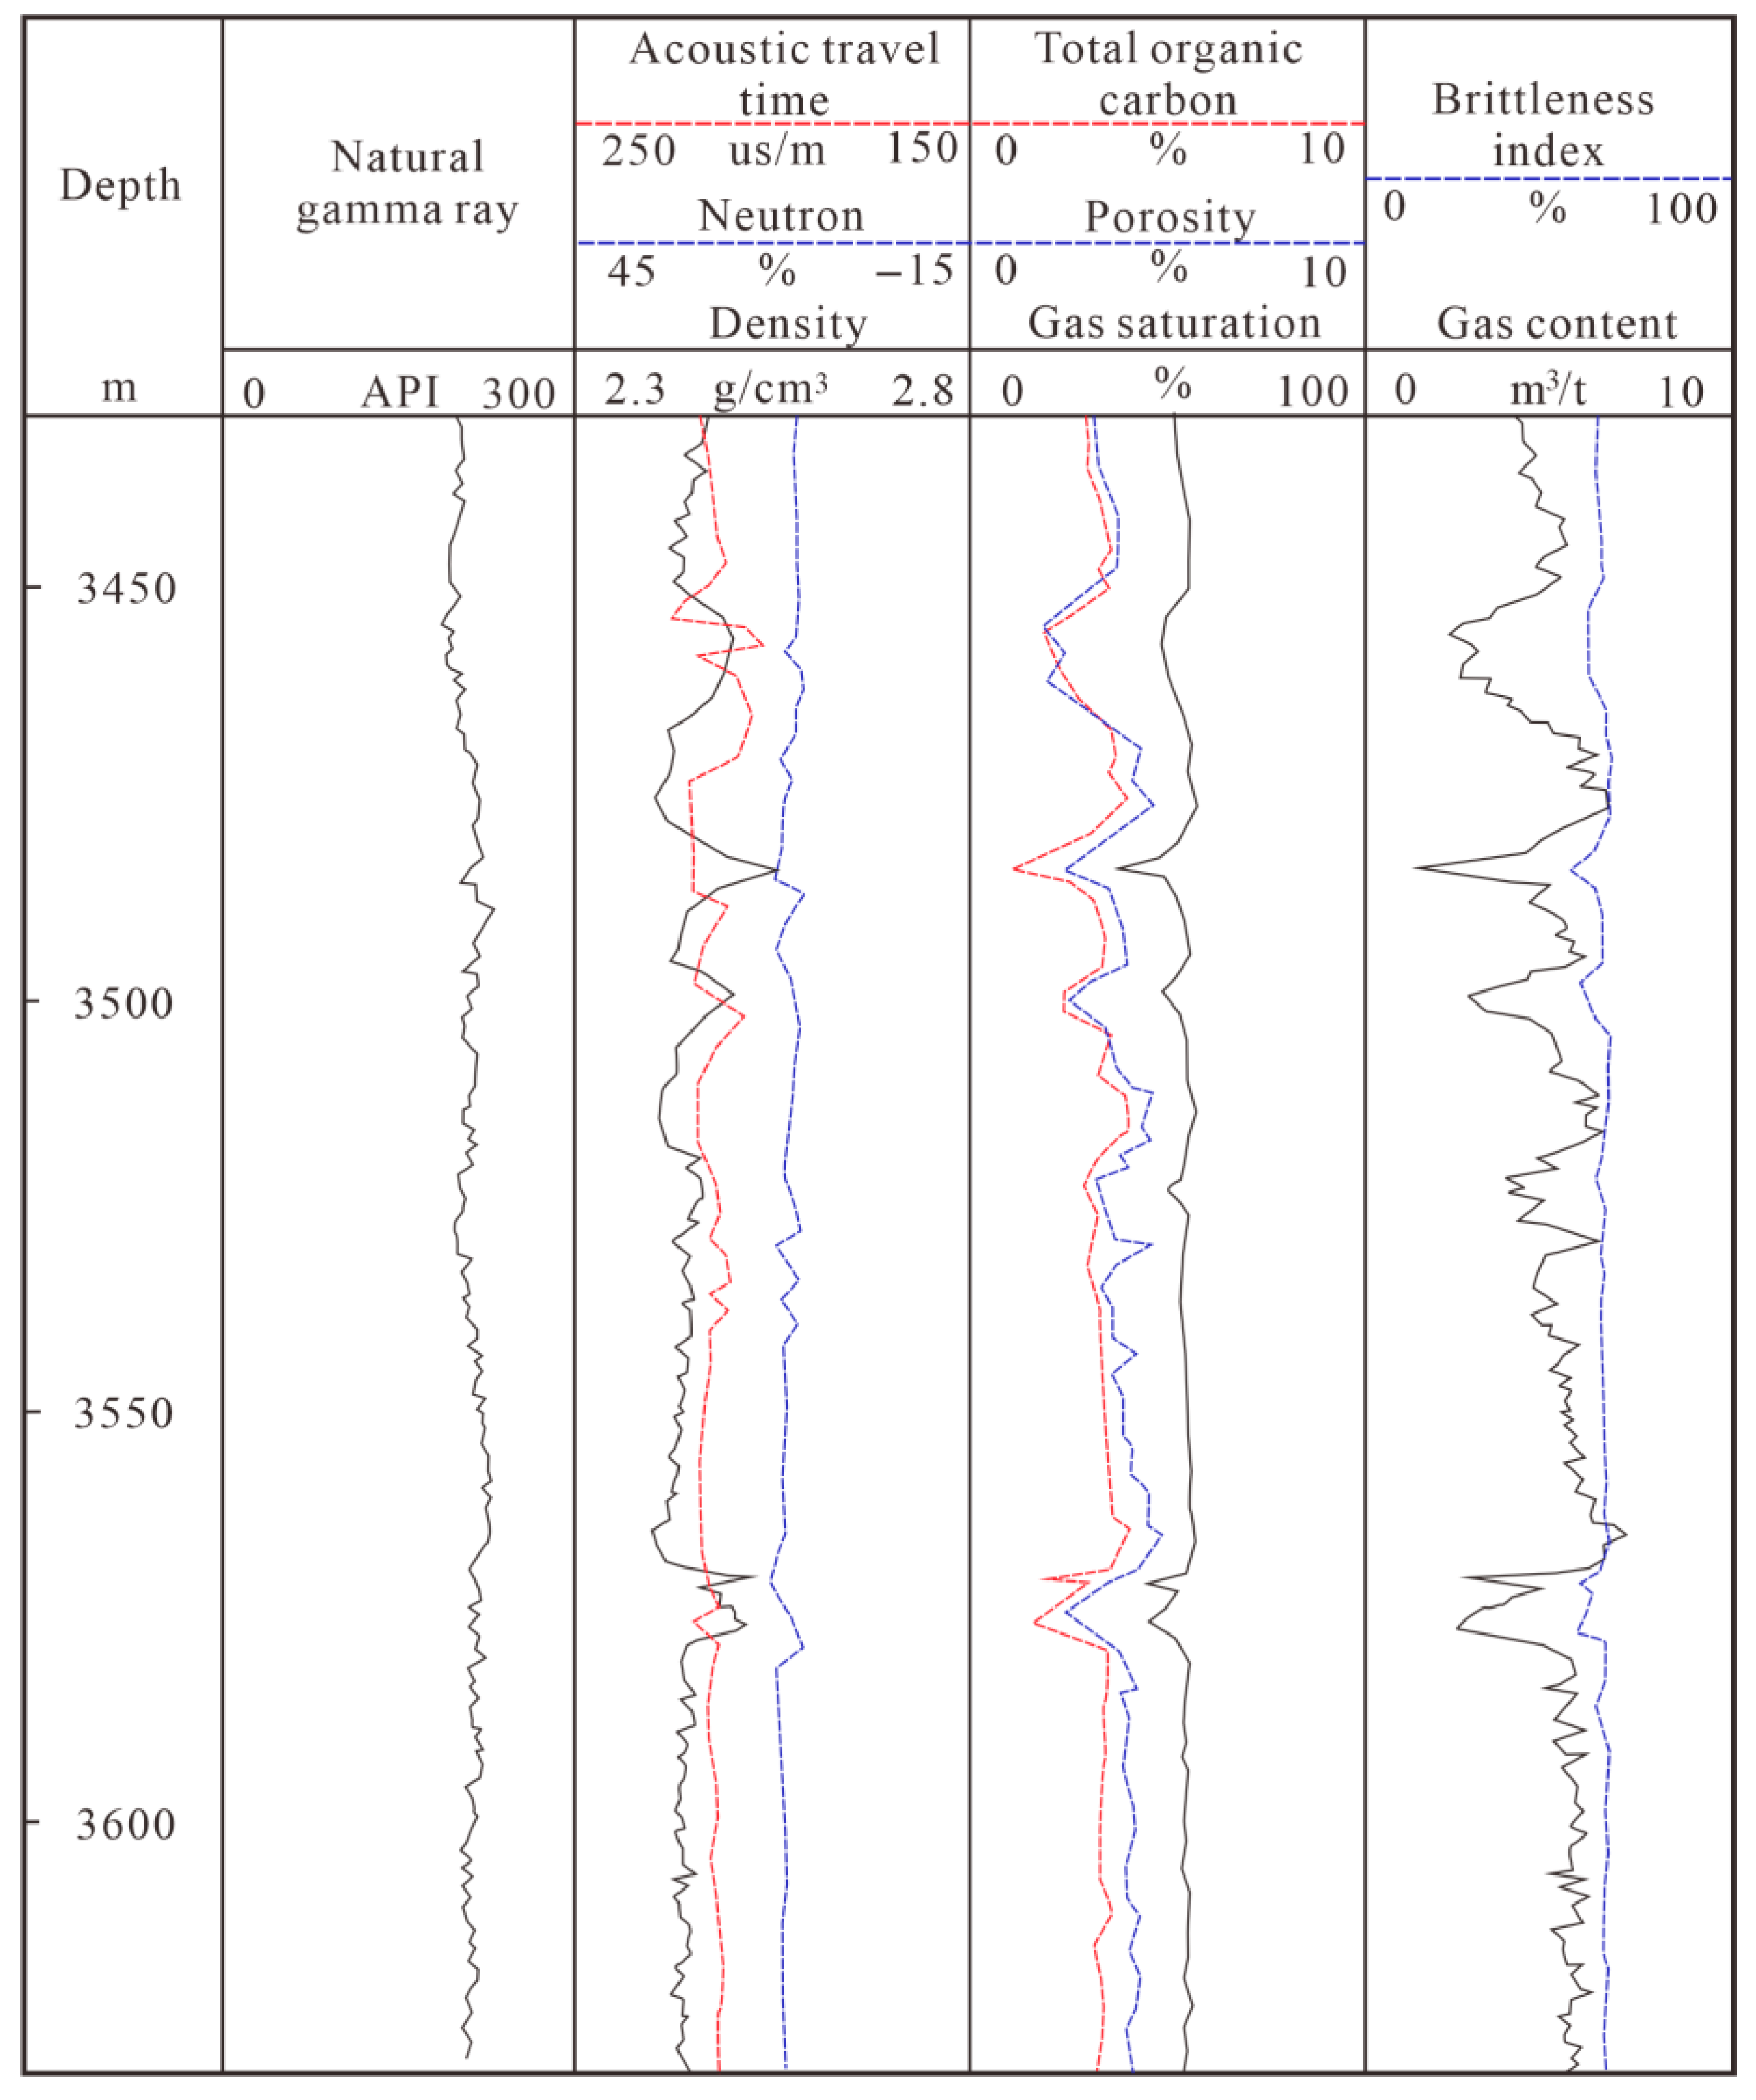
4.1. Case Analysis

The gas-production potential of the shale gas wells FD-1HF and FE-3HF in the Fuling shale gas field is evaluated. Well FD-1HF, located on Platform 50, has a high-quality shale horizontal section that is 1354.6 m long. The reservoir pressure in the middle layer is 23.36 MPa. The formation density ranges from 2.31 g/cm3 to 2.75 g/cm3, with an average of 2.50 g/cm3; the total organic carbon (TOC) ranges from 1.55% to 6.82%, with an average of 4.10%; the porosity ranges from 1.38% to 7.56%, with an average of 4.79%; the gas saturation ranges from 55.1% to 87.8%, with an average of 60.3%; the gas content ranges from 1.56 m3/t to 8.85 m3/t, with an average of 5.73 m3/t; the fracture index ranges from 55% to 86%, with an average of 77% (Figure 4). The gas-production index Igp is calculated to be 0.79 using a matrix model based on the Analytic Hierarchy Process (AHP), classifying it as a super-high-yield shale gas well. After completion, the well was fractured in 20 sections, and the trial gas flow rate reached 60.32 × 10⁴ m3/d, matching the predicted level and achieving the evaluation objectives.
The FE-3HF well, a development well on Platform 58, has a high-quality shale horizontal section of 1390.0 m length. The reservoir pressure in the middle layer is 16.66 MPa. The formation density ranges from 2.48 g/cm3 to 2.62 g/cm3, with an average of 2.54 g/cm3; the total organic carbon (TOC) ranges from 1.12% to 5.12%, with an average of 3.46%; the porosity ranges from 1.26% to 6.12%, with an average of 4.23%; the gas saturation ranges from 48.2% to 65.1%, with an average of 58.45%; the gas content ranges from 1.46 m3/t to 8.13 m3/t, with an average of 4.72 m3/t; the fracture index ranges from 58% to 68%, with an average of 65% (Figure 5). Based on the matrix model using the Analytic Hierarchy Process (AHP), the gas-production index (Igp) is calculated to be 0.39, classifying it as a medium-producing shale gas well. After completion, the well was fractured in 18 sections, and the trial gas test achieved an unobstructed flow rate of 18.51 × 10⁴ m3/d, which matches the predicted level and achieves the evaluation effect.
At present, the Analytic Hierarchy Process has been used to evaluate the gas production of 25 wells in the Fuling shale gas field, and the prediction accuracy is 88%, indicating that the method has high accuracy and applicability.

4.2. Discussion

We have established a shale gas reservoir gas-production evaluation method using the AHP and have found good applications in the study area. However, the AHP is a subjective weighting method and has certain limitations. This method mainly relies on the subjectivity of the evaluator. If the evaluator lacks the corresponding technical knowledge and experience, it is easy to make large errors.
Therefore, if subjective weighting methods such as AHP can be combined with objective weighting methods such as factor analysis and grey correlation, the weight results obtained by the two types of analysis methods can be compared, and the weight and importance ranking of each parameter can be obtained using the weighted average method, which will be more reliable. This is also the future extension direction of shale gas reservoir gas-production evaluation methods.

5. Conclusions

(1)
Gas production, as a comprehensive indicator of reservoir quality and gas-production capability, is primarily evaluated through parameters such as gas content, brittleness index, total organic carbon content, the length of high-quality gas-bearing sections, porosity, gas saturation, formation pressure, and formation density. By employing methods like the Analytic Hierarchy Process (AHP) and fuzzy mathematics, a mathematical model can be established to assess the gas-production potential of shale formations.
(2)
Using this model, the gas production of multiple shale gas wells in the Fuling shale gas field in China has been evaluated. In conjunction with actual test results, the gas production of this shale gas field is categorized into three levels: Wells with a gas-production index above 0.65 are classified as ultra-high production; those with an index between 0.45 and 0.65 are classified as high production; those with an index between 0.35 and 0.45 are classified as medium production; and those with an index below 0.35 are classified as low production.
(3)
The gas-production index evaluation model established by the Analytic Hierarchy Process can predict and analyze the gas-production potential of a single well in detail, which is of guiding significance for the adjustment of dynamic schemes of shale gas blocks. The application effect on site shows that the evaluation model can predict the gas-production potential well and has good applicability.

Author Contributions

Methodology, H.R.; investigation, H.R.; resources, S.W.; data curation, S.W.; writing—original draft preparation, H.R.; writing—review and editing, W.S. and S.W.; supervision, S.W. All authors have read and agreed to the published version of the manuscript.

Funding

The project is jointly funded by the National Major Science and Technology Special Project (2016ZX05060) and Sinopec Petroleum Engineering Technology Service Co., Ltd. (SG22-12K).

Data Availability Statement

The original contributions presented in this study are included in the article. Further inquiries can be directed to the corresponding author.

Conflicts of Interest

Author Haitao Rao was employed by the company Sinopec Matrix Co., Ltd. The remaining authors declare that the research was conducted in the absence of any commercial or financial relationships that could be construed as a potential conflict of interest. The authors declare that this study received funding from Sinopec Petroleum Engineering Technology Service Co., Ltd. The funder was not involved in the study design, collection, analysis, interpretation of data, the writing of this article or the decision to submit it for publication.

References

  1. Pang, X.; Shao, X.; Li, M.; Hu, T.; Chen, Z.; Zhang, K.; Jiang, F.; Chen, J.; Chen, D.; Peng, J.; et al. Correlation and difference between conventional and unconventional reservoirs and their unified genetic classification. Gondwana Res. 2021, 97, 73–100. [Google Scholar] [CrossRef]
  2. Zhu, L.; Ma, Y.; Cai, J.; Zhang, C.; Wu, S.; Zhou, X. Key factors of marine shale conductivity in southern China—Part II: The influence of pore system and the development direction of shale gas saturation models. J. Pet. Sci. Eng. 2022, 209, 109516. [Google Scholar] [CrossRef]
  3. Qiu, Z.; Zou, C.; Wang, H.; Dong, D.; Wei, L. Discussion on characteristics and controlling factors of differential enrichment of Wufeng-Longmaxi formations shale gas in South China. Nat. Gas Geosci. 2020, 31, 163–175. [Google Scholar] [CrossRef]
  4. Jin, Z.; Hu, Z.; Gao, B.; Zhao, J. Controlling factors on the enrichment and high productivity of shale gas in the Wufeng-Longmaxi Formations, southeastern Sichuan Basin. Earth Sci. Front. 2016, 23, 1–10. [Google Scholar]
  5. Liang, X.; Wang, G.; Xu, Z.; Zhang, J.; Chen, Z.; Xian, C.; Lu, L.; Liu, C.; Zhao, C.; Xiong, S. “Sweet spot” comprehensive evaluation technology of complex mountain shale gas reservoir: Taking the Zhaotong National Shale Gas Demonstration Zone as an example. Nat. Gas Ind. 2016, 36, 33–42. [Google Scholar]
  6. Shi, W.; Zhang, C.; Jiang, S.; Liao, Y.; Shi, Y.; Feng, A.; Young, S. Study on pressure-boosting stimulation technology in shale gas horizontal wells in the Fuling shale gas field. Energy 2022, 254, 124364. [Google Scholar] [CrossRef]
  7. Zhang, R.; Chen, M.; Tang, H.; Xiao, H.; Zhang, D. Production performance simulation of a horizontal well in a shale gas re-servoir considering the propagation of hydraulic fractures. Geoenergy Sci. Eng. 2023, 221, 111272. [Google Scholar] [CrossRef]
  8. Chen, S.; Tan, P.; Shi, W.; Zhao, H. A comprehensive Loggingevaluation method for high quality shale gas reservoir in Fuling. Petrol. Drill. Technol. 2020, 48, 131–138. [Google Scholar]
  9. Tang, X.; Jiang, S.; Jiang, Z.; Li, Z.; He, Z.; Long, S.; Zhu, D. Heterogeneity of Paleozoic Wufeng–Longmaxi formation shale and its effects on the shale gas accumulation in the Upper Yangtze Region, China. Fuel 2019, 239, 387–402. [Google Scholar] [CrossRef]
  10. Gong, J.; Qiu, Z.; Zou, C.; Wang, H.; Shi, Z. An integrated assessment system for shale gas resources associated with graptolites and its application. Appl. Energy 2020, 262, 114524. [Google Scholar] [CrossRef]
  11. Liu, L.; Zheng, A.; Bao, H.; Liang, B.; Cai, J.; Zhang, Q.; Liu, S. Optimization of strategies for sustainable and stable gas production in the Jiaoshiba Block of the Fuling Shale Gas Field. Nat. Gas Ind. 2023, 43, 96–104. [Google Scholar]
  12. Shi, W.; Zhang, Z.; Huang, Z.; Shi, Y.; Liao, Y. Study on calculation method of gas saturation in low-resistivity shale gas reservoir: A case study of Jiaoshiba block in Fuling area. Fault-Block Oil Gas Field 2022, 29, 183–188. [Google Scholar]
  13. Cai, S.; Xiao, Q.; Zhu, W.; Chen, Q.; Chen, J.; Wang, X. Nanopore structure characteristics and impacting factors of Wufeng-Longmaxi formation shale in southeast Chongqing: A case study of Shizhu Outcrop. Sci. Technol. Eng. 2021, 21, 10603–10612. [Google Scholar]
  14. Wang, L.; Li, S.; Liu, X.; Hou, Y.; Zhou, C.; Xiang, S.; Wang, M. Water saturation of low resistance shale in the Wufeng-Longmaxi Formation of Sichuan Basin logging evaluation. Sci. Technol. Eng. 2022, 22, 6456–6462. [Google Scholar]
  15. Yong, R.; Yang, H.; Wu, W.; Yang, X.; Yang, Y.; Huang, H. Controlling factors and exploration potential of shale gas enrichment and high yield in Permian Dalong Formation, northern Sichuan Basin, SW China. Petrol. Explor. Dev. 2025, 52, 285–300. [Google Scholar] [CrossRef]
  16. Gou, Q.; Xu, S.; Hao, F.; Zhang, B.; Shu, Z.; Yang, F.; Wang, Y.; Li, Q. Quantitative calculated shale gas contents with different lithofacies: A case study of Fuling gas shale, Sichuan Basin, China. J. Nat. Gas Sci. Eng. 2020, 76, 103222. [Google Scholar] [CrossRef]
  17. Ye, Y.; Tang, S.; Xi, Z.; Jiang, D.; Duan, Y. A new method to predict brittleness index for shale gas reservoirs: Insights from well logging data. J. Petrol. Sci. Eng. 2022, 208, 109431. [Google Scholar] [CrossRef]
  18. Liao, Y.; Tan, P.; Shi, W.; Feng, A.; He, H. An Evaluation Method for Gas Production Property for Shale Gas Reservoirs in the Fuling Area. Pet. Drill. Tech. 2018, 46, 69–75. [Google Scholar]
  19. Zang, D.; Wang, S.; Chai, L.; Wang, X.; Chen, J. AHP application to oil shale exploration optimization in Jianchang Basin. J. Xi’an Univ. Sci. Technol. 2014, 34, 180–186. [Google Scholar]
  20. Han, D.; Zheng, X.; Ding, C.; Gui, D. Empirical study on the application of the analytic hierarchy process in forest fire emergency. J. Wildland Fire Sci. 2024, 42, 78–84. [Google Scholar]
Figure 1. Schematic diagram of block structure (a) and target layer division in Jiaoshiba area of Fuling shale gas field (b): main structure of the area, and reservoir division profile of typical well (modified according to ref. [12]).
Energies 18 03817 g001
Figure 2. Hierarchical structure of gas-production property for shale gas reservoirs.
Energies 18 03817 g002
Figure 3. Cross plot of gas-production index and open flow rate in Fuling shale gas field.
Energies 18 03817 g003
Figure 4. Reservoir profile of partial horizontal section (3410.0–3610.0 m) of Well FD-1HF (including parameters such as organic carbon content, porosity, gas saturation, brittleness index, gas content, etc.).
Energies 18 03817 g004
Figure 5. Reservoir profile of partial horizontal section (3430.0–3630.0 m) of Well FE-3HF (including parameters such as organic carbon content, porosity, gas saturation, brittleness index, gas content, etc.).
Energies 18 03817 g005
Table 1. Scales and their meanings.
Scale (aij)Judgment of the Importance of Two Factors
1Factors i and j are equally important
3Factor i is slightly more important than factor j
5Factor i is significantly more important than factor j
7Factor i is much more important than factor j
9Factor i is extremely more important than factor j
2, 4, 6, 8The scale value of the intermediate state of the comparison between the two factors
count backwardsIf factor j is compared with factor i, the scale aji = 1/aij
Table 2. Judgment matrix for evaluation parameters of gas-production property.
Influencing FactorAir Content Brittleness IndexTotal Organic
Carbon Content
LengthPorosityGas SaturationStrata PressureDensity
air content12335567
brittleness index 0.51223345
total organic carbon content0.330.5112235
length0.330.5112235
porosity0.20.330.50.51123
gas saturation0.20.330.50.51123
strata pressure0.170.250.330.330.50.512
density0.140.20.20.20.330.330.51
Table 3. Average random consistency index (RI) of judgment matrix [20].
Matrix Order1234567891011
RI000.580.961.121.241.321.411.451.491.52
Table 4. Fuzzy matrix composed of factor set and evaluation set elements.
Well NumberAir Content Brittleness
Index
Total Organic Carbon ContentLength Porosity Gas SaturationStrata Pressure Density
1R11R12R13R14R15R16R17R18
2R21R22R23R24R25R26R27R28
3R31R32R33R34R35R36R37R38
mRm1Rm2Rm3Rm4Rm5Rm6Rm7Rm8
Table 5. Fuzzy matrix after normalization of productivity influencing factors of 20 shale gas wells in the Fuling shale gas field.
NumberWell NameAir ContentBrittleness IndexTotal Organic Carbon ContentLengthPorosityGas SaturationStrata PressureDensity
1F1-2HF0.750.420.540.850.870.950.910.57
2F5-1HF0.500.250.470.540.750.640.550.00
3F6-2HF0.760.670.840.900.850.760.981.00
4F8-1HF0.250.420.220.650.460.510.590.29
5F8-2HF0.830.580.660.871.000.901.000.71
6F9-2HF0.200.000.000.000.690.000.000.29
7F10-1HF0.450.500.411.000.620.680.540.29
8F11-3HF0.431.000.820.680.490.410.970.86
9F12-1HF0.870.580.800.901.000.880.981.00
10F13-2HF1.000.921.000.881.001.000.981.00
11F16-2HF0.430.170.250.930.620.730.580.14
12F17-4HF0.210.750.581.000.210.350.160.43
13F18-3HF0.440.500.620.930.570.530.640.57
14F20-1HF0.370.580.630.740.440.490.780.57
15F21-1HF0.220.500.430.360.290.410.490.29
16F26-3HF0.560.790.970.890.530.570.941.14
17F40-2HF0.560.750.740.910.690.590.851.00
18F44-1HF0.300.580.550.800.330.490.600.43
19F47-2HF0.000.330.280.530.000.230.210.14
20F50-1HF0.140.420.450.840.200.270.150.29
Table 6. Correspondence between open flow rate and gas-production level of the Fuling shale gas field.
Well NumberWell NameObstructed Flow/(104 m3/d)Gas-Production IndexGas-Production Level
1F1-2HF50.700.70Super-productive
2F5-1HF25.270.47high yield
3F6-2HF81.920.79Super-productive
4F8-1HF19.330.38Medium yield
5F8-2HF155.830.78Super-productive
6F9-2HF5.700.12low yield
7F10-1HF26.220.55high yield
8F11-3HF112.830.66Super-productive
9F12-1HF82.630.82Super-productive
10F13-2HF111.020.97Super-productive
11F16-2HF34.320.45high yield
12F17-4HF21.590.48high yield
13F18-3HF55.890.57high yield
14F20-1HF44.190.53high yield
15F21-1HF17.390.35Medium yield
16F26-3HF68.020.73Super-productive
17F40-2HF83.370.70Super-productive
18F44-1HF30.850.49high yield
19F47-2HF9.500.20low yield
20F50-1HF15.970.34Medium yield
Disclaimer/Publisher’s Note: The statements, opinions and data contained in all publications are solely those of the individual author(s) and contributor(s) and not of MDPI and/or the editor(s). MDPI and/or the editor(s) disclaim responsibility for any injury to people or property resulting from any ideas, methods, instructions or products referred to in the content.

