Article

Anaerobic Co-Digestion of Sewage Sludge and Organic Solid By-Products from Table Olive Processing: Influence of Substrate Mixtures on Overall Process Performance

by
Encarnación Díaz-Domínguez
1,
José Ángel Rubio
1,
James Lyng
2,
Enrique Toro
3,
Fernando Estévez
3 and
José L. García-Morales
1,*
1
Department of Environmental Technologies, Faculty of Marine and Environmental Sciences, IVAGRO-Wine and Agrifood Research Institute, University of Cadiz, 11510 Cadiz, Spain
2
School of Agriculture and Food Science, University College Dublin, D04 C1P1 Dublin, Ireland
3
Empresa Metropolitana de Abastecimiento y Saneamiento de Aguas de Sevilla S.A. (EMASESA), C/Escuelas Pías, 41003 Sevilla, Spain
*
Author to whom correspondence should be addressed.
Energies 2025, 18(14), 3812; https://doi.org/10.3390/en18143812
Submission received: 6 June 2025 / Revised: 9 July 2025 / Accepted: 14 July 2025 / Published: 17 July 2025
(This article belongs to the Special Issue Zero Waste Technology from Biofuel Development)

Abstract

Sewage sludge, characterized by its high organic matter and nutrient content, as well as the presence of microbial pathogens and other contaminants, requires proper management due to its significant generation rate. The table olive sector, which is highly significant in Spain as a global leader in production and export, generates various waste streams such the Organic Solid By-Products from Table Olive Processing (OSBTOP), which are mainly derived from the olive pit after the pitting process. The main aim of this study was to enhance the methane production performance of sewage sludge through co-digestion with OSBTOP as a co-substrate. Batch assays demonstrated that employing OSBTOP as a co-substrate increased methane content by 35–41% across all tested mixtures. While the highest methane yield was produced at a 40:60 (sludge:OSBTOP) ratio, a 60:40 mixture proved to be a more advantageous option for scale-up and practical application. This is attributed to factors such as the higher availability of sludge and its inherent buffering capacity, which counteracts the accumulation of volatile fatty acids and promotes process stability, thereby contributing to the study’s objective of significantly enhancing methane production from sewage sludge through co-digestion. In semi-continuous operation, methane yields in the co-digestion scenario exceeded those of mixed sludge digestion, showing a yield of 180 versus 120 LCH4−1 · kgVSadded−1, representing a 50% improvement. This study highlights the potential of anaerobic digestion as a strategy for valorizing OSBTOP, a by-product with no prior studies, while demonstrating that its co-digestion with sewage sludge enhances methane generation, offering a sustainable approach to organic waste treatment.

1. Introduction

The management of sewage sludge is one of the most critical challenges facing wastewater treatment plants (WWTPs) today. Despite representing only 0.5% to 2% of the total volume of treated wastewater, sludge management accounts for more than 50% of WWTPs’ operational costs [1]. In Spain alone, an estimated 1.2 million tons of dry matter sludge are generated annually [2]. This sludge is rich in organic matter and often contains pathogens, which requires the implementation of effective treatment strategies that are both economically and environmentally sustainable.
Organic Solid By-Products from Table Olive Processing (OSBTOP) are generated during the processing of table olives. The olive pits are ground, and the ground material is sieved to separate the woody fraction from the pulp. This pulp, together with out-of-specification olives, is processed using a decanter, resulting in this by-product. OSBTOP exhibit physicochemical characteristics similar to “alperujo” or “alpeorujo”, also known as two-phase olive mill wastes (2POMW). 2POMW are the main by-product generated during the extraction of olive oil, obtained after the continuous two-phase centrifugation of the olive paste produced from the milling of olives, and is composed of solid residue and vegetation water. It is worth noting that “alperujo” is typically generated during seasonal olive oil extraction campaigns lasting less than one hundred days per year in most cases, whereas OSBTOP is produced continuously throughout the entire year. This continuous generation highlights the importance of evaluating its potential for valorization. Notably, Spain is a global leader in table olive production and export, accounting for 60% of the European Union’s output and 15% of global production. In the 2024/2025 season, Spain is projected to produce 468.3 million tons of processed table olives, an increase from the 407.4 million tons recorded in the 2023/2024 season [3]. OSBTOP is an organic residue that poses not only environmental challenges, but also opportunities to harness its energy potential.
Anaerobic digestion (AD) is a biological treatment that has been employed for years to stabilize sewage sludge. However, its application has expanded in recent years to include other types of organic waste, such as animal waste, domestic waste and industrial, and waste wastewater [4,5,6]. This approach not only contributes to the effective management of waste but also enables energy recovery, which is crucial for reducing energy consumption and mitigating the global environmental impact. AD is a process whereby biodegradable organic matter is broken down in the absence of oxygen. This produces biogas and a nutrient-rich digestate that is suitable for use in agriculture. The biogas produced is primarily a mixture of methane, carbon dioxide and other gases [7].
AD is a complex process involving diverse microbial populations with varying growth rates, susceptible to inhibition by numerous factors. These include specific waste components, such as the phenolic compounds found in most olive by-products [8]. High concentrations of volatile fatty acids (VFAs) can also cause the inhibition of AD. Inhibitory substances like ammonium, sulfates, and heavy metals can also disrupt microbial activity. Furthermore, there are environmental factors (temperature, pH, etc.) and operational variables (organic loading rate, mixing, etc.) that can alter the activity of methanogenic microorganisms and thus potentiate the inhibitory effect of the VFAs [9,10,11].
Maintaining a balanced nutrient profile, particularly the carbon-to-nitrogen (C/N) ratio, is essential for optimal AD performance. Sewage sludge typically has a low C/N ratio (4–9) due to its high nitrogen content [12,13,14]. In contrast, OSBTOP is rich in carbon and has a high C/N ratio [15]. Therefore, co-digesting sewage sludge with OSBTOP can help adjust the overall C/N ratio towards the optimal range of 20–30, which improves microbial activity and protein synthesis during the AD process [11,14,16].
This study investigates the use of OSBTOP as a co-substrate for AD, a novel contribution given the limited prior research on its application in this context. Additionally, this study is significant as it seeks an effective alternative for the treatment of sewage sludge, a substrate that, due to its specific characteristics, often benefits from co-digestion with other substrates to improve AD efficiency. This approach supports the principles of the circular economy by promoting the valorization of waste streams through energy recovery.

2. Materials and Methods

2.1. Substrates and Inoculum

Two substrates were used in this study: OSBTOP and mixed sludge (Table 1). The OSBTOP was collected at the facilities of Ángel Camacho Alimentación S.L., located in Morón de la Frontera (Seville, Spain). A single batch was obtained, ensuring sufficient quantity for all planned experimental activities. Sampling was carried out downstream of the decanter unit, where OSBTOP is separated from “lampante” oil. This decanter processes the olive pulp obtained after the woody part of the pit is removed through sieving. After collection, OSBTOP was characterized and stored at −15 °C in a freezing chamber until further use.
The mixed sludge and digested sludge (used as inoculum) were obtained from the Copero Municipal WWTP in Seville. The mixed sludge samples were collected where the sludge from both the primary and secondary settlers was combined. This sludge was stored at 5 °C until used in the experimental phase. The digested sludge samples (Table 1) were collected directly from inside the anaerobic digesters and used to inoculate the laboratory reactor. This provided a microbial community that was already well adapted to the operating conditions (e.g., similar temperature and feed characteristics). This contributed to the process starting up rapidly and stably.
The physicochemical properties of the substrates are detailed in Table 1. Notably, mixed sludge exhibited the highest concentrations of both solids and organic matter, accompanied by an elevated total nitrogen (TNK) content. The use of this substrate in the inoculation reactor facilitated an effective start-up, attributable to the increased organic matter load. It also promoted enhanced operational stability due to its higher alkalinity. Conversely, digested sludge, employed as the inoculum source, exhibited a lower concentration of total and soluble organic fractions, as evidenced by the volatile solids (VS), total chemical oxygen demand (TCOD), soluble chemical oxygen demand (SCOD), and total VFA (TVFA) values. These characteristics are consistent with a stabilized AD effluent, where organic matter has undergone hydrolysis and subsequent consumption by anaerobic microorganisms, resulting in biogas production [17,18]. The digested sludge showed a higher ammonium nitrogen concentration compared to the other substrates. According to published data [19], ammonium concentrations in digested sludge generally range from 1.0 to 2.0 g-N/L, with pH values between 7.5 and 8.6, leading to free ammonia concentrations of 30–560 mg NH3-N/L at 33 °C. The values observed in the digested sludge used in this study are well below the thresholds reported in the literature for methanogenesis inhibition, which typically occurs at total ammonia nitrogen concentrations of 2500–3000 mg N/L [20]. Such attributes render it appropriate for inoculation reactors, where the establishment of an active and adapted microbial community is crucial for subsequent experimental phases. In a broader analysis, OSBTOP demonstrated a high organic matter content, both as a percentage and on a VS basis, compared to mixed sludge, with a lower content of inorganic compounds (approximately 4% versus 25% in mixed sludge). It is noteworthy that OSBTOP displayed a low alkalinity and an elevated C/N ratio. Conversely, mixed sludge was characterized by high alkalinity, which conferred a substantial pH buffering capacity essential for maintaining process stability during the initial acidogenic phases of AD, and a low C/N ratio due to its higher nitrogen content [21,22].

2.2. Experimental Procedure

To obtain an active inoculum source for the different experimental stages, a laboratory-scale inoculation reactor was set up. This reactor ensured a continuous availability of inoculum for both the batch assays and the semi-continuous operation phase. First, the inoculation reactor was started and operated until stabilization was achieved. Then, batch experiments were conducted to determine the most favorable mixing ratio between mixed sludge and OSBTOP. Finally, the selected mixture was used in semi-continuous co-digestion tests to evaluate its effectiveness in improving AD compared to the mono-digestion of a single substrate.

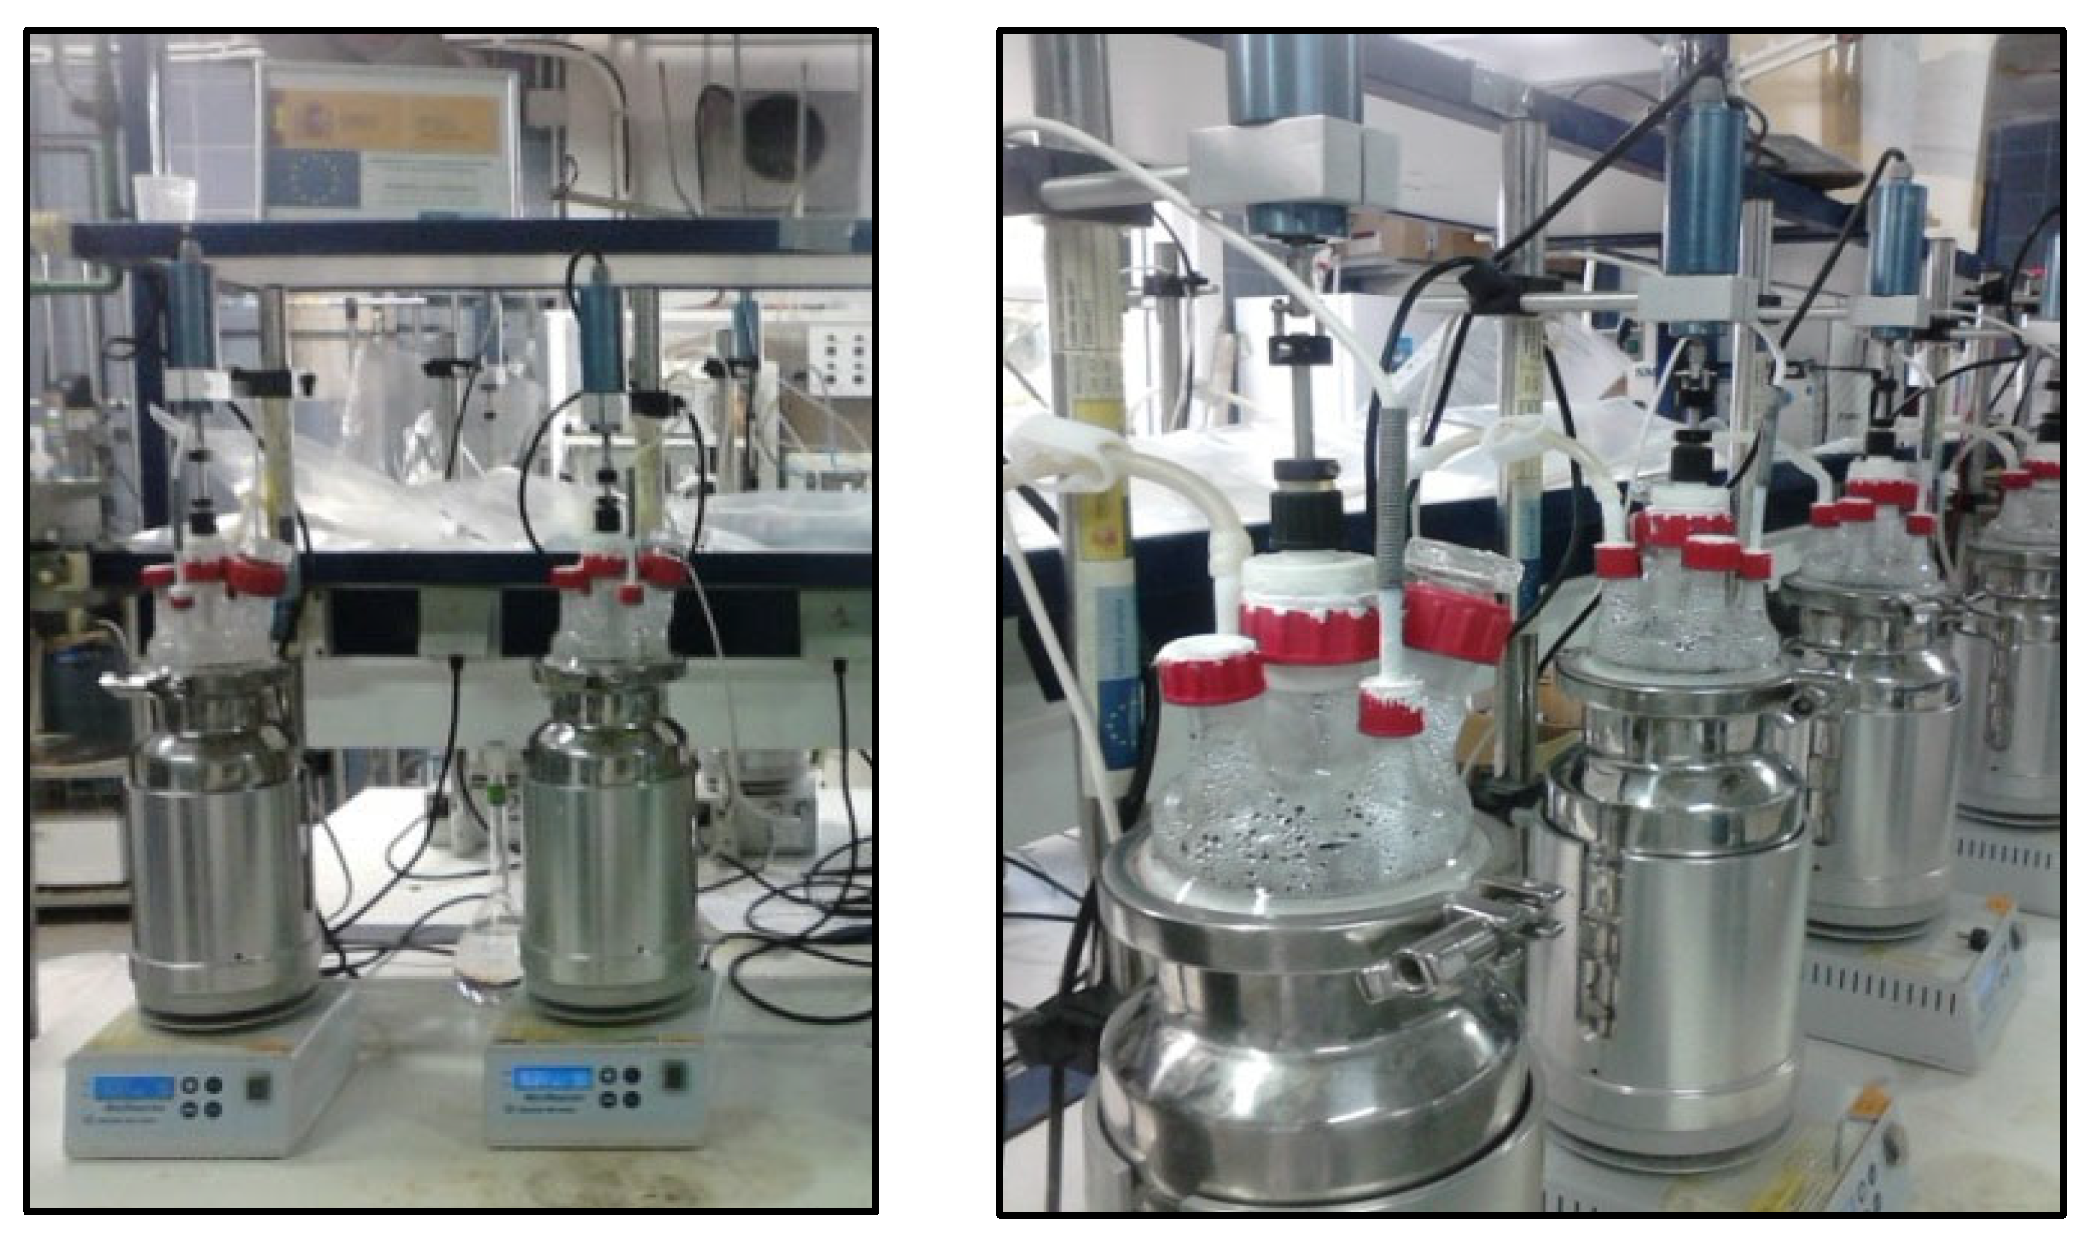
2.2.1. Inoculation Reactor Start-Up

At the start of the experiment, the reactor was loaded with digested sludge (Table 1), and operated under semi-continuous conditions by feeding it a fixed volume of mixed sludge daily. The inoculation reactor (Scharlab, Barcelona, Spain) consisted of a 6-L laboratory-scale continuously stirred tank reactor. The reactor lid included several ports for biogas outlet and feedstock inlet. Biogas produced during operation was collected in a 10-L Tedlar® gas bag (Samplebags.eu, Groningen, The Netherlands) (Figure 1). Mechanical mixing (Heidolph, Bavaria, Germany) was provided by a rotor connected to a stainless-steel shaft with a paddle-shaped end, ensuring proper homogenization of the reactor contents. A discharge valve located at the bottom of the reactor allowed for the removal of digested material.
Temperature was maintained in the mesophilic range (35 ± 1 °C) using a water jacket system connected to a 7-L thermostatic water bath (SELECTA, Barcelona, España). The reactor was operated with a hydraulic retention time (HRT) of 25 days. Daily monitoring included pH, biogas volume, and gas composition. Additionally, VS content was analyzed three times per week.

2.2.2. Batch Operation Experiments

To carry out the batch experiments, several mixtures of mixed sludge and OSBTOP were initially prepared. The selection of substrate proportions was based on optimizing the C/N ratio (using the characterization data presented in Table 1), while maximizing the proportion of mixed sludge in the mixtures. According to the literature [14,23,24], the optimal C/N ratio for AD falls within the range of 20 to 30. The composition of mixed sludge and OSBTOP enabled the formulation of mixtures within this range (Table 2), which were subsequently tested under batch experiments. Each mixture was evaluated in duplicate reactors, while an additional reactor containing only inoculum was used as a blank to assess its independent contribution to biogas production. Furthermore, a control assay was conducted in parallel using two reactors fed exclusively with mixed sludge, to allow for a comparative analysis between mono-digestion and co-digestion performance.
The experimental setup consisted of stainless-steel vessels with a 2-L working volume (Trallero, Zaragoza, Spain), sealed with glass lids equipped with multiple ports for sampling, biogas outlet, and mechanical stirring. Each reactor was fitted with an individual heating system, including an electric jacket and temperature sensors, to ensure constant thermal conditions under mesophilic conditions (35 °C). Homogenization of the reactor content was achieved through continuous mechanical stirring. Biogas produced during the assays was collected in 5-L Tedlar® bags (Figure 2).
Each reactor was inoculated with effluent from the stabilized inoculation reactor (450 mL), accounting for 25% of its working volume. The remaining volume (1350 mL) of each reactor was then filled with a combination of the substrate mixture (according to the specific blend outlined in Table 2) and distilled water. To ensure a consistent solids concentration across all assays, the total solids (TS) content in each reactor was adjusted to 3% through the addition of distilled water.
At the beginning of the experiment and after each sampling event, nitrogen gas was purged into each reactor to ensure anaerobic conditions. Daily monitoring included the measurement of biogas volume and composition, as well as pH. When required, pH was adjusted to approximately 7.4 by adding NaOH (Scharlab, Barcelona, Spain). In addition, liquid samples were collected twice per week for the determination of key physicochemical parameters, including TS, VS, SCOD, and both total and individual VFA. The total duration of the batch experiments was set to 30 days, until the increase in biogas production was less than 1% in two consecutive measurements [25].

2.2.3. Semi-Continuous Operation Experiments

To evaluate the influence of incorporating OSBTOP as a co-substrate in the AD of mixed sludge, a comparative study was conducted between two semi-continuous reactors: one operated with mixed sludge alone, and the other with a previously selected mixture of mixed sludge and OSBTOP. This comparison aimed to assess the potential improvements in process performance resulting from the co-digestion strategy.
The reactor used for mixed sludge digestion was the same inoculation reactor described earlier. To evaluate the performance of the selected co-digestion strategy, one additional stirred-tank reactor with identical specifications was employed.
For the co-digestion setup, the reactor was initially filled with effluent collected from the inoculation reactor. Once the working volume of 6 L was reached, feeding commenced using the selected co-substrate mixture from the batch phase. Prior to feeding, the substrate mixture was diluted with water to achieve a TS content of approximately 3%. Both reactors were operated under semi-continuous mode with a HRT of 30 days, consistent with the industrial anaerobic reactor.
Throughout the operation, the same parameters were monitored in both the gaseous phase and the effluent as in the batch assays, and at the same frequency. The feedstock was also regularly characterized to assess organic matter removal efficiency.

2.3. Analytical Methods

Analytical characterization of both liquid and gas phases was performed according to the Standard Methods described by APHA-AWWA-WPFC [26]. The parameters determined included pH (Knick, Berlin, Germany), electrical conductivity (EC) (Crison instrument, Barcelona, Spain), moisture content, TS, VS, TCOD, SCOD, dissolved organic carbon (DOC), TVFA (expressed as mg acetic equivalent/L), individual VFA (acetic, propionic, butyric, isobutyric, valeric, isovaleric, isocaproic, caproic, and heptanoic acids), total organic matter, alkalinity, total Kjeldahl nitrogen (TKN) and ammonium nitrogen (NH4+-N).
TS, VS, and moisture content were determined gravimetrically using the standard methods 2540-B and 2540-E. COD was quantified by the colorimetric method (5220-D), while DOC was measured using a total organic carbon (TOC) analyzer, Shimadzu TOC-L CSH/CSN (Shimadzu, Kyoto, Japan), based on infrared combustion. Ammonium nitrogen and alkalinity were assessed through titration methods 4500-NH3-E and 2320-B, respectively.
The gas composition, including methane (CH4), carbon dioxide (CO2), and hydrogen (H2), was analyzed using a Shimadzu GC-2010 gas chromatograph (Shimadzu, Kyoto, Japan), equipped with a thermal conductivity detector (TCD) and separated using a Supelco Carboxen 1010 plot column (Sigma-Aldrich, St. Louis, MO, USA). For biogas volume measurement, a gas flow meter, Ritter TG1 (Ritter, Bochum, Germany), and suction pump, KNF Laboport (KNF, Freiburg im Breisgau, Germany), were used. VFAs were also determined by gas chromatography (GC-FID) using a Nukol capillary column (Sigma-Aldrich, MO, USA), as described by Zahedi et al. [27].

2.4. Statistics Analysis

Statistical analysis was conducted on TS, VS, TCOD, SCOD, DOC, TVFA, and methane productivity (LCH4−1 · Lreactor−1 · d−1). The analysis followed a two-step approach. First, the results from duplicate reactors for each condition were compared to confirm the absence of significant differences in their behavior (Table S1). This validation supported the use of average values to represent each experimental condition. Subsequently, the mean values obtained for the three co-digestion mixtures in batch experiments were statistically compared to determine whether significant differences existed among them (Table S2).
To determine the appropriate statistical test for each variable, the normality of the datasets was first assessed using the Shapiro–Wilk test. A p-value lower than the significance level (α = 0.05) led to the rejection of the null hypothesis, indicating that the data did not follow a normal distribution. Conversely, a p-value greater than 0.05 indicated normality in the data. Based on the results of the normality test, parametric tests (Student’s t-test) were applied to variables with a normal distribution, while non-parametric alternatives (Mann–Whitney U test) were used for those not meeting the normality assumption. In both cases, a significance level of α = 0.05 was adopted. When the p-value was below this threshold, the null hypothesis was rejected, suggesting statistically significant differences between groups. If the p-value exceeded 0.05, no significant differences were assumed. For the comparison of the three co-digestion mixtures, the Kruskal–Wallis test was employed to assess differences among multiple independent groups. As with the previous tests, a confidence level of α = 0.05 was used. All statistical analyses were conducted using IBM SPSS Statistics 21 (licensed by the University of Cádiz).

3. Results and Discussion

Monitoring of the inoculation reactor ensured the establishment of a stable microbial community, providing a viable inoculum for subsequent batch and semi-continuous experiments. Batch experiments then assessed the co-digestion of mixed sludge and OSBTOP at varying proportions to identify the most favorable substrate mixture. Finally, the selected mixture was scaled up to semi-continuous reactors to evaluate the influence of OSBTOP as a co-substrate on mixed sludge AD, focusing on organic matter removal and methane production performance.

3.1. Inoculation Reactor Monitoring and Control

Maintaining optimal and stable environmental variables, such as pH, over time is essential for the growth and activity of microorganisms in AD processes [28,29]. In this study, the inoculation reactor was fed with mixed sludge, and its inherent high alkalinity (Table 1) of this substrate was sufficient to maintain a stable average pH of 7.34 (±0.06). This buffering capacity prevented the pH drops that could have inhibited methanogenic bacteria, as their activity significantly declines when the pH falls below 6 [30]. Beyond pH, key indicators of AD performance include methane production and VS removal [11].
The average VS removal (Figure 3A) throughout the reactor’s operational period was 58.2% (±2.6%), remaining relatively stable overall. This stability is attributed to the inherent basal content of non-biodegradable solids in the feedstock. It also indicates that the system has reached stable operating conditions [31], where the microbial community became well-adapted, resulting in a consistent rate of organic matter degradation. This percentage is higher than that reported in another study of mixed sludge with similar characteristics, which achieved an efficiency of 53.0% [22].
The trends for methane production are shown in Figure 3B. As depicted in Figure S1, illustrating the accumulated methane volume curve, methane production exhibited a progressive increase throughout the experiment, with a clear inflection point around day 13. This change in slope indicates the successful start-up phase of the AD process and the onset of active methanogenic activity. Upon reaching operational stability, the reactor achieved an average methane productivity of 0.35 (±0.07) LCH4−1 · Lreactor−1·d−1 and a methane content of 72.5% (±2.9%). The average methane yield was 230.00 (±0.09) LCH4−1 · kgVSconsumed−1 and 140.00 (±0.06) LCH4−1 · kgVSadded−1. Temporary fluctuations in reactor performance were noted after the removal of effluent for batch and semi-continuous assays (vertical lines, Figure 3), and a period of recovery was needed to restore stability. Notably, the biogas methane content and productivity are slightly higher than the values reported in a similar study involving the digestion of mixed sludge. That study reported an average methane content of 50–60% and 123.00 ± 3.27 LCH4−1 · kgVSadded−1 [32].

3.2. Batch Experiments: Optimization of Substrate Ratios

The following section will evaluate the AD performance of the different mixed sludge and OSBTOP mixtures detailed in Table 2. These mixtures served as the substrate for the reactors, which were operated in batch mode. The results presented are the mean values obtained from duplicate reactors. Statistical analysis was performed to confirm the absence of significant differences between the duplicates, thus validating the use of the average value (Table S1).

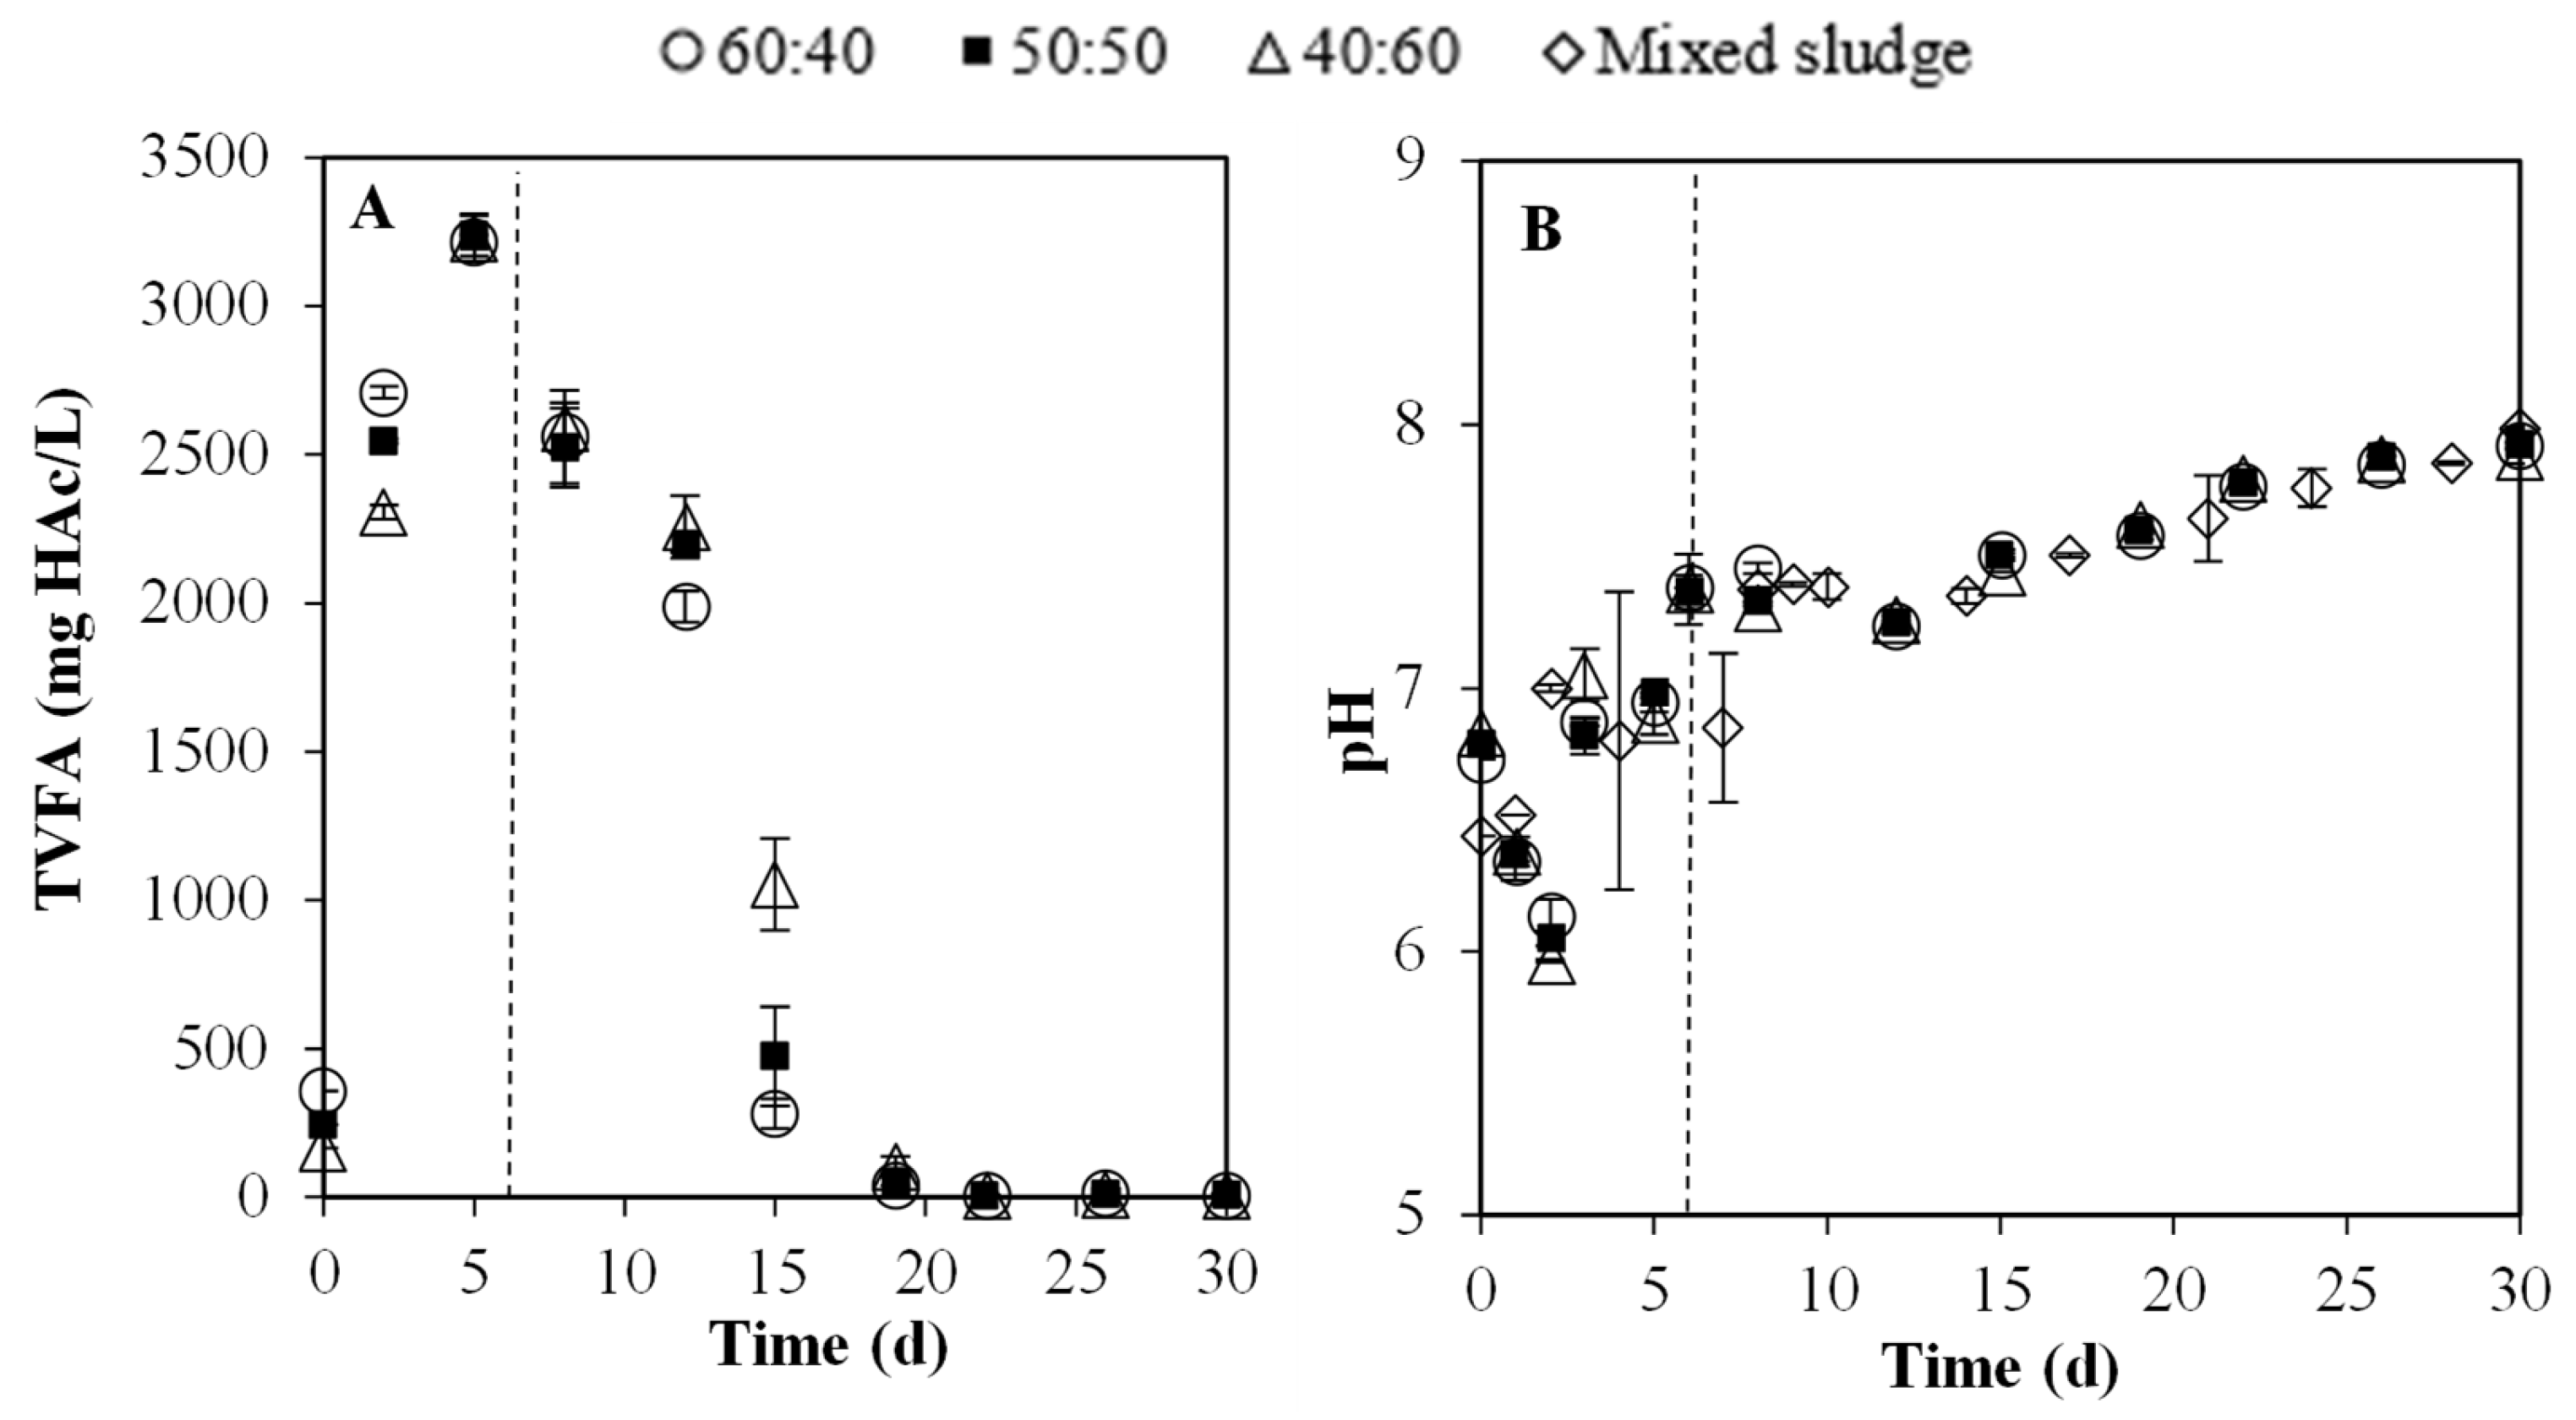
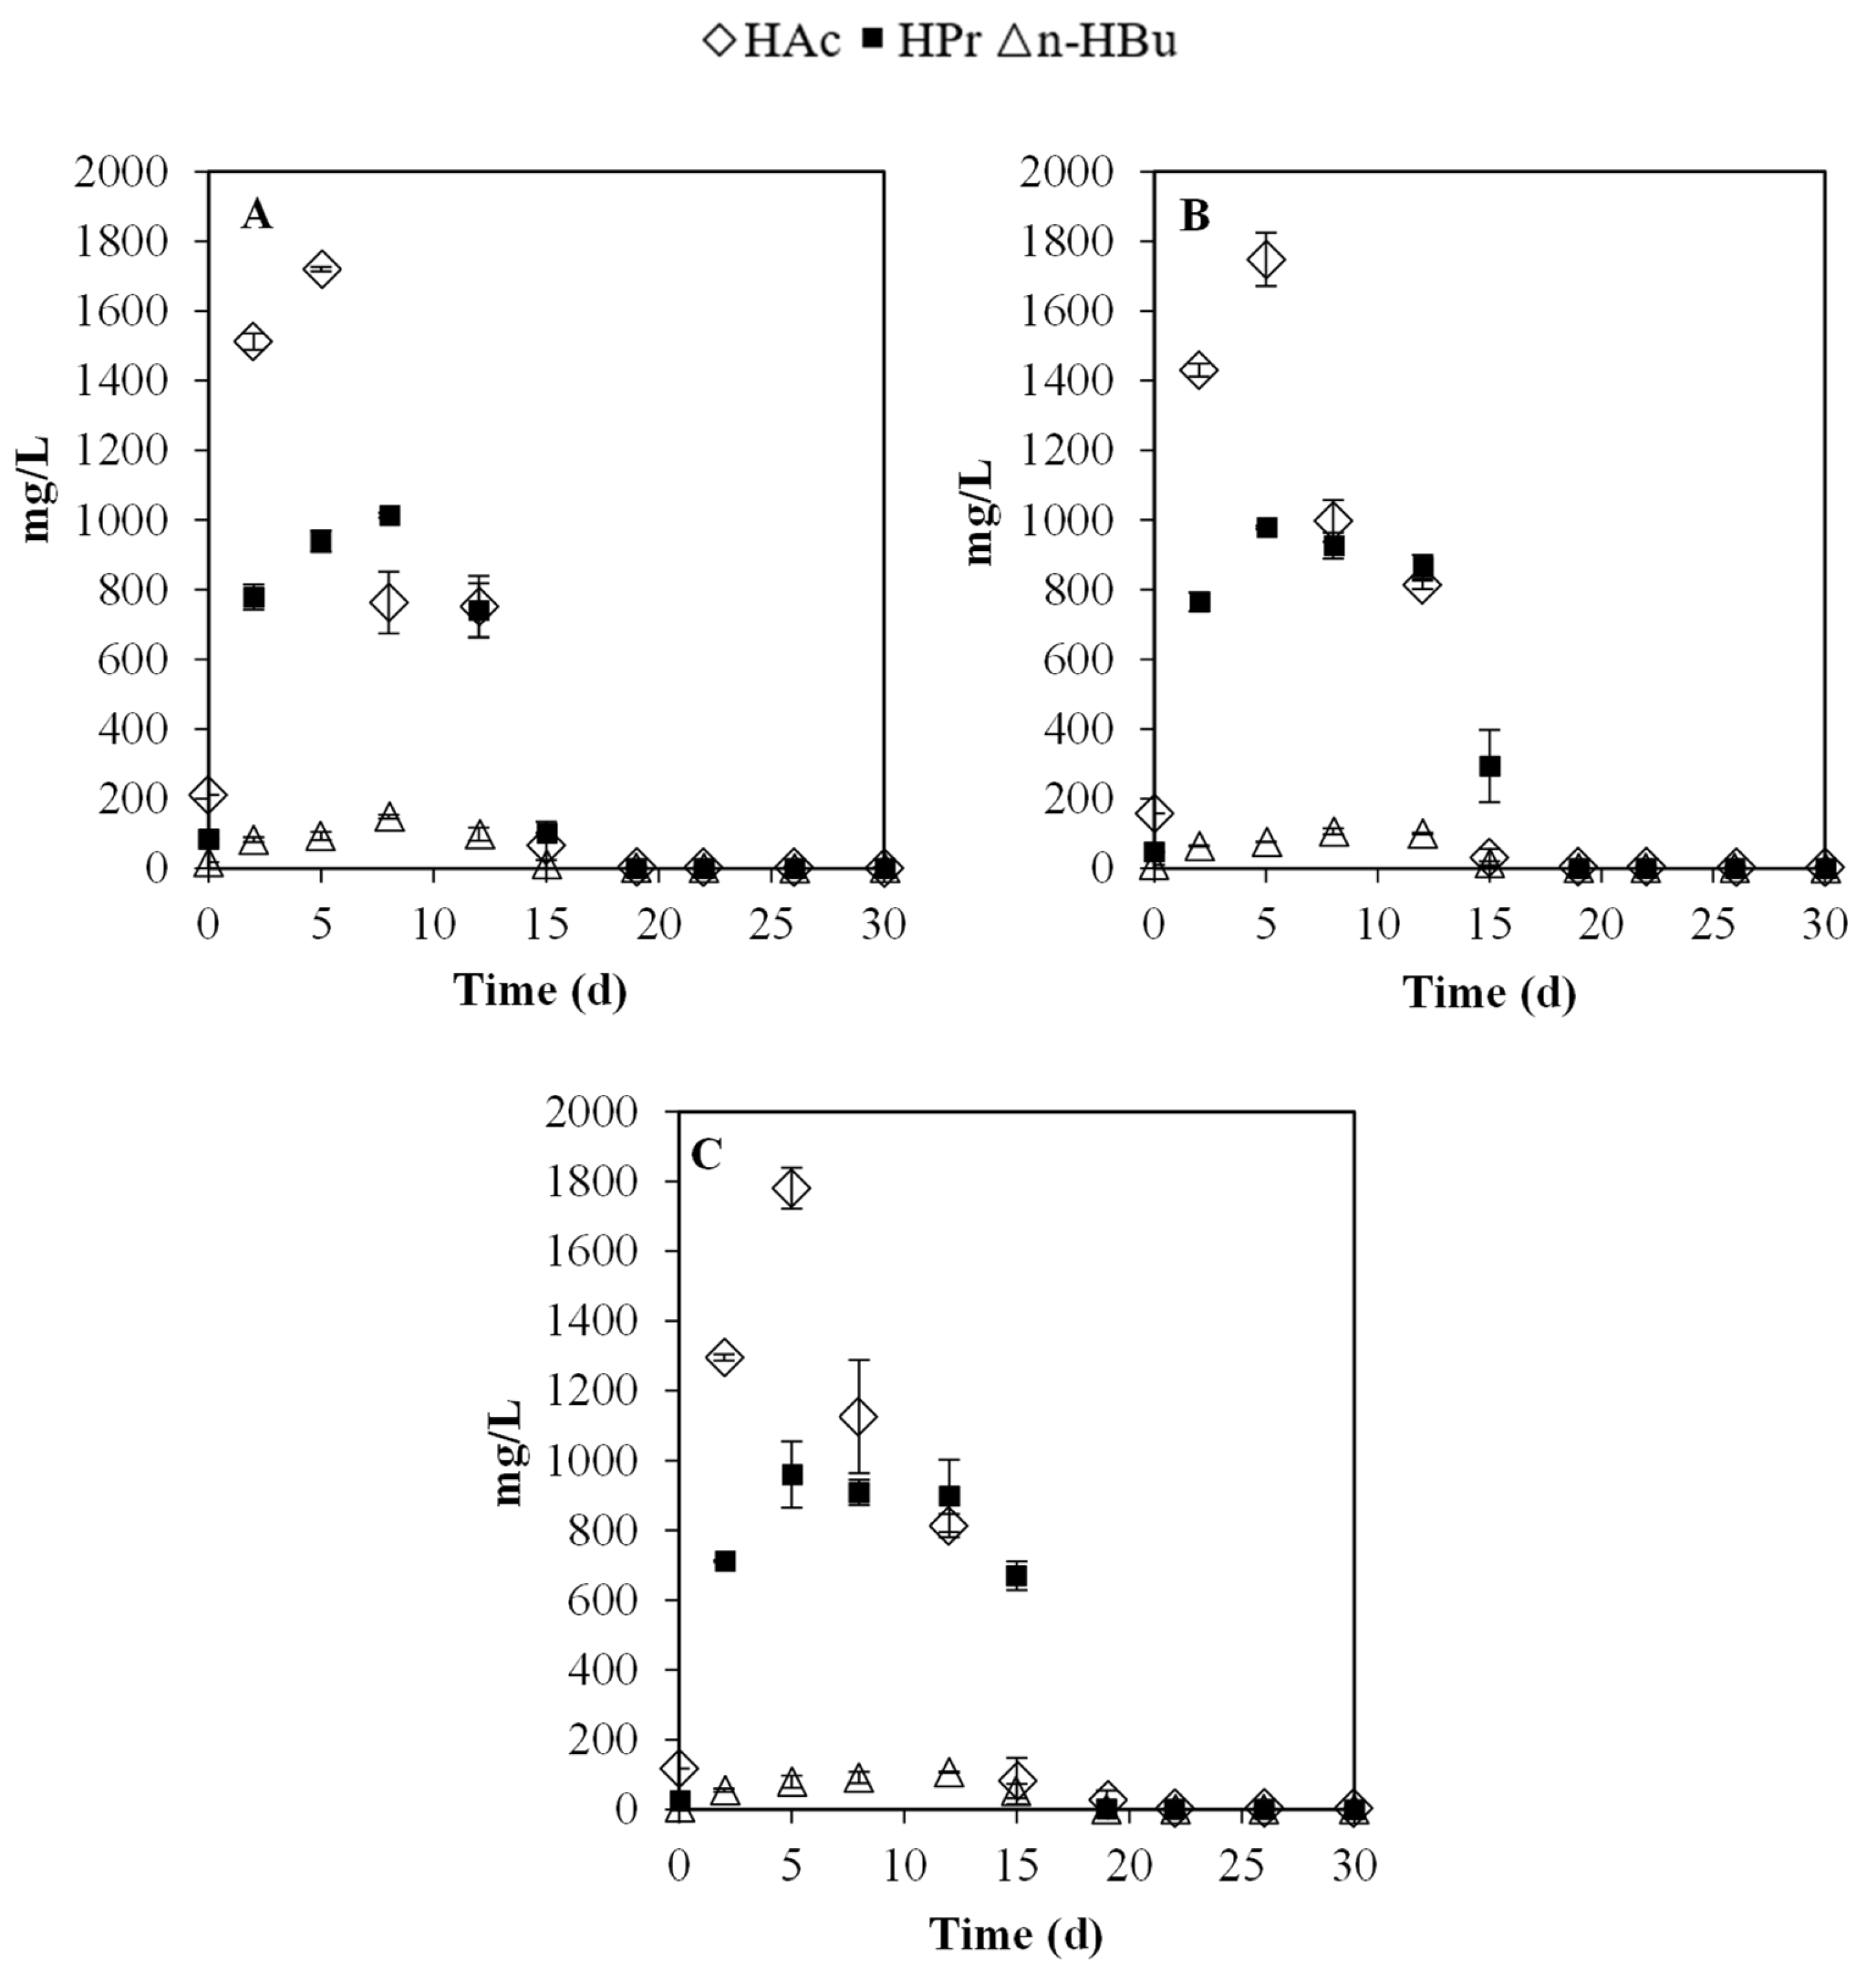
3.2.1. Key Physicochemical Parameter: pH and VFA

pH serves as a key physicochemical indicator of stress levels and overall reactor performance, reflecting the progression of distinct phases within AD [29,33]. Fluctuations in pH during AD are primarily influenced by alkalinity, VFAs concentration, carbon dioxide (CO2) production, and bicarbonate (HCO3) levels [33].
Initially, the hydrolysis of substrates and the subsequent production of VFAs by acidogenic bacteria (Figure 4A) lead to a decrease in pH (Figure 4B) [34]. As shown in Figure 4, a significant drop in pH to values around 6.0 was observed during the first two days of the assay. From start-up until day 6, the pH had to be adjusted to around 7.4, optimal for methanogenic microbiota in mesophilic range [28]. In the present study, the maximum TVFA levels were similar across all three mixtures (with no statistical differences, Table S2), reaching approximately 3200 mgHAc/L. Notably, these values are lower than the inhibitory range of 5800 to 6900 mg/L reported by Pramanik et al. [33], where methane production can be completely inhibited.
The consumption of VFAs coincided with the initiation of methane production in the reactors (Figure S5), as illustrated in Figure 4A. From day 6 until the end of the experiment, the pH in all reactors remained within the range of 7.3 to 7.9, a range conducive to AD [28]. Therefore, further pH correction was unnecessary. VFA consumption continued until approximately day 19 of the experiment, when VFAs were almost completely depleted from the medium. This behavior indicates an efficient conversion of VFAs into methane, characteristic of a stable and uninhibited single-stage methanogenic AD process. The consumption of VFAs is mediated by acetogenic bacteria, which convert compounds such as propionic, butyric, and valeric acids into acetic acid. Subsequently, acetic acid is transformed into methane and carbon dioxide by acetoclastic methanogenic archaea.
Regarding the evolution of the major VFAs (acetic, propionic, and n-butyric acids), acetic acid consumption was notably observed, this acid had accumulated until day 5 of the experiment (Figure 5). Acetic acid is the primary metabolite in methane, and it contributes to a major part of the produced methane [35]. Notably, under alkaline conditions, fermentation of lignocellulosic biomass, such as olive mill solid waste (OMSW), can result in acetic acid representing over 90% of the TVFA, thereby promoting an acetic-type fermentation pathway in such substrates [36,37]. The maximum levels of acetic acid increased with a higher proportion of OSBTOP in the mixture.
Additionally, an increase in propionic acid was observed from the beginning of the experiment in all three mixtures, which gradually decreased over time. Notably, by day 15 of the experiment, propionic acid became the predominant fatty acid in the medium as the proportion of OSBTOP increased, a trend also observed in similar lignocellulosic substrates [38]. This is attributed to the higher levels of long-chain fatty acids (LCFAs) present in this substrate. Furthermore, the accumulation of propionic acid is due to the slow growth rate of the microorganisms responsible for its degradation (μmax = 0.008 h−1) and the thermodynamically unfavorable nature of its degradation under mesophilic conditions (ΔG° = +76.1 kJ) [39,40]. To mitigate propionate inhibition in future full-scale applications, it is crucial to select co-substrates with good buffering capacity or favorable VFA profiles. Additionally, supplementing with trace metals such as nickel, cobalt, and molybdenum, key enzymatic cofactors in methanogenesis, can enhance propionate conversion, improve methane yield, and stabilize the process. In contrast, the evolution of n-butyric acid showed no significant trends, with very low concentration levels throughout the experiment and its near-complete disappearance from day 15 onwards.

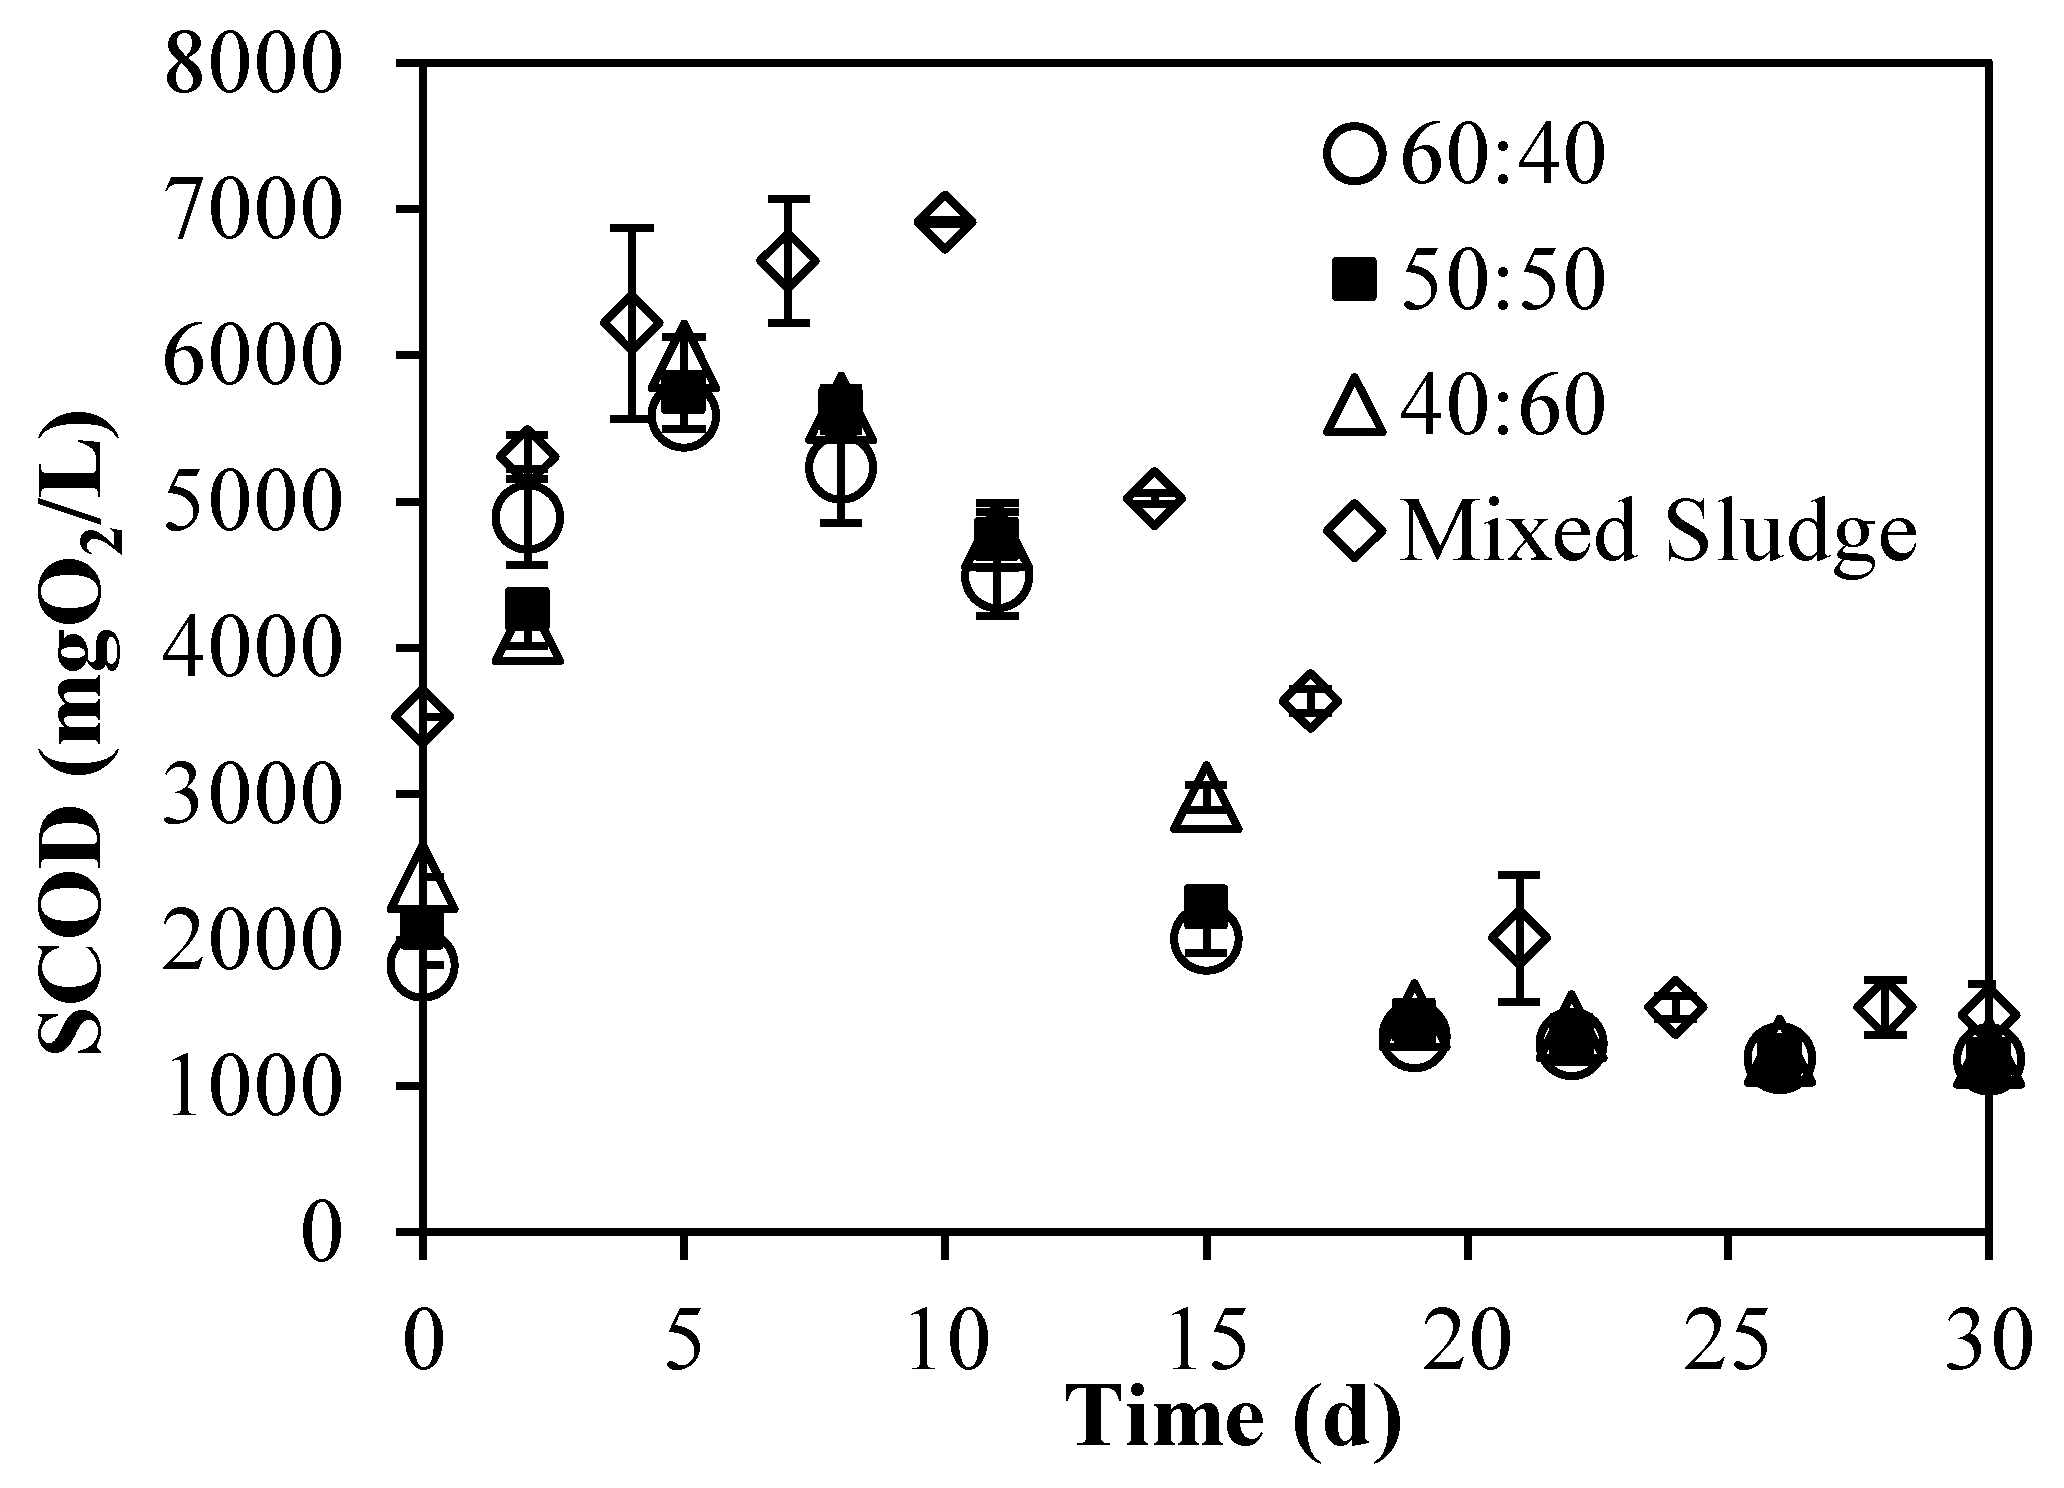
3.2.2. Evolution of Particulate and Soluble Organic Matter

This section examines the evolution of VS as an indicator of particulate organic matter degradation, and the evolution of SCOD as indicators of soluble organic matter dynamics.
During the hydrolytic phase of AD, the degradation of particulate matter occurred at different rates depending on the substrate mixture, as illustrated in Figure S2. This figure shows TS and VS removal. The 60:40 mixture exhibited the highest VS consumption (43%). This value is lower than the 57.5% VS removal efficiency reported by Rubio et al. [41] for a similar substrate (2POMW) co-digested with cattle manure (CM) at a 75:25 ratio under mesophilic conditions (35 °C) and 10% TS in batch mode. This difference is likely attributed to the higher proportion of olive processing by-products in the mixture, which inherently possesses a greater fraction of readily biodegradable organic matter, potentially leading to enhanced VS removal. Similarly, a co-digestion study of food waste (FW) and olive husk (similar to 2POMW) at a 67:33 weight ratio under mesophilic conditions reported a VS removal efficiency of 49.3% [42], also exceeding the findings of the present study. This higher removal is likely due to the greater proportion of easily biodegradable organic matter present in FW compared to sewage sludge. In contrast, the mixed sludge alone achieved approximately 50% VS removal (Figure S2). Additional graphs detailing the evolution of TS and VS during the experiment are included in the Supplementary Material (Figure S3).
The degradation of particulate organic matter was associated with an increase in the solubilization of organic matter, a characteristic of the hydrolytic-acidogenic phase [43,44]. The increase in soluble compounds, as shown by SCOD (peaking up to days 5 to 8, Figure 6) and DOC (Figure S4), was associated with significant VFAs production and a decrease in pH (Figure 4B). The increase in OSBTOP proportion led to higher SCOD concentrations, indicating its greater contribution of hydrolysable and potentially mechanizable organic matter.
By the end of the experiment, SCOD (Figure 6) and DOC (Figure S4) levels stabilized across all three mixtures, with no statistical differences (Table S2). These baseline levels correspond to the presence of soluble compounds with limited biodegradability, with concentrations around 1300 mgO2/L and 240 mgC/L for SCOD and DOC, respectively. Similar trends have been reported in other studies [41,45] involving the co-digestion of similar residues such as 2POMW or OMSW. As the proportion of these residues increases in the co-digestion mixture, soluble material also accumulates in the reactor due to their high VS content, including both readily soluble fractions and those solubilized during hydrolysis. These residues often contain LCFAs (mainly oleic acid), polyphenols, and lignocellulosic components, which can be released or converted into soluble intermediates. However, their poorly biodegradable and potentially inhibitory compounds may impair the full degradation of these compounds, leading to their accumulation in the digester.
The results obtained for the mixed sludge in terms of SCOD (Figure 6) and DOC (Figure S4) show higher levels of soluble organic matter, as reflected by these parameters, both at the start of the experiment and throughout its evolution. This is attributed to the fact that mixed sludge is a substrate that is partially hydrolyzed due to the degradation of organic matter from the aerobic biological process that constitutes a significant portion of its content.

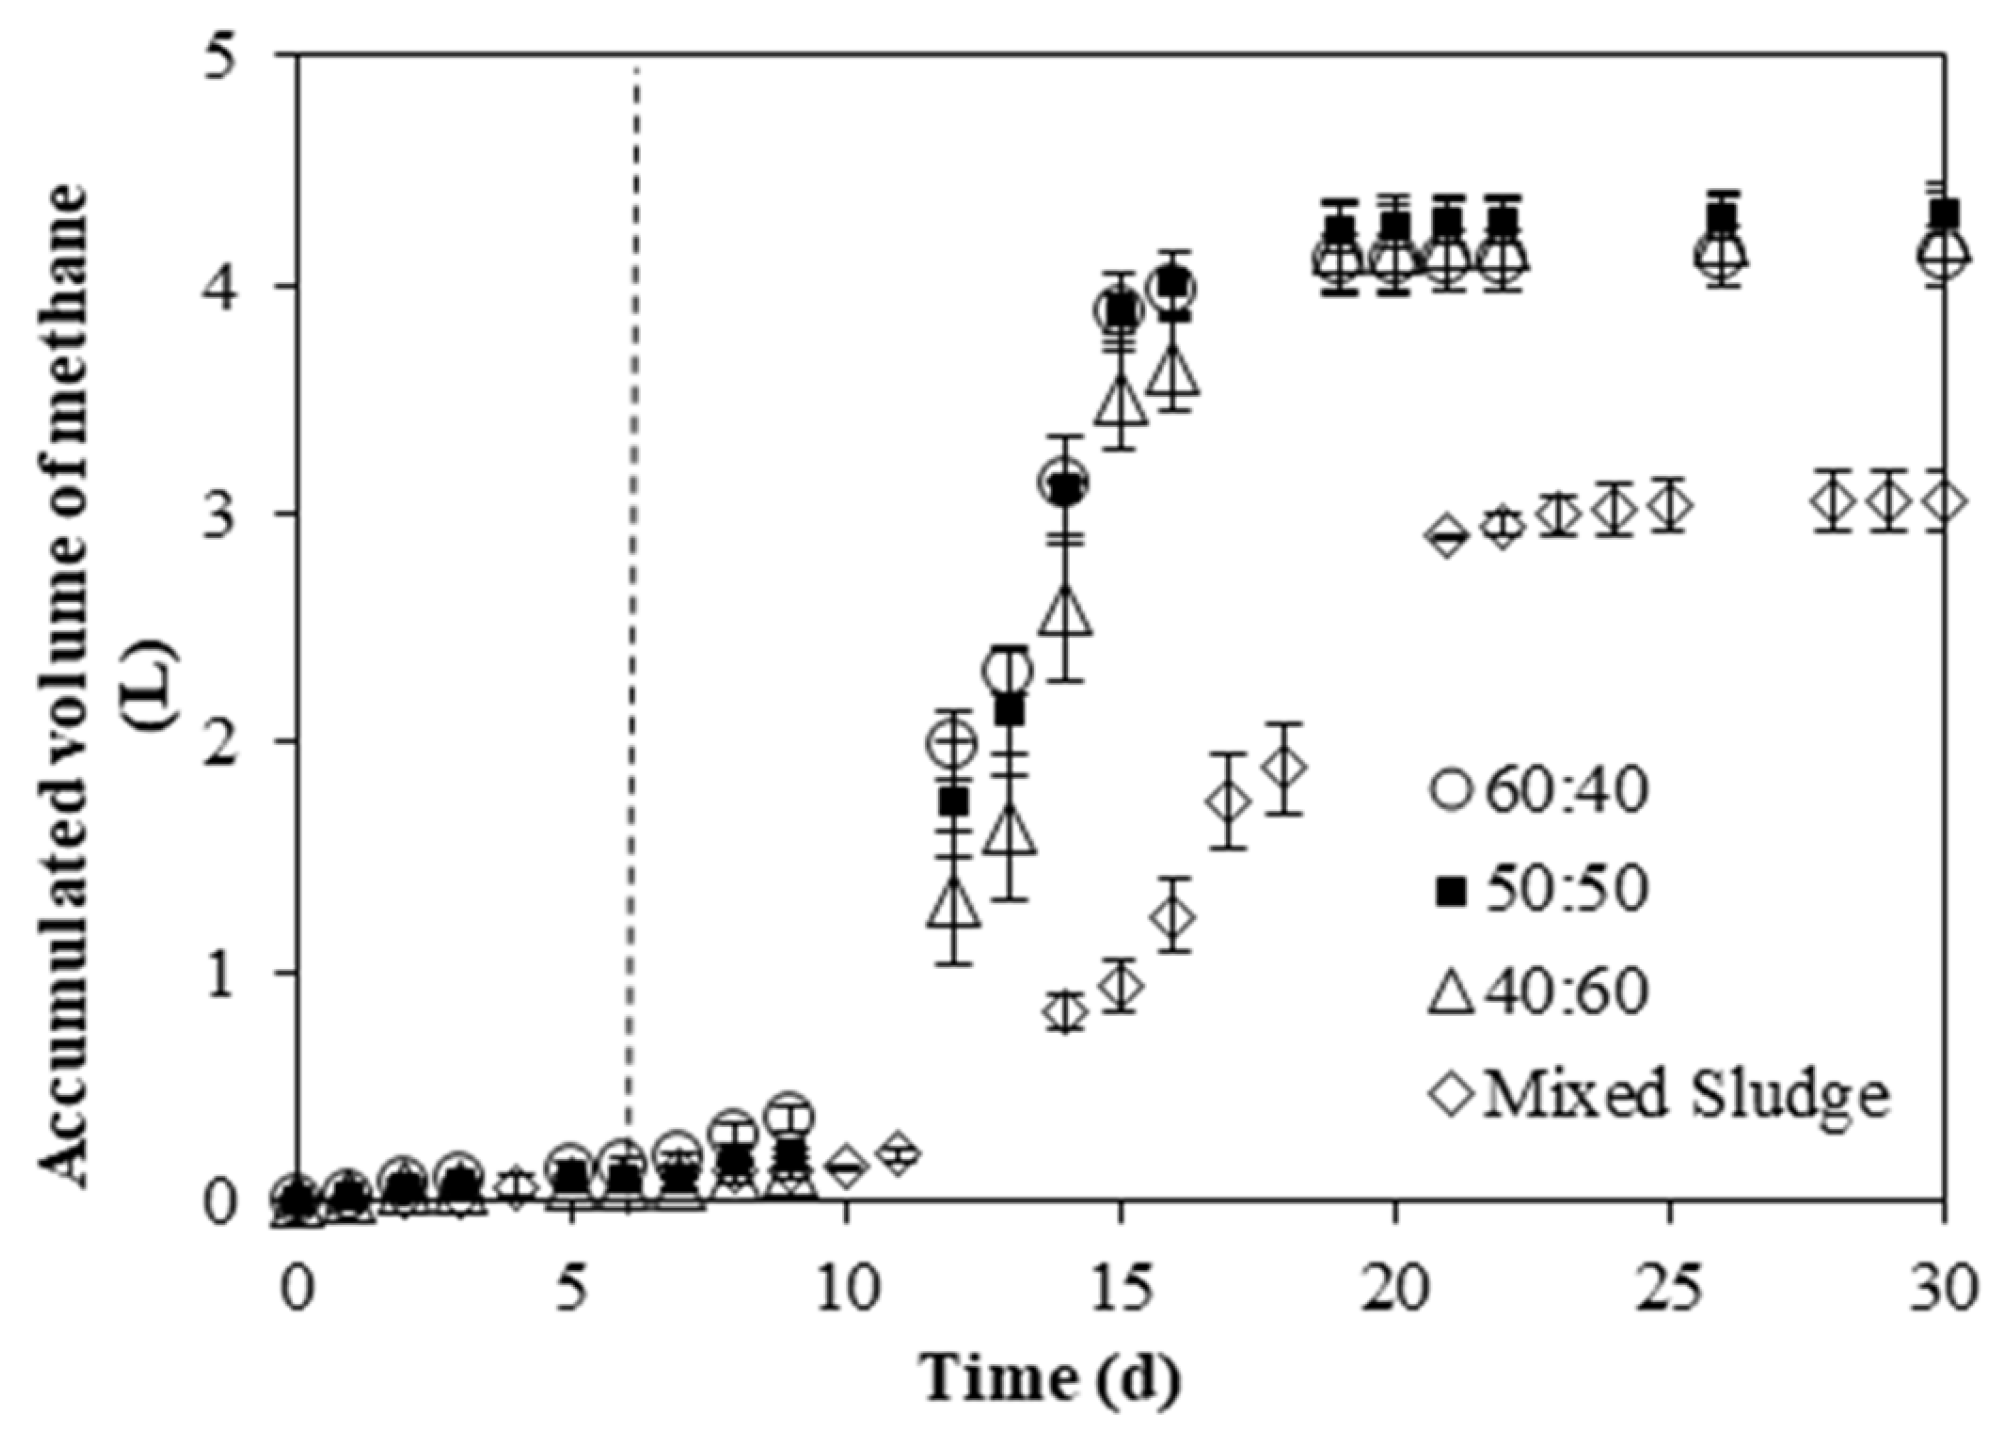
3.2.3. Methane Production

The initial hydrolytic-acidogenic phase, which lasted until around day 6, was characterized by lower methane production, as can be seen in Figure S5, which shows how the methane content of the biogas changed over time. This is attributed to the slower growth of methanogenic microorganisms, a consequence of the significant VFAs concentration (Figure 4A) that led to a decrease in pH (Figure 4B), thus resulting in conditions less favorable for methanogenic activity. However, within this initial phase, hydrogenotrophic methanogens, known for their relatively faster growth rates, likely initiated the process of methane production from hydrogen and carbon dioxide. The pH values during this period ranged from approximately 6.2 to 6.8 (Figure 4B), falling within the 5.0 < pH ≤ 7.2 range identified by Ajayi-Banji et al. [29] as “slightly favorable” for methane-producing archaea. Consistent with this, the methane percentages observed during this period were generally lower than those observed later in the process, which aligns with the 10–45% methane concentration range reported [29] for this pH range.
Around day 9, the solubilized organic matter resulting from the initial phase, mainly VFAs (Figure 4A), became readily available for consumption (Figure 6) by the established methanogenic community, coinciding with the onset of significantly increased methane generation. As the more readily degradable substrates, such as acetate (as suggested by its earlier consumption trend in Figure 5), were depleted, an asymptotic trend in methane accumulation was observed in all three mixtures by approximately day 19, indicating biodegradable substrate removal. Throughout this methanogenic phase, and from day 9 onwards, the pH remained relatively stable and consistently above 7.4, generally ranging between 7.3 and 8.0. This pH range falls within the optimal range (7.3 < pH ≤ 8.4) reported by Ajayi-Banji et al. [29], which favors methanogen growth. Under these conditions, acetoclastic methanogens are likely to be predominant, given their role in converting acetate directly into methane and carbon dioxide. Ajayi-Banji et al. [29] also reported methane concentrations between 42% and 69% within this pH range. In the present study, methane content during the methanogenic phase reached approximately 83% (Figure S5), suggesting that the pH conditions were indeed conducive to methane production.
Comparing the cumulative methane production (Figure 7) from the 60:40, 50:50, and 40:60 mixtures of mixed sludge and OSBTOP with that from the mono-digestion of mixed sludge, increases of 35%, 41%, and 38% were observed, respectively. However, these differences were not statistically significant in terms of methane productivity (Table S2). Furthermore, the median time to generate 50% of the total accumulated (Figure 7) methane was shorter in the co-digestion assays with the 60:40 mixture (12 days) than in the mixed sludge assay (16–17 days). This difference is also evident in the slope of the methane production curve during the period of maximum production, which was notably steeper in the co-digestion assays.
While Figure 7 presents the cumulative methane volume to illustrate the temporal evolution of production, this also allows for the observation of methane production kinetics. In parallel, the overall efficiency of organic matter conversion is quantified by the specific methane yields. The 60:40 mixture exhibited a methane yield of 227.57 LCH4−1 · kgVSconsumed−1 and 91.57 LCH4−1 · kgVSadded−1. The 50:50 mixture showed a yield of 269.93 LCH4−1 · kgVSconsumed−1 and 96.90 LCH4−1 · kgVSadded−1, while the 40:60 mixture achieved 278.39 LCH4−1 · kgVSconsumed−1 and 103.72 LCH4−1 · kgVSadded−1. In contrast, the mono-digestion of mixed sludge resulted in a methane yield of 185.85 LCH4−1 · kgVSconsumed−1 and 86.07 LCH4−1 · kgVSadded−1. These results indicate that increasing the proportion of OSBTOP in the co-digestion mixtures correlates with higher methane yields, both in terms of VS consumed and VS added, compared to the digestion of mixed sludge alone. Although the assays with mixed sludge alone showed higher VS removal efficiency (Figure S2) and a greater proportion of soluble material (Figure 6), methane production was lower. This may be attributed to the presence of less biodegradable compounds, which are not readily converted into methane.
These findings are consistent with those reported in previous studies that utilize substrates such as OMSW, 2POMW, and olive husks, which exhibit characteristics similar to OSBTOP (the substrate used in this study), in batch systems. The main difference lies in the choice of co-substrate: while in this study OSBTOP was co-digested with mixed sludge, other works have explored combinations with different co-substrates. For example, a mixture of OMSW and Dunaliella salina (microalga), at a 75:25 ratio achieved a methane yield of 330 LCH4−1 · kgVSadded−1 [46]. Similarly, in a study involving the macroalga Rugulopteryx okamurae, the highest methane production was obtained from the co-digestion mixture with a ratio of 1:3 of R. okamurae to OMSW (based on the VS ratio of the substrates), yielding 454 LCH4−1 · kgVSadded−1 [47]. In another study, 2POMW was co-digested with CM at a ratio of 75:25 and a TS of 10%, reaching a yield of 35.80 LCH4−1 · kgVSadded−1 [41]. Additionally, a mixture of olive husks and FW (33:67 weight ratio) resulted in a significantly higher yield of 446 LCH4−1 · kgVSadded−1 [42]. These results emphasize that, although the primary substrate (olive by-product) is similar across studies, the co-substrate selection significantly influences methane production. Mixed sludge proves to be a suitable and competitive option, with performances within the range of values reported in similar studies.
In conclusion, several parameters exhibited increased maximum concentrations with a higher proportion of OSBTOP in the mixture, notably SCOD, and the levels of acetic and propionic acids, suggesting a greater potential of this substrate to contribute methanizable organic matter upon hydrolysis. Consequently, the mixture with a 40% mixed sludge and 60% OSBTOP ratio demonstrated the highest yield in terms of methane productivity relative to consumed and initial VS However, for continuous operation and to enhance process robustness against potential disturbances, stability, and buffering capacity, mixtures richer in sludge (60:40) are preferable due to the higher alkalinity of sludge, which can buffer the generation of VFAs from the hydrolysis of organic compounds in the OSBTOP. This aspect has been observed with similar substrates where high concentrations of olive alperujo have been shown to cause acidification episodes, likely due to its high fat content (~12%), which inhibit methanogenic Archaea [48,49]. This option (60:40 mixture) allows for the fulfillment of the main objective of this study, which is to improve the characteristics of sludge for AD. The 60:40 mixture, compared to the digestion of mixed sludge alone, resulted in a higher final biogas production (38%) and an earlier, accelerated generation rate. Crucially, it also enables the management of a greater quantity of sludge, as its production in WWTPs significantly exceeds that of OSBTOP. Therefore, evaluating its performance in semi-continuous operation is of interest.

3.3. Semi-Continuous Experiments: Mono- and Co-Digestion Comparison

The following section will evaluate the anaerobic co-digestion performance of the selected mixture (60:40, mixed sludge and OSBTOP). This performance will be compared with the mono-digestion of mixed sludge, using stabilized data from the inoculation reactor after its use in batch experiments as a baseline. The selected mixture and the mixed sludge served as the feed for the reactors (Table S3), which were operated in semi-continuous mode.

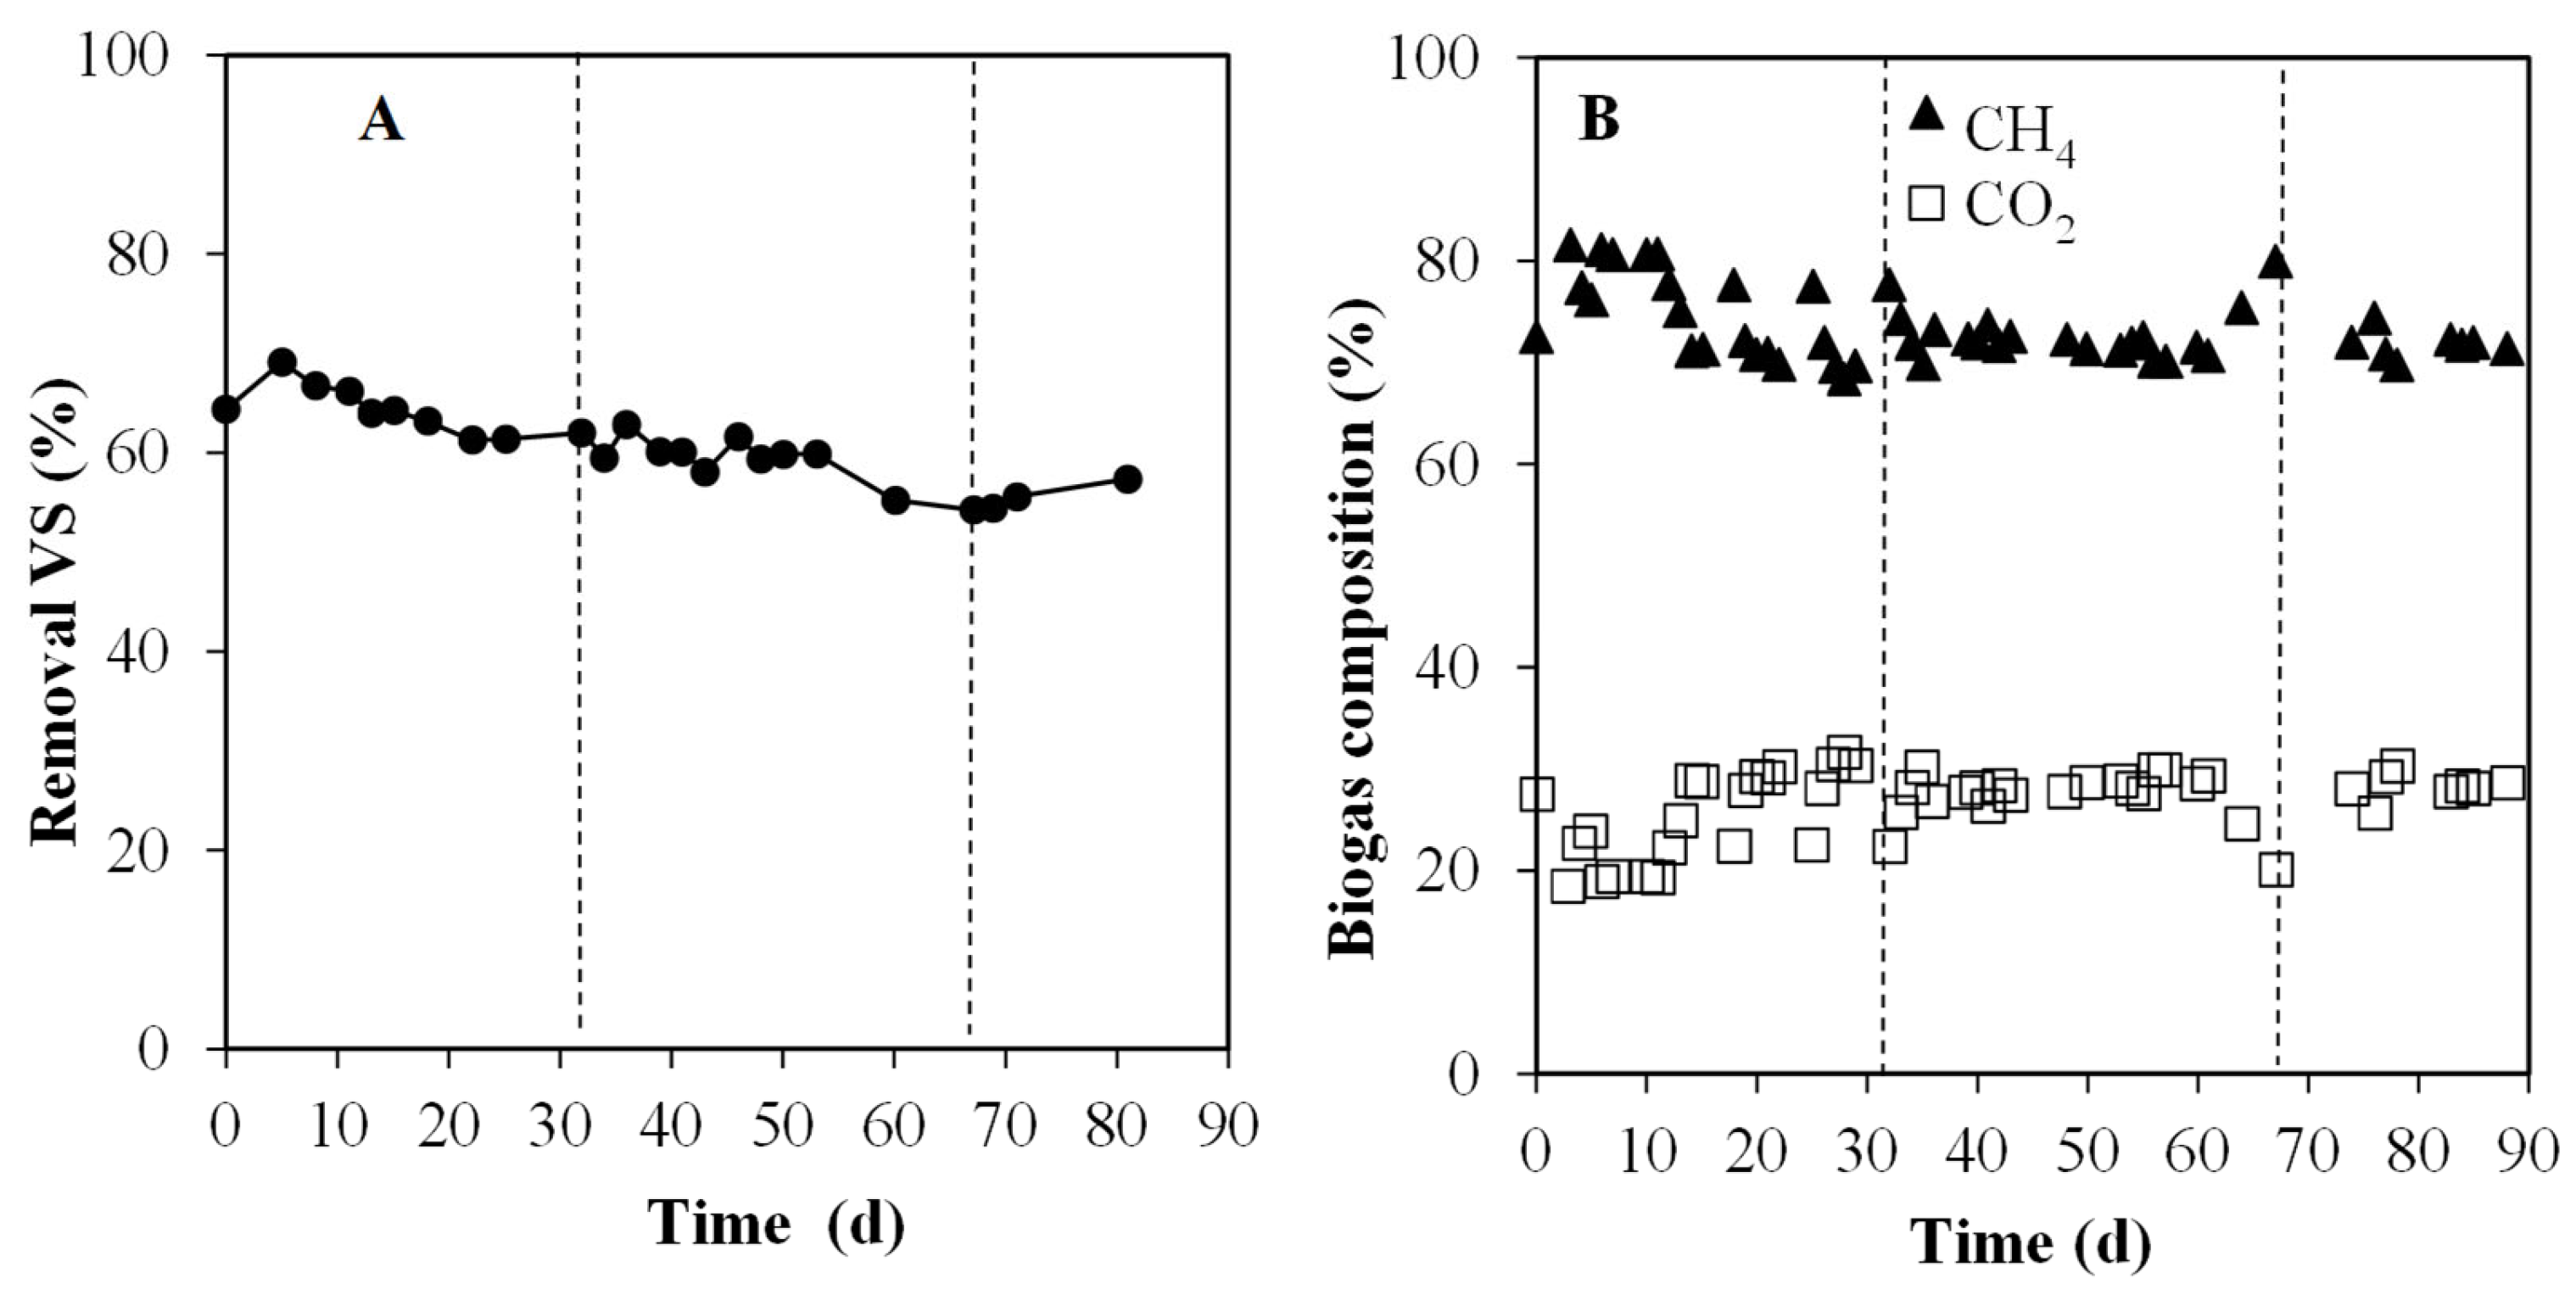
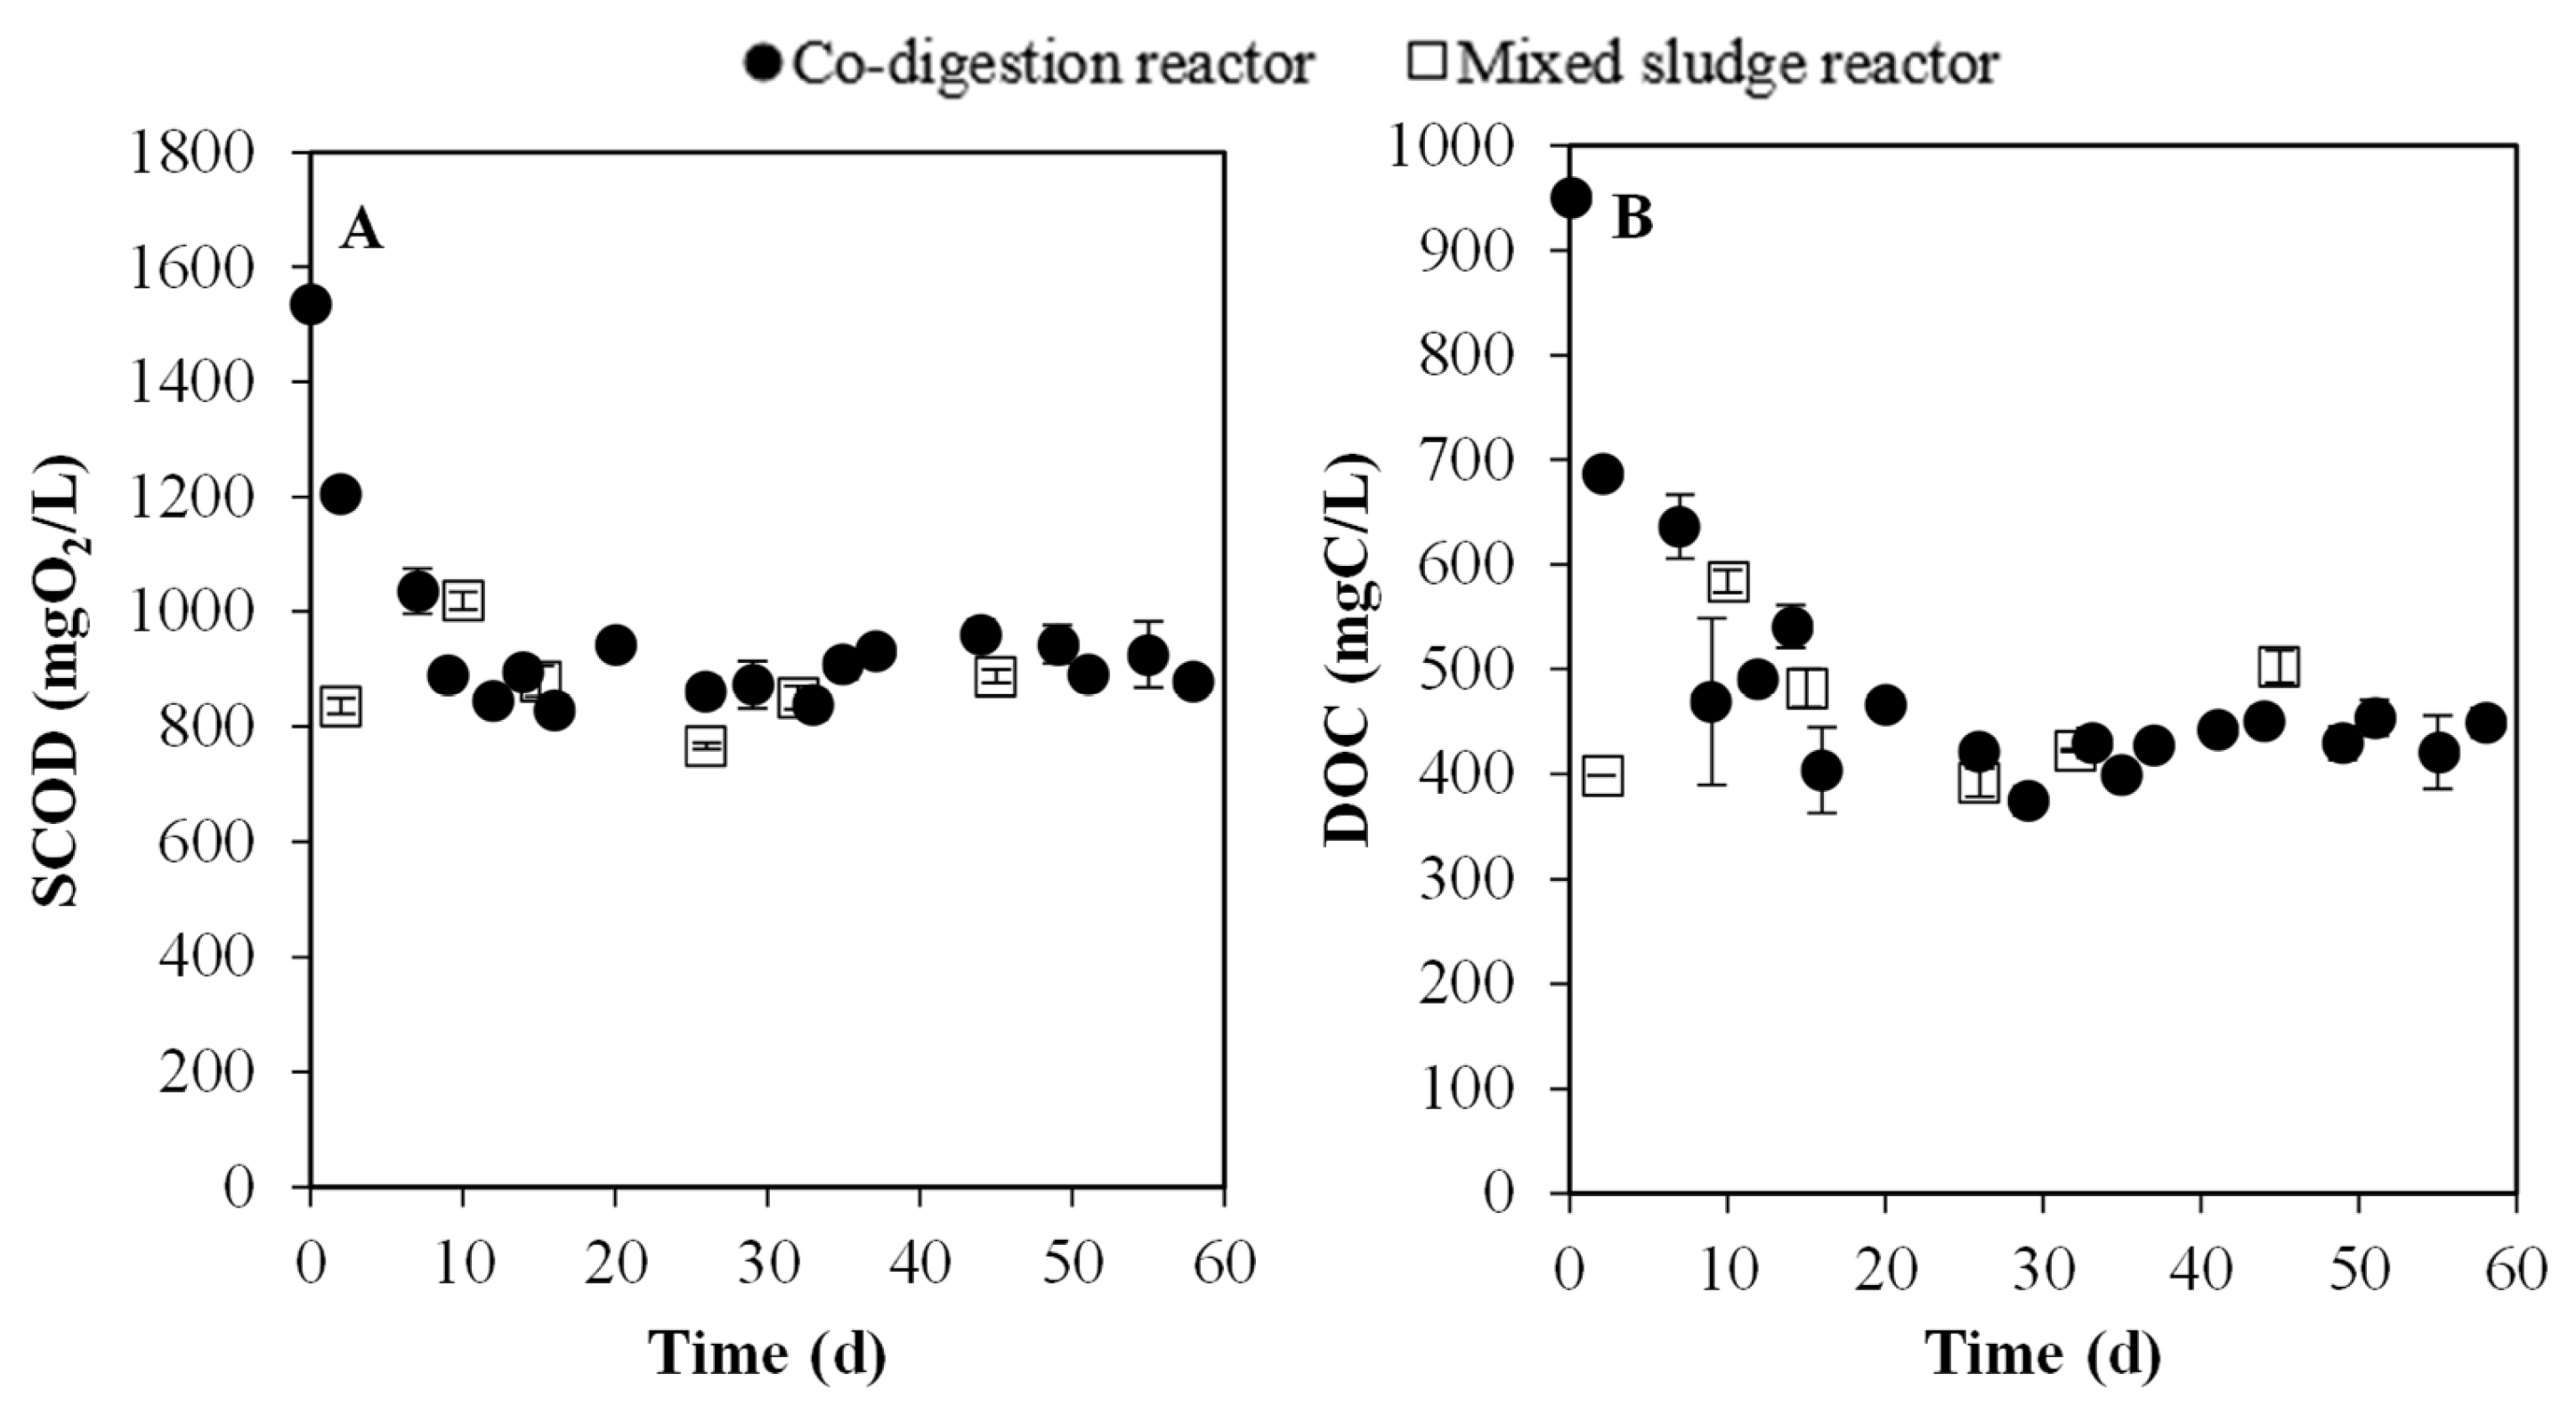
3.3.1. Evolution of Particulate and Soluble Organic Matter

AD is used to degrade organic matter. The average VS removal efficiencies were 41.8% (±6%) for the co-digestion reactor and 46.5% (±2.5%) for the mixed sludge reactor. As illustrated in Figure S6, both TS and VS showed a marked decrease from influent to effluent in both the co-digestion and mixed sludge reactors, providing visual confirmation of effective organic matter degradation. These results are comparable to those reported in a semi-continuous study using 2POMW co-digested with CM at a 60:40 ratio, operated under mesophilic conditions with approximately 10% TS and a HRT of 30 days, which achieved a VS removal efficiency of 46.5% [50].
In terms of the concentration of solubilized organic matter, an initial period of significant consumption of dissolved organic matter is observed within the first 12 days for both SCOD and DOC (Figure 8). Subsequently, the levels of both parameters stabilize at approximately 894.3 (±42.4) mgO2/L and 439.9 (±39.7) mgC/L for SCOD and DOC, respectively. During this period, stable methane production is observed, as shown in Section 3.3.2. Additionally, the baseline concentration of residual soluble organic matter, representing a fraction of dissolved compounds that are difficult to biodegrade, can be determined. With respect to the reactor fed with mixed sludge, during the stable biogas production periods, concentrations were around 873.0 (±83.5) mgO2/L and 463.4 (±74.0) mgC/L, slightly lower for SCOD (Figure 8A) and higher for DOC (Figure 8B) compared to the co-digestion reactor.

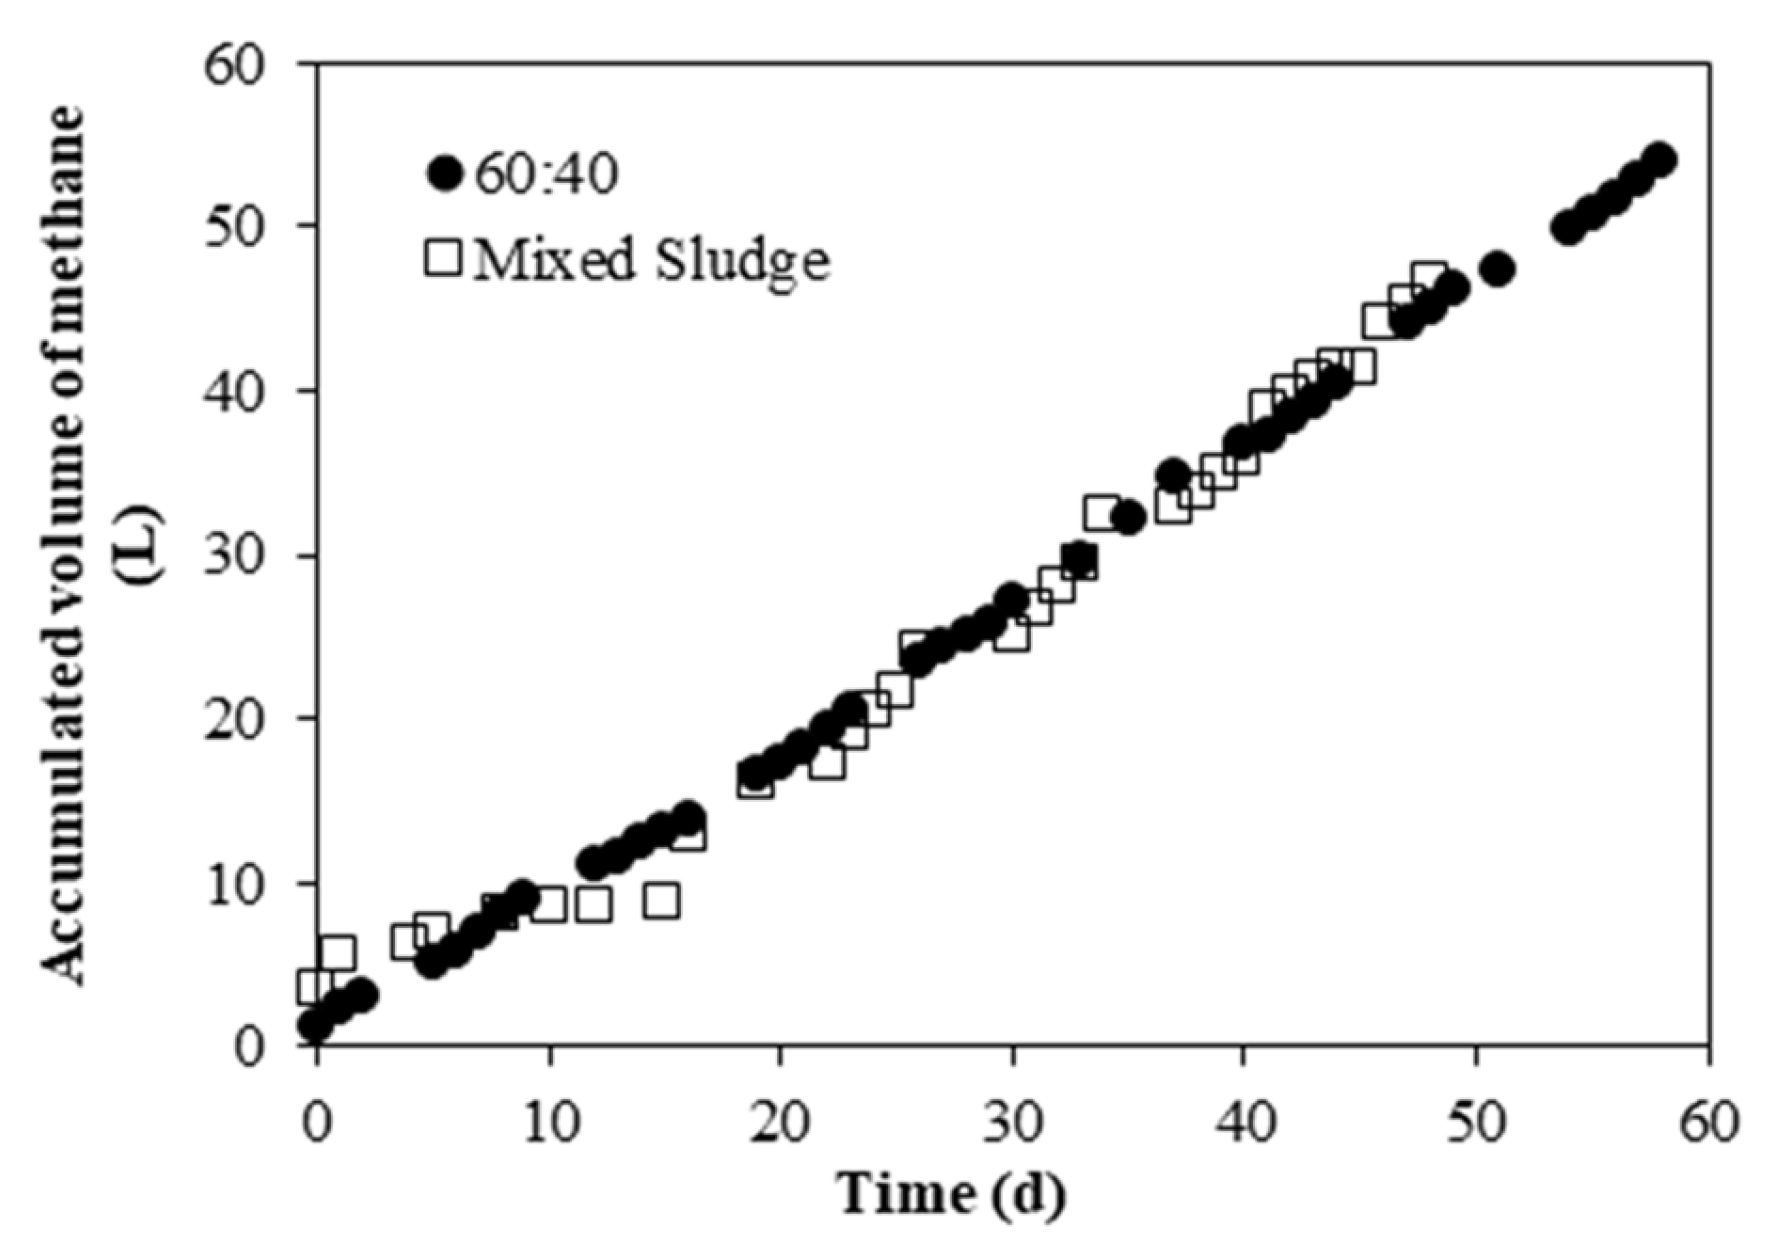
3.3.2. Methane Production

Figure 9 presents the cumulative methane production throughout the experimental period for both reactors. The mixed sludge reactor exhibited an initial period of low methane production, attributed to the disruption caused by the partial emptying of the reactor when it was used as inoculum for the batch assays. Once stability was achieved, methane production reached 1.06 LCH4−1 · d−1. In contrast, the co-digestion reactor demonstrated stable methane production from the beginning of the experiment. This stability is due to the start-up procedure employed, which involved initiating the reactor with AD of mixed sludge and gradually adding the corresponding volume of co-substrates daily, based on the 30-day HRT. This approach facilitated a progressive acclimation of the anaerobic microbiota to the substrate mixture. In contrast to the batch assays, the pH remained stable in both reactors throughout the experimental period, at approximately 7.20. This behavior indicates process stability, as no pH decrease was observed at any time, despite the acidic nature of the feeds, particularly the co-substrate mixture, which had an initial pH of around 6.03. The methane production obtained for the co-digestion reactor was 0.96 LCH4−1 · d−1. Regarding biogas composition, both reactors show similar methane proportions in the biogas, with averages of 74.5% (±4.0%) and 73.1% (±3.4%) for the co-digestion and mixed sludge reactors, respectively, over the entire experimental period.
Methane yield based on VS consumed was 440 (±80) LCH4−1 · kgVSconsumed−1 for the co-digestion reactor and 430 (±110) LCH4−1 · kgVSconsumed−1 for the mixed sludge reactor. In order to more clearly assess the impact of OSBTOP, a co-substrate rich in biodegradable organic carbon, on overall methane production and the efficiency of organic matter conversion, the specific methane yield, expressed as volume of methane produced per kilogram of volatile solids (VS) added, was calculated. This normalization enables a more accurate comparison between reactors, taking into account the differing substrate characteristics and the resulting variation in operational organic loading rates (OLRs). The average methane yield based on VS added was 180 (±40) LCH4−1 · kgVSadded−1 and 120 (±70) LCH4−1 · kgVSadded−1 for the co-digestion and mixed sludge reactors, respectively.
The value obtained for the co-digestion reactor is comparable to those reported in other studies using different co-substrates, such as CM, which yielded 170 LCH4−1 · kgVSadded−1 in a semi-continuous system with a 60:40 (w/w) mixture of 2POMW and CM [50].
In conclusion, consistent with observations in batch experiments, the semi-continuous results confirm that OSBTOP is a suitable co-substrate for mixed sludge, representing an effective strategy to enhance its methane yield (50% improvement compared to mono-digestion).

4. Conclusions

The present study conclusively demonstrates the effective enhancement of methane production through the mesophilic anaerobic co-digestion of sewage sludge and OSBTOP. Notably, batch assays revealed a significant 35–41% increase in methane content across all tested mixtures compared to sludge digestion alone. While a 40:60 sludge-to-OSBTOP ratio exhibited the highest methane yield in batch mode, a 60:40 ratio is recommended for continuous operation. This preference for a sludge-rich mixture in continuous systems is attributed to the inherent alkalinity of the sludge, which provides crucial buffering capacity against VFAs accumulation, thereby promoting continuous process stability. Furthermore, the 60:40 ratio aligns with the higher availability of sewage sludge in WWTPs, facilitating more effective overall waste management. Semi-continuous operation further validated the benefits of co-digestion. Utilizing a 60:40 mixed sludge-to-OSBTOP ratio, methane yield reached 180 (±40) LCH4−1 · kgVSadded−1, a 50% improvement over the 120 (±70) LCH4−1 · kgVSadded−1 achieved with mixed sludge alone.
This research highlights the potential of OSBTOP as a novel and effective co-substrate for AD. The study demonstrates that OSBTOP, effectively enhances methane production when co-digested with mixed sludge, offering a sustainable improvement for sludge management. As the first study to explore the AD of OSBTOP, it addresses a key gap in the valorization of this by-product. A notable advantage of OSBTOP is its consistent, year-round availability, which contrasts with the seasonal nature of other lignocellulosic residues such as 2POMW, making it particularly suitable for stable and continuous biogas production. Anaerobic co-digestion of OSBTOP in WWTPs is a strategy that reduces greenhouse gas emissions while generating biogas sustainably for on-site energy use, which could lower operational costs. This approach enhances waste valorization and energy recovery, promoting sustainable resource management and strengthening energy self-sufficiency within a circular economy framework.

Supplementary Materials

The following supporting information can be downloaded at: https://www.mdpi.com/article/10.3390/en18143812/s1, Table S1: Statistical results (p-values) for the parameters evaluated in the experimental duplicates; Table S2: Statistical results (p-values) obtained for the parameters evaluated in the different tested mixtures (60:40, 50:50, and 40:60), as well as in the Mixed Sludge and the 60:40 mixture; Figure S1: Cumulative methane production in the inoculation reactor. The vertical lines indicate the days on which effluent was removed from the reactor; Figure S2: Percentage of TS and VS removed in batch experiments; Figure S3: Evolution of total (A) and volatile solids (B) for the different mixtures and the inoculum used; Figure S4: Evolution of DOC in the batch reactors; Figure S5: Methane content in biogas for 60:40 (A), 50:50 (B), 40:60 (C) mixtures and Mixed Sludge (D); Table S3: Physicochemical parameters measured in the semi-continuous reactor feeds; Figure S6: Average values of TS and VS in the feed and effluent in semi-continuous experiments.

Author Contributions

Conceptualization, J.L.G.-M., E.T., F.E. and J.Á.R.; methodology, J.L.G.-M., E.T., F.E. and J.Á.R.; software, E.D.-D. and J.Á.R.; validation, J.L.G.-M. and J.L.; formal analysis, E.D.-D. and J.Á.R.; investigation, J.Á.R.; resources, J.L.G.-M., E.T. and F.E.; data curation, E.D.-D. and J.Á.R.; writing—original draft preparation, E.D.-D.; writing—review and editing, E.D.-D. and J.L.G.-M.; visualization, J.L.G.-M., E.T. and F.E.; supervision, J.L.G.-M. and J.L.; project administration, J.L.G.-M., E.T. and F.E.; funding acquisition, J.L.G.-M., E.T. and F.E. All authors have read and agreed to the published version of the manuscript.

Funding

This research was funded by the “Empresa Metropolitana de Abastecimiento y Sanea-miento de Aguas de Sevilla S.A.” (EMASESA), with partial support from the Corporación Tecno-lógica de Andalucía through research contract 18INOT2895-OT 2014/065 with the University of Cádiz. The authors would like to acknowledge the predoctoral contract granted by the Junta de Andalucía (PREDOC-01870) to Encarnación Díaz-Domínguez.

Data Availability Statement

The raw data supporting the conclusions of this article will be made available by the authors on request.

Conflicts of Interest

Authors Enrique Toro and Fernando Estévez were employed by the company Empresa Metropolitana de Abastecimiento y Saneamiento de Aguas de Sevilla S.A. (EMASESA). The remaining authors declare that the research was conducted in the absence of any commercial or financial relationships that could be construed as a potential conflict of interest.

Abbreviations

The following abbreviations are used in this manuscript:
ADAnaerobic Digestion
CMCattle Manure
C/NCarbon-to-Nitrogen Ratio
CODChemical Oxygen Demand
DOCDissolved Organic Carbon
ECElectrical Conductivity
EMASESAEmpresa Metropolitana de Abastecimiento y Saneamiento de Aguas de Sevilla S.A
FWFood Waste
GC-FIDGas Chromatography with Flame Ionization Detector
GC-TCDGas Chromatography with Thermal Conductivity Detector
HRTHydraulic Retention Time
IVAGROInstituto de Investigación Vitivinícola y Agroalimentaria
LCFAsLong-Chain Fatty Acids
MAGRAMAMinisterio de Agricultura Alimentación y Medio Ambiente
MITECOMinisterio para la Transición Ecológica y el Reto Demográfico
OLRsOrganic Loading Rates
OMSWOlive Mill Solid Waste
OSBTOPOrganic Solid By-Products from Table Olive Processing
PEMARPlan Estatal Marco de Gestión de Residuos
2POMWTwo-Phase Olive Mill Waste
SCODSoluble Chemical Oxygen Demand
TCDThermal Conductivity Detector
TCODTotal Chemical Oxygen Demand
TNKTotal Kjeldahl Nitrogen
TOCTotal Organic Carbon
TSTotal Solids
TVFATotal Volatile Fatty Acids
VFAsVolatile Fatty Acids
VSVolatile Solids
WWTPWastewater Treatment Plant

References

  1. Ministerio de Agricultura Alimentación y Medio Ambiente (MAGRAMA). Plan Estatal Marco de Gestión de Residuos (PEMAR); Ministerio de Agricultura, Alimentación y Medio Ambiente: Madrid, Spain, 2015; pp. 1–182. Available online: https://www.miteco.gob.es/content/dam/miteco/es/calidad-y-evaluacion-ambiental/planes-y-estrategias/pemaraprobado6noviembrecondae_tcm30-170428.pdf (accessed on 5 June 2025).
  2. Ministerio para la Transición Ecológica y el Reto Demográfico (MITECO). Ministerio Para La Transición Ecológica y El Reto Demográfico, Calidad y Evaluación Ambiental, Prevención y Gestión de Residuos, Flujos de Residuos, Lodos de Depuradora. Available online: https://www.miteco.gob.es/es/calidad-y-evaluacion-ambiental/temas/prevencion-y-gestion-residuos/flujos/lodos-depuradora.html (accessed on 19 September 2024).
  3. Consejo Oleícola Internacional Estadísticas de Las Aceitunas de Mesa. Available online: https://www.internationaloliveoil.org/que-hacemos/unidad-de-asuntos-econonicos-y-promocion/?lang=es#figures (accessed on 20 April 2025).
  4. Ahring, B.K. Perspectives for Anaerobic Digestion. In Advances in Biochemical Engineering/Biotechnology; Springer: Berlin/Heidelberg, Germany, 2003; Volume 81, pp. 1–30. [Google Scholar] [CrossRef]
  5. Kiyasudeen, K.; Ibrahim, M.H.; Quaik, S.; Ismail, S.A. Prospects of Organic Waste Management and the Significance of Earthworms; Applied Environmental Science and Engineering for a Sustainable Future Series; Springer: Cham, Switzerland, 2016; pp. 23–44. [Google Scholar] [CrossRef]
  6. Shah, S.V.; Yadav Lamba, B.; Tiwari, A.K.; Chen, W.H. Sustainable Biogas Production via Anaerobic Digestion with Focus on CSTR Technology: A Review. J. Taiwan Inst. Chem. Eng. 2024, 162, 105575. [Google Scholar] [CrossRef]
  7. Olivera, M.; Barriga, F.; Neumann, P.; Gómez, G.; Vidal, G. Effects of Short Retention Times and Ultrasound Pretreatment on Ammonium Concentration and Organic Matter Transformation in Anaerobic Digesters Treating Sewage Sludge. Fermentation 2024, 10, 63. [Google Scholar] [CrossRef]
  8. Borja, R.; Alba, J.; Banks, C.J. Impact of the Main Phenolic Compounds of Olive Mill Wastewater (OMW) on the Kinetics of Acetoclastic Methanogenesis. Process Biochem. 1997, 32, 121–133. [Google Scholar] [CrossRef]
  9. Chen, Y.; Cheng, J.J.; Creamer, K.S. Inhibition of Anaerobic Digestion Process: A Review. Bioresour. Technol. 2008, 99, 4044–4064. [Google Scholar] [CrossRef]
  10. Kwietniewska, E.; Tys, J. Process Characteristics, Inhibition Factors and Methane Yields of Anaerobic Digestion Process, with Particular Focus on Microalgal Biomass Fermentation. Renew. Sustain. Energy Rev. 2014, 34, 491–500. [Google Scholar] [CrossRef]
  11. Induchoodan, T.G.; Haq, I.; Kalamdhad, A.S. Factors Affecting Anaerobic Digestion for Biogas Production: A Review, 1st ed.; Elsevier Ltd.: Amsterdam, The Netherlands, 2022; ISBN 9780323857925. [Google Scholar]
  12. Lin, C.Y.; Lay, C.H. Carbon/Nitrogen-Ratio Effect on Fermentative Hydrogen Production by Mixed Microflora. Int. J. Hydrogen Energy 2004, 29, 41–45. [Google Scholar] [CrossRef]
  13. Yang, G.; Wang, J. Co-Fermentation of Sewage Sludge with Ryegrass for Enhancing Hydrogen Production: Performance Evaluation and Kinetic Analysis. Bioresour. Technol. 2017, 243, 1027–1036. [Google Scholar] [CrossRef]
  14. Tena, M.; Luque, B.; Perez, M.; Solera, R. Enhanced Hydrogen Production from Sewage Sludge by Cofermentation with Wine Vinasse. Int. J. Hydrogen Energy 2020, 45, 15977–15984. [Google Scholar] [CrossRef]
  15. García-Morales, J.L.; Angeriz, R.; Gómez, J.; Suffo, M. Composting of Organic Solid By-Products from Table Olive Processing (OSBTOP). In Proceedings of the 16th International RAMIRAN Conference 2015 on Rural-Urban Symbiosis, Hamburg, Germany, 8–10 September 2015; University of Veterinary Medicine and Pharmacy in Košice: Košice, Slovakia, 2015; pp. 3–6. [Google Scholar]
  16. Zahan, Z.; Georgiou, S.; Muster, T.H.; Othman, M.Z. Semi-Continuous Anaerobic Co-Digestion of Chicken Litter with Agricultural and Food Wastes: A Case Study on the Effect of Carbon/Nitrogen Ratio, Substrates Mixing Ratio and Organic Loading. Bioresour. Technol. 2018, 270, 245–254. [Google Scholar] [CrossRef]
  17. Julio Guerrero, I.C.; Peláez Jaramillo, C.A.; Molina Perez, F.J. Evaluación de La Co-Digestión Anaerobia de Lodos de Aguas Residuales Municipales Con Residuos de Alimentos. Rev. ION 2016, 29, 63–70. [Google Scholar] [CrossRef]
  18. Náthia-Neves, G.; Berni, M.; Dragone, G.; Mussatto, S.I.; Forster-Carneiro, T. Anaerobic Digestion Process: Technological Aspects and Recent Developments. Int. J. Environ. Sci. Technol. 2018, 15, 2033–2046. [Google Scholar] [CrossRef]
  19. Liu, Y.; Ngo, H.H.; Guo, W.; Peng, L.; Wang, D.; Ni, B. The Roles of Free Ammonia (FA) in Biological Wastewater Treatment Processes: A Review. Environ. Int. 2019, 123, 10–19. [Google Scholar] [CrossRef]
  20. Yamamoto-Ikemoto, R.; Matsuura, N.; Honda, R.; Hara-Yamamura, H.; Some, K.; Prak, S.; Koike, K.; Togari, T. Ammonia Tolerance and Microbial Community in Thermophilic Co-Digestion of Sewage Sludge Initiated with Lignocellulosic Biomass. Bioresour. Technol. 2023, 376, 128834. [Google Scholar] [CrossRef] [PubMed]
  21. Ezieke, A.H.; Serrano, A.; Clarke, W.; Villa-Gomez, D.K. Bottom Ash from Smouldered Digestate and Coconut Coir as an Alkalinity Supplement for the Anaerobic Digestion of Fruit Waste. Chemosphere 2022, 296, 134049. [Google Scholar] [CrossRef]
  22. Silva, I.; Gouveia, B.; Azevedo, A.; Fernandes, E.C.; Duarte, E. Anaerobic Co-Digestion of Municipal Mixed Sludge and Mango Peel Biowaste: Performance and Stability Analysis for Different Ratios. Results Eng. 2024, 22, 102142. [Google Scholar] [CrossRef]
  23. Rubio, J.A.; Romero, L.I.; Wilkie, A.C.; García-Morales, J.L. Mesophilic Anaerobic Co-Digestion of Olive-Mill Waste with Cattle Manure: Effects of Mixture Ratio. Front. Sustain. Food Syst. 2019, 3, 9. [Google Scholar] [CrossRef]
  24. Halmaciu, I.A.; Ionel, I.; Miutescu, M.C.; Grecu, E. Novel Specifications Regarding Biogas Production from Agriengineering Activities in Romania. AgriEngineering 2024, 6, 3602–3617. [Google Scholar] [CrossRef]
  25. Holliger, C.; Alves, M.; Andrade, D.; Angelidaki, I.; Astals, S.; Baier, U.; Bougrier, C.; Buffière, P.; Carballa, M.; De Wilde, V.; et al. Towards a Standardization of Biomethane Potential Tests. Water Sci. Technol. 2016, 74, 2515–2522. [Google Scholar] [CrossRef]
  26. Methods Standard. Standard Methods for the Examination of Water and Wastewater; Methods Standard: Washington, DC, USA, 2012; Volume 16. [Google Scholar]
  27. Zahedi, S.; Rivero, M.; Solera, R.; Perez, M. Seeking to Enhance the Bioenergy of Municipal Sludge: Effect of Alkali Pre-Treatment and Soluble Organic Matter Supplementation. Waste Manag. 2017, 68, 398–404. [Google Scholar] [CrossRef]
  28. Mao, C.; Feng, Y.; Wang, X.; Ren, G. Review on Research Achievements of Biogas from Anaerobic Digestion. Renew. Sustain. Energy Rev. 2015, 45, 540–555. [Google Scholar] [CrossRef]
  29. Ajayi-Banji, A.; Rahman, S. A Review of Process Parameters Influence in Solid-State Anaerobic Digestion: Focus on Performance Stability Thresholds. Renew. Sustain. Energy Rev. 2022, 167, 112756. [Google Scholar] [CrossRef]
  30. Lohani, S.P.; Havukainen, J. Anaerobic Digestion: Factors Affecting Anaerobic Digestion Process. In Waste Bioremediation. Energy, Environment, and Sustainability; Springer: Singapore, 2018; pp. 343–359. [Google Scholar] [CrossRef]
  31. Appels, L.; Baeyens, J.; Degrève, J.; Dewil, R. Principles and Potential of the Anaerobic Digestion of Waste-Activated Sludge. Prog. Energy Combust. Sci. 2008, 34, 755–781. [Google Scholar] [CrossRef]
  32. Li, P.; He, C.; Yu, R.; Shen, D.; Jiao, Y. Anaerobic Co-Digestion of Urban Sewage Sludge with Agricultural Biomass. Waste Biomass Valorization 2020, 11, 6199–6209. [Google Scholar] [CrossRef]
  33. Pramanik, S.K.; Suja, F.B.; Zain, S.M.; Pramanik, B.K. The Anaerobic Digestion Process of Biogas Production from Food Waste: Prospects and Constraints. Bioresour. Technol. Rep. 2019, 8, 100310. [Google Scholar] [CrossRef]
  34. Mao, C.; Wang, X.; Xi, J.; Feng, Y.; Ren, G. Linkage of Kinetic Parameters with Process Parameters and Operational Conditions during Anaerobic Digestion. Energy 2017, 135, 352–360. [Google Scholar] [CrossRef]
  35. Pan, X.; Zhao, L.; Li, C.; Angelidaki, I.; Lv, N.; Ning, J.; Cai, G.; Zhu, G. Deep Insights into the Network of Acetate Metabolism in Anaerobic Digestion: Focusing on Syntrophic Acetate Oxidation and Homoacetogenesis. Water Res. 2021, 190, 116774. [Google Scholar] [CrossRef]
  36. Sun, J.; Zhang, L.; Loh, K.C. Review and Perspectives of Enhanced Volatile Fatty Acids Production from Acidogenic Fermentation of Lignocellulosic Biomass Wastes. Bioresour. Bioprocess. 2021, 8, 68. [Google Scholar] [CrossRef]
  37. Jiménez-Páez, E.; Serrano, A.; Purswani, J.; Correa-Galeote, D.; Cubero-Cardoso, J.; Fermoso, F.G. Impact on the Microbial Population during Biological Volatile Fatty Acid Production from Olive Mill Solid Waste. Environ. Technol. Innov. 2023, 32, 103409. [Google Scholar] [CrossRef]
  38. Rubio, J.A.; Fdez-Güelfo, L.A.; Romero-García, L.I.; Wilkie, A.C.; García-Morales, J.L. Start-up of the Mesophilic Anaerobic Co-Digestion of Two-Phase Olive-Mill Waste and Cattle Manure Using Volatile Fatty Acids as Process Control Parameter. Fuel 2022, 325, 124901. [Google Scholar] [CrossRef]
  39. Van Lier, J.B.; Grolle, K.C.F.; Frijters, C.T.M.J.; Stams, A.J.M.; Lettinga, G. Effects of Acetate, Propionate, and Butyrate on the Thermophilic Anaerobic Degradation of Propionate by Methanogenic Sludge and Defined Cultures. Appl. Environ. Microbiol. 1993, 59, 1003–1011. [Google Scholar] [CrossRef]
  40. Fan, Y.; Liu, Y.; Zhang, Z.; Sun, J.; Yang, X.; Deng, P.; Yang, H.; Zhao, Z. Alleviation of Propionic Acid Inhibition and Enhancement of Methane Production in Anaerobic Digestion by Micronano-Bubble Water Supplementation. Bioresour. Technol. 2025, 427, 132425. [Google Scholar] [CrossRef]
  41. Rubio, J.A.; Fdez-Güelfo, L.A.; Romero-García, L.I.; Wilkie, A.C.; García-Morales, J.L. Co-Digestion of Two-Phase Olive-Mill Waste and Cattle Manure: Influence of Solids Content on Process Performance. Fuel 2022, 322, 124187. [Google Scholar] [CrossRef]
  42. Pagliaccia, P.; Gallipoli, A.; Gianico, A.; Montecchio, D.; Braguglia, C.M. Single Stage Anaerobic Bioconversion of Food Waste in Mono and Co-Digestion with Olive Husks: Impact of Thermal Pretreatment on Hydrogen and Methane Production. Int. J. Hydrogen Energy 2016, 41, 905–915. [Google Scholar] [CrossRef]
  43. Pasalari, H.; Gharibi, H.; Darvishali, S.; Farzadkia, M. The Effects of Different Pretreatment Technologies on Microbial Community in Anaerobic Digestion Process: A Systematic Review. J. Environ. Health Sci. Eng. 2024, 22, 439–453. [Google Scholar] [CrossRef] [PubMed]
  44. Zhou, P.; Li, D.; Zhang, C.; Ping, Q.; Wang, L.; Li, Y. Comparison of Different Sewage Sludge Pretreatment Technologies for Improving Sludge Solubilization and Anaerobic Digestion Efficiency: A Comprehensive Review. Sci. Total Environ. 2024, 921, 171175. [Google Scholar] [CrossRef] [PubMed]
  45. Stoyanova, E.; Lundaa, T.; Bochmann, G.; Fuchs, W. Overcoming the Bottlenecks of Anaerobic Digestion of Olive Mill Solid Waste by Two-Stage Fermentation. Environ. Technol. 2017, 38, 394–405. [Google Scholar] [CrossRef] [PubMed]
  46. Fernández-Rodríguez, M.J.; Rincón, B.; Fermoso, F.G.; Jiménez, A.M.; Borja, R. Assessment of Two-Phase Olive Mill Solid Waste and Microalgae Co-Digestion to Improve Methane Production and Process Kinetics. Bioresour. Technol. 2014, 157, 263–269. [Google Scholar] [CrossRef]
  47. de la Lama-Calvente, D.; Fernández-Rodríguez, M.J.; Llanos, J.; Mancilla-Leytón, J.M.; Borja, R. Enhancing Methane Production from the Invasive Macroalga Rugulopteryx Okamurae through Anaerobic Co-Digestion with Olive Mill Solid Waste: Process Performance and Kinetic Analysis. J. Appl. Phycol. 2021, 33, 4113–4124. [Google Scholar] [CrossRef]
  48. Ortega, V.; Donoso-Bravo, A.; Chamy-Maggy, R.; Campos, J.L.; Mosquera-Corral, A.; Belmonte, M. Factors That Affect Methane Yield Using Raw Olive Alperujo (Unhydrolyzed) as Substrate in BMP Assays. Recycling 2022, 7, 15. [Google Scholar] [CrossRef]
  49. Cubero-Cardoso, J.; Llamas, M.; Trujillo-Reyes, Á.; Fernández-Prior, Á.; Rodríguez-Gutiérrez, G. Assessing the Potential of Olive Mill Solid Waste as Feedstock for Methane and Volatile Fatty Acids Production via Anaerobic Bioprocesses. New Biotechnol. 2024, 84, 77–84. [Google Scholar] [CrossRef]
  50. Rubio, J.A.; Fdez-Güelfo, L.A.; Romero-García, L.I.; Wilkie, A.C.; García-Morales, J.L. Mesophilic Anaerobic Co-Digestion of Two-Phase Olive-Mill Waste and Cattle Manure: Optimization of Semi-Continuous Process. Fuel 2022, 328, 125354. [Google Scholar] [CrossRef]
Figure 1. Photograph of inoculation reactor.
Energies 18 03812 g001
Figure 2. Photographs of the reactors used in the batch experiments.
Energies 18 03812 g002
Figure 3. Evolution of VS removal (A) and biogas composition (B) in the inoculation reactor. The vertical lines indicate the days on which effluent was removed from the reactor.
Energies 18 03812 g003
Figure 4. Evolution of TVFA expressed in acetic acid equivalent (A) and pH (B) in the batch reactors. The vertical lines indicate the date after which pH correction was no longer necessary.
Energies 18 03812 g004
Figure 5. Evolution of major individual VFA (acetic acid, propionic acid, and butyric acid) for the 60:40 (A), 50:50 (B) and 40:60 (C) batch experiments.
Energies 18 03812 g005
Figure 6. Evolution of SCOD in the batch reactors.
Energies 18 03812 g006
Figure 7. Accumulated volume of methane for the different mixtures in the batch reactors. The vertical line indicates the date after which pH correction was no longer necessary.
Energies 18 03812 g007
Figure 8. Evolution of SCOD (A) and DOC (B) in semi-continuous experiments.
Energies 18 03812 g008
Figure 9. Accumulated volume of methane in semi-continuous experiments.
Energies 18 03812 g009
Table 1. Physicochemical parameters measured in the different substrates and inoculum used.
ParameterUnitsOSBTOP 2Mixed Sludge 2Digested Sludge 2
pH-5.08 (±0.08)5.85 (±0.37)7.27 (±0.02)
ECmS/cm1.41 (±0.01)2.66 (±0.41)5.49 (±0.04)
Moisture%71.51 (±0.07)97.20 (±1.68)98.18 (±0.19)
TSg/kg284.92 (±0.66)28.03 (±16.77)18.15 (±1.87)
VSg/kg 1273.90 (±0.58)20.71 (±11.25)10.35 (±1.63)
TCODgO2/kg 1-35.32 (±14.40)18.52 (±0.47)
SCODgO2/kg 111.13 (±0.26)3.25 (±1.48)0.98 (±0.09)
DOCgC/L3.25 (±0.38)1.21 (±0.49)334.44 (±0.62)
TVFAgHAc/L1.15 (±0.50)1.94 (±0.43)29.51 (±0.58)
Organic Matter%96.13 (±0.05)75.27 (±3.26)56.78 (±3.31)
C%55.76 (±2.60)43.66 (±1.89)32.93 (±3.10)
N%1.2 (±0.71)6.34 (±0.80)8.10 (±0.90)
C/N-48.4 (±1.10)6.97 (±1.05)4.06 (±0.92)
AlkalinitygCaCO3/L0.40 (±0.00)1.94 (±0.37)4.14 (±0.20)
TKNg/kg 13.28 (±0.13)1.44 (±0.36)1.47 (±0.01)
Ammonia NitrogenmgNH3-N/kg 12.35 (±0.00)87.93 (±7.71)337.62 (±14.41)
1 Expressed in wet weight. 2 Standard deviation of the set of samples taken.
Table 2. C/N ratio and substrate proportions (based on wet weight) of the mixtures in the batch experiment.
NomenclatureMixed Sludge %OSBTOP %RatioC/N Ratio
Mixed sludge10001:06.7
60:4060403:220.8
50:5050501:125.0
40:6040602:329.3
Disclaimer/Publisher’s Note: The statements, opinions and data contained in all publications are solely those of the individual author(s) and contributor(s) and not of MDPI and/or the editor(s). MDPI and/or the editor(s) disclaim responsibility for any injury to people or property resulting from any ideas, methods, instructions or products referred to in the content.

