Article

Flexible Operation of High-Temperature Heat Pumps Through Sizing and Control of Energy Stored in Integrated Steam Accumulators

by
Andrea Vecchi
1,*,
Jose Hector Bastida Hernandez
2 and
Adriano Sciacovelli
3,*
1
Department of Mechanical Engineering, The University of Melbourne, Parkville, VIC 3010, Australia
2
School of Engineering, Cardiff University, Cardiff CF24 3AA, UK
3
Department of Civil and Mechanical Engineering, Technical University of Denmark (DTU), 2800 Kongens Lyngby, Denmark
*
Authors to whom correspondence should be addressed.
Energies 2025, 18(14), 3806; https://doi.org/10.3390/en18143806
Submission received: 27 May 2025 / Revised: 9 July 2025 / Accepted: 15 July 2025 / Published: 17 July 2025
(This article belongs to the Special Issue Trends and Developments in District Heating and Cooling Technologies)

Abstract

Steam networks are widely used for industrial heat supply. High-temperature heat pumps (HTHPs) are an increasingly attractive low-emission solution to traditional steam generation, which could also improve the operational efficiency and energy demand flexibility of industrial processes. This work characterises 4-bar steam supply via HTHPs and aims to assess how variations in power input that result from flexible HTHP operation may affect steam flow and temperature, both with and without a downstream steam accumulator (SA). First, steady-state modelling is used for system design. Then, dynamic component models are developed and used to simulate the system response to HTHP power input variations. The performance of different SA integration layouts and sizes is evaluated. Results demonstrate that steam supply fluctuations closely follow changes in HTHP operation. A downstream SA is shown to mitigate these variations to an extent that depends on its capacity. Practical SA sizing recommendations are derived, which allow for the containment of steam supply fluctuations within acceptability. By providing a basis for evaluating the financial viability of flexible HTHP operation for steam provision, the results support clean technology’s development and uptake in industrial steam and district heating networks.

1. Introduction

District systems offer a rational solution to efficiently meet the energy demand of an aggregation of users [1]. Alongside district heating [2] and cooling [3] networks delivering thermal energy to customers mostly in the residential and commercial building sectors, steam networks are widespread in industry to provide process heat up to 250 °C [4,5] and are typically supplied by burning fossil fuels [6]. As electric heating technologies reach commercial maturity, their use in conjunction with clean electricity is becoming a more attractive way to supply steam with lower associated emissions and, potentially, greater demand-side flexibility [7]. However, many industries operate on tight margins [8] and require a constant, on-demand steam supply to avoid costly downtime. Any flexible, electricity-based steam generation must therefore meet strict operational requirements.
Heat pumps use electricity to upgrade heat from a source to a higher-temperature sink. They are well-established for space heating applications, where the same unit can provide heating or cooling, alternatively [9]. In this context, flexible heat pump use has been shown to reduce peak electricity demand significantly [10] whilst maintaining occupants’ comfort [11] and offering benefits to various agents across the power system [12]. Suitable device control strategies [13] and optimised refrigerant circuitry [14] have proven effective in improving heat pump performance outside rated operating conditions, containing costs and emissions.
A high-temperature heat pump (HTHP) works on the same principle but can deliver heat above 100 °C [15], which makes these devices suitable for industrial steam generation. Several HTHP pilot projects have been tested [16], with multiple manufacturers worldwide and applications in sectors like paper, food, and chemicals [17]. As with space heating, operating HTHPs flexibly in industry could bring wider system benefits, as well as offer an improved business case for practitioners, compared to fixed operation [18]. However, variations in power input affect thermodynamic states along the HTHP cycle [19], which in turn alter steam flow and temperature.
Steam accumulators (SAs) are commonly used in industry to balance short-term mismatches between steam supply and demand [20]. These devices operate as sliding pressure vessels where saturated water vapour and liquid are in thermodynamic equilibrium. During charging, injected steam increases vessel pressure and some vapour condenses, raising the liquid level; during discharging, this process is reversed [21]. Acting as a buffer between steam supply and demand, SAs help ensure a more stable steam delivery and reduce fluctuations.
To date, most studies on flexible HTHP operation have focused on the dynamics of internal system states [22] and on control methods to keep performance near design conditions [23]. Others have tested the HTHP response to upward and downward ramps in compressor power setpoints against the specifications for a grid balancing service provision [24]. The effect of flexible HTHP operation on the heat supply and delivery to downstream processes remains largely unaddressed. Meanwhile, works on SAs—either experimental [25], numerical [26,27], or combined [28,29]—consider SA in isolation and demonstrate strong dynamics. The input steam profiles used in these studies are case-dependent and unrelated to an upstream HTHP [30,31]. Overall, the steam supply dynamics from variable-power HTHPs, with or without a downstream SA, remain underexplored in sufficient detail. As such, a clear understanding of how SAs could support HTHP’s flexible operation and strengthen the case for their integration in industry is missing.
This paper bridges that gap by addressing the research question, “How does the flexible operation of an HTHP, alone or combined with a downstream SA, affect the flow and temperatures of the steam supplied?” The analysis proceeds as follows:
  • First, a single-stage HTHP is designed to supply 5 MWth of steam at 4 bar to some industrial processes, using steady-state modelling;
  • Then, the steam supply dynamics of both a standalone HTHP and an HTHP combined with an SA are examined during power turn-up and turn-down operation;
  • Finally, these insights are used to explore suitable SA sizing and discuss how flexibility incentives might justify the investment.
By shedding light on steam supply dynamics under flexible HTHP operation, this work supports cleaner, more flexible heat provision in low-to-medium-pressure industrial steam networks. The results can therefore assist clean technology uptake and development in industrial steam and district heating networks.

2. Methods

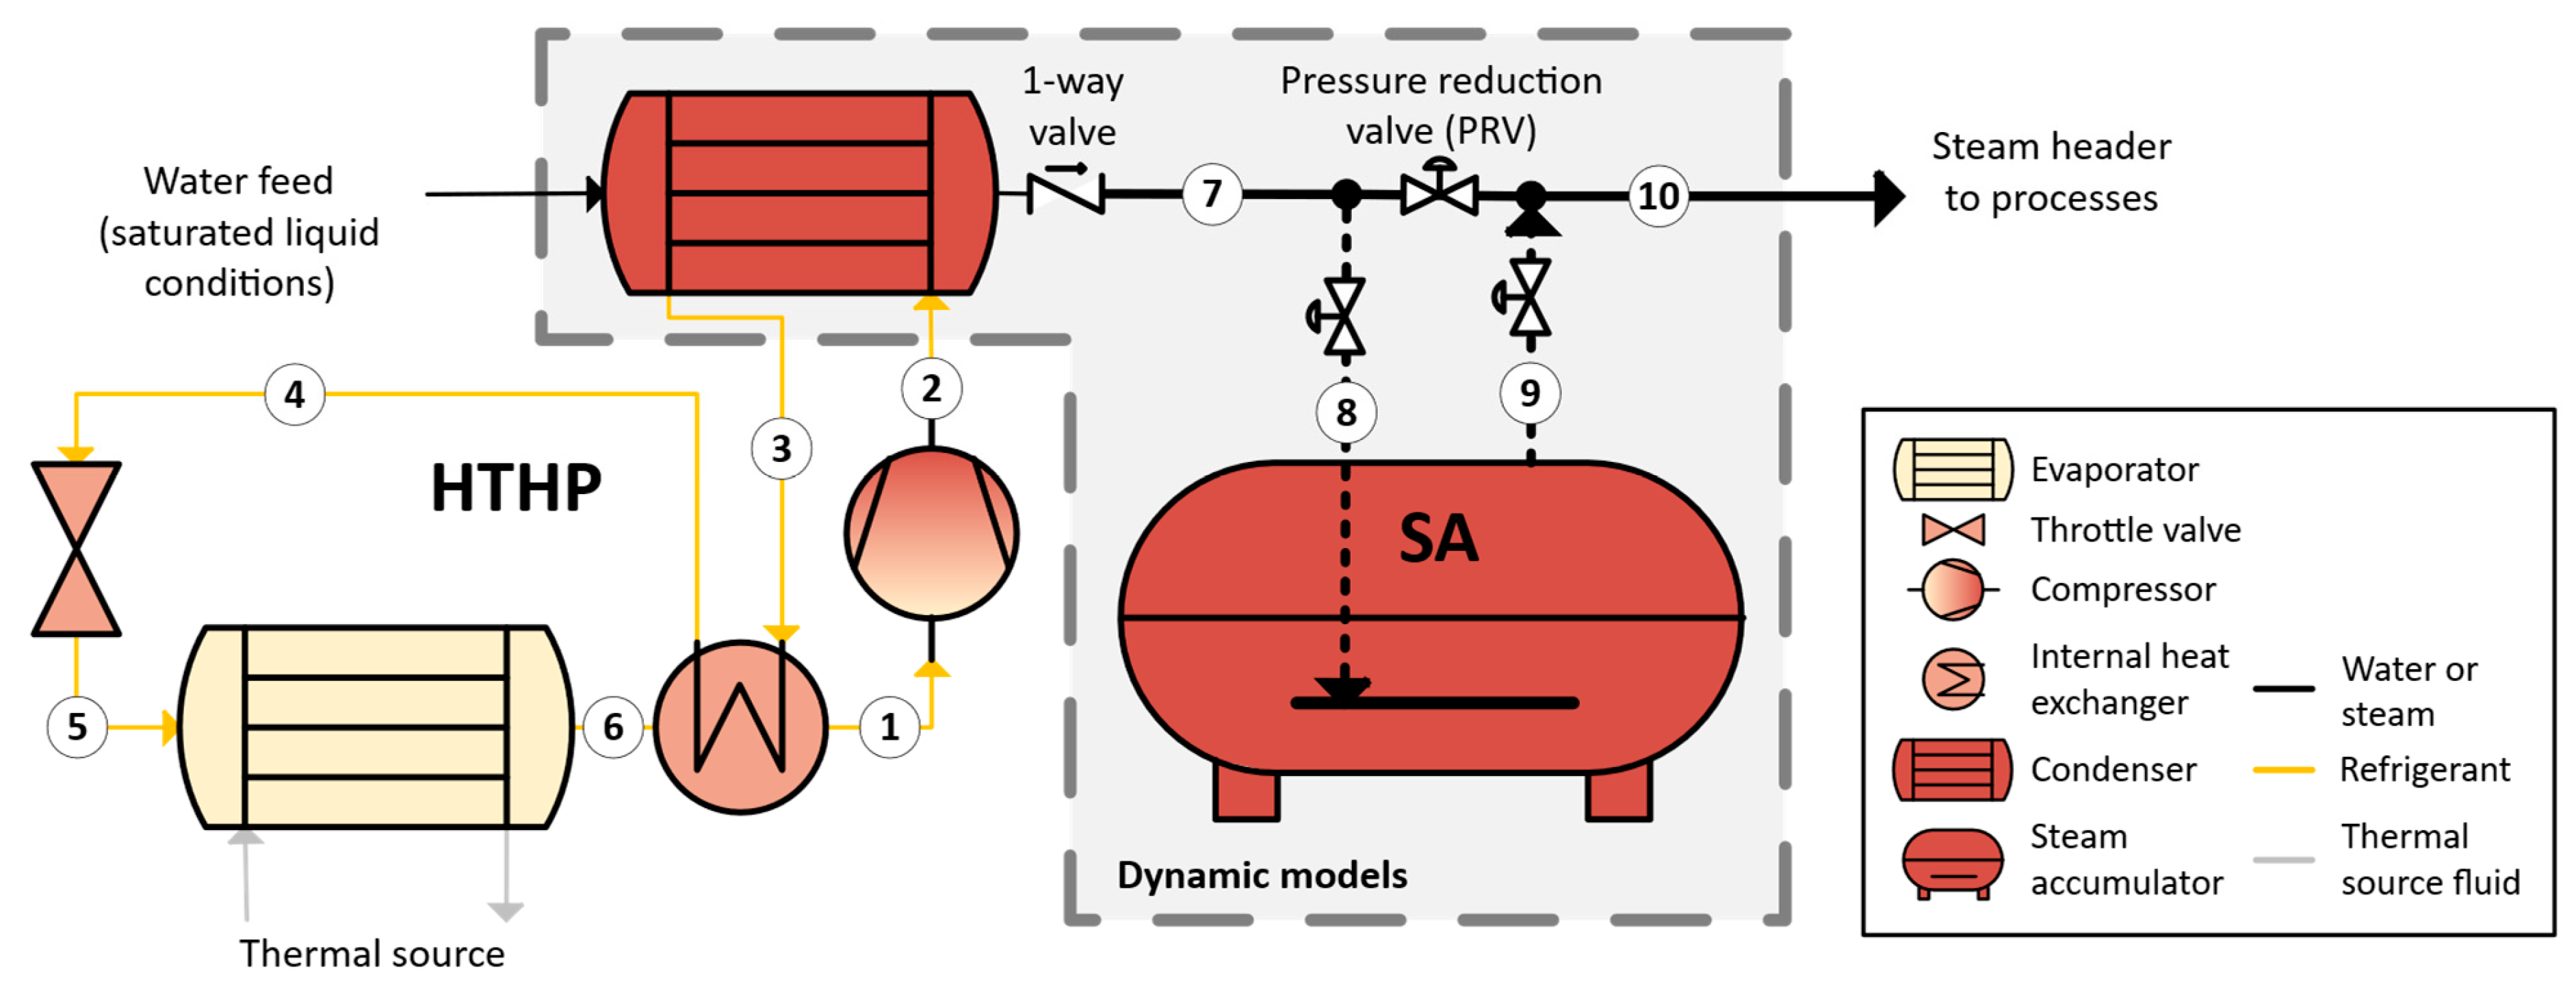
Figure 1 shows a schematic of the system studied. A single-stage, reverse vapour compression cycle HTHP is considered to supply a notional downstream industrial process via a 4-bar steam header. The HTHP uses the heat input from a thermal source and an electrical power input to supply thermal power at the condenser. This thermal power evaporates the water feed to generate steam, which is then injected through the main steam header to supply downstream industrial processes. This can happen directly (solid pipework in Figure 1) or with an intermediate SA (dashed pipework in Figure 1). Since the latter option requires a pressure difference between the header and the SA to allow for accumulator charging and discharging, two cases are considered:
  • A 2–4 bar pressure-swing SA and steam header operated at 2 bar when the SA is discharging;
  • A 4–8 bar pressure-swing SA and water feed operated at 8 bar when the SA is charging.
In both cases, a pressure reduction valve (PRV) is needed on the steam supply line that leaves the HTHP condenser to maintain the desired header pressure.
A thermodynamic model of the HTHP was developed by applying steady-state mass, momentum, and energy balances to all components [32]. The model included standard assumptions such as constant equipment efficiency, fixed pressure drops and pinch point temperature differences in the heat exchangers, and saturated liquid conditions of the water feed to the condenser. The selected refrigerant was n-Pentane due to its favourable thermodynamic properties and low environmental impact [33]. However, the presented modelling framework is equally suitable to study HTHP using other refrigerants in the same system layout. Input parameters to the steady-state HTHP thermodynamic model are reported in Table 1.
The model was used to design a 5 MWth HTHP intended to supply steam at 4 bar (approximately 145 °C), using an 80 °C heat source with a temperature difference of 10 °C. These conditions were chosen to reflect the needs of several industrial applications [34] and, given the resulting 65 °C temperature lift, also align with the operating range of many commercial units [17]. The size of individual components was then used as an input for the dynamic models of the HTHP condenser and SA, both developed in OpenModelica [35] and described in detail hereafter. These and other HTHP component models, together with the integrated system models used to generate the results in this work, are available on GitHub (https://github.com/AndreOlds/HTHP.git, accessed on 26 May 2025).

2.1. Dynamic Modelling of the Condenser

A finite-volume, segmented approach was adopted to account for thermal dynamics in the HTHP condenser [36]. Dynamic, lumped-parameter energy conservation equations were specified for each of the fluid and wall control volumes along the heat exchanger. Under the considered counterflow arrangement, and for each segment i , these were expressed as follows:
V i ρ i d h i d t = m ˙ h ~ i 1 h ~ i U i A T i T i W
V i ρ i d h i d t = m ˙ h ~ i h ~ i 1 U i A T i T i W
V i W ρ W c p W T i W t = λ W 2 T i W x 2 + U i A T i T i W + U i A T i T i W
In Equations (1) to (3), W superscripts indicate wall control volumes; fluid control volumes are denoted by and superscripts, as the equations apply regardless of which one of them is the hot and which one the cold fluid. Since the flow direction is known, internal fluid states in each segment were assumed to equate the upstream values at the segment boundaries, using an upwind scheme. A 2nd-order, centred finite difference scheme was used to discretise space derivatives in Equation (3). Furthermore, fluid properties in the above equations vary as a function of the thermodynamic state, as described by equations of state implemented in CoolProp and accessed through the ExternalMedia library [37].
A fixed refrigerant pressure loss over each segment was considered for each segment, which yielded an overall pressure drop p H X across the component:
p i = p i 1 p H X N 1
Local convective heat transfer coefficients, U values, were estimated for each fluid stream based on the Prandtl number and a mean Reynolds number computed over a channel cross-section of hydraulic diameter D h :
R e i = ρ i D h μ i m ˙ A c ρ i
Appropriate convective heat transfer correlations were computed for each segment. Gnielinski’s correlation was used for fully developed, turbulent, internal single-phase flow [38]. As both fluids can experience phase change, two correlations proposed by Shah for flow boiling through a pipe [39] and internal condensation [40] were used for heat transfer coefficient estimations in the case of, respectively, local evaporation and condensation in each condenser segment.
The model was solved by imposing mass flow rates and suitable temperature and pressure boundary conditions at fluid inlets, alongside fixed initial temperature conditions. It is worth noting that the presented modelling approach is also suitable to capture the operation of a counterflow evaporator.

2.2. Dynamic Modelling of the Steam Accumulator

The modelling of the SA follows the approach presented by Desideri et al. [41]. Under the common assumption of thermodynamic equilibrium between the liquid and vapour phase, the dynamic mass and energy conservation equations for the component read as follows:
V d ρ d t = m ˙ i n m ˙ o u t
V ρ d h d t = m ˙ i n h i n h m ˙ o u t h o u t h + V d p d t + Q ˙
The liquid level in vessel L was introduced, which allows for characterising the properties within the SA as a linear combination of those for saturated liquid and vapour conditions, both depending on SA internal pressure:
ρ = L ρ l + 1 L ρ v
ρ h = L ρ l h l + 1 L ρ v h v
Equations (8) and (9) were then substituted into Equations (6) and (7) and suitably manipulated. This allowed for expressing dynamic mass and energy balances as a function of tank pressure and liquid level as the two independent variables:
V d L d t ρ l ρ v + d p d t L d ρ l d p + 1 L d ρ v d p = m ˙ i n m ˙ o u t
V d L d t ρ l h v ρ v h v + d p d t L h l d ρ l d p + ρ l d h l d p + 1 L h v d ρ v d p + ρ v d h v d p = m ˙ i n h i n m ˙ o u t h o u t + V d p d t + Q ˙
Derivatives of fluid thermodynamic properties in Equations (10) and (11) were returned by the ExternalMedia library [37].
Outlet conditions from the SA depend on the liquid level inside the accumulator. For an outlet flange located at a level L * ,
h o u t = h v     i f   L < L * h l     i f   L L *
The model was complemented by assuming an adiabatic vessel ( Q ˙ = 0 ) and solved by specifying boundary conditions on the inlet and outlet pressures, which drive the respective mass flow rates, and the initial pressure and liquid level inside the SA.

2.3. Model Validation

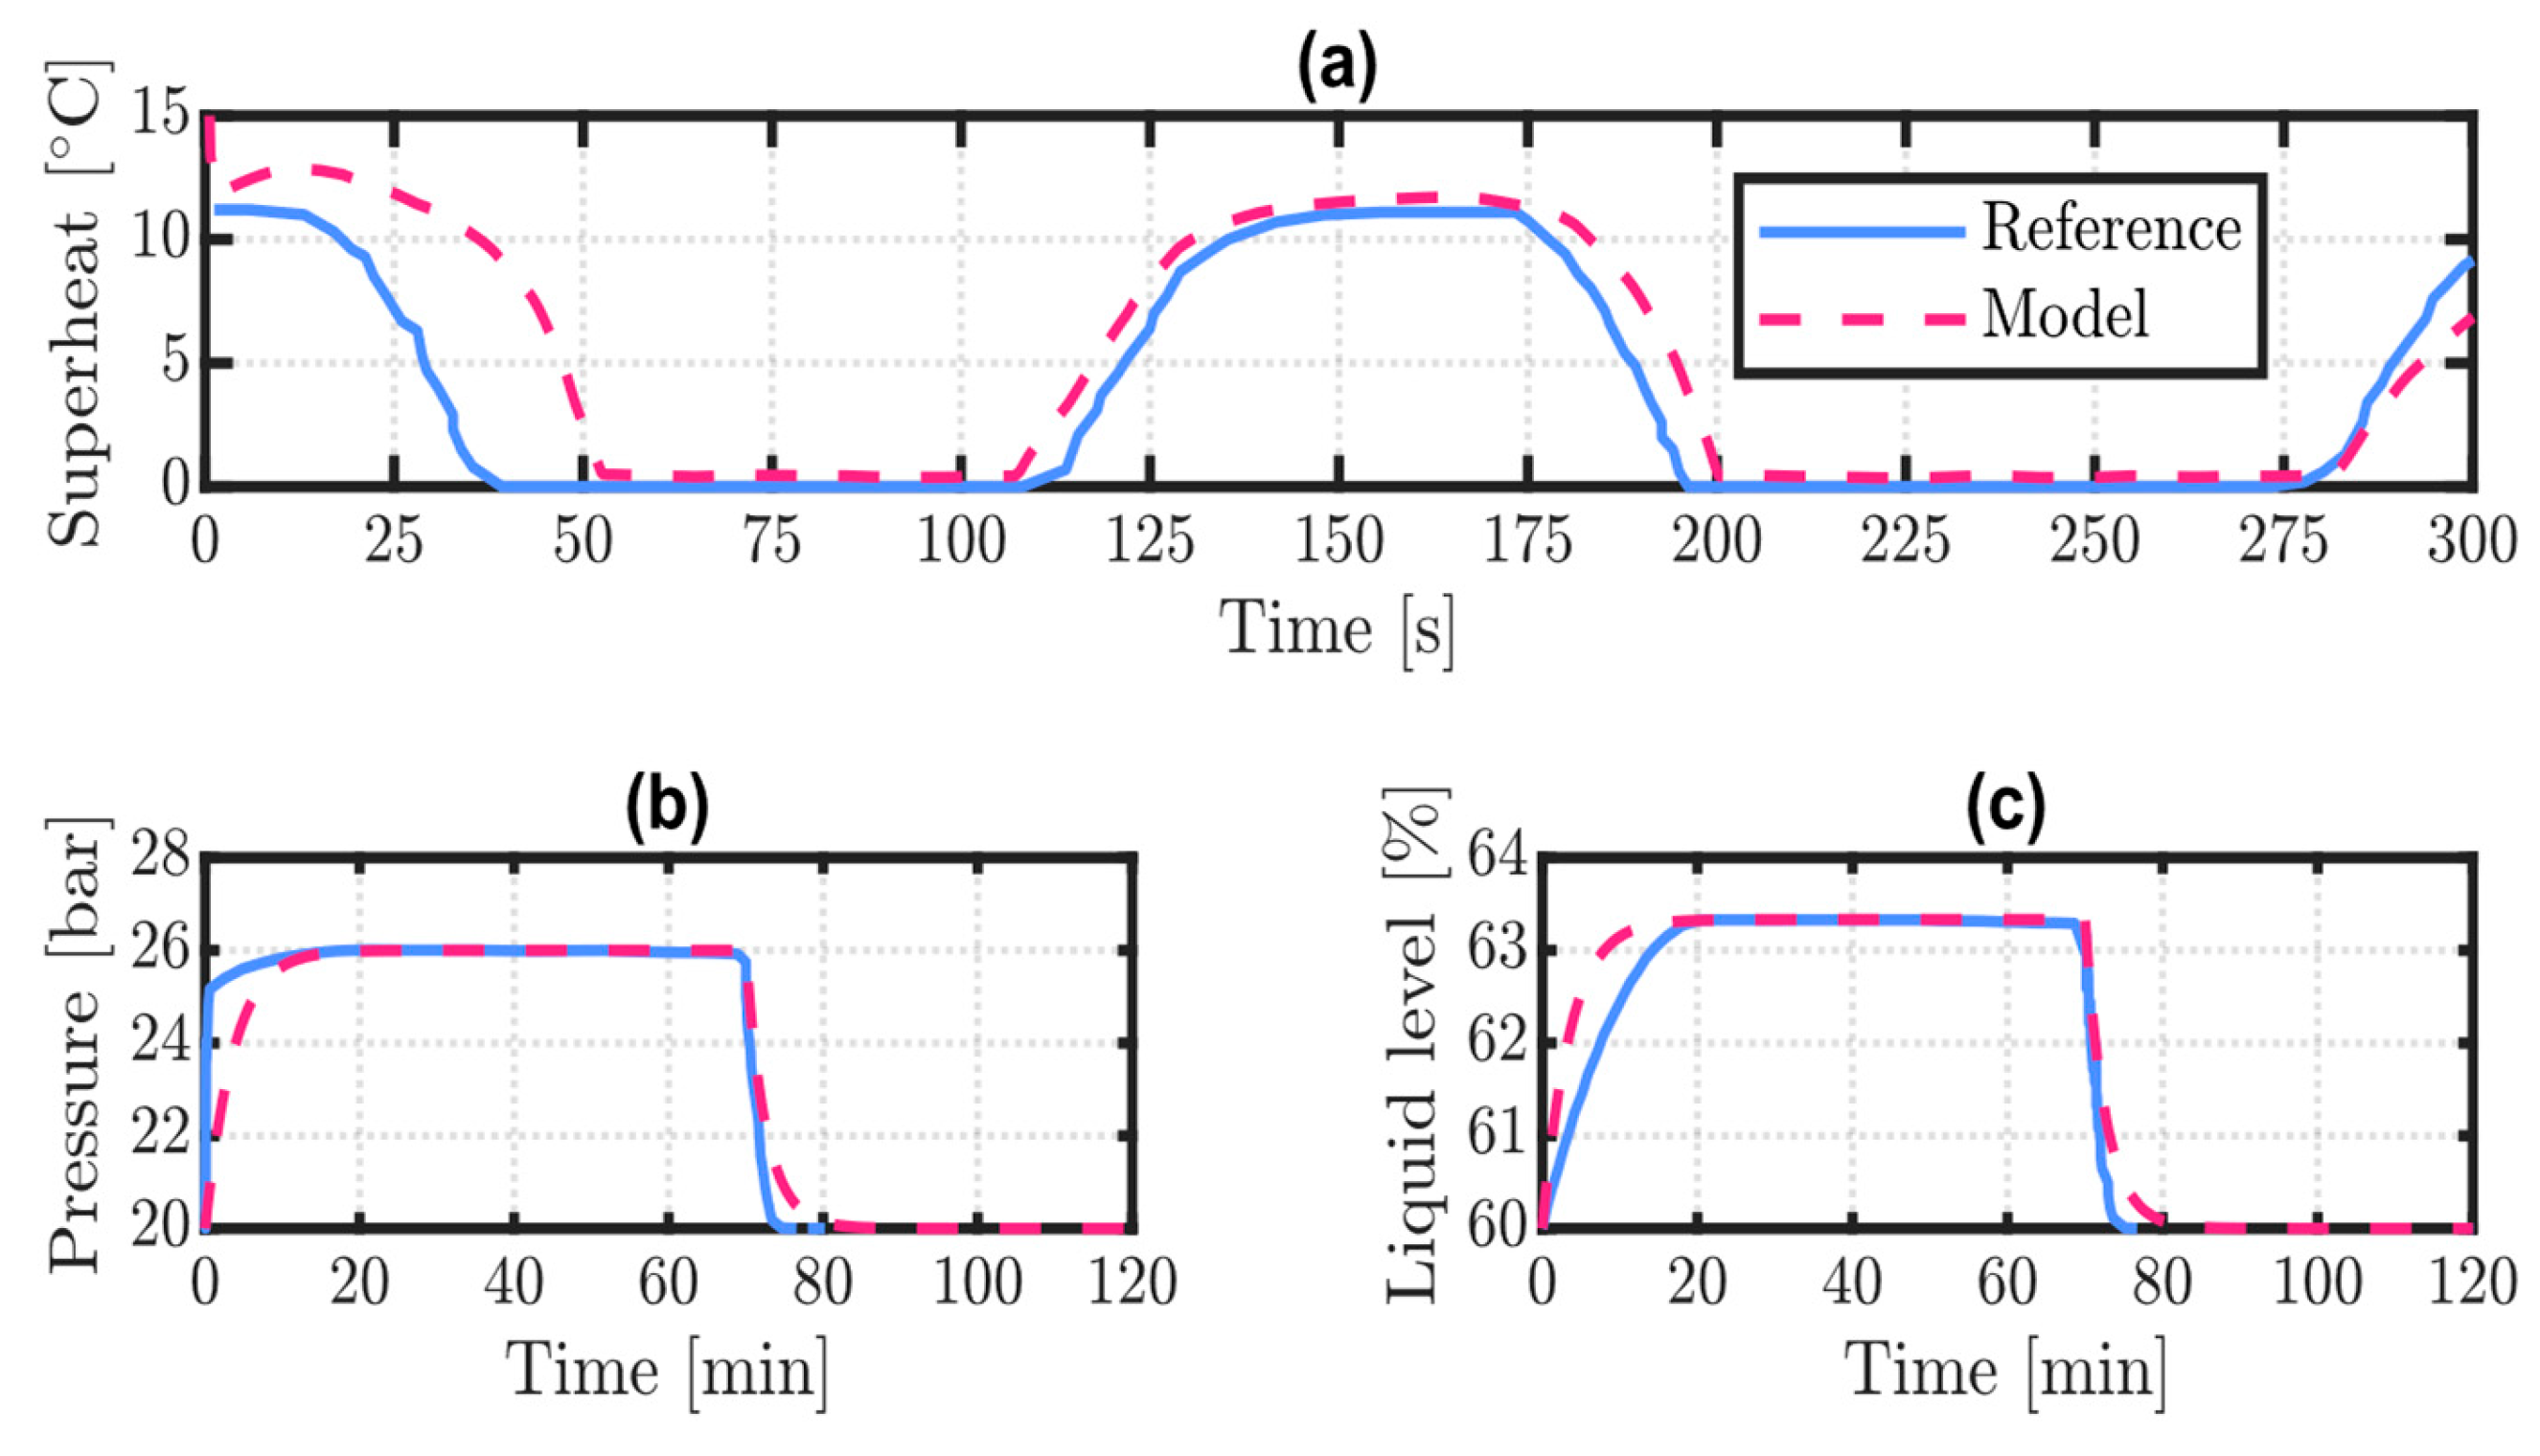
This section describes the validation of the two dynamic models presented against data from the literature. Given the lack of condenser-specific references reporting both component features and test conditions, dynamic simulation results for an evaporator using R-404A refrigerant were selected to validate the model from Section 2.1 [42]. As mentioned, the proposed modelling is indeed broadly applicable to counterflow heat exchangers. For constant mass flow rates and inlet temperatures of both fluids, Figure 2a illustrates the degree of superheating at the refrigerant outlet, which follows changes to the inlet pressure of the secondary fluid. Twelve segments were used to discretise the component as a result of prior grid independence tests performed.
For the validation of the SA model, pressure and liquid level evolution inside a 26 m3 vessel were compared against the results by Niknam and Sciacovelli [30], using their profile of inlet and outlet mass flow rates over a 120 min charge/discharge cycle. The results are presented in Figure 2b,c. Both the heat exchanger and the SA models exhibit a very close match with the reference in steady-state conditions and overall satisfactory behaviour during transients.

2.4. Flexible HTHP Operation

Flexible HTHP operation in this work involves the adjustment of HTHP power input at values other than the rated setpoints to suit some external signal. Three operating conditions were tested:
  • Rated: HTHP power input in rated conditions;
  • Turn-up: HTHP power input increased to 120% of the rated setpoint for 1 h;
  • Turn-down: HTHP power input decreased to 50% of the rated setpoint for 1 h.
Although this modelling could equally simulate more specific demand-side response signals in both HTHP power input and duration, the operating conditions tested aim to uncover the underlying phenomena that broadly apply to flexible HTHP operation. Power turn-up mimic periods of high renewable generation and/or low energy demand present, for instance, in the middle of the day (see [43]). Power turn-down could be used to enable partial load shedding at peak demand times or when renewable generation is lacking (see [44]). Rated conditions, on the other hand, serve mainly as a baseline.
Deviations in the HTHP power input require control of the HTHP cycle to maintain thermodynamic states within feasibility. Drawing from relevant work on heat pump control [10,23,45], the following strategies were assumed:
  • A pressure vessel maintains a constant pressure in the low-pressure segment of the system;
  • Adjustment of secondary-side flow in the evaporator maintains a fixed inlet temperature under compressor suction and avoids wet conditions;
  • Adjustment of the secondary-side flow in the condenser is proportional to the refrigerant mass flow.
A variable frequency drive was considered to achieve HTHP power input variations. Two verified ramp rates from HTHP control studies in the literature were used to study dynamic responses under fast and slow ramping, as per Table 2. These indirectly account for response delays due to rotational and other inertial terms in the compressor and throughout the HTHP cycle. They also represent two limiting cases for HTHP regulation speed and, since other dynamic studies report ramp rates within these limits, are deemed to provide a reasonable estimate of the system response range over time. The refrigerant conditions at the compressor outlet under a fixed inlet pressure and temperature were then determined from the instantaneous value of compressor isentropic efficiency, η , and compression ratio, Π .
h o u t = h i n + h s i n ; Π p i n h i n η
Instantaneous values of isentropic efficiency and compression ratio were expressed as a function of the corrected rotational speed, n ¯ , and mass flow rate, m ¯ , via off-design performance maps [46]:
n ¯ = n   T 0 i n n 0   T i n
m ¯ = m   ˙ p 0 i n   T i n m ˙ 0   p i n   T 0 i n
Π Π 0 = a 1 m ¯ 2 + a 2 m ¯ + a 3
η η 0 = 1 a 4 1 n ¯ n ¯ m ¯ 2 n ¯ m ¯
Table 2. Feasible ramp rates verified by HTHP control studies and adopted in this work.
RampingRamp Rate [%/s]Ref.Note
Fast2[19]0.2–0.6%/s verified for large-scale ammonia heat pumps [23]
Slow0.2[24]

2.4.1. Model Runs Performed

Table 3 summarises the model run performed, whose results are presented later on.

2.4.2. Performance Assessment

A primary performance indicator is the HTHP coefficient of performance, C O P , which expresses the ratio between the heat delivered at the condenser and the power input to the compressor:
C O P = m ˙ h N h 1 W ˙ e
For each run, the thermal power supplied to the downstream processes by the steam header was also computed, considering a return liquid stream in saturated liquid conditions, with specific enthalpy h l . Steam supply conditions ( S S ) were evaluated at point 10 (Figure 1):
Q ˙ S S = m ˙ S S h S S h l
Both C O P and Q ˙ S S assess an instantaneous performance and therefore vary as a function of time. Conversely, the unserved steam demand, U S D , was evaluated by integrating the thermal power supplied over the full duration of flexible HTHP operation and normalising by the value in rated conditions:
U S D = 1 0 t m i n Q ˙ S S , Q ˙ 0 S S d t Q ˙ 0 S S Δ t

3. Results

3.1. System Sizing

Steady-state HTHP simulations in rated conditions were first used to size HTHP components and derive the condenser and SA parameters, which are inputs to the dynamic models. Rated conditions involve a compression ratio of 7.5 and a 19.8 kg/s refrigerant mass flow rate (~13,000 m3/h). These specifications are well within the current technology offering and can be realised by various off-the-shelf devices [47]. Both reciprocating machines and two-stage screw compressors could serve the considered application, the latter with fewer limitations on suction capacity. A two- to three-stage dynamic machine could similarly be selected. At rated capacity, the compressor absorbs approximately 2 MWe for a predicted HTHP C O P of 2.5. This aligns with the reported performance for single-stage HTHP layouts at a 60–70 °C temperature lift [33].
Table 4 now reports the condenser and SA design specifications. To satisfy the 5 MWth duty, a 910 m2 shell-and-tube condenser is needed. About half of the heat transfer surface is found to exchange some 80% of the thermal power during condensation. The remaining heat transfer surface is almost equally split between refrigerant desuperheating and subcooling, and it operates with relatively small log-mean temperature differences below 10 °C. Furthermore, about 800 parallel passages are needed to contain refrigerant flow velocities below 1 m/s for the considered one-inch tubes. A schematic of the potential shell-and-tube layout and pipe passage arrangement is depicted in [36]; hot fluid flow inside the tubes is proposed in this case due to the higher pressure of the refrigerant. Steady-state SA sizing results in required volumes of ~100 m3 with minimal variations depending on the operating pressure level. A 4–8-bar sliding pressure yields a slightly higher steam flashing capacity so that the same steam requirements can be supplied by an 11% smaller tank.

3.2. Steady-State System Performance

Effective compressor control should maintain the required steam temperature when the HTHP power input is varied for power turn-up and turn-down operation. With fixed suction conditions, the compressor, and hence the corrected rotational speed, must be adjusted to match the modulating power input, whilst keeping the compression ratio constant despite changes in refrigerant flow. This can be achieved by suitably acting on the throttle valve in the HTHP cycle to alter the pressure drop-flow characteristics of the fluid circuit [19]. Additionally, the operating point must remain away from surge and choke limits.
Figure 3 presents an overlay of the considered operating points on the compressor’s off-design performance maps, which shows how flexible HTHP operation is constrained by compressor characteristics. For fixed outlet conditions, the change in the mass flow rate that the compressor can handle is almost proportional to the variation in power input. Hence, the surge at low corrected mass flow rates is a concern mainly for HTHP power downturn. In this work, the rated operating point was determined to ensure a 5% safety margin from a surge during turn-down operation. Conversely, turn-up operation necessitates higher rotational speeds and may result in compressor choke at high corrected mass flow rates. A relatively wide range of HTHP power absorption (from 50% to 120% of the rated value) was achieved at the expense of lower efficiencies at the rated design point. Should an even wider range be required, a larger drop in compressor performance is to be expected.
The same compressor characteristics also limit the HTHP performance achievable for a higher pressure of the water feed, which must be matched by raising the compression ratio and outlet temperature. This has a twofold impact on HTHP thermodynamic performance. On the one hand, the compressor can handle lower mass flow rates (see Figure 3). On the other hand, less heat can be supplied by the refrigerant in the condenser as the HTHP cycle approaches the refrigerant’s critical point. This is visualised in Figure 4 by comparing HTHP power turn-up operation in the cases of a downstream 2–4-bar and a 4–8-bar SA. Elevating water feed pressure from 4 to 8 bar to allow SA charging in the latter case results in higher temperatures in the condenser and lower latent heat of evaporation of the refrigerant. The resulting changes in HTHP operational variables and detriment in steady-state performance in this case are reported in Table 5, alongside results for the other model runs considered. Dynamic system performance, including the effect of slow and fast compressor power ramping, is discussed in the following sections.

3.3. Dynamic System Performance

3.3.1. Heat Pump Only

Figure 5 shows the evolution in the mass flow rate and temperature of the steam delivered by the HTHP, which follows a change in power input for either turn-up or turn-down operation. No fluid-dynamic inertial terms were explicitly included in this modelling, and flow changes follow the imposed power ramping. On the contrary, a thermal transient develops across the condenser in response to the changes in stream mass flow rate and thermodynamic state at the compressor outlet. Transient conditions last for a few minutes for both ramping speeds and power turn-up and turn-down. Once in a new steady state, the temperature in the steam header stabilises at about 3 °C below rated values for power turn-up operation, still well above saturation (144 °C). The delivered temperature variation is negligible for HTHP power turn-down. Analysis of the temperature profiles computed along the condenser demonstrates that the heat transfer surface is appropriate to ensure full water evaporation and refrigerant condensation throughout the tested conditions.
Figure 6 shows the thermal power delivered to the downstream processes. The discussed changes in steam temperature are limited and have a negligible effect on the thermal power supplied. As noted, steam is still in the superheated region. Hence, thermal power variations are to be attributed almost entirely to changes in steam mass flow rates. As a greater compressor power absorption allows for handling larger refrigerant flow rates, a 21% higher thermal power is supplied during power turn-up, in Figure 6a. The excess steam produced in this case could be either recirculated through the steam network or vented. On the contrary, reducing compressor power absorption during power turn-down operation results in lower refrigerant flow rates through the HTHP and a 48% lower thermal power supplied, in Figure 6b. This halving of the steam supply during HTHP turn-down is likely incompatible with the operation of the industrial processes downstream. The addition of an intermediate SA to stabilise the steam supply and its effect in maintaining downstream process operability are discussed in the following section.

3.3.2. Heat Pump and Downstream Steam Accumulation

Figure 7 presents the mass flow rates and temperatures of the steam delivered to the processes, this time when HTHP is coupled with a downstream SA. Changes to the produced steam mass flow rate are mitigated by the SA. During power turn-up, the extra mass flow rate is stored in the SA, whilst steam can be discharged from the SA during power turn-down and supplied to the steam header to complement the reduced production from the HTHP. The SA also limits fluid-dynamic transients that depend on the ramping capability of the HTHP: mass flow rate results under fast and slow ramping are not distinguishable.
Different and much slower dynamic steam supply conditions now arise, which stem from SA sliding pressure operation. As the state of charge of the SA increases, so does its internal pressure. This generates a backpressure acting against further injection of steam until eventually the SA is fully charged. Conversely, during SA discharge, the positive pressure driver between SA and the steam header gradually reduces and with it also the extracted mass flow rate. This is observed for both the 4-bar and the 8-bar SA cases.
The major difference between the 4-bar and the 8-bar SA cases now relates to the thermal dynamics. In the former case, steam temperatures differ from what is discussed in Section 3.3.1 only during power turn-down, as the steam header pressure needs to be throttled to 2 bar to enable injection from the sliding-pressure SA. The delivered steam remains in the superheated conditions. On the other hand, temperature dynamics significantly change for HTHP power turn-up in the 8-bar SA case. As discussed, HTHP thermal capacity at elevated steam pressures reduces, and steam falls within the two-phase region; this is visualised in Figure 8. Even under a more realistic regulation of water feed to preserve steam outlet temperatures, this is likely to result in unserved steam demand.
Figure 9 shows the evolution in supplied steam power, which follows the mass flow rates and temperature dynamics discussed. Given the slower observed transients resulting from the downstream SA, further delays from neglected inertial terms are unlikely to significantly affect the observed trend in steam supply dynamics. The steam delivery can now be kept within 10% deviations from its rated value during some of the power turn-up and turn-down operation. With a 4-bar SA, this is the case for the full power turn-up operation and about 10 min of the power turn-down. For an 8-bar SA, the larger operating pressure swing (4 to 8 bars) allows about 15 min operation with ±10% deviations in the steam power supply and a more limited U S D value. However, the discussed reduction in HTHP thermal capacity during power turn-up results in insufficient steam generation and a significant 83% unserved steam demand to the downstream processes. U S D values for all the runs considered are reported in Table 6.

4. Discussion

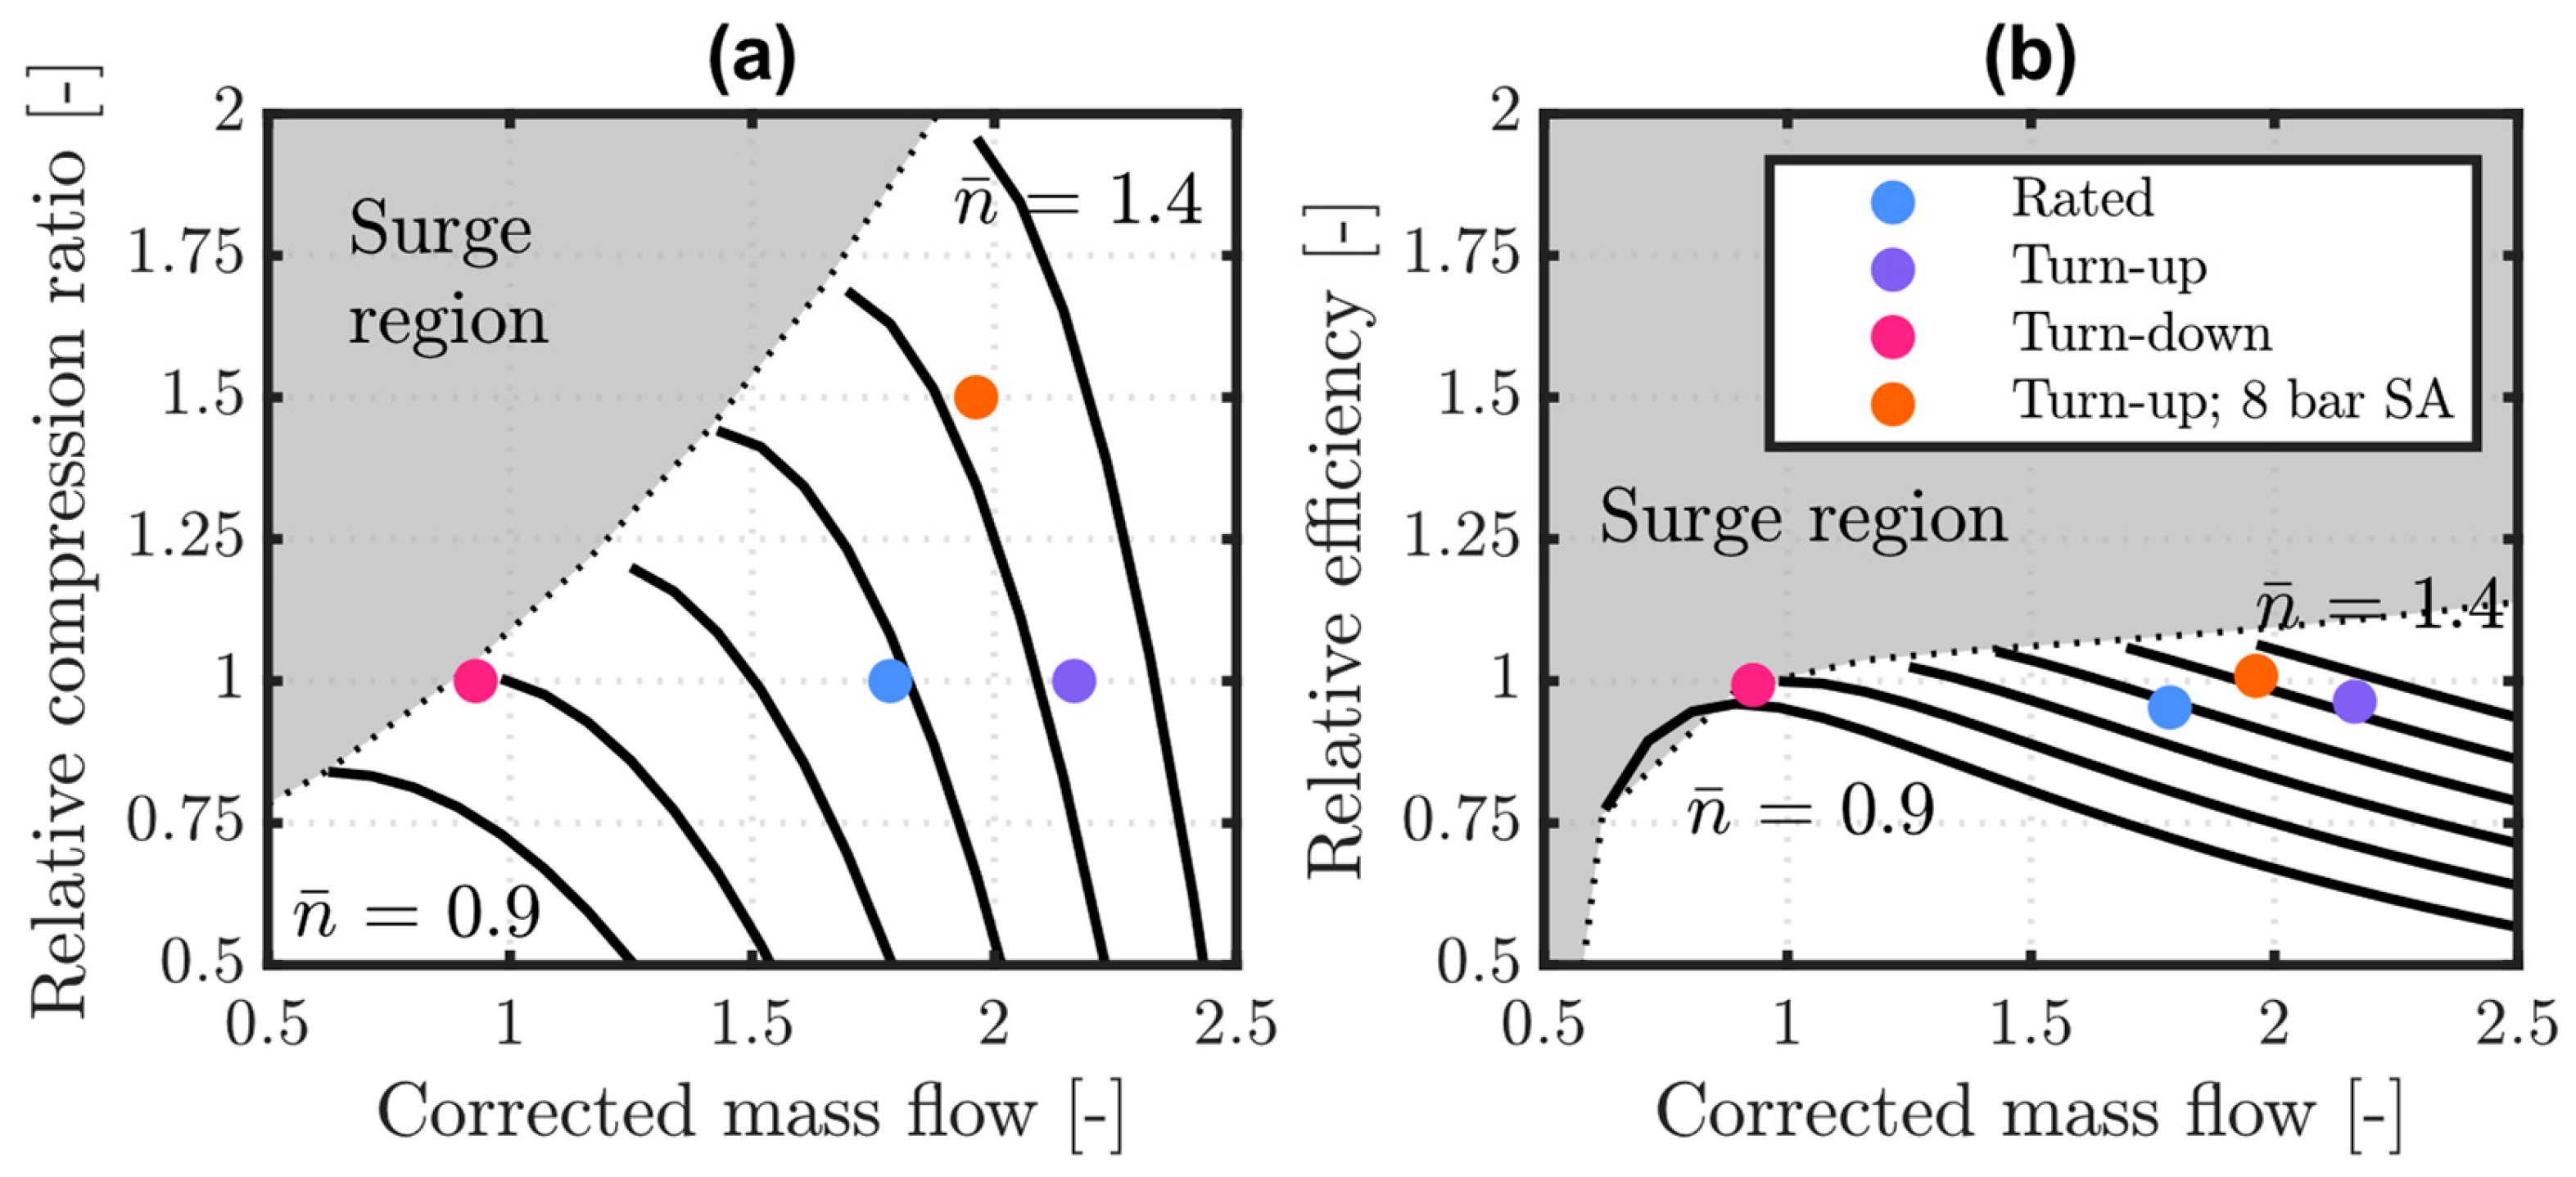
The results so far demonstrate the importance of compressor characteristics and selection in enabling flexible HTHP operation. Power input flexibility comes at the expense of HTHP performance at rated conditions. Indeed, a slightly higher C O P was found for both the turn-down and the turn-up cases compared to rated conditions, which results from the discussed need to select a nominal compressor operating point that allows a wide enough power adjustment.
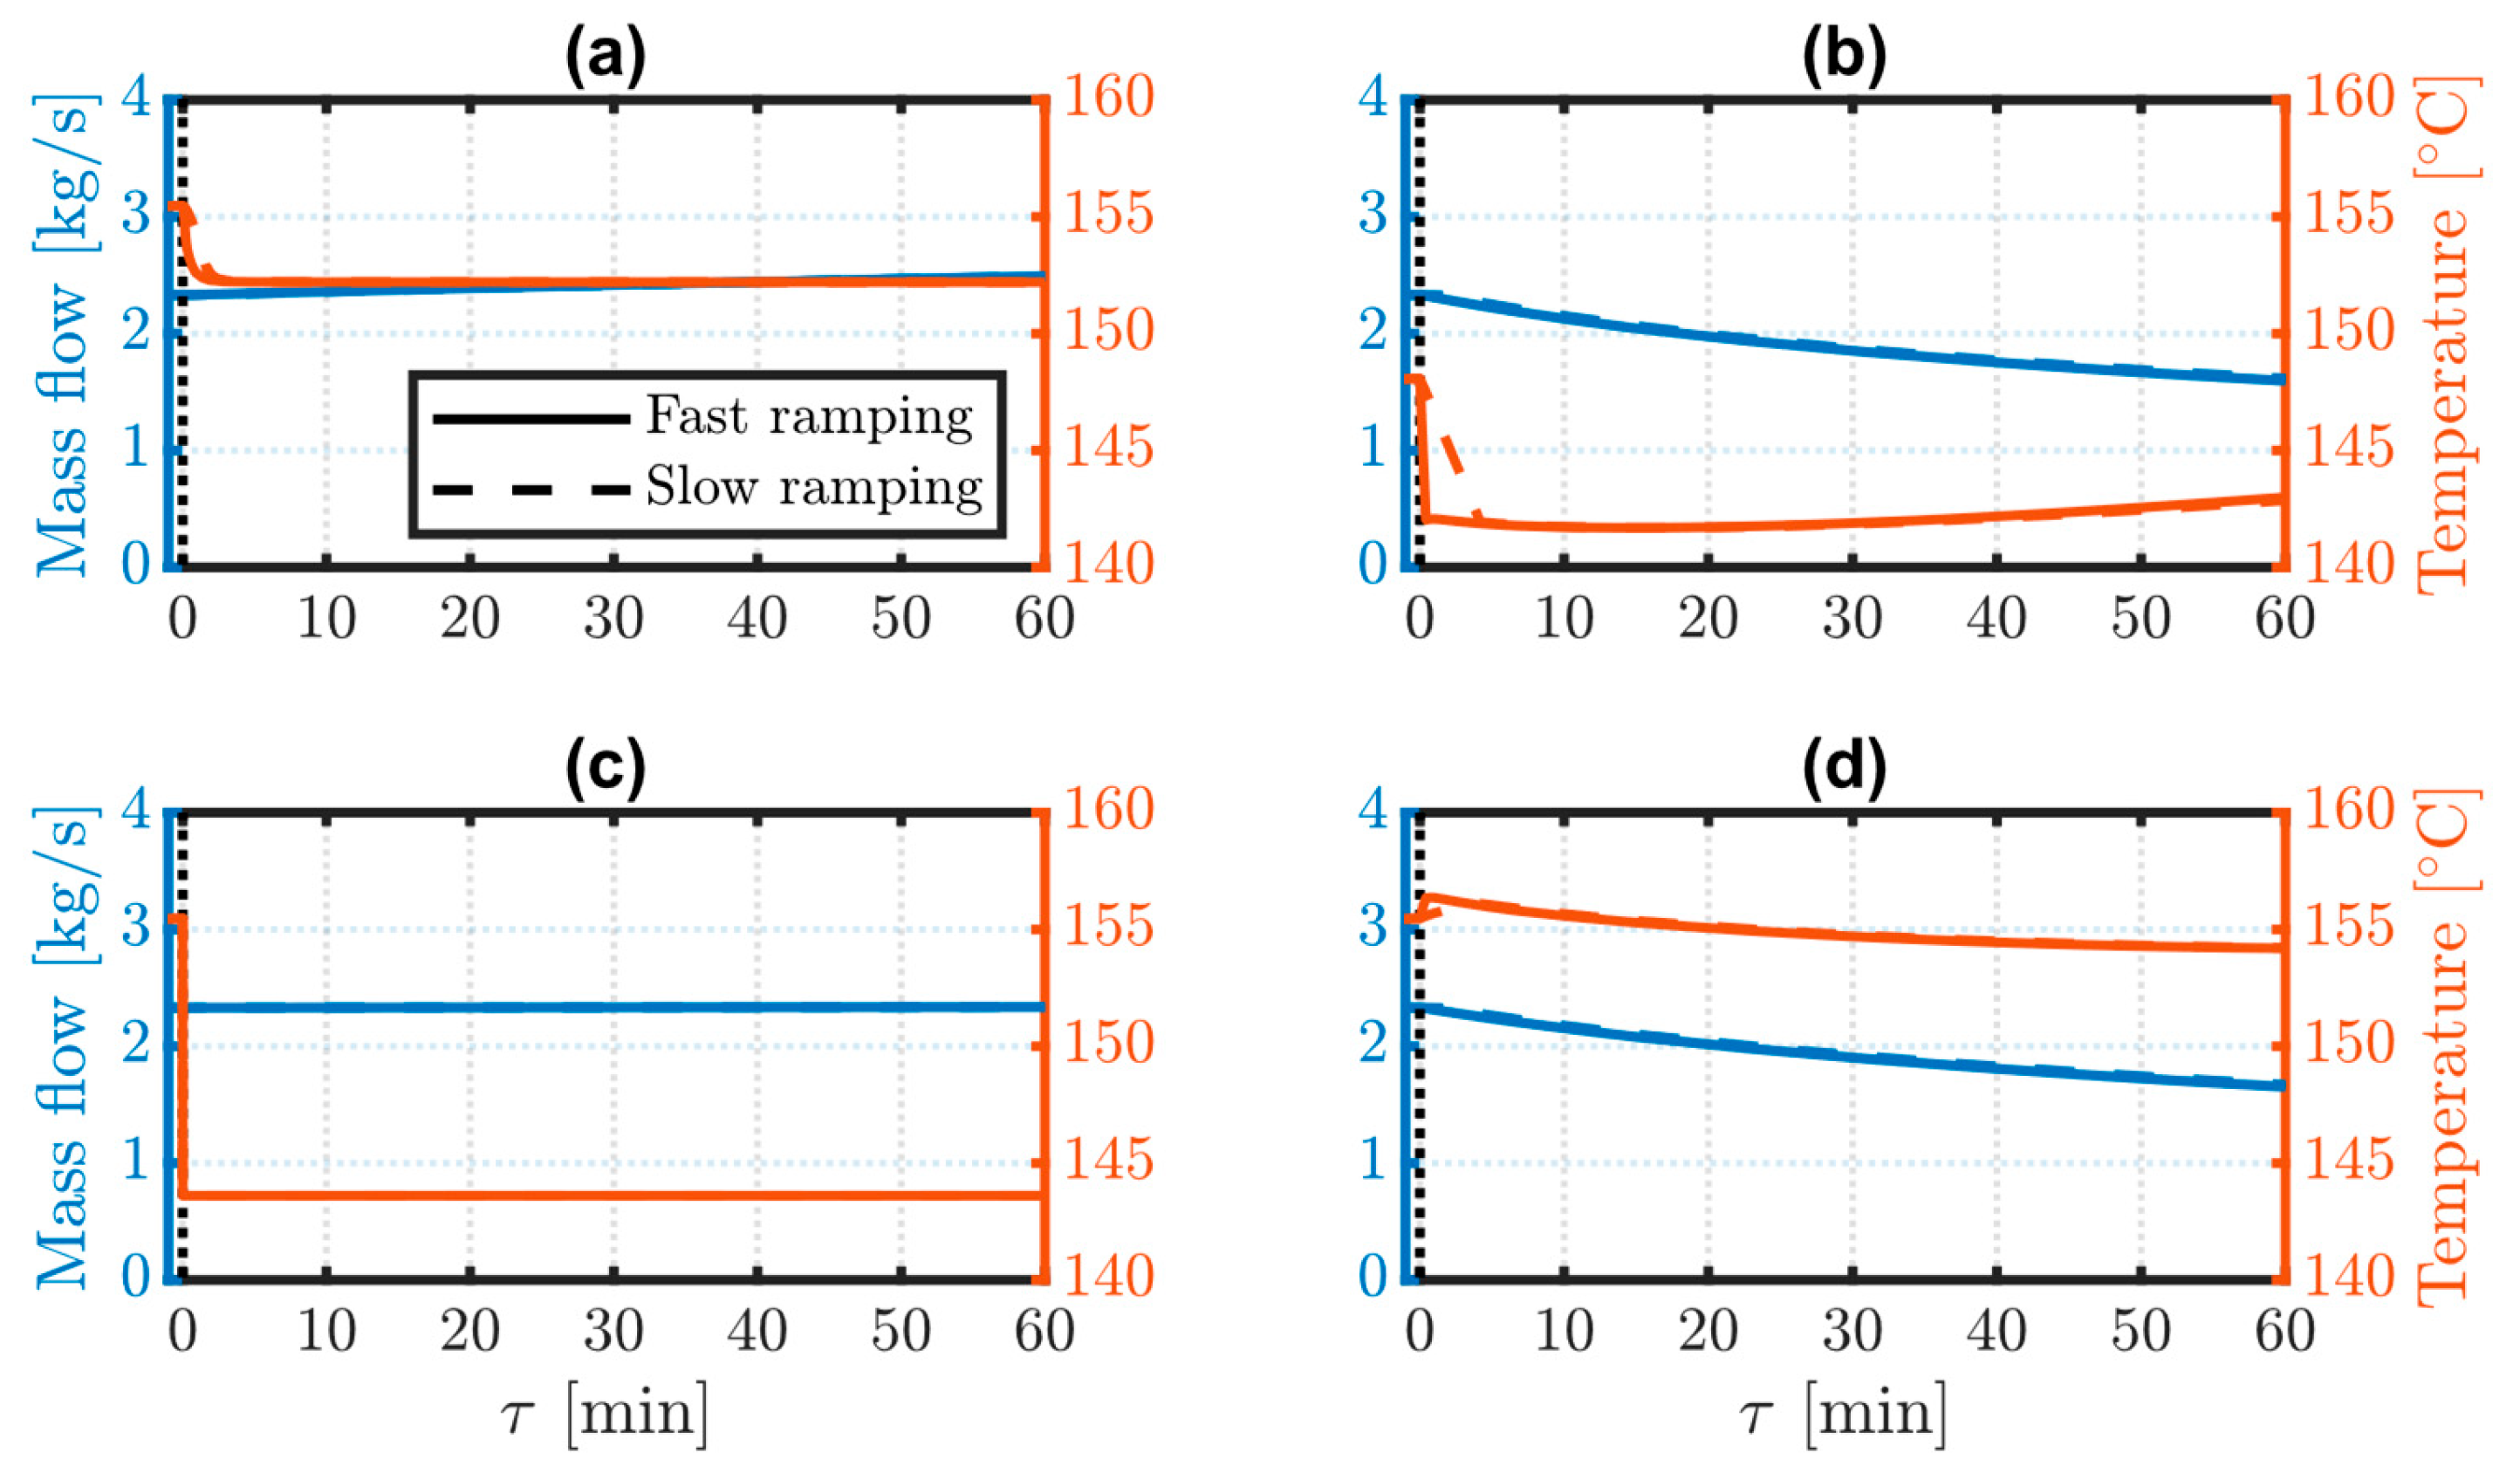
Once the nominal operating point is selected, off-design compressor characteristics determine the refrigerant mass flow rate and outlet temperature from the compressor. These drive dynamic changes in system and steam supply performance, which depend largely on fluid-dynamic transients and the compressor ramp-up/down capability, and with minimal contribution of thermal dynamics in the condenser.
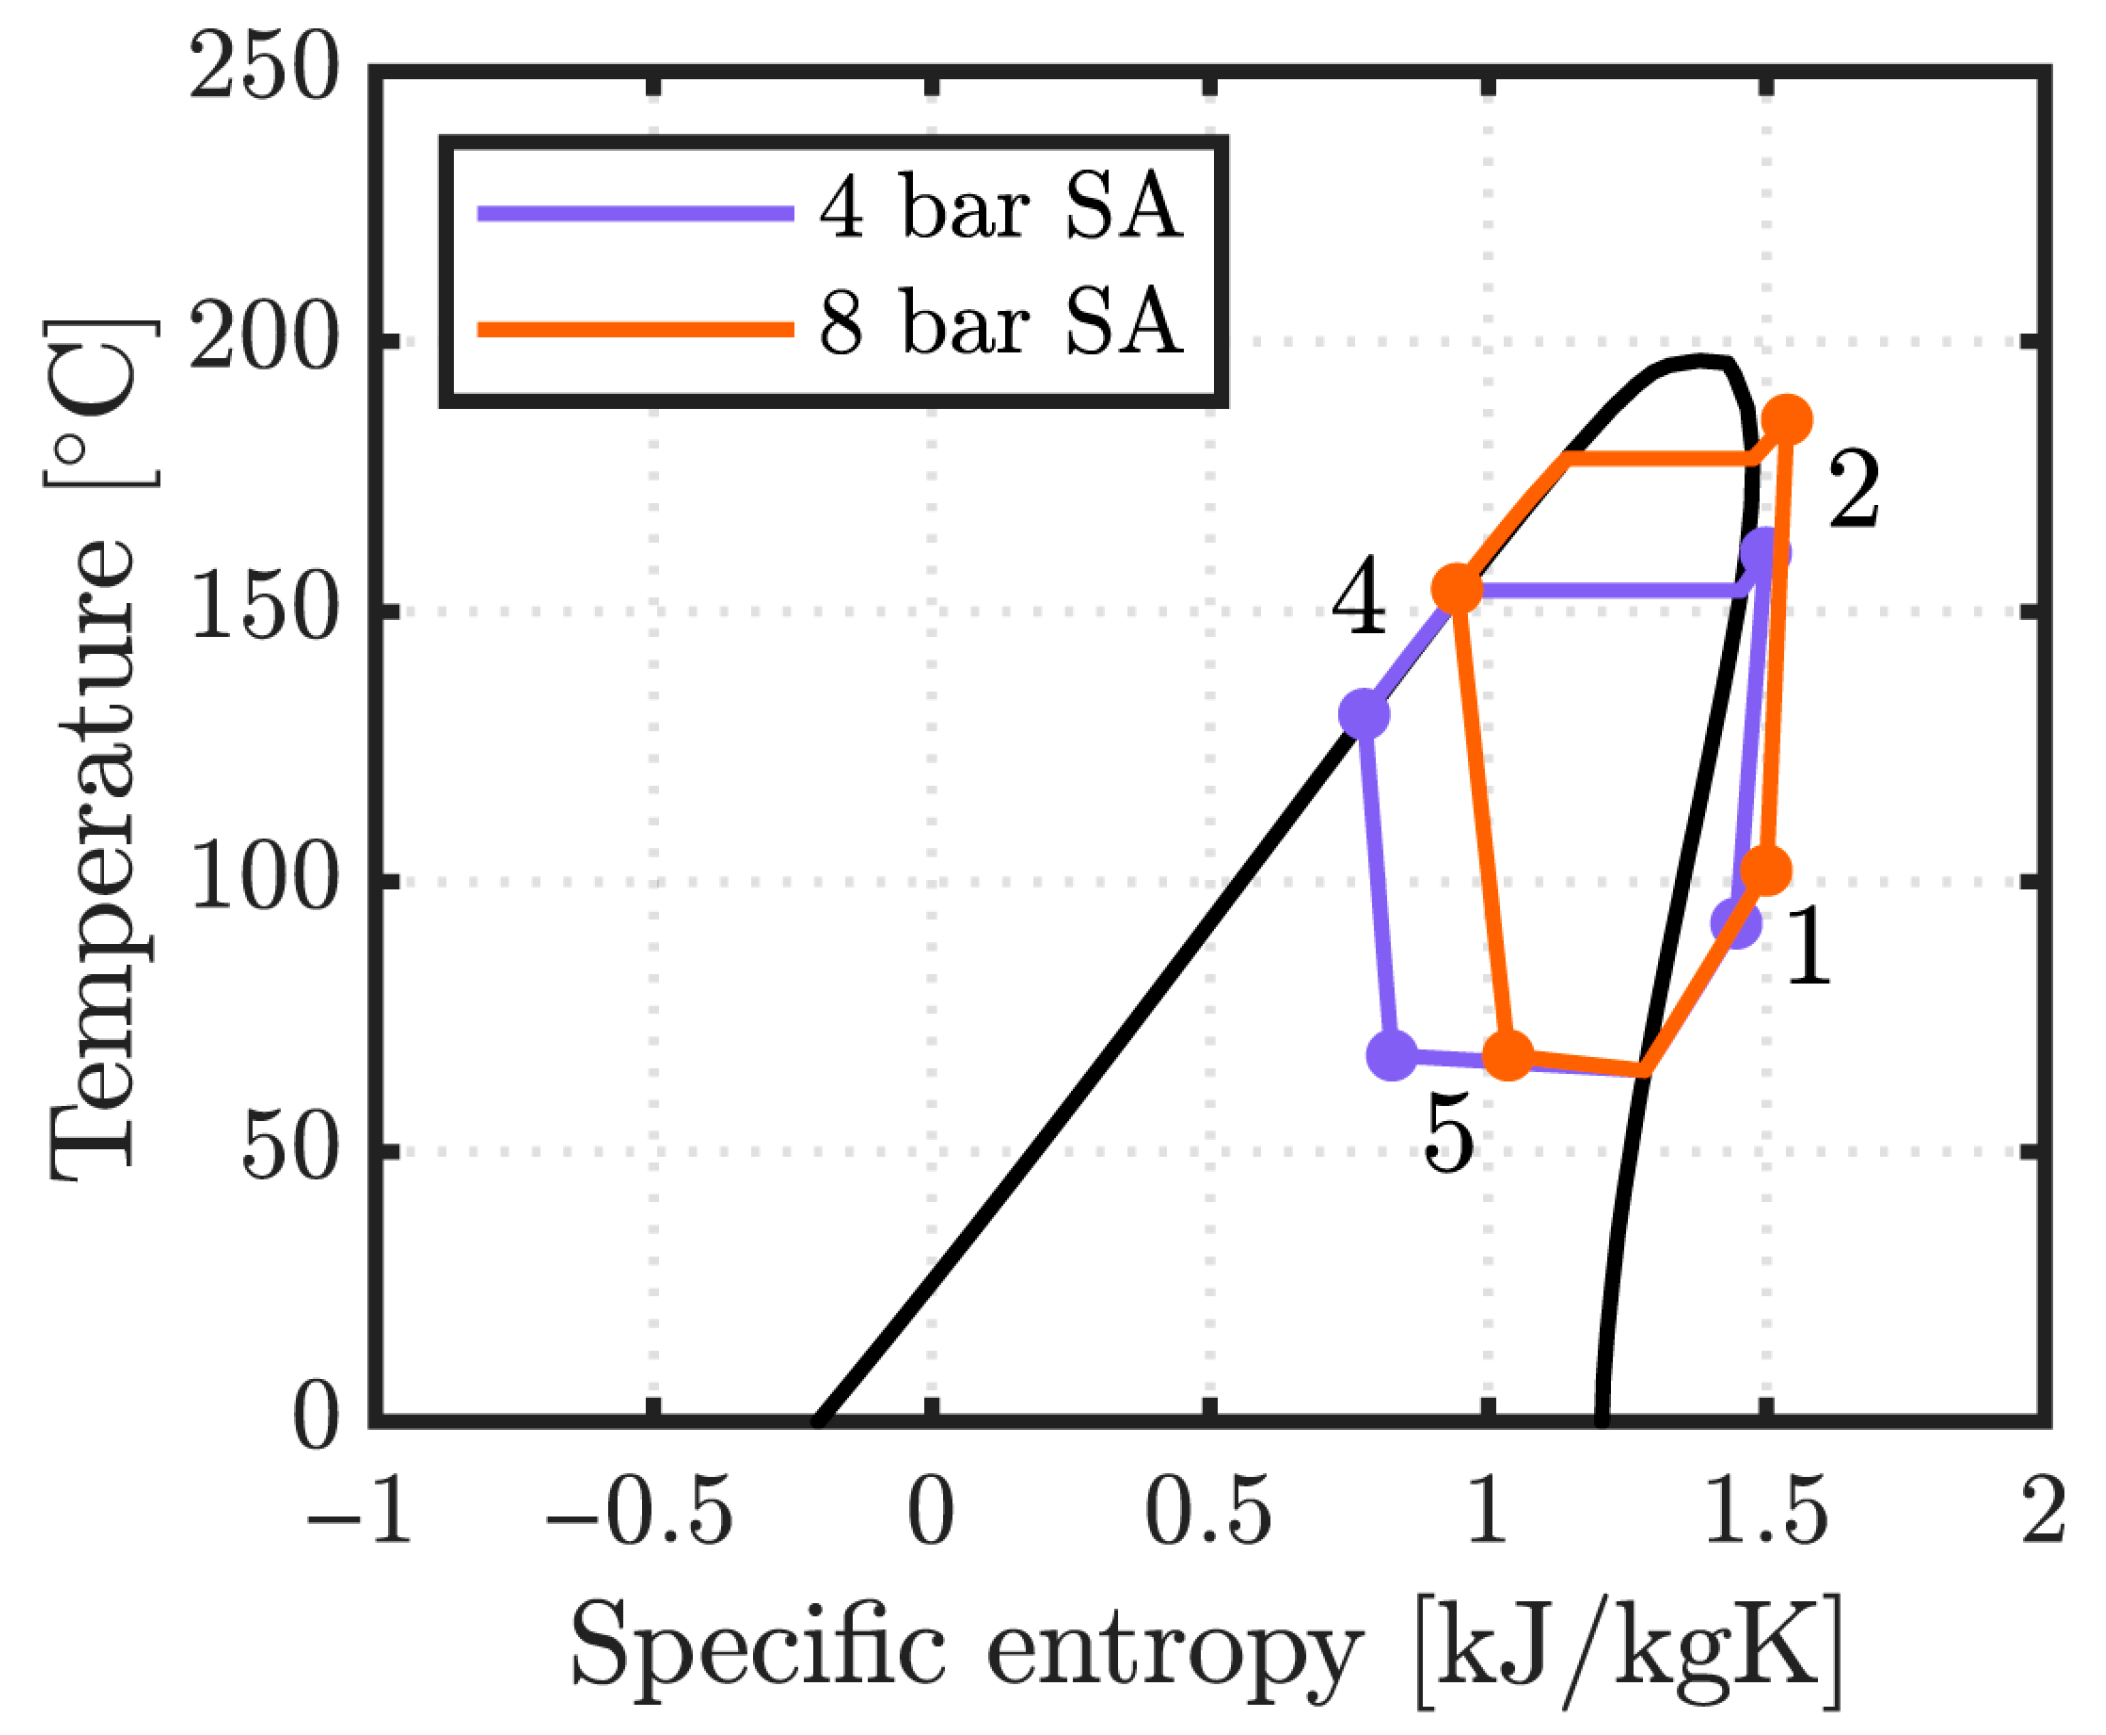
By smoothing steam supply variations, and subject to temperature and thermal power deviations’ acceptability in the downstream processes, SA may ensure their continuous operation along with flexible adjustment of HTHP power. However, SA integration also requires either increasing the pressure level of the water feed or decreasing that of the steam header. These findings suggest that the former should be avoided as it significantly impacts HTHPs capacity to supply the downstream processes. The latter leads to much smaller variations in HTHP and steam delivery performance, and only during power turn-down, with the extent to which the steam header pressure can be decreased to be assessed case by case.
Therefore, the following section concludes by focusing on steam delivery during HTHP power turn-down operation and with a 4-bar downstream SA. Accounting for the dynamic phenomena discussed, guidelines are derived for SA sizing at different levels of HTHP turn-down setpoints and duration. These allow us to contain the unserved steam demand within acceptability and should guide the assessment of this technical solution in various cases.

4.1. SA Sizing Guidelines for a Reliable Steam Supply

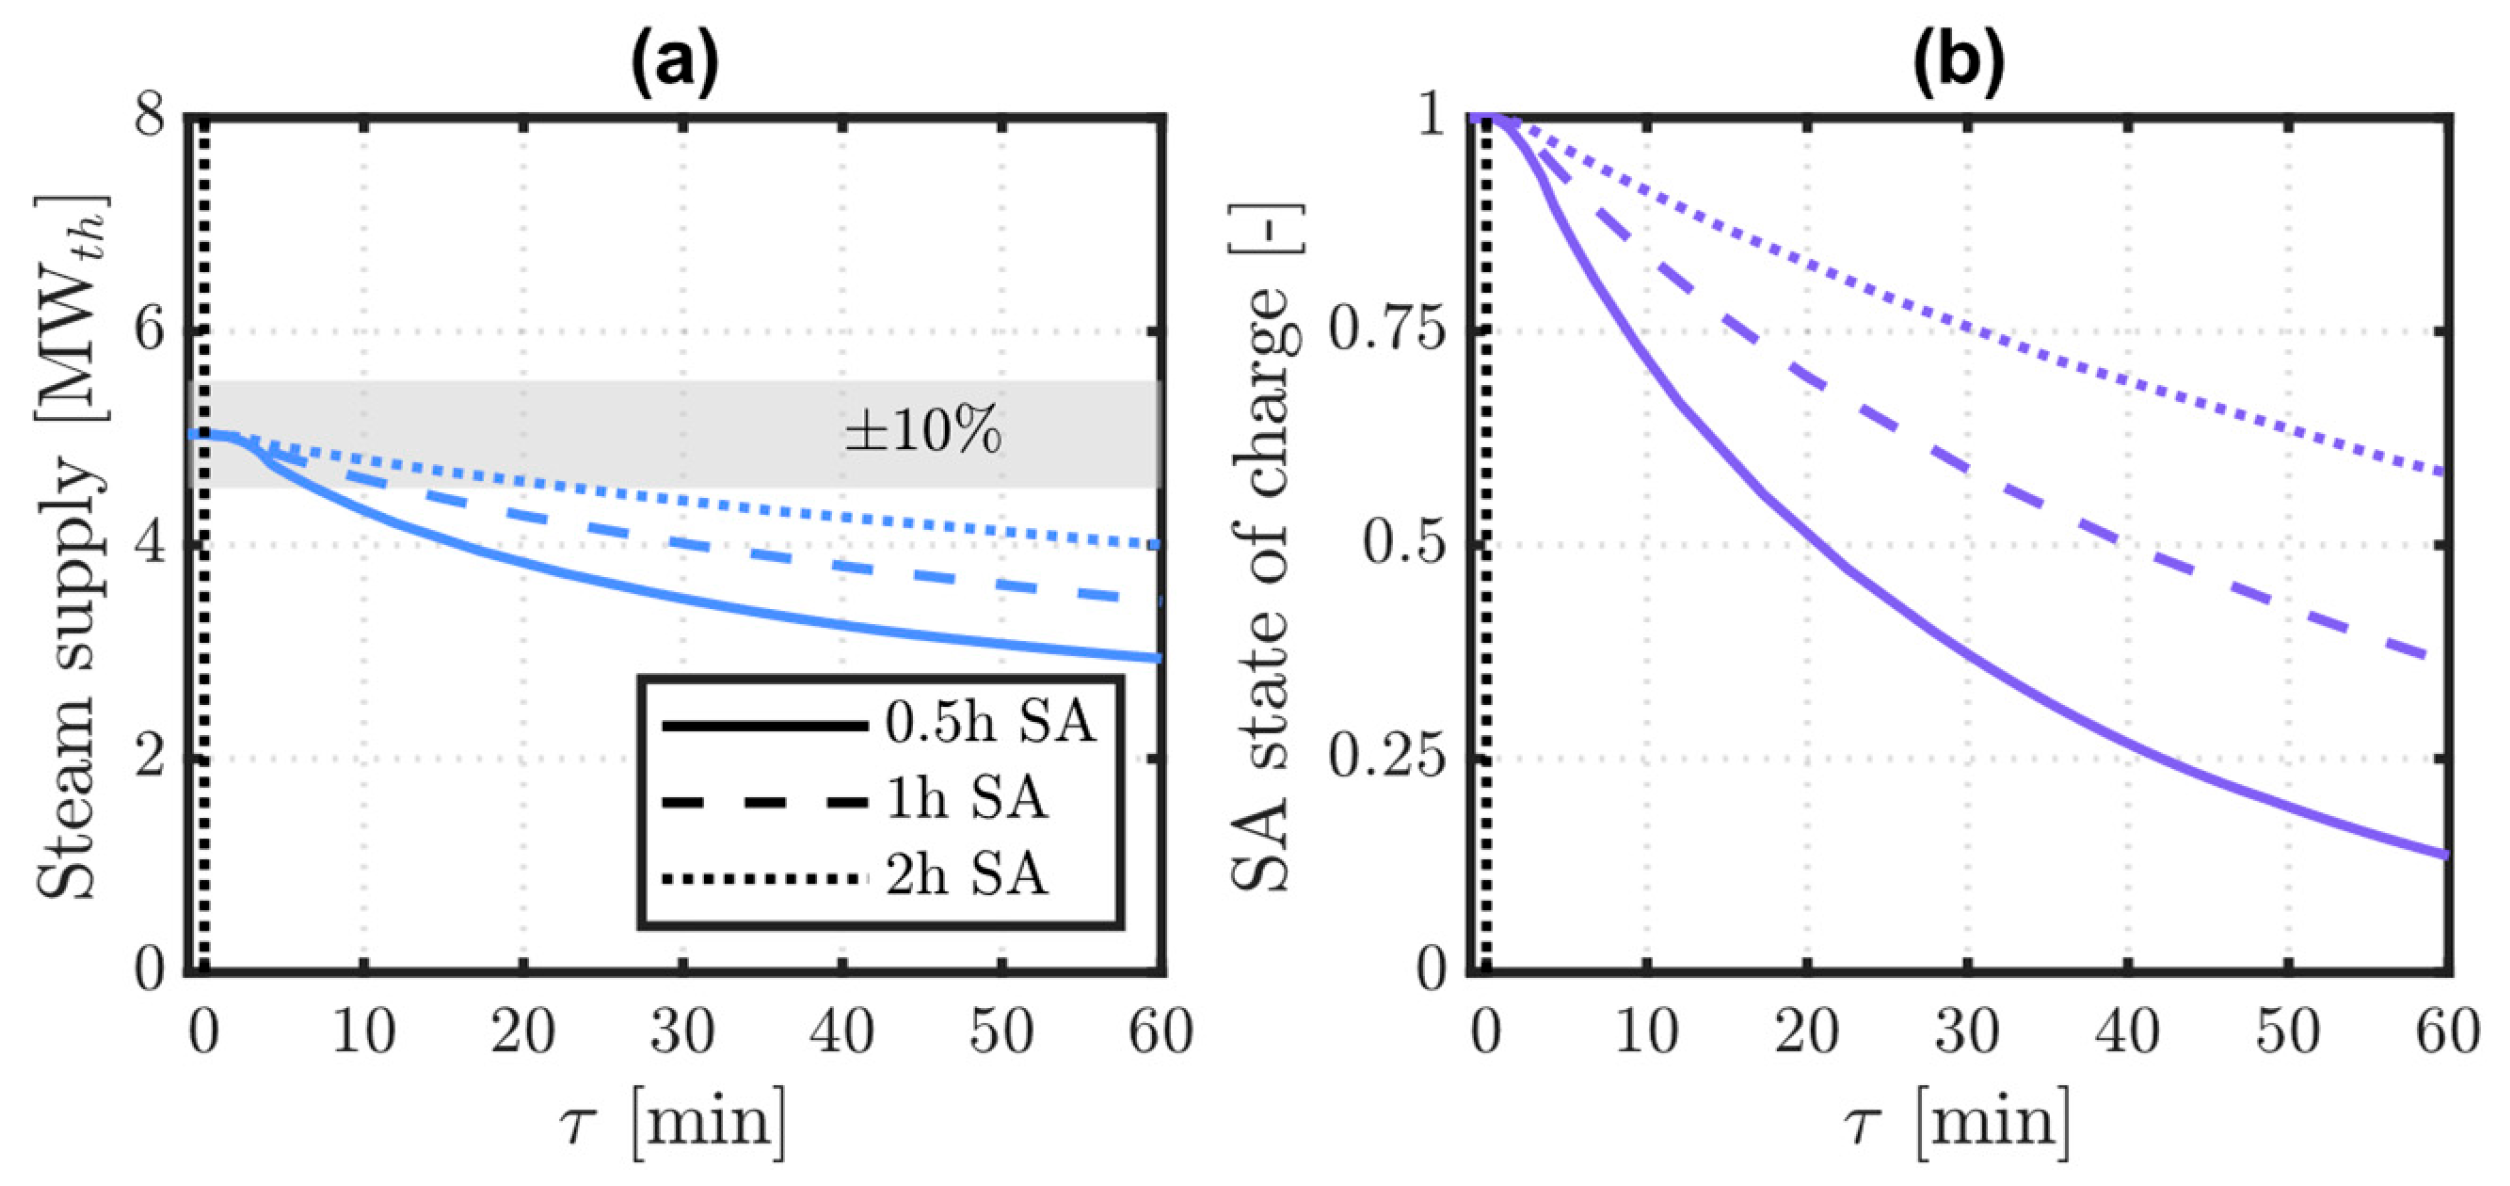
Figure 10 shows the thermal power of steam supplied with three SAs of different design capacities and the evolution in SA state of charge. Departure from the rated thermal power of steam supplied is mitigated by a downstream SA, to an extent that depends on SA capacity. The computed values of unserved steam demand to the industrial processes, U S D , are 27%, 18%, and 11%, respectively, for a 0.5, 1, or 2 h tank capacity. As bigger SAs are shown to reduce U S D , as well as the steam supply departure from rated thermal power values, it must be possible to size SA so that the steam supply is kept within the acceptability range. Depending on the specific application, the unserved steam demand to the industrial processes or the instantaneous thermal power could be chosen as the most suitable indicator to quantify this acceptability range. Choosing the former entails setting a lower bound for the thermal energy delivered over a certain period and therefore seems more significant, for instance, when other backup steam generation technologies are available on-site. Choosing the thermal power delivered, on the contrary, involves limiting the departure from rated values at each timepoint throughout a certain period, which is generally a stricter requirement. Hence, it seems more relevant to a standalone application.
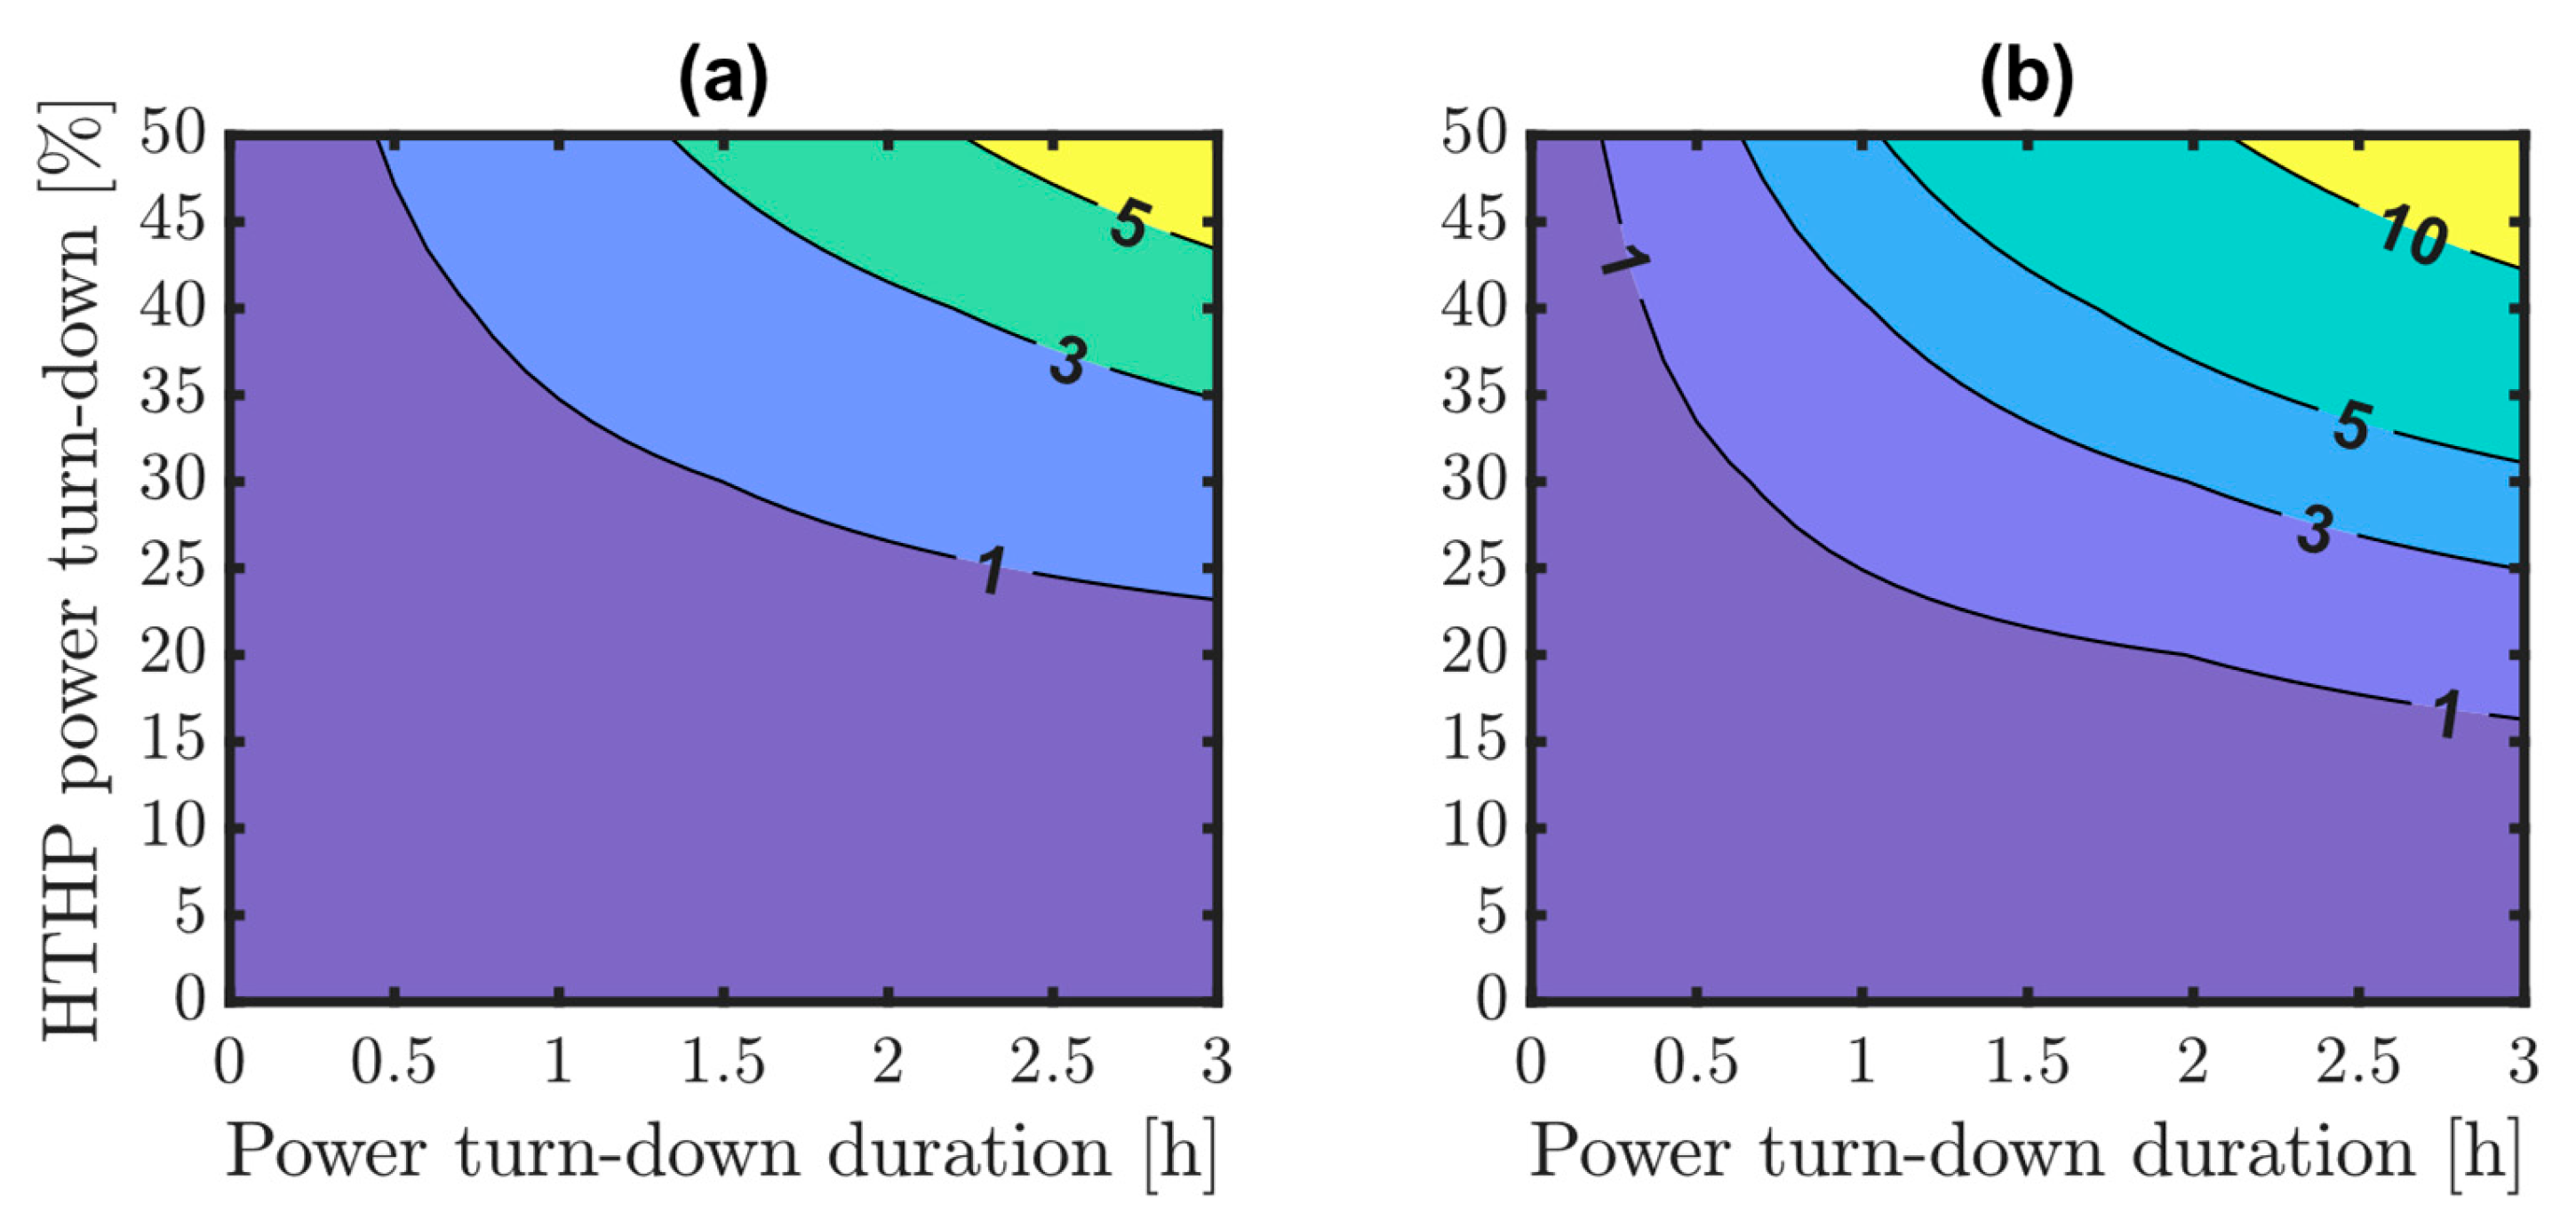
Figure 11 presents the actual SA supply time to be used for SA sizing in the integrated HTHP + SA systems; panel (a) assumes a maximum 10% drop in U S D to be acceptable and panel (b) a maximum 10% drop in the thermal power supplied. Both figures show that SA sizing depends on the desired level of power reduction during HTHP turn-down operation (y-axis), as well as its duration (x-axis). At up to 20% power turn-down, HTHP and steam departure from rated conditions is small, and SAs of up to 1 h are found sufficient for a reliable operation of the downstream industrial processes. However, a wider HTHP flexibility necessitates larger SA capacities; the desired level of power reduction during HTHP turn-down affects SA sizing much more than the expected turn-down duration. Comparing the actual SA supply time values from panels (a) and (b) in Figure 11 also demonstrates how limiting the drop in thermal power supplied as opposed to the unserved steam demand is a stricter acceptability requirement and necessitates larger SA capacities.
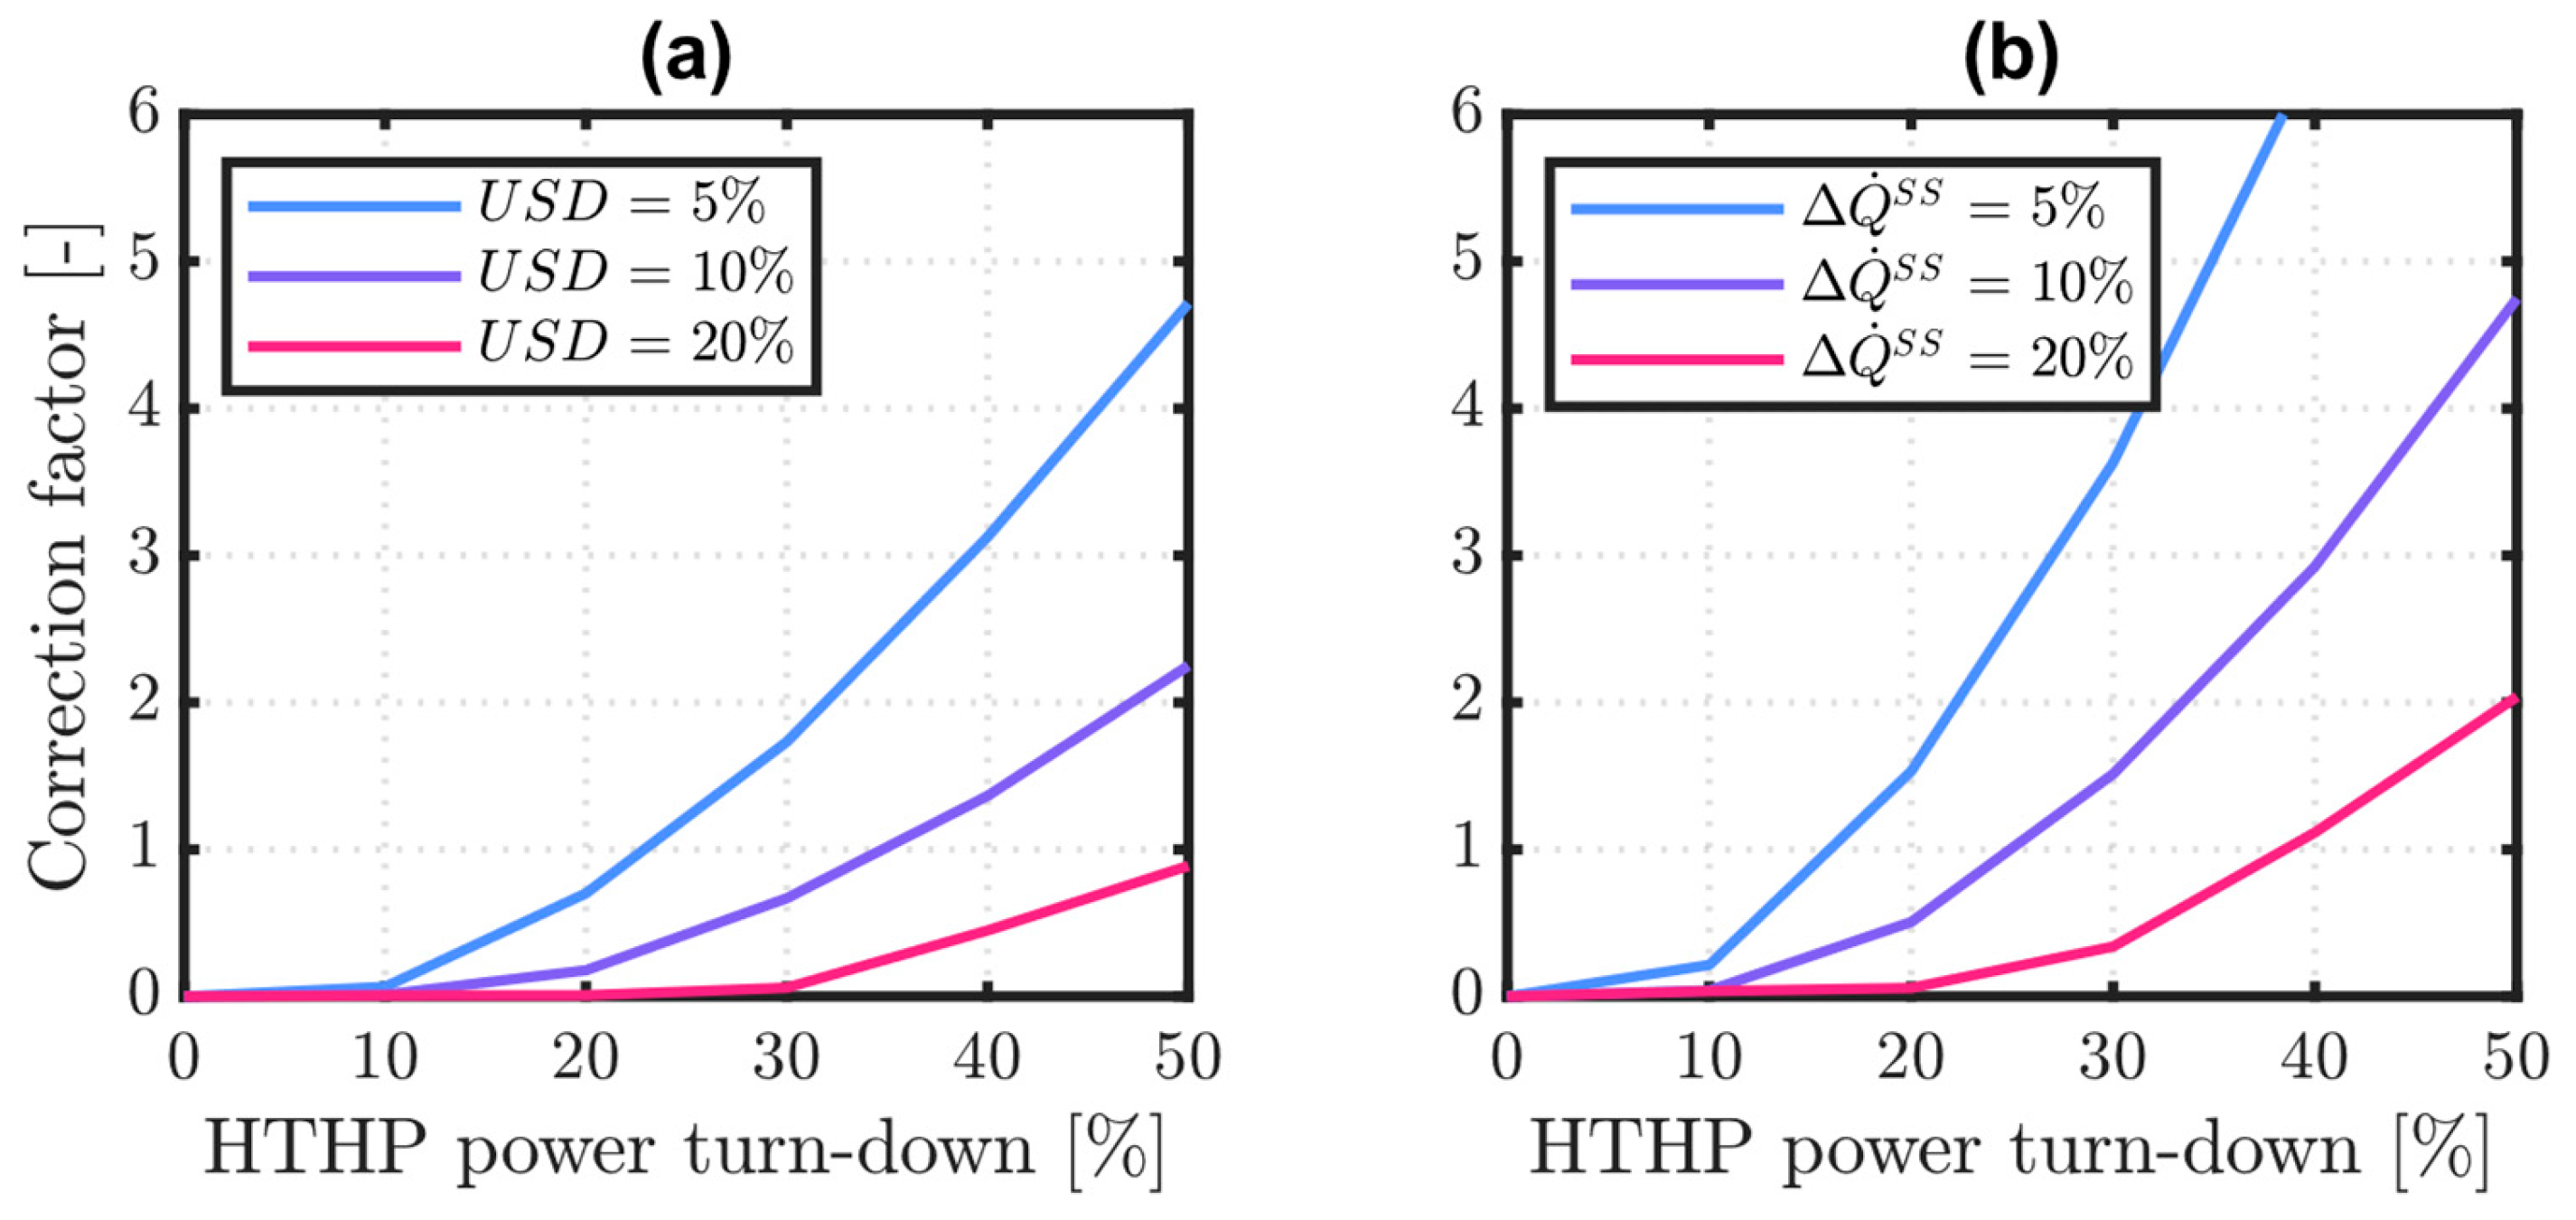
Finally, design correction factors for variable levels of the relevant acceptability threshold are presented in Figure 12. These are multiplication factors on the SA tank capacity that will be needed to match a certain duration of HTHP turn-down operation. Again, in Figure 12a, the threshold is applied to the drop in U S D , and in Figure 12b, to the drop in the thermal power supplied. Particularly at high levels of HTHP power turn-down, correction factors are above unit values. This indicates that a steady-state SA design not accounting for the integrated HTHP and SA dynamics can result in significantly undersized SAs. On the other hand, for minor reductions in HTHP power, correction factors are below the unit value. In these cases, a smaller SA may be needed compared to what traditional steady-state design would suggest. These sizing corrections could be considered, together with the revenues resulting from different schemes of demand–response and balancing services provided to the grid, to assess the economic viability of flexible HTHP operation and SA investments, case by case. Economic considerations are beyond the scope of this work, but a suggested area for follow-up work is to quantify the viability of this integrated solution for flexible HTHP operation in specific industrial applications.

4.2. Limitations of This Study

This work aims to position itself between technology- and system-level assessment. Thus, without developing a fully dynamic HTHP model, as carried out in existing studies on heat pump control [10,23,45], it instead aims to capture, both directly and indirectly, and discuss only those dynamics that are relevant for system-level technology integration. Accordingly, a relatively simple system configuration was considered to better characterise steam supply dynamics associated with flexible HTHP operation and their mitigation via a downstream SA.
Of course, alternative configurations of the steam supply networks will react to and tolerate deviations in steam supply differently. On-site availability of other backup technologies will also help to counteract variations. Moreover, it is possible that the many HTHP system layouts proposed [33] will be more or less sensitive to power turn-up/down. Nonetheless, acknowledging their extent will ultimately be case-dependent. This work uncovers dynamic effects and technical considerations that will be encountered when providing steam with flexible HTHP operation and downstream storage in an SA.

5. Conclusions

This study examined steam supply using both HTHP alone and in combination with a downstream SA, testing two alternative pressure intervals for the SA. It revealed both steady-state and dynamic effects that should be considered for suitable design and reliable system operation.
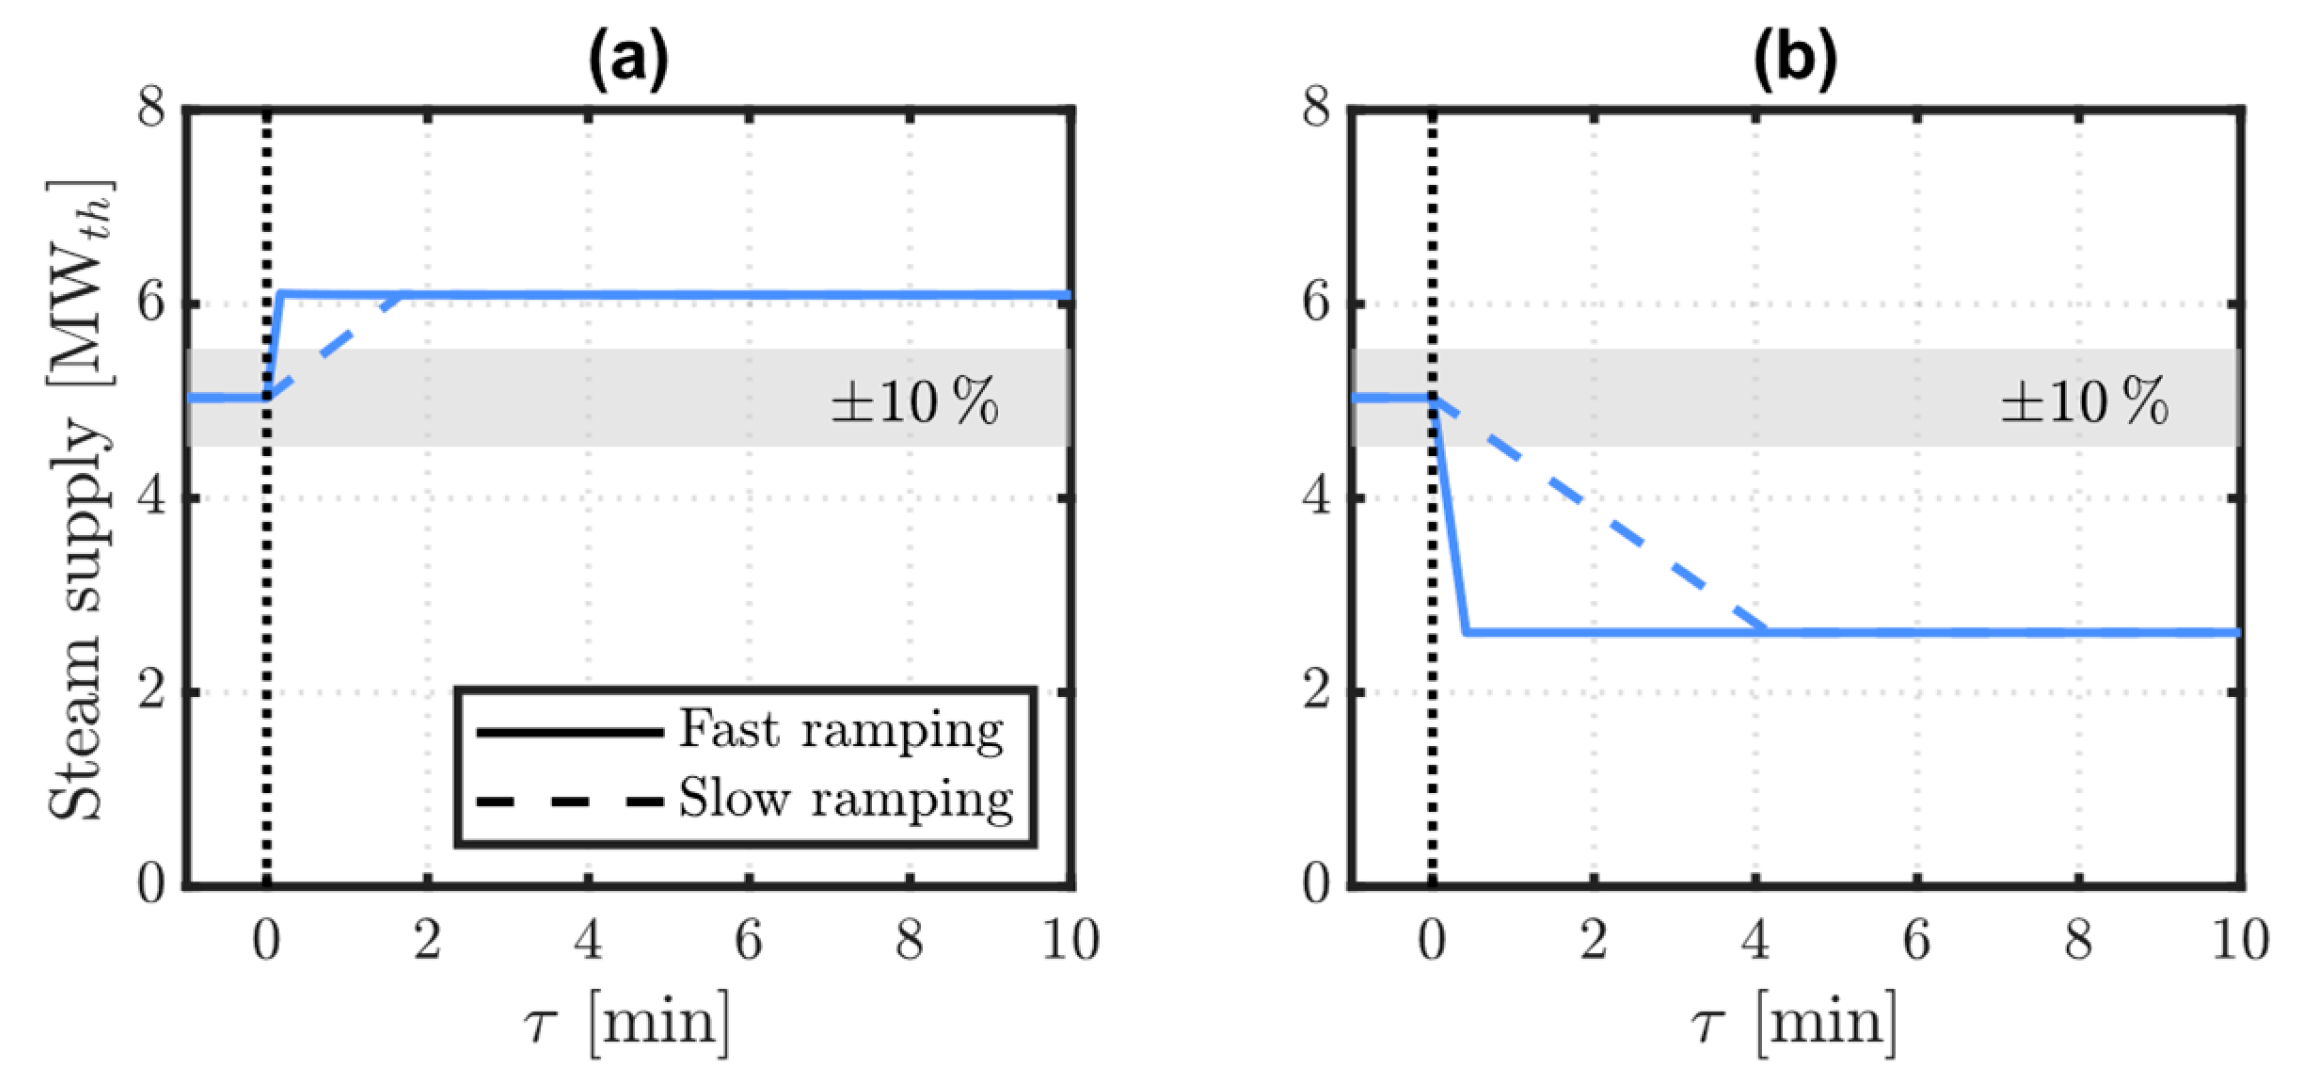
Even in a steady state, enabling demand-side flexibility from HTHP operation impacts the coefficient of performance achievable in rated conditions, to an extent that mainly depends on the technical features of the compressor. Furthermore, operating HTHPs flexibly was proven to result in changes to both the temperature and mass flow rate of the steam supplied to downstream processes. For a 20% increase in power consumption, a 21% higher thermal power could be delivered, while for a 50% reduction, the steam power supplied dropped to 48%. Alternative HTHP cycle layouts may present a technically feasible operation for different power turn-up and turn-down regions and therefore vary in suitability for flexible HTHP use. Yet, changes to the downstream steam supply are still to be expected.
A downstream SA between the HTHP and the processes supplied was proven effective in smoothing these fluctuations in the thermal power of steam delivered. Provided that the associated steam temperature variations are acceptable, the results demonstrated that the combined HTHP and SA system ensures a continuous steam supply to the downstream processes within acceptability, and it can be considered to enact a demand-side response. However, while the HTHP dynamic response to ramps in power input is resolved in a few minutes, longer-term dynamics in the order of hours are introduced by the SA. These are intrinsic to the sliding-pressure operation of SAs. Considering these dynamics for the appropriate design of the SA is shown to be paramount for a reliable steam supply.

Author Contributions

A.V.: Conceptualisation, Methodology, Formal Analysis, Validation, Investigation, Writing—Original Draft, Writing—Review and Editing, Visualisation, Funding Acquisition; J.H.B.H.: Methodology, Writing—Review and Editing; A.S.: Conceptualisation, Methodology, Validation, Investigation, Writing—Review and Editing. All authors have read and agreed to the published version of the manuscript.

Funding

Andrea Vecchi acknowledges the financial support to this project received from the University of Melbourne Early Career Researcher Grant scheme (2024ECRG155). Adriano Sciacovelli acknowledges the financial support to this project received from the Novo Nordisk Foundation (AI-LoDES, NNF25OC0100591).

Data Availability Statement

The original contributions presented in this study are included in the article. Further inquiries can be directed to the corresponding author.

Conflicts of Interest

The authors declare no conflicts of interest.

Nomenclature

Symbols
Q ˙ thermal power(W)
W ˙ power(W)
c p specific heat capacity(kJ/kgK)
m ˙ mass flow rate(kg/s)
m ¯ corrected mass flow rate(-)
n ¯ corrected rotational speed(-)
h specific enthalpy(kJ/kg)
s specific entropy(kJ/kgK)
R e Reynolds number(-)
Π compression ratio(-)
A heat transfer surface(m2)
C O P coefficient of performance(-)
D diameter(m)
L liquid level(-)
N number of segments(-)
P wetted perimeter(m)
T temperature(K)
U heat transfer coefficient(W/mK)
U S D unserved steam demand(-)
V volume(m3)
a generic coefficient(-)
n rotational speed(rpm)
p pressure(Pa)
t time(t)
η isentropic efficiency(-)
λ thermal conductivity(W/mK)
μ dynamic viscosity(Pa s)
ρ density(kg/m3)
Subscripts and Superscripts
0 rated
H X heat exchanger
S S steam supply
W wall
c cross-section
e electrical
h hydraulic
i segment
i n inlet
l liquid
o u t outlet
v vapour

References

  1. Xu, Y.; Leonforte, F.; Del Pero, C. District Multi-Energy Systems: A Comprehensive Review of Configurations, Technologies, and Performances. Build. Environ. 2024, 253, 111318. [Google Scholar] [CrossRef]
  2. Lund, H.; Østergaard, P.A.; Chang, M.; Werner, S.; Svendsen, S.; Sorknæs, P.; Thorsen, J.E.; Hvelplund, F.; Mortensen, B.O.G.; Mathiesen, B.V.; et al. The Status of 4th Generation District Heating: Research and Results. Energy 2018, 164, 147–159. [Google Scholar] [CrossRef]
  3. Pellegrini, M.; Bianchini, A. The Innovative Concept of Cold District Heating Networks: A Literature Review. Energies 2018, 11, 236. [Google Scholar] [CrossRef]
  4. Wang, L.; Yu, S.; Kong, F.; Sun, X.; Zhou, Y.; Zhong, W.; Lin, X. A Study on Energy Storage Characteristics of Industrial Steam Heating System Based on Dynamic Modeling. Energy Rep. 2020, 6, 190–198. [Google Scholar] [CrossRef]
  5. Hanus, K.; Variny, M.; Illés, P. Assessment and Prediction of Complex Industrial Steam Network Operation by Combined Thermo-Hydrodynamic Modeling. Processes 2020, 8, 622. [Google Scholar] [CrossRef]
  6. Rehfeldt, M.; Globisch, J.; Fleiter, T. Fuel Choice in Industrial Steam Generation: Empirical Evidence Reveals Technology Preferences. Energy Strategy Rev. 2019, 26, 100407. [Google Scholar] [CrossRef]
  7. Madeddu, S.; Ueckerdt, F.; Pehl, M.; Peterseim, J.; Lord, M.; Kumar, K.A.; Krüger, C.; Luderer, G. The CO2 Reduction Potential for the European Industry via Direct Electrification of Heat Supply (Power-to-Heat). Environ. Res. Lett. 2020, 15, 124004. [Google Scholar] [CrossRef]
  8. US Department of Energy. Industrial Decarbonization Roadmap; US Department of Energy: Washington, DC, USA, 2022. [Google Scholar]
  9. Xiong, T.; Wu, H.; Hu, L.; Liu, G.; Yan, G. Optimal Design of Vapor-Bypassed Heat Exchanger for Performance Improvement of Air Source Heat Pump System. Renew. Energy 2025, 249, 123219. [Google Scholar] [CrossRef]
  10. Crawley, J.; Martin-Vilaseca, A.; Wingfield, J.; Gill, Z.; Shipworth, M.; Elwell, C. Demand Response with Heat Pumps: Practical Implementation of Three Different Control Options. Build. Serv. Eng. Res. Technol. 2023, 44, 211–228. [Google Scholar] [CrossRef]
  11. Althaher, S.; Mancarella, P.; Mutale, J. Automated Demand Response From Home Energy Management System Under Dynamic Pricing and Power and Comfort Constraints. IEEE Trans. Smart Grid 2015, 6, 1874–1883. [Google Scholar] [CrossRef]
  12. Zhang, L.; Good, N.; Mancarella, P. Building-to-Grid Flexibility: Modelling and Assessment Metrics for Residential Demand Response from Heat Pump Aggregations. Appl. Energy 2019, 233–234, 709–723. [Google Scholar] [CrossRef]
  13. Naumann, G.; Schropp, E.; Gaderer, M. Predictive Rule-Based Control for an Air-Source Heat Pump System: Environmental and Economic Impacts in Future Energy Scenarios. Appl. Energy 2025, 396, 126298. [Google Scholar] [CrossRef]
  14. Hu, L.; Xiong, T.; Liu, G.; Xiao, Q.; Li, T.; Li, J.; Yan, G. Variable-Circuitry Heat Exchanger for Performance Improvement of R290 Air Source Heat Pump System. Energy 2025, 318, 134818. [Google Scholar] [CrossRef]
  15. Jouhara, H.; Żabnieńska-Góra, A.; Delpech, B.; Olabi, V.; El Samad, T.; Sayma, A. High-Temperature Heat Pumps: Fundamentals, Modelling Approaches and Applications. Energy 2024, 303, 131882. [Google Scholar] [CrossRef]
  16. Liu, C.; Han, W.; Xue, X. Experimental Investigation of a High-Temperature Heat Pump for Industrial Steam Production. Appl. Energy 2022, 312, 118719. [Google Scholar] [CrossRef]
  17. Zühlsdorf, B. High-Temperature Heat Pumps—IEA Annex 58—Task 1: Technologies; International Energy Agency (IEA): Paris, France, 2023; ISBN 9789189821347. [Google Scholar]
  18. Knorr, L.; Schlosser, F.; Horstmann, N.; Divkovic, D.; Meschede, H. Flexible Operation and Integration of High-Temperature Heat Pumps Using Large Temperature Glides. Appl. Energy 2024, 368, 123417. [Google Scholar] [CrossRef]
  19. Wolscht, L.; Knobloch, K.; Jacquemoud, E.; Jenny, P. Dynamic Simulation and Experimental Validation of a 35 MW Heat Pump Based on a Transcritical CO2 Cycle. Energy 2024, 294, 130897. [Google Scholar] [CrossRef]
  20. Steinmann, W.D.; Eck, M. Buffer Storage for Direct Steam Generation. Solar Energy 2006, 80, 1277–1282. [Google Scholar] [CrossRef]
  21. Stevanovic, V.D.; Maslovaric, B.; Prica, S. Dynamics of Steam Accumulation. Appl. Therm. Eng. 2012, 37, 73–79. [Google Scholar] [CrossRef]
  22. Tian, X.; Hao, Y.; Zhao, G.; Liang, J. Research on Dynamic Modeling of a High Temperature Steam Heat Pump. In Proceedings of the 2020 Chinese Automation Congress, CAC 2020, Shanghai, China, 6 November 2020; Institute of Electrical and Electronics Engineers Inc.: Piscataway, NJ, USA, 2020; pp. 2784–2789. [Google Scholar]
  23. Meesenburg, W.; Markussen, W.B.; Ommen, T.; Elmegaard, B. Optimizing Control of Two-Stage Ammonia Heat Pump for Fast Regulation of Power Uptake. Appl. Energy 2020, 271, 115126. [Google Scholar] [CrossRef]
  24. Tassenoy, R.; Laterre, A.; Lemort, V.; Contino, F.; De Paepe, M.; Lecompte, S. Assessing the Influence of Compressor Inertia on the Dynamic Performance of Large-Scale Vapor Compression Heat Pumps for Carnot Batteries. J. Energy Storage 2024, 101, 113948. [Google Scholar] [CrossRef]
  25. Garcia, P.; Largiller, G. Performances and Control Aspects of Steam Storage Systems with PCM: Key Learnings from a Pilot-Scale Prototype. Appl. Energy 2022, 325, 119817. [Google Scholar] [CrossRef]
  26. Ilic, M.; Stevanovic, V.D.; Petrovic, M.M.; Milivojevic, S. Numerical Investigations of Steam Accumulator Dynamics: Assessment of Computational Models. J. Energy Storage 2024, 96, 112633. [Google Scholar] [CrossRef]
  27. Sun, W.; Hong, Y.; Wang, Y. Operation Optimization of Steam Accumulators as Thermal Energy Storage and Buffer Units. Energies 2017, 10, 17. [Google Scholar] [CrossRef]
  28. Kasper, L.; Pernsteiner, D.; Schirrer, A.; Jakubek, S.; Hofmann, R. Experimental Characterization, Parameter Identification and Numerical Sensitivity Analysis of a Novel Hybrid Sensible/Latent Thermal Energy Storage Prototype for Industrial Retrofit Applications. Appl. Energy 2023, 344, 121300. [Google Scholar] [CrossRef]
  29. Sun, B.; Guo, J.; Lei, Y.; Yang, L.; Li, Y.; Zhang, G. Simulation and Verification of a Non-Equilibrium Thermodynamic Model for a Steam Catapult’s Steam Accumulator. Int. J. Heat Mass Transf. 2015, 85, 88–97. [Google Scholar] [CrossRef]
  30. Niknam, P.H.; Sciacovelli, A. Hybrid PCM-Steam Thermal Energy Storage for Industrial Processes—Link between Thermal Phenomena and Techno-Economic Performance through Dynamic Modelling. Appl. Energy 2023, 331, 120358. [Google Scholar] [CrossRef]
  31. Zhu, Q.; Lu, P.; Yang, Z.; Ji, X.; Han, Y. Multi-Parameter Optimization for the Wet Steam Accumulator of a Steam-Powered Catapult. Energies 2019, 12, 234. [Google Scholar] [CrossRef]
  32. Bergamini, R.; Jensen, J.K.; Elmegaard, B. Thermodynamic Competitiveness of High Temperature Vapor Compression Heat Pumps for Boiler Substitution. Energy 2019, 182, 110–121. [Google Scholar] [CrossRef]
  33. Mateu-Royo, C.; Arpagaus, C.; Mota-Babiloni, A.; Navarro-Esbrí, J.; Bertsch, S.S. Advanced High Temperature Heat Pump Configurations Using Low GWP Refrigerants for Industrial Waste Heat Recovery: A Comprehensive Study. Energy Convers. Manag. 2021, 229, 113752. [Google Scholar] [CrossRef]
  34. Lovegrove, K.; Alexander, D.; Bader, R.; Edwards, S.; Lord, M.; Mojiri, A.; Rutovitz, J.; Saddler, H.; Stanley, C.; Urkalan, K.; et al. Renewable Energy Options for Industrial Process Heat; ITP Thermal Pty Limited: Turner, Australia, 2019. [Google Scholar]
  35. Fritzson, P.; Aronsson, P.; Pop, A.; Lundvall, N.; Nystrom, K.; Saldamli, L.; Broman, D.; Sandholm, A. OpenModelica—A Free Open-Source Environment for System Modeling, Simulation, and Teaching. In Proceedings of the IEEE Conference on Computer Aided Control System Design, IEEE International Conference on Control Applications, IEEE International Symposium on Intelligent Control, Munich, Germany, 4–6 October 2006; IEEE: Munich, Germany, 2006. [Google Scholar]
  36. Bastida, H.; Ugalde-Loo, C.E.; Abeysekera, M.; Xu, X.; Qadran, M. Dynamic Modelling and Control of Counter-Flow Heat Exchangers for Heating and Cooling Systems. In Proceedings of the 54th International Universities Power Engineering Conference (UPEC), Bucharest, Romania, 3–6 September 2019; IEEE: Bucharest, Romania, 2019. [Google Scholar]
  37. Casella, F.; Richter, C. ExternalMedia: A Library for Easy Re-Use of External Fluid Property Code in Modelica. In Proceedings of the 6th International Modelica Conference, Bielefeld, Germany, 3–4 March 2008; pp. 157–161. [Google Scholar]
  38. Incropera, F.P.; DeWitt, D.P.; Bergman, T.L.; Lavine, A.S. Introduction to Heat Transfer; Wiley: Oxford, UK, 2006. [Google Scholar]
  39. Nellis, G.F.; Klein, S. Heat Transfer; Cambridge University Press: Cambridge, UK, 2009; ISBN 9780521881074. [Google Scholar]
  40. Shah, M.M. A General Correlation for Heat Transfer during Film Condensation inside Pipes. J. Heat Mass Transf. 1979, 22, 547–556. [Google Scholar] [CrossRef]
  41. Desideri, A.; Hernandez, A.; Gusev, S.; van den Broek, M.; Lemort, V.; Quoilin, S. Steady-State and Dynamic Validation of a Small-Scale Waste Heat Recovery System Using the ThermoCycle Modelica Library. Energy 2016, 115, 684–696. [Google Scholar] [CrossRef]
  42. Rodriguez, E.; Rasmussen, B. A Comparison of Modeling Paradigms for Dynamic Evaporator Simulations with Variable Fluid Phases. Appl. Therm. Eng. 2017, 112, 1326–1342. [Google Scholar] [CrossRef]
  43. Wilkinson, S.; Maticka, M.J.; Liu, Y.; John, M. The Duck Curve in a Drying Pond: The Impact of Rooftop PV on the Western Australian Electricity Market Transition. Util. Policy 2021, 71, 101232. [Google Scholar] [CrossRef]
  44. Noor, I.M.; Dawidowski, P.L.; Ottewill, J.R.; Haugen, T.; Zagorowska, M.A.; Thornhill, N.F. Electrical Power Management by Flexible Operation of a Continuous Gas Export Plant. IEEE Access 2024, 12, 139411–139426. [Google Scholar] [CrossRef]
  45. Kim, Y.J.; Norford, L.K.; Kirtley, J.L. Modeling and Analysis of a Variable Speed Heat Pump for Frequency Regulation through Direct Load Control. IEEE Trans. Power Syst. 2015, 30, 397–408. [Google Scholar] [CrossRef]
  46. Zhao, P.; Gao, L.; Wang, J.; Dai, Y. Energy Efficiency Analysis and Off-Design Analysis of Two Different Discharge Modes for Compressed Air Energy Storage System Using Axial Turbines. Renew. Energy 2016, 85, 1164–1177. [Google Scholar] [CrossRef]
  47. Liang, T.; Vecchi, A.; Knobloch, K.; Sciacovelli, A.; Engelbrecht, K.; Li, Y.; Ding, Y. Key Components for Carnot Battery: Technology Review, Technical Barriers and Selection Criteria. Renew. Sustain. Energy Rev. 2022, 163, 112478. [Google Scholar] [CrossRef]
Figure 1. The steam supply system layout investigated. Dashed pipework is needed only in cases featuring HTHP + SA; numbers indicate locations where thermodynamic states are tracked.
Energies 18 03806 g001
Figure 2. Validation of the dynamic models presented: predicted (a) degree of superheat in a counterflow evaporator versus results from [42]; (b) pressure; and (c) liquid level in a SA versus results from [30].
Energies 18 03806 g002
Figure 3. Compressor off-design maps of relative (a) compression ratio and (b) efficiency and considered operating points (conditions as per Table 3); n ¯ represents the corrected rotational speed.
Energies 18 03806 g003
Figure 4. Steady-state thermodynamic states along the HTHP cycle for power turn-up operation and a downstream SA at various pressures (states numbered as per Figure 1).
Energies 18 03806 g004
Figure 5. Mass flow rate (left) and temperature (right) of steam delivered for HTHP (a) power turn-up and (b) power turn-down operation. HTHP power departs from the rated value at τ = 0 and is adjusted following either slow or fast ramping.
Energies 18 03806 g005
Figure 6. Thermal power of the steam supplied for HTHP (a) power turn-up and (b) power turn-down operation. HTHP power departs from the rated value at τ = 0 and is adjusted following either slow or fast ramping.
Energies 18 03806 g006
Figure 7. Mass flow rate (left) and temperature (right) of steam delivered for HTHP power turn-up operation with a downstream (a) 4-bar and (c) 8-bar SA, and power turn-down operation with a downstream (b) 4-bar and (d) 8-bar SA. HTHP power departs from the rated value at τ = 0 and is adjusted following either slow or fast ramping.
Energies 18 03806 g007
Figure 8. Temperature and entropy evolution of steam supply conditions for HTHP (a) power turn-up and (b) power turn-down operation with a downstream SA at various pressures.
Energies 18 03806 g008
Figure 9. Thermal power of the steam supplied for HTHP power turn-up operation with a downstream (a) 4-bar and (c) 8-bar SA, and power turn-down operation with a downstream (b) 4-bar and (d) 8-bar SA. HTHP power departs from the rated value at τ = 0 and is adjusted following either slow or fast ramping.
Energies 18 03806 g009
Figure 10. (a) Thermal power of the steam supplied and (b) SA state of charge for HTHP power turn-down operation with a downstream 4-bar SA of various sizes. HTHP power departs from the rated value at τ = 0 .
Energies 18 03806 g010
Figure 11. Actual SA supply time [h] that limits to 10% (a) the unserved steam demand and (b) the drop in thermal power supplied, for various levels of HTHP power turn-down and durations.
Energies 18 03806 g011
Figure 12. Correction factor for SA design that limits the (a) unserved steam demand and (b) the drop in thermal power supplied to various thresholds, for various levels of HTHP power turn-down.
Energies 18 03806 g012
Table 1. Input parameters to the steady-state HTHP model.
Parameter, UnitValue
Compressor isentropic efficiency0.8
Degree of superheating at compressor outlet, °C7
Shafts’ mechanical efficiency0.97
Pinch point temperature difference, °C5
Pressure drop in the heat exchangers, bar0.2
Table 3. Summary of the model runs performed.
RunHTHP InputWater Feed PressureSteam Delivery PressureSA CapacityRamping
RatedRated4 bar4 barN.A.N.A.
Turn-up120% of rated4 bar4 barN.A.Fast; slow
Turn-down50% of rated4 bar4 barN.A.Fast; slow
Turn-up; 4-bar SA120% of rated4 bar4 bar1 hFast; slow
Turn-down; 4-bar SA50% of rated4 bar2 bar1 hFast; slow
Turn-up; 8-bar SA120% of rated8 bar4 bar1 hFast; slow
Turn-down; 8-bar SA50% of rated4 bar2 bar1 hFast; slow
Table 4. Design specifications for the condenser of the 5 MWth HTHP investigated, and an SA sized for a water level of up to 80%.
ComponentDesign SpecificationUnitValue
CondenserThermal dutyMWth5.00
CondenserHeat transfer surfacem2910
CondenserNumber of passages-800
CondenserSurface area densitym2/m3450
CondenserPipe internal diametermm25.4
Steam accumulator—4 barSliding pressurebar2 to 4
Steam accumulator—4 barFlashing capacity%4.5
Steam accumulator—4 barVolumem3116
Steam accumulator—8 barSliding pressurebar4 to 8
Steam accumulator—8 barFlashing capacity%5.4
Steam accumulator—8 barVolumem3103
Table 5. HTHP operational variables and steady-state performance indicators at the considered operating points.
Parameter, UnitRatedTurn-UpTurn-DownTurn-Up; 8 bar SA
Compressor rotational speed, rpm3558399029843968
Compressor efficiency0.800.810.830.85
Compressor power input, MWe1.982.380.992.38
Compressor outlet temperature, °C161.3160.9159.9180.3
Refrigerant mass flow rate, kg/s19.824.010.321.7
Condenser duty, MWth56.082.624.15
Steam mass flow rate, kg/s2.32.81.22.6
Steam temperature, °C155.5152.3155.9175.0
Evaporator duty, MWth3.083.781.671.75
Coefficient of performance2.532.552.641.74
Table 6. Unserved steam demand to the downstream processes for the runs considered.
Run U S D [%]
Rated0
Turn-up0
Turn-down46
Turn-up; 4-bar SA0
Turn-down; 4-bar SA18
Turn-up; 8-bar SA83
Turn-down; 8-bar SA16
Disclaimer/Publisher’s Note: The statements, opinions and data contained in all publications are solely those of the individual author(s) and contributor(s) and not of MDPI and/or the editor(s). MDPI and/or the editor(s) disclaim responsibility for any injury to people or property resulting from any ideas, methods, instructions or products referred to in the content.

