Article

Energy Yield Analysis of Bifacial Solar Cells in Northeast Mexico: Comparison Between Vertical and Tilted Configurations

by
Angel Eduardo Villarreal-Villela
1,
Osvaldo Vigil-Galán
2,
Eugenio Rodríguez González
1,*,
Jesús Roberto González Castillo
2,
Daniel Jiménez-Olarte
3,
Ana Bertha López-Oyama
4,5 and
Deyanira Del Angel-López
1
1
Centro de Investigación en Ciencia Aplicada y Tecnología Avanzada Unidad Altamira, Instituto Politécnico Nacional (CICATA UA—IPN), Altamira 89600, Tamaulipas, Mexico
2
Escuela Superior de Física y Matemáticas, Instituto Politécnico Nacional (ESFM—IPN), Mexico City 07738, Mexico
3
Escuela Superior de Ingeniería Mecánica y Eléctrica, Instituto Politécnico Nacional (ESIME—IPN), Mexico City 07738, Mexico
4
Departamento de Investigación en Física (DIFUS), Universidad de Sonora, Blvd. Transversal S/N, Hermosillo 83000, Sonora, Mexico
5
Secihti-DIFUS, Universidad de Sonora, Blvd. Transversal S/N, Hermosillo 83000, Sonora, Mexico
*
Author to whom correspondence should be addressed.
Energies 2025, 18(14), 3784; https://doi.org/10.3390/en18143784
Submission received: 11 June 2025 / Revised: 10 July 2025 / Accepted: 15 July 2025 / Published: 17 July 2025
(This article belongs to the Section A2: Solar Energy and Photovoltaic Systems)

Abstract

Bifacial photovoltaic technology is made up of solar cells with the ability to generate electrical power on both sides of the cell (front and rear), consequently, they generate more energy in the same area compared to conventional or monofacial solar cells. The present work deals with the calculation of the energy yield using bifacial solar cells under the specific environmental conditions of Tampico, Tamaulipas, Mexico. Two configurations were compared: (1) tilted, optimized in height and angle, oriented to the south, and (2) vertically optimized in height, oriented east–west. The results were also compared with a standard monofacial solar cell optimally tilted and oriented south. The experimental data were acquired using a current–voltage (I-V) curve tracer designed for this purpose. This study shows that the vertically optimized bifacial solar cell produces similar electrical power to the conventional monofacial solar cell, with the benefit of maximum production in peak hours (8:30 and 16:30). In contrast, in the case of the inclined bifacial solar cell, about 26% more in the production of electrical power was reached. These results guide similar studies in other places of the Mexican Republic and regions with similar latitudes and climate.

1. Introduction

The exponential development of photovoltaic installations constitutes a challenge for this renewable energy source. This challenge implies the reduction of costs and the land usage for installations of photovoltaic systems, which limit other applications such as agriculture and livestock. Building-integrated photovoltaics (BIPV) and bifacial solar cells are some palliative solutions to these challenges. Bifacial solar cells are already on the market, mainly with silicon technology, which must have a market occupancy of 70% by 2030 [1,2]. The other 30% is expected to be covered by conventional technologies: 10% will continue to be based on crystalline silicon with monofacial devices, and the remaining 20% will be based on thin film technology with materials such as cadmium telluride (CdTe), chalcopyrites (CIGS), and amorphous silicon [3].
When utilizing bifacial system technology, it is known that an increase of up to 20% in energy production is possible using the same amount of area required for installation. This translates directly into a reduction in the normalized cost of electricity without sacrificing land allocated for other activities. From a manufacturing perspective, significant advances have been made in high-performance PERT (passivated emitter and rear totally diffused) cells and long-lasting encapsulation materials, which also contribute to cost reduction. The most significant challenges relate to initial installation costs, predictive modeling of gains under real-life operating conditions, optimization of balanced systems to improve the capture of reflected irradiance, and the need for better standardization and certification protocols for bifacial panels. While bifacial panels are not yet the best option in all cases, they are increasingly accessible, efficient, and versatile.
Until now, thin-film device technology has not yet presented efficiencies that allow its transfer to the industrial sector in bifacial cell technology [4]. Several companies have installed plants with bifacial photovoltaic devices. In April 2020, the ACWA Power company installed a 900 MW solar plant with bifacial panels on solar trackers in Saudi Arabia [5]. In the same year, the Quinbrook Infrastructure company installed a 690 MW solar plant with bifacial panels and solar trackers in the USA [6]. Bifacial modules mounted vertically from east to west were installed in Switzerland in 2017 with a nominal power of 9.09 kWp [7]. In Mexico, a 220 MW bifacial panel solar plant, also using solar trackers, was installed by the Enel Green Power company [8]. It is observed that, although the trend is to use bifacial solar systems with a solar tracker, it is necessary in the case of Mexico, with four types of climates—warm, temperate, dry, and cold [9]—to evaluate which bifacial plant is the most recommended under the specific conditions of the weather in question. To compare different technologies and materials, bifacial photovoltaic modules are subject to the recent IEC 60904-1-2 standard that governs their characterization indoors and outdoors [10]. Consequently, in addition to laboratory tests, it is imperative to assess the performance of these devices under the specific environmental conditions of the installation site. Bifacial photovoltaic modules have been studied in several regions around the world. Baloch et al. performed a comprehensive analysis in a desert climate of Qatar of various parameters in bifacial modules installed individually or in an array [11]. The authors found the optimum tilt angle for modules was larger (~30°) than the traditional 22° used for tilting the modules. Katsaounis et al. compared experimental data from a polycrystalline Si monofacial panel and a Si monocrystalline bifacial panel near the western coast of Saudi Arabia. Researchers simulated the results with an algorithm that considered the effects of temperature and solar spectrum, reporting an increase in efficiency from the bifacial panels against the monofacial ones of 10% and 15% for inclinations of 25° and 45°, respectively [12]. Castillo-Aguilella et al. obtained experimental data from bifacial panels installed in seven different places in the United States, and depending on height, tilt angle, and albedo, reported an increase in efficiency between 12.3% and 30% [13]. Kurz et al. reported a comparative analysis of bifacial and monofacial photovoltaic panels in Poland, finding that bifacial panels generate slightly more power than monofacial panels under similar conditions, with the advantage increasing at lower irradiance values, and that bifacial panels require a smaller inclination angle than one-sided panels, increasing their efficiency up to 56% [14].
Muehleisen et al. studied 20 bifacial modules installed on building roofs, which were painted white to maximize the albedo value. The authors reported an increase in efficiency in the 15–20% range [15]. Gu et al. studied a bifacial panel installed in outdoor conditions, using as reference a monofacial panel under the same conditions, to evaluate long-term performance, considering factors such as the ground albedo, the tilt angle, and the orientation [16]. Baumann et al. studied the performance of bifacial modules, vertically mounted on a flat green roof, east–west oriented, and compared the achieved energy yield of two different grounds with the energy yield of a south-oriented monofacial module. Results showed no significant difference in energy yield between bifacial and monofacial modules [17]. Appelbaum calculated the annual incident irradiation on bifacial photovoltaic (PV) modules mounted vertically, in north–south direction, facing east–west, and on bifacial PV modules east–west oriented, facing south, under the same environmental conditions. Based on calculations (for the specific latitude of Tel Aviv), the author concluded that bifacial modules tilted with an optimal angle of 20° may produce on average 32% more energy than the bifacial vertical modules [18]. Basak et al. analyzed the influence of the tilt angle on the energy generation, adjusting the module from 0° to 90° during sunny days. Their findings revealed that a tilt of 30° produced the highest average daily power output, capturing direct and reflected sunlight from a white surface [19].
Yu et al. conducted a comparative study of bifacial and monofacial panels for applications with micro and chain inverters [20]. In both cases, the panels were installed with a tilt angle of 45° facing south. After twelve months of in-field measurements, the average energy yield of bifacial panels was 3.2% higher than that of monofacial panels. Using a computational model and worldwide meteorological data, Khan et al. estimated the annual energy yield of a bifacial solar plant where modules were mounted vertically [21]. The authors studied the influence of mutual shading of panels, the yearly incident irradiation on PV modules, and the tilt angle on the energy yield of the solar farm.
As noted, the distinctive feature of a bifacial photovoltaic device is its ability to harness radiation from the surrounding albedo. This ability is measured by the so-called bifaciality factor (BiFi), which relates the front and back energy conversion efficiency under standard lighting conditions ranging from 0 to 1. For example, a BiFi of 0.8 or 80% implies that the back can generate 80% of the energy of the front. A high BiFi value implies greater utilization of the back irradiance and a higher total power output from the device. In the current bifacial photovoltaic market, crystalline silicon (c-Si) solar cells are dominant, with a BiFi ranging from 0.75 to 0.95 with a total efficiency of about 24%.
Perovskites possess properties that make them candidates for bifacial photovoltaic applications. These cells can achieve a BiFi of 94%, with a record monofacial efficiency exceeding 26%. Furthermore, perovskites have the advantage over silicon solar cells in low-light conditions of having a higher open-circuit voltage and lower voltage loss, allowing them to utilize albedo energy more efficiently [18,22].
The levelized cost of electricity (LCOE), which is the relationship between the total cost (CF) invested in an installation and the maintenance of a solar energy installation during its useful life (T, in years) and the total amount of electricity (FE, in kWh) generated during said useful life, L C O E = C F E F T   , is directly proportional to the efficiency of a solar installation and constitutes a good metric for its economic valuation.
Globally, the LCOE for monofacial photovoltaic systems ranges from USD 24 to USD 46/MWh for large-scale plants, although in areas with high solar irradiation, such as Mexico, prices can reach USD 33/MWh. In the case of bifacial photovoltaic systems, factors such as albedo, land cost, the distance between rows of photovoltaic modules, and the introduction of tracking systems affect the LCOE value.
Peter Tillmann et al. proposed a Bayesian optimization method for reducing the LCOE of the bifacial solar panel arrays [23].
The Bayesian algorithm optimized 23% lower LCOE compared to the standard configuration. The bifacial gain can be expected to increase for locations with higher latitudes and higher diffuse light shares. The algorithm allows the user to extract clear design guidelines for utility-scale monofacial and bifacial solar power plants in most regions of the world.
The energy yield of bifacial photovoltaic modules has been extensively examined in the mentioned reports, which also assess the influence of factors such as latitude, weather conditions, tilt angle, surface albedo, and elevation. In some cases, empirical models were employed to compare theoretical predictions with experimental data. Typically, two main orientations for bifacial cells have been proposed: vertical east–west oriented (facing south) and tilted north–south. In both configurations, the results obtained depend on the environmental conditions in which the experiments were conducted.
Given that the published studies refer to a specific locality, this work aims to find the conditions that maximize the energy produced by a bifacial system, compared to a conventional monofacial system, under the conditions of Mexico. Mexico lies in the northern hemisphere between latitudes 11° and 32°, where about 32% of the world’s countries are located [24]. According to the state of the art, in Mexico, there is still a dearth of field parameters that optimize the maximum power delivered by a bifacial system at these latitudes.
The Köppen climate classification system assigns Tampico, Tamaulipas, a tropical savanna climate [25]. This climate covers around 20% of the world’s territory [26] and 28% of Mexico’s territory [27]. Consequently, the present study may demonstrate whether bifacial technology is a technical alternative to conventional photovoltaic technology and can serve as a guide in regions with comparable geographic locations worldwide.
On the other hand, the main electrical parameters of a PV device, both under lab and real conditions, are extracted from the I-V characteristic; consequently, its acquisition is crucial for diagnoses and evaluations of PV modules. Several commercial systems have been developed to characterize PV modules, but they are relatively expensive, preventing them from being widely used in industry. Consequently, significant research has been carried out to develop new I-V curve tracing technologies, reducing the overall costs, and improving both the acquisition speed and accuracy [28,29,30,31]. In this sense, this article describes the adaptation of a homemade I-V equipment for outdoor high-current solar cell measurements, with the intention of being used by other research groups in this field.

2. Materials and Methods

2.1. Bifacial Solar Cells Studied in This Work

For this study, two bifacial solar cells with HIT structure (heterojunction with intrinsic thin layer) and a Si monofacial solar cell were characterized. The structure of the bifacial cells is shown in Figure 1. This structure consists of a crystalline silicon wafer, surrounded by ultra-thin p-type and n-type amorphous silicon layers, two transparent conductive oxide (TCO) layers, and metal electrode grids. The symmetrical structure of the HIT solar cell offers advantages over other structures, because being a less stressful structure, it allows the processing of thinner wafers. These cells have been commercially produced since 2000. Due to the above characteristics, HIT solar cells (area: 244 cm2; thickness: 200 µm) were chosen in this work.
Figure 1. (a) Structure of the HIT bifacial solar cells used in this work. (b) Specific photovoltaic parameters of the employed silicon cells.
Energies 18 03784 g001
For operation and handling, they were arranged individually on glass plates as shown in Figure 2.
Figure 2. (a) front and rear views of bifacial cells; (b) monofacial cell; (c) schematic diagram of a solar cell arranged between glass plates; (d) view of the bifacial solar cell encapsulated between the glass plates.
Energies 18 03784 g002

2.2. Measurement Equipment

Depending on the irradiance value, the bifacial solar cells studied in this report deliver a short-circuit current up to 10 A, a value quite beyond the measurement range of the available instrumentation in the experimental lab facility used for the present study. Furthermore, experiments were carried out outdoors where expensive measuring equipment could be damaged. Consequently, an I-V tracer was developed, based on a previous report [29] and properly adapted to the experimental requirements. A schematic of the I-V tracer is presented in Figure 3a. The equipment is controlled with a Raspberry Pi 3 b + single-board computer and was designed to acquire the I-V curves of up to three solar cells (SC1 to SC3). Furthermore, it records the ambient temperature, humidity, and solar cell temperatures using the DHT22 and LM35 sensors. The solar irradiance was measured using a calibrated solar cell (see Figure 3c). All the measurements are stored on a micro-SD card and can be remotely accessed over the internet for further processing. The cell voltage is measured directly from its terminals using one channel of the analog-to-digital converter (ADS1115). For current measurements, the I-V tracer circuit uses a current sense resistor of 5 mΩ (RSENSE) to monitor the current, and a second channel of the ADC measures the voltage drop in RSENSE. A MOSFET IRLB40B209 is used as a variable electronic load (e-load) and is controlled by the Raspberry Pi through the digital-to-analog converter (DAC-MCP4921) (see Figure 3b). The solar cell under test is selected using power relays T9G (PR’s).
Figure 3. Homemade equipment used to measure I-V curves, irradiance, and temperature: (a) block diagram of the equipment, (b) schematic diagram of the I-V tracer (the relays used have been included as switches, they are marked with a red rectangle), (c) photograph of calibrated cell used to measure irradiance.
Energies 18 03784 g003

3. Results

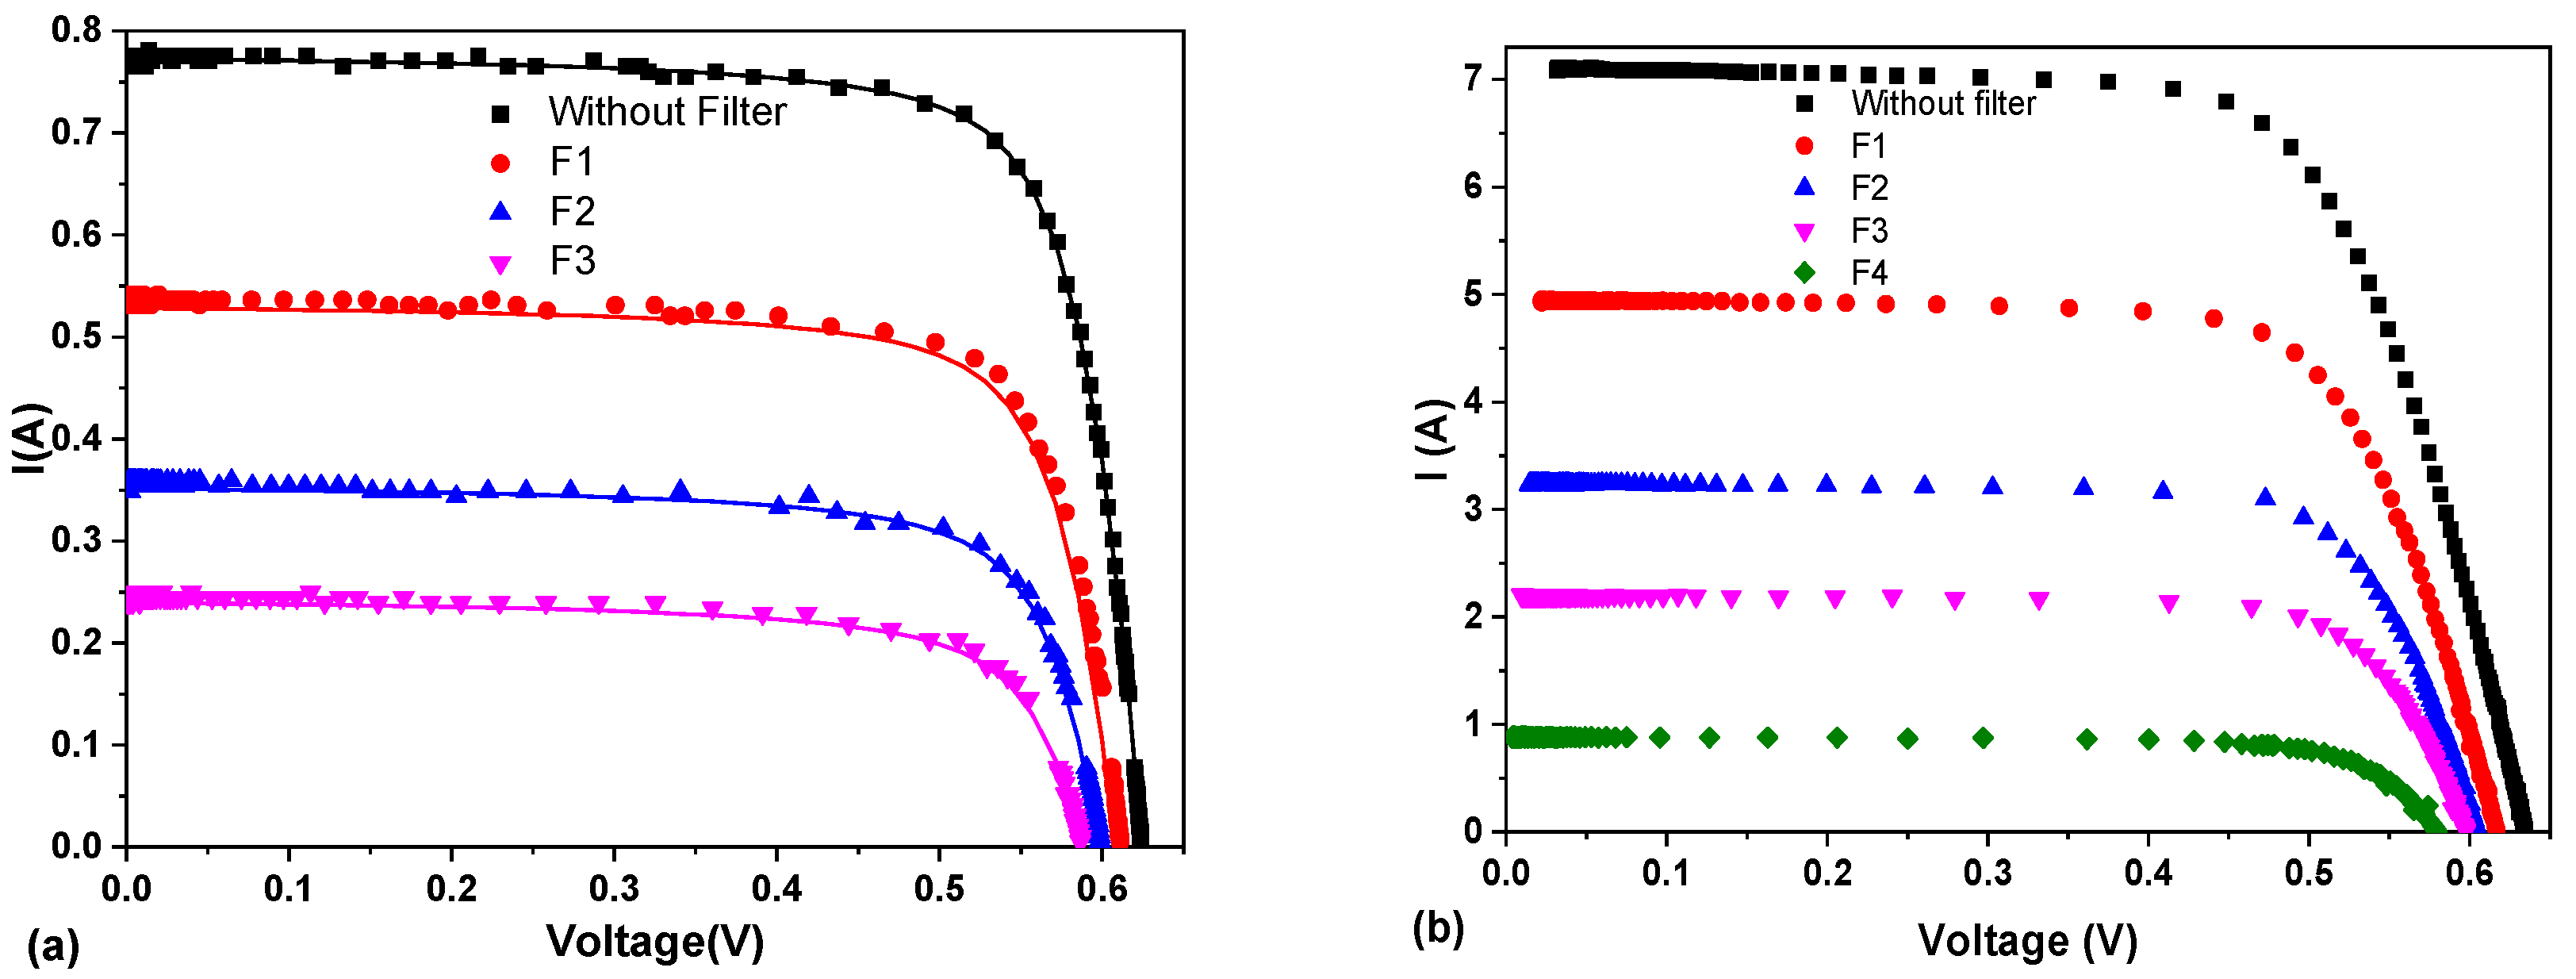
3.1. Validation of the I-V Tracer

The developed tracer was validated by comparing I-V curves acquired at the laboratory level and measured simultaneously with commercial equipment (Keithley 2410 source meter). To perform these measurements, four homemade filters were constructed (F1, F2, F3, and F4) with transmittances (63%, 40%, 24%, and 7%, respectively). The filters were laser printed on acetate sheets using different point densities. Placing these filters in front of the solar cell, different irradiances could be achieved on the cell face. The transmittance measurements of filters are provided in the Supplementary Materials. The results of this comparison are presented in Figure 4a.
Figure 4. Measurements obtained with the I-V tracer proposed in this work: (a) Comparison of the I-V curves acquired with the tracer (symbols) and with the commercial Keithley 2410 equipment (lines), (b) I-V curves acquired with the I-V tracer for cells with high short-circuit current (Isc) values.
Energies 18 03784 g004
To determine the coincidence (%) between the values obtained with the IV tracer and the Keithley source, the percentage error between each of the current measurements for a given voltage value was initially calculated (measurements are reported in Figure 4a). To calculate the percentage error δ   % = I s o u r c e I t r a c e r I t r a c e r × 100   , the value obtained from the Keithley source was assumed to be the true value. These percentages were then averaged, resulting in an approximate error of 3%. Consequently, a ~97% coincidence is reached between the two types of equipment, which validates the measurements in the high current regime (Figure 4b), where the commercial Keithley 2410 source meter cannot be used.

3.2. Optimization of Installation Parameters

3.2.1. In Situ Albedo Spectrum
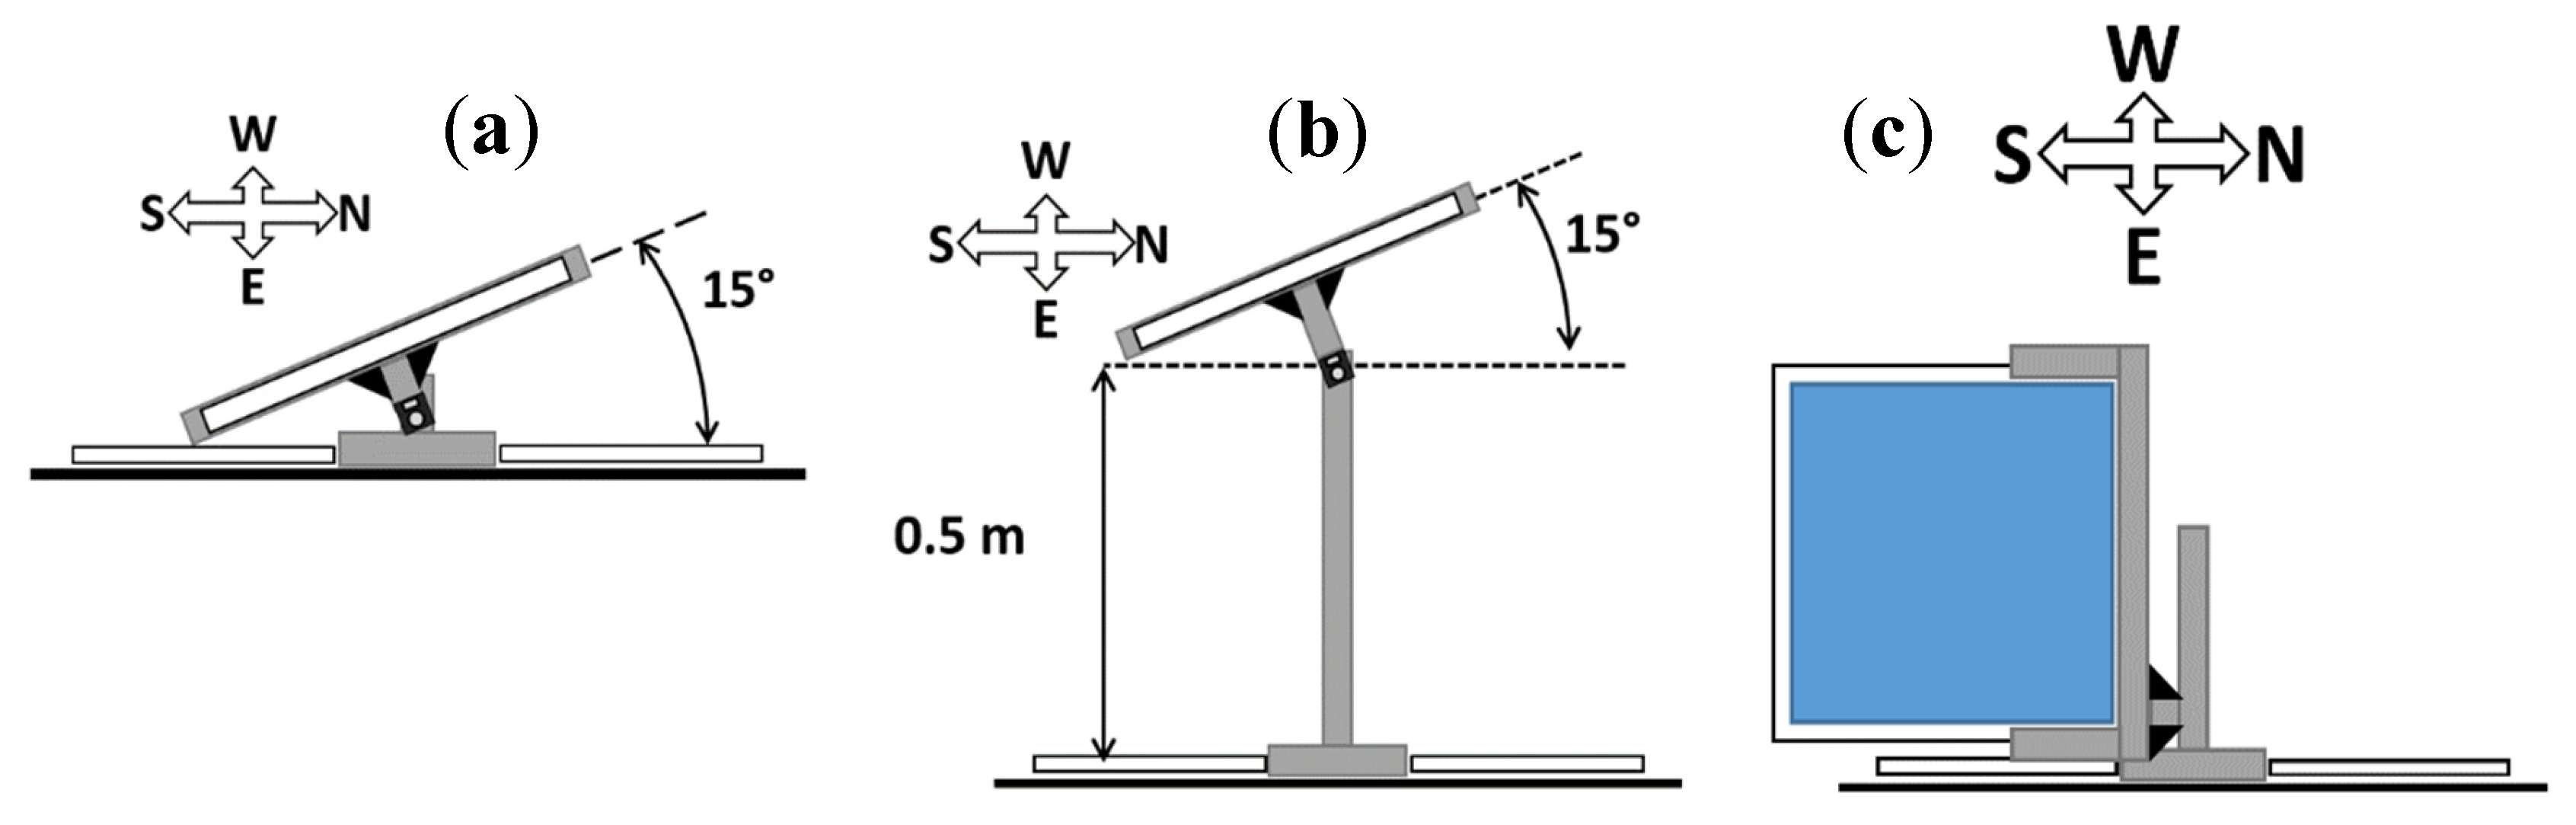
Albedo value and spectral response are the main parameters characterizing albedo properties. Albedo is the fraction of incident solar radiation reflected from the ground, or that which covers it, and the objects surrounding the photovoltaic system. In the case of photovoltaic installations with bifacial panels, the kind of albedo is relevant in the amount of solar radiation that reaches the back side of the bifacial solar cells. Although in general the albedo of different surfaces is given in the literature, the dispersion of the data shows that its real value strongly depends on the locality and the soil reflection coefficient. Therefore, it is necessary to measure this parameter in situ and to assess the possibility of improving it. To maximize the albedo during measurements carried out in this work, a white tarp was installed under the study cells; consequently, the reflection of sunlight was higher than that of the concrete surface. In addition, it can be easily cleaned regularly to prevent damage as an albedo generator. Both the solar emission and the diffuse light reflected by the white tarp were acquired in the 300–1000 nm range with an Ocean Optics HR4000 spectrometer, comprising an optical fiber (600 μm in diameter), which collects the radiation and guides it to the entrance slit of the spectrometer. For albedo measurements, the fiber end was positioned 5 cm above the white tarp, perpendicularly to its surface. The measurements were performed at noon; the normalized results are shown in Figure 5.
Figure 5. Normalized spectral curves obtained from solar radiation incident on the surface of the albedo and that reflected by it. In the 300–400 nm interval (blue circle) spectra are different due to the absorption from the white tarp.
Energies 18 03784 g005
The comparison reveals that the spectral components in both spectra are similar, apart from the interval 300–400 nm, where the white tarp strongly absorbs the solar radiation. The albedo coefficient of white tarp ( α w t ) was calculated by measuring both the direct sun irradiance ( I s u n ) and the albedo from the tarp ( I a l b e d o ) using a calibrated solar cell:
α w t = I a l b e d o I s u n 0.57
The value obtained for α w t is in the albedo range of a white painted surface between 0.5–0.9 [32].

3.2.2. Orientation

The orientation of the photovoltaic panel constitutes one of the important parameters in optimizing the solar energy conversion into electricity. In this work, the following installation options were studied: (1) tilted facing south bifacial solar cell and (2) vertical east–west oriented bifacial solar cell, named as BFtilted and BFvertical, respectively. We have included a conventional south-facing monofacial solar cell (MFtilted) as a reference. The three configurations are outlined in Figure 6. The tilt angle used to optimize solar cell performance depends on two factors: the latitude of the location and the season of the year. In Mexico, an annual variation in the angle is reported, ranging from 10° to 30°, and can be calculated with the expression β = 3.7 + 0.69 φ , where β is the tilt angle and φ is the latitude [33]. However, based on this information, an experimental optimization process was conducted in our study to define the operating parameters regarding height and tilt angle (see Figure 7 and Figure 8). Based on the results obtained for maximum current generation at the time of the study with the bifacial solar cell, the values reported in Figure 6 were defined for a height of 0.5 m (taking the horizontal position as a starting point) and a tilt angle of 15° [33].
Figure 6. Orientation and type of solar cells: (a) conventional monofacial tilted north–south orientation; (b) bifacial tilted north–south orientation; (c) bifacial vertical east–west orientation.
Energies 18 03784 g006

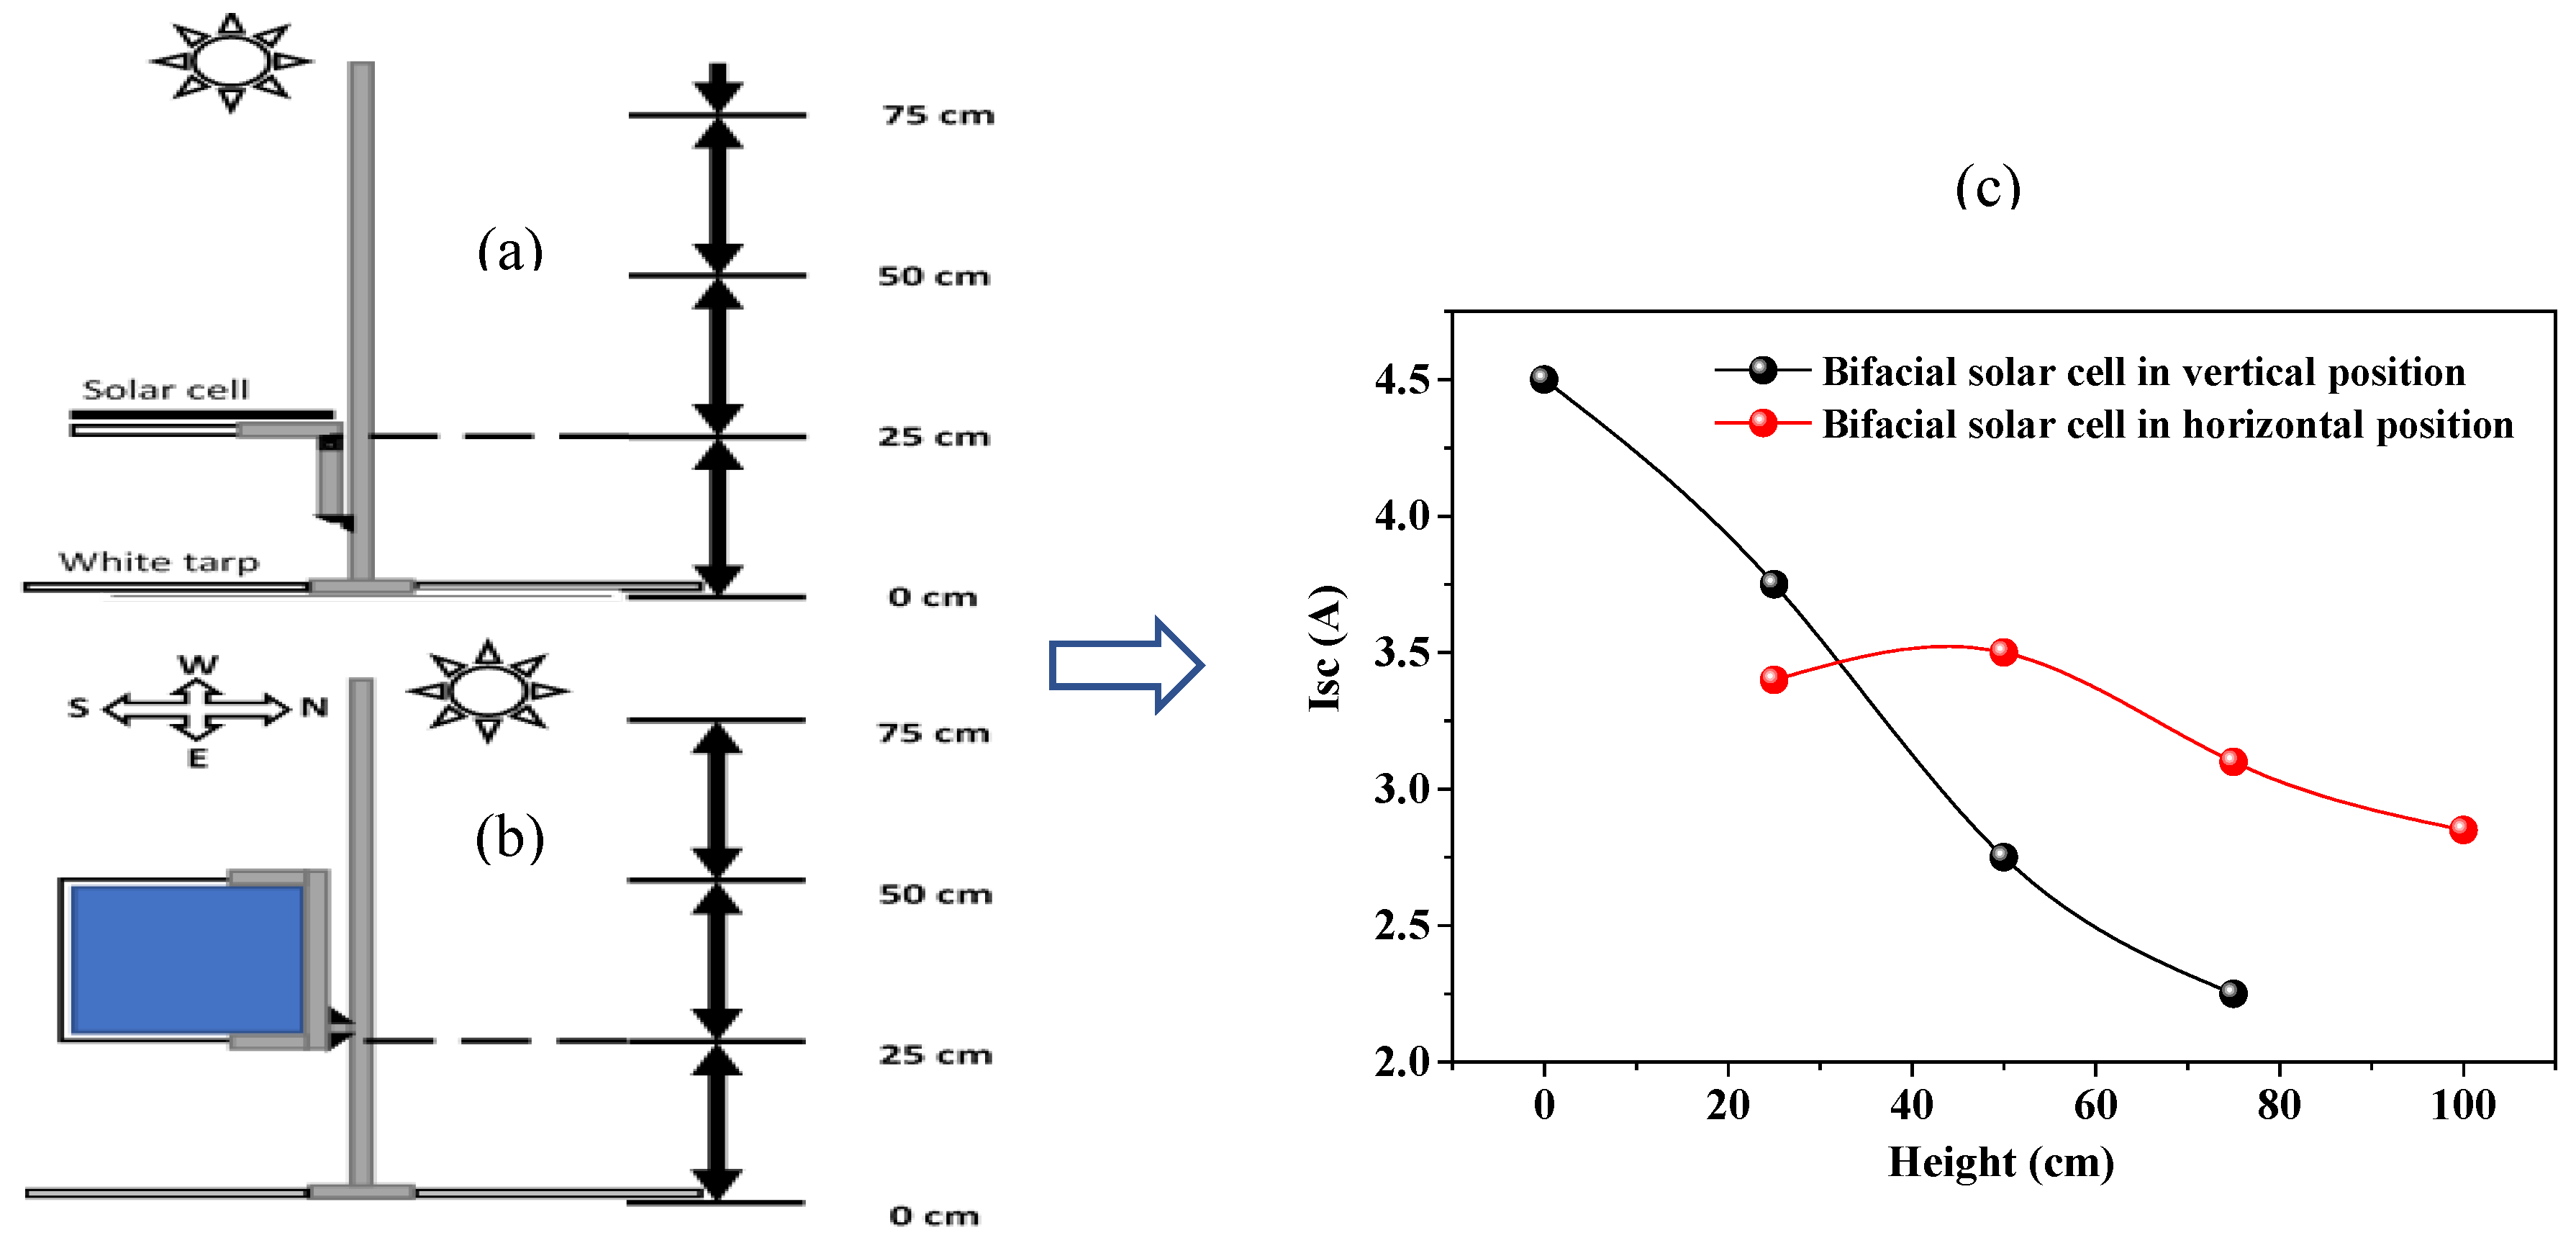
3.2.3. Height Optimization
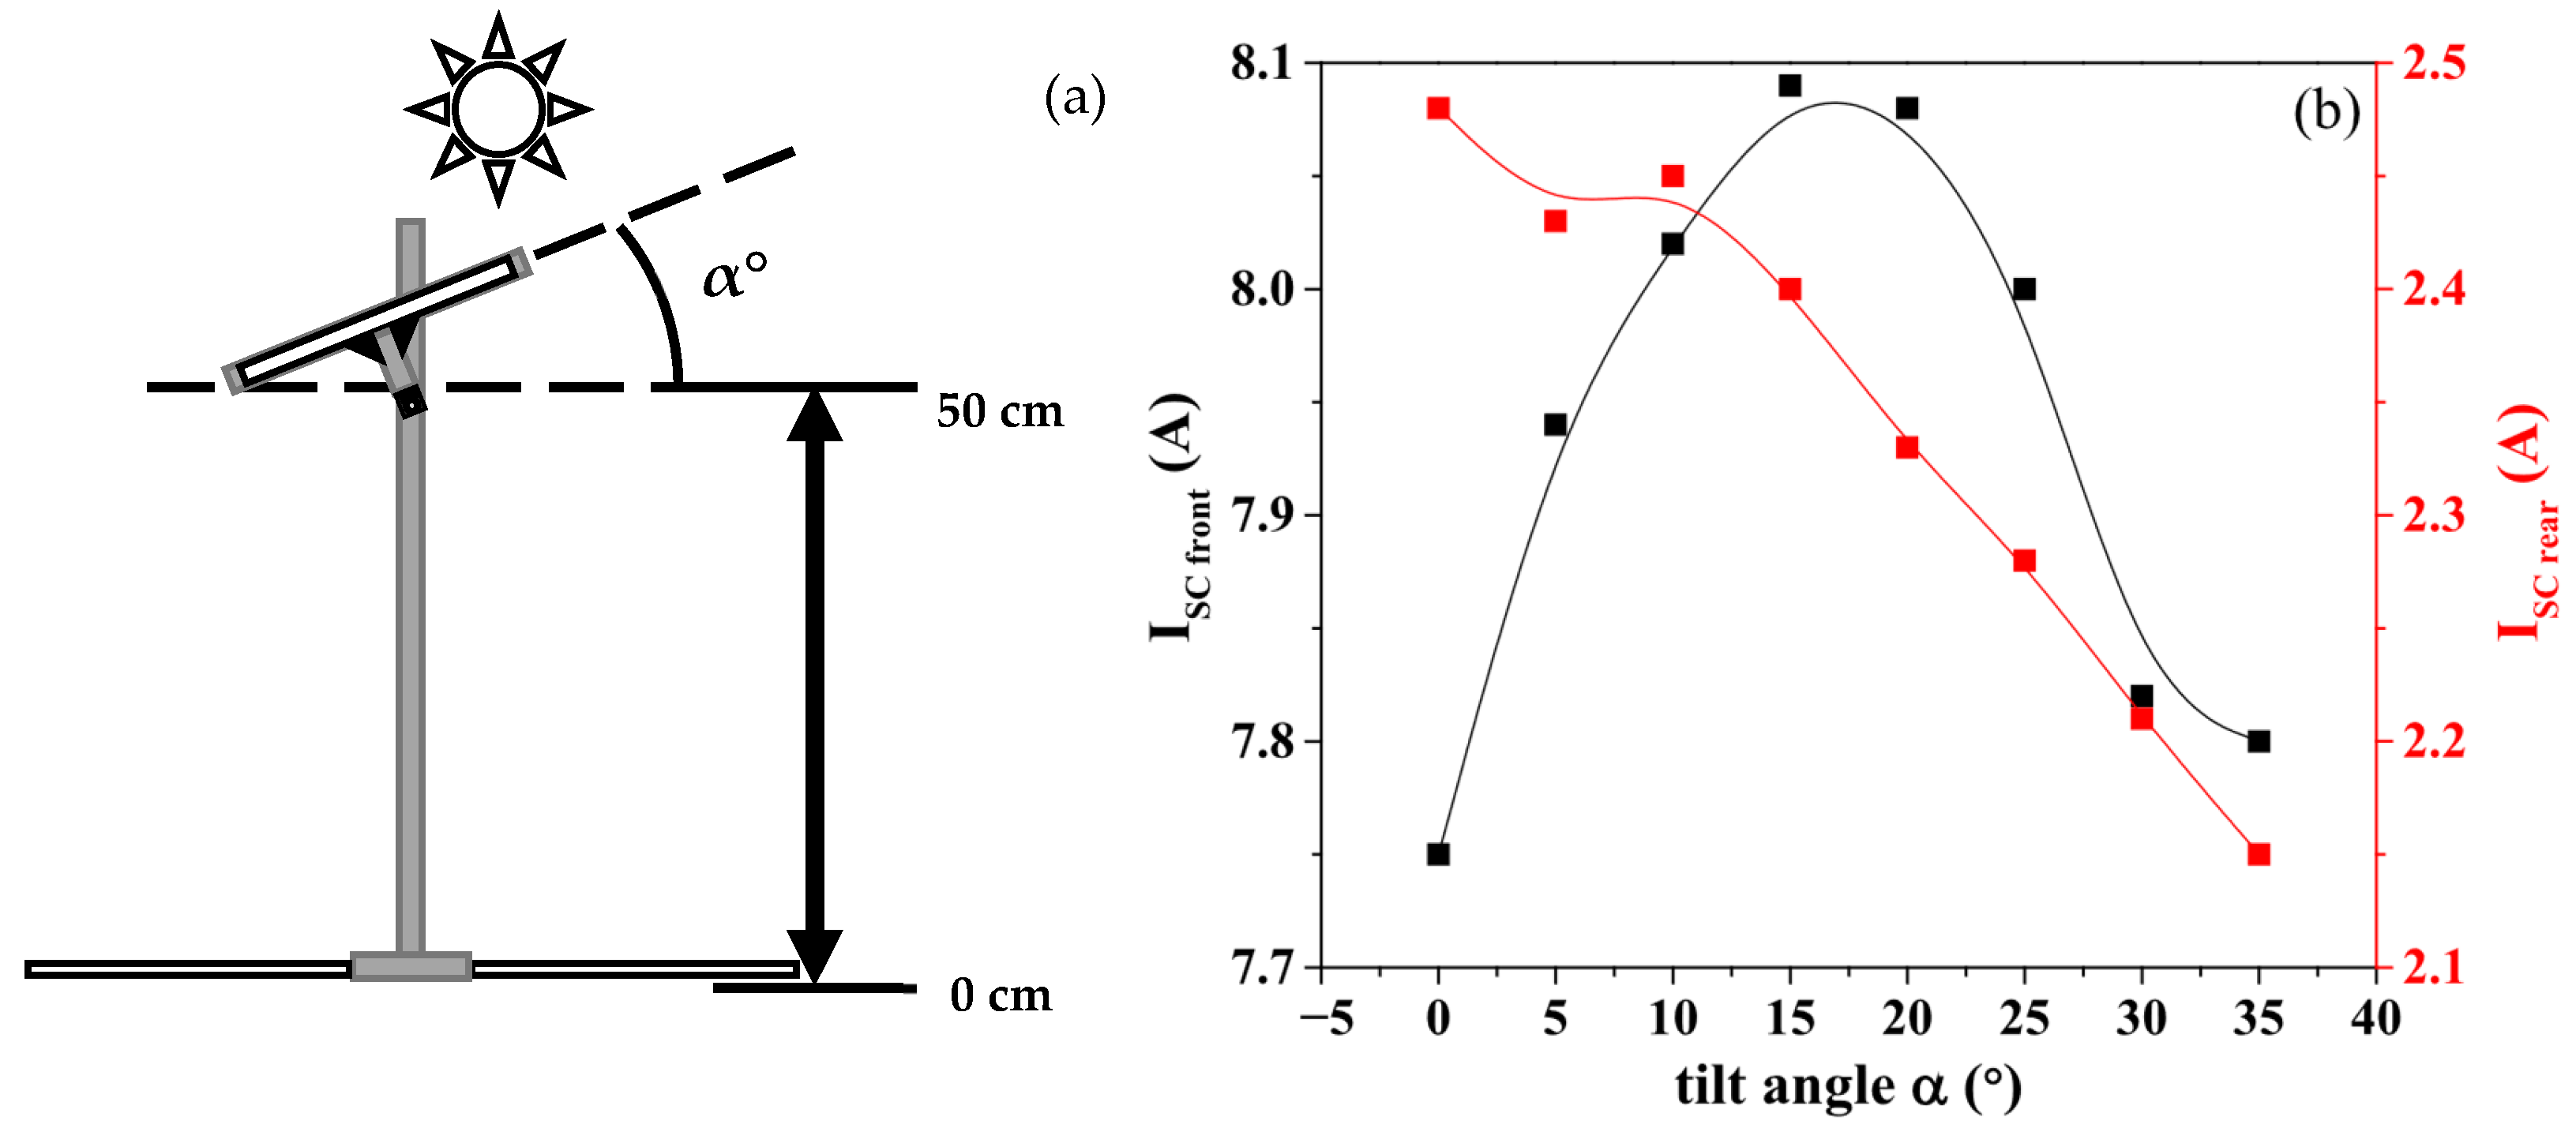
Auto shading is a phenomenon that impairs the performance of bifacial devices since it decreases the albedo on the rear face; however, it is possible to reduce its effect by increasing the height of the panel. To study the effect of height, the experiment shown in Figure 7 was carried out.
Figure 7. Experimental conditions for the evaluation of the optimal height of bifacial solar cells: diagrams for current measurements in the cell, (a) parallel to the ground, (b) vertical cell, (c) experimental dependency of Isc versus height in both positions.
Energies 18 03784 g007
In the parallel position concerning the ground (Figure 7a), the front face was covered. Measurements were made at noon to take them at the time of greatest irradiance. A similar test was carried out with the vertical solar cell; in this case, none of its faces were covered (Figure 7b). The results of this experiment are shown in Figure 7c. As can be seen, in the case of the solar cell in a horizontal position, the highest value of short-circuit current (Isc) is obtained by positioning the cell at 50 cm from the ground, which corresponds to the distance at which the combination of shading effects and the decrease in incident radiation with distance is optimized. For the bifacial cell in the vertical position, the results show that the Isc decreases continuously with increasing height of the cell, because the effect of the albedo is diminished when the cell is moved away from the soil surface. The foregoing corresponds to the fact that in the case of the vertical position, the highest performance of the cell is obtained by positioning it directly on the ground.

3.2.4. Tilt Angle

To study the effect of the tilt angle on both faces of the bifacial solar cell, the device was raised 50 cm from the ground, and subsequently, the front and rear Isc was recorded (the rear face was covered when the front was measured and vice versa) for various angles of inclination as shown in the scheme of Figure 8a. From the experiment, the curve of Figure 8b was obtained, where the Isc registers a behavior like that of a conventional solar cell; that is, an angle was found at which the Isc is maximum (15°) in this specific experiment. On the other hand, the Isc generated by the rear face behavior has a maximum value of 0°, and then the values tend to a progressive linear decrease, since the white tarp behaves like a diffuse reflector and when the cell is positioned parallel to the horizontal (0°) has the best light reflection towards the rear face. The optimal angle found in this experiment (15°) is conditioned to the specific position of the Earth concerning the sun on the day of the year in which the measurement was made.
Figure 8. (a) Experimental setup used for the evaluation of the optimal tilt angle, (b) Isc of the cell (front and rear) in dependence of tilt angle.
Energies 18 03784 g008

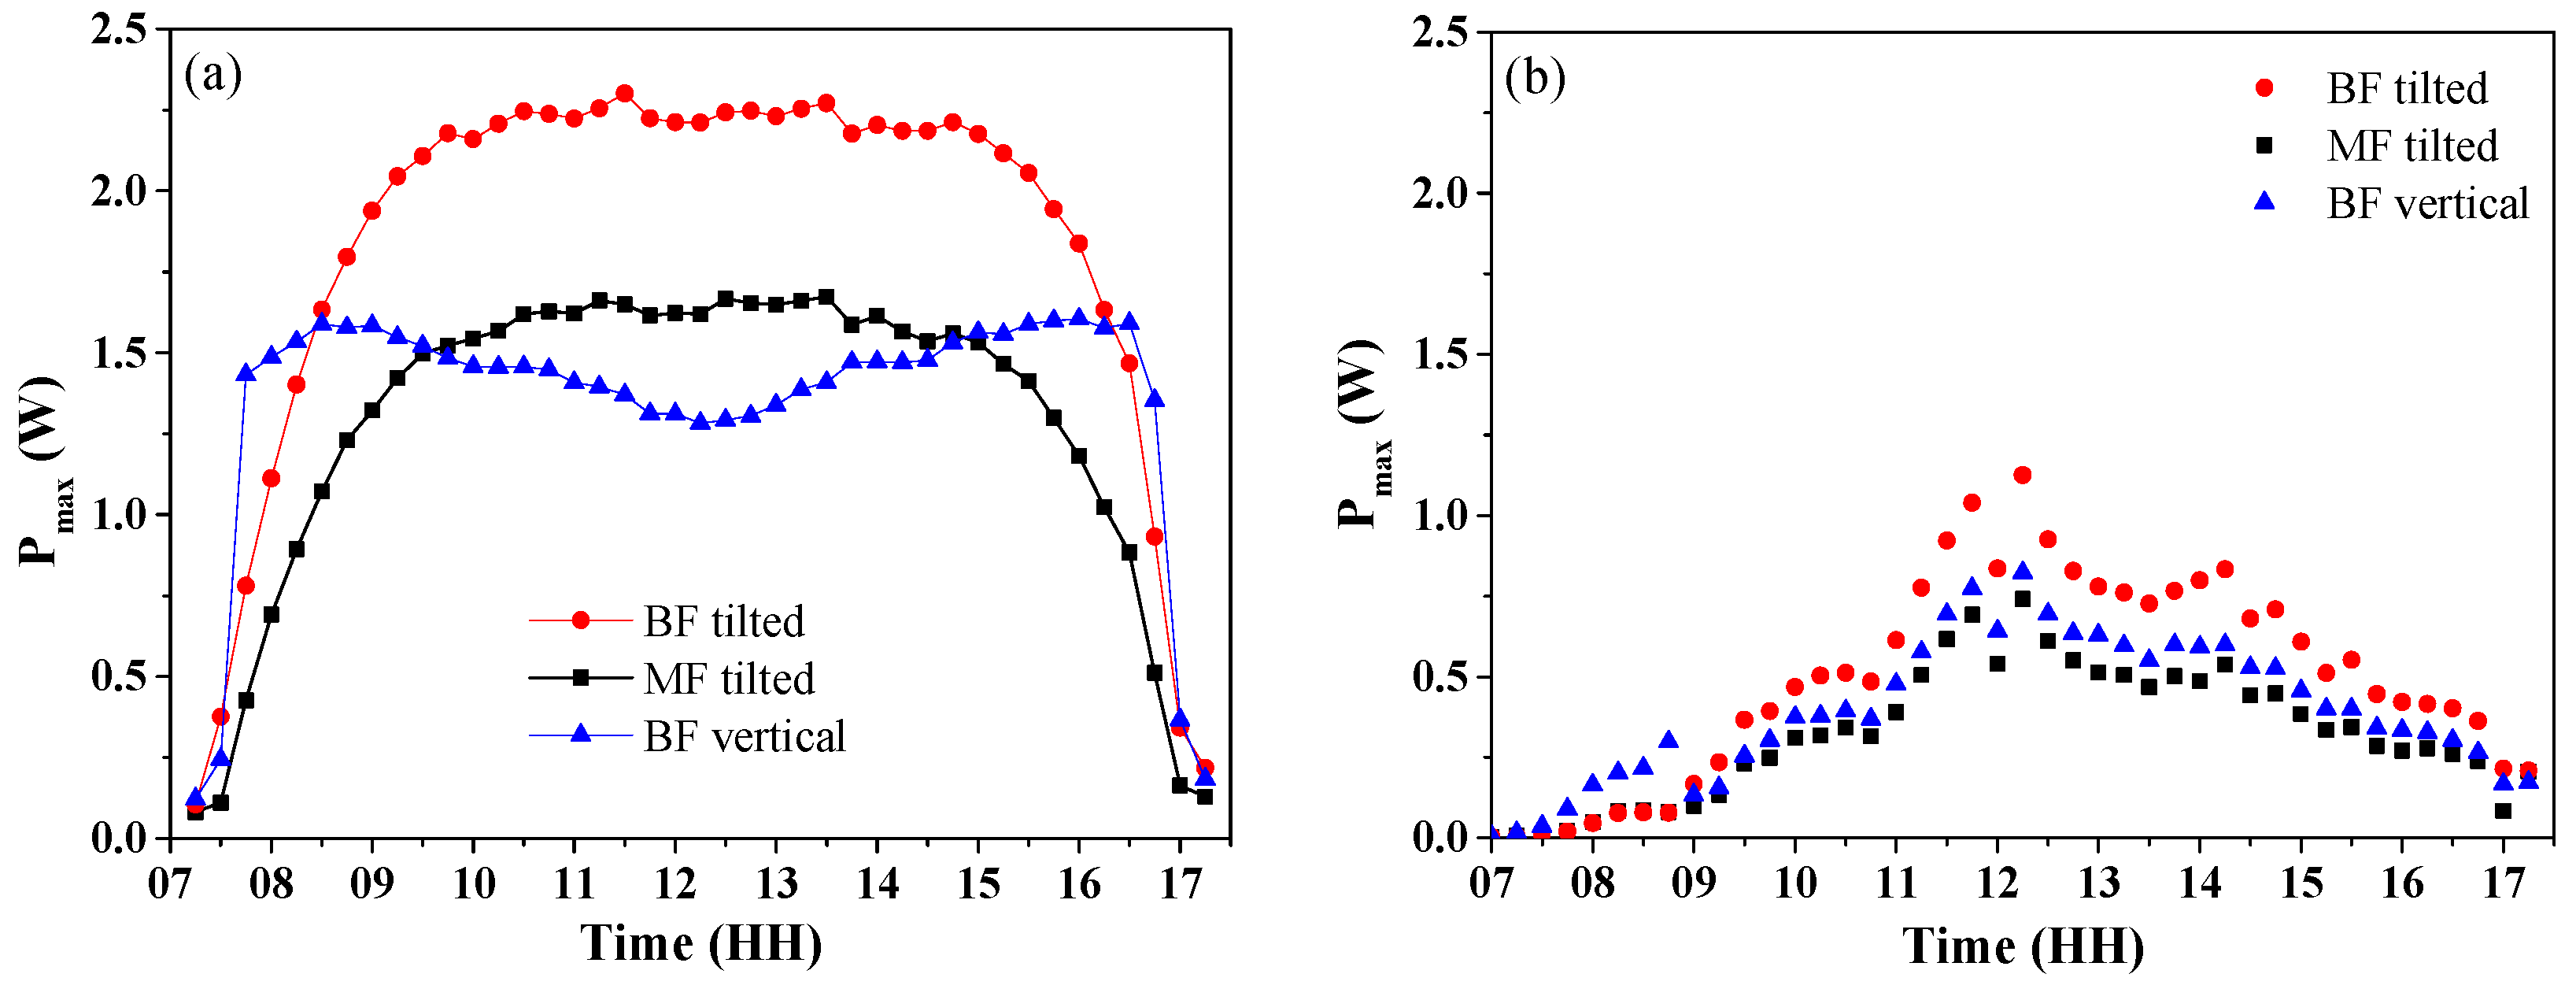
3.3. Daytime Profile of Maximum Power

Figure 9a shows the behavior of the maximum power (Pmax) for the three cells measured in this work on a sunny day, which is in correspondence with those reported in the literature, while Figure 9b shows the behavior of a cloudy day. As shown in Figure 9a, the BFtilted produces more electrical power than the MFtilted, because additional electrical power is obtained from the rear side of the BFtilted cell. On the other hand, the BFvertical cell exhibits two maximum points, one during the morning and the other during the afternoon, since these are the times when the faces are irradiated perpendicularly. This typical behavior has two important aspects: (1) they are quite like that generated by the tilted MF cell (1.6 W in the morning and the afternoon and 1.66 W during the zenith, respectively), (2) the two maxima occur when the electrical power generated by the MF tilted cells is minimal and consumer demand is increased. Due to these facts, the BFvertical cell can be used in a complementary way to any of the other two cells studied. During a cloudy day (Figure 9b) there are no significant differences in power generation for all three configurations due to the low irradiance and the diffuse nature of radiation arriving at the cells.
As can be seen, the maximum power delivered by the vertical bifacial cell occurs approximately at 8:30 a.m. and 4:30 p.m. This vertical configuration better matches demand peaks, so this configuration is more recommended in microgrid systems.
Figure 9. Power profile measured of the three test cells: (a) sunny day, (b) cloudy day.
Energies 18 03784 g009

3.4. Analysis of the Energy Yielded by the Cells

Cell energy output measurements were carried out during 27 days in the experimental conditions reported in Section 3.2.2. The energy yields of the cell were obtained by calculating the area under the curve of the diurnal profiles Pmax vs. time, reported in Figure 9. Results of these calculations are presented in Figure 10a,b, establishing a comparison between the MFtilted with BFtilted and BFvertical, respectively. Results reveal that the daily energy values depend on the environmental conditions of the day on which the measurement was carried out; consequently, the average energy yield over the entire measurement period was calculated and included as dashed lines in the graphs.
Results presented in Figure 10a show that the average energy yield of BFtilted is around 26% higher than MFtilted, i.e., on average, it produces 2.8 Wh more energy than the MFtilted. This higher energy yield arises from the extra energy generated at the rear side of the bifacial cell.
Moreover, results presented in Figure 10b exhibit that the average energy yield for the MFtilted and the BFvertical are similar. The average energy produced by the MFtilted is only 0.6% higher than BFvertical one, i.e., on average it produces 0.07 Wh more energy than the BFvertical. These results follow the behavior of the Pmax profile reported in the previous section (Figure 9).
Figure 10. Energy yield of the cells under study during a 27-day period: (a) MFtilted vs BFtilted, (b) MFtilted vs. BFvertical. Dotted lines represent the average values of the energy yield for the respective cells over the evaluated period of time.
Energies 18 03784 g010

4. Conclusions

The present study reports the comparison of the energy yield for two types of bifacial and one monofacial cell configurations: (a) bifacial solar cell installed with an optimal tilt angle facing south, (b) bifacial solar cell installed in vertical position and facing east–west, and (c) standard monofacial solar cell optimally tilted oriented south. The three solar cells are under the same environmental conditions. This study reveals that a photovoltaic system with bifacial solar cells, installed with an optimal tilt angle of 15° facing south with a height of 50 cm from a white tarp may produce, on the average for northeast Mexico (latitude 23°38′ N), 26% more energy per day than the tilted monofacial solar cell, the vertical bifacial solar cell produces similar energy as the tilted monofacial solar cell, with the advantage that its power–hour distribution is better coupled to the hours of greatest energy consumption. This result corroborates those reported by other authors in different environmental conditions.
The results confirm the potential to introduce bifacial solar cells in the photovoltaic production of electrical energy. According to our knowledge, a study of bifacial solar cells under the specific environmental conditions of Mexico is reported for the first time in this work and creates the guidelines for a similar application in other places with similar conditions.
Another contribution of this publication lies in the development of a portable I-V tracer system that, unlike commercial systems, is low-cost, suitable for outdoor measurements, and has the capacity to withstand high currents of at least 10.0 amps, according to the characterizations carried out in this work.

Supplementary Materials

The following supporting information can be downloaded at: https://www.mdpi.com/article/10.3390/en18143784/s1, Figure S1: Transmittance of homemade filters spectra in the 200–800 nm interval. The transmittance is almost flat in this wavelength interval.

Author Contributions

Conceptualization, A.E.V.-V., E.R.G., O.V.-G. and J.R.G.C.; methodology, validation, data curation A.E.V.-V., D.J.-O., A.B.L.-O. and D.D.A.-L.; formal analysis, investigation A.E.V.-V., E.R.G., O.V.-G., D.J.-O., J.R.G.C., A.B.L.-O. and D.D.A.-L.; funding acquisition E.R.G., J.R.G.C., D.J.-O. and D.D.A.-L., methodology, A.E.V.-V., E.R.G., D.J.-O. and J.R.G.C.; project administration, E.R.G., supervision, O.V.-G., D.D.A.-L. and A.B.L.-O.; resources, E.R.G., J.R.G.C., D.D.A.-L. and D.J.-O.; writing—original draft preparation, A.E.V.-V., E.R.G. and O.V.-G.; writing—review and editing, all authors. All authors have read and agreed to the published version of the manuscript.

Funding

This research was funded by Secretaría de Ciencia, Humanidades, Tecnología e Innovación [grant number 634015], and SIP projects by Instituto Politécnico Nacional [grant numbers 20230826, 20240595, 20240387, 20240290], and the APC was funded by Instituto Politécnico Nacional.

Data Availability Statement

The original contributions presented in the study are included in the article. Further inquiries can be directed to the corresponding author.

Acknowledgments

The authors acknowledge financial support of the IPN in the framework of the multidisciplinary project Clave SIP: 1903. A. E. Villarreal-Villela thanks SECIHITI for the scholarship No. 634015. E. Rodríguez-González acknowledges the financial support under projects SIP-20230826, SIP-20240595, COFAA, and EDI of IPN. O. Vigil-Galán acknowledges the financial support from COFAA and EDI of IPN. J. R. González-Castillo thanks the SECIHTI program: “Estancias Posdoctorales por México” for the postdoctoral scholarship. D. Jiménez-Olarte acknowledges the financial support under project SIP-20240387 and EDI of IPN. D. Del Angel-López acknowledges the financial support under project SIP-20240290 and EDI of IPN.

Conflicts of Interest

The authors declare no conflicts of interest.

Abbreviations

The following abbreviations are used in this manuscript:
I-VCurrent–voltage curve tracer
IscShort-circuit current
BIPVBuilding-integrated photovoltaics
PVPhotovoltaic
HITHeterojunction with intrinsic thin layer
TCOTransparent conductive oxide
SC1Solar cell 1
SC2Solar cell 2
SC3Solar cell 3
ADCAnalog-to-digital converter
DACDigital-to-analog converter
RSENSECurrent sense resistor
PR’sPower relays
BFtilted Bifacial solar cell tilted
BFverticalBifacial solar cell vertical
MFtiltedMonofacial solar cell tilted
PmaxMaximum power

References

  1. Maniscalco, M.; Longo, S.; Miccichè, G.; Cellura, M.; Ferraro, M. A Critical Review of the Environmental Performance of Bifacial Photovoltaic Panels. Energies 2023, 17, 226. [Google Scholar] [CrossRef]
  2. Oberbeck, L.; Alvino, K.; Goraya, B.; Jubault, M. IPVF’s PV Technology Vision for 2030. Prog. Photovolt. 2020, 28, 1207–1214. [Google Scholar] [CrossRef]
  3. Lee, T.D.; Ebong, A.U. A Review of Thin Film Solar Cell Technologies and Challenges. Renew. Sustain. Energy Rev. 2017, 70, 1286–1297. [Google Scholar] [CrossRef]
  4. Subedi, K.K.; Phillips, A.B.; Shrestha, N.; Alfadhili, F.K.; Osella, A.; Subedi, I.; Awni, R.A.; Bastola, E.; Song, Z.; Li, D.-B.; et al. Enabling Bifacial Thin Film Devices by Developing a Back Surface Field Using CuxAlOy. Nano Energy 2021, 83, 105827. [Google Scholar] [CrossRef]
  5. Pearcey, E. Giant Bifacial PV Plants Act as Springboard for Growth. Available online: https://www.solarnews.es/solarnews_internacional/2020/09/02/giant-bifacial-pv-plants-act-as-springboard-for-growth/ (accessed on 28 January 2025).
  6. Wesoff, E. The Largest US Solar-plus-Storage Plant Will Deploy 690 MW of Bifacial Modules on Trackers. Available online: https://pv-magazine-usa.com/2020/05/15/the-largest-us-solar-plus-storage-plant-will-deploy-690-mw-of-bifacial-modules-on-trackers/ (accessed on 21 February 2025).
  7. Baumann, T.; Carigiet, F.; Knecht, R.; Klenk, M.; Dreisiebner, A.; Nussbaumer, H.; Baumgartner, F. Performance Analysis of Vertically Mounted Bifacial PV Modules on Green Roof System. In Proceedings of the EU PVSEC 2018, Brussels, Belgium, 28 September 2018; pp. 1–6. [Google Scholar]
  8. Rojo Martín, J. Enel Hits 1.3GW of Mexican Solar with Launch of First Bifacial-Only Plant. Available online: https://www.pv-tech.org/enel-hits-1-3gw-of-mexican-solar-with-launch-of-first-bifacial-only-plant/ (accessed on 12 February 2025).
  9. INEGI. Climatology. Available online: http://en.www.inegi.org.mx/temas/climatologia/#Map (accessed on 21 February 2025).
  10. IEC Technical Specification 60904-1-2. Available online: https://webstore.iec.ch/en/publication/34357 (accessed on 2 February 2025).
  11. Baloch, A.A.B.; Hammat, S.; Figgis, B.; Alharbi, F.H.; Tabet, N. In-Field Characterization of Key Performance Parameters for Bifacial Photovoltaic Installation in a Desert Climate. Renew. Energy 2020, 159, 50–63. [Google Scholar] [CrossRef]
  12. Katsaounis, T.; Kotsovos, K.; Gereige, I.; Basaheeh, A.; Abdullah, M.; Khayat, A.; Al-Habshi, E.; Al-Saggaf, A.; Tzavaras, A.E. Performance Assessment of Bifacial C-Si PV Modules through Device Simulations and Outdoor Measurements. Renew. Energy 2019, 143, 1285–1298. [Google Scholar] [CrossRef]
  13. Castillo-Aguilella, J.E.; Hauser, P.S. Multi-Variable Bifacial Photovoltaic Module Test Results and Best-Fit Annual Bifacial Energy Yield Model. IEEE Access 2016, 4, 498–506. [Google Scholar] [CrossRef]
  14. Kurz, D.; Dobrzycki, A.; Krawczak, E.; Jajczyk, J.; Mielczarek, J.; Woźniak, W.; Sąsiadek, M.; Orynycz, O.; Tucki, K.; Badzińska, E. An Analysis of the Increase in Energy Efficiency of Photovoltaic Installations by Using Bifacial Modules. Energies 2025, 18, 1296. [Google Scholar] [CrossRef]
  15. Muehleisen, W.; Loeschnig, J.; Feichtner, M.; Burgers, A.R.; Bende, E.E.; Zamini, S.; Yerasimou, Y.; Kosel, J.; Hirschl, C.; Georghiou, G.E. Energy Yield Measurement of an Elevated PV System on a White Flat Roof and a Performance Comparison of Monofacial and Bifacial Modules. Renew. Energy 2021, 170, 613–619. [Google Scholar] [CrossRef]
  16. Gu, W.; Li, S.; Liu, X.; Chen, Z.; Zhang, X.; Ma, T. Experimental Investigation of the Bifacial Photovoltaic Module under Real Conditions. Renew. Energy 2021, 173, 1111–1122. [Google Scholar] [CrossRef]
  17. Baumann, T.; Nussbaumer, H.; Klenk, M.; Dreisiebner, A.; Carigiet, F.; Baumgartner, F. Photovoltaic Systems with Vertically Mounted Bifacial PV Modules in Combination with Green Roofs. Sol. Energy 2019, 190, 139–146. [Google Scholar] [CrossRef]
  18. Appelbaum, J. Bifacial Photovoltaic Panels Field. Renew. Energy 2016, 85, 338–343. [Google Scholar] [CrossRef]
  19. Basak, A.; Chakraborty, S.; Behura, A.K. Tilt Angle Optimization for Bifacial PV Module: Balancing Direct and Reflected Irradiance on White Painted Ground Surfaces. Appl. Energy 2025, 377, 124525. [Google Scholar] [CrossRef]
  20. Yu, B.; Song, D.; Sun, Z.; Liu, K.; Zhang, Y.; Rong, D.; Liu, L. A Study on Electrical Performance of N-Type Bifacial PV Modules. Sol. Energy 2016, 137, 129–133. [Google Scholar] [CrossRef]
  21. Khan, M.R.; Hanna, A.; Sun, X.; Alam, M.A. Vertical Bifacial Solar Farms: Physics, Design, and Global Optimization. Appl. Energy 2017, 206, 240–248. [Google Scholar] [CrossRef]
  22. Xu, F.; Yang, X.; Huang, T.; Li, Z.; Ji, Y.; Zhu, R. The Emergence of Top-Incident Perovskite Solar Cells. Nano Energy 2024, 130, 110171. [Google Scholar] [CrossRef]
  23. Tillmann, P.; Jäger, K.; Becker, C. Minimising the Levelised Cost of Electricity for Bifacial Solar Panel Arrays Using Bayesian Optimisation. Sustain. Energy Fuels 2020, 4, 254–264. [Google Scholar] [CrossRef]
  24. Geodatos. Geographic Coordinates Searching. Available online: https://www.geodatos.net/coordenadas (accessed on 8 March 2025).
  25. Beck, H.E.; Zimmermann, N.E.; McVicar, T.R.; Vergopolan, N.; Berg, A.; Wood, E.F. Present and Future Köppen-Geiger Climate Classification Maps at 1-Km Resolution. Sci. Data 2018, 5, 180214. [Google Scholar] [CrossRef]
  26. Pennington, R.T.; Lehmann, C.E.R.; Rowland, L.M. Tropical Savannas and Dry Forests. Curr. Biol. 2018, 28, R541–R545. [Google Scholar] [CrossRef]
  27. García, E. Modificaciones al Sistema de Clasificación Climática de Köppen; Universidad Nacional Autónoma de México Instituto de Geografía: Ciudad de México, Mexico, 2004; ISBN 970-32-1010-4. [Google Scholar]
  28. Amiry, H.; Benhmida, M.; Bendaoud, R.; Hajjaj, C.; Bounouar, S.; Yadir, S.; Raïs, K.; Sidki, M. Design and Implementation of a Photovoltaic I-V Curve Tracer: Solar Modules Characterization under Real Operating Conditions. Energy Convers. Manag. 2018, 169, 206–216. [Google Scholar] [CrossRef]
  29. Papageorgas, P.; Piromalis, D.; Valavanis, T.; Kambasis, S.; Iliopoulou, T.; Vokas, G. A Low-Cost and Fast PV I-V Curve Tracer Based on an Open Source Platform with M2M Communication Capabilities for Preventive Monitoring. Energy Procedia 2015, 74, 423–438. [Google Scholar] [CrossRef]
  30. García-Valverde, R.; Chaouki-Almagro, S.; Corazza, M.; Espinosa, N.; Hösel, M.; Søndergaard, R.R.; Jørgensen, M.; Villarejo, J.A.; Krebs, F.C. Portable and Wireless IV-Curve Tracer for >5kV Organic Photovoltaic Modules. Sol. Energy Mater. Sol. Cells 2016, 151, 60–65. [Google Scholar] [CrossRef]
  31. Zhu, Y.; Xiao, W. A Comprehensive Review of Topologies for Photovoltaic I–V Curve Tracer. Sol. Energy 2020, 196, 346–357. [Google Scholar] [CrossRef]
  32. Adam, D. Paint It White. Available online: https://www.theguardian.com/environment/2009/jan/16/white-paint-carbon-emissions-climate (accessed on 17 February 2025).
  33. González-León, C.; Torres, J.; Serrano, J.P.; Rodríguez-Alejandro, A.D.A.; González-Cabrera, N. Estudio tecnico economico de paneles solares interconectados a la red de distribución. Rev. Iberoam. De Cienc. 2018, 5, 94–105. [Google Scholar]
Disclaimer/Publisher’s Note: The statements, opinions and data contained in all publications are solely those of the individual author(s) and contributor(s) and not of MDPI and/or the editor(s). MDPI and/or the editor(s) disclaim responsibility for any injury to people or property resulting from any ideas, methods, instructions or products referred to in the content.

