Article

Application of FAHP in Multi-Objective Optimization of Solar–Electromagnetic Energy Heating System Performance

School of Municipal and Environmental Engineering, Shenyang Jianzhu University, Shenyang 110168, China
*
Author to whom correspondence should be addressed.
Energies 2025, 18(14), 3712; https://doi.org/10.3390/en18143712
Submission received: 27 May 2025 / Revised: 2 July 2025 / Accepted: 11 July 2025 / Published: 14 July 2025
(This article belongs to the Special Issue Solar Thermal Energy Storage and Heating Systems)

Abstract

In this study, we applied the fuzzy analytic hierarchy process (FAHP) to the multi-objective optimization of the performance of a solar-electromagnetic energy heating system (SEHS). Optimizing the performance of SEHS as a sustainable heating solution in rural areas is crucial for improving energy efficiency and reducing environmental impacts. To achieve the optimal balance between economy, system performance, energy efficiency, and comfort, we developed a FAHP-based optimization model using system simulation data from the experimentally validated TRNSYS model. The results show that the optimal decision scheme improved the overall performance by 38% compared to the original design scheme. This work confirms the effectiveness of FAHP in dealing with uncertainty and multi-objective decision-making in SEHS and provides valuable scientific support for engineering practice.

1. Introduction

Under the dual pressure of intensifying global climate change and the depletion of traditional energy sources, energy transition has become an urgent task for global sustainable development [1,2,3,4]. As the process of energy conservation and emission reduction accelerates around the world, China proposed in September 2020 to achieve a “CO2 emissions peak by 2030 and work towards carbon neutrality by 2060”. However, rural areas in severely cold regions of China suffer from harsh climatic conditions, high energy consumption for heating, and severe environmental pollution. This not only hinders the development of the region’s economy and the comfort level of people’s homes but also creates significant constraints on the sustainable development of energy and the environment [5,6]. Therefore, developing new heating systems suitable for rural buildings in severely cold regions and improving the utilization rate of renewable energy are of great significance for promoting the coordinated development of energy and the environment.
Solar energy is widely used for its large reserves and inexhaustible, clean, and environmentally friendly properties [7,8,9,10,11,12]. Most of the residential buildings in rural areas are single-story or multi-story monolithic buildings, and the roof space is convenient for the placement of solar collectors. However, solar energy resources are greatly affected by daily variations and weather conditions, resulting in a mismatch between heat demand and heat supply [13,14]. To address the intermittency and instability of single-source solar energy systems, many researchers have combined solar energy with other renewable energy sources and have conducted studies in different regions comparing different building types.
The joint application of solar energy and air source heat pumps (ASHPs) is the most common form of coupled heating system. Li et al. [15] applied a coupled solar energy and air source heat pump (SASHP) system in rural areas in northwest China and found that the SASHP system reduced CO2 emissions by as much as 10,960.7 kg annually compared with the use of ASHPs alone throughout the entire heating season. Long et al. [16] evaluated the performance of an SASHP system under Tibetan climate conditions and optimized its key design parameters. The results showed that the solar collector area and the water tank volume are the priority factors for the design of SASHP systems in Tibet. Yue et al. [17] applied an SASHP system to the Beijing–Tianjin–Hebei region in China. They found that although solar thermal heating has the lowest environmental impacts and carbon emissions among the various heating methods, it is not the best solution for clean heating in rural areas. Gao et al. [18] combined an SASHP system with phase-change energy storage to design and develop a heating system for extremely cold regions. Chen et al. [19] investigated a phase-change energy storage SASHP system that improved heat pump performance under extreme weather conditions, with a COP of up to 1.79. The above studies show that the SASHP system is applicable in rural areas; however, significant climatic differences exist among regions in China, which pose a great challenge to the utilization of complementary solar and air source systems.
Coupled systems of solar energy and ground source heat pumps (SGSHPs) are also frequently used for single-building heating. Compared with ASHPs, GSHPs use shallow soil at a relatively constant temperature as the heat source, and the ambient temperature has less influence on the system. Hong-Seok Mun et al. [20] employed an SGSHP system for the heating of a rural pigsty, which effectively guaranteed a suitable temperature. Yang et al. [21] applied an SGSHP composite heating system to agricultural greenhouses in cold areas. The COP of the composite system was 3.32. Compared with electric heating and pure soil source heat pump heating, the composite system heating method reduced electricity consumption by 70.74% and 12.17%, respectively, which indicates better environmental benefits. Farzin M. Rad et al. [22] evaluated the overall feasibility of an SGSHP system in cold climates by comparing and analyzing several cities. They found that Vancouver, which was the city with the mildest climate, was the best city for its application. However, SGSHP systems require high-soil conditions and are complicated to construct and maintain. The effectiveness and costs of their application in rural residences need to be further demonstrated.
Similarly to heat pump systems, heating systems that utilize electricity as an auxiliary energy source for solar energy include resistive, electrode vacuum/micro-pressure, graphene electric heating, resistive vacuum hot-water, and electromagnetic systems. Among them, electromagnetic heating is highly efficient and fast, allows water and electricity to be kept separate, which is safe and environmentally friendly, saves space, and can be started and stopped at any time in the low-temperature environment of cold regions. The coupling of electromagnetic energy as auxiliary heating energy with solar energy is a new heating system construction idea applied to single rural residences in cold regions. Currently, there are few studies on applying electromagnetic heating devices to building heating systems, and most of them focus on improving the performance of the electromagnetic heater itself [23,24,25]. In this study, we applied solar energy coupled with electromagnetic energy to the heating system of a rural residence.
Previous studies have demonstrated the feasibility of coupling solar energy with other renewable energy sources for single-building heating and hot-water technologies. However, the application of various types of renewable energy needs to take into account many factors, such as climatic and geological conditions, building load characteristics, system performance, economic costs, etc., and the configuration of renewable energy system integration under different climatic conditions varies. There are still fewer choices of heating system forms suitable for single residential buildings in rural areas in severe-cold Chinese regions. The improvement of performance and optimization of integrated renewable energy heating systems should be a focus of academic research [26,27,28].
The optimization of multi-energy integrated energy supply systems is the key to improving the overall performance and sustainability of the system. Single-objective optimization methods cannot achieve the performance trade-off among multiple objectives and are not suitable for optimizing the integrated performance of building energy systems. Multi-objective optimization methods can more comprehensively evaluate system performance. Common multi-objective optimization methods include the Pareto front method, weighted sum method, ε-constraint method, and multi-criteria decision-making method, etc. [29,30,31]. FAHP, AHP, TOPSIS, ELECTRE, PROMETHEE, and ANP are several commonly used multi-criteria decision-making methods. Among them, AHP combines qualitative and quantitative methods to determine the weights of multi-objective optimization, which is simple and easy to implement, but is highly subjective and requires rich design experience from the decision-makers. The TOPSIS method is good at ranking solutions based on distance, but usually assumes that the weights are pre-determined or obtained through other methods (such as entropy weight method), and has weak modeling ability for potential dependencies between criteria. The ELECTRE/PROMETHEE methods are based on outranking and are good at handling incomparability and imprecision, but the model construction is usually more complex, and the interpretability is not as intuitive as weight-based methods like FAHP. ANP can handle complex dependencies and feedback relationships between criteria, but the model construction and calculation are extremely complex [32,33,34,35,36,37]. In contrast, the FAHP method introduces fuzzy mathematics theory on the basis of AHP, which can effectively handle subjective judgments and uncertainties, and can systematically decompose complex problems, clearly define the relative importance relationships among various levels of elements, making weight determination more precise, the operation more concise, the adaptability stronger, and reducing the influence of subjective judgments on the results [38,39,40]. Consequently, the FAHP method is widely used in multi-objective decision-making problems with more evaluation indicators and more complex decision-making processes [41,42,43,44].
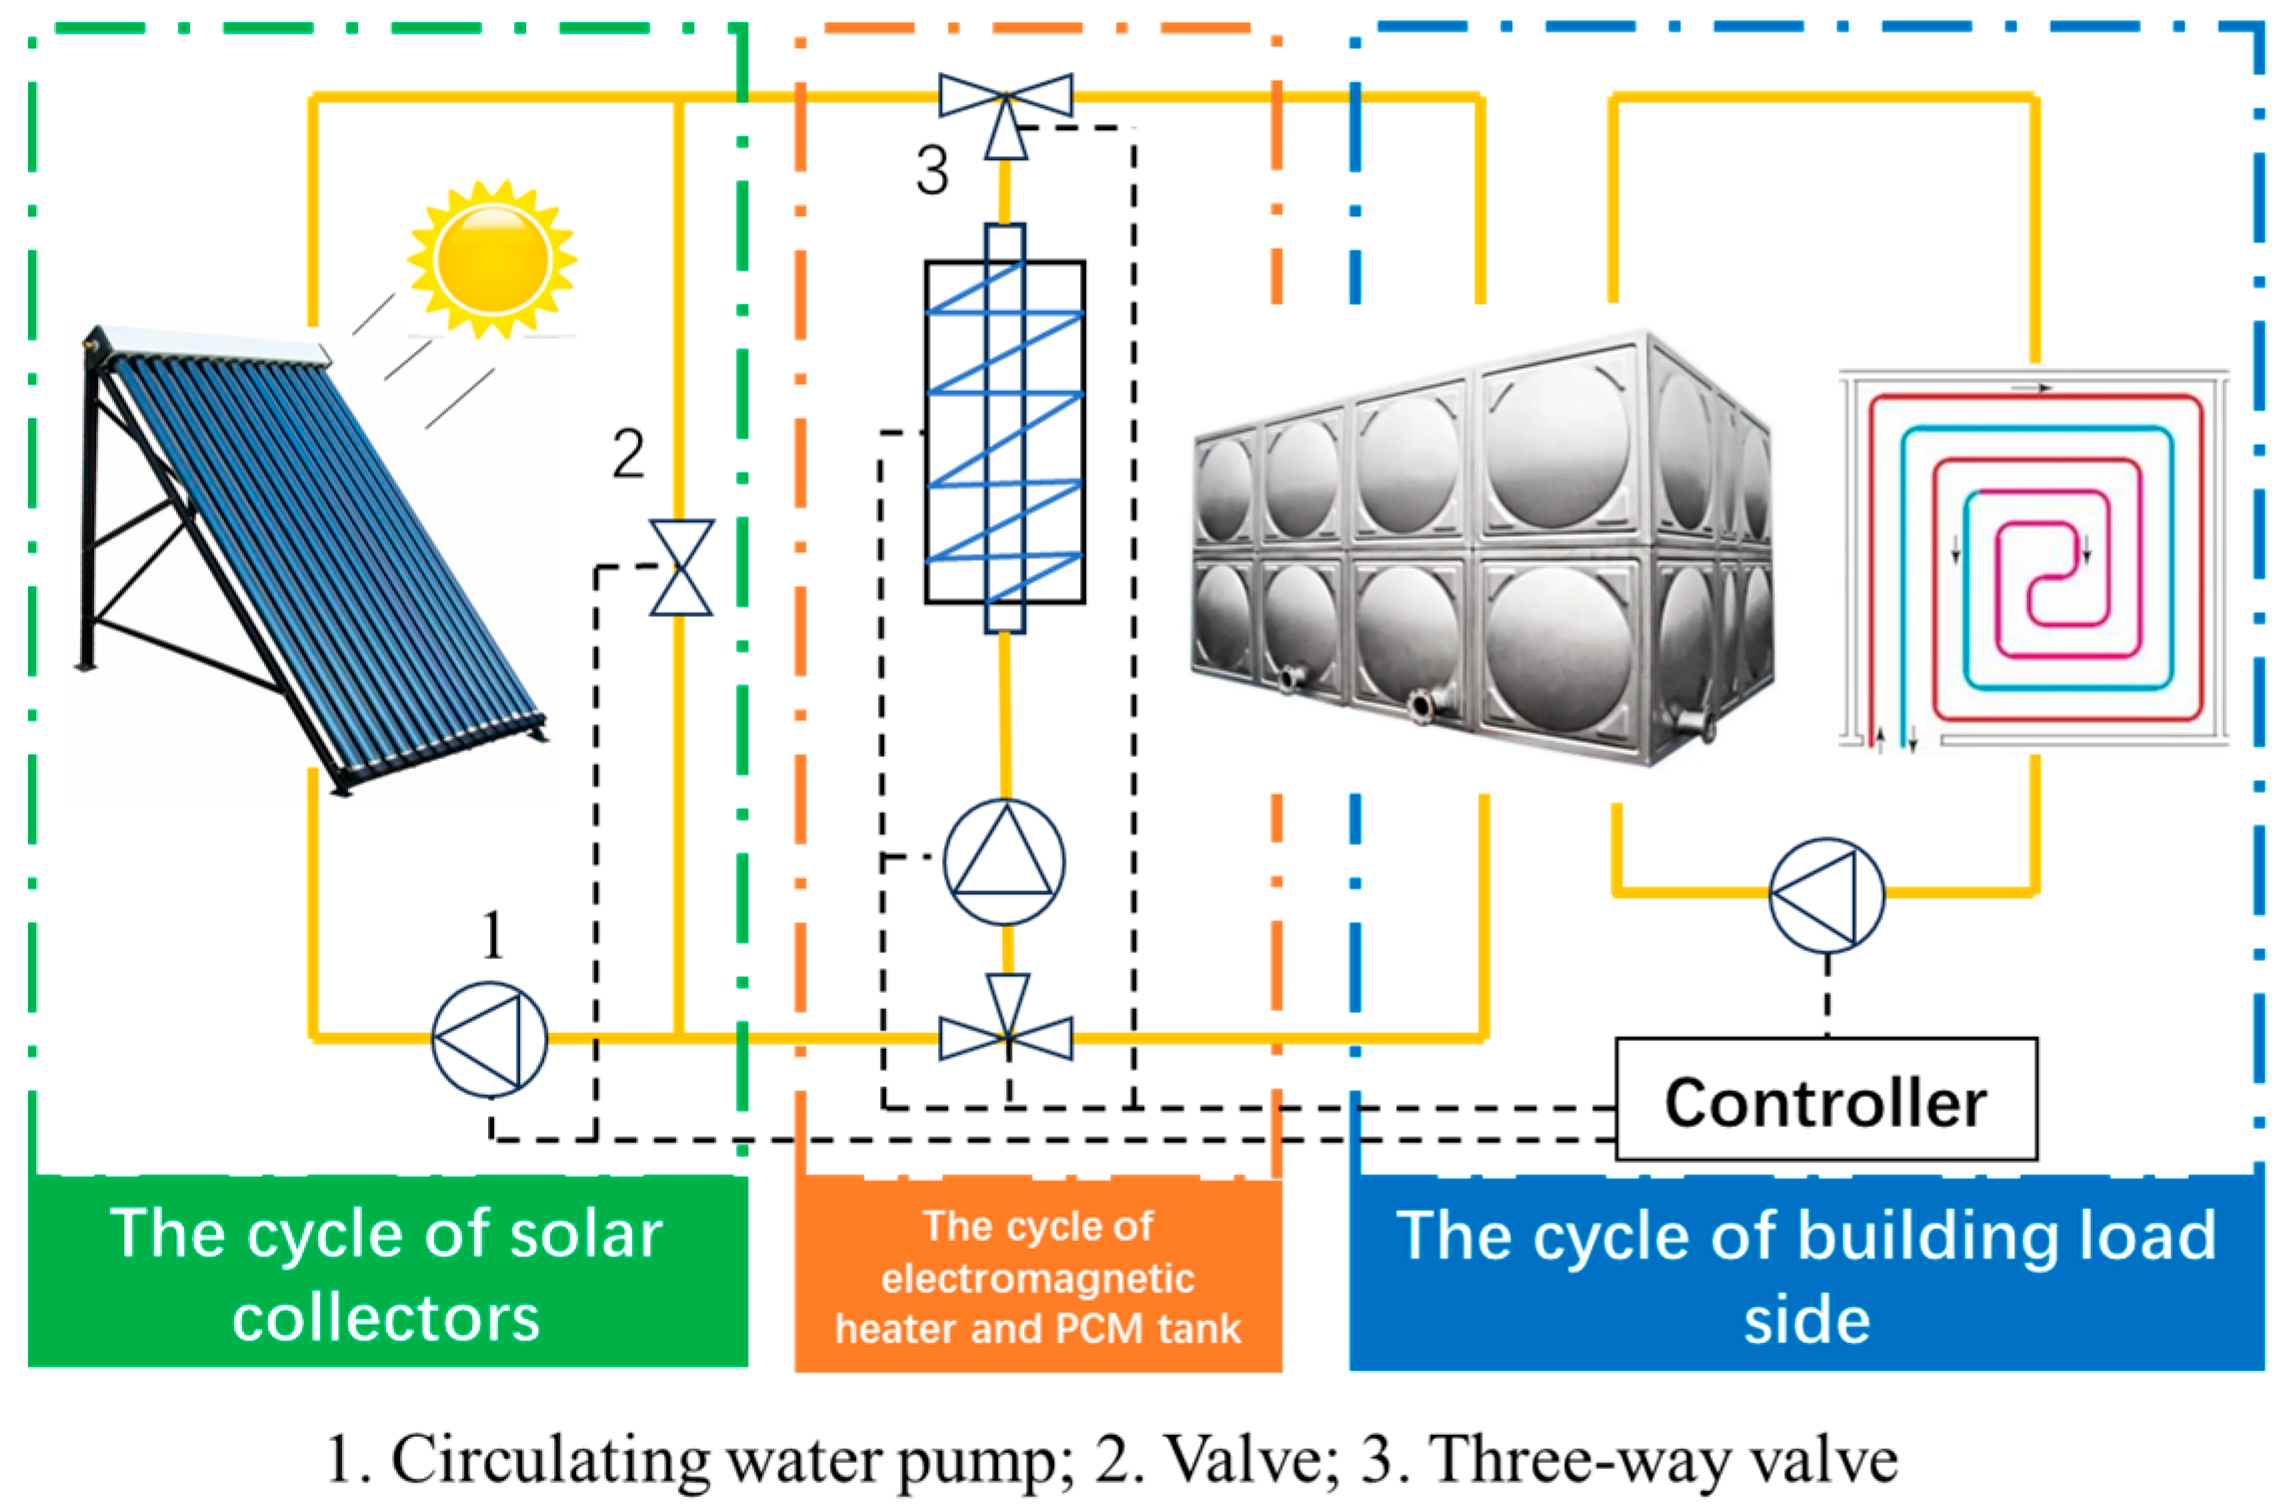
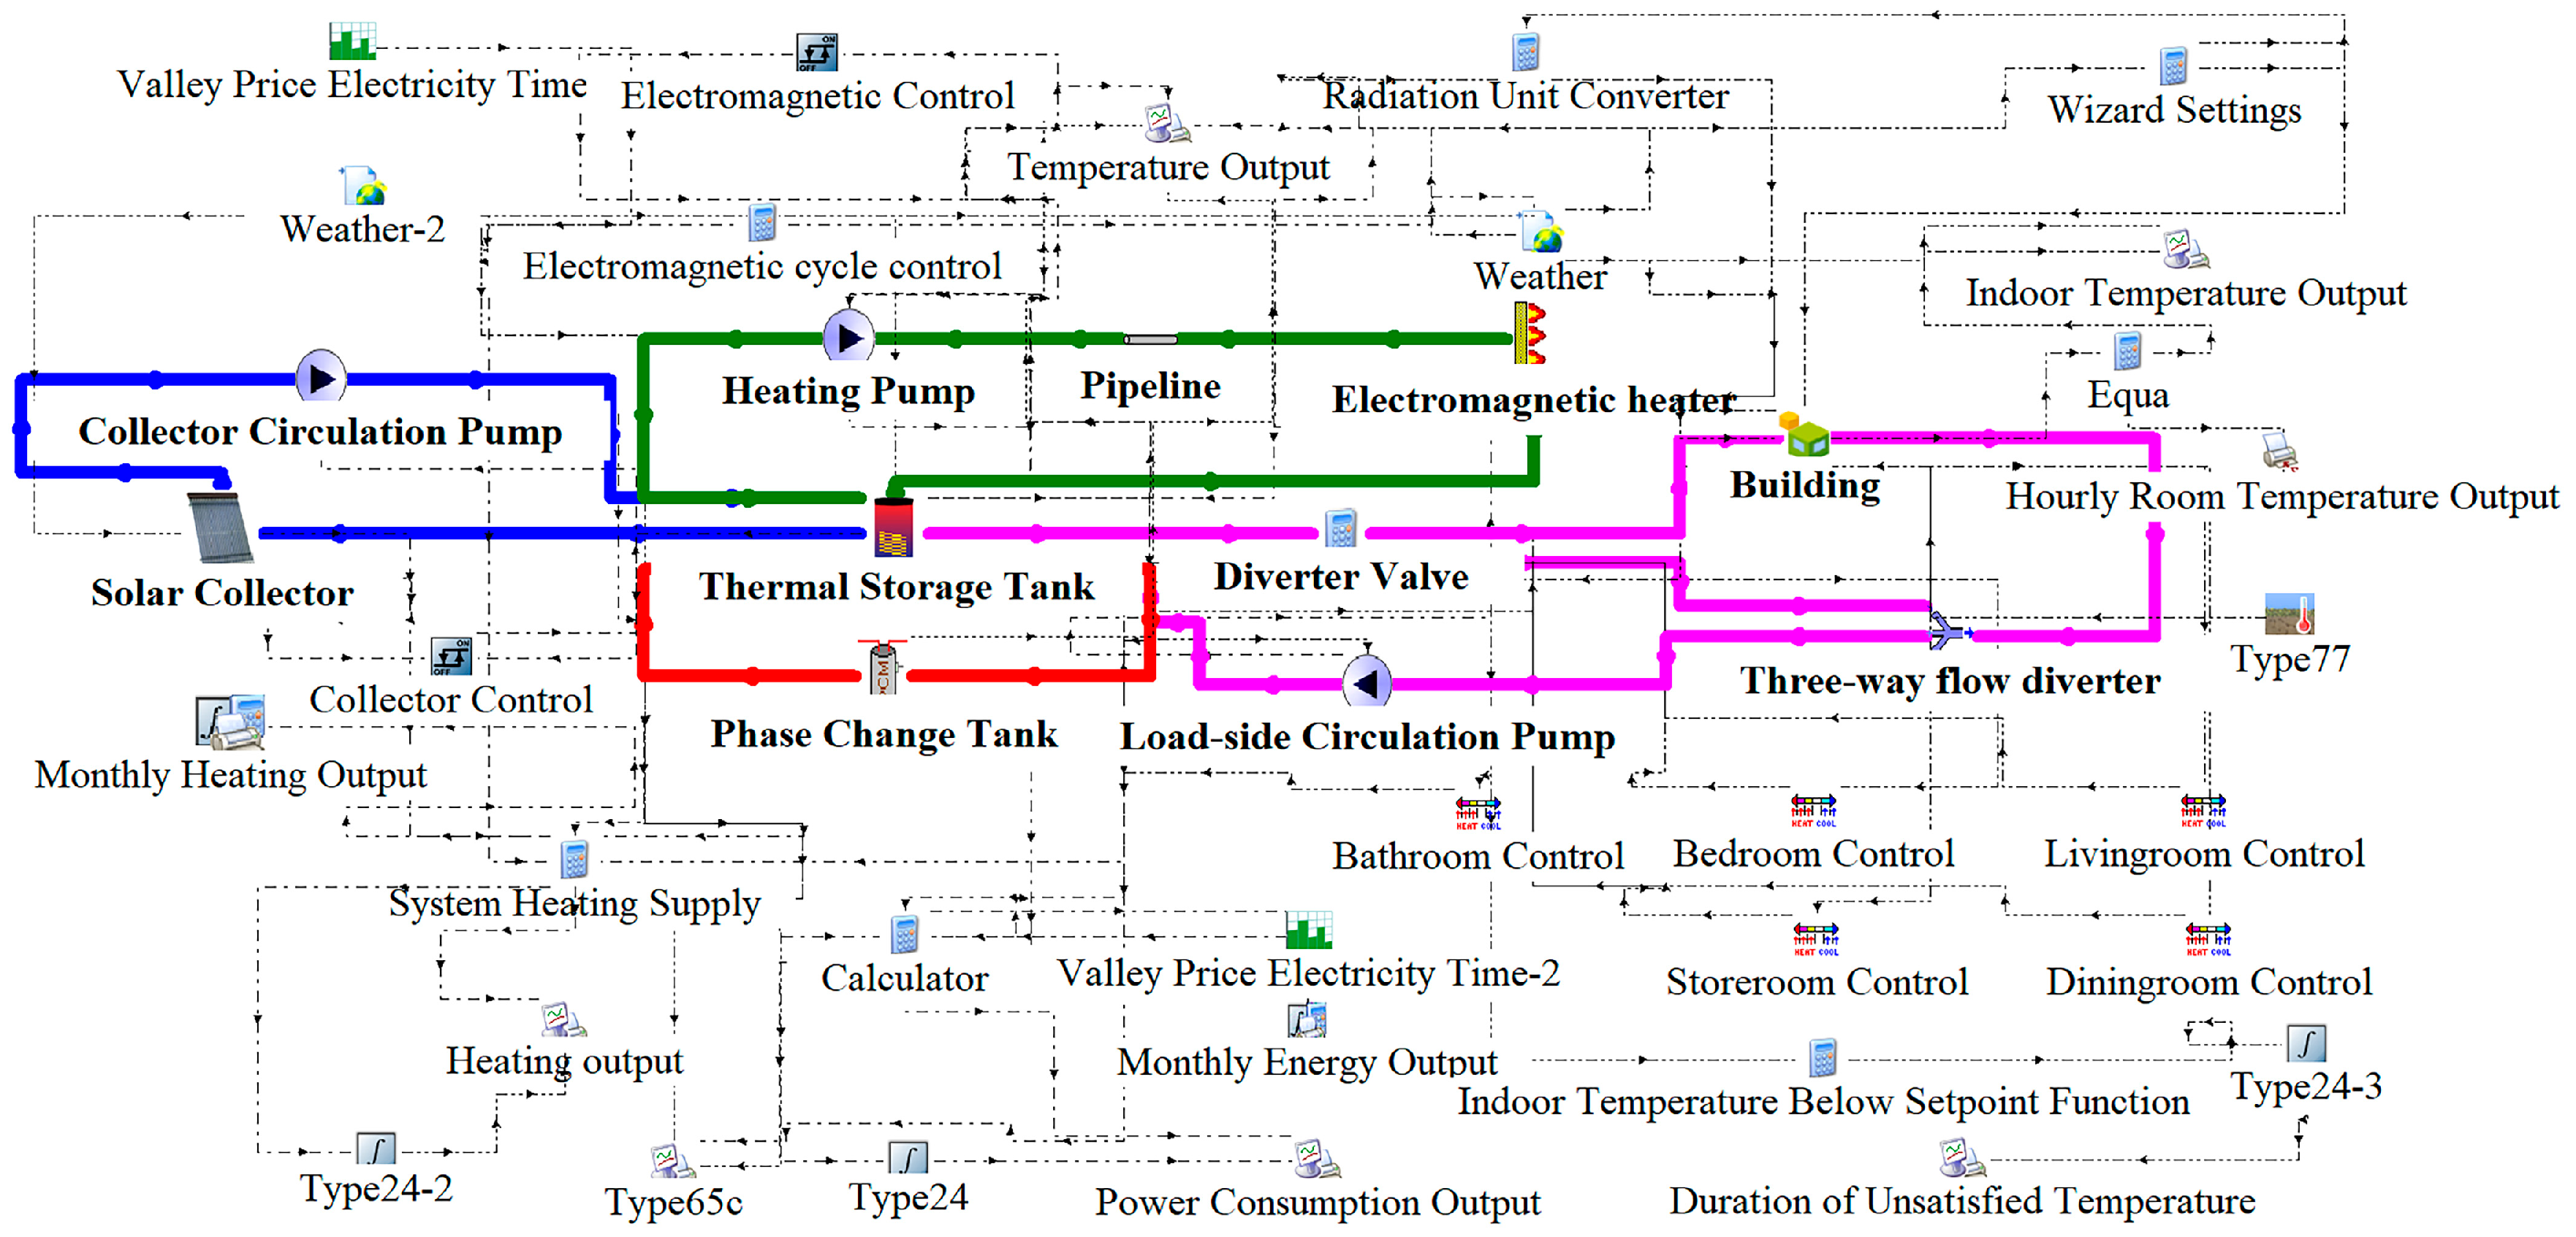
In conclusion, in order to promote the application of multi-energy coupled heating systems represented by SEHS in individual rural houses, this paper adopts FAHP to provide a multi-objective optimization method that can be implemented rapidly and weakens subjective influence, providing a decision-making basis for the optimal design of this system in rural residential buildings in severe cold regions. In this study, we employ the phase-change material (PCM) water tank technology [45,46] to design an SEHS, taking single residential buildings in rural areas in severe-cold regions as the research object; establish a system simulation model using TRNSYS 18 software; and verify the accuracy of the model by building an experimental platform. A comprehensive evaluation index system of the system is established, and the AHP is used to determine the weight of each factor and define the comprehensive objective function to establish a multi-objective optimization model based on the FAHP. Taking the collector area, the collector inclination angle, the volume of water in the tank, the PCM volume, the rated power of the electromagnetic heater, the collector’s circulating water pump flow rate, the electromagnetic heater’s circulating water pump flow rate, and the user side’s circulating water pump flow rate as the optimization variables, a multi-objective optimization study is carried out using the orthogonal test to provide references for the application configuration and operation setup of SEHSs with a combined PCM tank in cold regions.
The main contributions of this study can be summarized as follows:
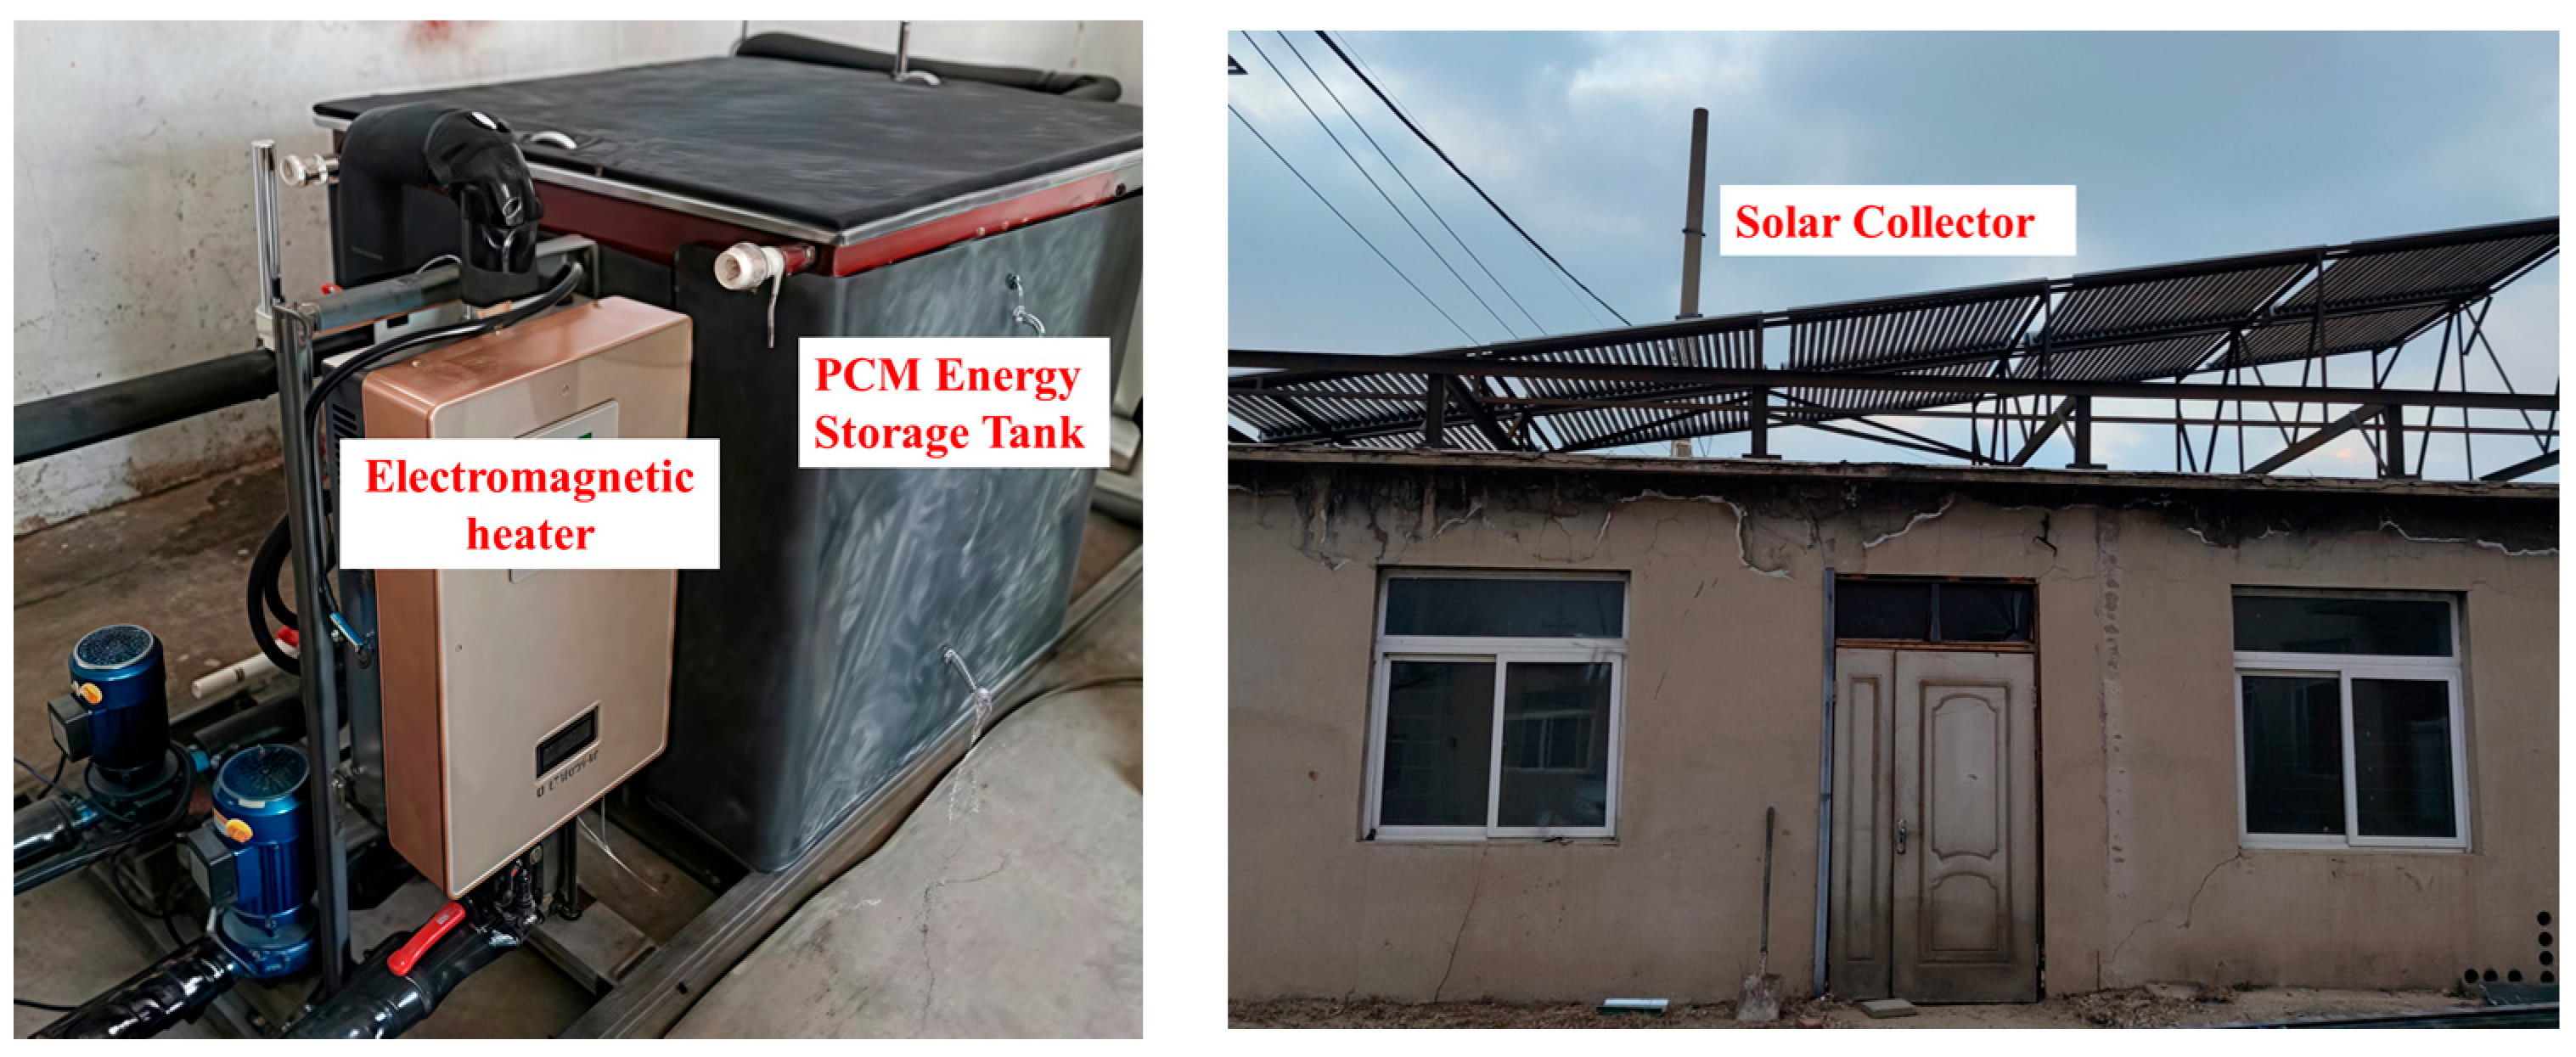
(1) We propose an SEHS for PCM water tank integration applicable to isolated rural houses in a severe-cold region and build a platform for the actual testing of the system;
(2) The FAHP method is proposed for application in the multi-objective optimization of a multi-energy integrated heating system, and a multi-objective optimization model of SEHS performance is constructed;
(3) We carry out case studies for typical farmhouses in rural areas in severe-cold regions, use TRNSYS 18 to build a simulation model of the SEHS for PCM water tank integration, and use orthogonal test methods to obtain the simulation system operation data and establish a dataset for multi-objective optimization decision-making.

2. Materials and Methods

2.1. Methodology

2.1.1. System Description

An SEHS with an integrated PCM tank is designed for single residential buildings in rural areas in severe-cold regions. The coupled heating system consists of a solar vacuum tube collector, an electromagnetic heater, a PCM tank, a circulating water pump, end equipment, and a control system. A system operation schematic is shown in Figure 1.
In many areas of China, the government has implemented a peak-and-valley tariff charging model for electric heating to encourage the use of clean energy heating. In the Shenyang area studied in this work, the tariff for electric heating is 0.4 RMB/kW·h for the period from 23:00 to 7:00 the next day and 0.52 RMB/kW·h for the period from 7:00 to 23:00. Therefore, an SEHS could make full use of nighttime valley time to activate electromagnetic heaters to store heat in the PCM water tank, so as to “shift the peak to fill the valley”. The end of the heating system would adopt a ground radiation heating system, and the designed water supply temperature would be set to 40 °C. The PCM selected for the PCM water tank is low-temperature organic PCM paraffin, and its physical parameters are shown in Table 1. Based on testing, in the early and late heating period, the heat collected by the solar collectors could meet the building load of the whole day. In the middle of the heating period, the electromagnetic heater would only be turned on at night, and the heat would be able to meet the heating demand of the next day.

2.1.2. System Operation Mode and Control Strategy

The coupled heating system consists of two cyclic operation modes, daytime mode and nighttime mode, with the solar collectors being activated only during the daytime when there is sufficient solar radiation and the electromagnetic heaters being activated only during the nighttime during the valley power hours (from 23:00 to 7:00 the next day). The electromagnetic heater meets the load demand of the room at night and stores excess heat in the PCM tank, which is used to supplement the load demand of the room during the daytime when solar radiation is insufficient. The control strategy of the system is as follows: During the daytime, the solar collector cycle controls the start and stop of the circulating pump according to the temperature difference. Specifically, the difference between the vacuum tube collector outlet temperature (Tout) and the bottom temperature of the PCM water tank (Tin) is taken as the control parameter, and the collector cycle starts when Tout − Tin > 5 °C and shuts down when Tout − Tin < 2 °C. At night, the electromagnetic heating cycle uses temperature control to start and stop the circulating pump. Specifically, electromagnetic heating circulation starts when the average tank temperature (Ttank) < 50 °C and shuts down when Ttank > 52 °C. User-side circulation controls the start and stop of the circulating pump according to the room temperature, where when the latter is lower than the set temperature, the end circulating pump starts. The system operation control logic is shown in Figure 2.

2.1.3. Simulation Model Construction

In TRNSYS 18, the simulation model of the SEHS coupled with a PCM water tank was constructed by using the following main components: a meteorological data module (Type 15-3), a building load module (Type 56), a solar collector module (Type 538), an electromagnetic heater module (Type 659), a thermal storage tank module (Type 156), a PCM module (Type 1334), and a water pump module (Type 114). The control strategy was developed based on controllers (Type 108 and Type 165) and equations. (The equations for each Type are shown in Supplementary Materials.) The simulation model is shown in Figure 3.

2.1.4. Multi-Objective Optimization Modeling of Coupled Heating System

According to the characteristics of residential heating demand in rural areas, costs, system performance, energy efficiency, and comfort were selected as the first-level indicators based on expert research. The secondary indicators corresponding to system costs are installation cost and operation cost; those corresponding to system performance are the system performance coefficient and collector efficiency; those corresponding to system energy efficiency are the solar contribution rate and the primary energy utilization rate; and those corresponding to system comfort are room temperature fluctuation (expressed by using the variance, S2) and the total length of time in which the set heating temperature is not reached (introducing the penalty function, gt). A comprehensive evaluation system was established based on fuzzy mathematical principles. First, the factor judgment set was established as follows:
V = ( v 1 , v 2 , v 3 , v 4 )
where V stands for the overall evaluation, v 1 stands for costs, v 2 stands for system performance, v 3 stands for energy efficiency, and v 4 stands for comfort.
Secondly, the evaluation index system for the SEHS with an integrated PCM water tank was established, as shown in Table 2.
Next, based on the importance of each of the above decision factors, an evaluation set was constructed, representing the evaluation results of the SEHS with an integrated PCM water tank. Specifically, it was constructed by categorizing the final evaluation results of the above four criterion layer indicators of the SEHS with an integrated PCM water tank into four levels as
U = ( u 1 , u 2 , u 3 , u 4 )
where u1 stands for very good, u2 stands for good, u3 stands for fair, and u4 stands for poor.
When considering the influence of different factors on the system, it is especially critical to calculate the weight of each factor, where the size of the weight directly reflects the degree of influence on the system. At present, weight calculation methods mainly include hierarchical analysis, the entropy value method, principal component analysis, factor analysis, the gray correlation method, and the TOPSIS method. Among them, the hierarchical analysis method is comprehensive and systematic when dealing with multi-objective problems; therefore, it was chosen in this study to calculate the index weights. The process for determining the weights is shown in Figure 4.
(1) Establishment of fuzzy evaluation matrix and judgment matrix
By consulting and soliciting opinions from experts and researchers in the field of clean energy heating, the relevant indicators of the system were evaluated according to the 1-9-scale method; then, the fuzzy evaluation matrix (R) and judgment matrix ( A ) were established. The geometric mean method was used for the judgment matrix based on the opinions of several experts, and the calculation formula is as follows:
ω i = j = 1 n a i j 1 n k = 1 n j = 1 n a k j 1 n i = 1 , 2 , , n
where ω i is the weight coefficient of the i th row of the matrix and n is the order of the matrix; a i j is the element of the i th row and the j th column of the matrix; i and k are the i th and k th rows of the matrix, respectively; and j is the j th column of the matrix.
(2) Weighting
Common methods of weight calculation are the arithmetic mean, the geometric mean, and the eigenvalue methods. In this study, the arithmetic mean method was used for calculation, and the formula is as follows:
ω i = 1 n j = 1 n a i j k = 1 n a k j i = 1 , 2 , , n
(3) Normalization calculations
After establishing the judgment matrix, it is necessary to normalize the matrix, such as normalizing the resulting weight vector ω i = ω 1 ω 2 ω 3 T , calculated as
W i = ω i j = 1 n ω j ( i , j = 1 , 2 , 3 , , n )
(4) Consistency test
Due to the complexity of the target problem and the ambiguity and diversity of people’s understanding of the problem, the judgment matrices based on the opinions of the researchers may not be exactly the same, so the consistency test is the basis for assessing the objective accuracy of the results. The closer the consistency index (CI) is to 0, the more satisfactory the consistency of the results is; the larger the CI is, the more inconsistent the results are. The formula for the consistency index (CI) is
C I = λ max n n 1
λ max = i = 1 n ( A W ) i n W i
where C I is the matrix consistency index, λ max is the maximum characteristic root, n is the order of the judgment matrix, and ( A W ) i is the weight of the i th row of the matrix.
A stochastic consistency index, the RI, is introduced to measure the size of the C I . The RI is related to the order of the judgment matrix, and the larger the order, the more probable it is that the established judgment matrix has consistent stochastic deviations, as shown in Table 3.
In the SEHS multi-objective optimization study with the combined PCM tank, eight key parameters were selected as factors affecting the multi-objective optimization results: the collector area, the collector inclination, the volume of water in the tank, the PCM volume, the rated power of the electromagnetic heater, the collector’s circulating pump flow rate, the circulating pump flow rate of the electromagnetic heater, and the circulating pump flow rate of the user side.

2.2. Case Studies

2.2.1. Case Building

In this study, we selected a rural house in the surrounding area of Shenyang City, Liaoning Province. The latitude and longitude of Shenyang city is 41°48′11.75″ N, 123°25′31.18″ E. The single-story building with a floor height of 3.6 m and a floor area of 110.52 m2 located in the north and facing south. The thermal parameters of the building envelope are shown in Table 4, and the building plan is shown in Figure 5. The heating system of the building is an SEHS with an integrated PCM water tank, and the physical diagram of the system is shown in Figure 6.

2.2.2. Building Model Construction and Load Calculation

The building model was constructed by using TRNSYS 18 software, as shown in Figure 7. According to the “Rural Residential Building Energy Conservation Design Standard (GB 50824-2013)” [47], the design heating temperature of a farmhouse in a cold region is 14 °C. The latitude of the region of Shenyang is 41°48′ N. The winter heating time is from 1 November to 31 March of the next year, a total of 151 days, with 24 h a day of continuous heating. The maximum value of the building heat load during the whole heating cycle is 7.18 kW, and the average heat load is 3.13 kW. The heat load of the rural residence during the heating period hour by hour is shown in Figure 8.

2.2.3. Model Validation

In order to simulate and verify the accuracy of the model, the heat load calculated with the building simulation model was compared with the load change rule of a building in the same area with a similar floor area [48], and the results showed that the load change trends of the two were nearly the same, as shown in Figure 9. The supply and return water temperatures of the simulation model of the coupled heating system were compared with the measured values, and the measured data from 17:00 on 22 January 2023, to 17:00 on 23 January 2023, were selected. The maximum error between the simulation results and the test results was 13.54%, as shown in Figure 10, which verifies the accuracy of the TRNSYS simulation model.

2.2.4. Construction of Multi-Objective Optimization Function

According to the established optimization and evaluation model, as well as the optimization variables, the SEHS with an integrated PCM water tank uses the FAHP to derive the comprehensive evaluation weights of each index and construct the multi-objective optimization function.

3. Establishment of Evaluation Matrix

According to the method of establishing the evaluation matrix in 3.1, the evaluation results of multiple experts were normalized to obtain the evaluation results of each indicator as shown in Table 5.

4. Establishment of Judgment Matrix

According to the evaluation index system of the SEHS, the judgment matrix and comprehensive evaluation matrix of each index are constructed. Table 6, Table 7, Table 8 and Table 9 show the judgment matrices for costs, system performance, energy efficiency, and comfort, respectively, and Table 10 shows the comprehensive judgment matrices obtained by using the geometric mean method to process the results of several experts’ judgments.

5. Calculation of Weights

As an example, the judgment matrices of installation cost (B11) and operation cost (B12) are normalized and calculated as
W 1 = 1 4 1 / 4 1 ω 1 ω 2 0.8 0.2
ω 1 = 1 2 a 11 a 11 + a 21 + a 12 a 12 + a 22 = 0.8
ω 2 = 1 2 a 21 a 11 + a 21 + a 22 a 12 + a 22 = 0.2
Similarly, the weights of the two factors for the other secondary indicators are W 2 = (0.83, 0.17), W 3 = (0.75, 0.25), and W 4 = (0.25, 0.75) and that of the first-level indicator is A = (0.61, 0.13, 0.17, 0.09).

6. Consistency Test

The stochastic consistency index of the second-order judgment matrix is 0, indicating full consistency, so only the consistency test of the combined judgment matrix is needed:
A W = 1.00 5.01 5.11 5.19 0.20 1.00 0.56 1.78 0.20 1.78 1.00 2.10 0.19 0.56 0.48 1.00 0.61 0.13 0.17 0.09 = 2.60 0.51 0.71 0.36
λ max = 1 n ( B ω ) 1 ω 1 + ( B ω ) 2 ω 2 + ( B ω ) 3 ω 3 + ( B ω ) 4 ω 4 = 4.09
C I = λ max n n 1 = 0.03
C R = C I R I = 0.032 < 0.1
Therefore, it passes the consistency test.

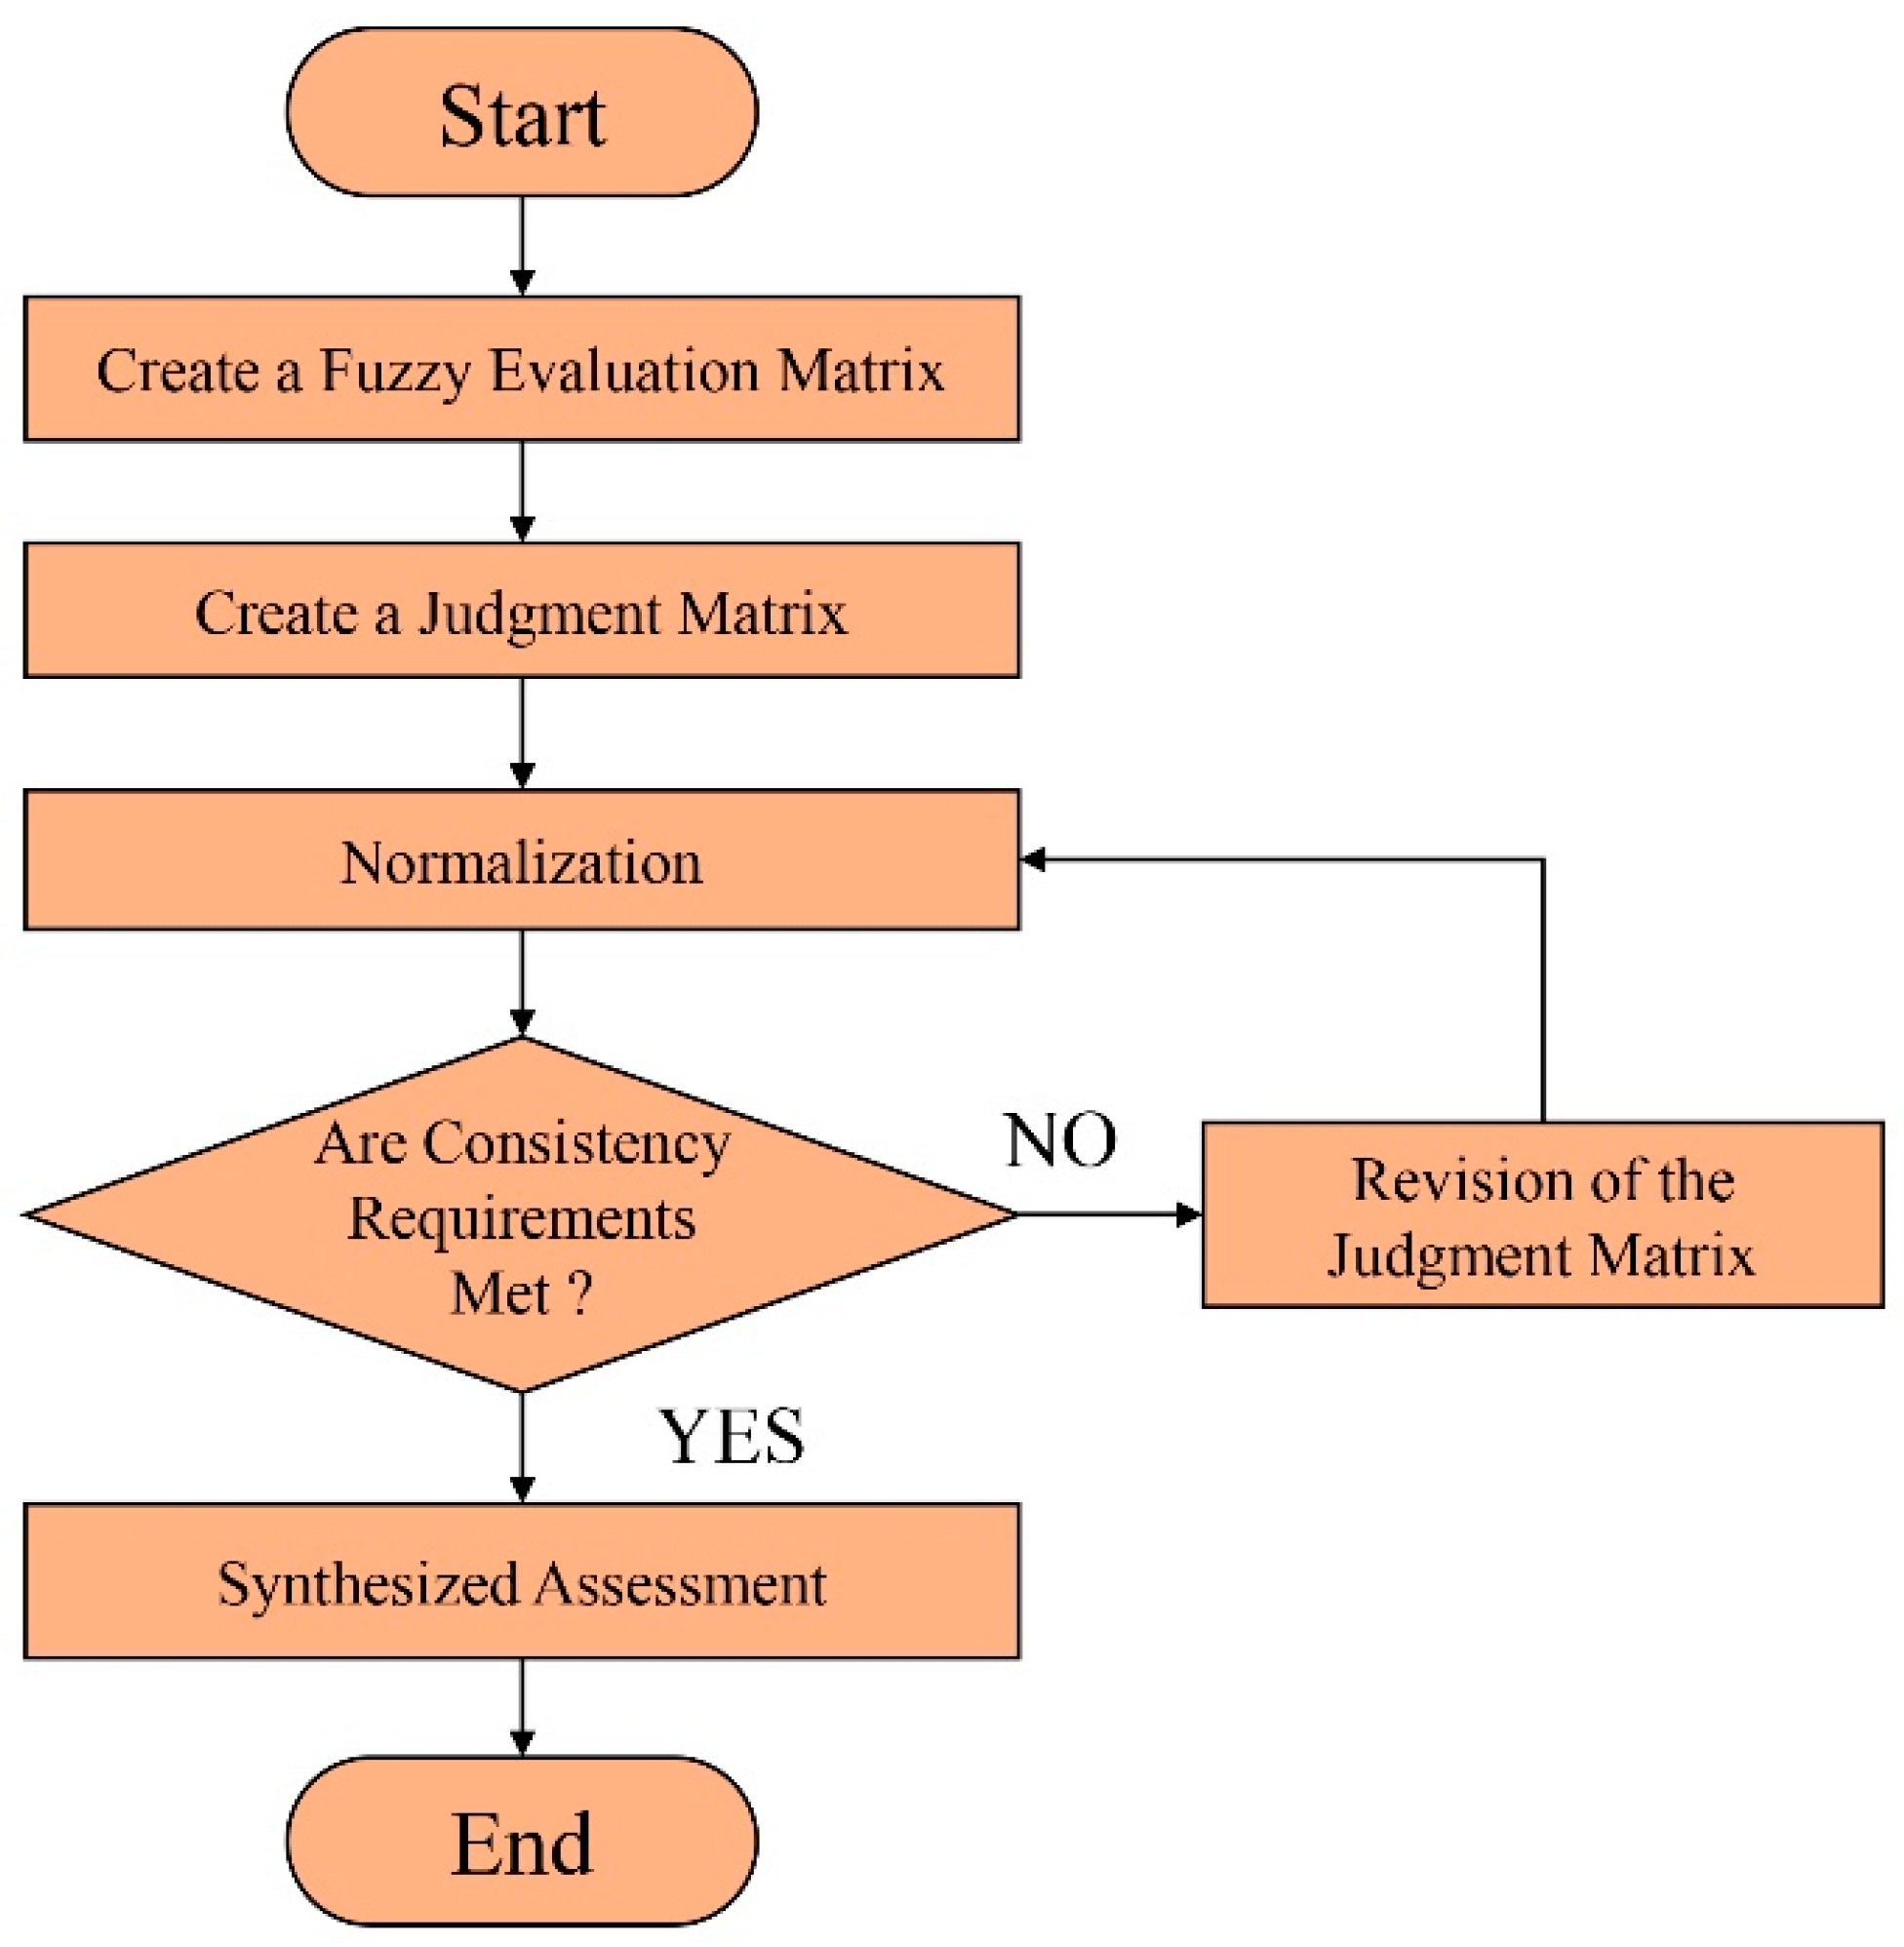
7. Comprehensive Evaluation Indicators

According to the method described in the previous section, the second-level fuzzy evaluation results are represented by B21, B22, B23, B24, and B i j = A i j R i j , and the second-level fuzzy evaluation matrix is obtained:
B 21 = A 21 R 21 = 0.8 0.2 0 0.35 0.60 0.05 0.25 0.35 0.30 0.10 = 0.05 0.35 0.54 0.06
B 22 = A 22 R 22 = 0.83 0.17 0.50 0.30 0.20 0 0.10 0.45 0.45 0 = 0.432 0.3255 0.2425 0
B 23 = A 23 R 23 = 0.75 0.25 0.90 0.10 0 0 0.25 0.45 0.3 0 = 0.7375 0.1875 0.075 0
B 24 = A 24 R 24 = 0.25 0.75 0.40 0.40 0.15 0.05 0.15 0.45 0.30 0.10 = 0.2125 0.4375 0.2625 0.0875 .
The first-level fuzzy evaluation matrix is then calculated:
R = B 21 B 22 B 23 B 24 = 0.05 0.35 0.54 0.06 0.432 0.3255 0.2425 0 0.7375 0.1875 0.075 0 0.2125 0.4375 0.2625 0.0875
B = A R = 0.61 0.13 0.17 0.09 0.05 0.35 0.54 0.06 0.432 0.3255 0.2425 0 0.7375 0.1875 0.075 0 0.2125 0.4375 0.2625 0.0875 = 0.231 0.327 0.397 0.044
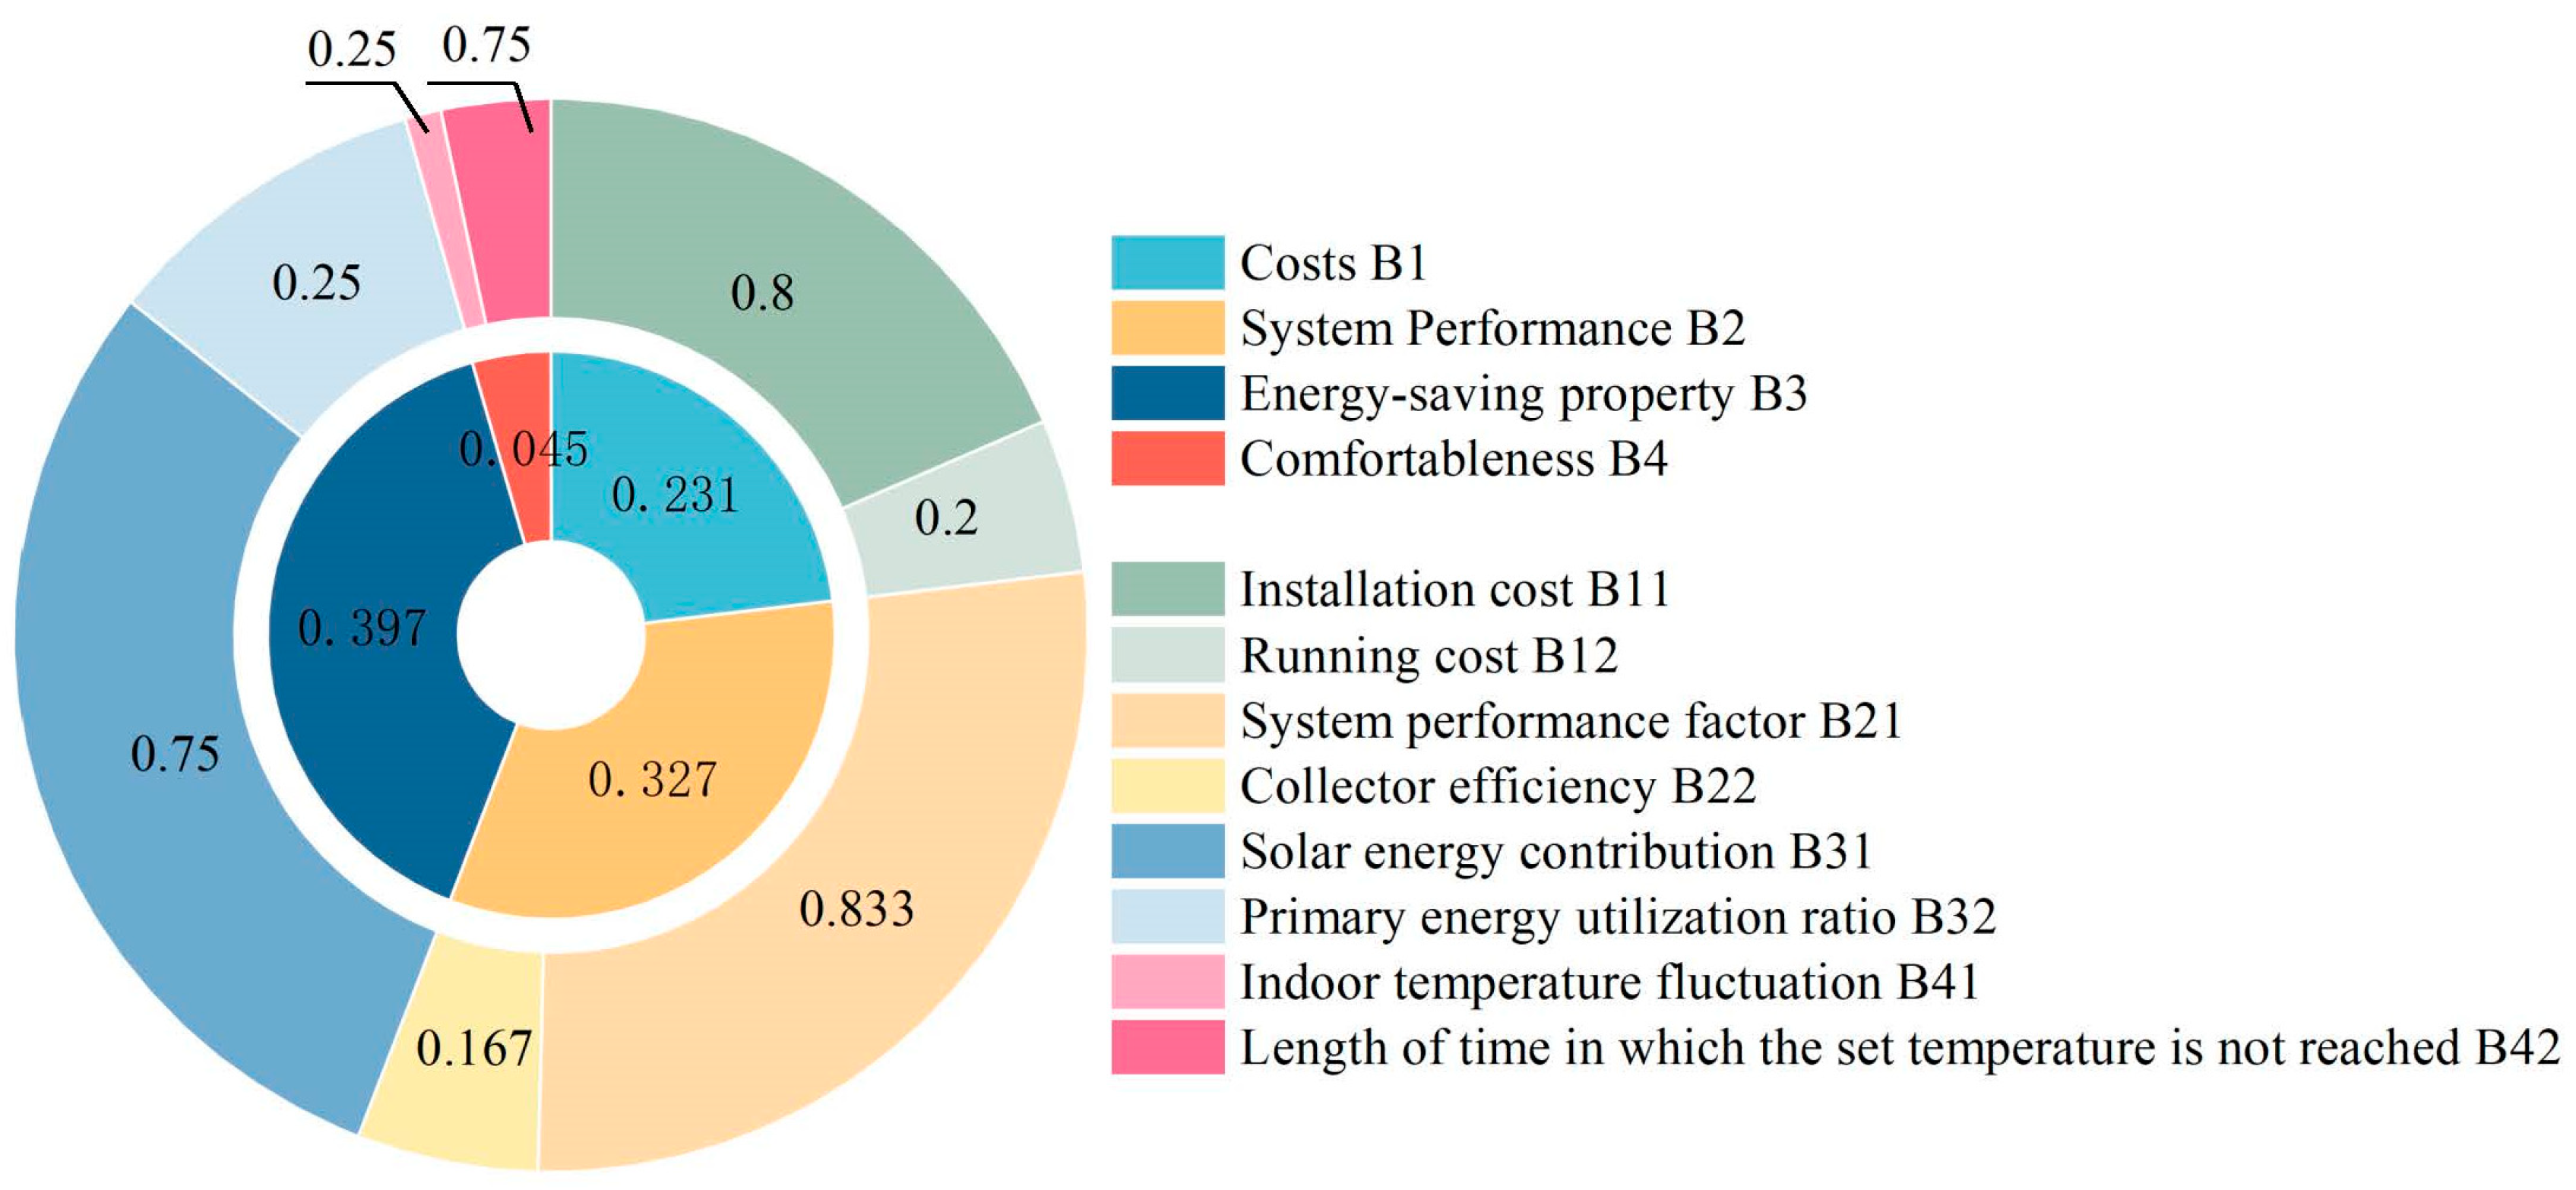
In summary, the weights of the constructed comprehensive evaluation system are shown in Figure 11.
Before constructing the optimization objective function, the input data need to be pre-processed appropriately. Firstly, the original input data are dimensionless; therefore, they are all mapped to the range of [0, 1] to ensure that the impact of the data of different indicators on the objective function is balanced and avoid disproportionate impact on the objective function because of the size of the value of a single variable. Secondly, the direction of the objective function is unified; in this study, the smaller the value, the more the evaluation index is positive, while the larger the value, the more the evaluation index is negative. According to the calculated weights of the first-level indicators and those of the second-level indicators, the multi-objective optimization function of the solar–electromagnetic energy coupled heating system, f , is constructed as follows:
f = 0.231 C 0.327 ( 0.833 η s + 0.167 C O P ) 0.397 ( 0.75 f t + 0.25 P E R ) + 0.044 ( 0.25 s 2 + 0.75 g t )
where C is the formula for the installation and operating costs; η s is the solar collector efficiency; C O P is the system heating performance coefficient; f t is the solar contribution rate, %; P E R is the primary energy utilization rate, %; s 2 is the variance of room temperature fluctuation; and g t is the penalty function for the length of time in which the heating temperature demand is not met.
Based on engineering experience, the installation and operating costs can be calculated with the following formula:
C = 0.8 ( 500 A + 1000 V T A N K + 40 V P C M ρ P C M + 500 Q E + 3 P + L ) + 0.2 ( Y d Q d + Y n Q n )
where A is the area of the solar collector, m2; V T A N K is the volume of the heat storage tank, m3; V P C M is the volume of the phase-change material, m3; ρ P C M is the density of the PCM, kg/m3; Q E is the rated power of the electromagnetic heater, kW; P is the unit price of the water pump, RMB; L is the installation cost of the equipment, i.e., 10% of the total equipment cost; Y d is the system power consumption during the day, RMB/ kW·h; Y n is the system power consumption at night, RMB/ kW·h; Q d is the daytime power consumption of the system, kW·h; and Q n is the nighttime power consumption of the system, kW·h.
Q d = Q 1 + Q 2 + Q 3 + Q 4
Q n = Q 1 + Q 2 + Q 3 + Q 4
where Q 1 is the daytime power consumption of the collector’s circulating pump, kW·h; Q 2 is the daytime power consumption of the electromagnetic heater’s circulating pump, kW·h; Q 3 is the daytime power consumption of the user side’s circulating pump, kW·h; Q 4 is the daytime power consumption of the electromagnetic heater, kW·h; Q 1 is the nighttime power consumption of the collector, kW·h; Q 2 is the electromagnetic heater’s daytime power consumption, kW·h; Q 3 is the user side’s circulating pump’s nighttime power consumption, kW·h; and Q 4 is the electromagnetic heater’s nighttime power consumption, kW·h.
The solar collector efficiency is calculated as
η s = Q s A I T
where Q S is the heat absorbed by the collector, kW, and I T is the product of radiation intensity per unit area, kW/m2.
The system COP is calculated as
C O P = Q C W C
In the formula, Q C is the total heat supply of the system, kW·h, and W C is the total power consumption of the system, which is equal to the sum of Q d and Q n , kW·h.
Solar Energy Utilization f t is calculated as
f t = Q J Q C
where QJ is the total heat collected by the collector, kW·h.
The primary energy utilization rate is calculated as
P E R = Q C A I T + W C η f η w η y
In the above formula, η f is the power plant power supply efficiency, here taken as 42%; η w is the grid transmission efficiency, here taken as 92%; and η y is the compressor motor efficiency, here taken as 90%.
The expression for the variance of room temperature fluctuations is
s 2 = ( x 1 x ¯ ) 2 + ( x 2 x ¯ ) 2 + + ( x n x ¯ ) 2 n
where x ¯ is the average of the data and n is the number of data.

Orthogonal Experimental Design

As mentioned earlier, for the multi-objective optimization of the SEHS, we considered eight factors, which are the collector area, the collector inclination, the volume of water in the tank, the volume of PCM, the rated power of the electromagnetic heater, the circulating pump flow rate of the collector, the circulating pump flow rate of the electromagnetic heater, and the circulating pump flow rate of the user side. Five different levels were designed for each factor, as shown in Table 11. If each level of each factor is analyzed in one simulation, a total of 58 tests are to be conducted, which is not feasible. It is necessary to ensure the accuracy of the tests while ensuring the reasonableness of the number of simulation tests; therefore, the orthogonal test method was used in this study. An eight-factor, five-level orthogonal table was generated by using the allpairs tool, and a total of 46 simulation tests were required. The parameters of each group are shown in Table 12.

8. Results and Discussion

The 46 sets of parameters in the orthogonal test table are input into the TRNSYS simulation model, and the running data are derived from the system simulation to calculate the objective function value of the SEHS, as shown in Figure 12. The smaller the objective function value, the more significant the optimization effect. From Figure 12, it can be seen that the objective function values are all negative, indicating that the overall optimization effect obtained by using the FAHP method is good. Among them, the objective function value of parameter group 23 is the smallest, indicating that this group of parameters is the optimal combination for multi-objective optimization. Compared with the initial design parameters, the comprehensive system performance of this group of parameters increases by 38%, the room temperature fluctuation increases by 17.0%, the economic costs increase by 2.2%, system performance increases by 10.24%, and energy efficiency increases by 18.23%. The volatility of the indoor comfort indicators for the farmhouse is high; it is considered that the indoor temperature fluctuation must be within 20% and that the total number of hours in which the design temperature is not met must be less than 120 h (5 days) to meet the design requirements. Among the parameter groups, groups 1, 9, 12, 15, 31, 38, 39, 40, and 45 do not meet the above indoor temperature design requirements and are considered unsatisfactory.
Figure 13 shows the optimization results of the room temperature fluctuation for each optimized parameter group, as well as the original parameter group. It can be clearly seen that the optimization results of groups 2, 3, 6, 29, and 46 are much higher than those of the other parameter groups and better than the original design parameter group. Compared with the latter, the room temperature fluctuations for these groups are reduced by 13%, 15%, 13%, 14%, and 15%, respectively.
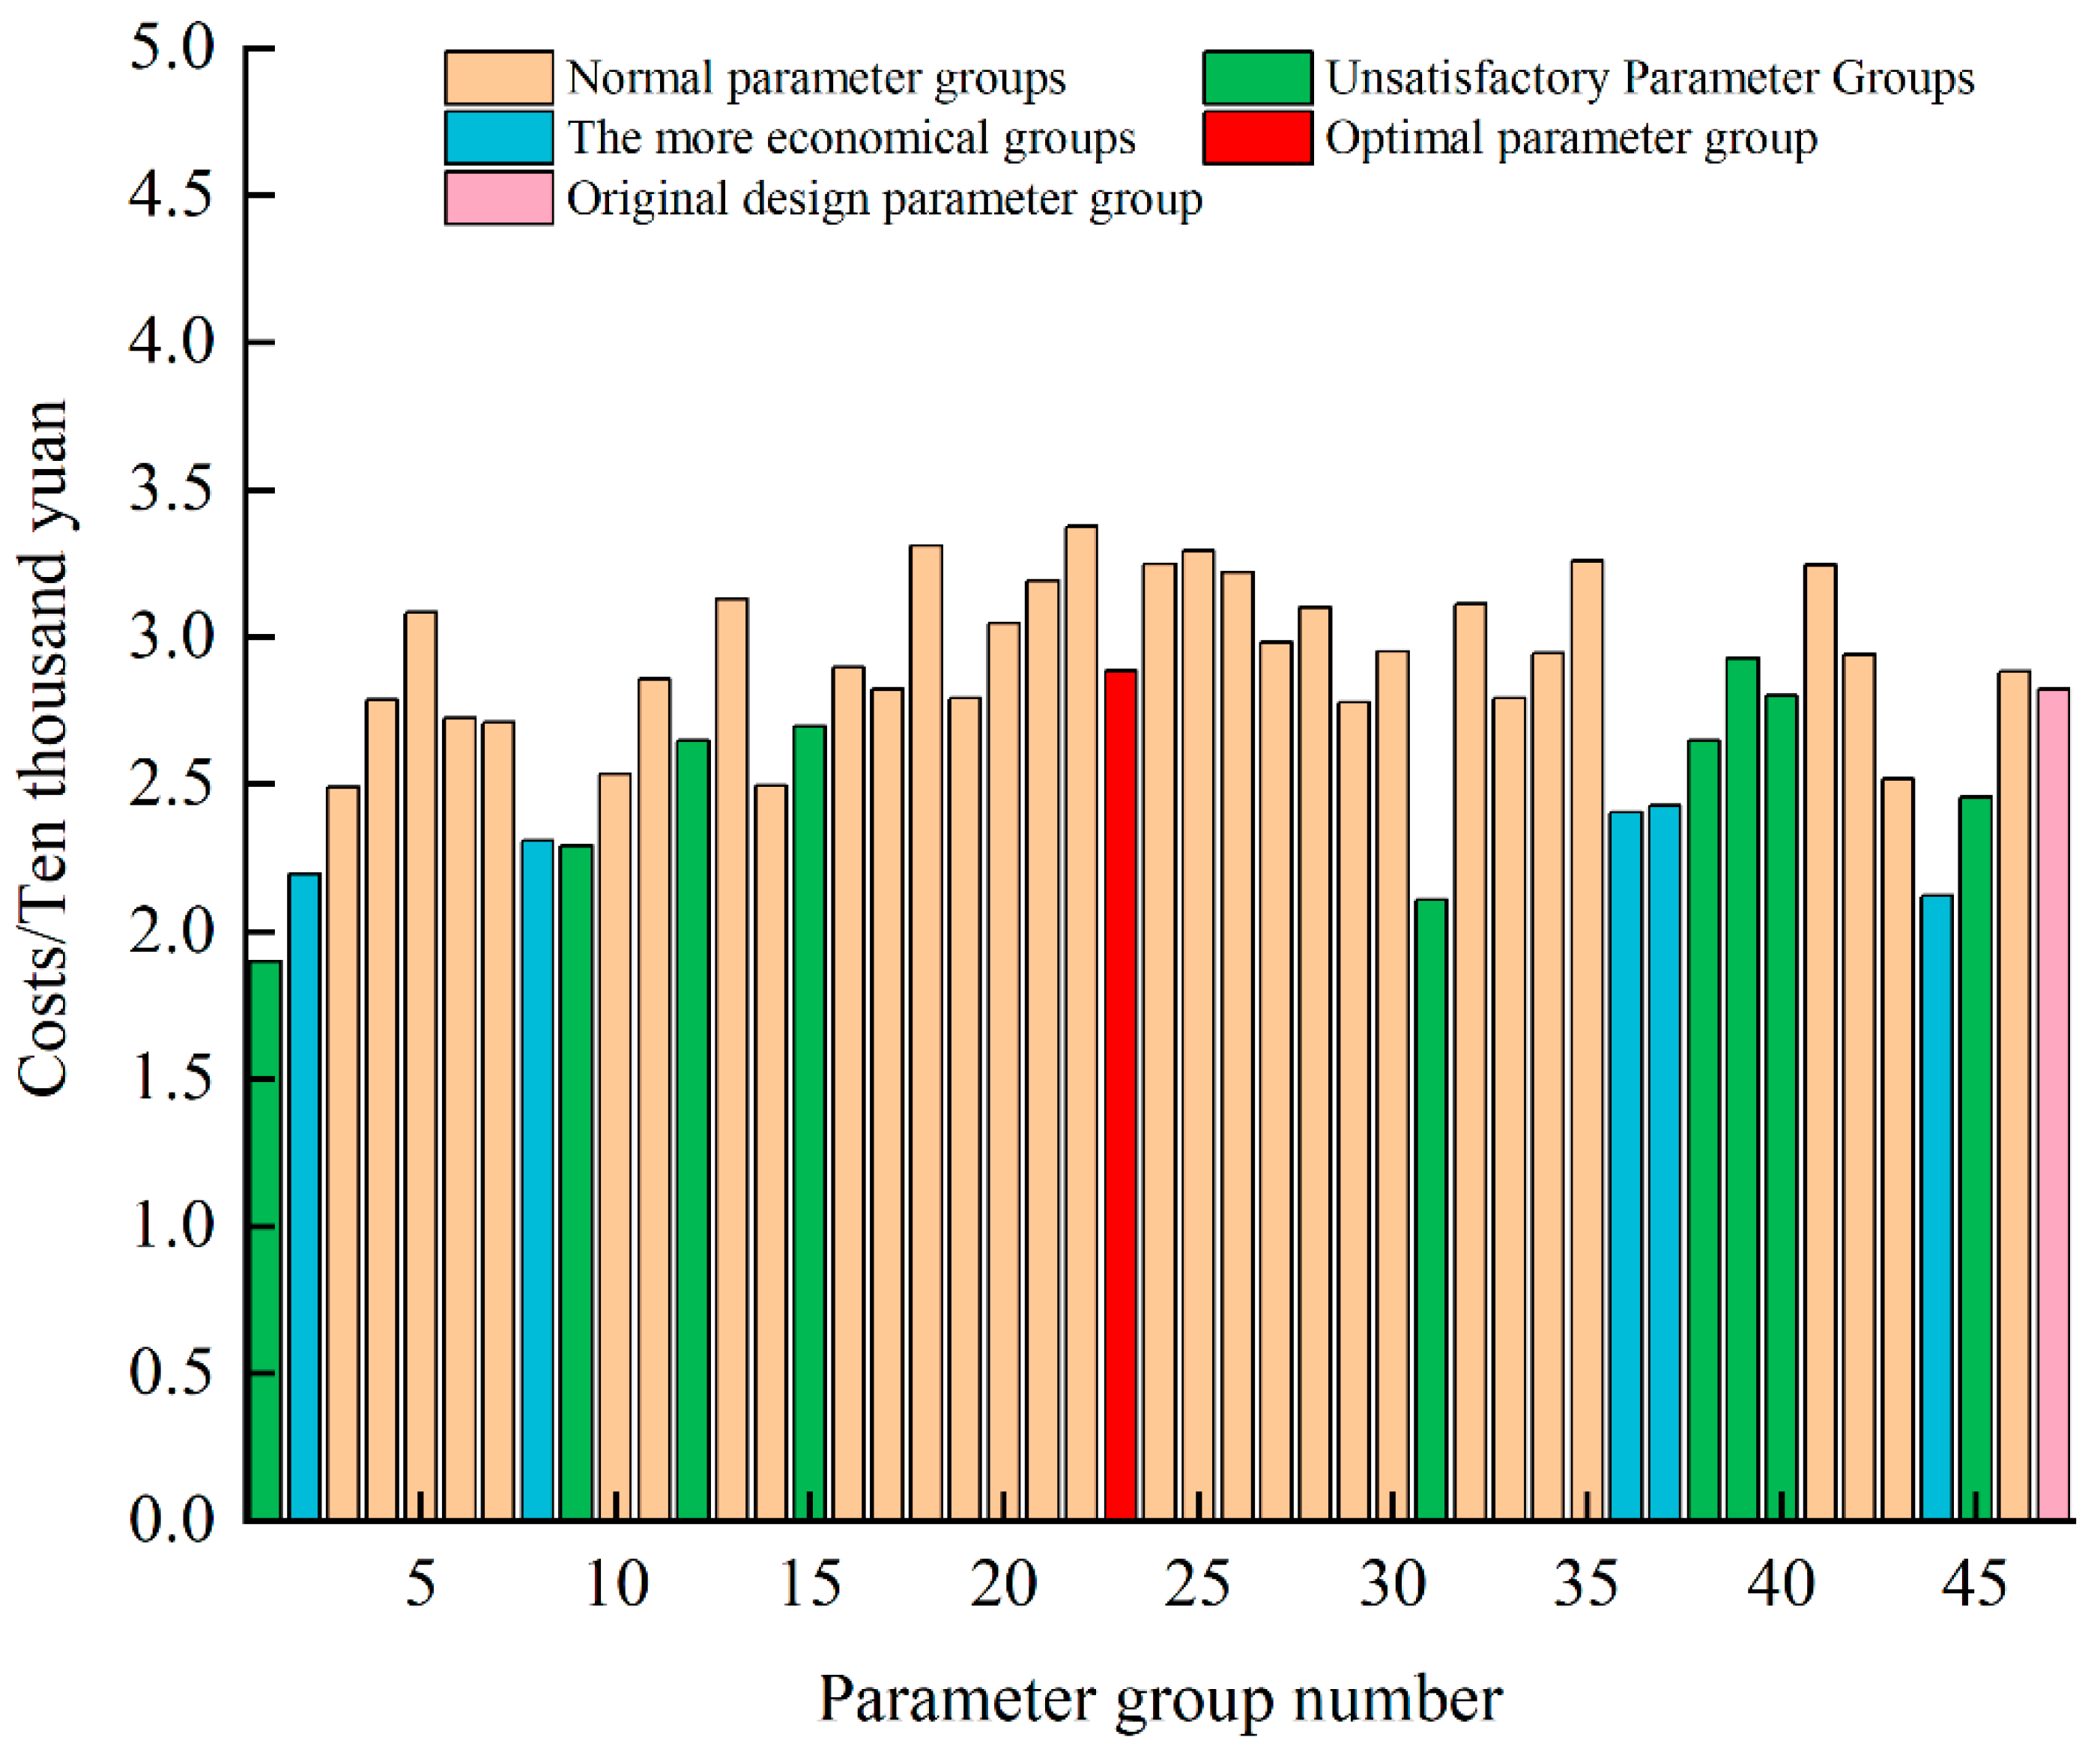
Figure 14 shows the costs optimization results for each optimized parameter group, as well as the original parameter group. It can be clearly seen that the optimization results of groups 2, 8, 36, 37, and 44 are much higher than the optimization results of the other parameter groups and are better than the original design parameter group. Compared with the latter, the costs for these groups are improved by 22%, 18%, 15%, 14%, and 25%, respectively.
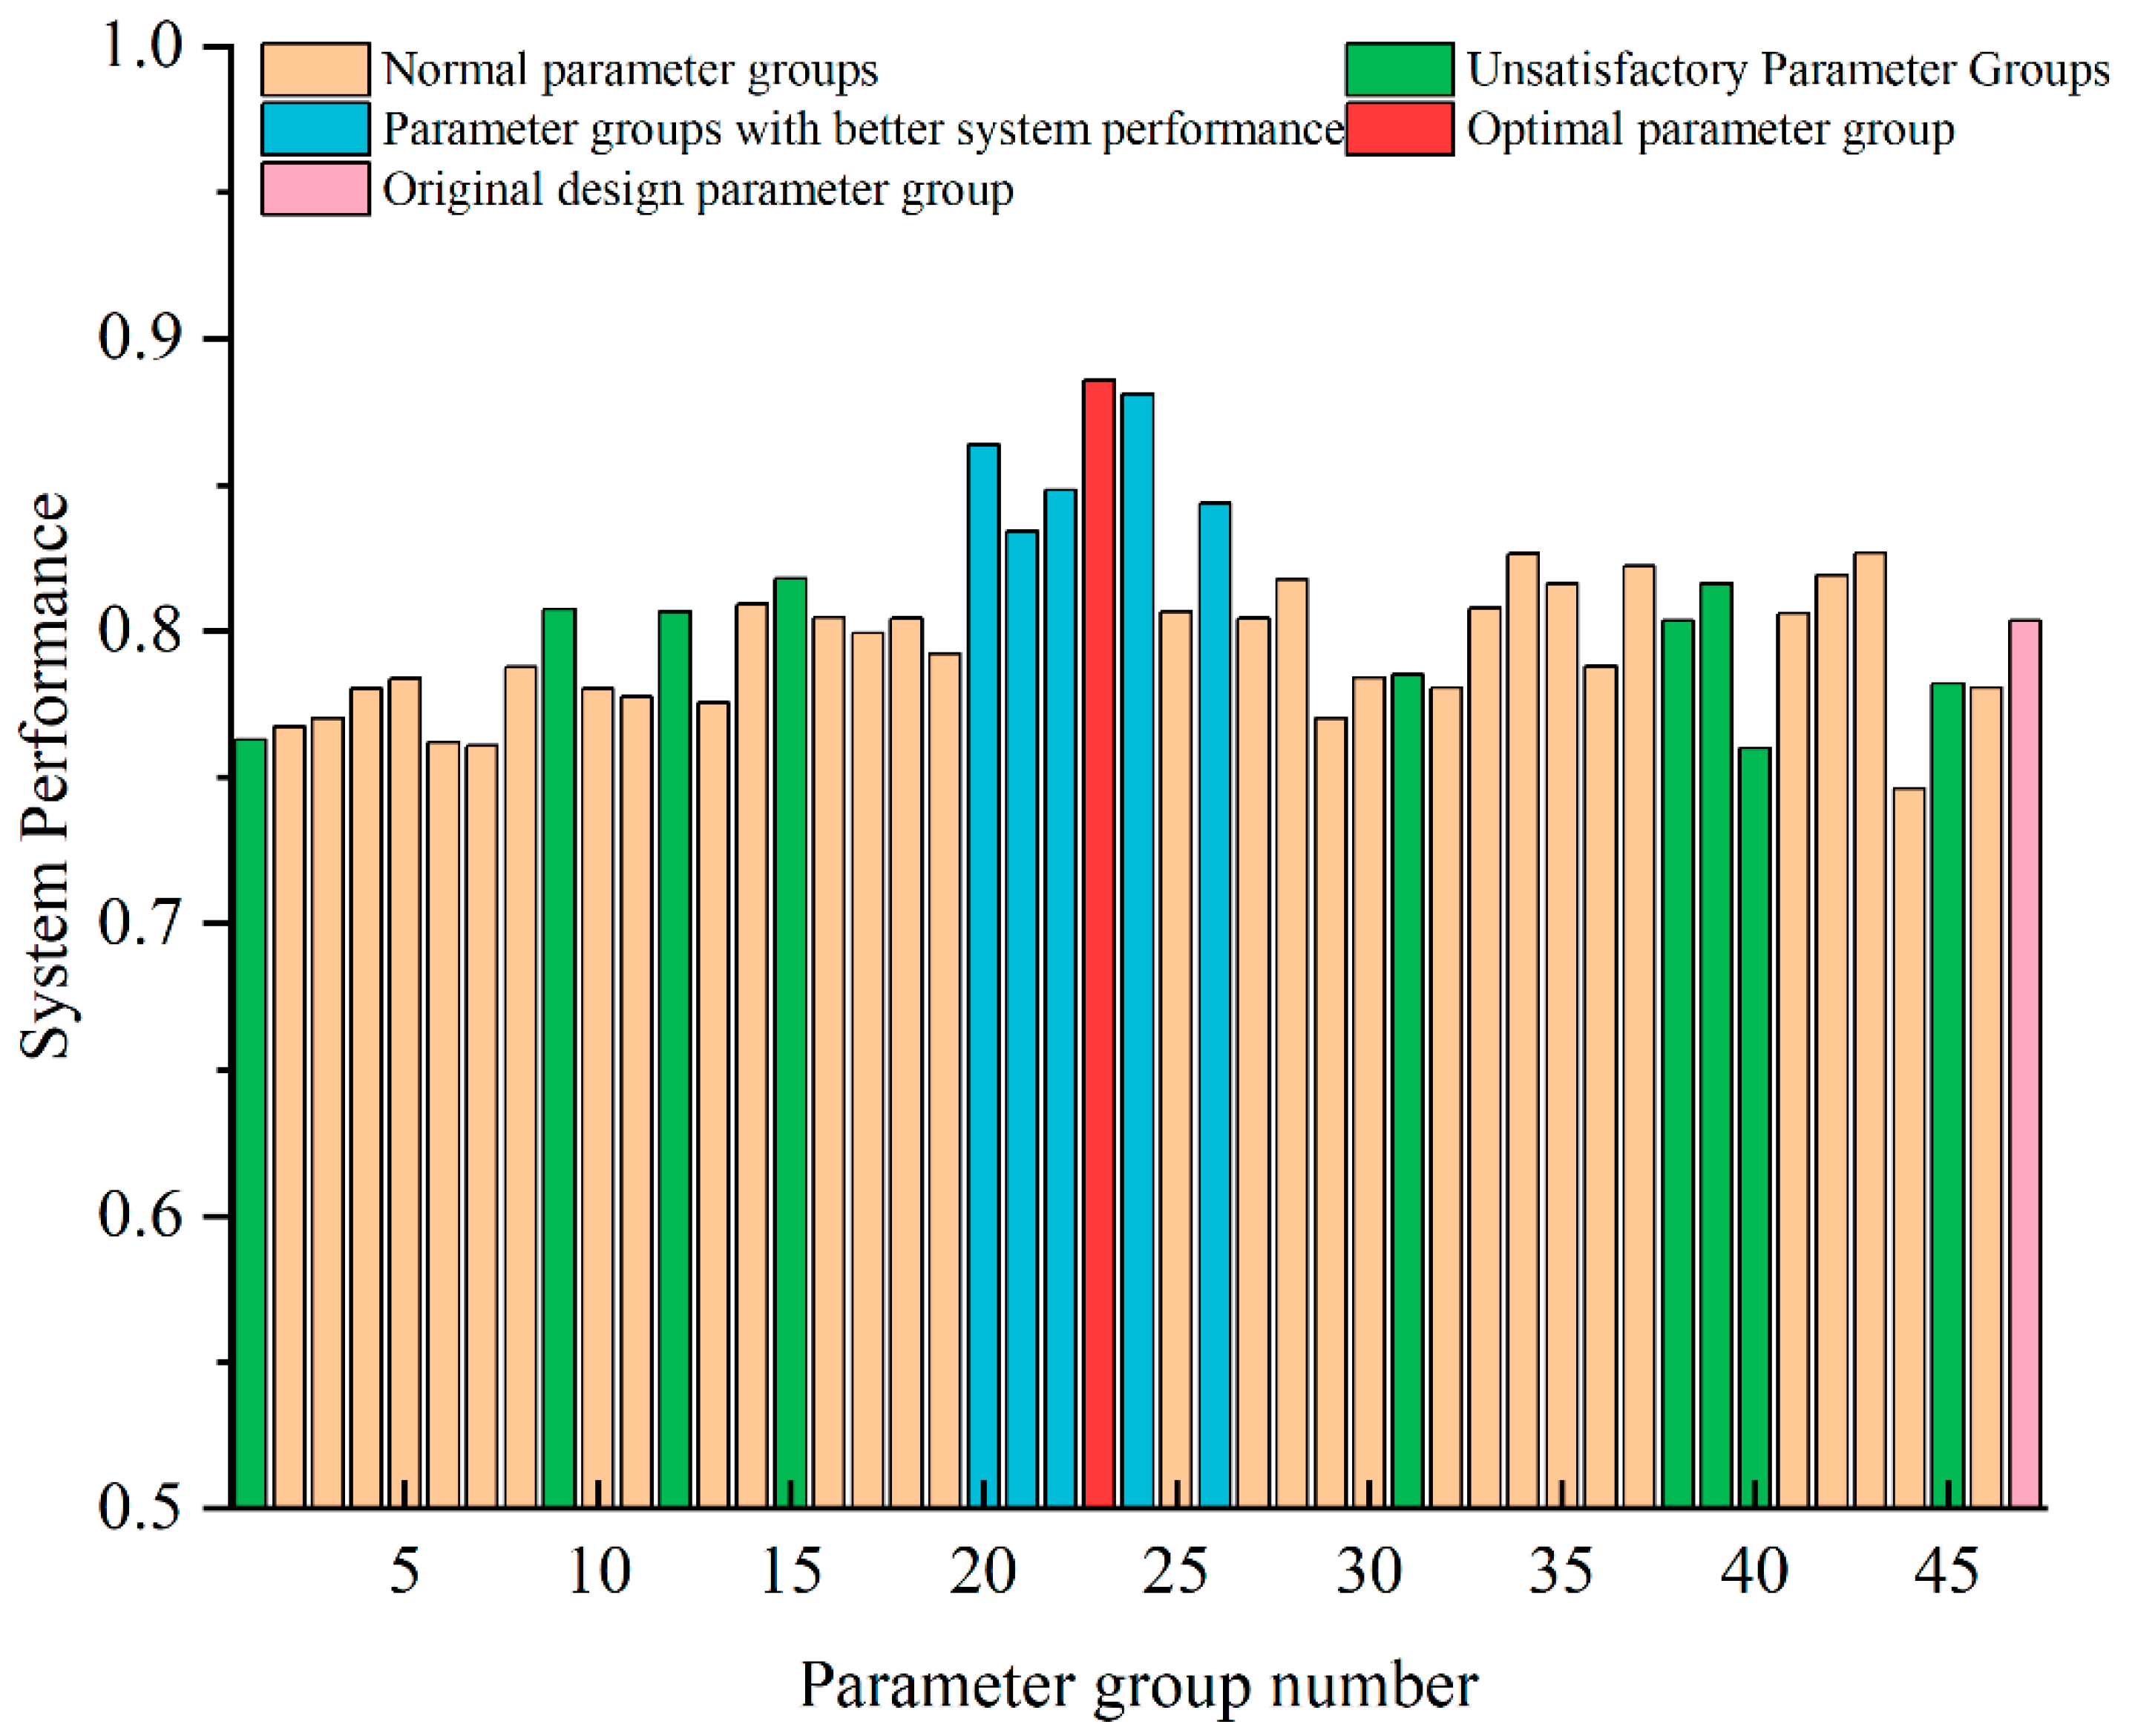
Figure 15 shows the optimization results of system performance for each optimized parameter group, as well as the original parameter group. It can be clearly seen that the optimization results of groups 20, 21, 22, 24, and 26 are much higher than the optimization results of the other parameter groups and better than the original design parameter group. Compared with the latter, the system performance for these groups is improved by 7%, 4%, 6%, 10%, and 5%, respectively.
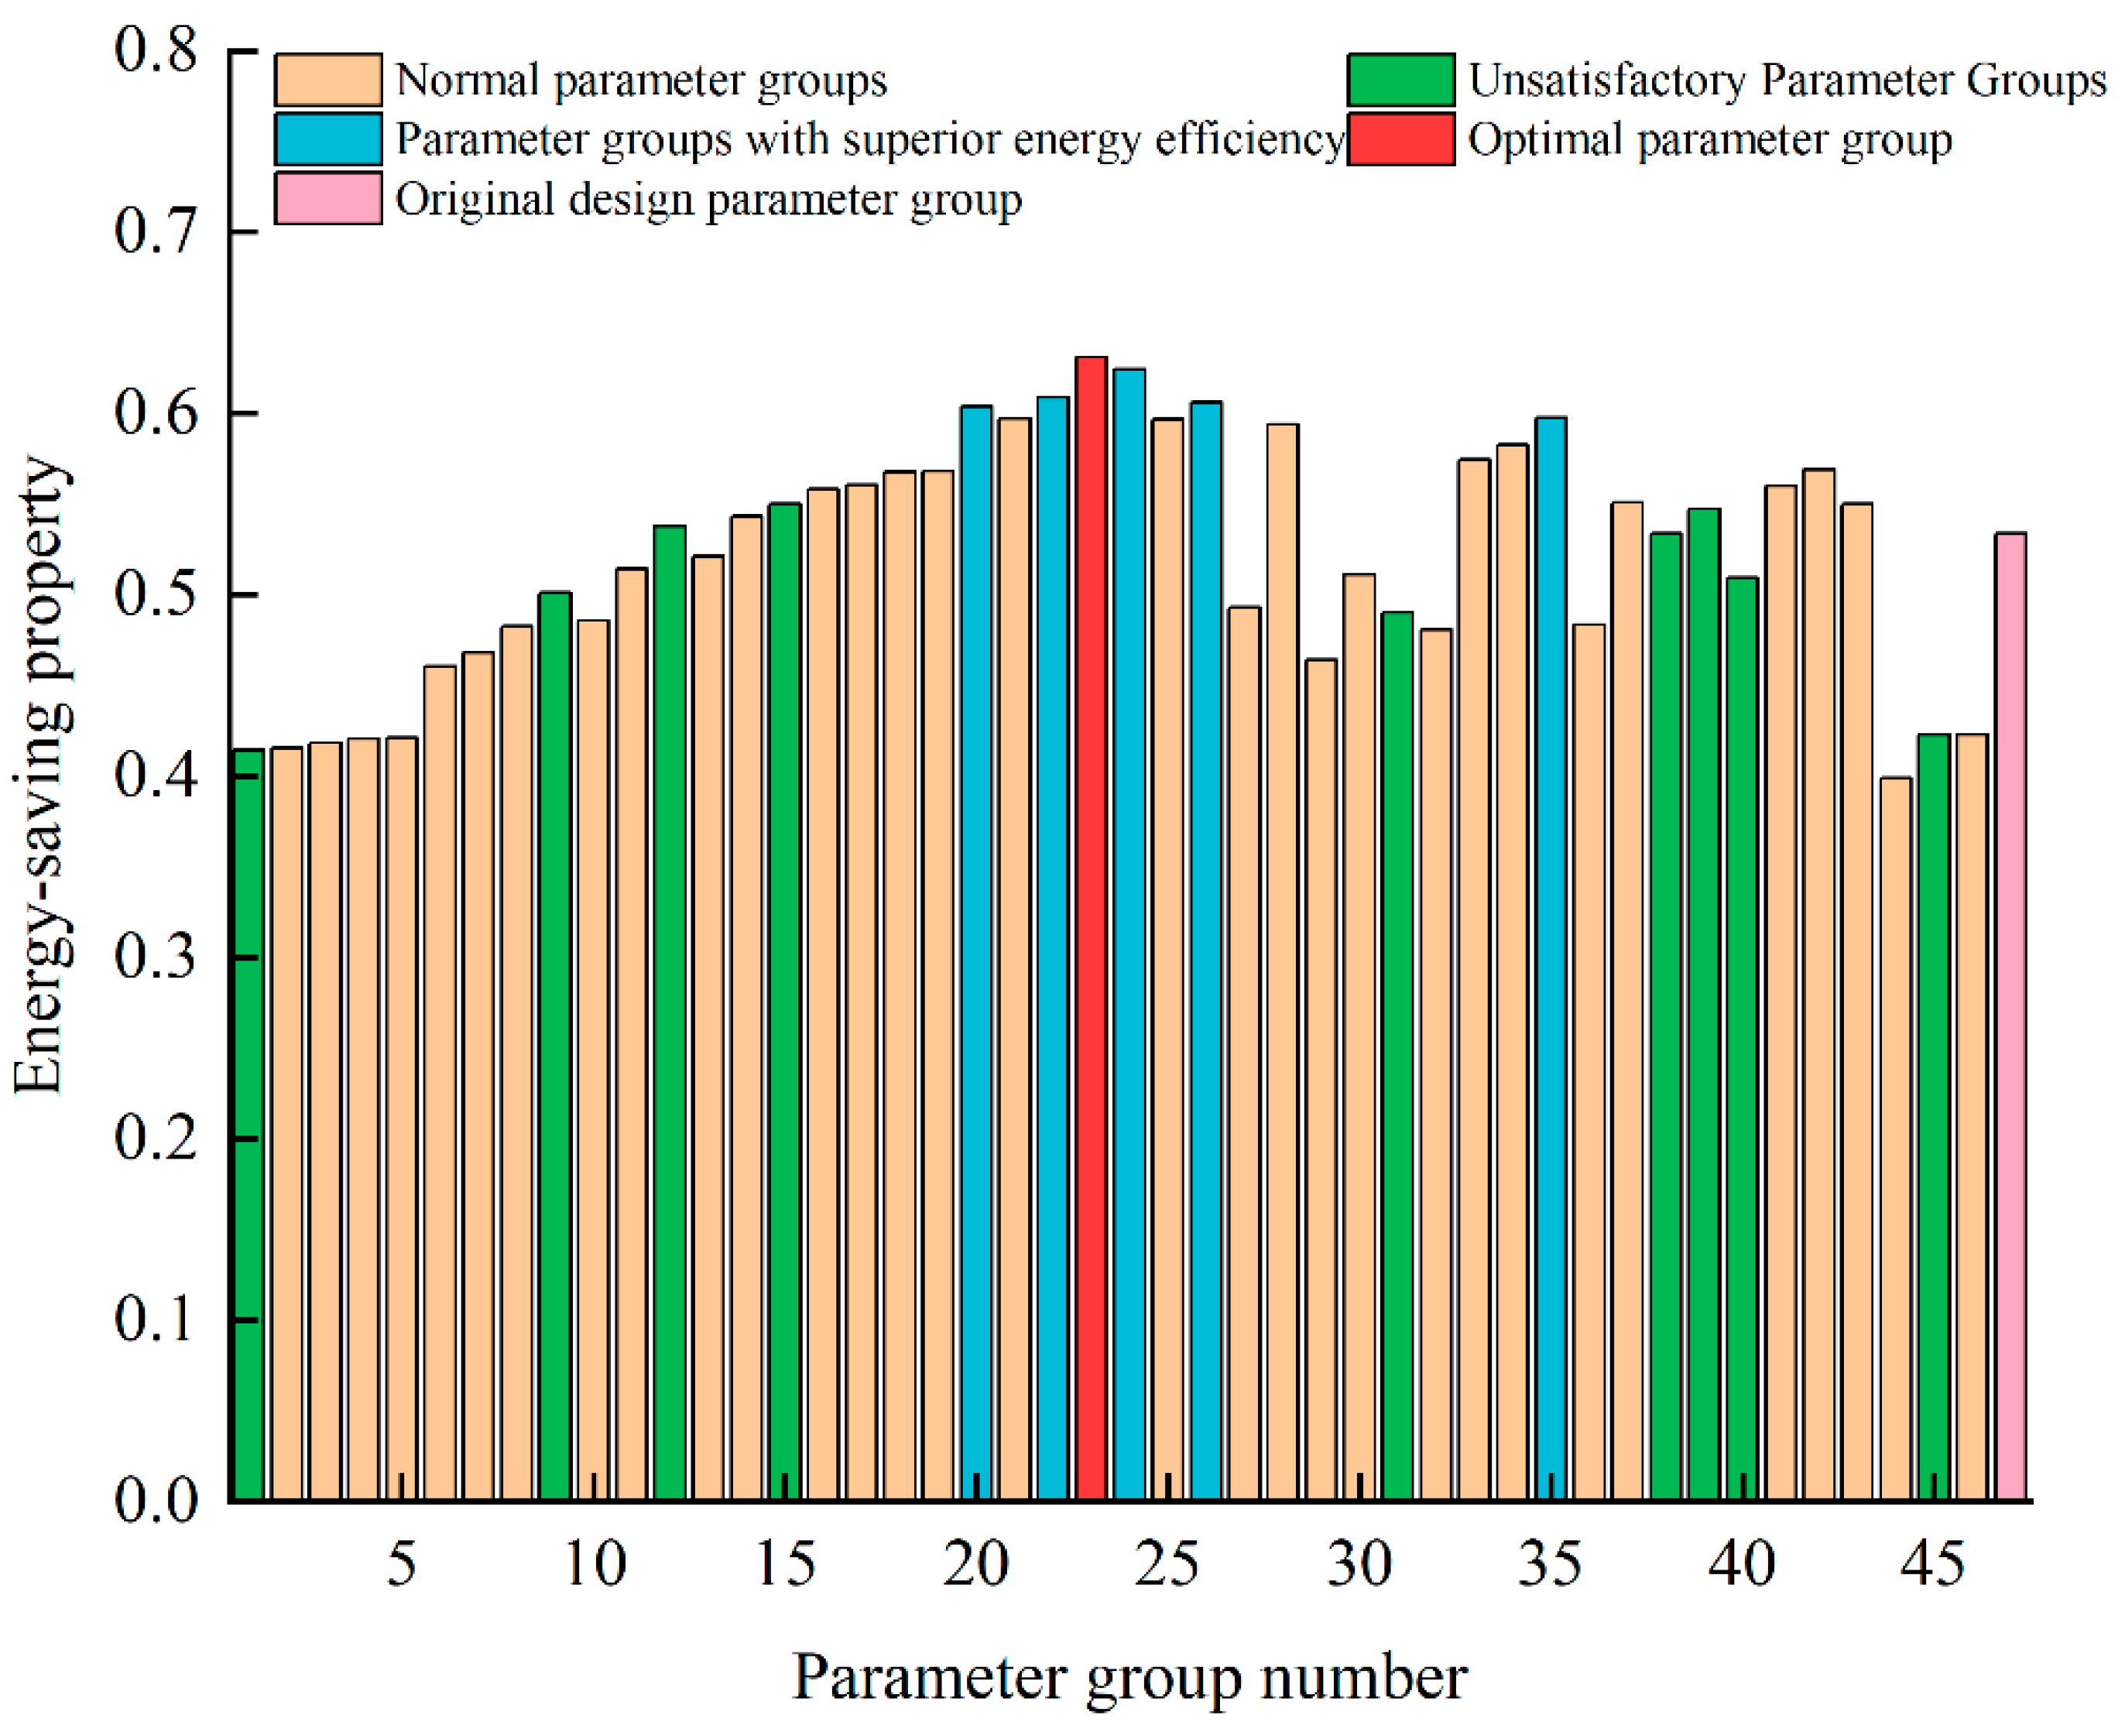
Figure 16 shows the optimization results of energy efficiency for each optimized parameter group, as well as the original parameter group. It can be clearly seen that the optimization results of groups 20, 22, 24, 26, and 35 are much higher than those of the other parameter groups and better than the original design parameter group. Compared with the latter, the energy efficiency for these groups is improved by 13%, 14%, 17%, 14%, and 12%, respectively.
It can be seen from the above analysis that the multi-objective optimization analysis of multi-energy complementary heating system performance using FAHP has obvious advantages. Through the rational design of the index system and arithmetic process, the scientificity and operability of decision-making, the ability to quantify fuzzy information, the flexibility of multi-factor integration and the adaptability of complex systems can all be improved, and the results are intuitive and interpretable.

9. Conclusions

A multi-objective optimization study of an SEHS with an integrated PCM tank is carried out by using TRNSYS 18 for different parameter sets separately; the optimized results are analyzed, and the following conclusions are obtained.
(1) The simulation results of 46 groups are input into the FAHP multi-objective optimization comprehensive objective function, which results in the minimum value of the objective function for parameter group 23. The values of the parameters of the optimal objective function are as follows: a collector area of 32 m2, a collector inclination angle of 51.48°, a water volume in the tank of 3.5 m3, a volume of PCM of 0.15 m3, a rated power of the electromagnetic heater of 15 kW, a circulating pump flow rate of the collector of 1550 m3/h, a circulating water pump flow rate of the electromagnetic heater of 3860 m3/h, and a circulating water pump flow rate of the user side of 1130 m3/h. This parameter set can better meet the building heating demand.
(2) In addition to the minimum objective function as the basis for optimization, in this study, we also consider the comfort factor. The parameter groups with indoor temperature fluctuations greater than 20% compared with the initial design value and a number of hours in which the set temperature is not met greater than 120 h are regarded as not satisfying the design requirements. Even if there is a parameter group with a lower objective function value, if it does not meet the comfort requirements, it cannot be used as an optimized design solution.
(3) Compared with the initial design values, the optimal combination of system values improves the overall performance by 38%, the room temperature fluctuation by 17%, the economic costs by 2.2%, system performance by 10.24%, and energy efficiency by 18.23%.
This study demonstrates that the FAHP method can be used to conduct multi-objective decision-making for coupled heating systems in a simple and efficient manner, thereby achieving their optimal design. It holds significant engineering significance and provides guidance for optimizing the design parameters of coupled heating systems. Although this method effectively realizes the system optimization function, its dynamic adaptability is limited. In the future, it is necessary to consider introducing time-varying weights or combining it with machine learning (such as fuzzy neural networks) to enhance the real-time optimization capability. Additionally, future work should also focus on ensuring the effective deployment and execution of the optimization strategy. This requires focusing on the collaboration between the optimization layer and the underlying execution system, and conducting in-depth research on the communication architecture and control strategies for real-time optimization decisions. Such research must address the challenges of instantaneity, reliability, and precise control in complex coupled systems, thereby significantly improving their intelligent operation level.

Supplementary Materials

The following supporting information can be downloaded at: https://www.mdpi.com/article/10.3390/en18143712/s1.

Author Contributions

Conceptualization, N.H.; methodology, G.F.; software, N.H. and S.C.; validation, N.H. and S.C.; data curation, Y.C.; writing—original draft preparation, N.H.; writing—review and editing, N.H.; supervision, G.F.; project administration, G.F.; funding acquisition, N.H. and X.L. All authors have read and agreed to the published version of the manuscript.

Funding

This research was funded by the Liaoning Provincial Department of Education Basic Research Program grant number [JYTMS20231575], Liaoning Provincial Department of Education Basic Research Program grant number [JYTQN2023388] and Liaoning Provincial Science and Technology Program Joint Program grant number [1731638045577]. And APC was funded by [JYTMS20231575].

Data Availability Statement

The data presented in this study are available on request from the corresponding author.

Conflicts of Interest

The authors declare no conflict of interest.

Abbreviations

FAHPfuzzy analytic hierarchy process
SEHSsolar-electromagnetic energy heating system
ASHPair source heat pumps
SASHPsolar energy and air source heat pump
SGSHPsolar energy and ground source heat pumps
GSHPground source heat pump
PCMphase change material
Nomenclature
Toutthe vacuum tube collector outlet temperature
Tinthe bottom temperature of the PCM water tank
Ttankthe average tank temperature
C I is the matrix consistency index
C is the formula for the installation cost and operating cost
C O P is the system heating performance coefficient
f t is the solar contribution rate, %
P E R is the primary energy utilization rate, %
s 2 is the variance of room temperature fluctuation
g t is the penalty function for the length of time that the heating temperature demand is not met
A is the area of solar collector, m2
V T A N K is the volume of heat storage tank, m3
V P C M is the volume of phase change material, m3
ρ P C M is the density of PCM, kg/m3
Q E is the rated power of electromagnetic heater, kW
P is the unit price of water pump, yuan
L is the installation cost of the equipment, 10% of the total equipment cost
Y d is the system power consumption during the day, Yuan/kW·h
Y n is the system power consumption at night, Yuan/kW·h
Q d is the daytime power consumption of the system, kW·h
Q n is the nighttime power consumption of the system, kW·h
Q 1 is the daytime power consumption of collector circulation pump, kW·h
Q 2 is the daytime power consumption of electromagnetic heater circulation pump, kW·h
Q 3 is the daytime power consumption of user-side circulation pump, kW·h
Q 4 is the daytime power consumption of electromagnetic heater, kW·h
Q 1 is the nighttime power consumption of collector, kW·h
Q 2 is the electromagnetic heater’s daytime power consumption, kW·h
Q 3 is the user side circulating pump’s nighttime power consumption, kW·h
Q 4 is the electromagnetic heater’s nighttime power consumption, kW·h
Q S is the heat absorbed by the collector, kW
I T is the product of radiation intensity per unit area, kW/m2
Q C is the total heat supply of the system, kW·h
W C is the total power consumption of the system
Greek Symbols
ω i is the weight coefficient of the i th row of the matrix
a i j is the element of the i th row and the j th column of the matrix;
λ max is the maximum characteristic root
η s The solar collector efficiency
η f is the power plant power supply efficiency
η w is the grid transmission efficiency
η y is the compressor motor efficiency

References

  1. Chen, L.; Zhang, J.; Zhang, X.; Liu, H. A New Low-Carbon Project Scheduling Problem with Renewable and Traditional Energy: A Comprehensive Analysis and Its Solution. J. Clean. Prod. 2024, 468, 143089. [Google Scholar] [CrossRef]
  2. Mendonça, M.; Santos, V. Advancing Sustainable Energy Solutions: AI Hybrid Renewable Energy Systems with Hybrid Optimization Algorithms and Multi-Objective Optimization in Portugal. J. Clean. Prod. 2025, 511, 145564. [Google Scholar] [CrossRef]
  3. Aridi, R.; Aridi, M.; Pannier, M.-L.; Lemenand, T. Eco-Environmental, and Social Impacts of Producing Electricity with Various Renewable Energy Sources. Energy 2025, 320, 135139. [Google Scholar] [CrossRef]
  4. Tong, X.; Zhao, S.; Chen, H.; Wang, X.; Liu, W.; Sun, Y.; Zhang, L. Optimal Dispatch of a Multi-Energy Complementary System Containing Energy Storage Considering the Trading of Carbon Emission and Green Certificate in China. Energy 2025, 314, 134215. [Google Scholar] [CrossRef]
  5. Liu, L.; Gao, J.; Luo, Z.; Liu, J.; Wang, L.; Yuan, Y. Field Investigation of Indoor Air Quality and Its Association with Heating Lifestyles among Older People in Severe Cold Rural China. J. Build. Eng. 2024, 95, 110086. [Google Scholar] [CrossRef]
  6. Yuan, P.; Duanmu, L.; Wang, Z. Coal Consumption Prediction Model of Space Heating with Feature Selection for Rural Residences in Severe Cold Area in China. Sustain. Cities Soc. 2019, 50, 101643. [Google Scholar] [CrossRef]
  7. Du, B.; Hu, E.; Kolhe, M. An Experimental Platform for Heat Pipe Solar Collector Testing. Renew. Sust. Energy Rev. 2013, 17, 119–125. [Google Scholar] [CrossRef]
  8. Cardemil, J.M.; Starke, A.R.; Colle, S. Multi-Objective Optimization for Reducing the Auxiliary Electric Energy Peak in Low Cost Solar Domestic Hot-Water Heating Systems in Brazil. Sol. Energy 2018, 163, 486–496. [Google Scholar] [CrossRef]
  9. Leckner, M.; Zmeureanu, R. Life Cycle Cost and Energy Analysis of a Net Zero Energy House with Solar Combisystem. Appl. Energy 2011, 88, 232–241. [Google Scholar] [CrossRef]
  10. Tsalikis, G.; Martinopoulos, G. Solar Energy Systems Potential for Nearly Net Zero Energy Residential Buildings. Sol. Energy 2015, 115, 743–756. [Google Scholar] [CrossRef]
  11. Zhao, X.; Mu, H.; Li, N.; Kong, X.; Shi, X. Optimization Research on a Novel Community Integrated Energy System Based on Solar Energy Utilization and Energy Storage. Energies 2025, 18, 1151. [Google Scholar] [CrossRef]
  12. Vuong, E.; Fung, A.S.; Kumar, R. Performance Enhancement of a Building-Integrated Photovoltaic/Thermal System Coupled with an Air Source Heat Pump. Energies 2024, 18, 12. [Google Scholar] [CrossRef]
  13. Fan, Y.; Zhao, X.; Han, Z.; Li, J.; Badiei, A.; Akhlaghi, Y.G.; Liu, Z. Scientific and Technological Progress and Future Perspectives of the Solar Assisted Heat Pump (SAHP) System. Energy 2021, 229, 120719. [Google Scholar] [CrossRef]
  14. Cao, Y.; Chen, Y.; Ren, P.; Wang, D.; Zhuang, Z.; Zhou, W. Modeling and Performance Analysis of Solar Energy and Biogas Complementary Heating System in Rural Areas. Appl. Therm. Eng. 2025, 271, 126283. [Google Scholar] [CrossRef]
  15. Li, J.; Qu, C.; Li, C.; Liu, X.; Novakovic, V. Technical and Economic Performance Analysis of Large Flat Plate Solar Collector Coupled Air Source Heat Pump Heating System. Energy Build. 2022, 277, 112564. [Google Scholar] [CrossRef]
  16. Long, T.; Qiao, Z.; Wang, M.; Li, Y.; Lu, J.; Li, W.; Zeng, L.; Huang, S. Performance Analysis and Optimization of a Solar-Air Source Heat Pump Heating System in Tibet, China. Energy Build. 2020, 220, 110084. [Google Scholar] [CrossRef]
  17. Li, Y.; Tang, Y.; Qiao, L.; Liu, M.; Chen, L.; Yuan, X.; Wang, Q.; Ma, Q. Is Solar Heating an Appropriate Choice in Rural Areas of Northern China? Evidence from Numerical Simulation and Life Cycle Assessment. Sci. Total. Environ. 2023, 904, 166382. [Google Scholar] [CrossRef]
  18. Gao, J.; Li, S.; Wu, F.; Jiang, L.; Zhao, Y.; Zhang, X. Study on Efficient Heating Method by Solar Coupled Air Source Heat Pump System with Phase Change Heat Storage in Severe Cold Region. Appl. Energy 2024, 367, 123206. [Google Scholar] [CrossRef]
  19. Chen, H.; Wang, Y.; Li, J.; Cai, B.; Zhang, F.; Lu, T.; Yang, J.; Jiang, L.; Zhang, Y.; Zhou, J. Experimental Research on a Solar Air-Source Heat Pump System with Phase Change Energy Storage. Energy Build. 2020, 228, 110451. [Google Scholar] [CrossRef]
  20. Mun, H.-S.; Dilawar, M.A.; Mahfuz, S.; Ampode, K.M.B.; Chem, V.; Kim, Y.-H.; Moon, J.-P.; Yang, C.-J. Effects of a Combined Geothermal and Solar Heating System as a Renewable Energy Source in a Pig House and Estimation of Energy Consumption Using Artificial Intelligence-Based Prediction Model. Animals 2022, 12, 2860. [Google Scholar] [CrossRef]
  21. Yang, X.; Sun, D.; Li, J.; Yu, C.; Deng, Y.; Yu, B. Demonstration Study on Ground Source Heat Pump Heating System with Solar Thermal Energy Storage for Greenhouse Heating. J. Energy Storage 2022, 54, 105298. [Google Scholar] [CrossRef]
  22. Rad, F.M.; Fung, A.S.; Leong, W.H. Feasibility of Combined Solar Thermal and Ground Source Heat Pump Systems in Cold Climate, Canada. Energy Build. 2013, 61, 224–232. [Google Scholar] [CrossRef]
  23. Liu, X.; Wu, Y.; Li, H.; Zhou, H. Design and Development of Pilot Plant Applied to Wind and Light Abandonment Power Conversion: Electromagnetic Heating of Solid Particles and Steam Generator. J. Clean. Prod. 2024, 470, 143313. [Google Scholar] [CrossRef]
  24. Wang, B.; Yan, M. Research on the Heating Effect Evaluation of the Electromagnetic Induction Heating System at Low Temperature Based on the Electrochemical-Thermal Coupling Model. J. Energy Storage 2024, 87, 111348. [Google Scholar] [CrossRef]
  25. Wang, B.; Yan, M. The Heating Effect Analysis of Electromagnetic Induction Heating System Based on the Multi Objective Optimization Strategy. J. Energy Storage 2025, 105, 114705. [Google Scholar] [CrossRef]
  26. Bellos, E.; Tzivanidis, C. Multi-Objective Optimization of a Solar Assisted Heat Pump-Driven by Hybrid PV. Appl. Therm. Eng. 2019, 149, 528–535. [Google Scholar] [CrossRef]
  27. Guo, F.; Li, Y.; Xu, Z.; Qin, J.; Long, L. Multi-Objective Optimization of Multi-Energy Heating Systems Based on Solar, Natural Gas, and Air- Energy. Sustain. Energy Techn. 2021, 47, 101394. [Google Scholar] [CrossRef]
  28. Sun, C.; Ju, X.; Hao, W.; Lu, Y. Research on Multi-Objective Optimization of Control Strategies and Equipment Parameters for a Combined Heating System of Geothermal and Solar Energy in Cold and Arid Regions Based on TRNSYS. Case. Stud. Therm. Eng. 2023, 50, 103441. [Google Scholar] [CrossRef]
  29. Chang, S.; Feng, G.; Zhang, L.; Huang, K.; Li, A. Multi-Objective Optimization of a Photovoltaic Thermal Curtain Wall Assisted Dual-Source Heat Pump System. Appl. Therm. Eng. 2023, 222, 119845. [Google Scholar] [CrossRef]
  30. Konis, K.; Gamas, A.; Kensek, K. Passive Performance and Building Form: An Optimization Framework for Early-Stage Design Support. Sol. Energy 2016, 125, 161–179. [Google Scholar] [CrossRef]
  31. Wu, R.; Mavromatidis, G.; Orehounig, K.; Carmeliet, J. Multiobjective Optimisation of Energy Systems and Building Envelope Retrofit in a Residential Community. Appl. Energy 2017, 190, 634–649. [Google Scholar] [CrossRef]
  32. Da Cunha, R.A.; Rangel, L.A.D.; Rudolf, C.A.; Santos, L.D. A Decision Support Approach Employing the PROMETHEE Method and Risk Factors for Critical Supply Assessment in Large-Scale Projects. Oper. Res. Perspect. 2022, 9, 100238. [Google Scholar] [CrossRef]
  33. Liu, Y.; Eckert, C.M.; Earl, C. A Review of Fuzzy AHP Methods for Decision-Making with Subjective Judgements. Expert Syst. Appl. 2020, 161, 113738. [Google Scholar] [CrossRef]
  34. Govindan, K.; Jepsen, M.B. ELECTRE: A Comprehensive Literature Review on Methodologies and Applications. Eur. J. Oper. Res. 2016, 250, 1–29. [Google Scholar] [CrossRef]
  35. Greco, S.; Słowiński, R.; Wallenius, J. Fifty Years of Multiple Criteria Decision Analysis: From Classical Methods to Robust Ordinal Regression. Eur. J. Oper. Res. 2025, 323, 351–377. [Google Scholar] [CrossRef]
  36. Sepahi, N.; Ilinca, A.; Rousse, D.R. Multi-Criteria Decision Analysis for Evaluating Carbon Capture Technologies in Power Plants. Renew. Sust. Energy Rev. 2025, 219, 115699. [Google Scholar] [CrossRef]
  37. Theilig, K.; Vollmer, M.; Lang, W.; Albus, J. Multi-Criteria Decision-Making for Energy Building Renovation: Comparing Exterior Wall Structures with the AHP, ANP, Utility Analysis, and TOPSIS. Build. Environ. 2025, 280, 113075. [Google Scholar] [CrossRef]
  38. Qin, G.; Zhang, M.; Yan, Q.; Xu, C.; Kammen, D.M. Comprehensive Evaluation of Regional Energy Internet Using a Fuzzy Analytic Hierarchy Process Based on Cloud Model: A Case in China. Energy 2021, 228, 120569. [Google Scholar] [CrossRef]
  39. Hou, J.; Gao, T.; Yang, Y.; Wang, X.; Yang, Y.; Meng, S. Battery Inconsistency Evaluation Based on Hierarchical Weight Fusion and Fuzzy Comprehensive Evaluation Method. J. Energy Storage 2024, 84, 110878. [Google Scholar] [CrossRef]
  40. Guo, T.; Tang, S.; Sun, J.; Gong, F.; Liu, X.; Qu, Z.; Zhang, W. A Coupled Thermal-Hydraulic-Mechanical Modeling and Evaluation of Geothermal Extraction in the Enhanced Geothermal System Based on Analytic Hierarchy Process and Fuzzy Comprehensive Evaluation. Appl. Energy 2020, 258, 113981. [Google Scholar] [CrossRef]
  41. Alexopoulos, D.K.; Anastasiadis, A.G.; Vokas, G.A.; Kaminaris, S.D.; Psomopoulos, C.S. Assessment of Flexibility Options in Electric Power Systems Based on Maturity, Environmental Impact and Barriers Using Fuzzy Logic Method and Analytic Hierarchy Process. Energy Rep. 2023, 9, 401–417. [Google Scholar] [CrossRef]
  42. Han, Z.; Ge, Y.; Dong, H.; Wang, L.; Sun, T. Multi-Dimensional Value Evaluation for Power-to-Hydrogen Technology Based on Fuzzy Analytic Hierarchy Process. Energy Rep. 2023, 9, 478–484. [Google Scholar] [CrossRef]
  43. Ebrahimi, M.; Keshavarz, A. Prime Mover Selection for a Residential Micro-CCHP by Using Two Multi-Criteria Decision-Making Methods. Energy. Build. 2012, 55, 322–331. [Google Scholar] [CrossRef]
  44. Zhang, Y.; Shang, K. Evaluation of Mine Ecological Environment Based on Fuzzy Hierarchical Analysis and Grey Relational Degree. Environ. Res. 2024, 257, 119370. [Google Scholar] [CrossRef]
  45. Shoeibi, S.; Jamil, F.; Parsa, S.M.; Mehdi, S.; Kargarsharifabad, H.; Mirjalily, S.A.A.; Guo, W.; Ngo, H.H.; Ni, B.-J.; Khiadani, M. Recent Advancements in Applications of Encapsulated Phase Change Materials for Solar Energy Systems: A State of the Art Review. J. Energy Storage 2024, 94, 112401. [Google Scholar] [CrossRef]
  46. Li, J.; Li, X.; Wang, Y.; Tu, J. Long-Term Performance of a Solar Water Heating System with a Novel Variable-Volume Tank. Renew. Energy 2021, 164, 230–241. [Google Scholar] [CrossRef]
  47. GB_T50824-2013; Design Standard for Energy Efficiency of Rural Residential Buildings. China Architecture & Building Press: Beijing, China, 2013.
  48. Feng, G.; Wang, G.; Li, Q.; Zhang, Y.; Li, H. Investigation of a Solar Heating System Assisted by Coupling with Electromagnetic Heating Unit and Phase Change Energy Storage Tank: Towards Sustainable Rural Buildings in Northern China. Sustain. Cities Soc. 2022, 80, 103449. [Google Scholar] [CrossRef]
Figure 1. System schematic diagram.
Energies 18 03712 g001
Figure 2. System control logic diagram.
Energies 18 03712 g002
Figure 3. TRNSYS simulation model diagram.
Energies 18 03712 g003
Figure 4. Flowchart for determining indicator weights.
Energies 18 03712 g004
Figure 5. Building plan.
Energies 18 03712 g005
Figure 6. Photographs of actual coupled heating system construction.
Energies 18 03712 g006
Figure 7. Simulation model of a rural residence in Shenyang.
Energies 18 03712 g007
Figure 8. Hour-by-hour heat load during the heating period in the rural residence.
Energies 18 03712 g008
Figure 9. Comparison of loads of similar buildings.
Energies 18 03712 g009
Figure 10. Comparison of measured and simulated supply and return water temperatures.
Energies 18 03712 g010
Figure 11. The weights of the indicator system.
Energies 18 03712 g011
Figure 12. Optimized objective function values.
Energies 18 03712 g012
Figure 13. Comparison of variance of room temperature fluctuation.
Energies 18 03712 g013
Figure 14. Comparison of costs optimization results.
Energies 18 03712 g014
Figure 15. Comparison of system performance optimization results.
Energies 18 03712 g015
Figure 16. Comparison of energy efficiency optimization results.
Energies 18 03712 g016
Table 1. Physical parameters of PCM.
Name of PCMMelting Point, (°C)Density, (kg/m3)Specific Heat Capacity, (kJ/(kg·°C))Latent Heat of Phase Change, (kJ/kg)Thermal Conductivity, (W/(m·K))
Paraffin458002.121700.151
Table 2. Comprehensive evaluation indicator system.
Target LevelFirst-Level IndicatorsSecondary Indicators
Objective function BCosts B1Installation cost B11
Running costs B12
System performance B2Performance factor B21
Collector efficiency B22
Energy efficiency B3Solar contribution B31
Primary energy utilization rate B32
Comfort B4Room temperature fluctuations B41
Length of time in which set temperature is not reached B42
Table 3. Mean random consistency (RI) metric table.
Determining Order of Matrix123456789101112
RI value000.580.901.121.241.321.411.451.491.511.54
Table 4. Thermal parameters of the building envelope.
FrameworkMaterial (Which Sth Is Made of)Heat Transfer Coefficient W/(m(2)-K)
External wallEPS external insulation + clay bricks + internal insulation0.4
Interior wallClay tiles + gypsum board0.65
RoofConcrete + insulation0.25
ShutterDouble vacuum glass + broken bridge aluminum Alloy window frames2.0
Outdoor entranceStainless steel + double-insulated glass2.29
Outside door of roomLumber5.66
Table 5. Indicator evaluation matrix.
NormConsiderationsEvaluation Results
RareRather or Relatively GoodGeneralMediocre
Costs B1Installation cost B110.000.350.600.05
Running costs B120.250.350.300.10
System performance B2Performance factor B210.500.300.200.00
Collector efficiency B220.100.450.450.00
Energy efficiency B3Solar contribution B310.900.100.000.00
Primary energy utilization rate B320.250.450.300.00
Comfort B4Room temperature fluctuations B410.400.400.150.05
Length of time in which set temperature is not reached B420.150.450.300.10
Table 6. Costs judgment matrix.
ConsiderationsB11B12
B1114
B121/41
Table 7. System performance judgment matrix.
ConsiderationsB21B22
B2115
B221/51
Table 8. Energy efficiency judgment matrix.
ConsiderationsB31B32
B3113
B321/31
Table 9. Comfort judgment matrix.
ConsiderationsB41B42
B4111/3
B4231
Table 10. Comprehensive judgment matrix.
ConsiderationsCostsSystem PerformanceEnergy EfficiencyComfort
Costs1.00 5.01 5.11 5.19
System performance0.20 1.00 0.56 1.78
Energy efficiency0.20 1.78 1.00 2.10
Comfort0.19 0.56 0.48 1.00
Table 11. List of system optimization factors and levels.
ConsiderationsLevel (of Achievement, etc.)
12345
A: Collector area (m2)1620242832
B: Collector inclination (°)41.4846.4851.4856.4861.48
C: Volume of water in tank (m3)1.522.533.5
D: PCM volume (m3)0.10.150.20.250.3
E: Electromagnetic heater (kW)1517.52022.525
F: Collector’s circulating pump flow rate (kg/h)12501350145015501650
G: Electromagnetic heater’s circulating water pump flow rate (kg/h)32603460366038604060
H: User side’s circulating water pump flow rate (kg/h)10301130123013301430
Table 12. Table of orthogonal tests.
No.ABCDEFGHNo.ABCDEFGH
11641.481.50.115125032601030243256.483.50.220135032601430
21646.4820.1517.5135034601130253261.481.50.225135038601030
31651.482.50.220145036601230263246.483.50.1522.5125040601230
41656.4830.2522.5155038601330272061.4830.320145034601230
51661.483.50.325165040601430283246.482.50.125165036601330
62041.4820.222.5165032601130292041.483.50.2517.5165036601030
72046.481.50.2520125040601230302441.4830.1525125038601430
82051.4830.117.5135036601430312051.4820.115155040601230
92056.482.50.1515145034601030322056.4820.325155032601230
102061.481.50.1522.5155036601330332851.481.50.217.5145032601130
112441.482.50.2517.5155040601030342861.4820.220125034601030
122446.4830.215165038601230353251.4820.2520165038601330
132451.481.50.322.5135034601330362051.482.50.1517.5125038601330
142456.4820.120125036601130372461.482.50.117.5135040601130
152461.4820.2515145032601430382446.4830.215155034601430
162841.4830.1520135032601230392451.4830.315165040601030
172846.482.50.122.5145038601430402441.481.50.315145038601330
182851.4820.2525155034601130412841.482.50.2522.5135032601030
192856.481.50.217.5165040601330422846.483.50.1520165032601330
202861.482.50.315125036601130432456.483.50.117.5145040601230
213241.483.50.125145034601330441641.481.50.120155034601430
223246.4830.317.5125032601030451646.4830.2515135036601130
233251.483.50.1515155038601130461656.482.50.322.5165034601230
Disclaimer/Publisher’s Note: The statements, opinions and data contained in all publications are solely those of the individual author(s) and contributor(s) and not of MDPI and/or the editor(s). MDPI and/or the editor(s) disclaim responsibility for any injury to people or property resulting from any ideas, methods, instructions or products referred to in the content.

