Article

The Impact of Diesel Injection Strategy and In-Cylinder Temperature on the Combustion and Emissions of Ammonia/Diesel Dual-Fuel Marine Engine

1
Ningbo C.S.I. Power & Machinery Group Co., Ltd., Ningbo 315020, China
2
School of Mechanical Engineering, Guangxi University, Nanning 530004, China
3
College of Energy Engineering, Zhejiang University, Hangzhou 310027, China
*
Author to whom correspondence should be addressed.
These authors contributed equally to this work.
Energies 2025, 18(14), 3631; https://doi.org/10.3390/en18143631
Submission received: 12 June 2025 / Revised: 1 July 2025 / Accepted: 7 July 2025 / Published: 9 July 2025

Abstract

This study investigates the impact of different combustion control strategies on marine engine combustion and emission characteristics at a high ammonia energy ratio. Compared to the strategy of maintaining a constant fuel injection duration, the strategy of keeping the fuel injection pressure constant allows the kinetic energy of diesel to remain at a higher level. This results in an increase in combustion efficiency and indicated the thermal efficiency of the engine, while also reducing CO2 and soot emissions. However, when the ammonia energy ratio increases to more than 50%, the indicated thermal efficiency starts to decrease along with the increase in the emissions of N2O and unburned ammonia. To address these issues, one of the potential means is to improve the in-cylinder combustion environment by increasing the in-cylinder gas temperature. This can enhance combustion efficiency and ultimately optimize the performance and emission characteristics of dual-fuel engines, which results in an increase in the combustion efficiency to 98% and indicated thermal efficiency to 54.47% at a relatively high ammonia energy ratio of 60%. Emission results indicate that N2O emissions decrease from 1099 ppm to 25 ppm, while unburned ammonia emissions drop from 16016 ppm to 100 ppm. Eventually, the greenhouse gas emissions were reduced by about 85.3% in comparison with the baseline case.

1. Introduction

According to statistics from the International Energy Agency, CO2 emissions have been continuously rising since the Industrial Revolution. The increase in carbon emissions has led to a rise in the concentration of greenhouse gas (GHG) in the atmosphere, exacerbating the Earth’s greenhouse effect [1,2]. As a critical infrastructure for global trade, ships play an extremely important role in the transportation sector. Ships typically use petroleum-based fuels, which contain a large amount of carbon, leading to the emission of significant quantities of GHG and particulate matter (PM) [3]. Large ships require a substantial amount of fuel to maintain speed and range, thus contributing to increased carbon emissions [4,5]. Therefore, improvements to internal combustion (IC) engines are being implemented to reduce carbon emissions. The use of after-treatment technologies has effectively reduced the emissions of nitrogen oxides (NOx) and PM [6]. However, CO2 emissions have not been significantly minimized [2,7]. Entering the era of Industry 4.0, artificial intelligence is showing great potential for development in various fields. Artificial intelligence technologies are often used to optimize the prediction of fuel consumption and emission [8,9]. However, using low-carbon and zero-carbon fuels as alternatives to traditional fuels remains the primary method for addressing the high carbon emissions of marine IC engines [10,11].
Common low-carbon and zero-carbon fuels include biodiesel, liquefied natural gas (LNG), methanol, hydrogen, and ammonia [12,13]. Hydrogen and ammonia are representative zero-carbon fuels. Hydrogen, when fully combusted, only produces water, and ammonia’s combustion products are also just water and nitrogen gas [14]. In contrast, ammonia is better suited as an alternative fuel for ship engines. First, ammonia has much higher volumetric and gravimetric energy densities than hydrogen, meaning that for the same volume or mass, ammonia provides more energy [15]. Using ammonia as a fuel for ships can save storage space [16], and its storage and transportation systems are simpler and more cost-effective [17]. Therefore, ammonia has become the preferred alternative fuel for reducing engine carbon emissions. However, ammonia has high auto-ignition temperatures and slow flame propagation, which are the unique combustion characteristics that hinder the development of pure ammonia engines [18,19]. As a result, replacing a certain percentage of diesel with ammonia has become a practical solution, leading to the use of ammonia/diesel dual-fuel (ADDF) engines.
In recent years, there has been considerable research on ADDF engines [20,21]. Xu et al. [22] conducted both experimental and numerical studies on ADDF engines and found that when the energy fraction of diesel was too low, the engine’s CE significantly decreased. Experimental results from Wu et al. [23] indicated that as the AER increased, the proportion of high-reactivity fuel decreased, which made the combustion process more challenging. Yousefi et al. [24] studied the effects of different AER. Their results indicated that an increase in the AER led to a reduction in peak cylinder pressure, as well as a delay in the ignition timing and combustion phase. They also found that higher AER resulted in higher GHG emissions. To address this, they optimized the diesel fuel injection timing to ensure that, in addition to reducing GHG emissions, the ITE of the ADDF engine was close to that of a pure diesel mode. Previous studies have shown that fuel injection strategies have a significant impact on engine performance [25,26]. Other studies have also shown that the initial in-cylinder temperature has an impact on engine performance.
Currently, most research on ADDF engines are limited to small-bore engines, focusing mainly on the impact of injection strategies and other related factors. There is relatively little research on the effects of combustion control strategies under different AER for large-bore ADDF marine engines, as well as on optimizing engine performance at high AER, to the authors’ knowledge. This article investigates the effects of different combustion control strategies on the combustion and emissions of ADDF engines at varying AER, in order to extend the operating potential of ADDF marine engines to a higher AER. By optimizing the combustion control strategy, the goal is to improve the ITE of the ADDF engine while simultaneously reducing its emissions under high AER.

2. Experimental and Numerical Research Methods

2.1. Experimental Setup

The experimental data in this paper is derived from a large marine diesel engine model N21 developed by Ningbo C.S.I. Power & Machinery Group Co., Ltd., which located at Ningbo city, China. The main technical parameters of the engine are shown in Table 1.
In addition, measurement instruments are required to obtain the engine’s emission data. The detailed specifications of the measurement instruments used are shown in Table 2.

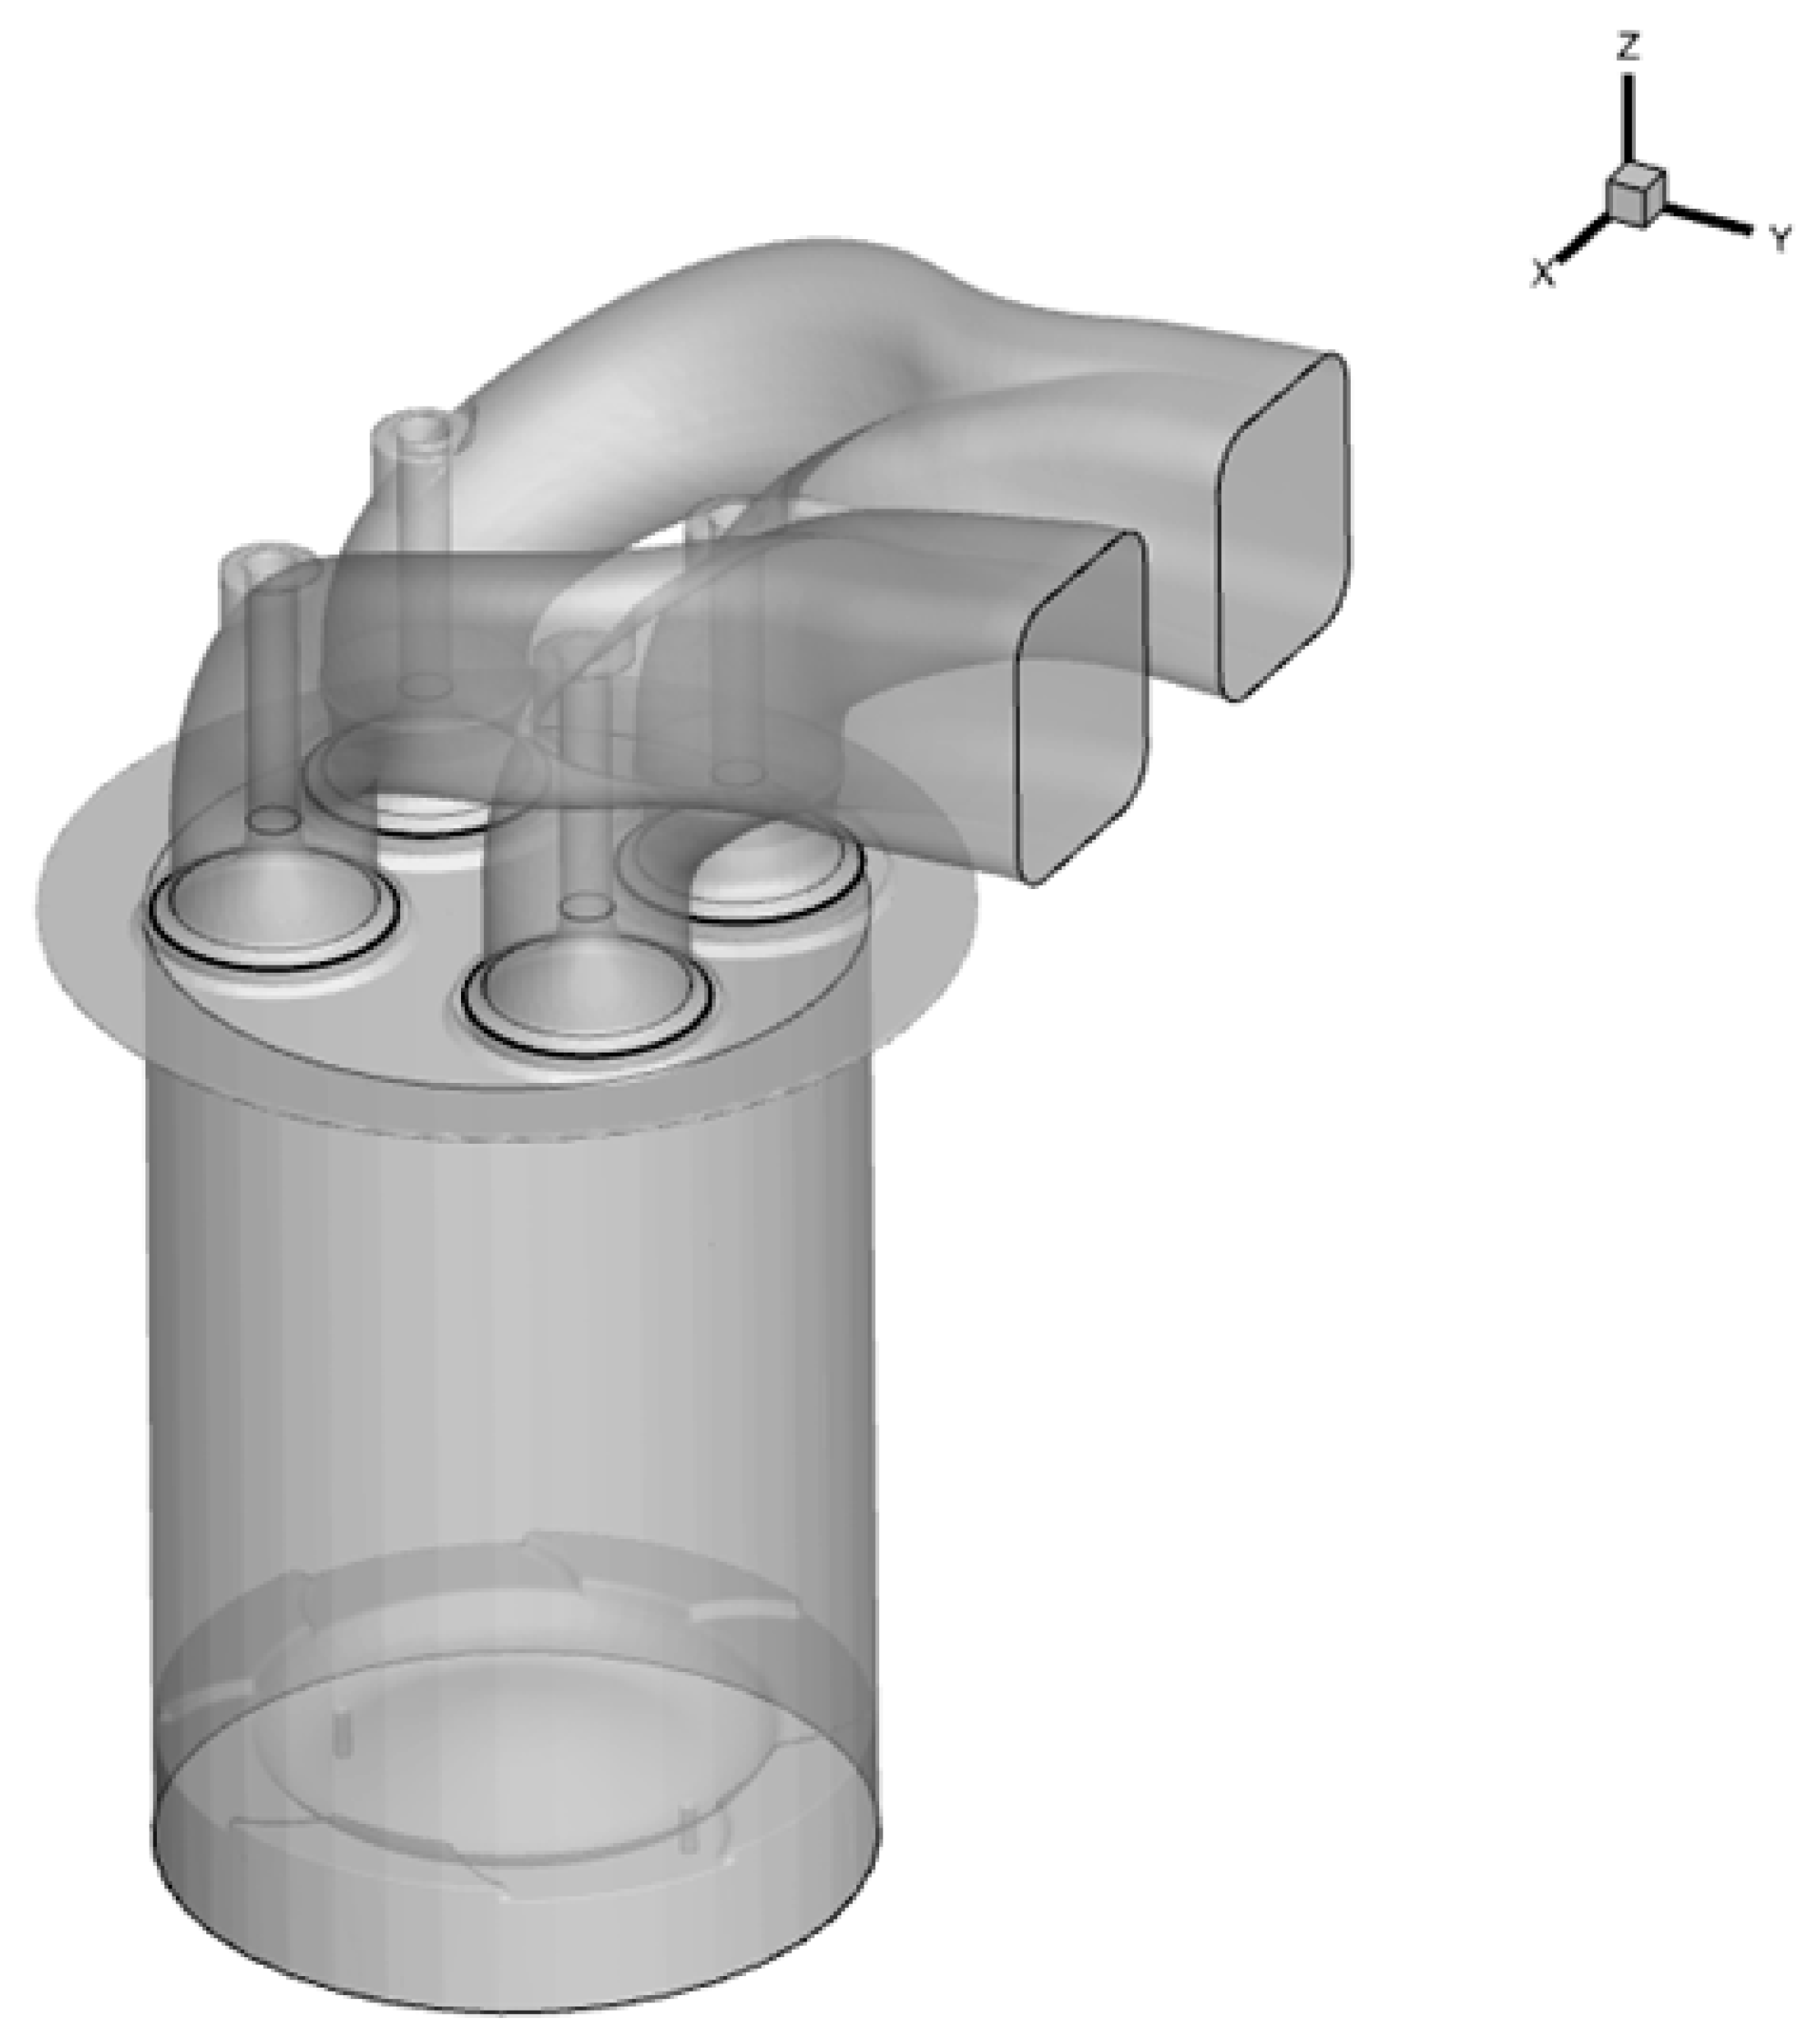
2.2. Simulation Models

This study uses simulation software CONVERGE to model the in-cylinder combustion process of the engine [27]. The completed 3D model is shown in Figure 1. Diesel is delivered into the cylinder via the injector, where it undergoes processes such as collision, evaporation, decomposition, and atomization. These processes are simulated using the built-in models of CONVERGE software. Droplet collision is simulated using the No-Time-Counter (NTC) method [28] and the Wall Film model [29], while the Frossling model is used to simulate the evaporation of diesel [30]. To simulate diesel decomposition and atomization, the Kelvin–Helmholtz/Rayleigh–Taylor model [31] is employed. Diesel is ignited when the combustion conditions are met [32].The combustion process is crucial, and a detailed chemical reaction solver, the SAGE model, is selected to compute the combustion process [33]. Since diesel has combustion characteristics very similar to n-heptane, the skeletal chemical kinetics mechanism for ammonia/n-heptane combustion proposed by Xu et al. [34] is used in this study. This mechanism includes 69 species and 389 chemical reactions and has been validated for accurately simulating ammonia/n-heptane combustion. To simulate the impact of turbulence in the combustion chamber, the Renormalization Group k-ε model is applied [35]. With this, the 3D model setup is complete.

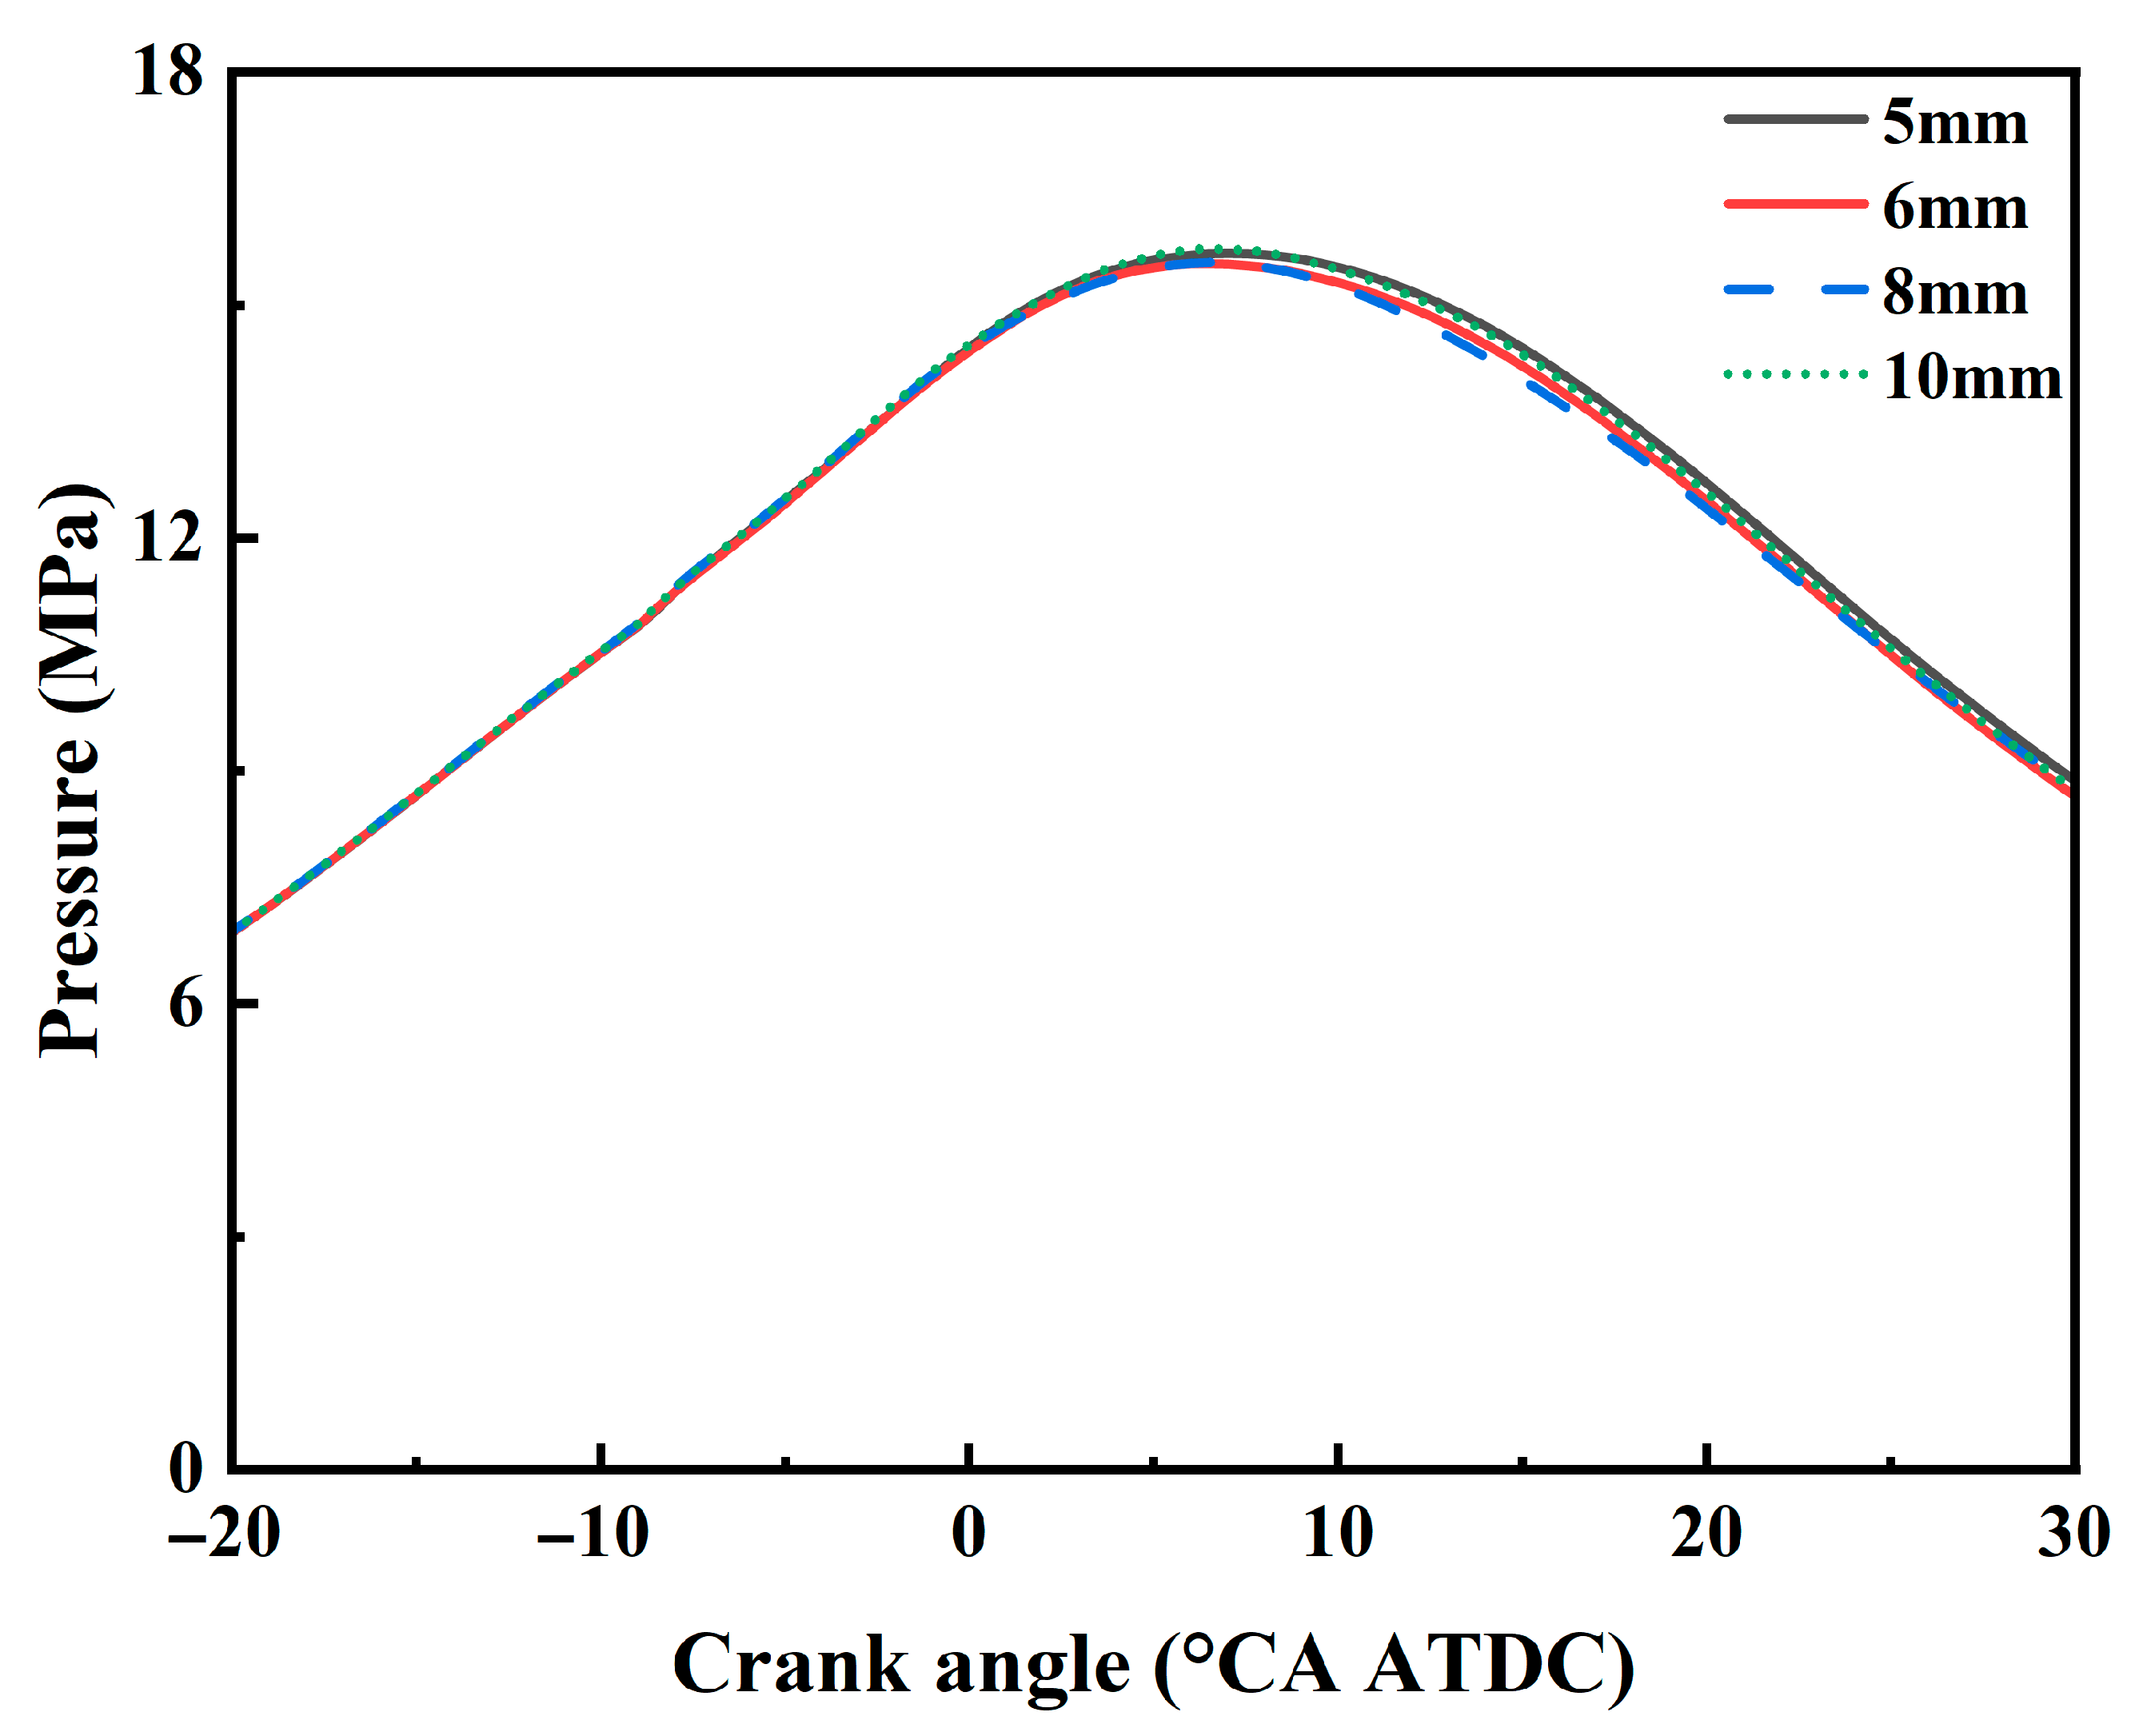
2.3. Model Validation

As shown in Figure 2, measurements of the model grid sizes were taken for three different sizes: 5 mm, 6 mm, 8 mm, and 10 mm. The in-cylinder pressure curves for 6 mm and 8 mm are similar, while there is a significant deviation in the curves for 5 mm, 10 mm, and 8 mm. After considering both the calculation cost and calculation accuracy, 8 mm is selected as the base grid size.
Validating the model is necessary to confirm its accuracy. Validation analysis is performed at engine loads of 75%. Figure 3 presents a comparison of the simulation results and experimental data. From the figure, the simulation results align closely with the experimental data. It is normal for some discrepancies to arise due to differences in the chemical reaction mechanism used and the simulation model compared to the actual experiments. Therefore, further research work can be carried out based on this foundation.

2.4. Data Processing

AER is determined by the following formula:
Ammonia   energy   ratio = M N × LHV N M N × LHV N + M D × LHV D × 100 %
In the formula, MN represents the mass of ammonia, and MD represents the mass of diesel; LHVN and LHVD are the lower heating values of ammonia and diesel, with values of 18.8 MJ/kg and 42.6 MJ/kg, respectively.
CA10, CA50, and CA90 represent the crank angle corresponding to 10%, 50%, and 90% of the total heat release, respectively. The duration of combustion is defined as the difference between CA90 and CA10. Ignition delay refers to the period from fuel injection to the start of combustion.
ITE and CE are calculated using Equations (2) and (3):
ITE = Indicated   power M N × LHV N + M D × LHV D × 100 %
CE = Q M N × LHV N + M D × LHV D × 100 %
In the formula, Indicated power refers to the engine’s indicated power, expressed in MJ, while Q represents the total heat released, also expressed in MJ.

2.5. Content of Simulation Calculations

This research first analyzes two different combustion control strategies under varying AER. The first strategy is Fixed Injection Duration (FID), where the injection duration stays fixed as the injection pressure varies. The second strategy is Fixed Injection Pressure (FIP), where the injection pressure remains constant while the injection duration varies. A comparative analysis of the combustion and emission characteristics of the two strategies is conducted. Further research and analysis are conducted based on the optimal strategy, that is, optimization is achieved by changing the initial temperature. This approach aims to improve the engine’s ITE while reducing emissions.
The simulation is conducted at 75% load. Table 3 presents the basic parameter settings of the model.
Table 4 presents Simulation Scheme 1, detailing the specific aspects of the FID and FIP strategies. With an increase in AER, proportionally shortening the diesel injection time can maintain a constant diesel injection pressure. Conversely, if the injection duration remains unchanged, the diesel injection pressure decreases as the AER increases.

3. Results and Analysis

3.1. Comparative Analysis of FID and FIP Strategies

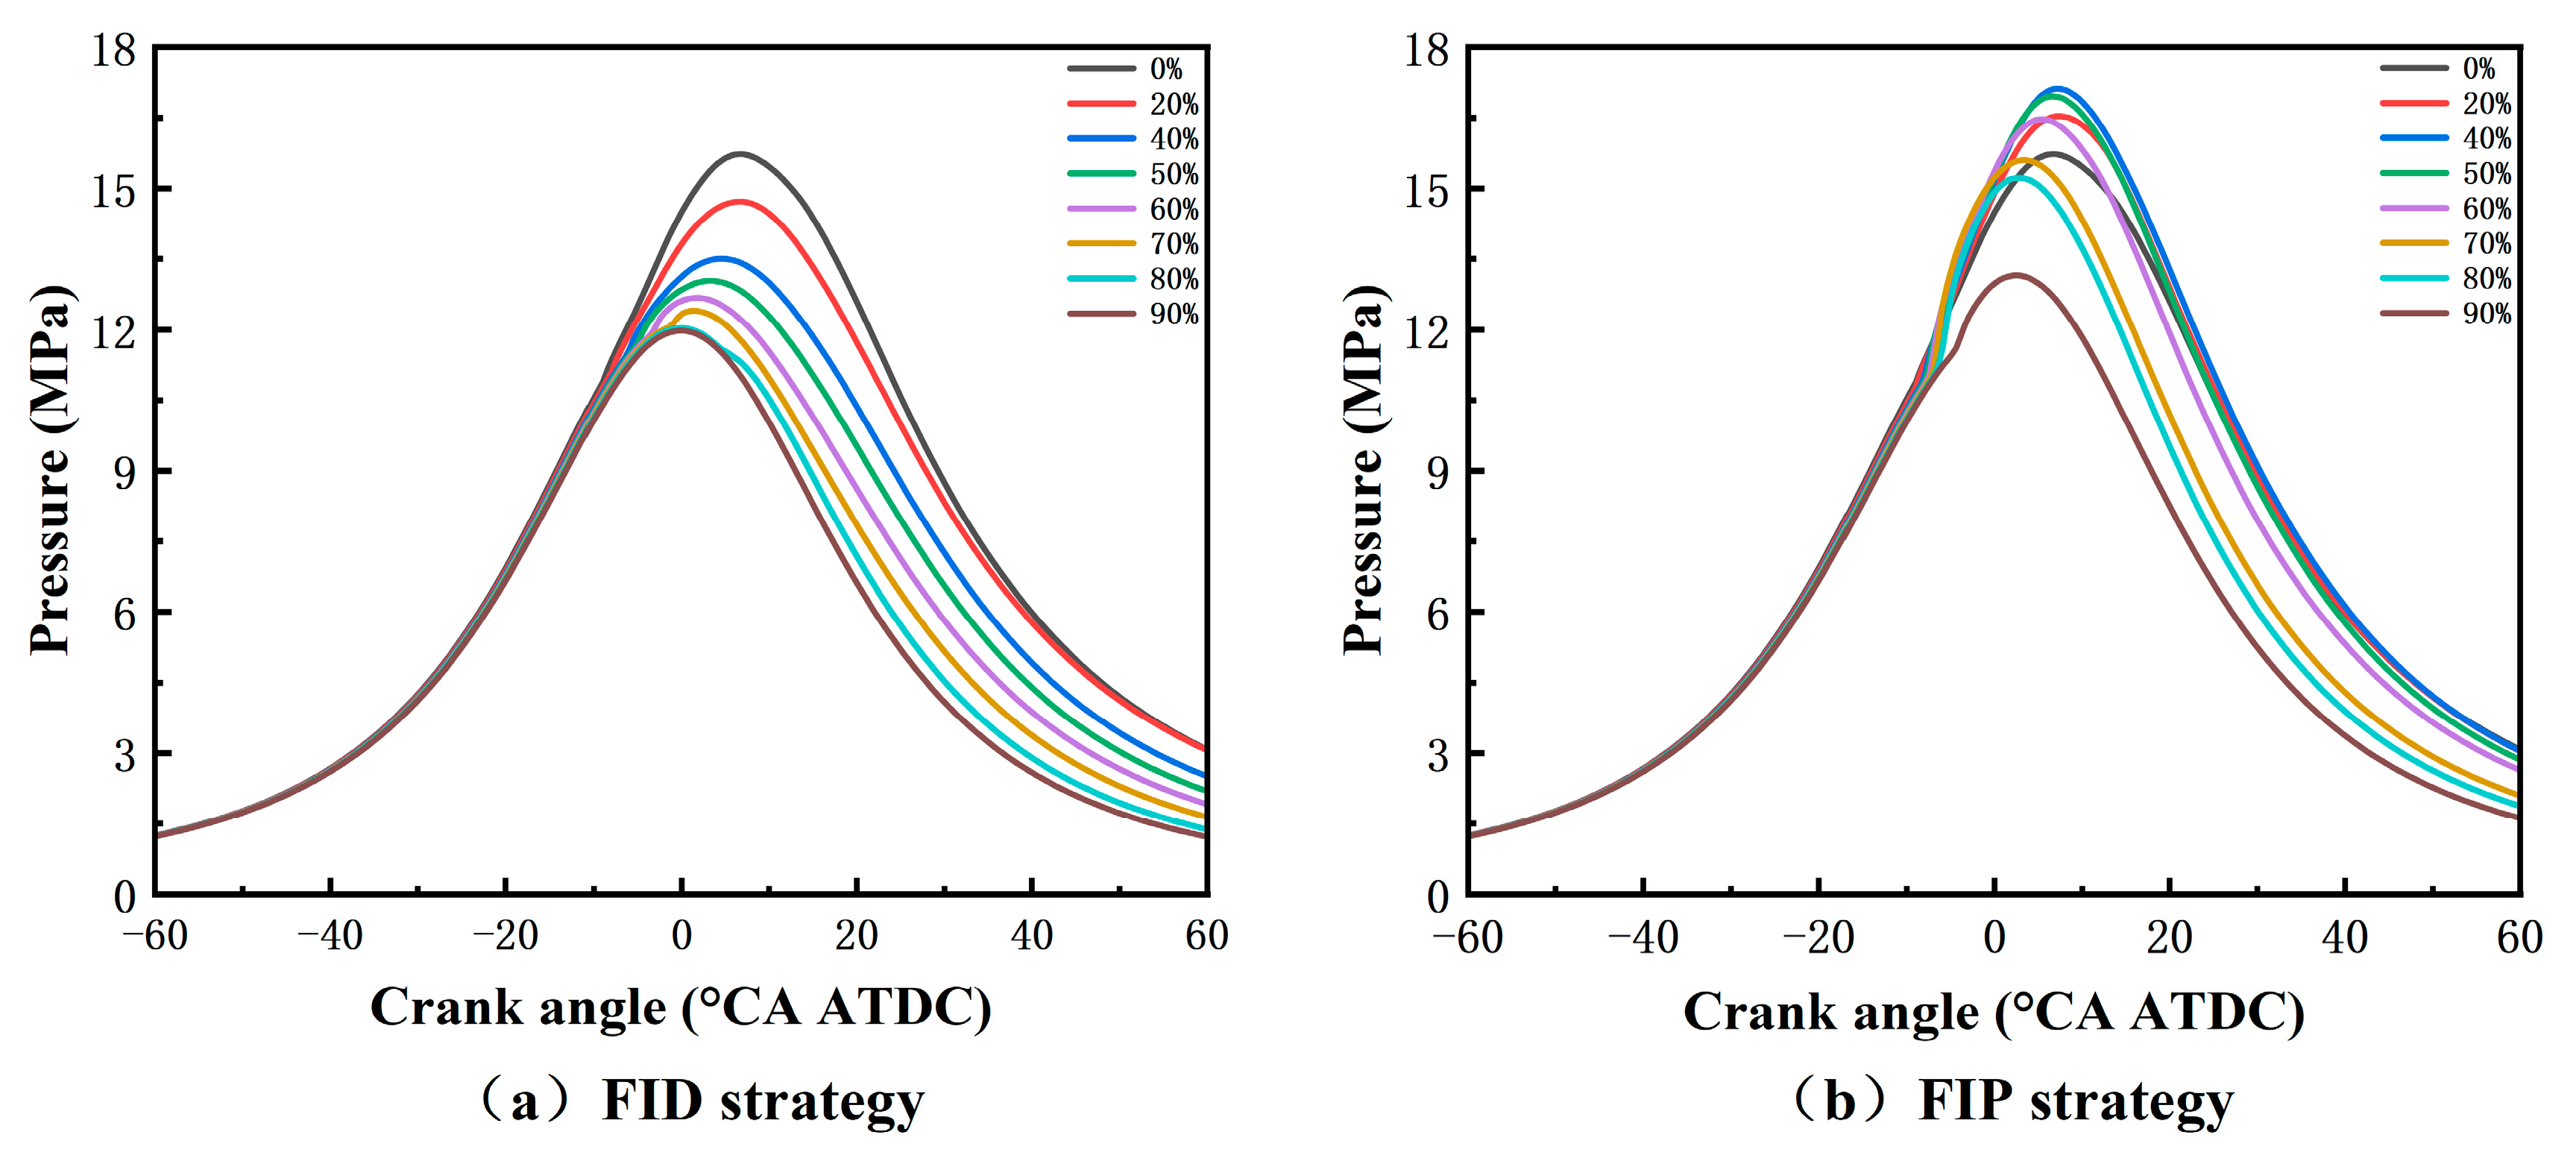
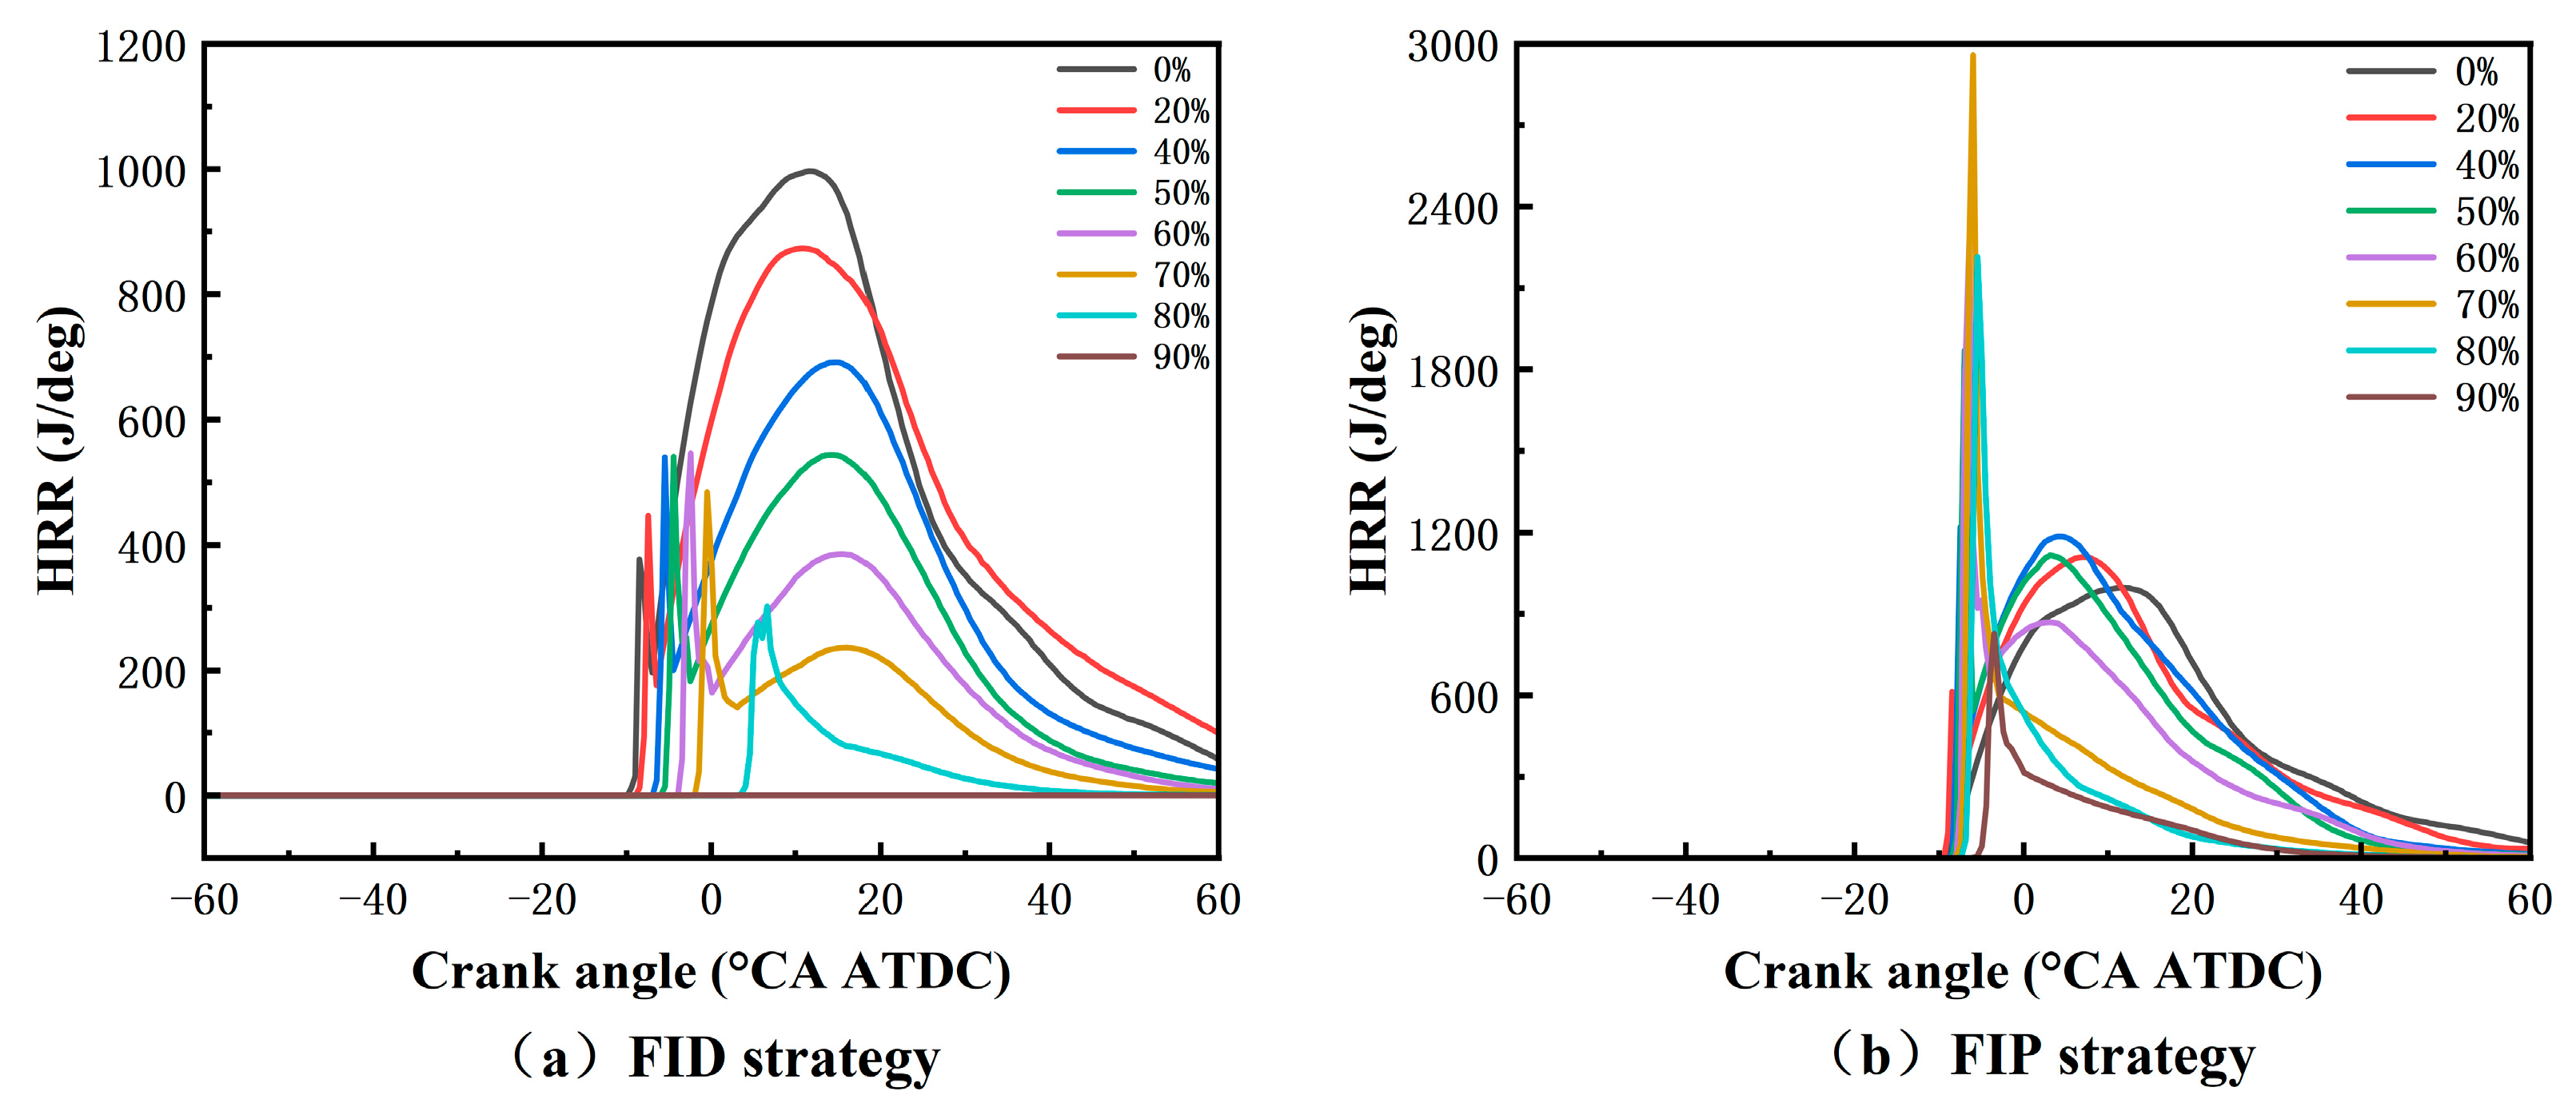
3.1.1. Combustion Characteristics

The variation in the cylinder pressure curves for the two strategies with increasing AER is shown in Figure 4. From Figure 4a, it can be seen that the in-cylinder pressure for the FID strategy decreases continuously as the AER increases. This is primarily because, in this strategy, the injection duration is kept constant, and with an increase in AER, the diesel injection pressure gradually decreases. This leads to uneven diesel distribution in the cylinder, incomplete combustion of diesel, and a continuous reduction in in-cylinder pressure. Additionally, the combustion speed of ammonia is slower than that of diesel, while the CE of the fuel decreases. These factors cause the in-cylinder pressure for the FID strategy to steadily decline. In contrast, the in-cylinder pressure for the FIP strategy exhibits a pattern of rising first and then falling. This occurs because, at lower AER, the mixed fuel of ammonia and diesel can generate higher in-cylinder pressure, causing the pressure to initially rise. However, as the AER increases, the poor combustion characteristics of ammonia become more pronounced. Moreover, with the reduction in diesel injection quantity, the ignition energy decreases, leading to worsened combustion performance, which ultimately results in a decline in in-cylinder pressure. The FIP strategy generates higher in-cylinder pressure than the FID strategy.
Figure 5 shows the heat release rate curves of two strategies as the AER varies. The first peak in the curve corresponds to the premixed combustion stage, and the second peak corresponds to the diffusion combustion stage. As seen from Figure 5a, the heat release rate curve of the FID strategy first increases and then decreases at the first peak, while the second peak continuously decreases. This is because ammonia is already well mixed inside the cylinder, and once ignition conditions are reached, a large amount of ammonia is ignited instantaneously, releasing a significant amount of heat. However, as the AER increases, the high self-ignition temperature of ammonia causes the CE to decline. Additionally, since the FID strategy keeps the injection duration constant, the diesel quantity in the early premixed combustion stage is reduced, leading to insufficient ignition energy and a reduction in heat release during premixed combustion. Therefore, the first peak increases initially and then decreases. In the FID strategy, as the AER increases, the injection pressure and quantity of diesel decrease, leading to poorer mixing between diesel and ammonia. Furthermore, because ammonia has a low flame propagation speed, the combustion range becomes smaller, and more ammonia fails to participate in combustion, leading to a less effective diffusion combustion. Thus, the second peak of the heat release rate curve continuously decreases.
In the FIP strategy, because the injection pressure remains constant, the diesel can mix more thoroughly with ammonia, resulting in a more uniform fuel mixture. Additionally, since the injection pressure stays constant, the amount of diesel participating in the premixed combustion phase remains at a relatively high level, providing sufficient ignition energy. As a result, the premixed combustion effect in the FIP strategy is more intense, and a large amount of ammonia is combusted, releasing more heat. However, when the AER increases further, the high self-ignition temperature of ammonia and its tendency to lower the in-cylinder temperature lead to a reduction in the amount of ammonia participating in combustion, thus reducing the released heat. Consequently, the first peak of the heat release rate curve decreases.
The second peak of the heat release rate curve for the FIP strategy first increases and then decreases. This is because the intense premixed combustion phase produces a larger flame, and since the injection pressure remains constant, the diesel has a larger diffusion range, causing more ammonia to be ignited. Therefore, the second peak initially increases. However, as the AER increases further, the increased amount of ammonia worsens the combustion environment, which is unfavorable for more complete combustion. Moreover, the reduced diesel injection amount, along with a shortened injection duration, causes the diesel to be injected too early. As shown in Table 4, when the AER exceeds 50%, the injection is completed too early. The premature end of injection weakens the diffusion combustion effect, resulting in a decline in the second peak of the heat release rate curve. Overall, the change in AER significantly affects the heat release rate curve, especially at elevated AER levels, which results in reduced CE and insufficient heat release.
Figure 6 illustrates the distribution of the temperature field in the cylinder for the two strategies. In the FID strategy, there are fewer high-temperature regions, which are concentrated in the later stages of combustion. At this point, the piston has moved down, the pressure inside the cylinder has decreased, and the combustion conditions have worsened. High temperatures can no longer promote complete combustion of the fuel. In contrast, the FIP strategy has more high-temperature regions that occur earlier, being concentrated in the early to mid-stages of combustion. The main reason is that the diesel injection pressure is sufficiently high, which allows the diesel to be injected further and increases the area of diffusion. This enables more thorough combustion of diesel and ammonia, resulting in higher cylinder temperatures. As can be seen from Figure 6, the onset of heat release is increasingly delayed. In particular, there is a significant delay in heat release under the FID strategy.
The turbulence kinetic energy (TKE) curve is shown in Figure 7. In the FID strategy, the TKE remains consistently lower than that during pure diesel combustion and continues to decline. This directly leads to poorer atomization of the diesel spray, resulting in larger fuel droplets. This may result in an improper mixing of diesel, ammonia, and air, causing incomplete combustion. Additionally, the reduction in diesel kinetic energy may lower the in-cylinder temperature, further impacting fuel combustion. In contrast, while the TKE in the FIP strategy also shows an overall downward trend, it is higher than that in the pure diesel mode during the early injection phase. The higher kinetic energy of diesel enhances the premixed combustion effect under the FIP strategy, releasing greater amounts of heat. This results in better premixed combustion performance under the FIP strategy, releasing more heat.
CA50, ignition delay, and combustion duration are key metrics that reflect an engine’s combustion behavior. Figure 8 shows the CA50 and ignition delay for two strategies. Figure 8a shows a delay in CA50 under the FID strategy as the AER increases, mainly due to the negative impact of ammonia on combustion. In contrast, the CA50 under the FIP strategy decreases with increasing AER. This is because the constant injection pressure under the FIP strategy leads to more intense premixed combustion in the early stage, accelerating the combustion rate, which results in an earlier CA50.
As shown in Figure 8b, ignition delay increases for both strategies. First, ammonia has a higher self-ignition temperature, meaning it takes longer to reach the ignition conditions after injection. Second, ammonia has a lower heating value compared to diesel, which results in less heat being released during combustion, thereby reducing the ignition energy and delaying the ignition timing. The rise in ammonia reduces the oxygen concentration and compression pressure in the cylinder, which lowers the cylinder temperature. Therefore, part of the ignition energy will be used to increase the cylinder temperature and pressure, which will also delay the ignition timing. If the ignition delay becomes too long, the heat release will occur later, and combustion will be concentrated on the piston going down.
Figure 9 shows a comparison of combustion durations between the FID and FIP strategies. Overall, the combustion duration for both strategies decreases as the AER increases. The main reason is that, with a higher AER, the fuel mixes more uniformly with air, leading to more stable combustion and a reduction in combustion duration. Additionally, the rate of combustion reactions is enhanced, further shortening of the combustion duration.
CE and ITE are key metrics for assessing engine performance. Figure 10 illustrates the CE and ITE of engines for both FID and FIP strategies. From the figure, it is evident that the CE for both strategies continuously decreases with an increasing AER. The reasons are as follows: the mixture of ammonia and diesel is not as homogeneous as that of air and diesel, leading to decrease in CE. Additionally, the difficult combustion characteristics of ammonia increase ignition difficulties and combustion delays, causing more ammonia to remain unburned, which further reduces CE. Furthermore, it can be observed that the CE in FID strategy drops sharply with an increasing AER. The CE for the pure diesel mode is 94.13%, while at an AER of 80%, the efficiency drops to only 37.56%. In contrast, the CE of the FIP strategy remains close to that of pure diesel at lower AER, only starting to decline significantly as the AER continues to increase.
The ITE of the FID strategy also shows a significant downward trend, which aligns with the trend in CE. As CE decreases, the fuel does not burn completely, resulting in less heat production. Unburned fuel and generated gases can also carry away energy, leading to increased exhaust heat losses. The reduction in released heat results in less energy effectively converted into mechanical energy, reducing the effective work performed by the engine and consequently lowering the ITE. In contrast, the FIP strategy can achieve higher ITE than the pure diesel mode when the AER is below 50%. This can be attributed to the following reasons: As shown in Figure 4, at lower AER, the engine’s cylinder pressure exceeds that of the pure diesel mode. Additionally, Figure 5 indicates that the performance of premixed and diffusion combustion is better at lower AER compared to pure diesel. Therefore, the greater cylinder pressure and heat release rate at low AER offset the slight reduction in CE, effectively driving the piston movement and increasing indicated work, which enhances ITE. At an AER of 40%, the engine’s ITE is 48.51%, which is higher than the 46.83% of the pure diesel mode. However, as the AER increases further, both cylinder pressure and heat release rate decrease, coupled with a decline in CE, leading to a drop in the engine’s ITE. Thus, improving engine performance at high AER remains an important goal.

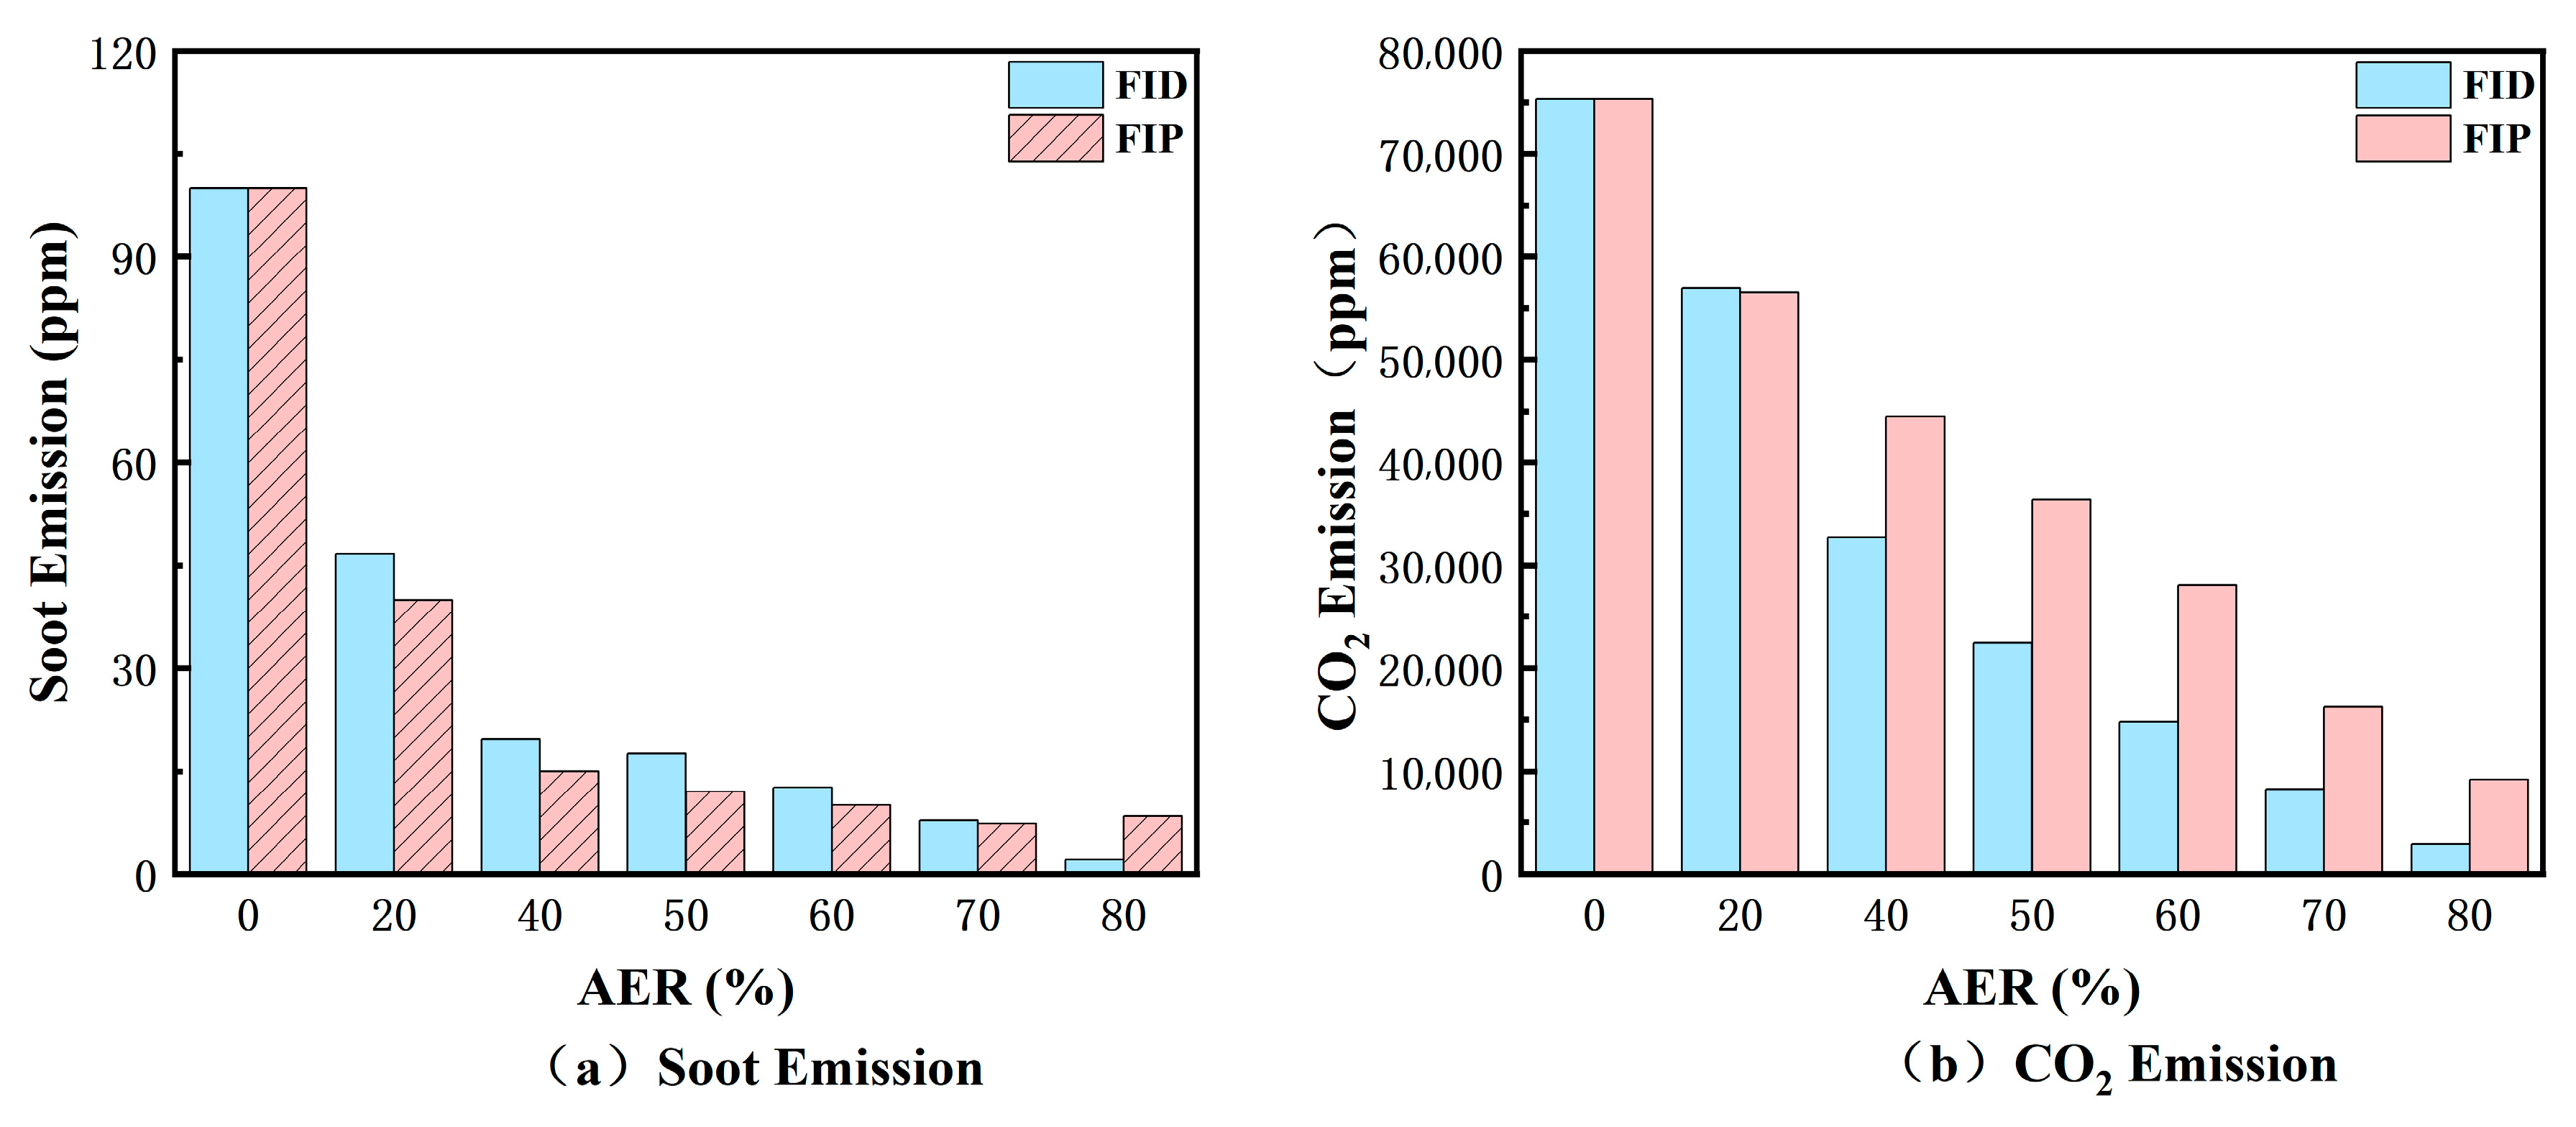
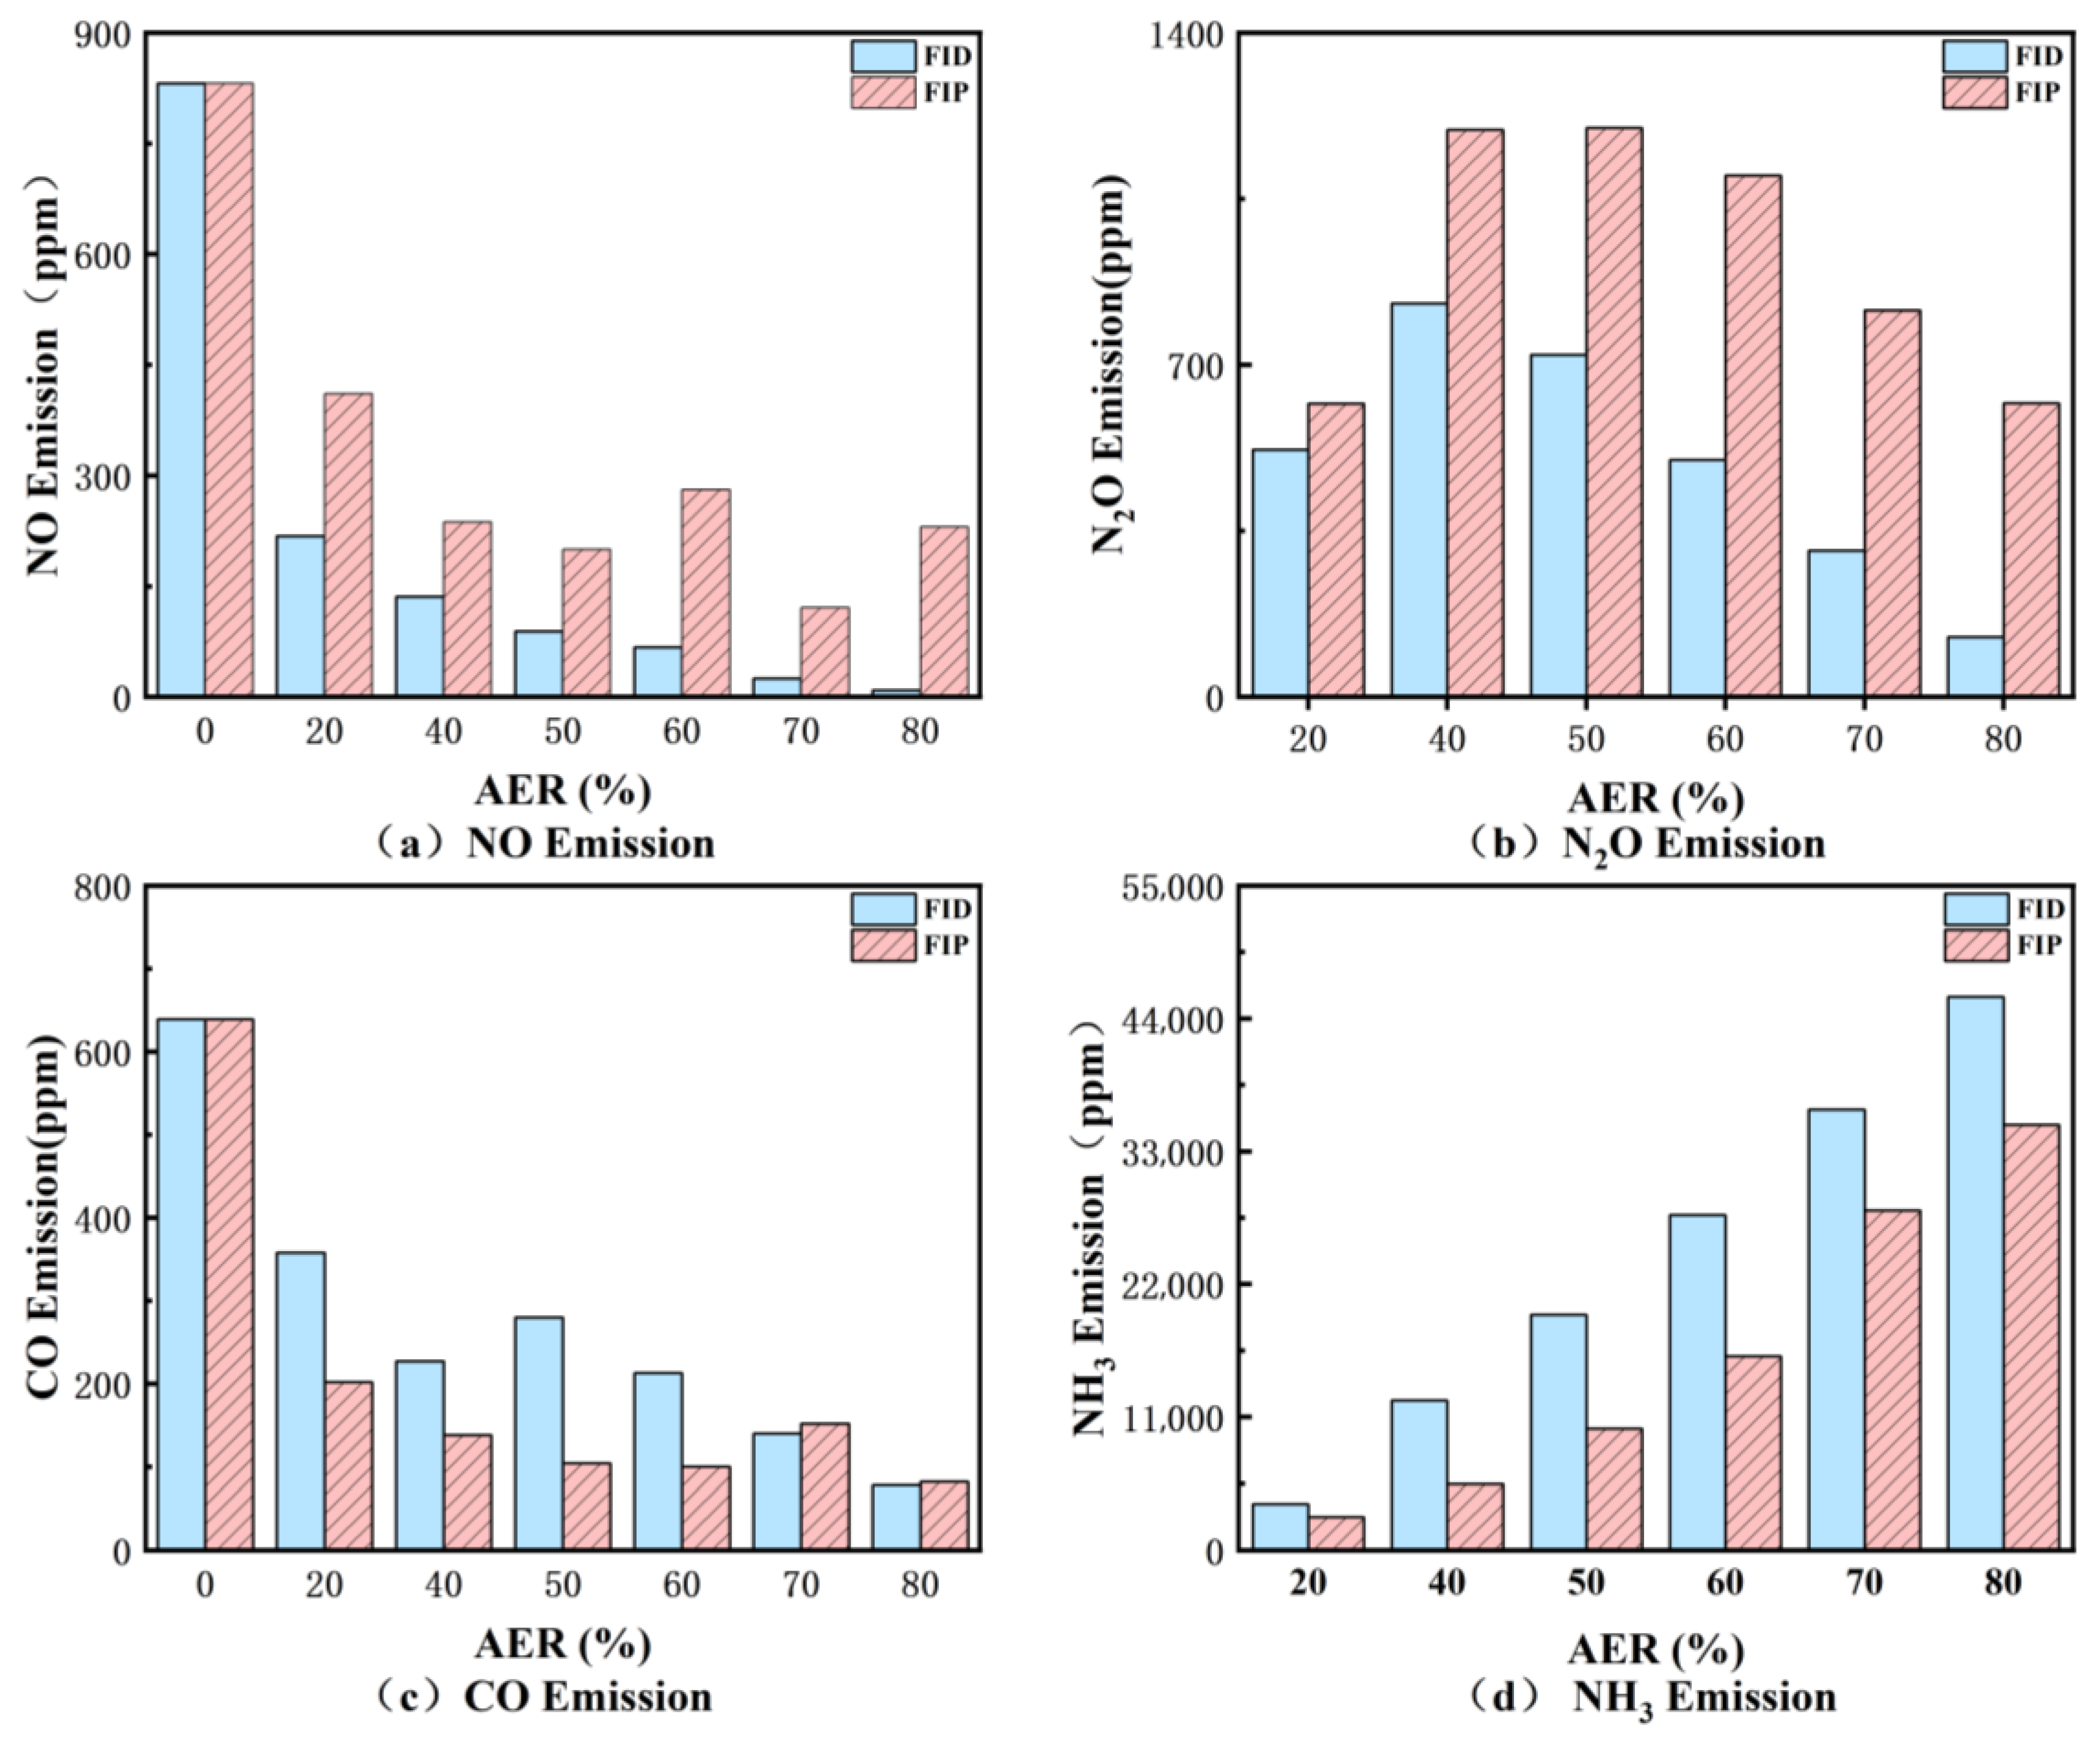
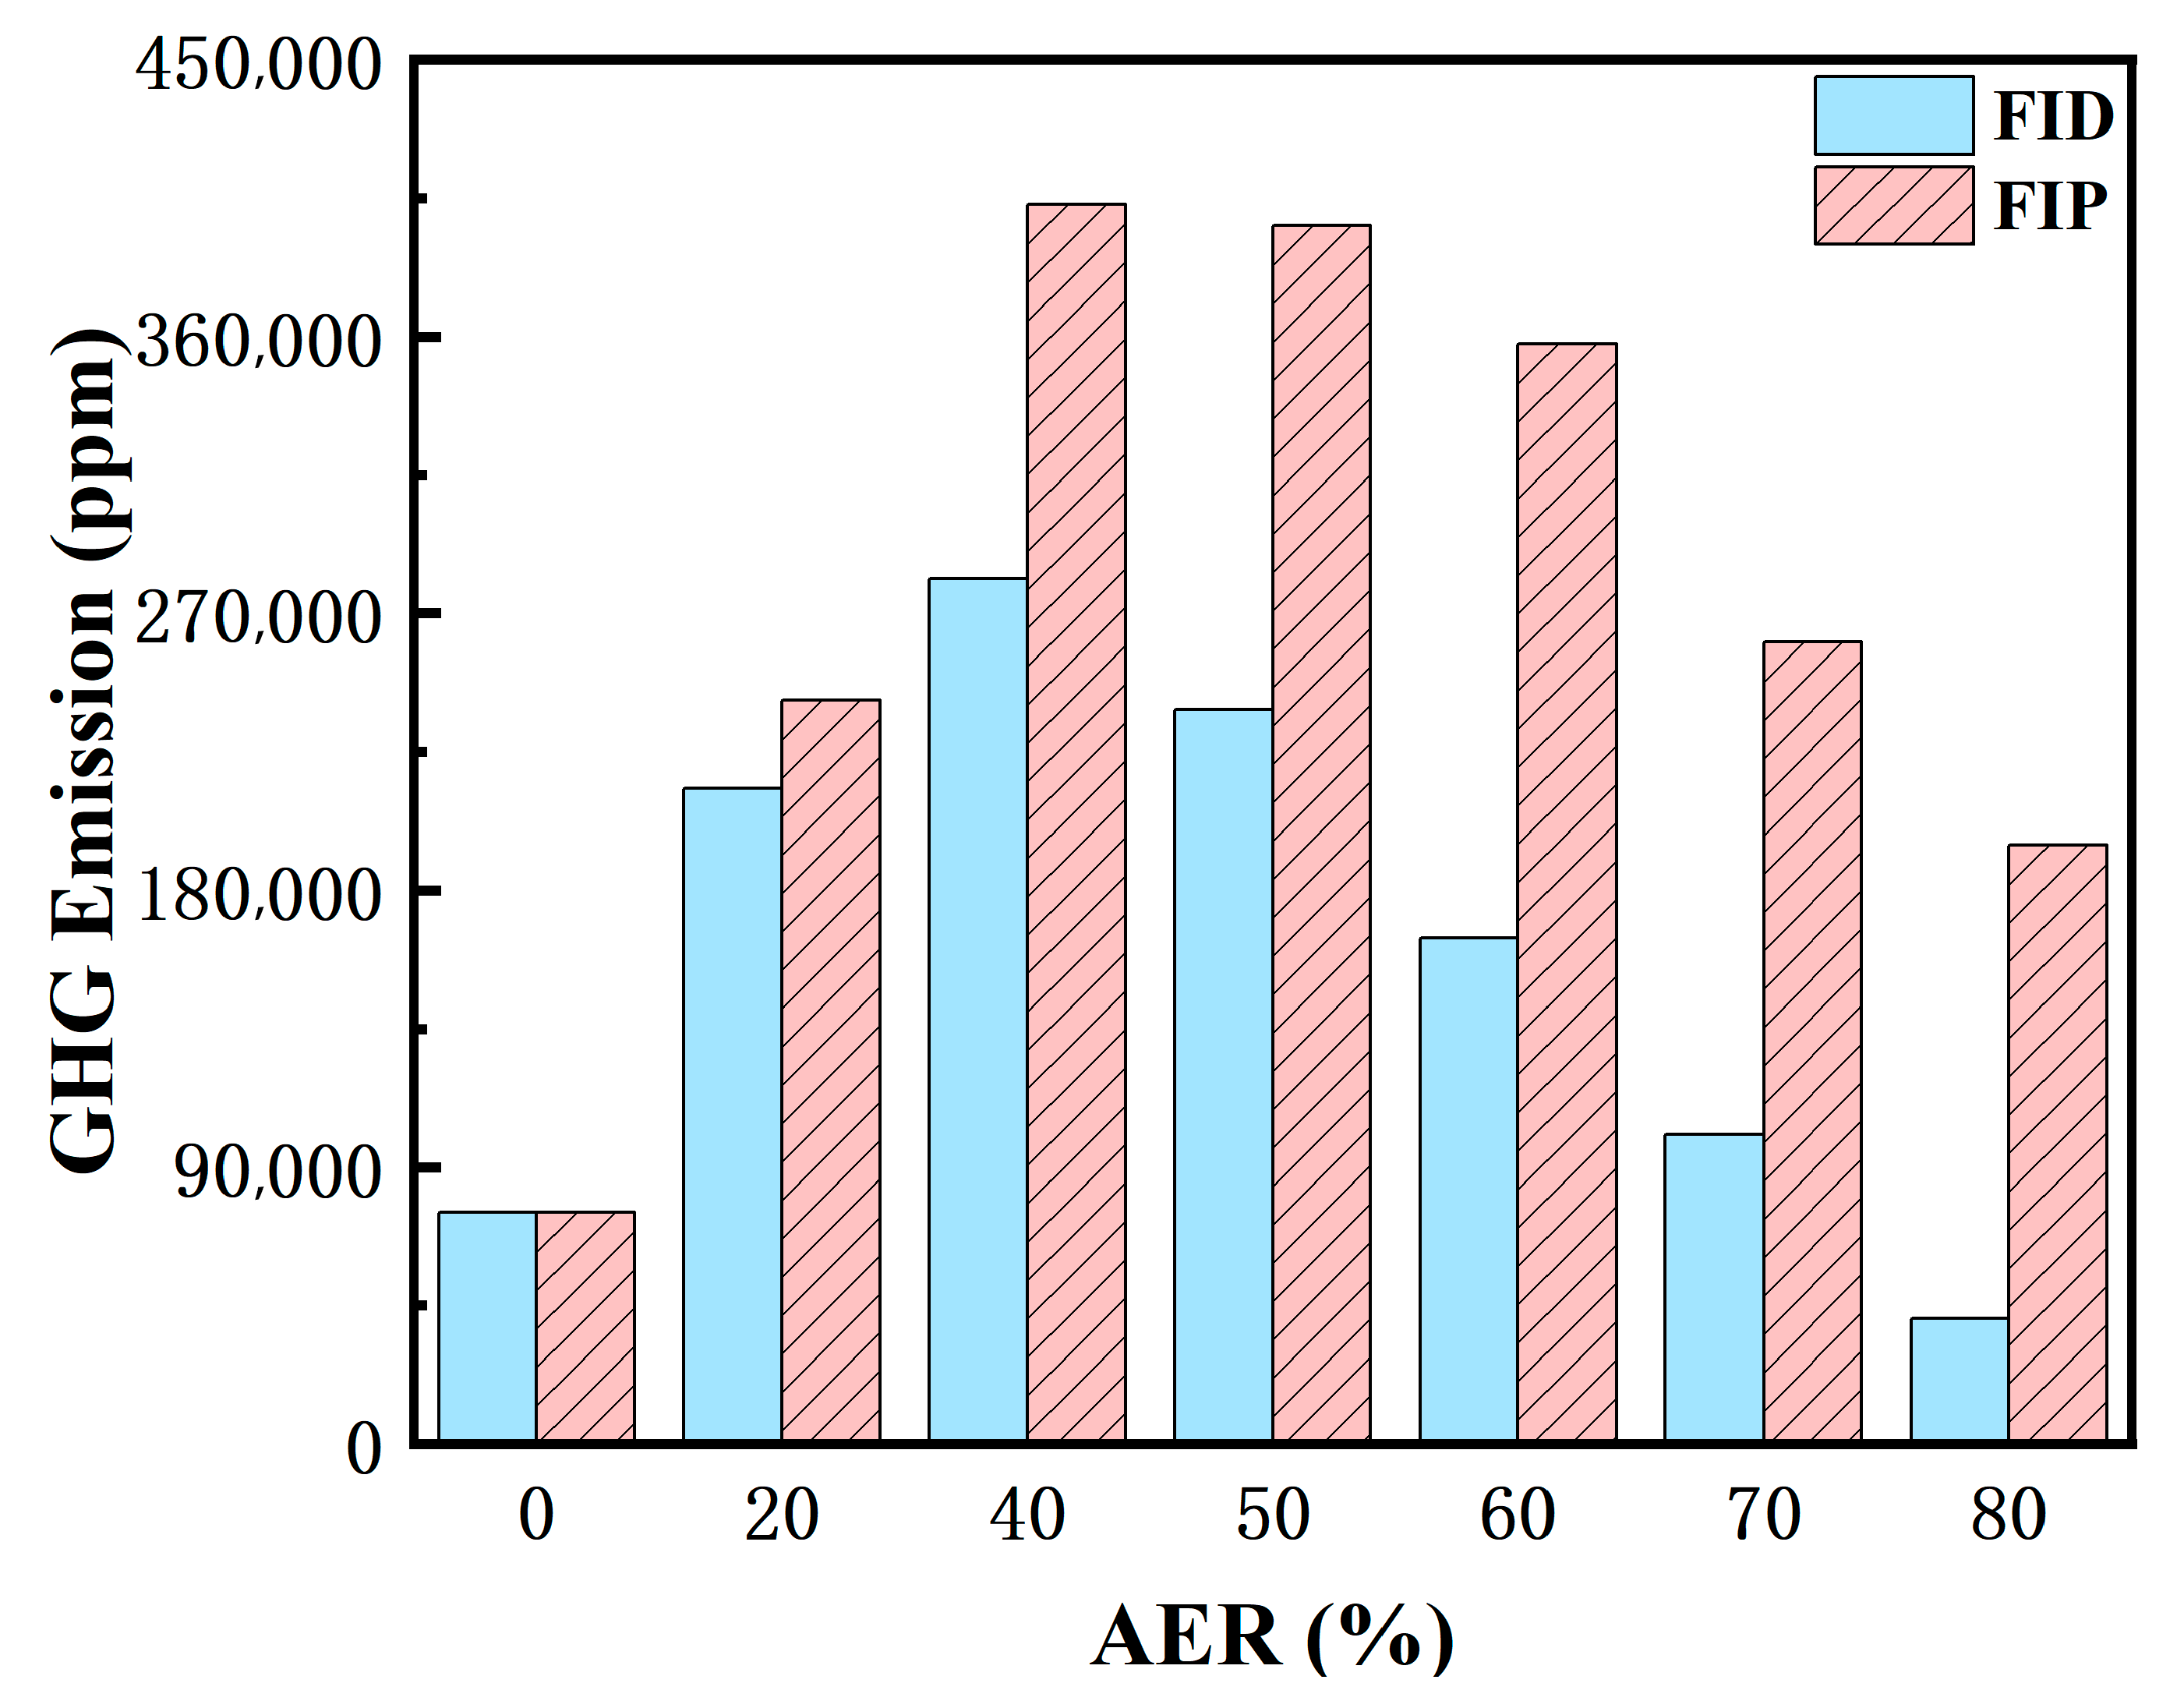
3.1.2. Emission Characteristics

The emission of soot particles and CO2 has always been a significant issue for traditional diesel engines. As shown in Figure 11, the emission variations in soot and CO2 for two strategies, FID and FIP, are illustrated. As shown in Figure 11a, with the rise in AER, the soot emissions for both strategies show a significant decline because ammonia combustion does not generate soot. Additionally, the reduction in the amount of diesel fuel further decreases the generation of soot. Figure 11b shows a decrease in CO2 emissions. This is because ammonia addition decreases diesel fuel consumption, thereby reducing the carbon source and effectively lowering total CO2 emissions. Therefore, with the increase in AER, both FID and FIP strategies lead to a notable decrease in CO2 emissions.
In addition to soot and CO2 emissions, engines also produce other pollutants that impact the environment. Figure 12 shows the changes in emissions of NO, N2O, CO, and unburned ammonia as the AER increases, under to the FID and FIP strategies. As shown in Figure 12a, NO emissions decrease considerably with increasing ammonia. In engines, the reaction between nitrogen and oxygen in the air produces NO, which is referred to as thermal NO. The report by Chen et al. [36] demonstrates the reaction mechanism of thermal NO. Research shows that nitrogen (N2) in the air reacts at high temperatures (reactions (4) and (5)). As the AER rises, the cylinder temperature drops, inhibiting the aforementioned reactions. Consequently, the generation of thermal NO decreases, leading to an overall reduction in NO emissions. As shown in Figure 12d, a large amount of unburned ammonia is observed, which is mainly due to the increased fuel-to-air ratio with increasing ammonia, leading to insufficient air and preventing the fuel from fully combusting. This could be also the main reason for the reduction in NO emissions. In addition, the thermal denitrification process [37] is another reason for the decrease in NO. Initially, ammonia reacts with oxygen atoms (O) and hydroxyl radicals (OH), represented by reactions (6) and (7), resulting in the formation of amine (NH2). Subsequently, NO reacts with NH2 and NH3 in reactions (8) and (9). This reaction occurs vigorously in the temperature range of 1100–1400 K. However, it slows down when the temperature drops below 1100 K. Conversely, when the temperature exceeds 1400 K, ammonia can be oxidized to form NO [38], known as fuel NO. The slow flame propagation characteristics of ammonia lead to a decrease in temperature inside the cylinder. Therefore, as the ammonia increases, reactions (8) and (9) predominantly occur. The oxidation of ammonia to NO is inhibited, resulting in a reduction in fuel NO. In summary, with an increase in AER, both thermal NO and fuel NO levels decrease, leading to lower NO emissions from the engine.
N 2 + O NO + N
N + O 2 NO + N
NH 3 + O NH 2 + OH
NH 3 + OH NH 2 + H 2 O
NH 2 + NO N 2 + H + OH
NH 3 + NO N 2 + H 2 O
The emissions of nitrous oxide (N2O) produced from the combustion of diesel engine fuels can be considered negligible [39]. In contrast, the combustion of ammonia does release N2O, which contributes to a greenhouse effect roughly 300 times more potent than CO2 [40]. As seen in Figure 12b, the ADDF engine will increase N2O emissions. Studies have indicated that reactions (10) and (11) are the primary pathways for N2O formation during ammonia combustion [41]. These reactions convert NO2 and NO into N2O at temperatures below 1400 K, leading to an increase in N2O emissions. Reaction (11) also contributes to a decrease in NO emissions.
NH 2 + NO 2 N 2 O + H
NH + NO N 2 O + H
Figure 12c shows that as the AER increases, CO emissions continuously decrease. The substitution of a portion of diesel with ammonia reduces the carbon content, thus lowering CO emissions. The addition of ammonia enhances the premixed combustion effect, allowing for more complete fuel combustion, which may also be a reason for the reduction in CO emissions. As seen in Figure 12d, the emissions of unburned ammonia increase as the AER rises. Firstly, the high auto-ignition temperature and slow flame propagation speed of ammonia make it difficult to combust. Secondly, at higher AER, the oxygen content in some regions may become insufficient, preventing complete combustion of ammonia. Additionally, CE reduction can result in more ammonia not participating in combustion and being released directly. These factors contribute to the increased emissions of unburned ammonia.
In recent years, with the worsening climate, GHG emissions have received increasing attention. In ADDF engines, the GHG emissions are primarily composed of CO2 and N2O. The GHG emissions can be calculated using the following formula:
GHG   emissions = CO 2 + N 2 O × 300
Figure 13 shows the GHG emissions for the FID and FIP strategies as the AER increases. From the figure, it is evident that GHG emissions rise with higher AER. Although the ADDF engine reduces CO2 emissions, they also contribute to the production of N2O. Therefore, GHG emissions show a continuous upward trend. When the AER is at 40%, the engine achieves the highest indicated thermal efficiency, but the GHG emissions at this point are also the highest.

3.2. Optimized Combustion Strategy

From the above, it is clear that the addition of ammonia has improved the ITE and other performance metrics of the engine. However, at a higher AER of more than 40%, not only does the engine efficiency decrease but it also results in increased emissions of N2O and unburned ammonia, which limits the application of ammonia–diesel dual-fuel under high AER. To tackle this issue, further research will be conducted based on Simulation Scheme 2 as shown in Table 5. Using the more efficient FIP strategy, the engine will operate at 75% load with an AER of 60%. The initial temperature inside the cylinder will be gradually increased by 20 K to study its impact on the engine’s combustion and emission characteristics.

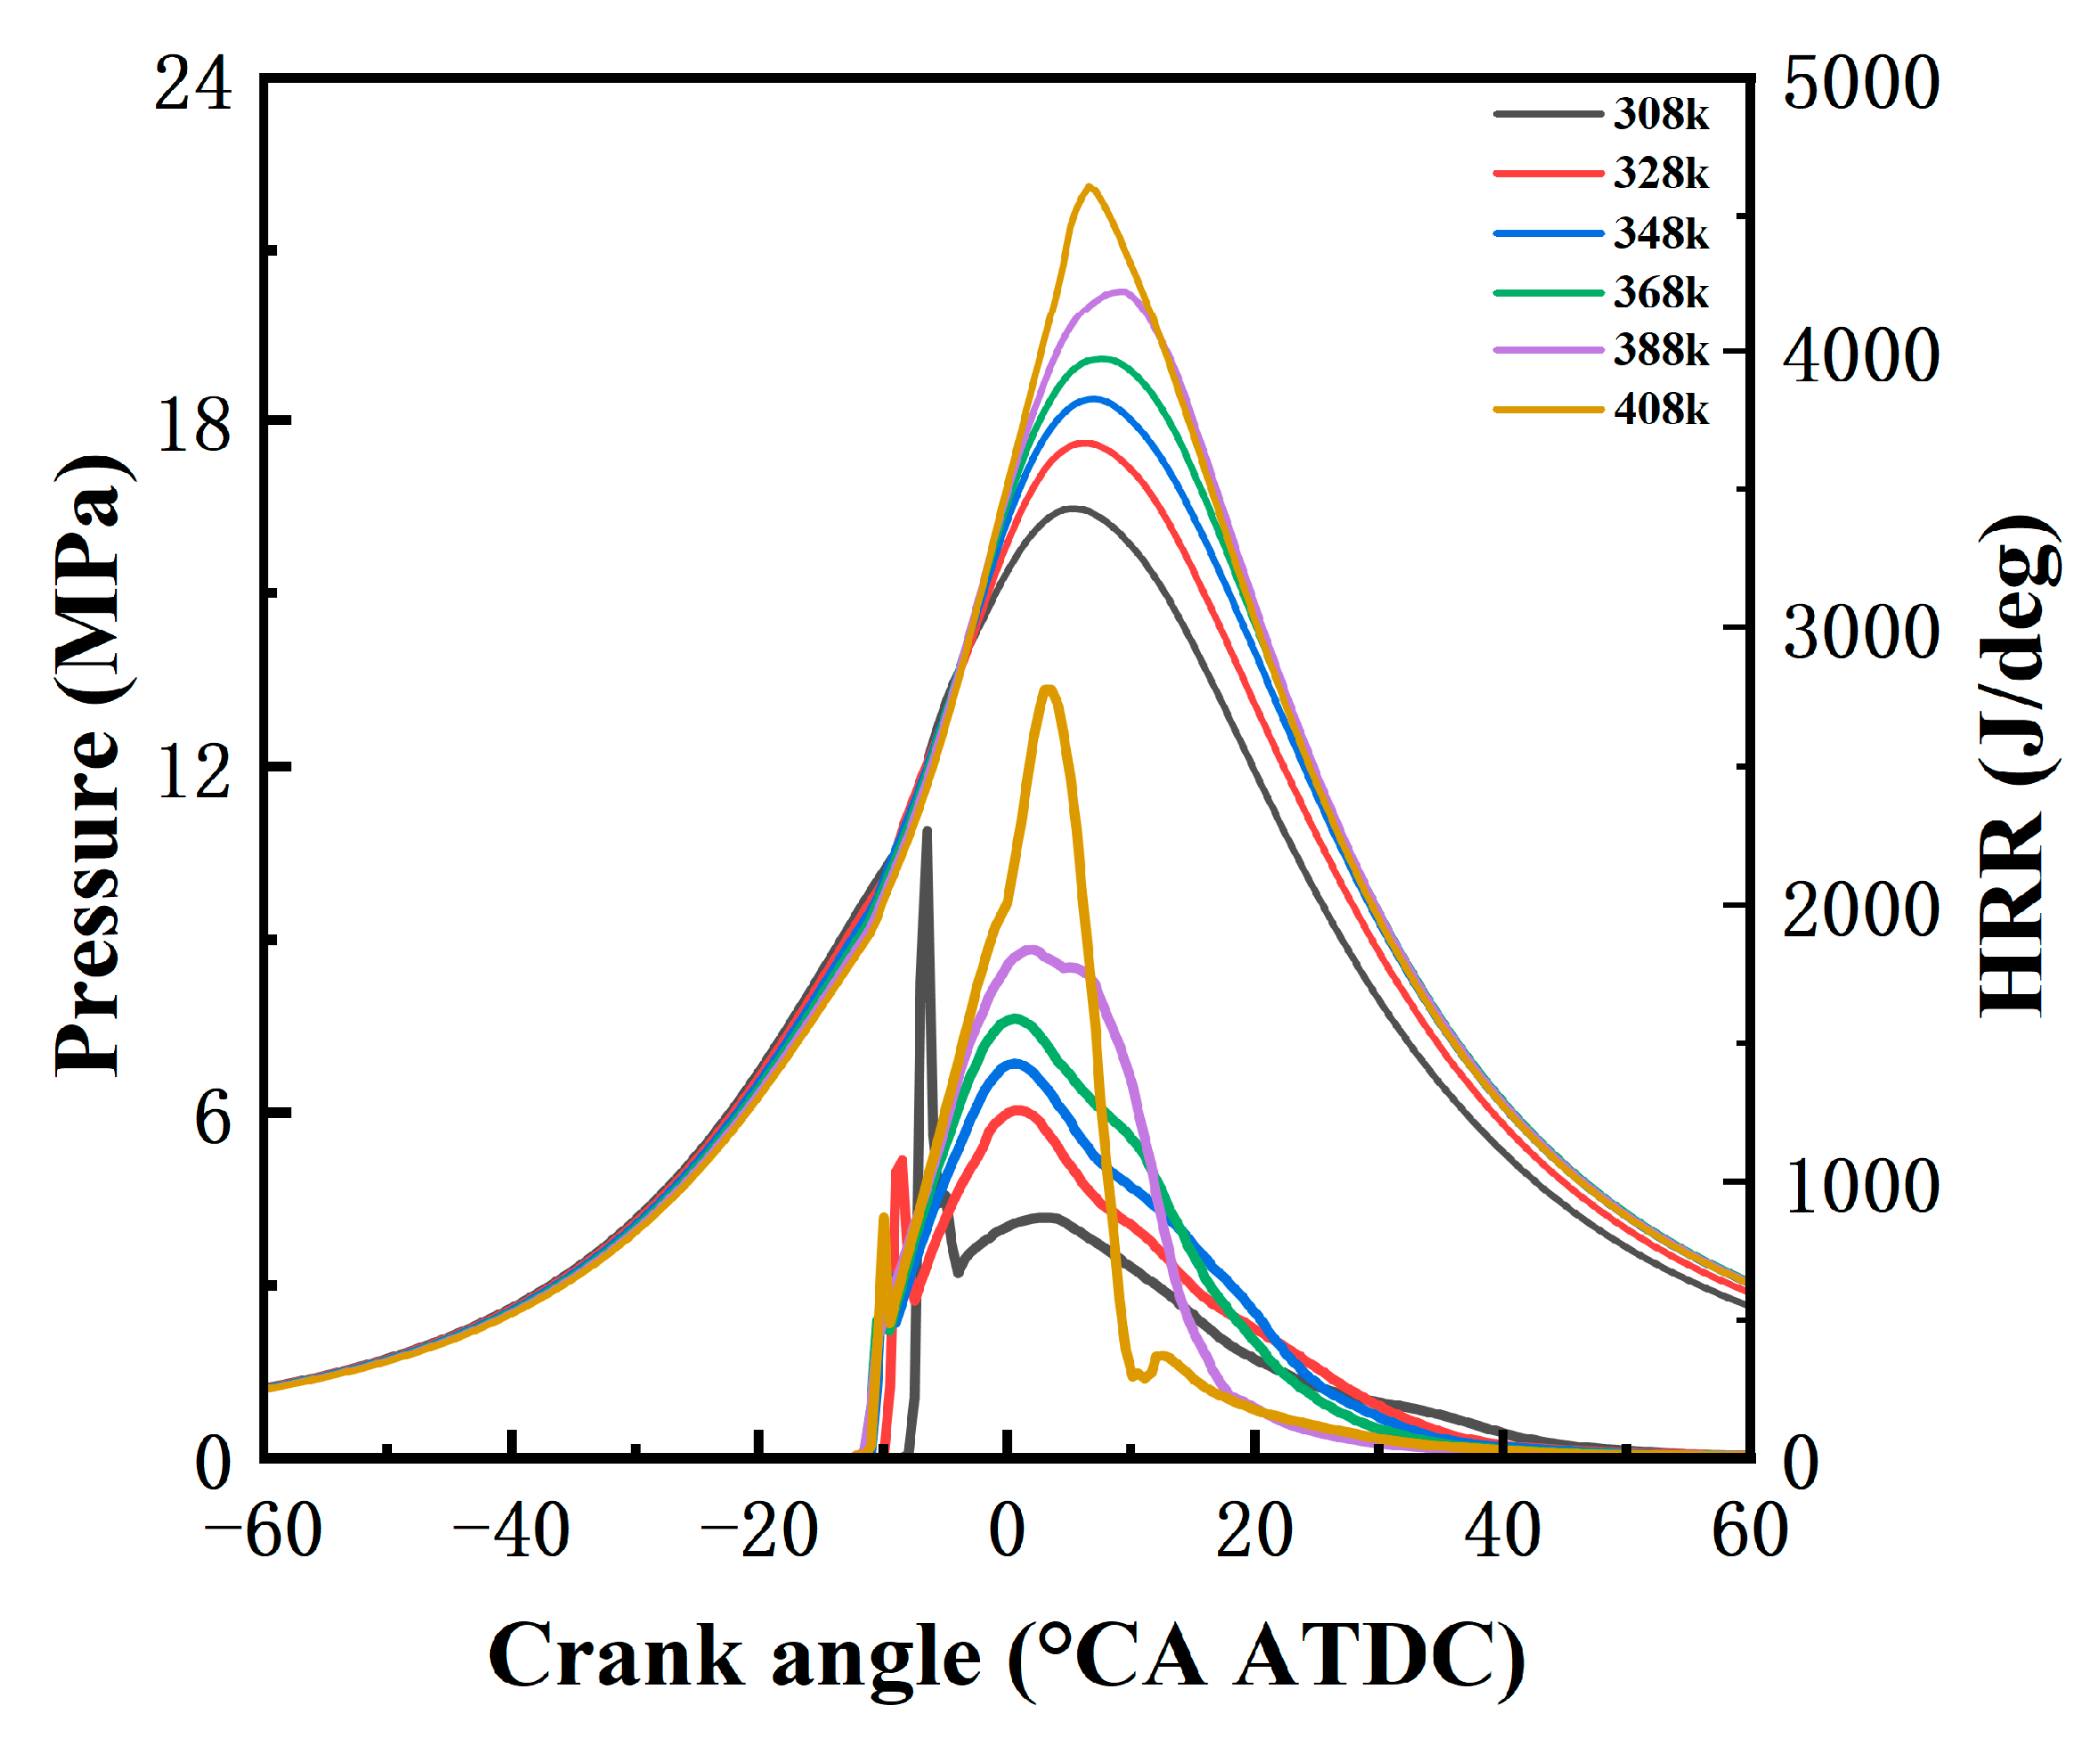
3.2.1. Combustion Characteristics of Optimized Strategies

Figure 14 illustrates the effects of different initial temperatures inside the cylinder on the cylinder pressure and heat release rate of the engine. The figure shows that with the increase in temperature, the peak pressure in the cylinder also rises continuously. This is due to the increased initial temperature, which enhances CE and releases more heat, leading to a rapid rise in gas temperature. Additionally, the increase in temperature accelerates the motion of gas molecules, increasing the internal energy of the gas and thereby raising the gas pressure. This results in higher cylinder pressure. However, the peak during the premixed combustion phase shows a continuous decline. This decrease occurs because, after raising the initial temperature, the mixed gases under high-temperature conditions may lead to a reduction in the premixed CE of ammonia. Some ammonia may undergo thermal decomposition at high temperatures, reducing heat release during premixed combustion and lowering the first peak of the heat release rate curve. Furthermore, at high temperatures, the ignition delay of ammonia is shortened, weakening the rapid combustion characteristics in the initial phase, thus lowering the heat release peak.
In contrast, the second peak of the heat release rate curve continues to rise. This increase is because, by this time, the injection of diesel has been completed, allowing more diesel to enter the cylinder and increasing the ignition energy. Under high-temperature conditions, the evaporation and mixing of diesel are more efficient. Therefore, combustion is primarily dominated by the diffusion combustion of diesel, leading to the ignition of more ammonia and the release of greater amounts of heat. During the diffusion combustion phase, the increase in local temperature accelerates the rates of fuel oxidation and vaporization, further increasing the released heat. However, when the temperature reaches 408 K, the cylinder pressure and heat release rate curves begin to deform. At this temperature, the peak pressure inside the cylinder reaches 22 MPa, while the engine’s cylinder burst pressure is 21 MPa. At this point, the pressure exceeds the limit, indicating that the temperature should only increase within a certain range.
Figure 15 illustrates the effect of varying initial cylinder temperatures on combustion characteristics. The figure shows a continuous reduction in ignition delay. Higher initial temperatures enhance the atomization of diesel fuel and improve the mixing of ammonia and diesel, forming a more easily combustible mixture, which accelerates the chemical reaction rate of the fuel. Additionally, ammonia is more prone to auto-ignition at higher temperatures, leading to an earlier ignition timing for ammonia, thereby shortening the ignition delay. As the ignition delay decreases, CA50 also advances. Higher initial temperatures enhance the combustion environment, accelerating CE and causing CA50 to occur earlier. With the rise in initial temperature, the combustion reaction rate of ammonia and diesel increases, resulting in faster combustion. Simultaneously, as the temperature increases, the heat release rate increases, reducing the time required for combustion completion. Therefore, the duration of combustion is continuously shortened as the temperature increases.
Figure 16 illustrates the impact of different initial cylinder temperatures on engine CE and ITE. As the cylinder temperature increases, the high auto-ignition temperature characteristic of ammonia diminishes, enabling more ammonia to burn. Additionally, the higher temperature facilitates the evaporation of diesel, improving its atomization and ensuring a more uniform dispersion. This, in turn, promotes more complete combustion, significantly enhancing CE. At an initial temperature of 308 K, the CE is only 70%. However, when the temperature rises to 388 K, the CE improves dramatically to 98%. This increase in CE results in a greater release of heat. The advancement of CA50, the delay in ignition, and the shortening of the combustion duration all contribute to the quicker and earlier release of heat. More heat is released before the top dead center, allowing the heat generated by the fuel to be more fully converted into effective mechanical energy, thereby improving ITE. At an initial temperature of 308 K, the AER reaches 60%, and the engine’s ITE is only 38.11%, significantly lower than the 46.83% of the pure diesel mode. However, when the initial cylinder temperature is increased to 388 K, the ITE rises to 54.47%, resulting in a substantial improvement in engine performance.

3.2.2. Emission Characterization of Optimized Strategies

Figure 17 illustrates the engine emissions at various initial cylinder temperatures. As seen in Figure 17a, increasing the initial cylinder temperature leads to a further reduction in CO emissions. Higher temperatures facilitate fuel atomization and mixing, improving CE and decreasing the likelihood of incomplete combustion of the fuel. Elevated temperatures also promote the reaction between oxygen and fuel molecules, accelerating oxidation reactions and further reducing CO formation. As a result, CO emissions decrease. The emissions of N2O also significantly decline with increasing temperature. This is because higher temperatures accelerate the reduction reactions of N2O [42]:
N 2 O + M = N 2 + O + M
The above reaction causes a decrease in N2O emissions. At an initial cylinder temperature of 308 K, the N2O emissions are 1099 ppm. However, when the temperature reaches 388 K, the N2O emissions drop to 25 ppm. In contrast, the NO emissions increase due to the high-temperature environment, which also promotes the reaction between nitrogen and oxygen to form NO. Additionally, the oxidation of ammonia at elevated temperatures contributes to increased NO emissions. However, SCR (Selective Catalytic Reduction) after-treatment technology has now been well developed, and the increase in NO emissions is no longer a problem. SCR technology can be used to reduce NO emissions.
As seen in Figure 17b, unburned ammonia emissions notably decrease with increasing temperatures. The increase in initial cylinder temperature enhances CE, allowing more ammonia to be fully combusted. Furthermore, higher temperatures lead to a greater decomposition of ammonia. These factors contribute to a substantial reduction in unburned ammonia emissions, which decrease from 16,016 ppm at 308 K to just 100 ppm at 388 K. The increase in the initial cylinder temperature will also ignite a large amount of unburned ammonia concentrated around the cylinder.
Figure 18 presents the CO2 and GHG emissions at various temperatures. The increase in temperature enhances CE, allowing for a more complete combustion of diesel. This results in a slight rise in CO2 emissions. However, these emissions are still far below those of the pure diesel method. Due to the substantial reduction in N2O emissions, GHG emissions have decreased by 85.3%. This achieves the goal of reducing GHG emissions.

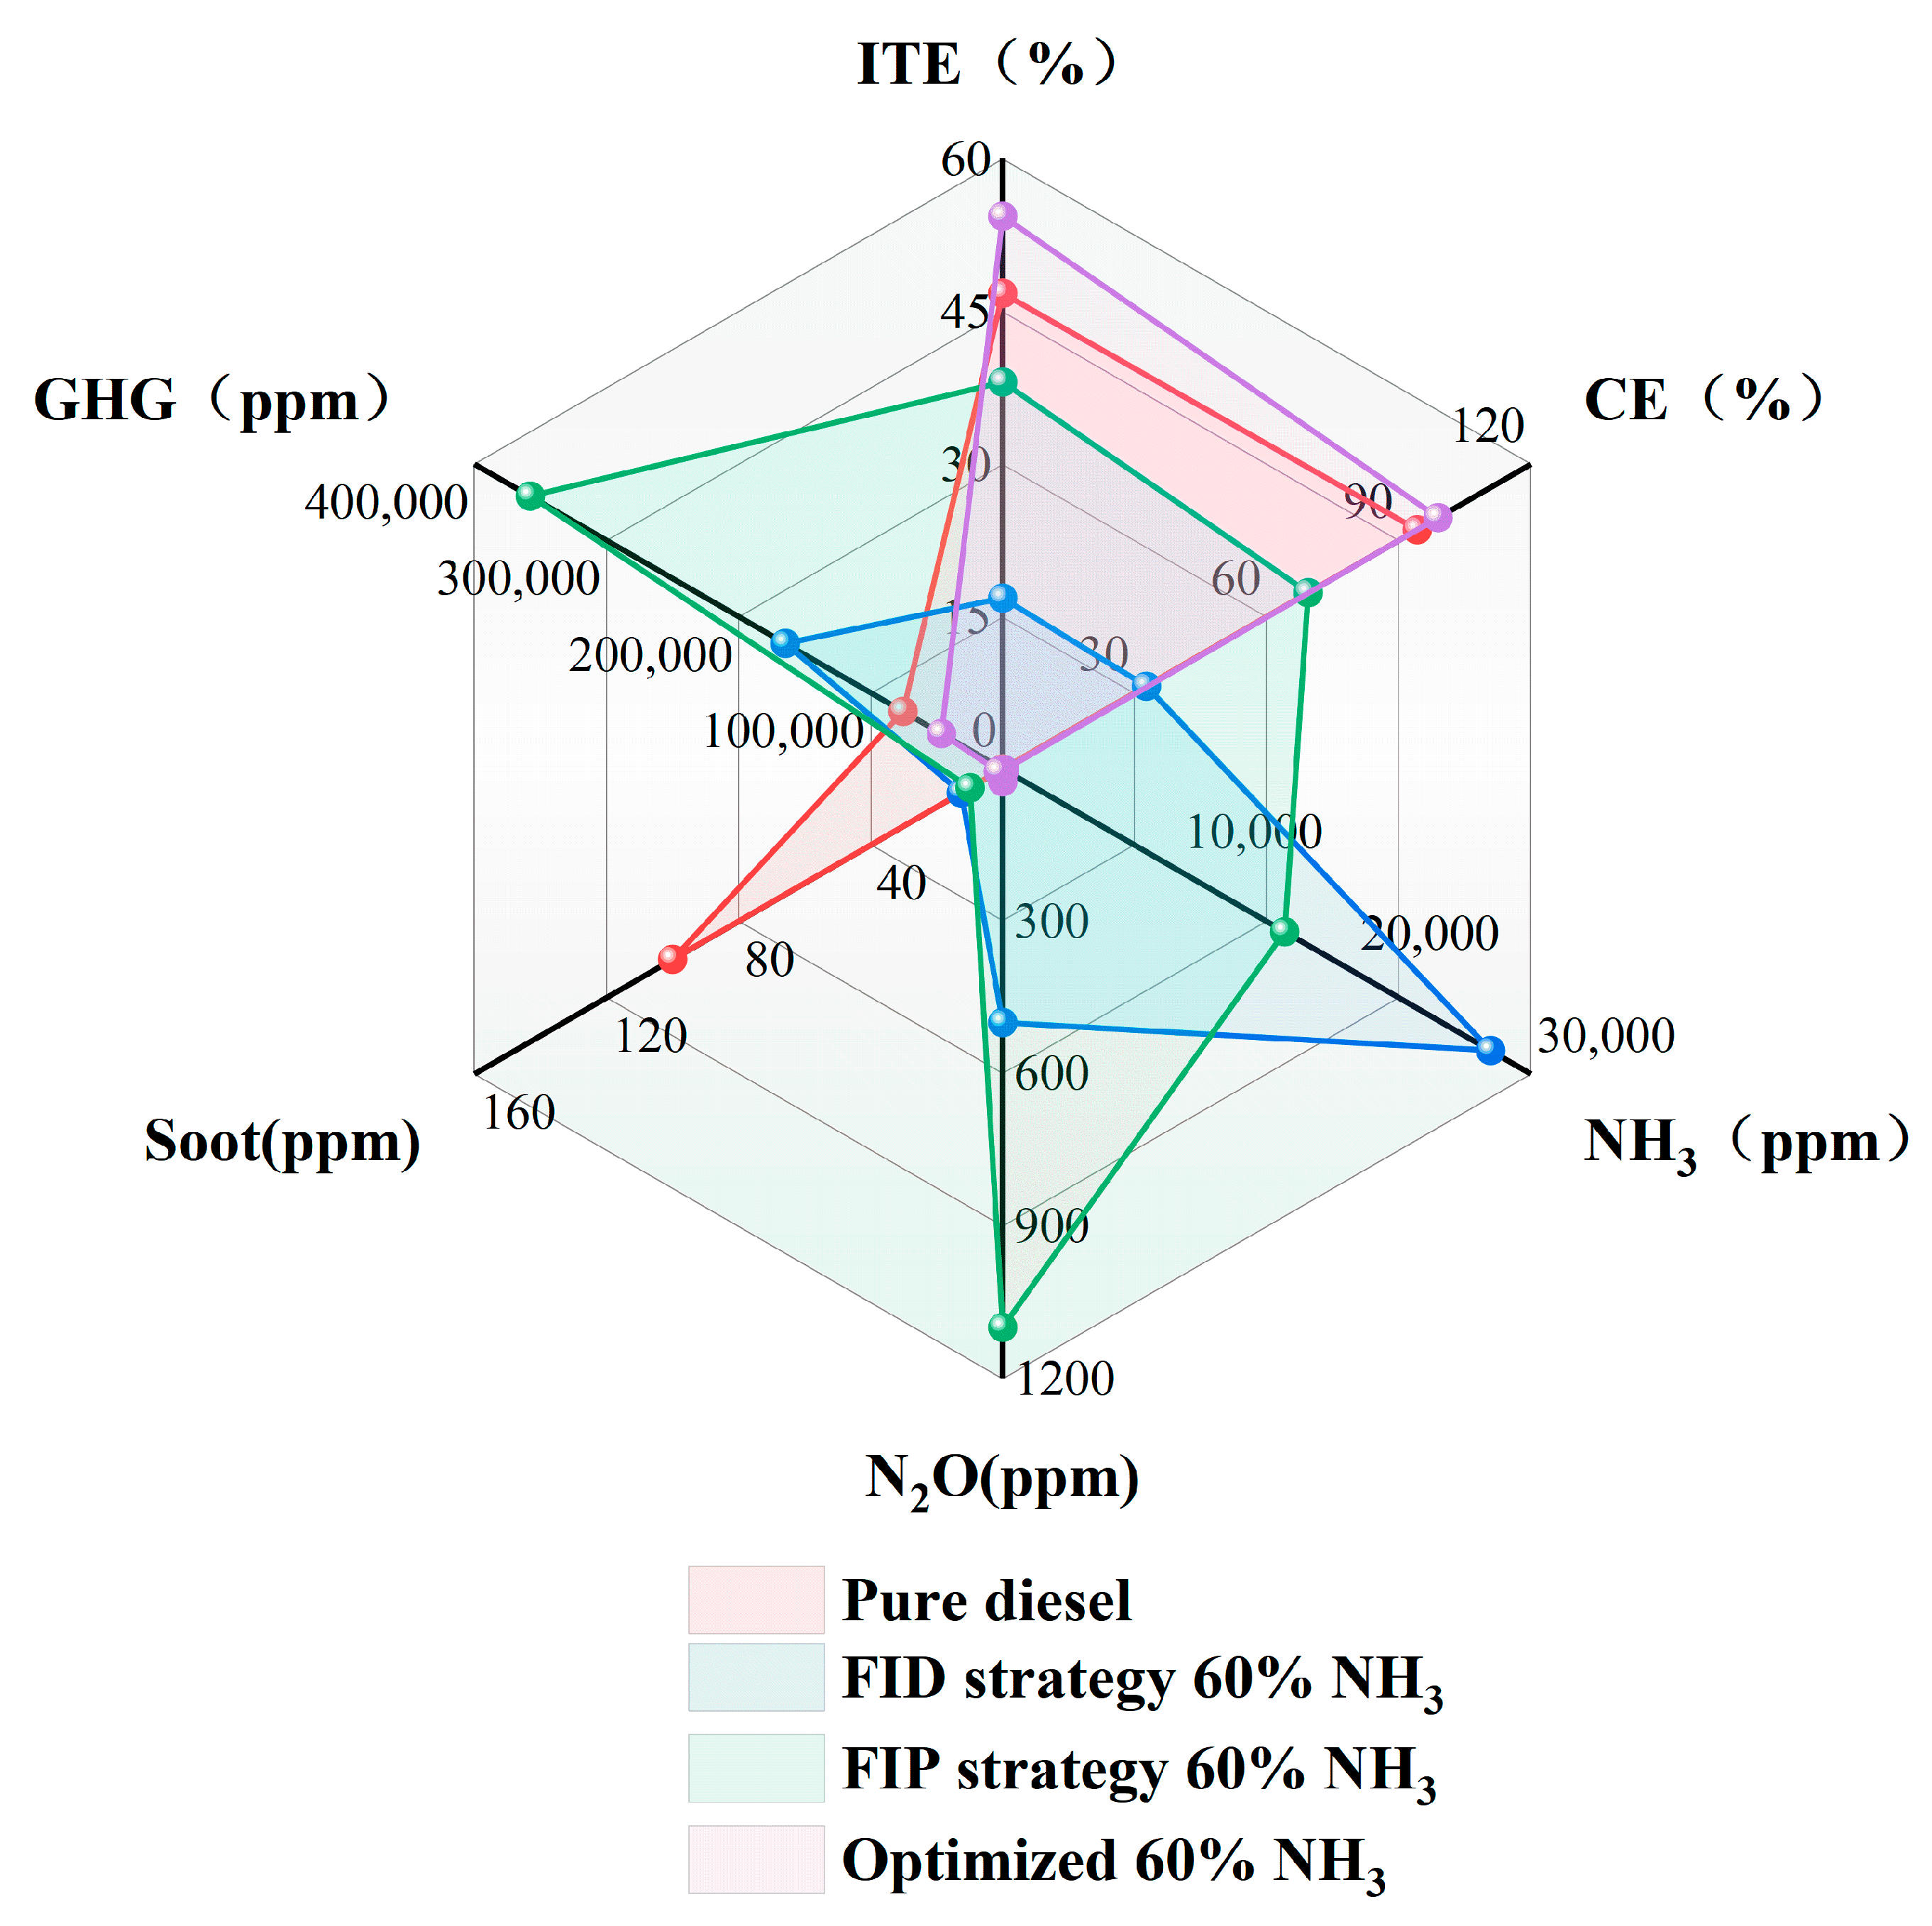
3.2.3. Optimized Results

The above comparison evaluates two different combustion strategies, and then optimization of the ADDF engine is conducted by increasing the initial cylinder temperature. To address the deficiencies of the engine at high AER, an optimal condition has been identified: at an AER of 60%, using the FIP strategy with the initial cylinder temperature raised to 388 K. The optimized engine shows significant improvements in both efficiency and emissions.
The results after optimizing the combustion strategy are compared in Figure 19. In the FID strategy, at a 60% AER, the CE and ITE of the ammonia–diesel dual-fuel mode are significantly lower than those of the pure diesel strategy. However, in the FIP strategy, TKE of diesel is enhanced, facilitating a better mixing of diesel, ammonia, and air, which leads to an increase in both the CE and ITE compared to the FID strategy. Nonetheless, the CE and ITE are still lower than those of the pure diesel mode, and emissions of GHG and unburned ammonia have increased. Building on this, the initial cylinder temperature is further optimized by raising it from 308 K to 388 K. The increase in initial cylinder temperature significantly improves the combustion environment. The higher temperature accelerates the flame propagation speed of ammonia, advances the ignition delay, and enables a more thorough ammonia combustion. Under high-temperature conditions, diesel diffuses more effectively, resulting in an increase in engine CE. The advancement of CA50 and the shortening of the combustion duration enable faster and earlier heat release, thereby increasing the engine’s ITE.
After optimization, N2O emissions drop from 1099 ppm to 25 ppm, and unburned ammonia emissions decrease from 16,016 ppm to 100 ppm, leading to an 85.3% reduction in GHG emissions. The ITE improves to 54.47%, an increase of 16.36% compared to the pre-optimization value of 38.11%. Additionally, compared to the pure diesel mode, soot emissions are also reduced by 98% after optimization.

4. Conclusions

Ammonia, as a carbon-free fuel, has attracted significant attention, but its inherent characteristics also pose considerable challenges for its application. Through numerical analysis based on credible experiment data, the impact of combustion control strategies on ammonia/diesel dual-fuel (ADDF) engines was studied. Additionally, optimization of the engine performance under high ammonia energy ratio (AER) was carried out. Based on the research above, the following main conclusions are obtained:
(1)
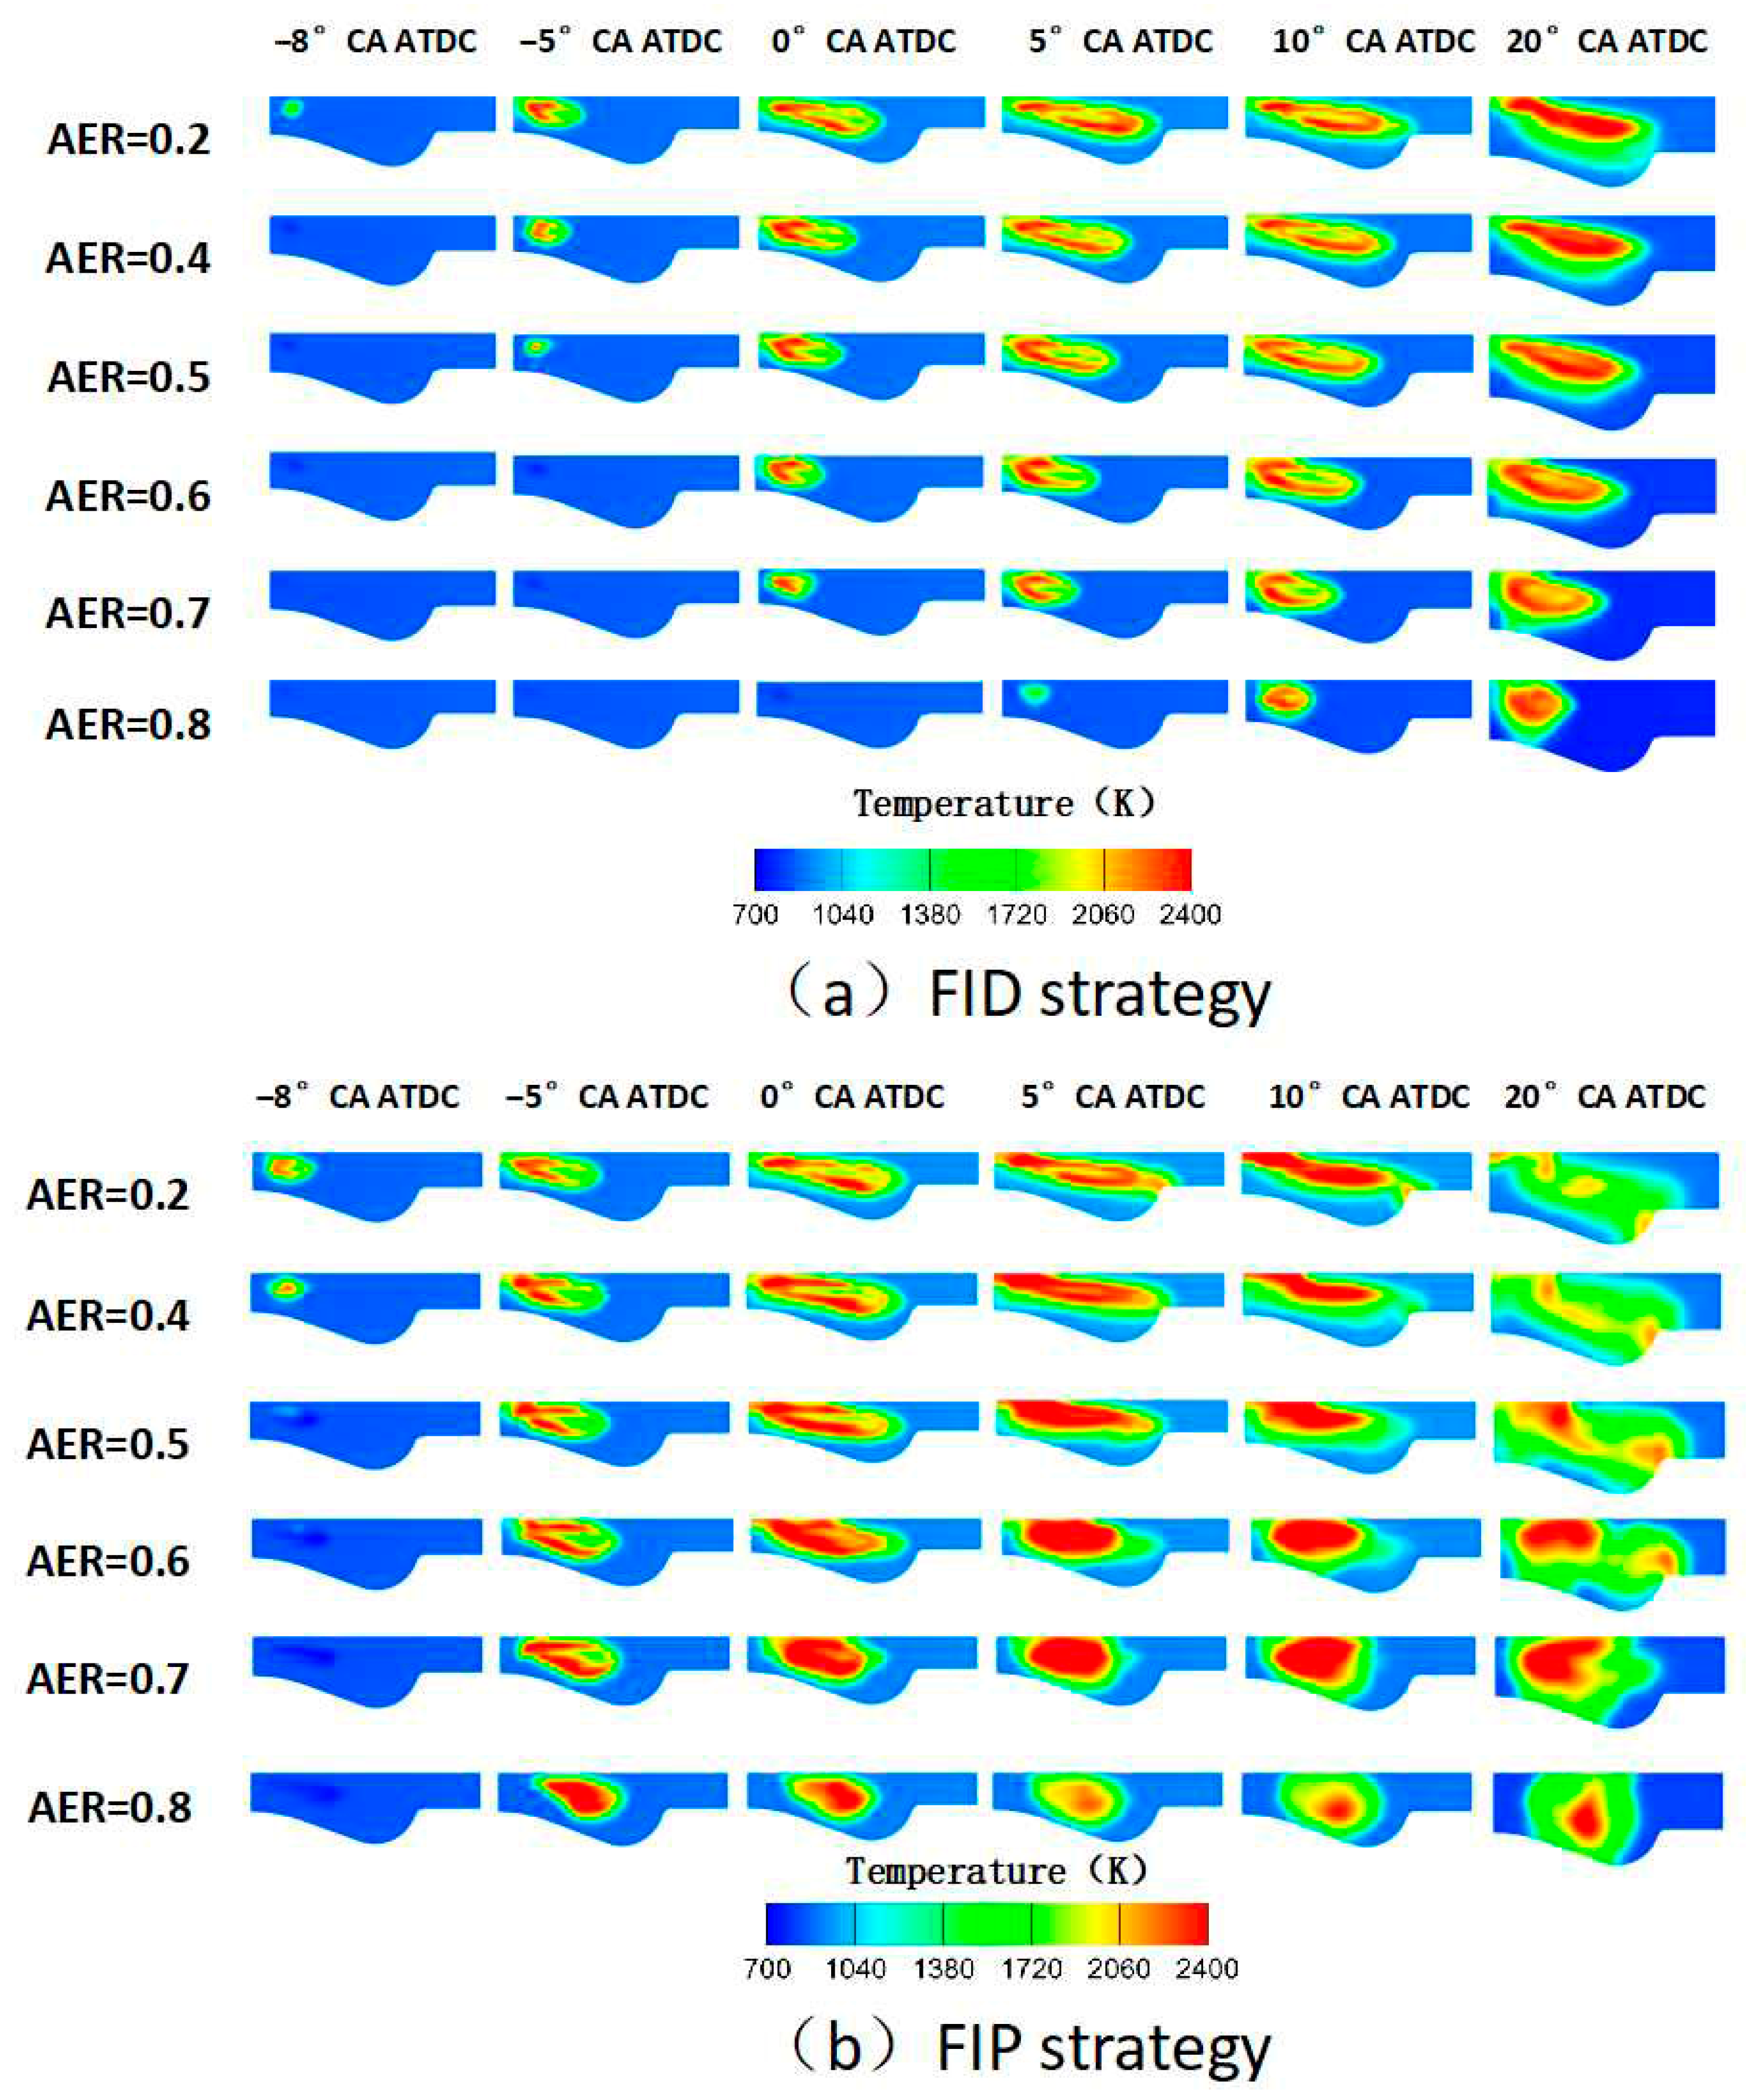
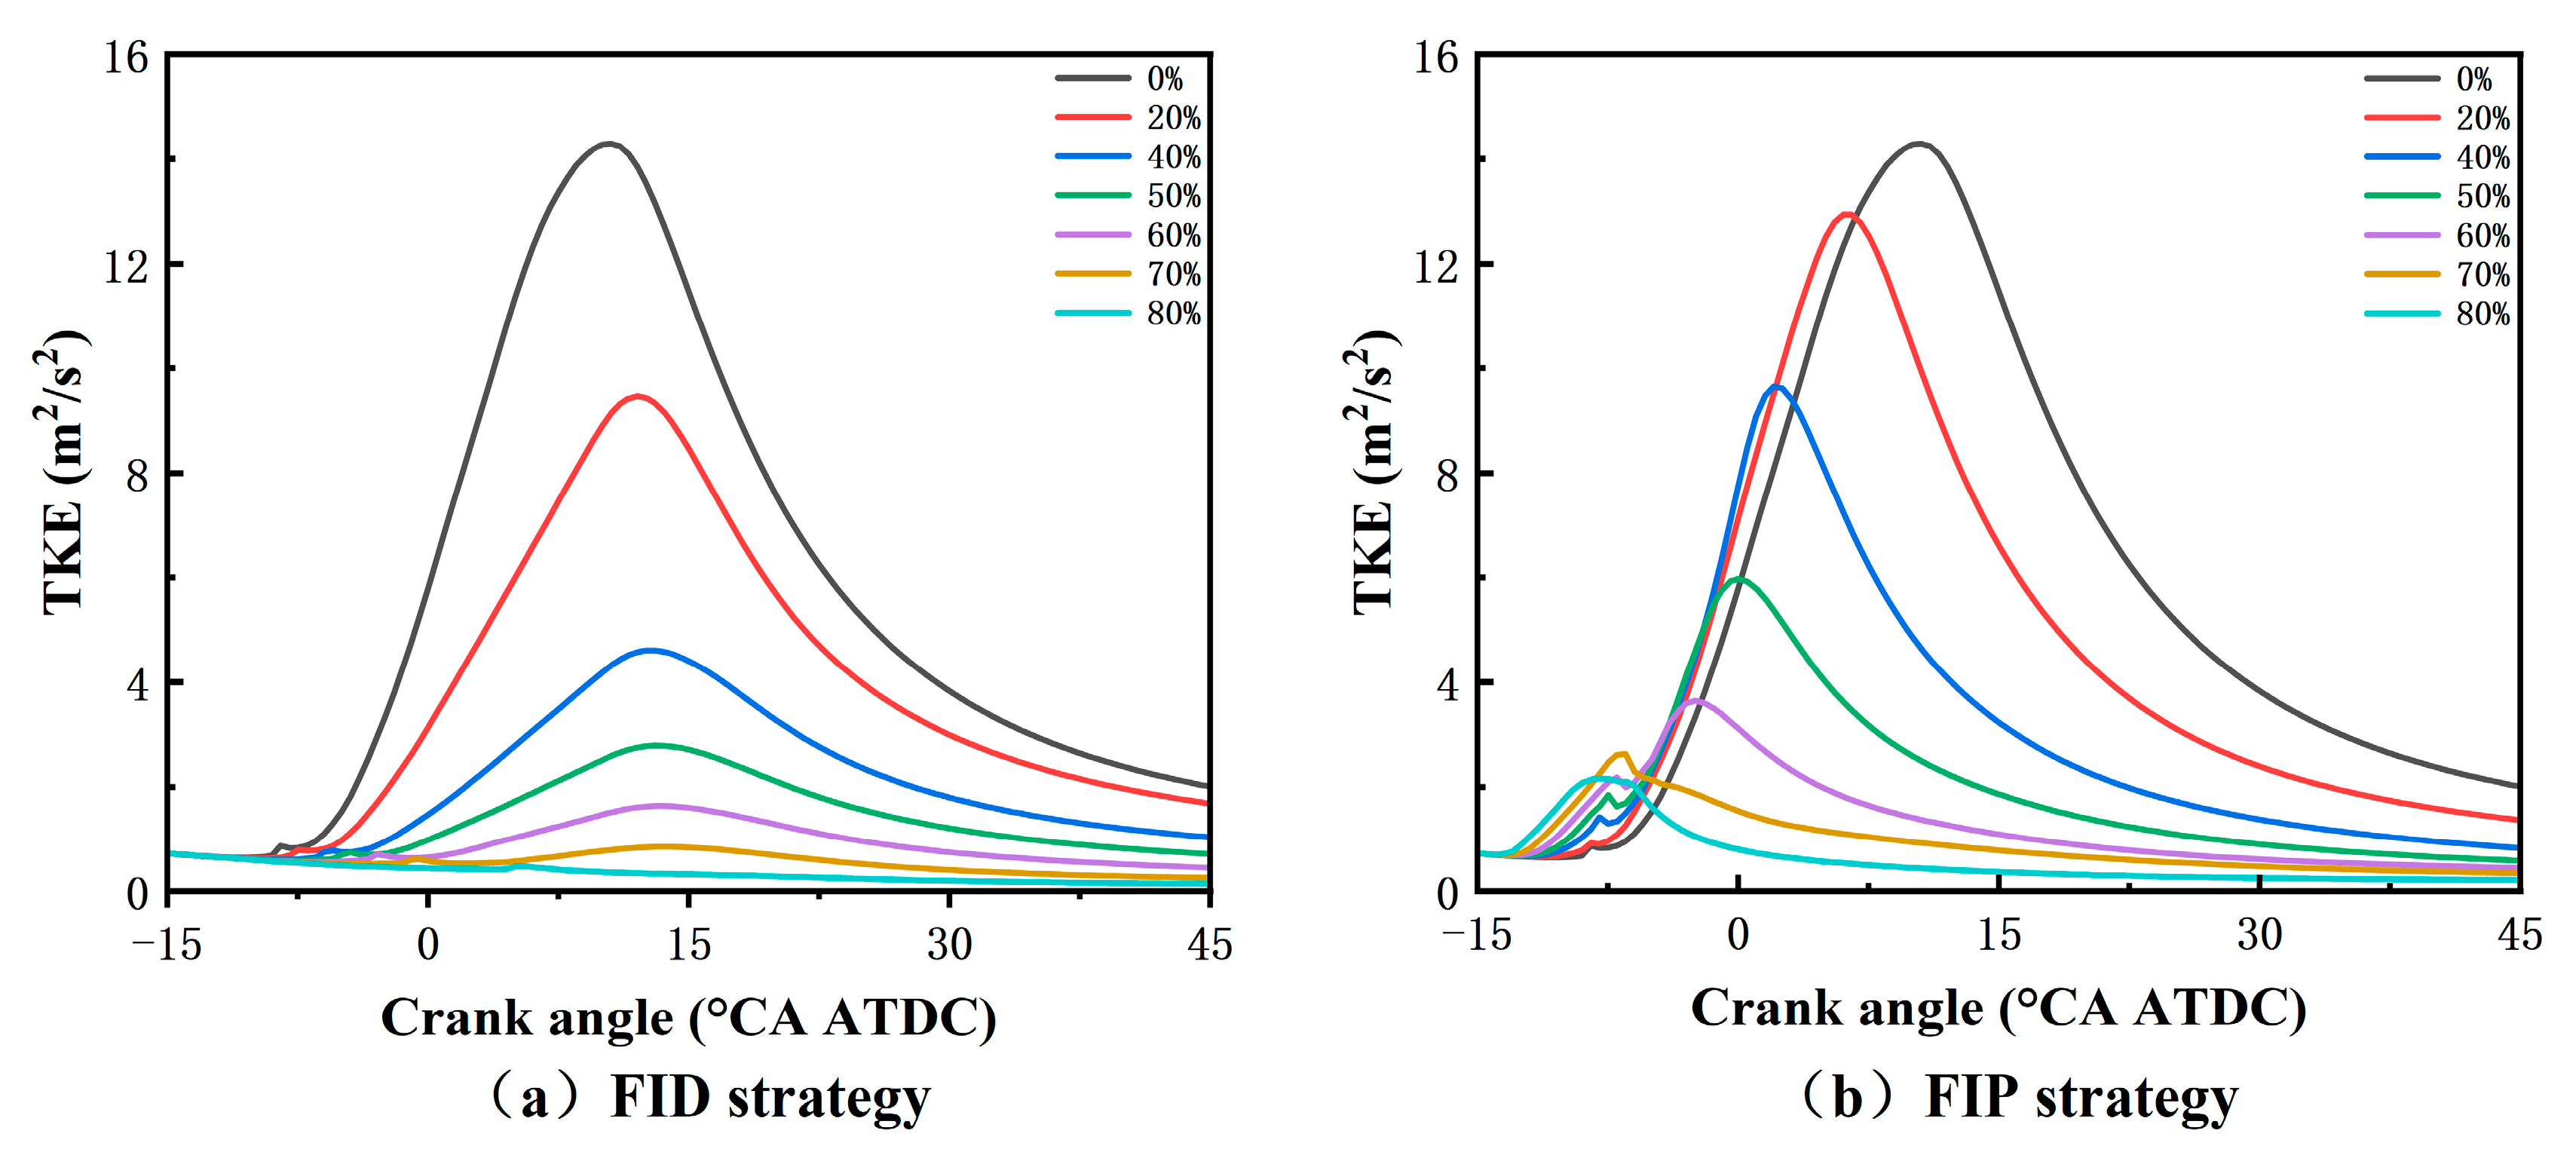
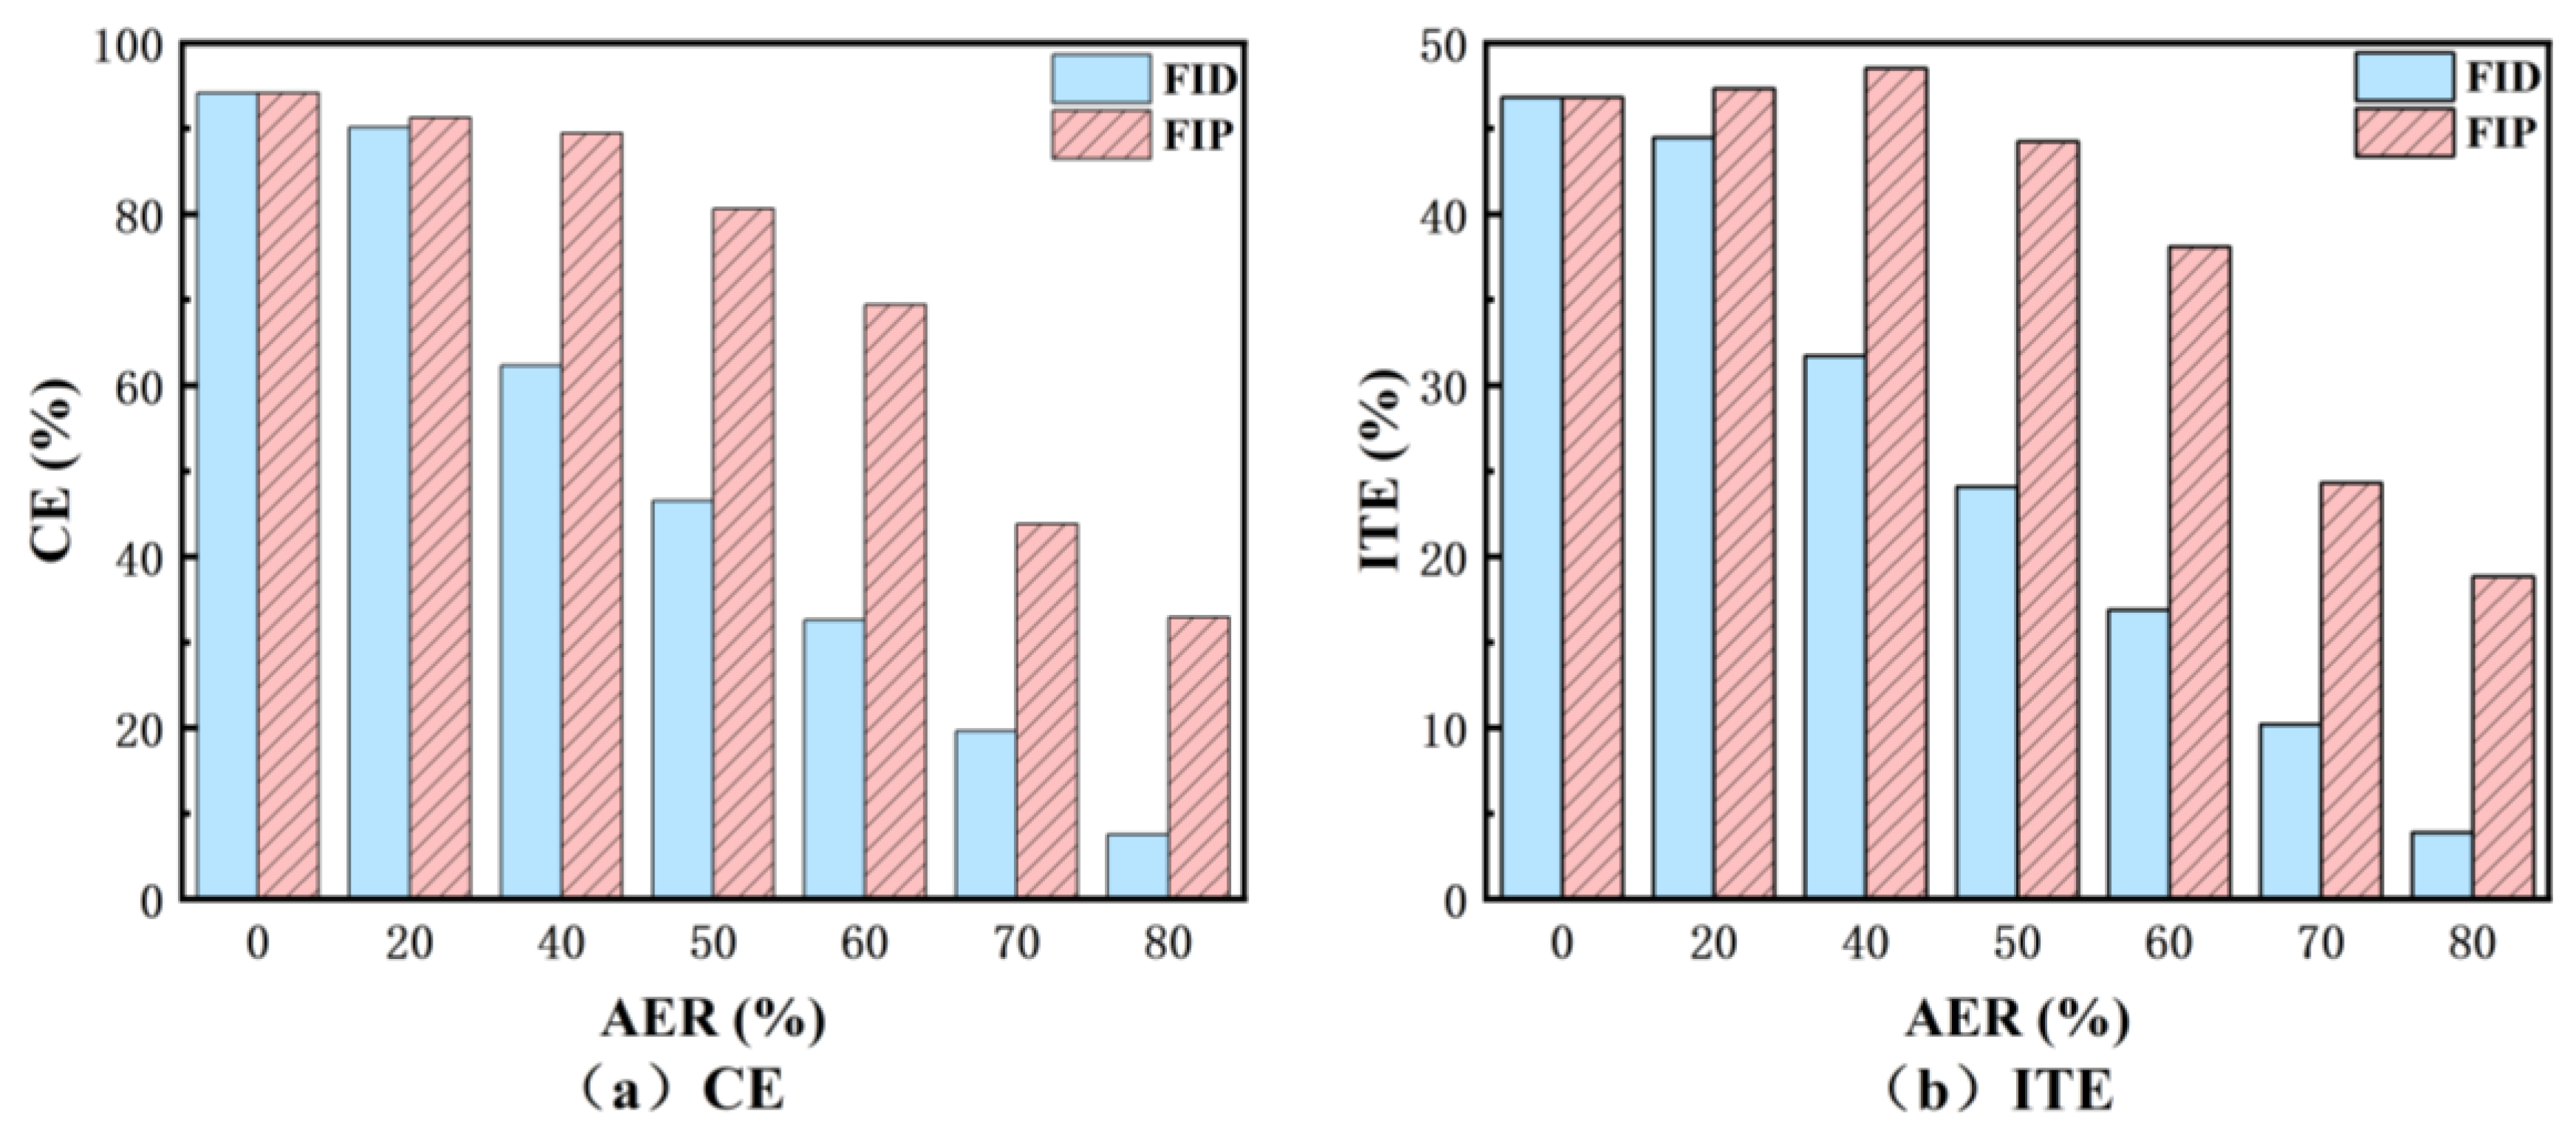
The Fixed Injection Duration (FID) strategy keeps the injection duration constant, which results in a decrease in injection pressure, reducing the diesel’s kinetic energy and leading to poorer atomization. In contrast, the Fixed Injection Pressure (FIP) strategy maintains the injection pressure, allowing for better atomization of the diesel and improved combustion, which results in higher engine performance under this strategy.
(2)
An increase in AER will cause a decrease in the combustion effect of the ADDF engine. For the large-bore marine engine in this study, when the AER is 40%, the FIP strategy can still overcome the adverse effects of ammonia, allowing the engine to achieve higher in-cylinder pressure, heat release rate, and indicated thermal efficiency.
(3)
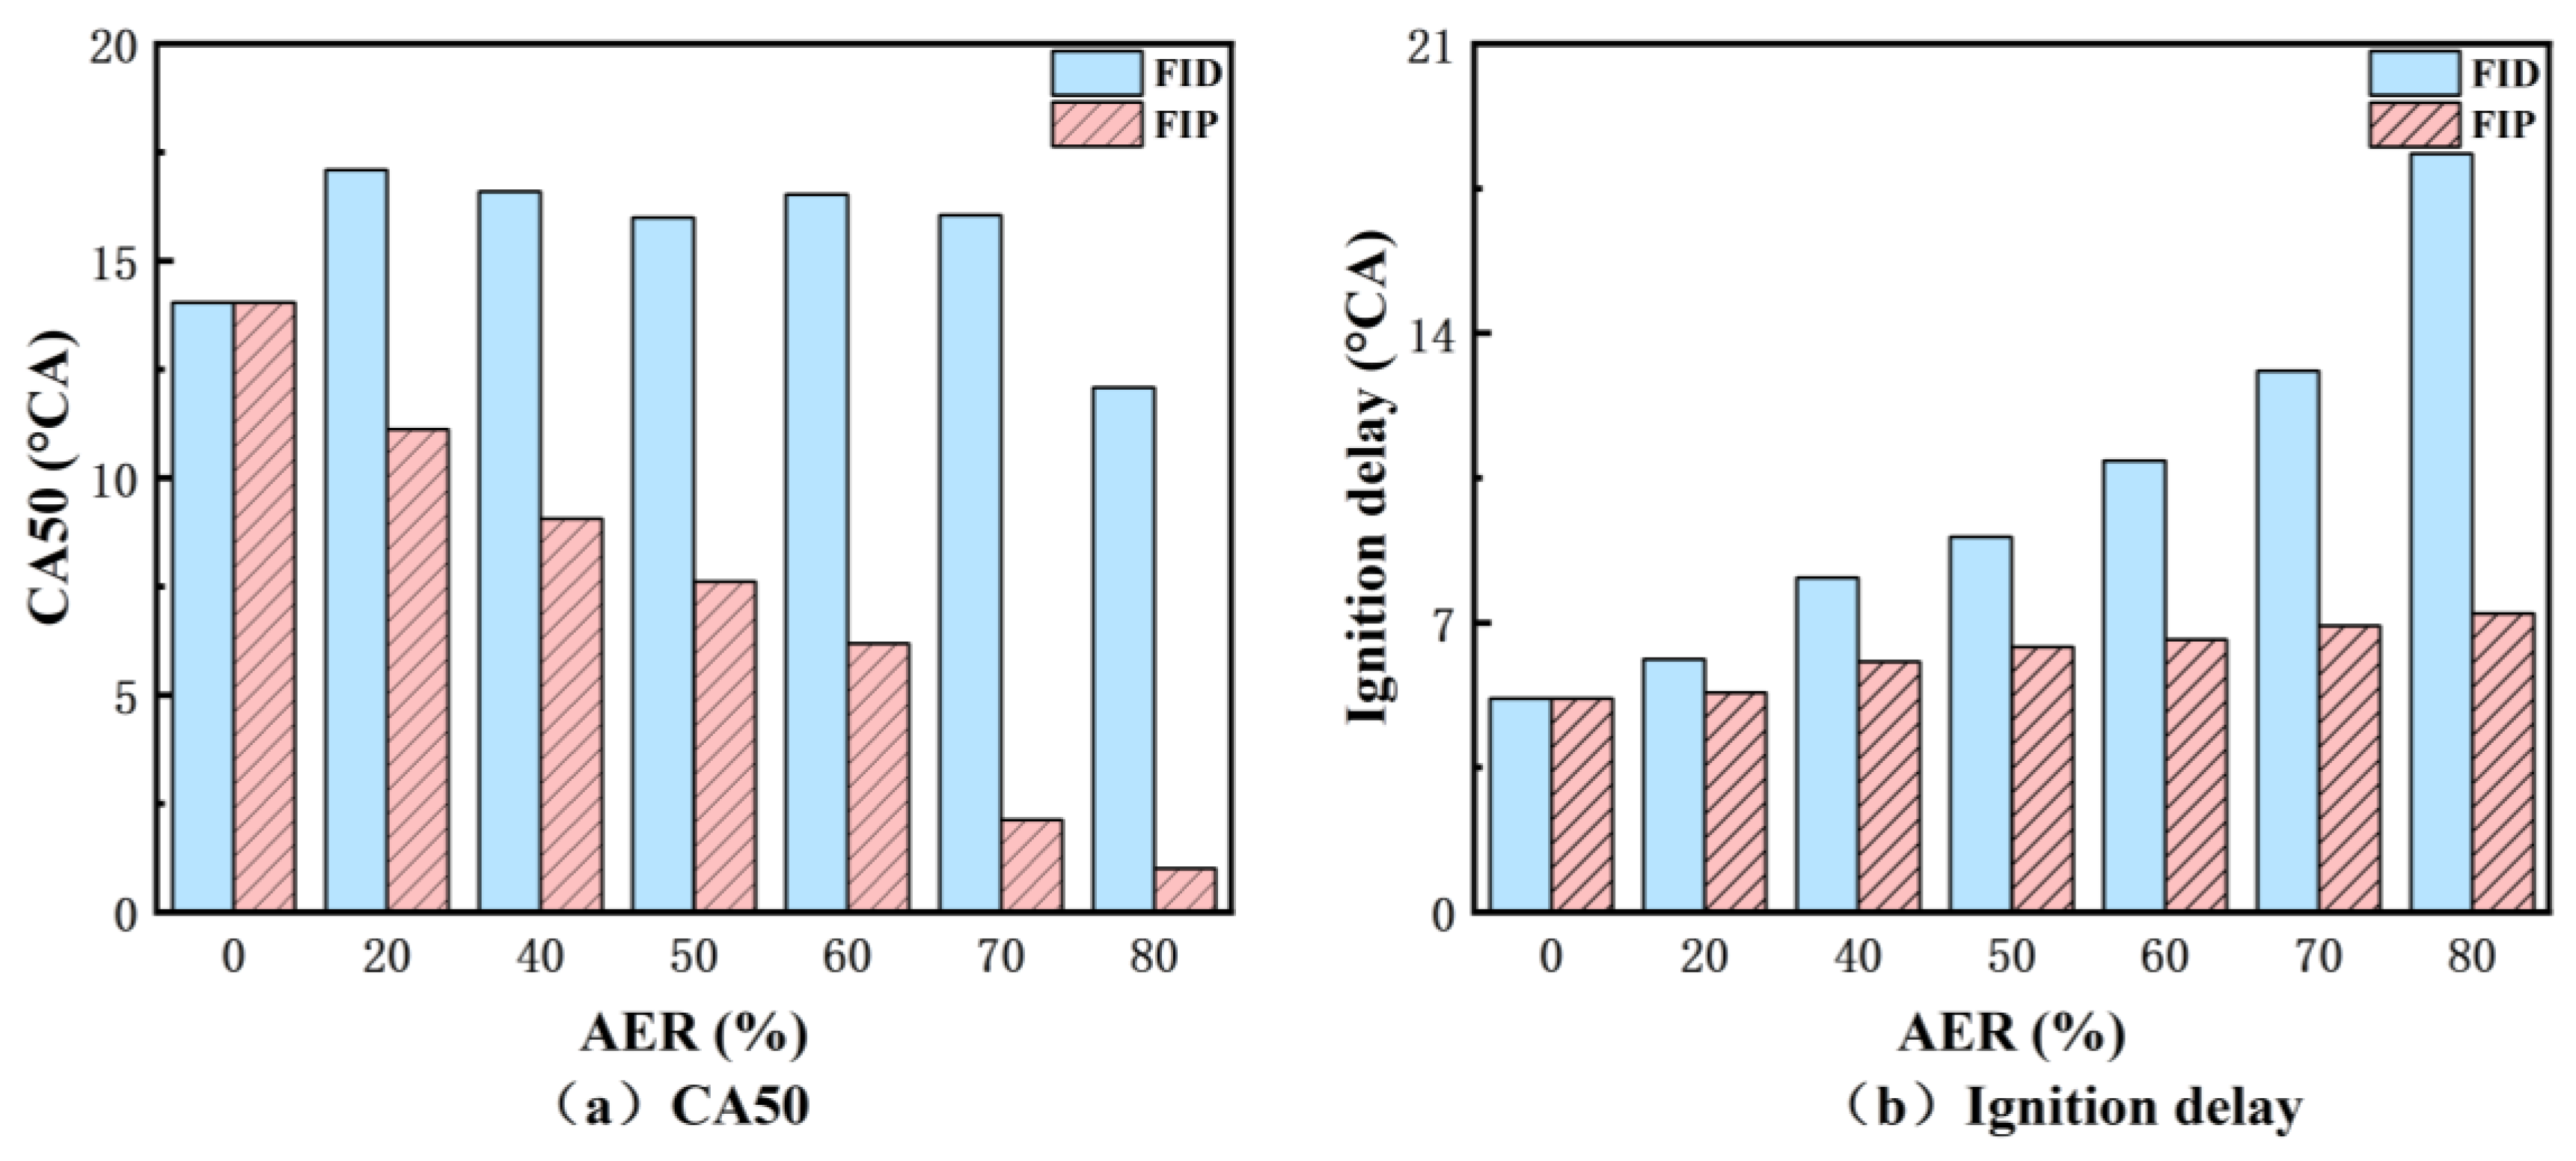
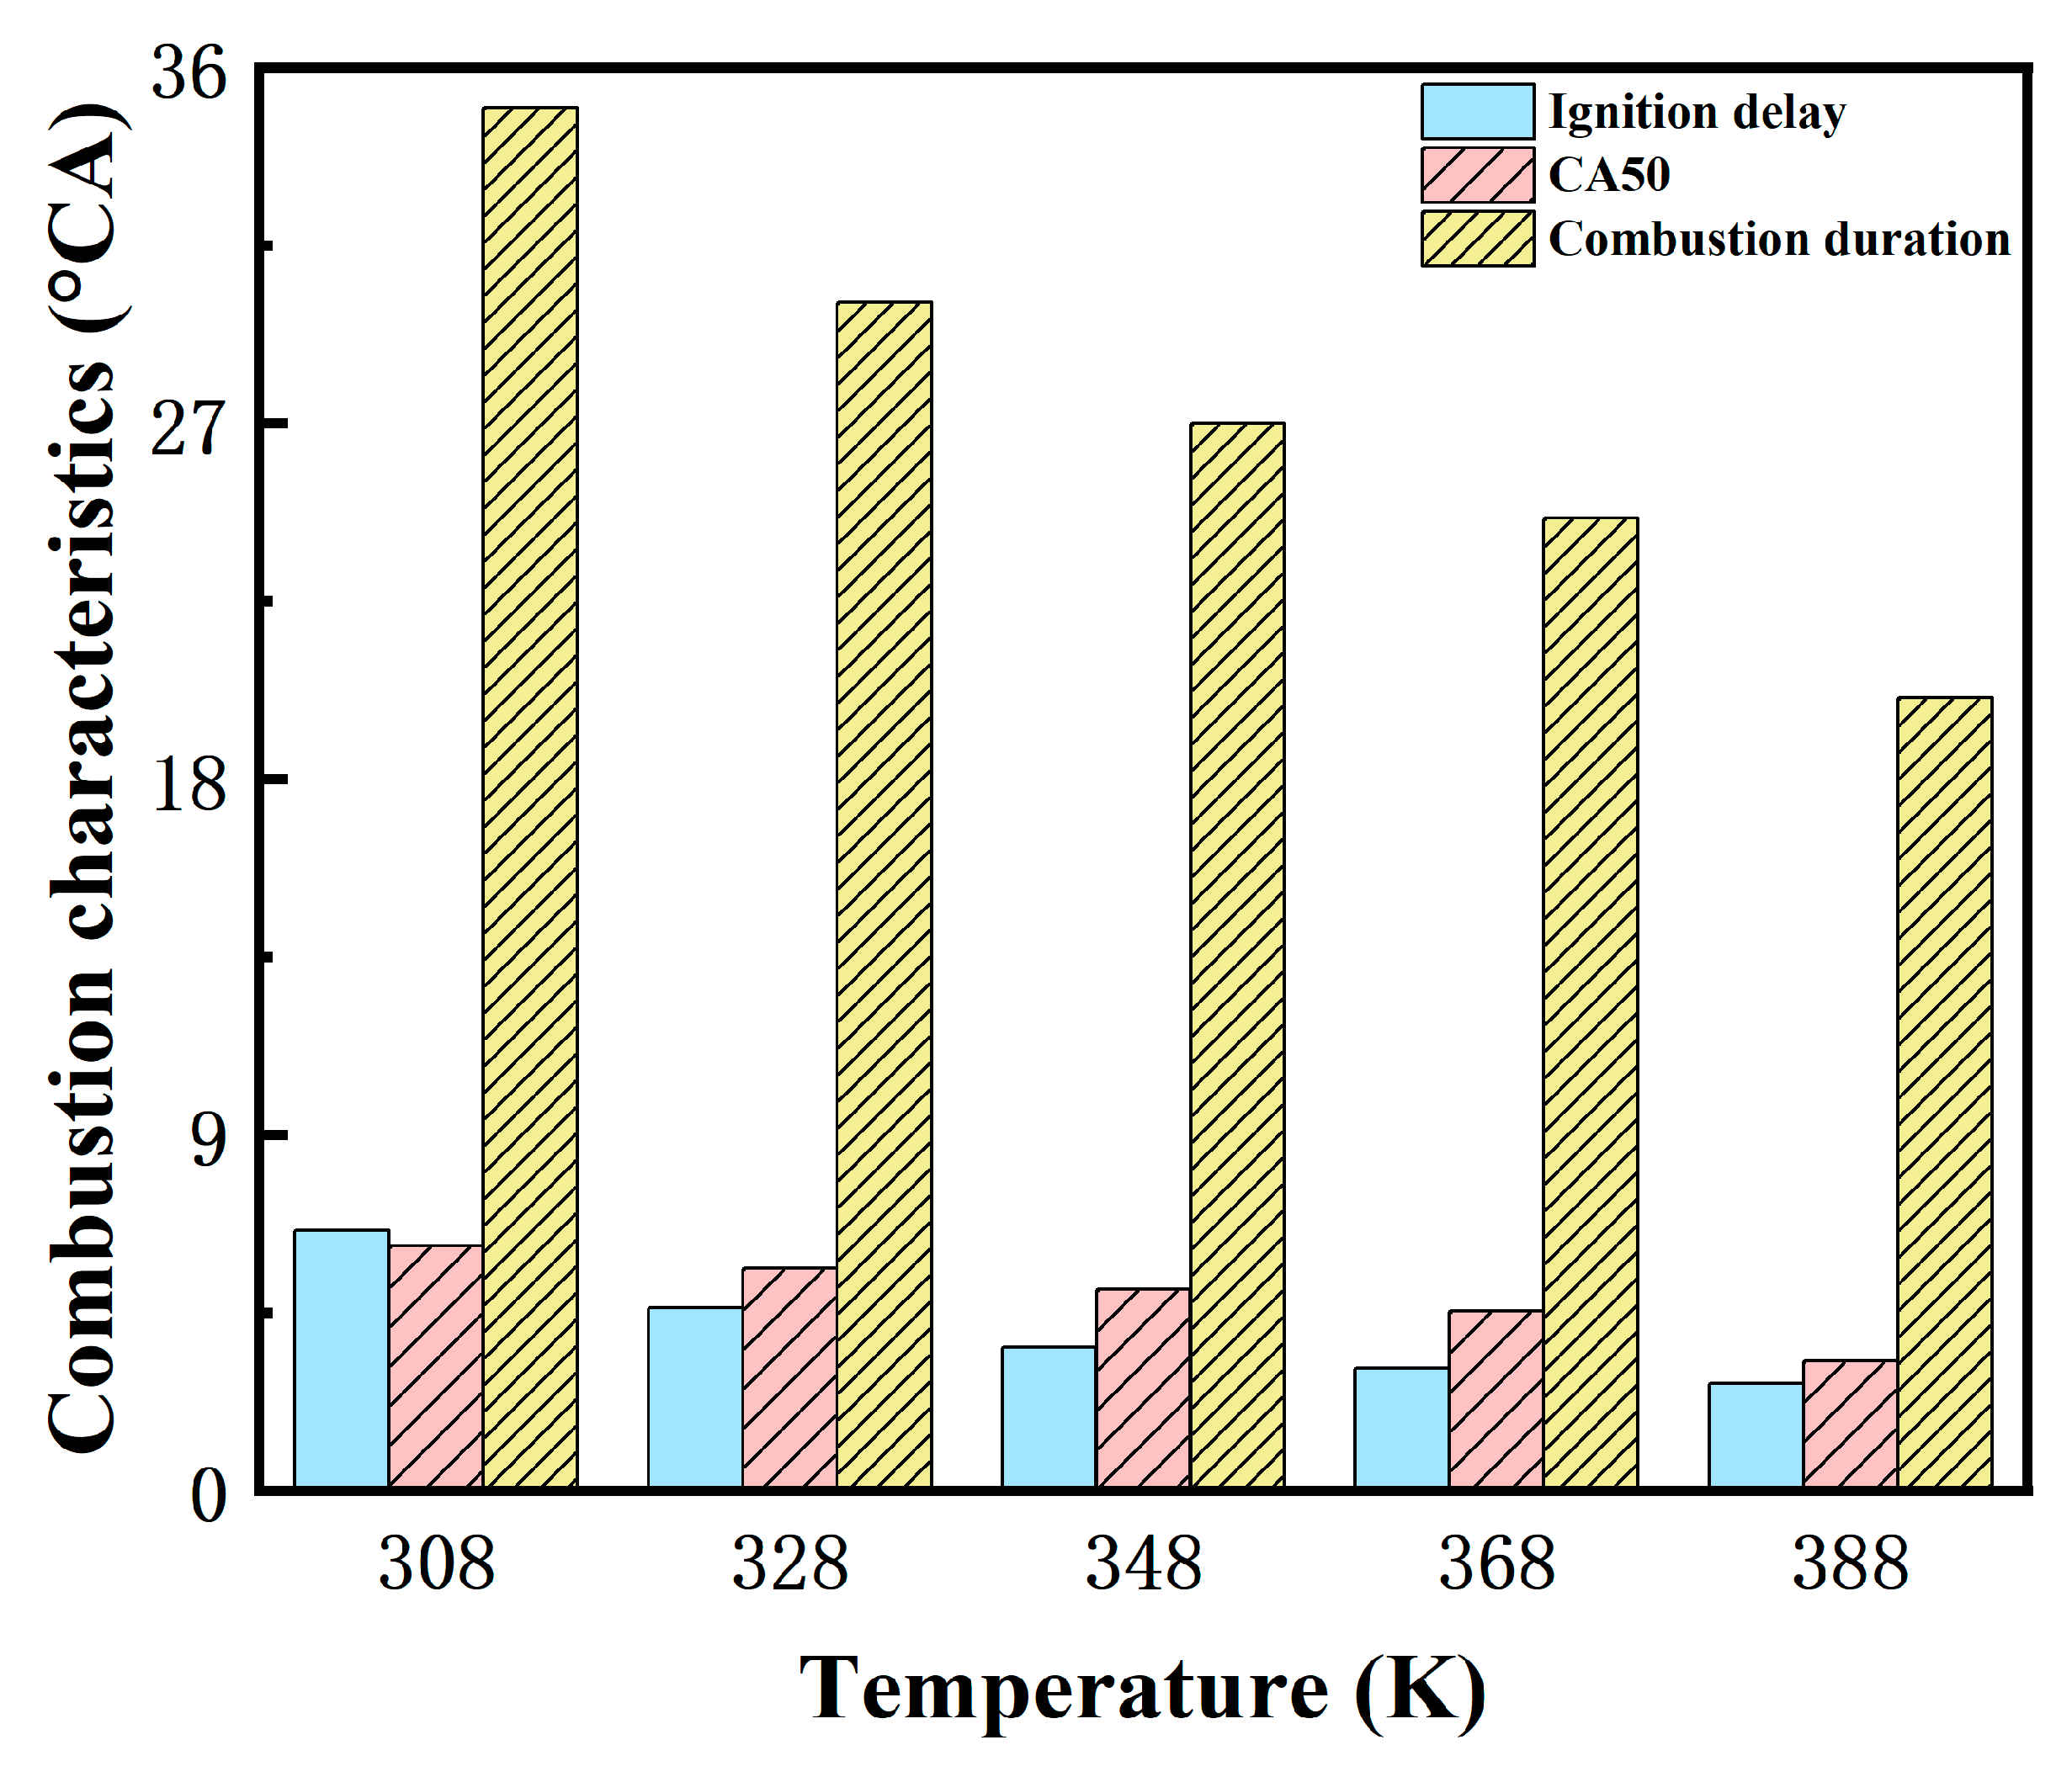
As the initial temperature in the cylinder increases, the combustion environment improves significantly. Ignition delay is shortened, flame propagation speed increases, and the combustion phase CA50 is advanced. The advancement of ignition delay weakens the rapid combustion characteristics in the initial phase, and the effect of premixed combustion becomes less significant. Instead, diesel diffusion combustion dominates, showing significant diffusion combustion effects.
(4)
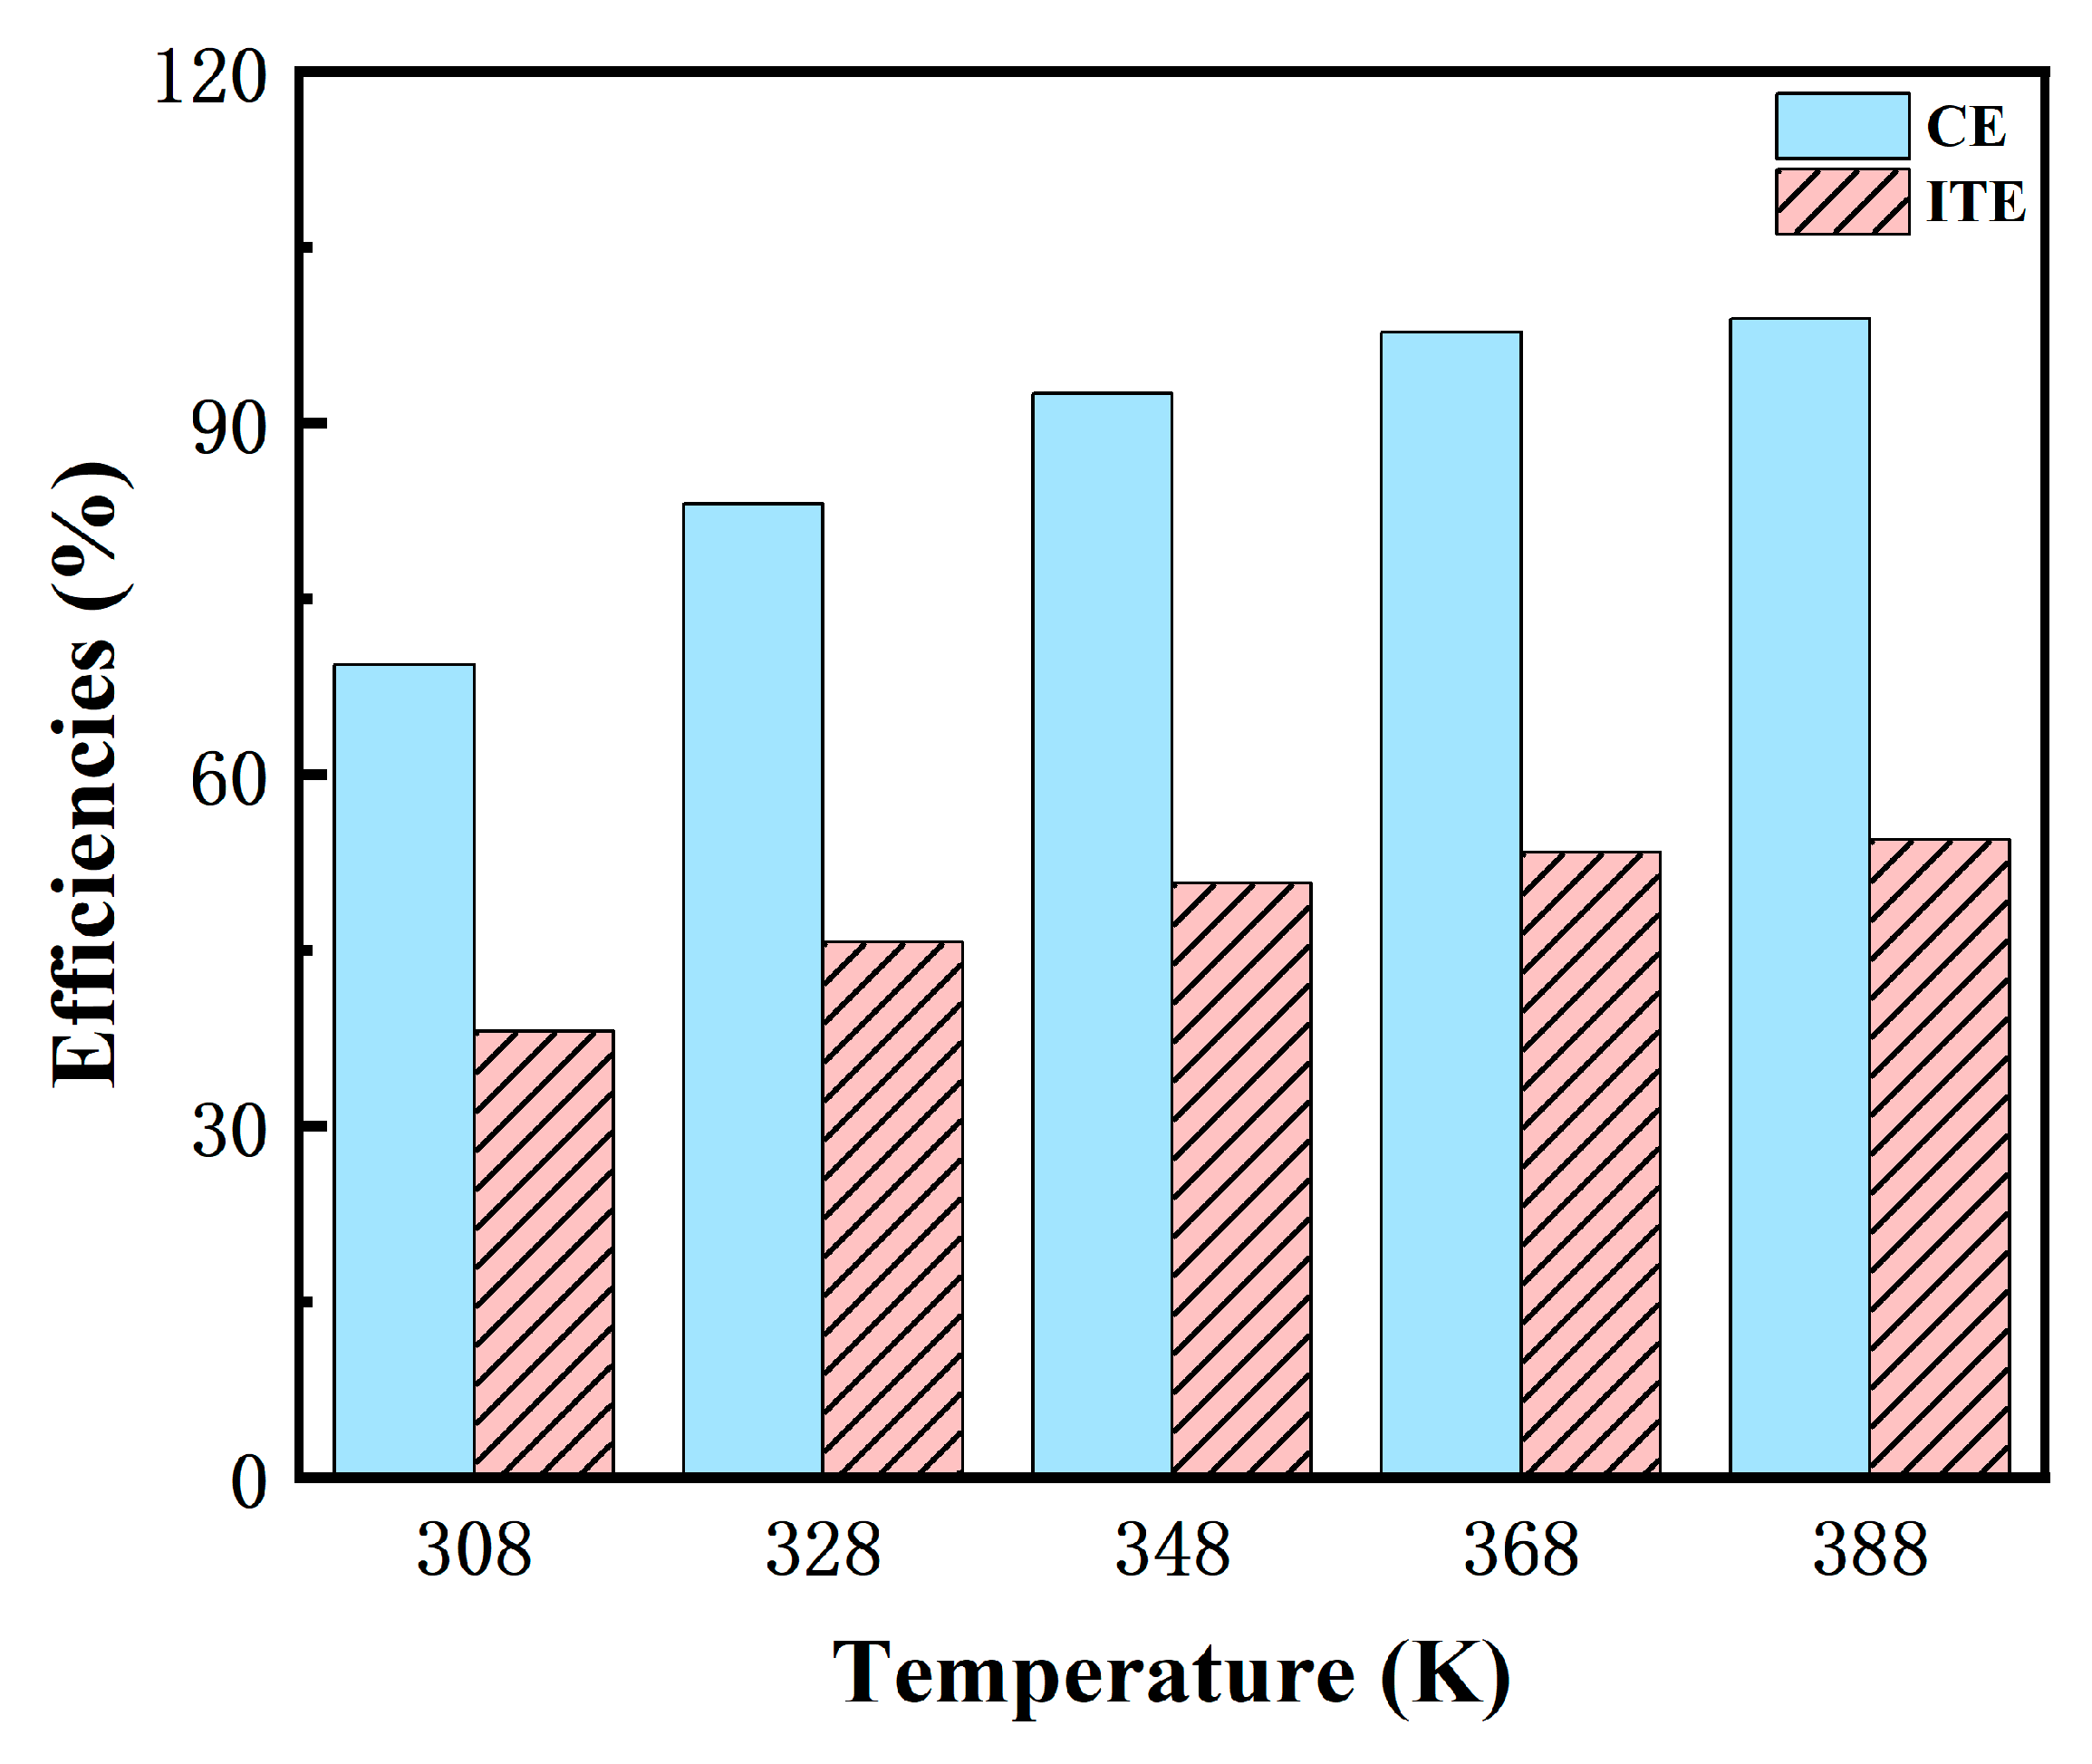
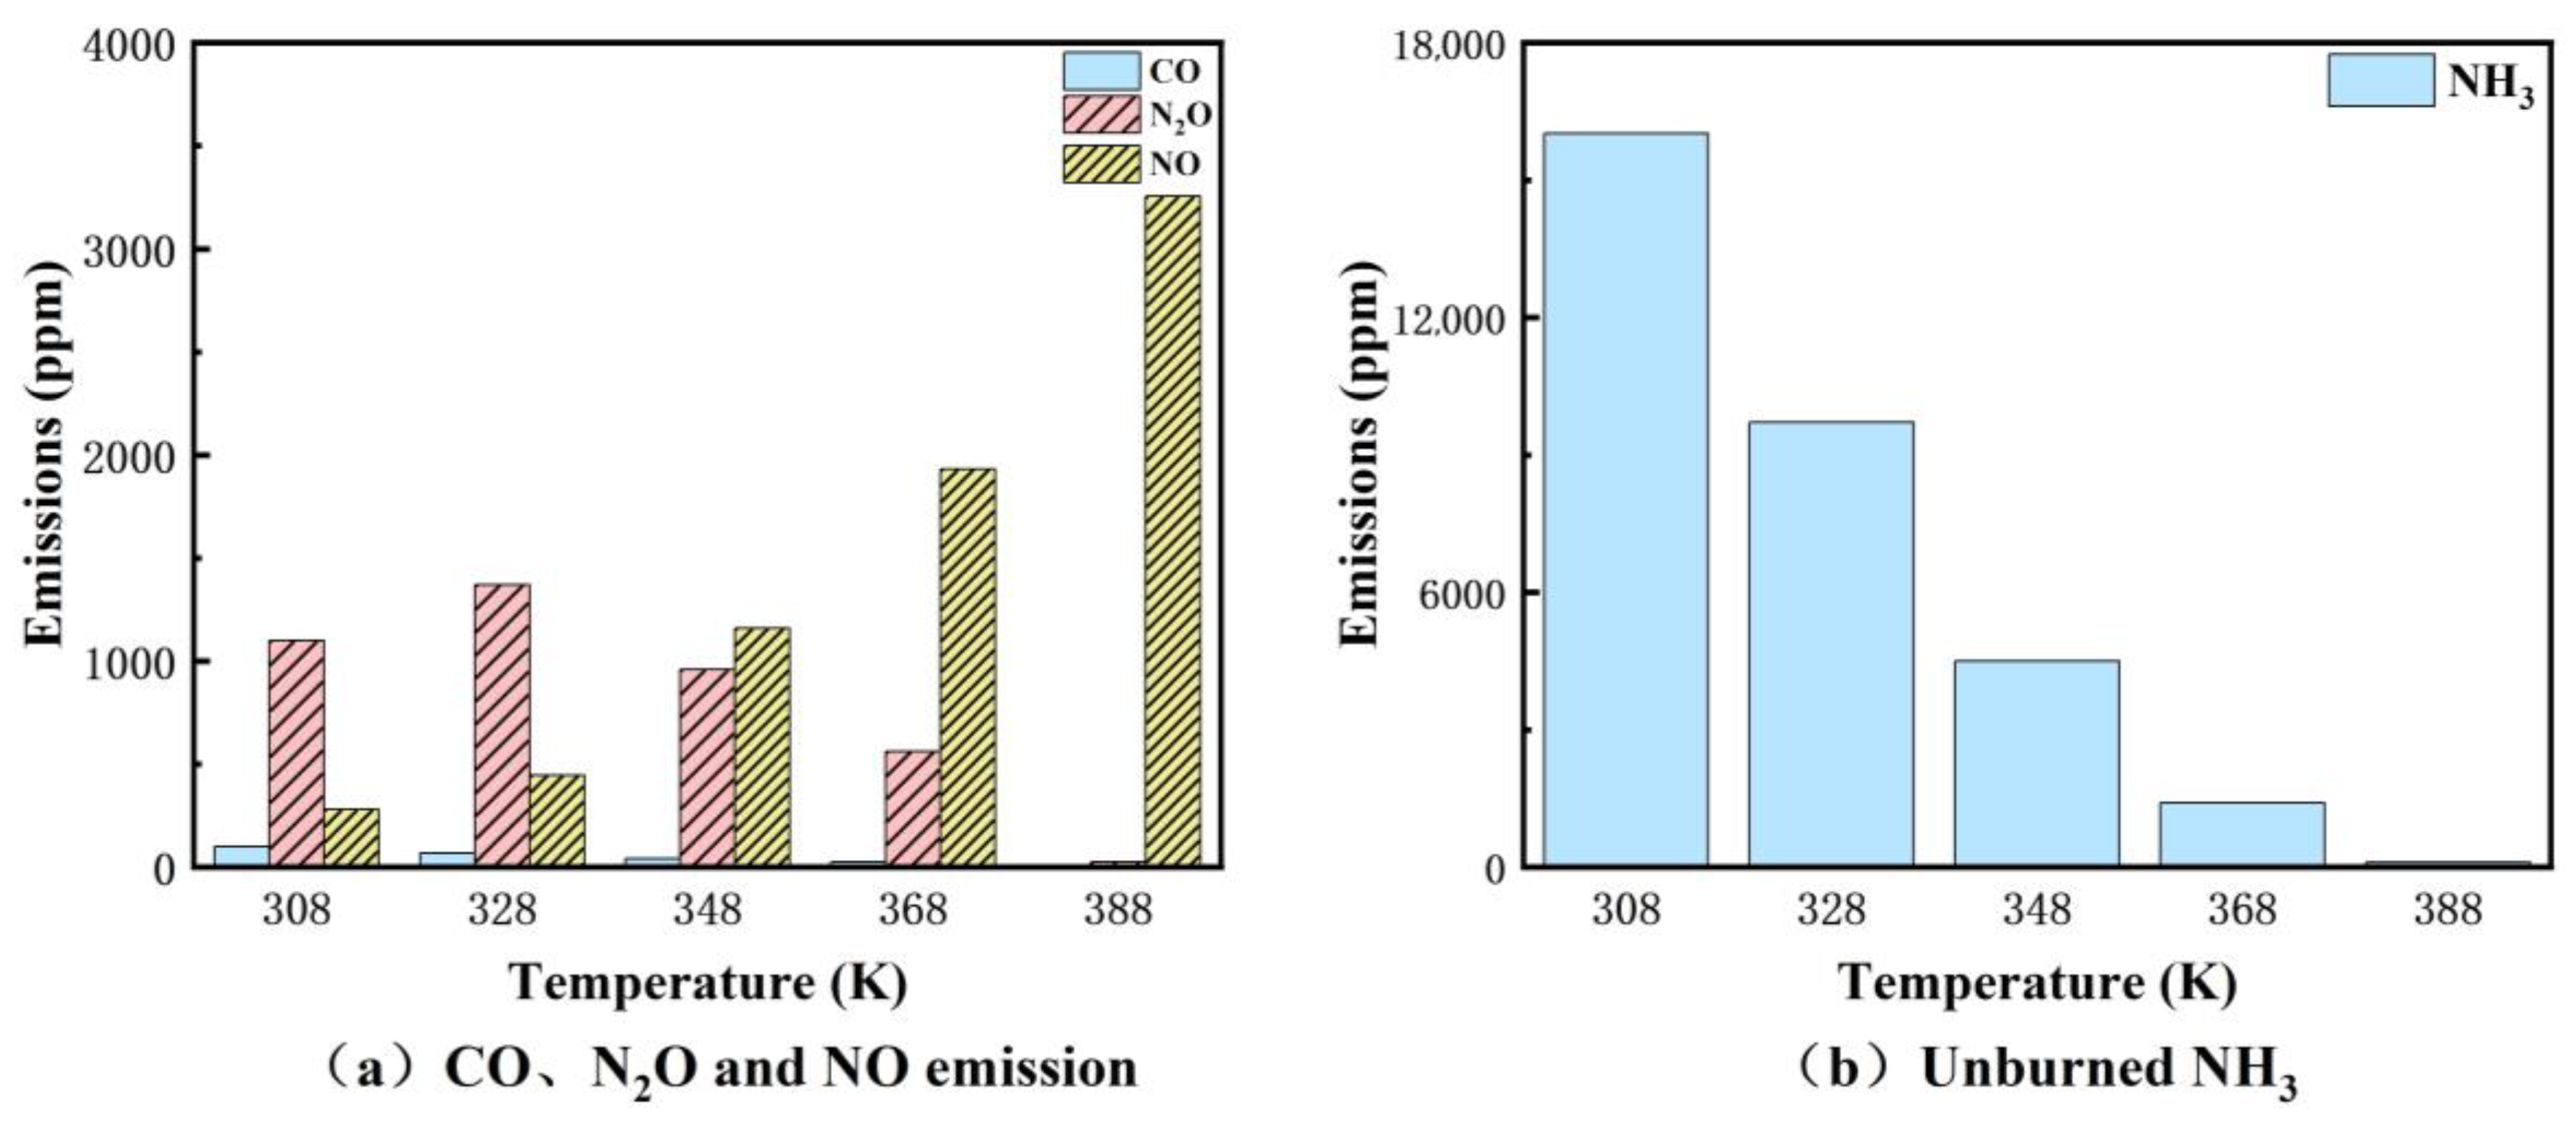
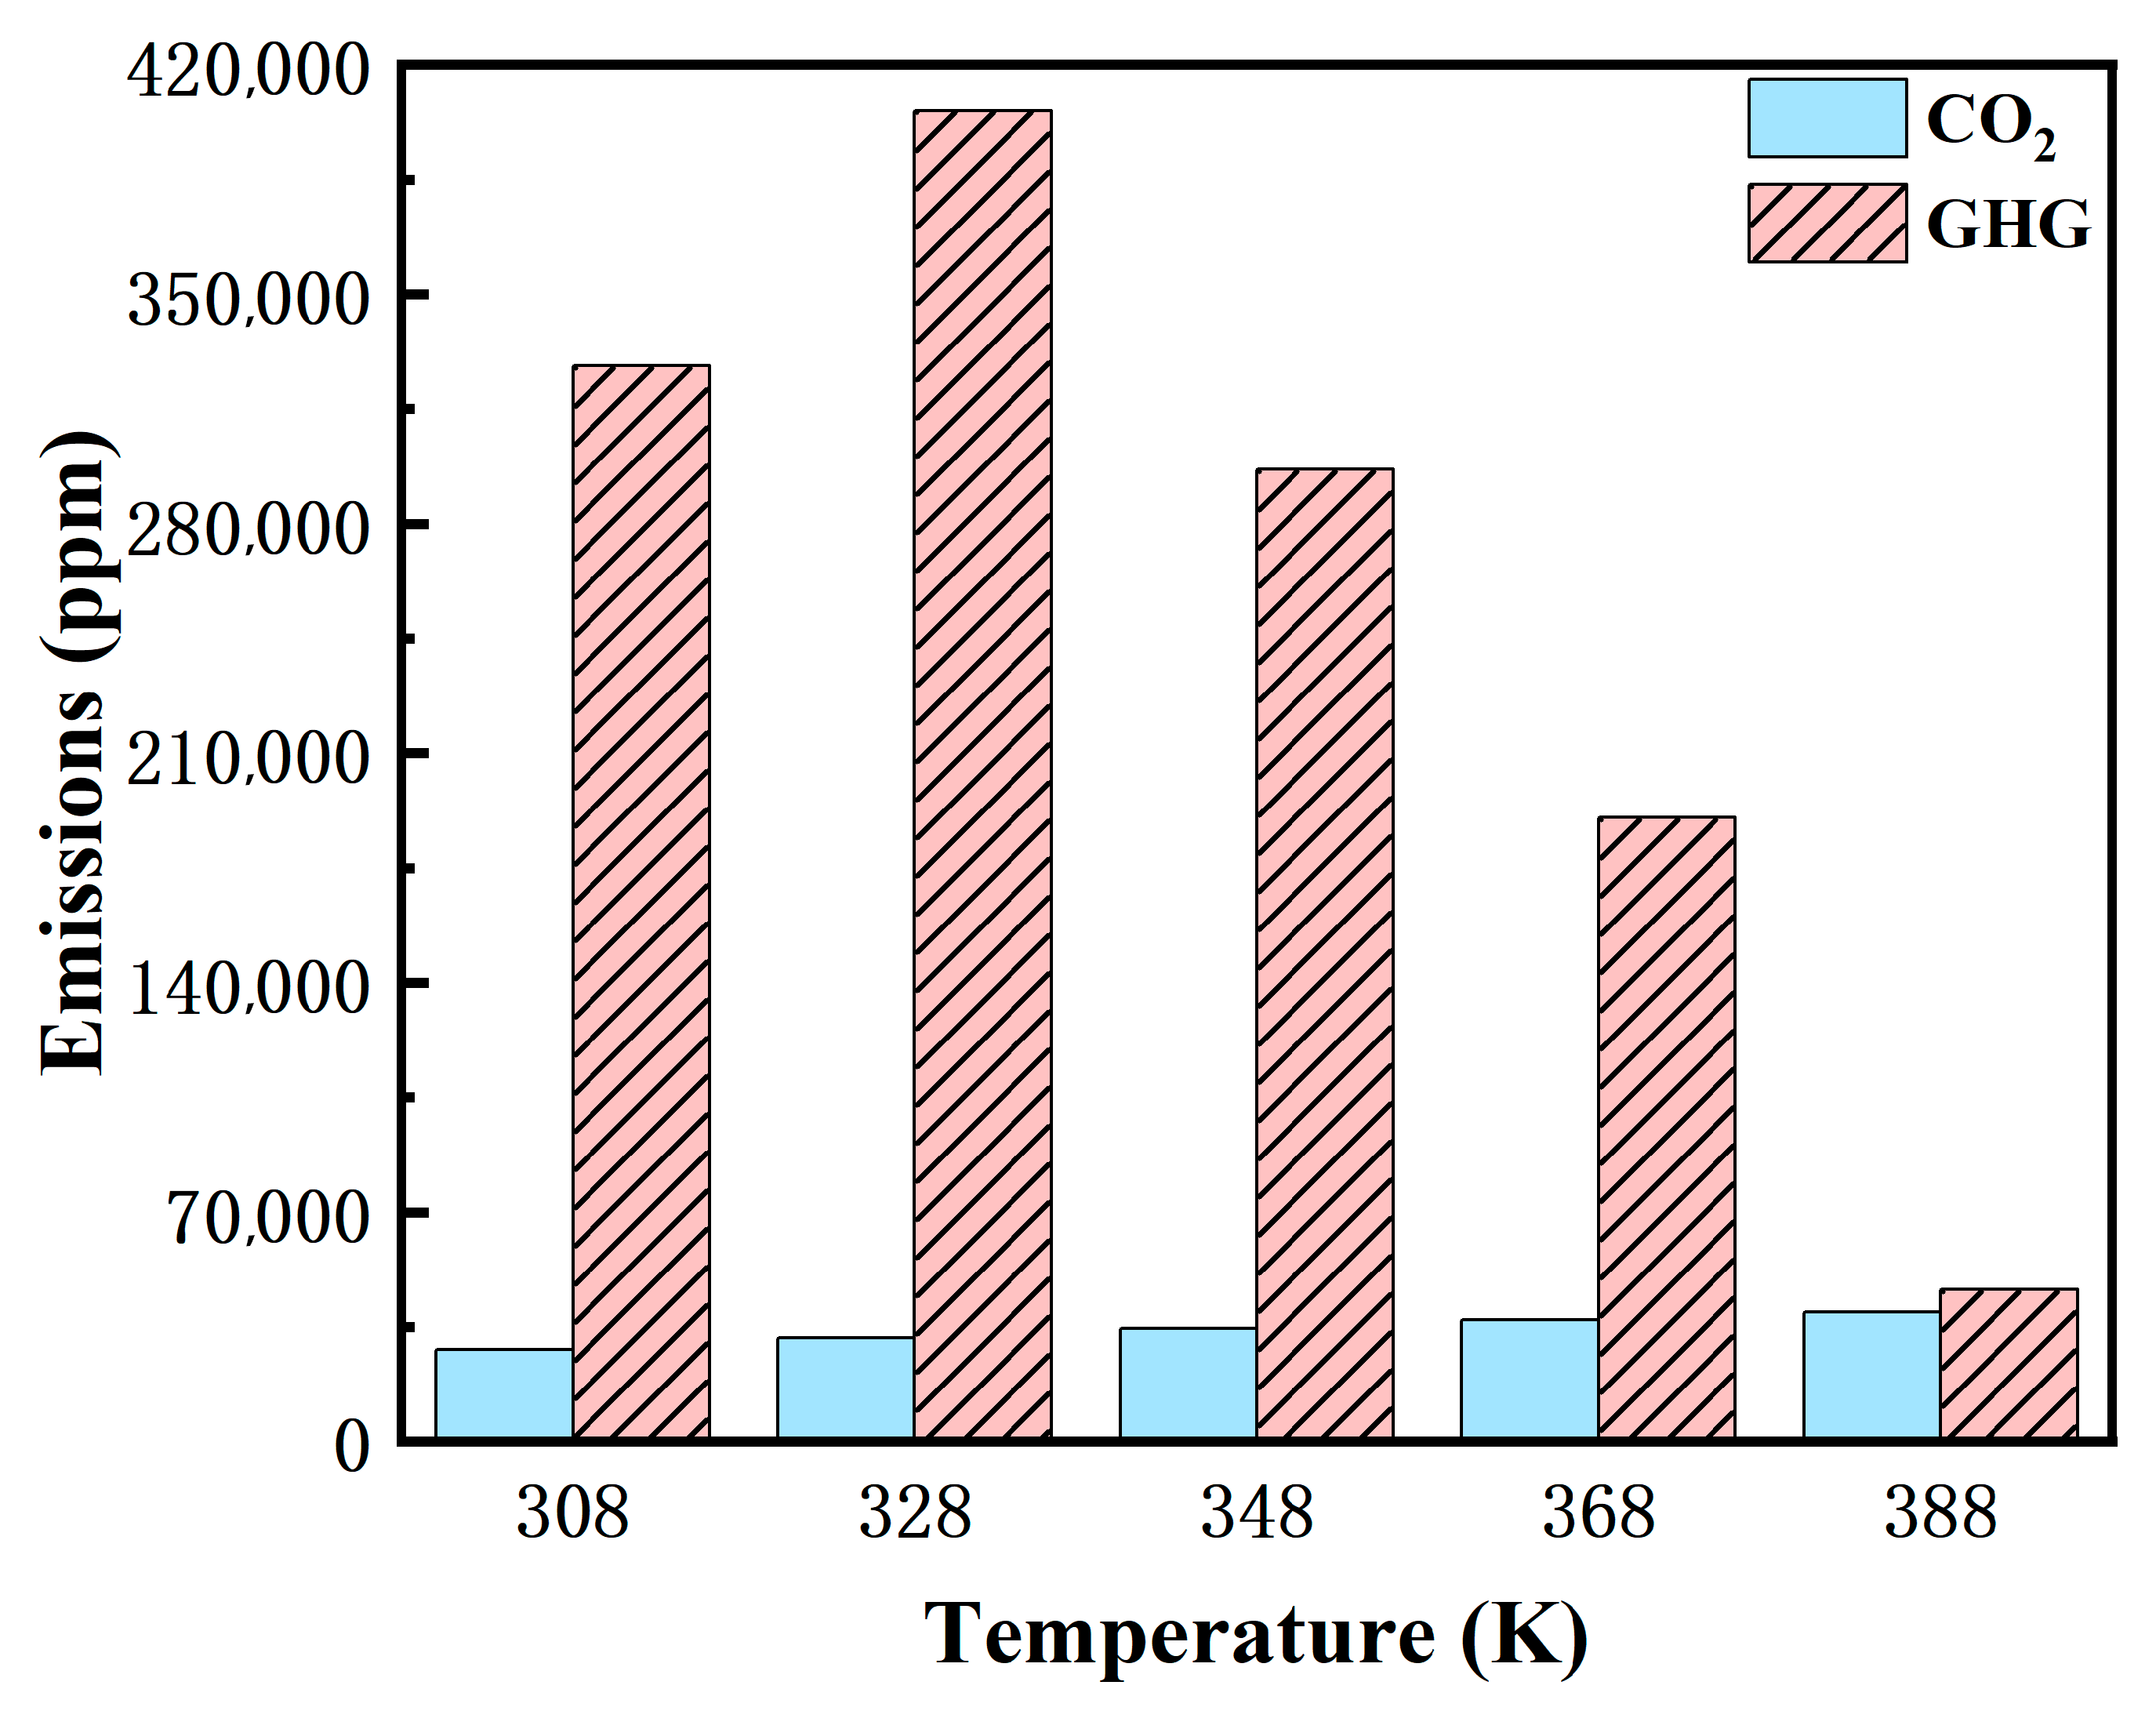
The optimum strategy, utilizing the FIP strategy with an AER of 60% and initial cylinder temperature of 388 K, significantly increases the indicated thermal efficiency to 54.47%, which is 16.36% higher than that of the FIP-only strategy without increasing initial cylinder temperature, and 7.64% higher than that of the pure diesel mode. Additionally, N2O emissions are reduced from 1099 ppm to 25 ppm, and unburned ammonia emissions are reduced from 16,016 ppm to 100 ppm. Compared to the pure diesel mode, greenhouse gas emissions have decreased by 40%.

Author Contributions

Validation, J.W.; Formal analysis, H.L.; Investigation, L.W.; Resources, F.W.; Data curation, L.L.; Writing—original draft, S.L.; Writing—review & editing, W.G.; Visualization, F.H.; Supervision, H.H. All authors have read and agreed to the published version of the manuscript.

Funding

This work was supported by the Young Innovative Talent Program (Grant No. 2022A-135-G), the Ningbo Major Research and Development Plan Project (Grant No. 2022Z151&2024Z134), and the National Natural Science Foundation of China (Grant No. 22302044). This work was also supported by the Guangxi Bagui Young Scholars Project.

Data Availability Statement

The authors do not have permission to share data.

Conflicts of Interest

Authors Wei Guan, Jie Wu, Hua Lou, Lei Wang, Haibin He were employed by the company Ningbo C.S.I. Power & Machinery Group Co., Ltd. The remaining authors declare that the research was conducted in the absence of any commercial or financial relationships that could be construed as a potential conflict of interest.

References

  1. Cline, W.R. Scientific basis for the greenhouse effect. Econ. J. 1991, 101, 904–919. [Google Scholar] [CrossRef]
  2. Ledley, T.S.; Sundquist, E.T.; Schwartz, S.E.; Hall, D.K.; Fellows, J.D.; Killeen, T.L. Climate change and greenhouse gases. Eos Trans. Am. Geophys. Union 1999, 80, 453–458. [Google Scholar] [CrossRef]
  3. Johnson, B.T. Diesel engine emissions and their control. Platin. Met. Rev. 2008, 52, 23–37. [Google Scholar] [CrossRef]
  4. Corbett, J.J.; Fischbeck, P. Emissions from ships. Science 1997, 278, 823–824. [Google Scholar] [CrossRef]
  5. Bayramoğlu, K.; Bayraktar, M.; Seyhan, A.; Yuksel, O. Evaluation of techniques to reduce carbon emissions from ships within the scope of revised greenhouse gas emission targets for 2030, 2040, and 2050. Ocean. Eng. 2025, 334, 121605. [Google Scholar] [CrossRef]
  6. Milojević, S.; Glišović, J.; Savić, S.; Bošković, G.; Bukvić, M.; Stojanović, B. Particulate matter emission and air pollution reduction by applying variable systems in tribologically optimized diesel engines for vehicles in road traffic. Atmosphere 2024, 15, 184. [Google Scholar] [CrossRef]
  7. Shurpali, N.; Agarwal, A.K.; Srivastava, V. Greenhouse Gas Emissions; Energy, Environment, and Sustainability; Springer: Singapore, 2019. [Google Scholar] [CrossRef]
  8. Castresana, J.; Gabina, G.; Martin, L.; Uriondo, Z. Comparative performance and emissions assessments of a single-cylinder diesel engine using artificial neural network and thermodynamic simulation. Appl. Therm. Eng. 2021, 185, 116343. [Google Scholar] [CrossRef]
  9. Marinković, D.; Dezső, G.; Milojević, S. Application of machine learning during maintenance and exploitation of electric vehicles. Adv. Eng. Lett. 2024, 3, 132–140. [Google Scholar] [CrossRef]
  10. Perčić, M.; Vladimir, N.; Jovanović, I.; Koričan, M. Application of fuel cells with zero-carbon fuels in short-sea shipping. Appl. Energy 2022, 309, 118463. [Google Scholar] [CrossRef]
  11. Wagner, N. Towards sustainable maritime transport: Focus on the early phase of technology development related to alternative fuels. Energy Sustain. Dev. 2025, 85, 101686. [Google Scholar] [CrossRef]
  12. Qi, H.; Huang, X.; Sheeraz, M. Green financing for renewable energy development: Driving the attainment of zero-emission targets. Renew. Energy 2023, 213, 30–37. [Google Scholar] [CrossRef]
  13. Sagin, S.V.; Sagin, S.S.; Fomin, O.; Gaichenia, O.; Zablotskyi, Y.; Píštěk, V.; Kučera, P. Use of biofuels in marine diesel engines for sustainable and safe maritime transport. Renew. Energy 2024, 224, 120221. [Google Scholar] [CrossRef]
  14. Ogden, J.M. Hydrogen: The fuel of the future? Phys. Today 2002, 55, 69–75. [Google Scholar] [CrossRef]
  15. Zamfirescu, C.; Dincer, I. Using ammonia as a sustainable fuel. J. Power Sources 2008, 185, 459–465. [Google Scholar] [CrossRef]
  16. Tawalbeh, M.; Murtaza, S.Z.M.; Al-Othman, A.; Alami, A.H.; Singh, K.; Olabi, A.G. Ammonia: A versatile candidate for the use in energy storage systems. Renew. Energy 2022, 194, 955–977. [Google Scholar] [CrossRef]
  17. Erdemir, D.; Dincer, I. A perspective on the use of ammonia as a clean fuel: Challenges and solutions. Int. J. Energy Res. 2021, 45, 4827–4834. [Google Scholar] [CrossRef]
  18. Dolan, R.H.; Anderson, J.E.; Wallington, T.J. Outlook for ammonia as a sustainable transportation fuel. Sustain. Energy Fuels 2021, 5, 4830–4841. [Google Scholar] [CrossRef]
  19. Rocha, R.C.; Zhong, S.; Xu, L.; Bai, X.; Costa, M.; Cai, X.; Kim, H.; Brackmann, C.; Li, Z.; Aldén, M. Structure and laminar flame speed of an ammonia/methane/air premixed flame under varying pressure and equivalence ratio. Energy Fuels 2021, 35, 7179–7192. [Google Scholar] [CrossRef]
  20. Nie, X.; Bi, Y.; Shen, L.; Lei, J.; Wan, M.; Wang, Z.; Liu, S.; Huang, F. Combustion and emission characteristics of ammonia-diesel dual fuel engine at different altitudes. Fuel 2024, 371, 132072. [Google Scholar] [CrossRef]
  21. Chen, Y.; Zhang, J.; Zhang, Z.; Zhang, B.; Hu, J.; Zhong, W.; Ye, Y. Effect of ammonia energy ratio and load on combustion and emissions of an ammonia/diesel dual-fuel engine. Energy 2024, 302, 131860. [Google Scholar] [CrossRef]
  22. Xu, L.; Xu, S.; Bai, X.S.; Repo, J.A.; Hautala, S.; Hyvönen, J. Performance and emission characteristics of an ammonia/diesel dual-fuel marine engine. Renew. Sustain. Energy Rev. 2023, 185, 113631. [Google Scholar] [CrossRef]
  23. Wu, B.; Zi, Z.; Jin, S.; Pei, Y.; Wang, D. Effect of diesel injection strategy and ammonia energy fraction on ammonia-diesel premixed-charge compression ignition combustion and emissions. Fuel 2024, 357, 129785. [Google Scholar] [CrossRef]
  24. Yousefi, A.; Guo, H.; Dev, S.; Liko, B.; Lafrance, S. Effects of ammonia energy fraction and diesel injection timing on combustion and emissions of an ammonia/diesel dual-fuel engine. Fuel 2022, 314, 122723. [Google Scholar] [CrossRef]
  25. Hu, Z.; Dong, D.; Wei, W.; Zhang, H.; Wei, F.; Zhou, M.; Li, G. Numerical investigation on energy ratios and injection strategies of an ammonia-diesel dual-fuel marine engine. Int. J. Hydrogen Energy 2024, 70, 522–536. [Google Scholar] [CrossRef]
  26. Abd Alla, G.H.; Soliman, H.A.; Badr, O.A.; Abd Rabba, M.F. Effect of injection timing on the performance of a dual fuel engine. Energy Convers. Manag. 2002, 43, 269–277. [Google Scholar] [CrossRef]
  27. Richards, K.J.; Senecal, P.K.; Pomraning, E. CONVERGE, version 3.0; Convergent Science: Madison, WI, USA, 2019.
  28. Schmidt, D.P.; Rutland, C.J. A new droplet collision algorithm. J. Comput. Phys. 2000, 164, 62–80. [Google Scholar] [CrossRef]
  29. Zhang, Y.; Jia, M.; Liu, H.; Xie, M.; Wang, T.; Zhou, L. Development of a new spray/wall interaction model for diesel spray under PCCI-engine relevant conditions. At. Sprays 2014, 24, 41–80. [Google Scholar] [CrossRef]
  30. Amsden, A.A.; O’Rourke, P.J.; Butler, T.D. A Computer Program for Chemically Reactive Flows with Sprays; Technical Report LA-11560-MS; Los Alamos Laboratory: Los Alamos, NM, USA, 1989.
  31. Beale, J.C.; Reitz, R.D. Modeling spray atomization with the Kelvin-Helmholtz/Rayleigh-Taylor hybrid model. At. Sprays 1999, 9, 623–650. [Google Scholar] [CrossRef]
  32. Dec, J.E. Advanced compression-ignition engines—Understanding the in-cylinder processes. Proc. Combust. Inst. 2009, 32, 2727–2742. [Google Scholar] [CrossRef]
  33. Kong, S.C.; Marriott, C.D.; Reitz, R.D.; Christensen, M. Modeling and experiments of HCCI engine combustion using detailed chemical kinetics with multidimensional CFD. SAE Trans. 2001, 110, 1007–1018. [Google Scholar]
  34. Xu, L.; Chang, Y.; Treacy, M.; Zhou, Y.; Jia, M.; Bai, X. A skeletal chemical kinetic mechanism for ammonia/n-heptane combustion. Fuel 2023, 331, 125830. [Google Scholar] [CrossRef]
  35. Tan, D.; Meng, Y.; Tian, J.; Zhang, C.; Zhang, Z.; Yang, G.; Cui, S.; Hu, J.; Zhao, Z. Utilization of renewable and sustainable diesel/methanol/n-butanol (DMB) blends for reducing the engine emissions in a diesel engine with different pre-injection strategies. Energy 2023, 269, 126785. [Google Scholar] [CrossRef]
  36. Chen, H.; He, J.; Hua, H. Investigation on combustion and emission performance of a common rail diesel engine fueled with diesel/biodiesel/polyoxymethylene dimethyl ethers blends. Energy Fuels 2017, 31, 11710–11722. [Google Scholar] [CrossRef]
  37. Lee, G.W.; Shon, B.H.; Yoo, J.G.; Jung, J.-H.; Oh, K.-J. The influence of mixing between NH3 and NO for a De-NOx reaction in the SNCR process. J. Ind. Eng. Chem. 2008, 14, 457–467. [Google Scholar] [CrossRef]
  38. Selleri, T.; Melas, A.D.; Joshi, A.; Manara, D.; Perujo, A.; Suarez-Bertoa, R. An overview of lean exhaust denox aftertreatment technologies and nox emission regulations in the european union. Catalysts 2021, 11, 404. [Google Scholar] [CrossRef]
  39. Lu, P.; Ye, L.; Yan, X.; Chen, X.; Fang, P.; Chen, D.; Che, D.; Cen, C. N2O inhibition by toluene over Mn-Fe spinel SCR catalyst. J. Hazard. Mater. 2021, 414, 125468. [Google Scholar] [CrossRef]
  40. United States Environmental Protection Agency. Quality Assurance Guidance Document-Model Quality Assurance Project Plan for the PM Ambient Air; United States Environmental Protection Agency: Washington, DC, USA, 2001.
  41. Mathieu, O.; Petersen, E.L. Experimental and modeling study on the high-temperature oxidation of Ammonia and related NOx chemistry. Combust. Flame 2015, 162, 554–570. [Google Scholar] [CrossRef]
  42. Song, Y.; Hashemi, H.; Christensen, J.M.; Zou, C.; Marshall, P.; Glarborg, P. Ammonia oxidation at high pressure and intermediate temperatures. Fuel 2016, 181, 358–365. [Google Scholar] [CrossRef]
Figure 1. Simulation model diagram.
Energies 18 03631 g001
Figure 2. Comparison of basic grid sizes.
Energies 18 03631 g002
Figure 3. Model calibration under 75% engine load.
Energies 18 03631 g003
Figure 4. Impact of varying AER on in-cylinder pressure for FID and FIP strategies.
Energies 18 03631 g004
Figure 5. Impact of varying AER on the heat release rate curves for FID and FIP strategies.
Energies 18 03631 g005
Figure 6. Distribution of temperature field in the cylinder for FID and FIP strategies.
Energies 18 03631 g006
Figure 7. Distribution of TKE for FID and FIP strategies.
Energies 18 03631 g007
Figure 8. Comparison of CA50 and ignition delay of two strategies.
Energies 18 03631 g008
Figure 9. Comparison of combustion durations of two strategies.
Energies 18 03631 g009
Figure 10. ITE and CE of engine with two strategies.
Energies 18 03631 g010
Figure 11. Soot and CO2 emission of engine with two strategies.
Energies 18 03631 g011
Figure 12. Emissions of NO, N2O, CO, and unburned ammonia.
Energies 18 03631 g012
Figure 13. Emissions of GHG from FID and FIP strategies.
Energies 18 03631 g013
Figure 14. The cylinder pressure and heat release rate curves at different initial in-cylinder temperatures.
Energies 18 03631 g014
Figure 15. Combustion characteristics at different initial in-cylinder temperatures.
Energies 18 03631 g015
Figure 16. Engine performance at different initial in-cylinder temperatures.
Energies 18 03631 g016
Figure 17. Emissions at different initial in-cylinder temperatures.
Energies 18 03631 g017
Figure 18. CO2 and GHG emissions at different initial in-cylinder temperatures.
Energies 18 03631 g018
Figure 19. Optimized results for different control strategies.
Energies 18 03631 g019
Table 1. Key engine parameters.
ParameterUnitValue
Engine typemmSix-cylinder, turbocharged, water-cooled
Bore × Strokemm210 × 300
Connecting rodmm625
Number of Cylinders-6
Engine speedrpm908.6
Rated power outputkW990
Diesel injection holes-12
Compression ratio-15.5
Table 2. Specifications of main measurement instruments.
Equipment NameCompaniesModel SpecificationsAccuracy
DynamometerHORIBA, Kyoto, JapanAMP 280–4 C±2 rpm
Air flowmeterABB, Zurich, SwitzerlandFMT700-P±0.8%
NOx sensorNGK, Nagoya, JapanSNS3500B±30 ppm
Cylinder pressure sensorKistler, Winterthur, Switzerland6125 C±0.4%
Temperature sensorSIEMENS, Munich, GermanyThermal coupling K Type±2.5 K
Data acquisition systemAVL, Graz, AustriaPUMA-
Table 3. Basic setup parameters of the model.
ParameterUnitValue
Engine speedrpm908.6
Diesel injection timing°CA ATDC−15
Diesel injection duration°CA35
Diesel injection pressurebar625
Diesel injection volumemg870
Initial cylinder temperatureK308
Table 4. Simulation scenario 1.
AER (%)MD (mg)MN (mg)Injection Pressure (bar)Injection Duration (°CA)
FIDFIPFIDFIP
087006256253535
20696394.340028
40522788.622521
50435985.715617.5
603481182.810014
7026113805610.5
801741577.1257
90871774.263.5
Table 5. Simulation scenario 2.
ParameterUnitValue
Strategy-FIP
AER%60
Initial cylinder temperatureK308, 328, 348, 368, 388, 408
Disclaimer/Publisher’s Note: The statements, opinions and data contained in all publications are solely those of the individual author(s) and contributor(s) and not of MDPI and/or the editor(s). MDPI and/or the editor(s) disclaim responsibility for any injury to people or property resulting from any ideas, methods, instructions or products referred to in the content.

