Article

Numerical Analysis of Electric Field in Oil-Immersed Current Transformer with Metallic Particles Inside Main Insulation

by
Wei Lou
1,
Bo Lu
1,
Youxiang Pan
2,
Zhou Han
2 and
Lujia Wang
3,*
1
State Grid Corporation of China, East China Branch, Shanghai 200120, China
2
Anhui Nanrui Zhongtian Electric Power Electronics Co., Ltd., Hefei 230061, China
3
School of Electrical Engineering, China University of Mining and Technology, Xuzhou 221116, China
*
Author to whom correspondence should be addressed.
Energies 2025, 18(14), 3628; https://doi.org/10.3390/en18143628
Submission received: 21 April 2025 / Revised: 18 June 2025 / Accepted: 23 June 2025 / Published: 9 July 2025

Abstract

During the manufacturing process of oil-immersed current transformers, metallic particles may become embedded in the insulation wrapping, and the resulting electric field distortion is one of the primary causes of failure. Historically, the shape of metallic particles has often been simplified to a standard sphere, whereas in practice, these particles are predominantly irregular. In this study, ellipsoidal and flaky particles were selected to represent smooth and angular surfaces, respectively. Using COMSOL Multiphysics® (version 6.2) software, a three-dimensional simulation model of an oil-immersed inverted current transformer was developed, and the influence of defect position and size on electric field characteristics was analyzed. The results indicate that both types of defects cause electric field distortion, with longer particles exerting a greater influence on the electric field distribution. Under the voltage of a 220 kV system, elliptical particles (9 mm half shaft) lead to the maximum electric field intensity of main insulation of up to 45.1 × 10⁶ V/m, while the maximum field strength of flaky particles (length 30 mm) is 28.9 × 10⁶ V/m. Additionally, the closer the particles are to the inner side of the main insulation, the more significant their influence on the electric field distribution becomes. The findings provide a foundation for fault analysis and propagation studies related to the main insulation of current transformers.

1. Introduction

Oil-immersed inverted current transformers are widely utilized in high-voltage power plants and substations due to their stable performance and high measurement accuracy [1]. In recent years, explosion accidents involving current transformers have occasionally occurred, with the root cause being partial discharge or arcing resulting from insulation defects [2,3]. Gas cavities and cracks in insulating materials can result in an uneven distribution of the electric field, leading to an increase in local electric field intensity and subsequently triggering partial discharge. Impurities introduced into the main insulation during the production process are also a significant contributor of insulation defects [4]. Metallic particles represent one of the most common impurities in the main insulation of current transformers. Under normal operating conditions, electric field distortion can be induced in the main insulation by these particles, typically initiating partial discharge (PD). This phenomenon poses significant risks in paper-based insulation systems, which are incapable of self-healing. Carbonization marks may form and propagate, eventually resulting in insulation failure. In severe cases, discharge energy can propagate to insulation oil breakdown, potentially leading to subsequent arc discharge [5]. Understanding the propagation behavior of metallic particle defects in the main insulation and analyzing the electric field distribution under such defects are critical for preventing transformer explosion failures.
Extensive research has been conducted on the characteristics of metallic particles [6]. In a high-voltage electric field, metallic particles are subjected to an electric field force, with their direction and speed of movement determined by the electric field strength and the charge state of the particles [7]. If the insulating medium is fluid, metallic particles are also influenced by fluid flow [8]. The partial discharge characteristics of metallic particles are strongly correlated with their motion characteristics. As the amplitude of particle motion increases, the initial voltage of partial discharge rises, whereas the number of partial discharges decreases [9,10]. Continuous partial discharge accelerates insulation breakdown, and as fluid velocity increases the breakdown voltage rises rapidly before stabilizing [11]. These characteristics not only highlight the potential detrimental effects of metallic particles on insulation performance but also provide a crucial theoretical foundation and reference data for the three-dimensional modeling of metallic particles in electric fields.
Numerous studies have been conducted on the influence of metallic particles on electric field distribution in GIS, GIL, and other equipment [12,13,14]. The shape of particles significantly affects electric field distribution, with spherical metallic particles increasing electric field intensity by approximately 2.5 times [15], while shapes with sharp edges, such as strips and flakes, exert a greater influence on electric field distribution compared to spheres [16,17]. Particle size is another critical factor influencing the electric field [18], with larger particles exerting a more pronounced effect on electric field distribution [19,20]. Metallic particles tend to migrate toward regions of high field strength [21], indicating that their position within power equipment may vary. In GIS disconnectors, electric field distortion is most severe when metallic particles are located on the surface of the shielding cover [22]. Furthermore, by comparing the electric field in defective and non-defective states, the impact of defects on electric field distribution can be more effectively analyzed. Based on this, studies have analyzed the electric field characteristics of metallic particles in GIS basin insulators, comparing the electric field at the same location with and without defects, and observed a 3–5 times increase in electric field values [23]. However, most of these studies focus on metallic particles in GIS and GIL, with limited research on metallic particles in the main insulation of current transformers. In practical engineering, particle shapes are not limited to perfect spheres but encompass a variety of forms, including smooth and angular surfaces. Therefore, two distinct models—ellipsoidal and rectangular flake-shaped particles—are proposed in this study. The synergistic effects among particle size, position, and shape are quantified, and the electric field distribution is comparatively analyzed with the defect-free condition.
In this study, a 220 kV oil-immersed inverted current transformer is selected as the research object, and a three-dimensional simulation model of metallic particle defects is developed based on a structural analysis of the transformer. Ellipsoidal and rectangular flake metallic particles are selected, and their influence on electric field distribution is analyzed by varying particle size and position, with the results compared to the electric field distribution in a normal-state transformer. The electric field distribution under metallic particle defects is analyzed, providing a basis for fault analysis of the main insulation in oil-immersed current transformers.

2. Finite Element Electric Field Simulation

2.1. Comsol Finite Element Electric Field Simulation Logic

In the electrostatic field, the loop theorem and Gauss’s flux theorem form the fundamental equations of electrostatics. Their integral formulations are expressed as follows [24,25]:
s D d S = q
In Equation (1), D denotes the electric displacement field (C/m2), S represents the closed surface area (m2), and Q is the enclosed charge (C). The differential form of the fundamental equations, namely Gauss’s law for electrostatics, is expressed as follows:
D = ρ
In Equation (2), ρ denotes the volume charge density (C/m3). Combining the differential form of the fundamental equations of electrostatics with constitutive relations yields the following:
D = ( ε E ) = ε E + E ε = ρ
For a homogeneous medium, the relationship between electric field intensity and electric potential is substituted into Equation (3) to yield Equation (4).
2 ϕ = ρ ε
This formulation represents the Poisson equation governing electrostatic fields, where φ denotes the electrostatic potential (V), ρ represents the charge density (C/m3), and ε signifies the permittivity (F/m). Under charge-free conditions (ρ = 0), the governing equation reduces to the Laplace equation [26,27]:
ε 2 ϕ = 0
This is the Laplace equation form of an electrostatic field. In the absence of free charge, the potential satisfies the Laplace equation, which means that the electric field is not scattered everywhere, that is, the electric field is a conservative field. When using the finite element method to solve electrostatic field problems, besides the Poisson equation, it is necessary to define appropriate boundary conditions to ensure the uniqueness of the solution. Boundary conditions are the conditions specified on the boundary of the problem domain, which can be the value of potential, the normal component of an electric field, the charge density on the surface of a conductor, etc. By defining appropriate boundary conditions, the solved electric field can meet the requirements of practical problems. In this simulation, the secondary side of the current transformer is grounded, and the intensity of the induced electric field can be ignored. Therefore, the calculation can be regarded as being carried out under the quasi-static electric field (EQS).

2.2. Simulation Parameter Setting

The current transformer is a complex configuration which includes metal guide rod, secondary shield, semiconductor layer and other media. The simulation model developed in this study is primarily designed to analyze the internal electric field distribution under both normal and insulation defect conditions, and, thus, the insulation sleeve is simplified, while the porcelain sleeve on the outer layer is neglected. The secondary junction box, located at the bottom of the current transformer, is used to connect the lead-out wires of the secondary coil. Since the bottom is far from the head, the secondary junction box has minimal influence on the current transformer and is therefore neglected in the calculations. Both the expander and the expansion cover, which are thin-walled structures used for pressure relief and oil level observation, have a negligible impact on the internal electric field distribution of the current transformer and are thus excluded from the calculations. Schematic diagram of main structure of oil-immersed current transformer is shown in Figure 1.
The internal insulation structure is illustrated in Figure 2. The primary winding typically consists of a conductive rod that passes through the center of the secondary winding, forming a coaxial sleeve with two conductors penetrating each other, all of which are housed within the oil storage tank at the head of the current transformer. The secondary winding is housed within the secondary shielding cover, and the secondary lead is routed to the secondary outlet terminal at the lower part of the transformer via the shielding tube. Additionally, the main insulation structure of the inverted current transformer employs capacitive insulation, with the high-voltage screen positioned at the outermost side of the main insulation structure to directly withstand the system voltage and connect to the oil storage tank. The innermost shielding cover and shielding tube function as the grounding screen. The thickness of the main insulation is 45 mm. The materials used for the components of the current transformer are listed in Table 1.
To enhance computational precision, Boolean operations were implemented to merge components sharing identical dielectric properties within the inverted oil-immersed current transformer, while isolating those with dissimilar material configurations. Following geometric model finalization, meshing procedures were initiated. Mesh configurations are fundamentally categorized as structured and unstructured grids. The essential distinction lies in unstructured grids comprising irregular nodal patterns that exhibit undefined connectivity relationships. Unstructured grids demonstrate superior adaptability to intricate geometries, particularly excelling in resolving irregular morphological challenges compared to their structured counterparts. Given laboratory computational constraints, a hybrid discretization approach integrating both grid types was employed for the oil-immersed current transformer model. Unstructured meshing was applied to regions with reduced dimensions and intricate interfacial geometries, whereas structured meshing was reserved for larger-scale components with simplified topological features, ensuring optimal balance between computational accuracy and resource efficiency. The discretized transformer model contained 2,132,724 domain elements, 746,012 boundary elements, and 35,731 edge elements. Figure 3 presents the meshing schematic for the inverted oil-immersed current transformer configuration.

2.3. Typical Defect Design

Two typical defects were introduced into the current transformer model:
Elliptical metallic particles: A three-dimensional ellipsoidal structure with axis A ranging from 4 to 9 mm (in increments of 1 mm), axis B of 1 mm, and axis C of 2 mm was used to simulate metallic particle defects of varying sizes. To investigate the influence of different positions on electric field intensity, elliptical metallic particles with semi-axes of 4 mm, 1 mm, and 2 mm were selected, and three positions along the main insulation from the high-voltage screen to the low-voltage screen were defined: On the side near the shield in the main insulation (close to the inside); In the middle position in the main insulation (close to the center); In the main insulation near the oil gap side (close to the outside).
Flake metallic particles: Flake structures with a radius of 3 mm and thicknesses ranging from 5 to 30 mm (in increments of 5 mm) were employed to simulate metallic particles of varying sizes. To examine the influence of different positions on electric field intensity, flaky metallic particles with a radius of 3 mm and a height of 10 mm were selected, and three positions along the main insulation from the high-voltage screen to the low-voltage screen were defined: On the side near the shield in the main insulation (close to the inside); In the middle position in the main insulation (close to the center); In the main insulation near the oil gap side (close to the outside).
A computational domain encompassing the current transformer was established with fivefold spatial extension in all dimensions to ensure proper field decay characteristics. The transformer core was positioned at the geometric centroid of the domain, with all external boundaries assigned Dirichlet boundary conditions (φ = 0). Potential excitation of 220 kV RMS was applied to the primary bushing assembly, while the low-voltage shielding components were maintained at ground potential (φ = 0 V) through explicit potential constraints.
The model assumes metal particles to be immobilized within the primary insulation layer, while neglecting their migratory motion, and instead analyzes the static effects of particle dimensions, spatial configuration, and geometric morphology on field distribution characteristics. The metallic particles in the main insulation position are shown in Figure 4:
Breakdown analysis of the current transformer reveals that metallic particles within the main insulation exhibit non-uniform distribution patterns. Figure 5a,b demonstrate the resulting insulation burning phenomenon caused by metallic particle defects.

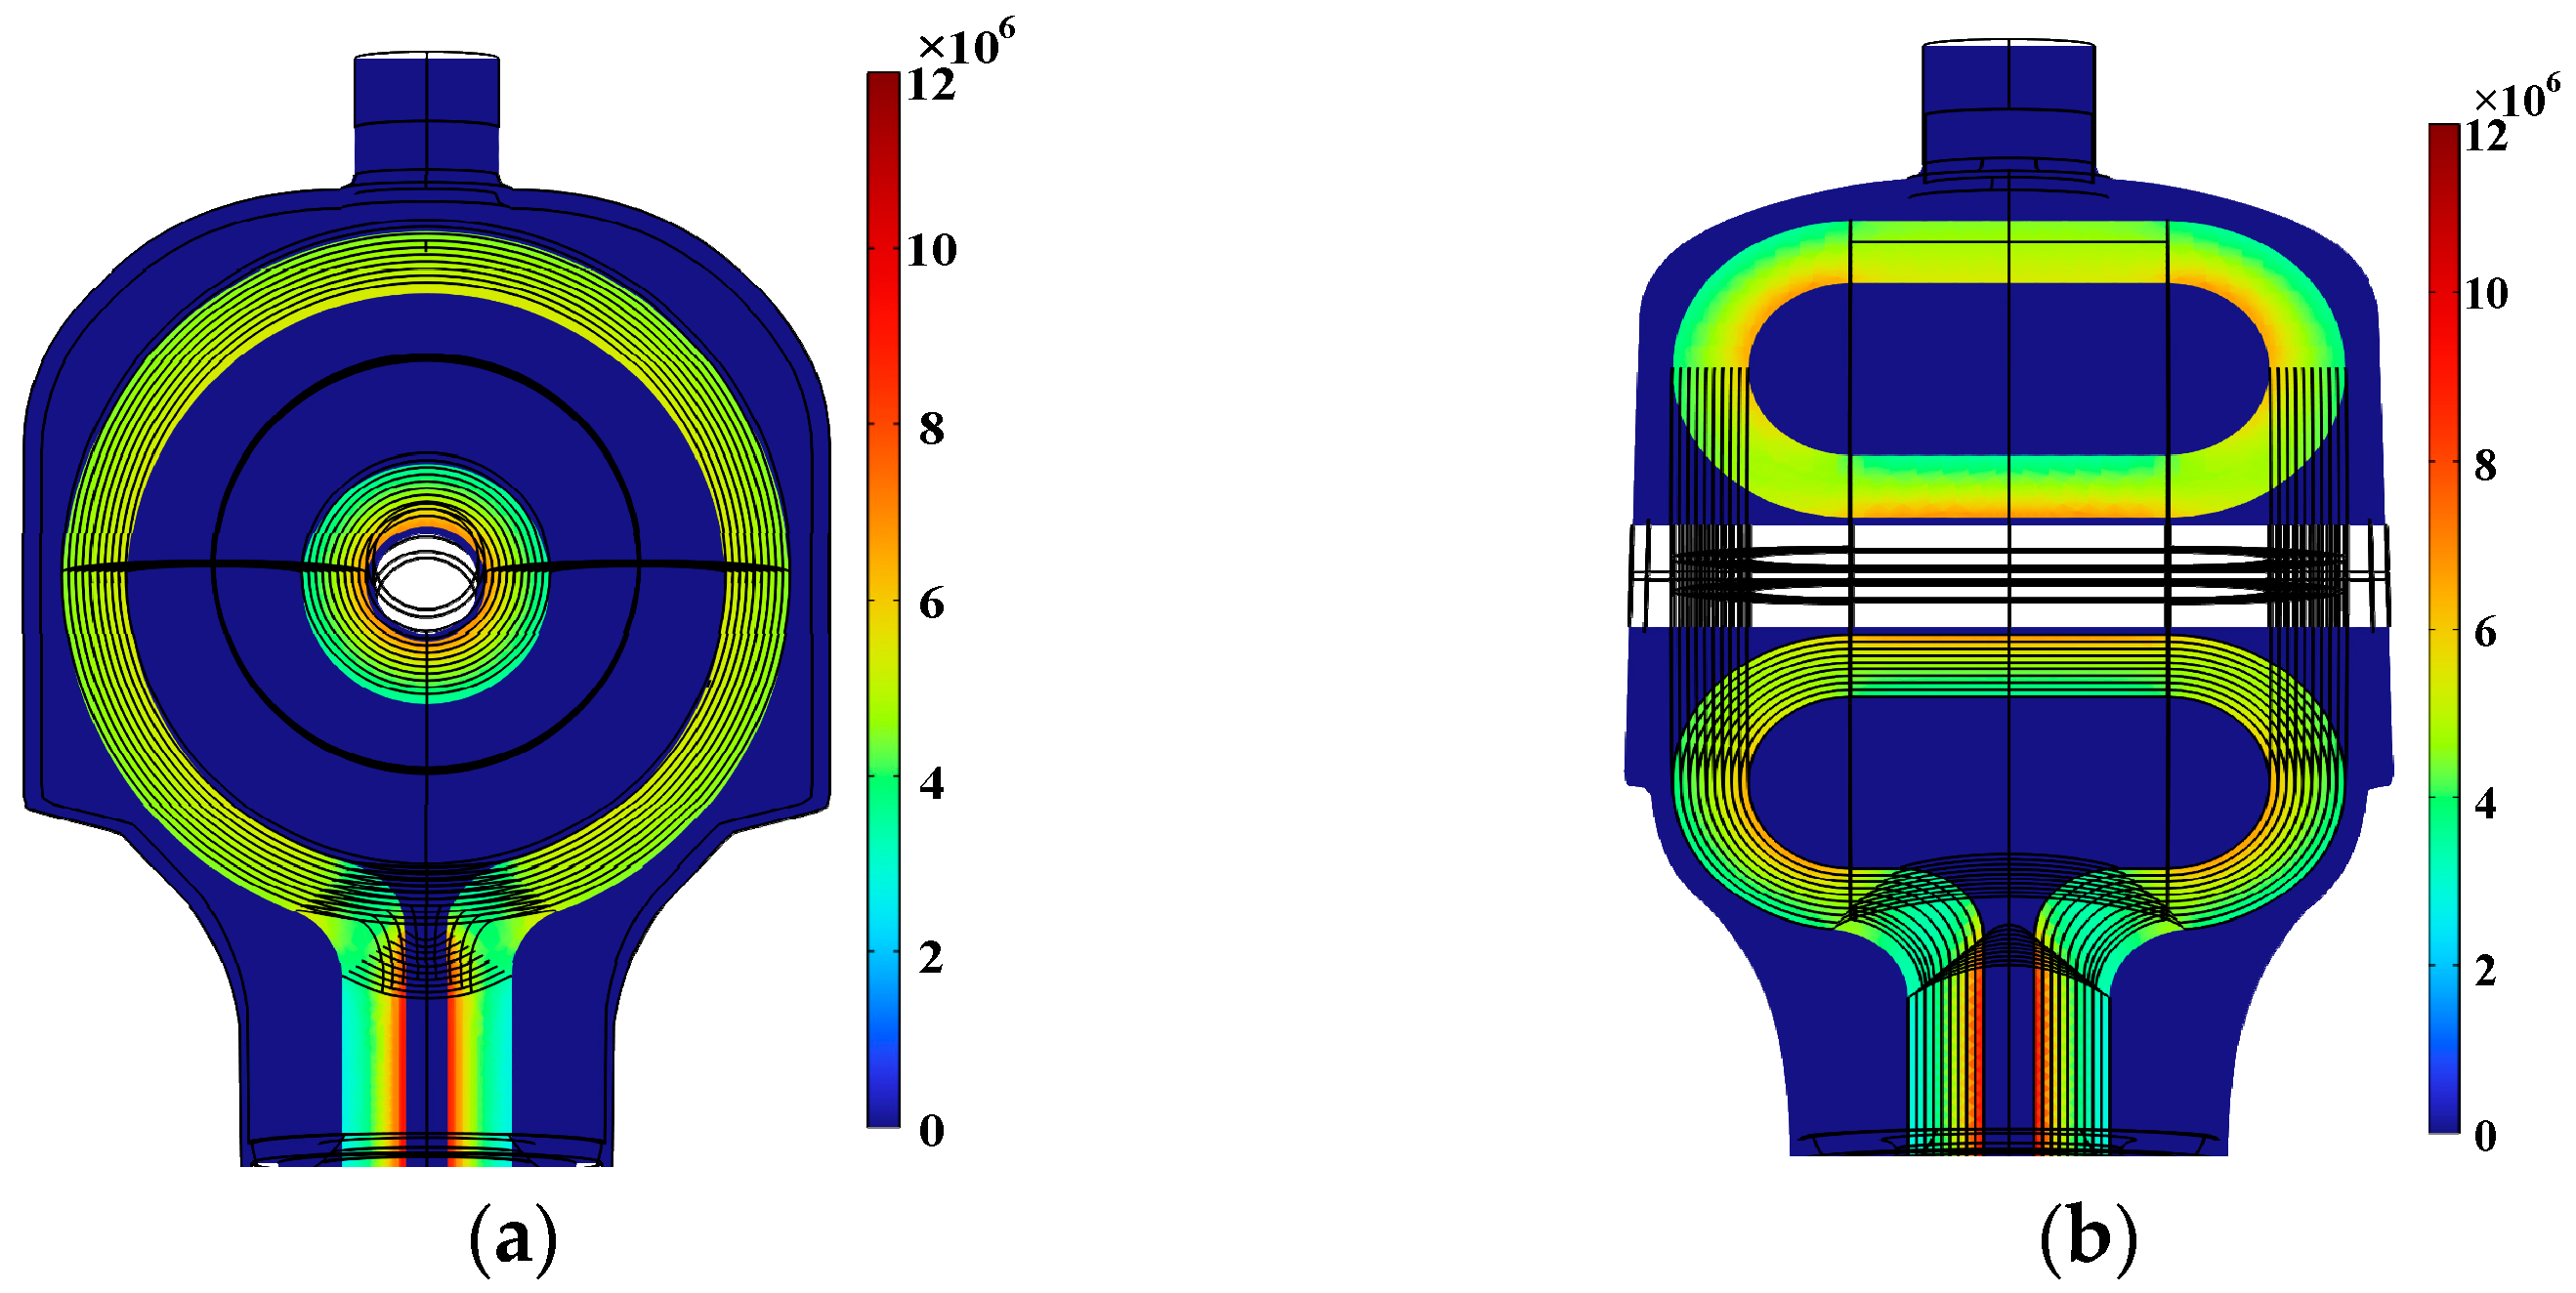
3. Flawless Simulation

As shown in the cross-sectional results in Figure 6, the electric field intensity difference between the inner and outer diameters of the main insulation at the head position is significant. This is because the radius of curvature of the inner diameter is smaller than that of the outer diameter, and a smaller radius of curvature results in higher surface charge density, leading to a notable increase in local electric field intensity and exacerbating the non-uniformity of the electric field distribution. Since the high-voltage screen and the conductive rod are equipotential structures, there is no potential difference across the insulating oil layer between them, resulting in an electric field intensity of zero.
In regions where the curvature of the outer ring side of the shielding shell is large, the electric field intensity is significantly higher, reaching a maximum value of 6.65 × 10⁶ V/m, likely due to electric field concentration effects in high-curvature areas. The electric field distribution on the shield surface is relatively uniform, with the field strength on the inner surface being approximately 5.39 × 10⁶ V/m, while the outer surface exhibits a slightly higher field strength of approximately 5.82 × 10⁶ V/m. Figure 7 illustrates the electric field distribution within the insulation sleeve of the inverted oil-immersed current transformer.
The main insulation of the insulation sleeve in the current transformer follows the same design as the head position, with layers wrapped sequentially from the inside to the outside. A smaller radius of curvature results in higher charge density, leading to a more pronounced electric field concentration effect. As illustrated in Figure 7, the electric field is concentrated on the surface of the secondary shield, which has a small radius of curvature, with the maximum electric field intensity reaching 8.38 × 10⁶ V/m. The electric field intensity gradually decreases from the inside to the outside along the horizontal axis, with the maximum intensity on the outer surface of the high-voltage screen measuring 2.7 × 10⁶ V/m.

4. Elliptical Metallic Particle Defect Simulation

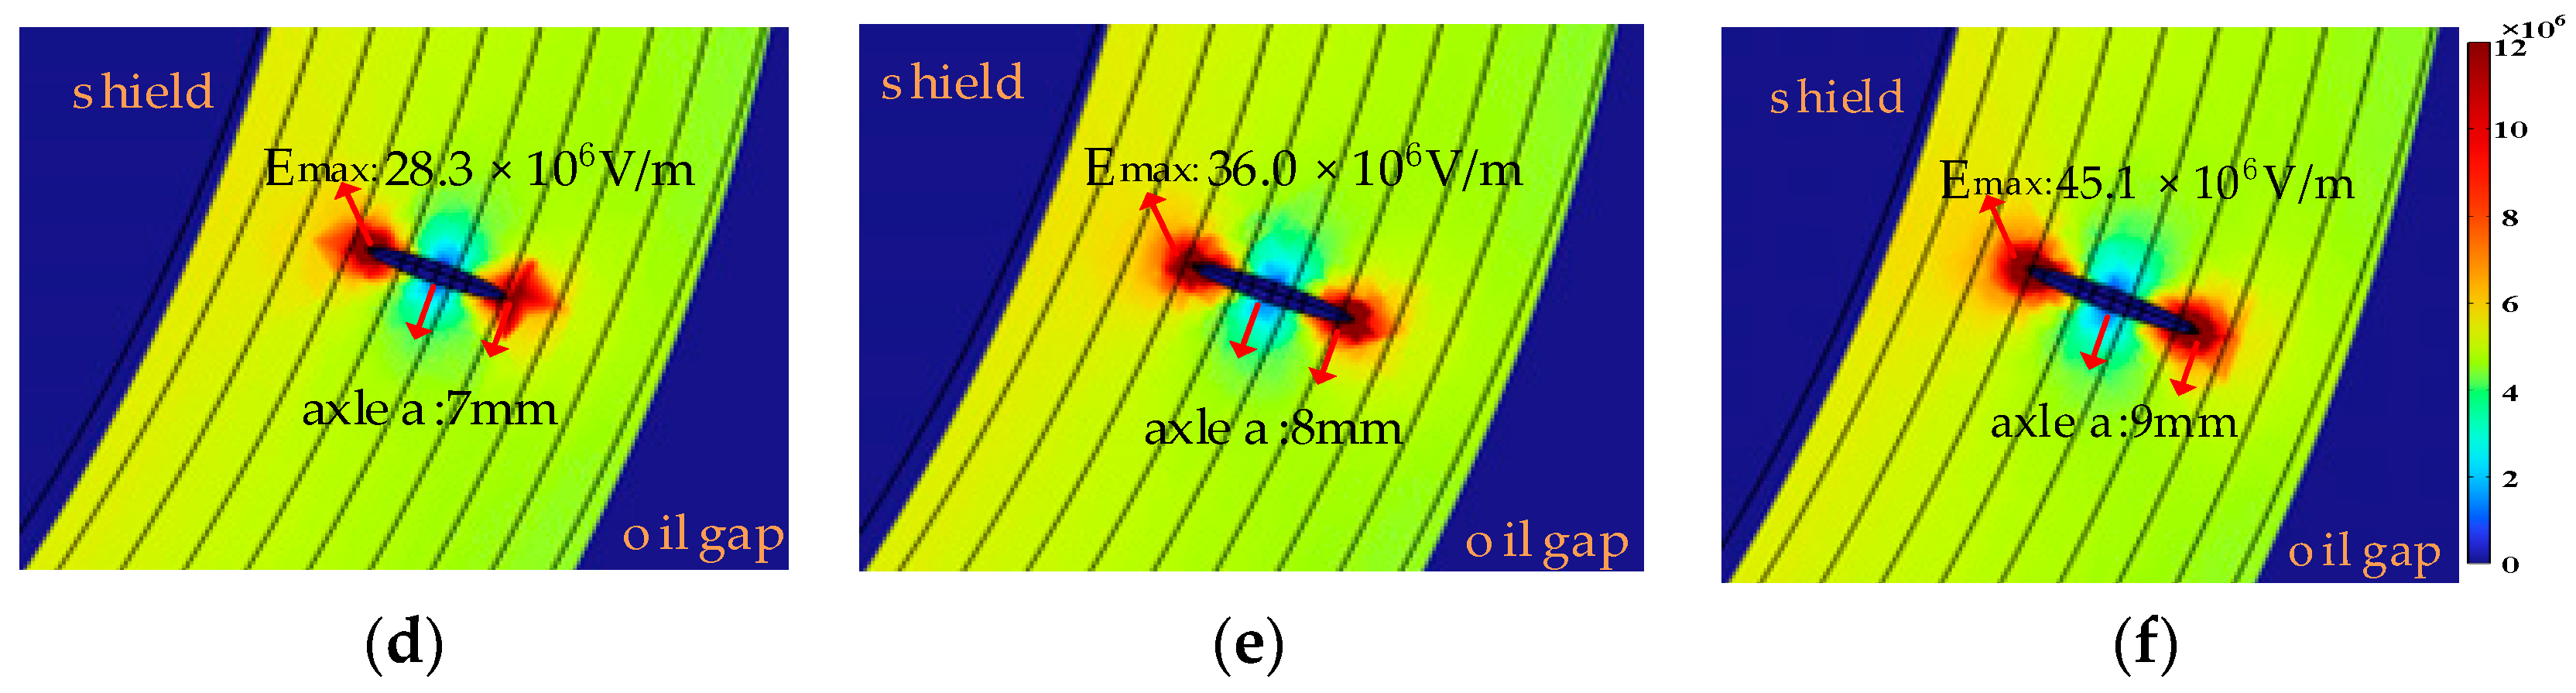
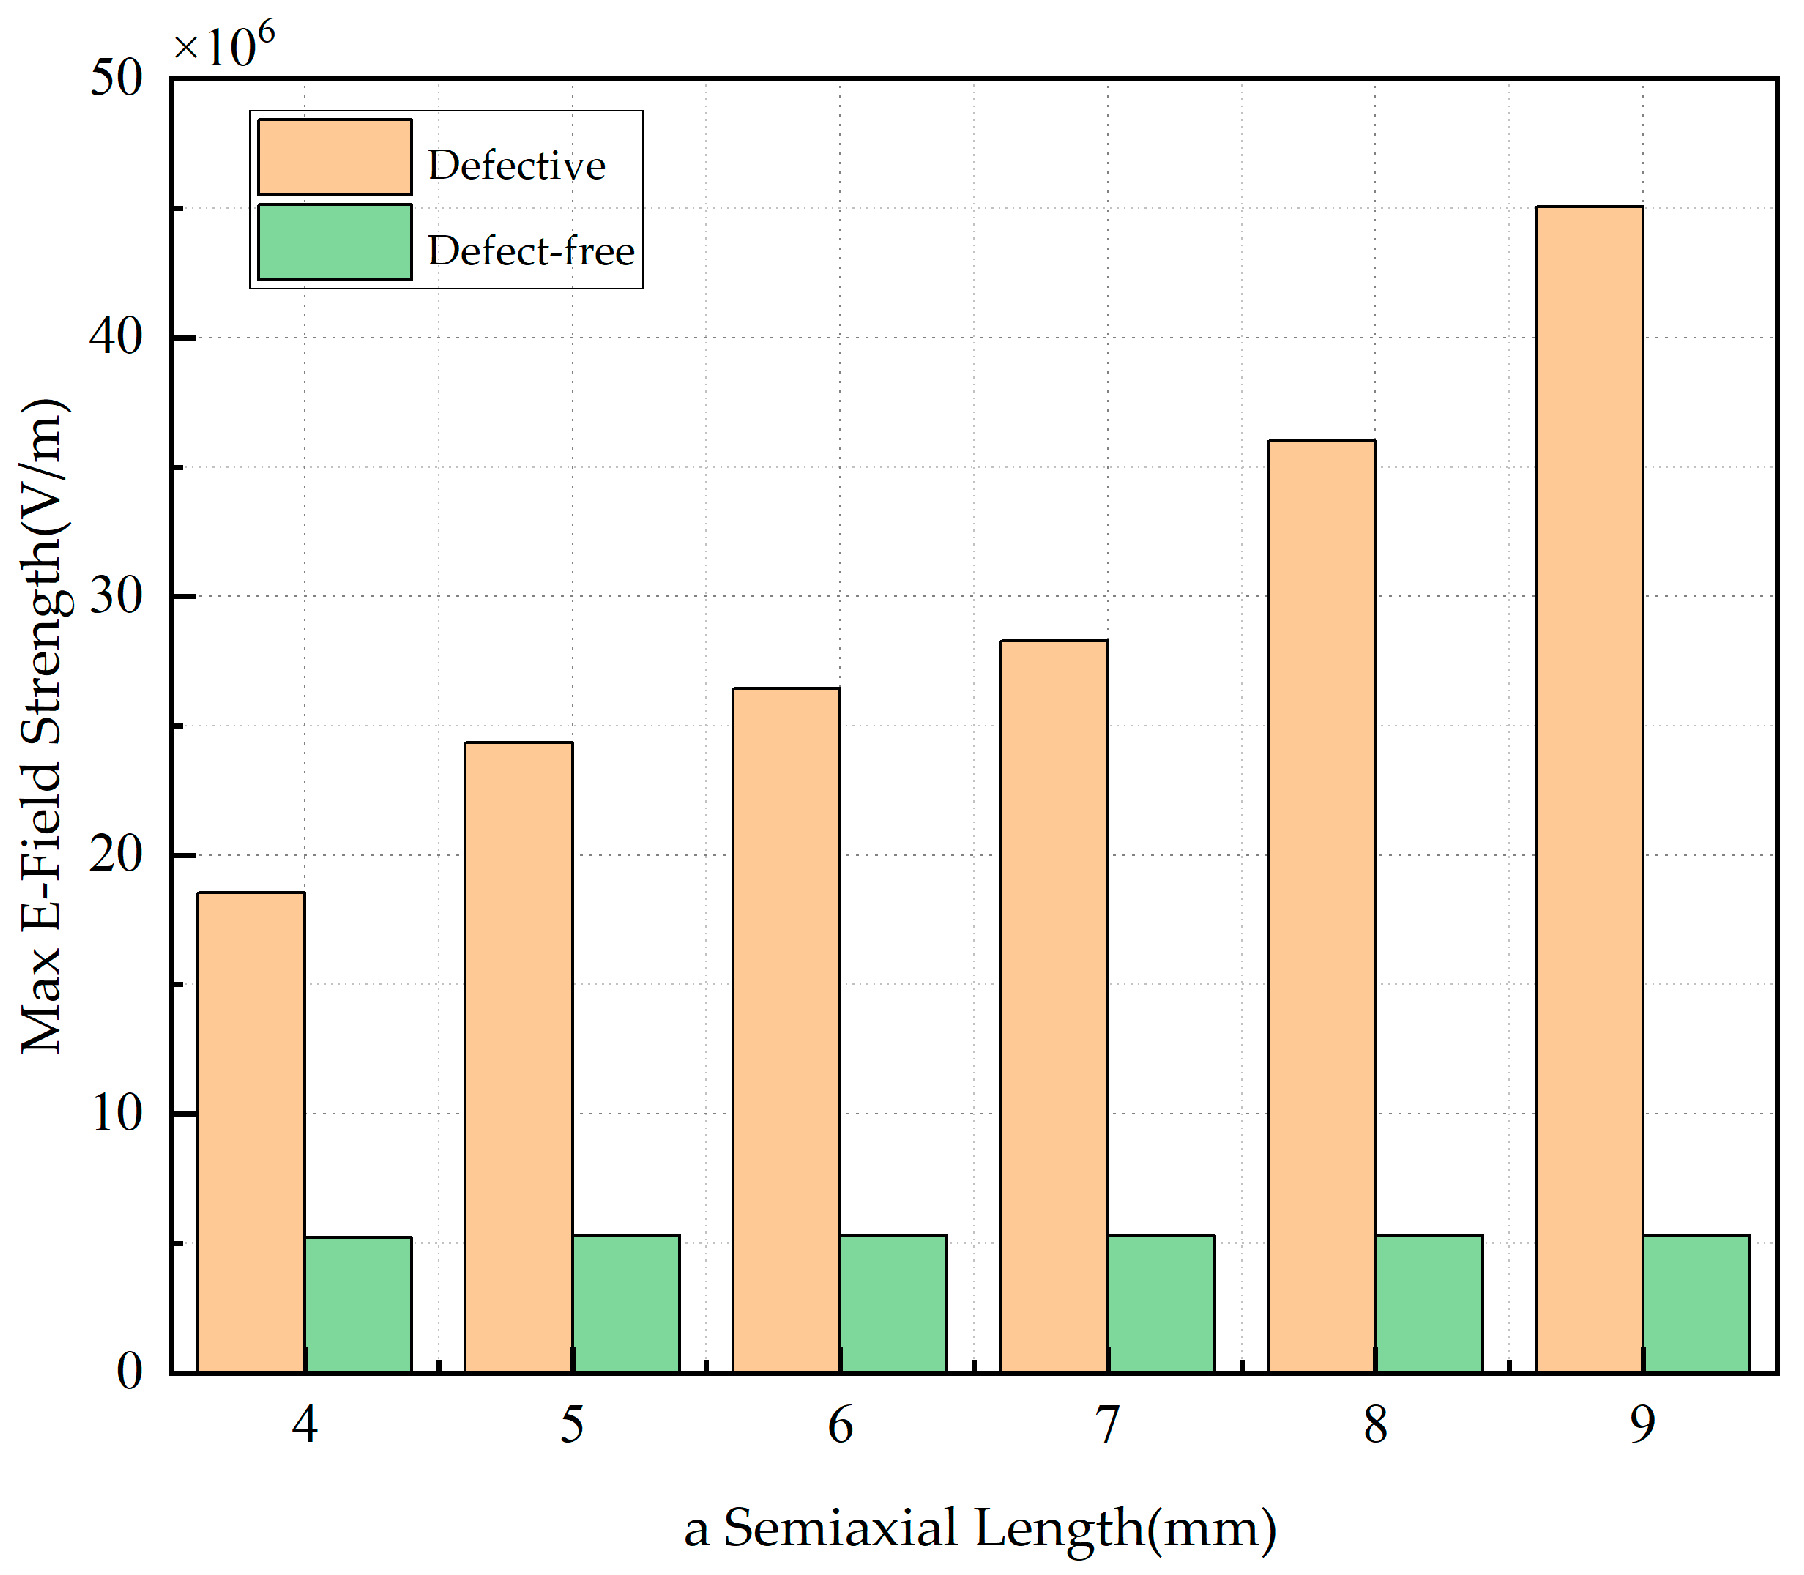
4.1. Electric Field Distribution Under Different Sizes of Elliptical Defects

In this section, an electric field enhancement coefficient, S, is introduced to more intuitively quantify the degree of electric field distortion at the transformer head. The electric field enhancement coefficient, S, is defined as the ratio of the difference between the maximum electric field intensity under defective conditions (E1max) and the maximum electric field intensity under normal conditions (E2max), as expressed by Equation (6):
S = E 1 max E 2 max E 2 max
The defect position is at zero potential, consistent with the secondary shield, while the body shell and the high-voltage screen are at high potential. No potential difference exists between the insulating oil and the high-voltage screen. As shown in Figure 8, when elliptical particle defects are present in the main insulation of the oil-immersed inverted current transformer, the maximum electric field intensity at the defect position ranges from 18.5 × 10⁶ V/m to 45.1 × 10⁶ V/m. Under these conditions, the electric field enhancement coefficient, S, ranges from 2.56 to 7.51. It is evident that longer elliptical metallic particles exert a greater influence on the electric field distribution of the main insulation. Under these conditions, the electric field is severely distorted, which may lead to partial discharge in the main insulation.
To investigate the influence of defect length on the degree of electric field distortion in the main insulation of the transformer head, a bar chart of the maximum field intensity for different defect lengths and the field intensity for the defect-free condition at the same position are presented in Figure 9:
As the defect length of elliptical metallic particles increases, the maximum field strength also increases. When the semi-axis length is 4 mm, the difference in field strength is 13.3 × 10⁶ V/m, with an electric field enhancement coefficient of 2.56, indicating slight electric field distortion. For semi-axis lengths between 5 mm and 7 mm, the increase in maximum electric field intensity is relatively gradual. For defect lengths between 7 mm and 9 mm, the rate of increase in maximum electric field intensity becomes significantly higher, with the electric field enhancement coefficient rising from 4.34 to 7.51, resulting in severe electric field distortion. This occurs because the insulation performance of the main insulation is significantly degraded with increasing defect length, causing the electric field distribution to become more concentrated at the defect location under the same voltage level. It is evident that longer defects within the transformer more readily distort the electric field distribution of the main insulation. Prolonged electric field distortion in the main insulation accelerates the deterioration of insulation materials, eventually leading to breakdown.

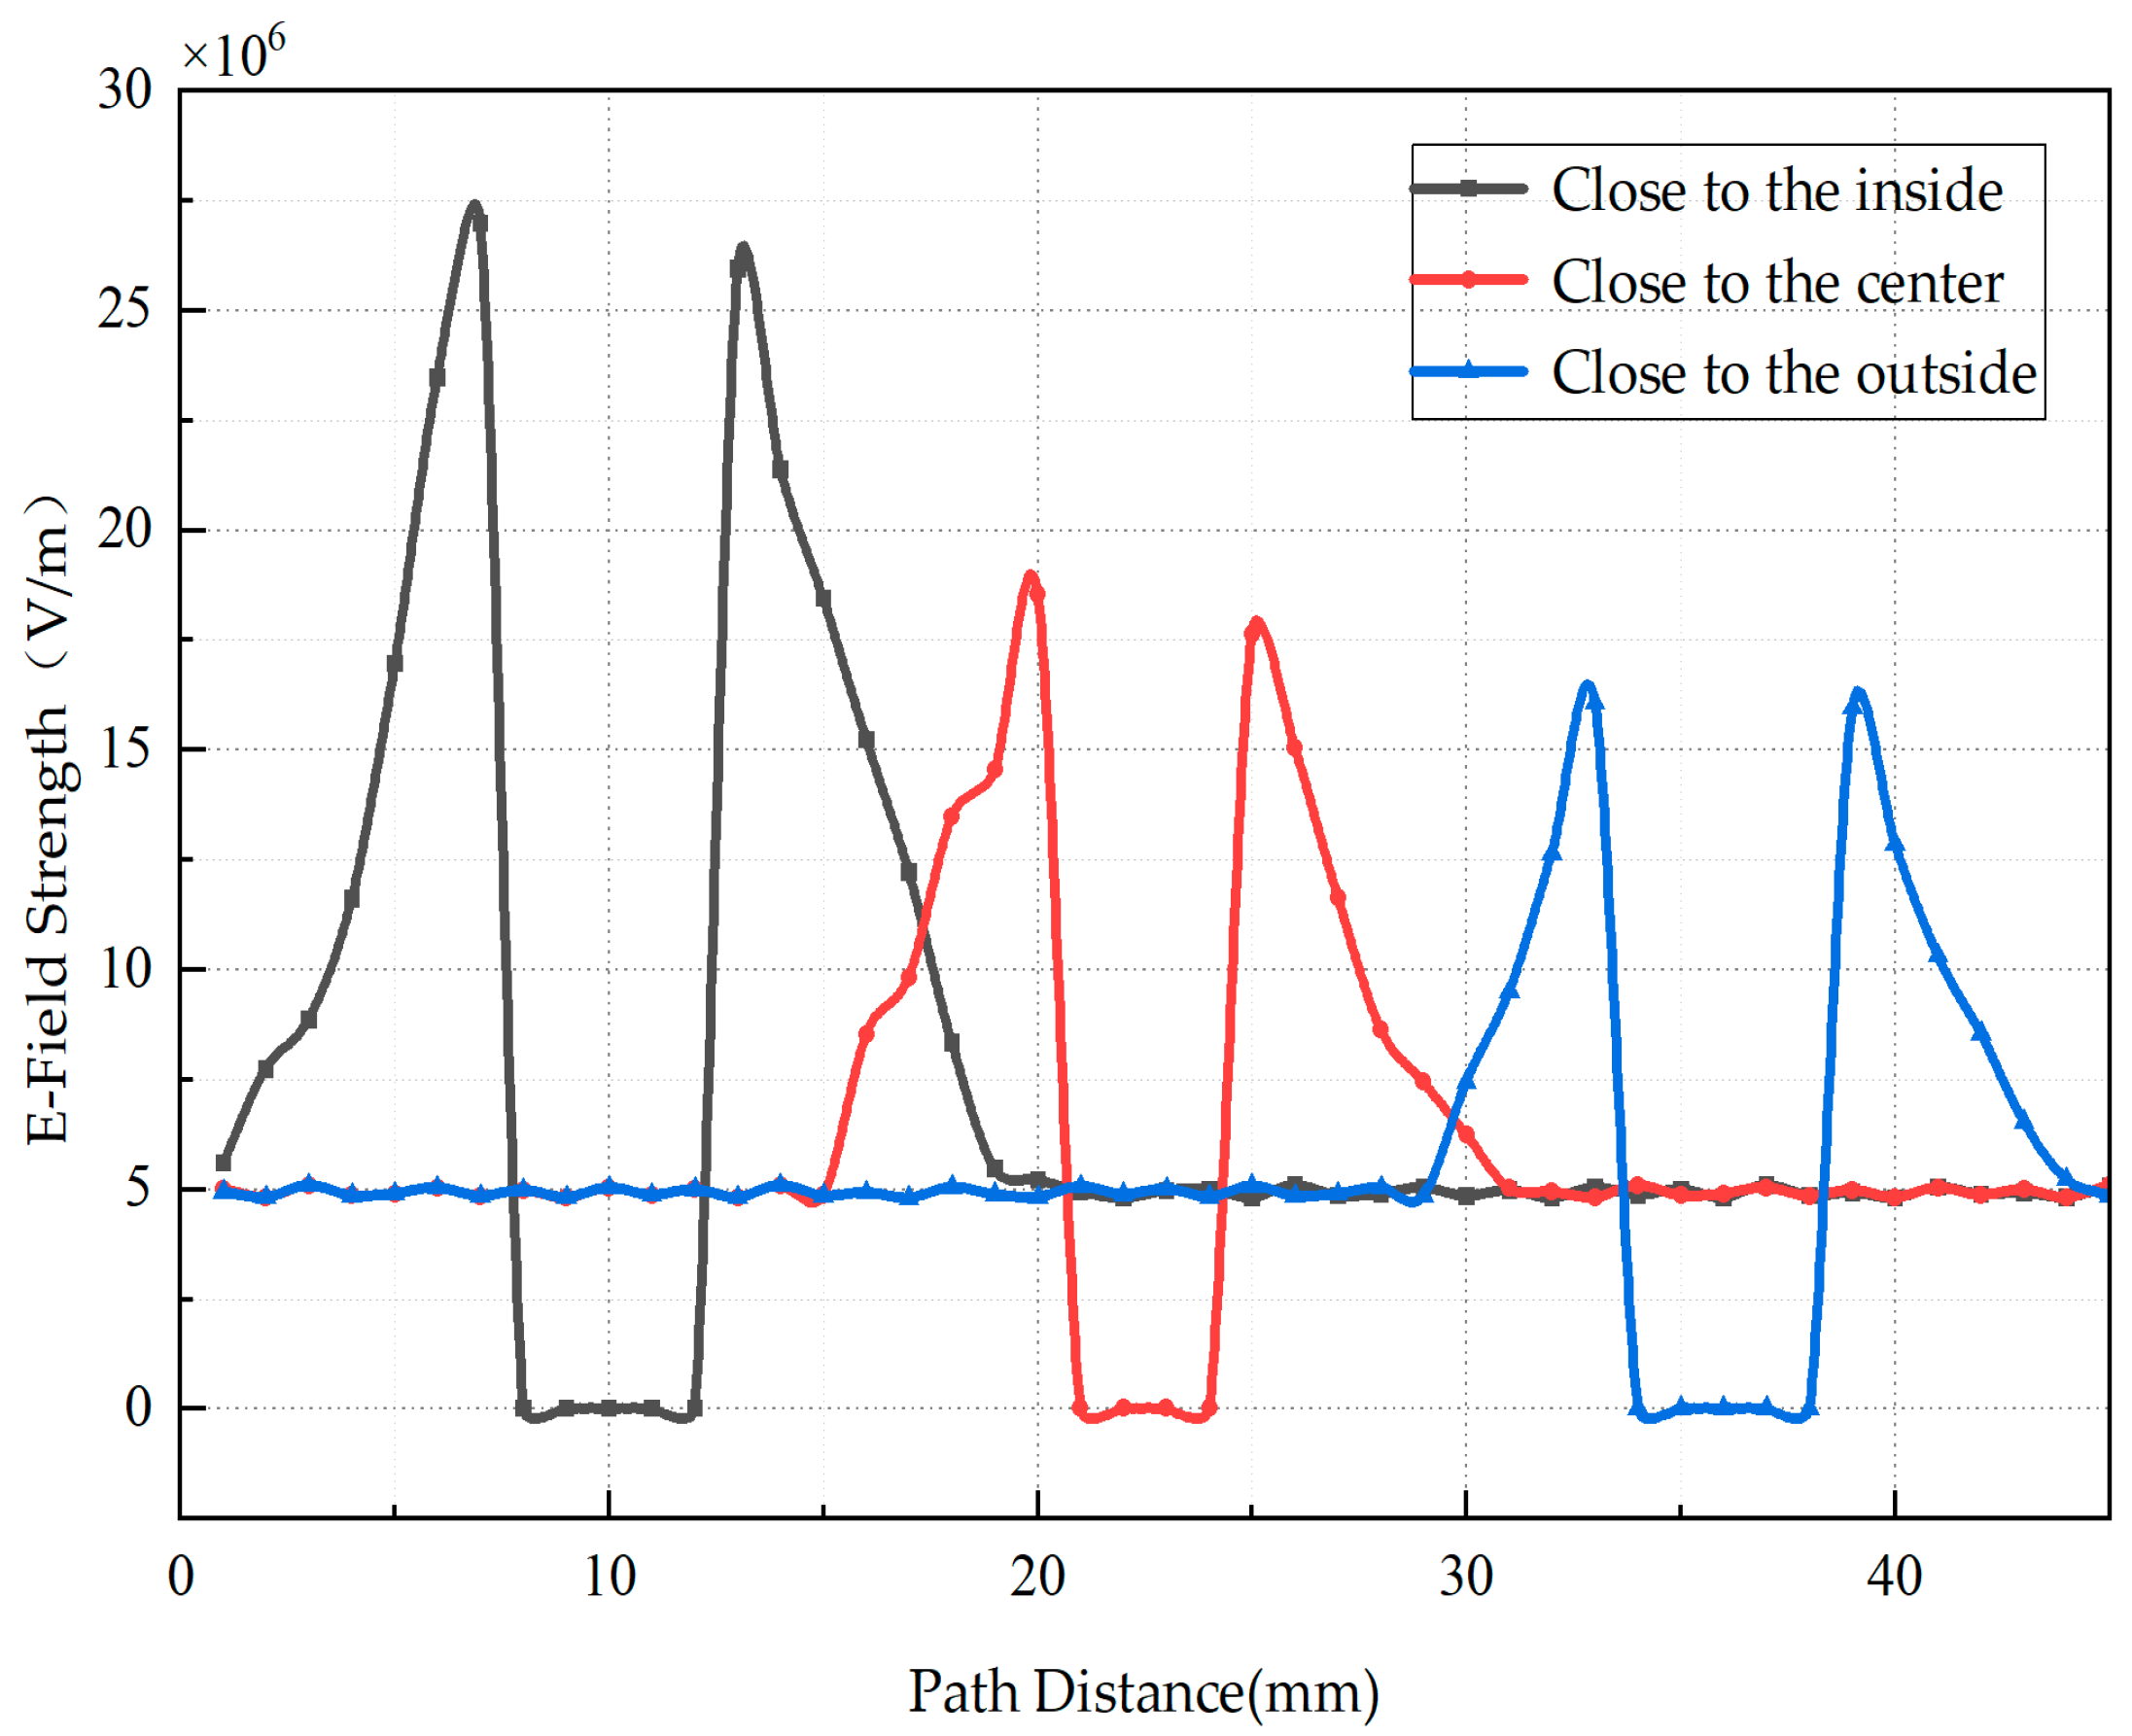
4.2. Electric Field Distribution Under Different Positions of Elliptical Defects

The electric field intensity within the main insulation was calculated for three positions with metallic particle defects, and the resulting electric field distribution nephograms for elliptical metallic particles at these positions are presented in Figure 10. The ellipsoidal metallic particles used in this analysis have semi-axis lengths of 4 mm, 1 mm, and 2 mm. In the figure, darker colors indicate higher electric field intensity, with values expressed in V/m.
As shown in Figure 10, regardless of the location of the metallic particle defect, the electric field distribution in the main insulation layer near the defect is concentrated, and the electric field intensity is significantly increased. Moreover, when the metallic particle defect is located near the inner side of the main insulation, the electric field distortion is most severe, with the surface electric field intensity of the particle reaching a maximum value of 2.78 × 10⁷ V/m and an electric field enhancement coefficient of S = 4.15.
To investigate the influence of metallic particles at different positions on the electric field distortion in the main insulation, the maximum electric field intensity was simulated for both cases with and without metallic particle defects at the same position, as presented in Table 2. As indicated in Table 2, when the metallic particle defect is located near the inner side of the main insulation, the electric field intensity increases by 22.0 × 10⁶ V/m compared to the defect-free condition. Compared to metallic particles near the outer side of the main insulation, the maximum electric field intensity increases by 90%, while a 68.9% increase is observed compared to metallic particles located in the middle of the main insulation. It is evident that the electric field distortion in the main insulation is most severe when metallic particles are located near the inner side.
A through line was drawn along the two vertices intersecting the semi-axis of ellipsoid A. The electric field intensity along this three-dimensional line segment was selected, and the corresponding numerical curves of electric field intensity at different positions are plotted in Figure 11.
As shown in Figure 11, when the main insulation contains elliptical metallic particle defects, the electric field intensity along the path exhibits a curve that first rises, then falls, and then rises again. Within the path distance of 0–8 mm, the electric field intensity near the inner side of the elliptical metallic particle defect is significantly higher than at other positions. At 7 mm, the maximum electric field intensity reaches 27.8 × 10⁶ V/m, occurring at the edge of the defect end, where the electric field distortion is most severe. However, elliptical metallic particle defects located in the middle and near the outer positions reach their peak electric field intensities at 20 mm and 33 mm, respectively. Moreover, they exhibit a “bimodal” curve, as the elliptical defect has two ends, with the second peak occurring at the opposite edge of the defect, where the degree of distortion is relatively lower. Since the selected section line traverses both ends of the ellipse, the electric field intensity forms a smooth straight line at the trough.

5. Flake Metallic Particle Defect Simulation

5.1. Electric Field Distribution Under Different Sizes of Flaky Defects

The length of the flaky defect was varied to observe the electric field distribution. The flaky particles have a fixed width of 5 mm and a height of 2 mm, with lengths varying as 5 mm, 10 mm, 15 mm, 20 mm, 25 mm, and 30 mm. As illustrated in the figure, electric field distribution nephograms are presented for metallic particles at the same position but with different lengths.
As shown in Figure 12, when a flaky particle defect is present in the main insulation of the oil-immersed inverted current transformer, the maximum electric field intensity at the defect location ranges from 8.89 × 10⁶ V/m to 28.9 × 10⁶ V/m. Under these conditions, the electric field enhancement coefficient (S) ranges from 0.71 to 4.45. It is evident that the influence of the flaky metallic particles on the electric field distribution is directly proportional to their length.
To investigate the influence of defect length on the degree of electric field distortion in the main insulation of the transformer head, a bar chart of the maximum field intensity for different defect lengths and the field intensity for the defect-free condition at the same position are presented in Figure 13.
As the defect length of the flaky metallic particles increases, the maximum field strength is observed to increase. At a defect length of 5 mm, the strong field difference is 3.69 × 10⁶ V/m, the electric field enhancement coefficient is 0.71, and the electric field exhibits slight distortion. For defect lengths between 5 mm and 30 mm, the maximum electric field intensity increases linearly. At a defect length of 30 mm, the maximum electric field intensity reaches its peak, with a strong field difference of 28.9 × 10⁶ V/m and an electric field enhancement coefficient of 4.45. The electric field distribution is severely distorted, with a relatively higher concentration of the electric field in the defect region at the same voltage level.

5.2. Electric Field Distribution Under Different Positions of Flaky Defects

The electric field intensity within the main insulation was calculated for three positions with metallic particle defects, and the resulting electric field distribution nephograms for flaky metallic particles at these positions are presented in Figure 14. The flaky metallic particles used in this analysis have a width of 5 mm, a height of 2 mm, and a length of 5 mm.
As shown in Figure 14, regardless of the location of the metallic particle defect, the electric field distribution near the defect position in the main insulation layer becomes concentrated, and the electric field intensity increases. Additionally, when the metallic particle defect is located near the inner side of the main insulation, the electric field distortion is most severe, with the surface electric field intensity of the particle reaching a maximum of 9.64 × 10⁶ V/m and an electric field enhancement coefficient of S = 0.78.
To investigate the influence of metallic particles at different positions on the electric field distortion of the main insulation, the maximum electric field intensity with and without metallic particle defects at the same position was simulated, as summarized in Table 3. As shown in Table 3, when the metallic particle defect is located near the inner side of the main insulation, the electric field intensity increases by 4.22 × 10⁶ V/m compared to the defect-free condition. Compared to metallic particles near the outer side of the main insulation, the maximum electric field intensity increases by 46%, and by 14.7% compared to particles located in the middle of the main insulation. It is evident that the electric field distortion of the main insulation is most severe when metallic particles are located near the inner side. This conclusion aligns with the findings from the previous section.
A tangent line perpendicular to the normal vector of the flaky length is drawn along one side of the flaky surface. The electric field intensity along this three-dimensional line segment is selected, and the numerical curves representing the electric field intensity at different positions are plotted, as illustrated in Figure 15.
As shown in Figure 15, when flaky metallic particle defects are present in the main insulation, the electric field intensity along the path exhibits a trend of initially increasing, then decreasing, and subsequently increasing again. Within the path distance of 0–6 mm, the electric field intensity at the defect location of flaky metallic particles near the internal measurement is significantly higher than that at other positions. At 5.5 mm, the maximum electric field intensity reaches 9.64 × 10⁶ V/m, occurring at the edge of the defect end, where the electric field distortion is most severe. However, the defects of flaky metallic particles located in the middle and near the outer positions reach their peak electric field intensities at 20 mm and 32.5 mm, respectively. Furthermore, all three curves exhibit a bimodal distribution. Additionally, since the tangent line selected for the flaky differs from that of the ellipsoid and lies along the flaky surface, the electric field intensity curve exhibits a lower peak value, resulting in a trough-like peak, as illustrated in Figure 15.

6. Conclusions

Using a 220 kV inverted oil-immersed current transformer as the research object, the variation in the electric field distribution within the main insulation under elliptical and flaky metallic particle insulation defects was simulated and analyzed, leading to the following conclusions:
(1)
When compared to angular flaky metallic particles, smooth-surfaced elliptical metallic particles were observed to exert a more pronounced influence on the electric field distortion within the main insulation. Moreover, for particles of the same shape, the longer the metallic particles, the greater their influence on the electric field intensity distribution. Among these, the electric field distortion rate caused by elliptical metallic particles with a semi-axis of 9 mm is the highest, with a maximum electric field intensity of 45.1 × 10⁶ V/m. The maximum electric field intensity resulting from flaky metallic particles with a length of 30 mm is 28.9 × 10⁶ V/m. The longer the metallic particles, the stronger the electric field concentration effect becomes.
(2)
By analyzing the influence of the two shapes on the electric field distribution at different positions, it is found that the closer the particles are to the inner side, the greater their influence on the electric field intensity of the main insulation. Compared to the defect-free condition, the electric field enhancement coefficient is 4.15 for elliptical defects near the inner side and 0.78 for flaky defects near the inner side. As the position of metallic particles shifts from the inner to the outer side, the insulation performance of the main insulation gradually recovers, thereby reducing the risk of insulation breakdown.

Author Contributions

Conceptualization, W.L.; methodology, B.L. and W.L.; software, Y.P.; validation, Y.P., Z.H. and L.W.; formal analysis, Z.H.; investigation, Z.H. and Y.P.; data curation, B.L.; writing—original draft preparation, B.L. and W.L.; writing—review and editing, L.W. and Y.P.; visualization, W.L. and Z.H.; supervision, B.L.; project administration, W.L. and Y.P. All authors have read and agreed to the published version of the manuscript.

Funding

This research was funded by Science and Technology Project of State Grid Corporation of China, East China Branch, grant number 529924240020.

Data Availability Statement

Data are contained within the article.

Conflicts of Interest

Author Youxiang Pan and Zhou Han was employed by the company Anhui Nanrui Zhongtian Electric Power Electronics Co., Ltd. The remaining authors declare that the research was conducted in the absence of any commercial or financial relationships that could be construed as a potential conflict of interest.

References

  1. Mahajan, S.M.; Robalino, D.M.; Sivan, V. Thermal Modeling of an Inverted-Type Oil-Immersed Current Transformer. IEEE Trans. Power Deliv. 2010, 25, 2511–2518. [Google Scholar]
  2. Velásquez, A.M.R.; Lara, M.V.J. Current transformer failure caused by electric field associated to circuit breaker and pollution in 500 kV substations. Eng. Fail. Anal. 2018, 92, 163–181. [Google Scholar]
  3. Zhang, L.; Guo, M.; Chen, Z.; Du, L.; Zhang, R.; Yang, Y.; Ma, H. Diagnosis and Analysis of Current Transformer. Transformer 2011, 48, 57–59. (In Chinese) [Google Scholar]
  4. Wang, Q.; Yang, B.; Che, C.; Yang, W.; Zhang, J.; Dou, B. Diagnosis and Analysis of a 110kV Oil-immersed Current Transformer with Partial Discharge Defects. In Proceedings of the 2020 IEEE 1st China International Youth Conference on Electrical Engineering (CIYCEE), Wuhan, China, 1–4 November 2020; pp. 1–5. [Google Scholar]
  5. Pei, L.; Li, H.; Niu, L.; Gao, N.; Zhang, Y.; Zhang, Y.; Pei, Y.; Yin, Q. Case Analysis of 220 kV Oil-immersed Current Transformer Defect. In Proceedings of the 2020 5th Asia Conference on Power and Electrical Engineering (ACPEE), Chengdu, China, 4–7 June 2020; pp. 2178–2182. [Google Scholar]
  6. Wang, W.; Gao, Y.; Zhao, H. The Effect of a Metal Particle on Surface Charge Accumulation Behavior of Epoxy Insulator with Zoning Coating. Energies 2022, 15, 4730. [Google Scholar] [CrossRef]
  7. Li, S.; Li, J.; Tang, H.; Deng, J. Motion Characteristics Analysis of Free Metal Particles in DC Bushing. High Volt. Appar. 2021, 57, 162–170. (In Chinese) [Google Scholar]
  8. Wang, J.; Wen, G.; Jiang, D.; Huang, Z.; Zhang, Y.; Pan, C. Partial Discharge and Breakdown Characteristics of Flowing Transformer Oil Containing Metal Particles. Insul. Mater. 2023, 56, 66–70. (In Chinese) [Google Scholar]
  9. Tang, J.; Ma, S.; Li, X.; Zhang, Y.; Pan, C.; Su, J. Impact of Velocity on Partial Discharge Characteristics of Moving Metal Particles in Transformer Oil using UHF Technique. IEEE Trans. Dielectr. Electr. Insul. 2016, 23, 2207–2212. [Google Scholar]
  10. Wang, B.; Niu, B.; Li, J.; Liu, W.; Chen, L.; Bai, T. Motion Behavior and Partial Discharge Characteristics of Metal Particles in Tip Electrode Under Mechanical and Electrical Combined Action. High Volt. Appar. 2023, 59, 127–135. (In Chinese) [Google Scholar]
  11. Yao, Y.; Tao, X.; Yu, M.; Pan, C.; Tang, J. DC Breakdown Characteristics of Flowing Transformer Oil Contaminated by Metallic Particles. Trans. China Electrotech. Soc. 2023, 38, 157–167. (In Chinese) [Google Scholar]
  12. Zhao, J.; An, Z.; Lv, B.; Wu, Z.; Zhang, Q. Characteristics of the Partial Discharge in the Development of Conductive Particle-Initiated Flashover of a GIS Insulator. Energies 2020, 13, 2481. [Google Scholar] [CrossRef]
  13. Yao, R.; Hui, M.; Li, J.; Bai, L.; Wu, Q. A New Discharge Pattern for the Characterization and Identification of Insulation Defects in GIS. Energies 2018, 11, 971. [Google Scholar] [CrossRef]
  14. Luo, H.; Gong, D.; Li, S.; Zhan, Z.; Di, N.; Dolkun, D.; Fan, X.; Liu, X. Suppression of Metal Particles by Coating for a ±550 kV DC GIS. Energies 2024, 17, 5627. [Google Scholar] [CrossRef]
  15. Wu, Z.; Wu, M.; Zhang, R.; Liao, L.; Du, G.; Huang, X.; Jin, W.; Zhang, J.; Li, H.; Lu, B. Simulation of Electric Field Distribution in Cable Joint under the Influence of Metal Particle. IOP Conf. Ser. Mater. Sci. Eng. 2020, 790, 012133. [Google Scholar]
  16. Liu, Y.; Nie, K.; Li, C.; Li, Z.; Gao, W.; Meng, F.; Li, Q. Electric Field Simulation Analysis of Typical Defects of Metal Particles in Main Insulation of Converter Transformer Based on Multi-physics Coupling. In Proceedings of the 5th International Symposium on Plasma and Energy Conversion; Fang, Z., Zhang, C., Mei, D., Zhang, S., Eds.; Springer Nature Singapore Pte Ltd.: Singapore, 2024; Volume 398, pp. 449–459. [Google Scholar]
  17. Deng, J.; Gao, K.; Ren, M.; Huang, H.; Jin, L. Electric Field Analysis of Multi-shape Metal Particle Adhesion Defects in 110 kV GIS. J. Electr. Eng. 2024, 19, 316–324. (In Chinese) [Google Scholar]
  18. Liu, Y.; Xia, B.; Du, B.; Farzaneh, M. Influence of Fine Metal Particles on Surface Discharge Characteristics of Outdoor Insulators. Energies 2016, 9, 87. [Google Scholar] [CrossRef]
  19. Dong, M.; Zang, C.; Zhan, Z.; Xin, W. Research Progress on Metal Particle Issues Inside GIL. High Volt. Appar. 2024, 60, 1011–1025. (In Chinese) [Google Scholar]
  20. Ma, S.; Tang, J.; Zhang, M.; Liu, Z.; Li, X. Simulation Study on Distribution and Influence Factors of Metal Particles in Traction Transformer. High Volt. Eng. 2015, 41, 3628–3634. (In Chinese) [Google Scholar]
  21. Wei, B.; Wang, Z.; Qi, R.; Wang, X.; Zhao, T. A Study on the Motion Behavior of Metallic Contaminant Particles in Transformer Insulation Oil under Multiphysical Fields. Sensors 2024, 24, 5483. [Google Scholar] [CrossRef]
  22. Shen, F.; Gao, Y.; Chen, Y. Analysis on Influence of Metal Particles in Different Positions on Electric Field of GIS Disconnector. High Volt. Appar. 2024, 60, 113–119. (In Chinese) [Google Scholar]
  23. Sha, W.; Luo, Y.; Ma, P.; Qi, L. Study on surface discharge and electric field characteristics of GIS basin insulator with different metal particle defects. Insul. Mater. 2023, 56, 89–93. (In Chinese) [Google Scholar]
  24. Ilunga, K.G.; Swanson, A.G.; Ijumba, N.; Stephen, R. Influence of Conductor Temperature on the Voltage–Current Characteristic of Corona Discharge in a Coaxial Arrangement—Experiments and Simulation. Energies 2025, 18, 1303. [Google Scholar]
  25. Lee, C.-H.; Cheng, P.-H.; Leou, K.-C.; Hsieh, C.-M.; Su, Y.-C. Calculation of the Optimal Magnetic Duty Cycle for a Graded Coaxial Magnet of a Rotary Type Magnetic Refrigerator. Energies 2025, 18, 289. [Google Scholar] [CrossRef]
  26. Leu, J.-H.; Su, A.; Kuo, S.-C.; Chen, K.-C. The Observation of Performance Trends by Numerical Simulation with Different Parameters in a Nonlinear Reversible Solid Oxide Cell System. Energies 2024, 17, 6083. [Google Scholar] [CrossRef]
  27. Zogning, C.; Lobry, J.; Moiny, F. Numerical Simulation of Corona Discharge Plasma Affecting the Surface Behavior of Polymer Insulators. Energies 2024, 17, 4247. [Google Scholar] [CrossRef]
Figure 1. Schematic diagram of main structure of oil-immersed current transformer.
Energies 18 03628 g001
Figure 2. Internal insulation structure diagram.
Energies 18 03628 g002
Figure 3. Schematic diagram of grid division of current transformer.
Energies 18 03628 g003
Figure 4. Schematic diagram of particle structure in main insulation position.
Energies 18 03628 g004
Figure 5. Disintegration analysis of current transformer after fault. (a) Metallic particulate matter; (b) Main insulation layer ablation.
Energies 18 03628 g005
Figure 6. Electric field distribution at the head of current transformer. (a) x-y cross-section; (b) y-z cross-section.
Energies 18 03628 g006
Figure 7. Electric field distribution of insulating bushing of current transformer.
Energies 18 03628 g007
Figure 8. Electric field distribution under defects of elliptical metallic particles with different sizes. (a) The axle a is 4 mm; (b) The axle a is 5 mm; (c) The axle a is 6 mm; (d) The axle a is 7 mm; (e) The axle a is 8 mm; (f) The axle a is 9 mm.
Energies 18 03628 g008aEnergies 18 03628 g008b
Figure 9. Maximum field strength of elliptical particles with different lengths in main insulation.
Energies 18 03628 g009
Figure 10. Nephogram of electric field distribution of elliptic metallic particles at different positions. (a) The metallic particles are near the inside; (b) the metallic particles are located in the middle; (c) the metallic particles are near the outside.
Energies 18 03628 g010
Figure 11. Electric field intensity of elliptical metallic particle defects along tangent line at three positions.
Energies 18 03628 g011
Figure 12. Electric field distribution under defects of flaky metallic particles with different lengths. (a) Length is 5 mm; (b) length is 10 mm; (c) length is 15 mm; (d) length is 20 mm; (e) length is 25 mm; (f) length is 30 mm.
Energies 18 03628 g012
Figure 13. Maximum field strength of main insulating flaky particles with different lengths.
Energies 18 03628 g013
Figure 14. Nephogram of electric field distribution of flaky metallic particles at different positions. (a) The metallic particles are near the inside; (b) the metallic particles are located in the middle; (c) the metallic particles are near the outside.
Energies 18 03628 g014
Figure 15. Electric field intensity of flaky metallic particle defects along the tangent line at three positions.
Energies 18 03628 g015
Table 1. Material properties of current transformers components.
Part NameMaterialElectrical Conductivity (S/m)Relative Dielectric Constant
oil conservatoriron10.295 × 1061
secondary shieldaluminum 3.774 × 1071
insulation paperinsulation paper9.9 × 10−43.5~4.4
dielectric oiltransformer oil0.3 × 10−122.2
Table 2. Maximum values of field strength at elliptical metallic particles with and without defects.
Electric Field Intensity When There is Defect (V/m)Electric Field Strength Without Defects (V/m)
The metallic particles are close to the outside.16.9 × 1065.12 × 106
The metallic particles are located in the middle.18.5 × 1065.26 × 106
The metallic particles are close to the inside.27.8 × 1065.41 × 106
Table 3. Maximum values of field strength at flake metallic particles with and without defects.
Electric Field Intensity When There is Defect (V/m)Electric Field Strength Without Defects (V/m)
The metallic particles are close to the outside.7.97 × 1065.08 × 106
The metallic particles are located in the middle.8.89 × 1065.21 × 106
The metallic particles are close to the inside.9.64 × 1065.42 × 106
Disclaimer/Publisher’s Note: The statements, opinions and data contained in all publications are solely those of the individual author(s) and contributor(s) and not of MDPI and/or the editor(s). MDPI and/or the editor(s) disclaim responsibility for any injury to people or property resulting from any ideas, methods, instructions or products referred to in the content.

