
FEM Simulation of FDS Response in Oil-Impregnated Paper Insulation of Current Transformers with Axial Aging Variation

 ,
,
Abstract
1. Introduction
2. Theory of the FDS
3. Thermal Simulation and Prototype Aging Experiment
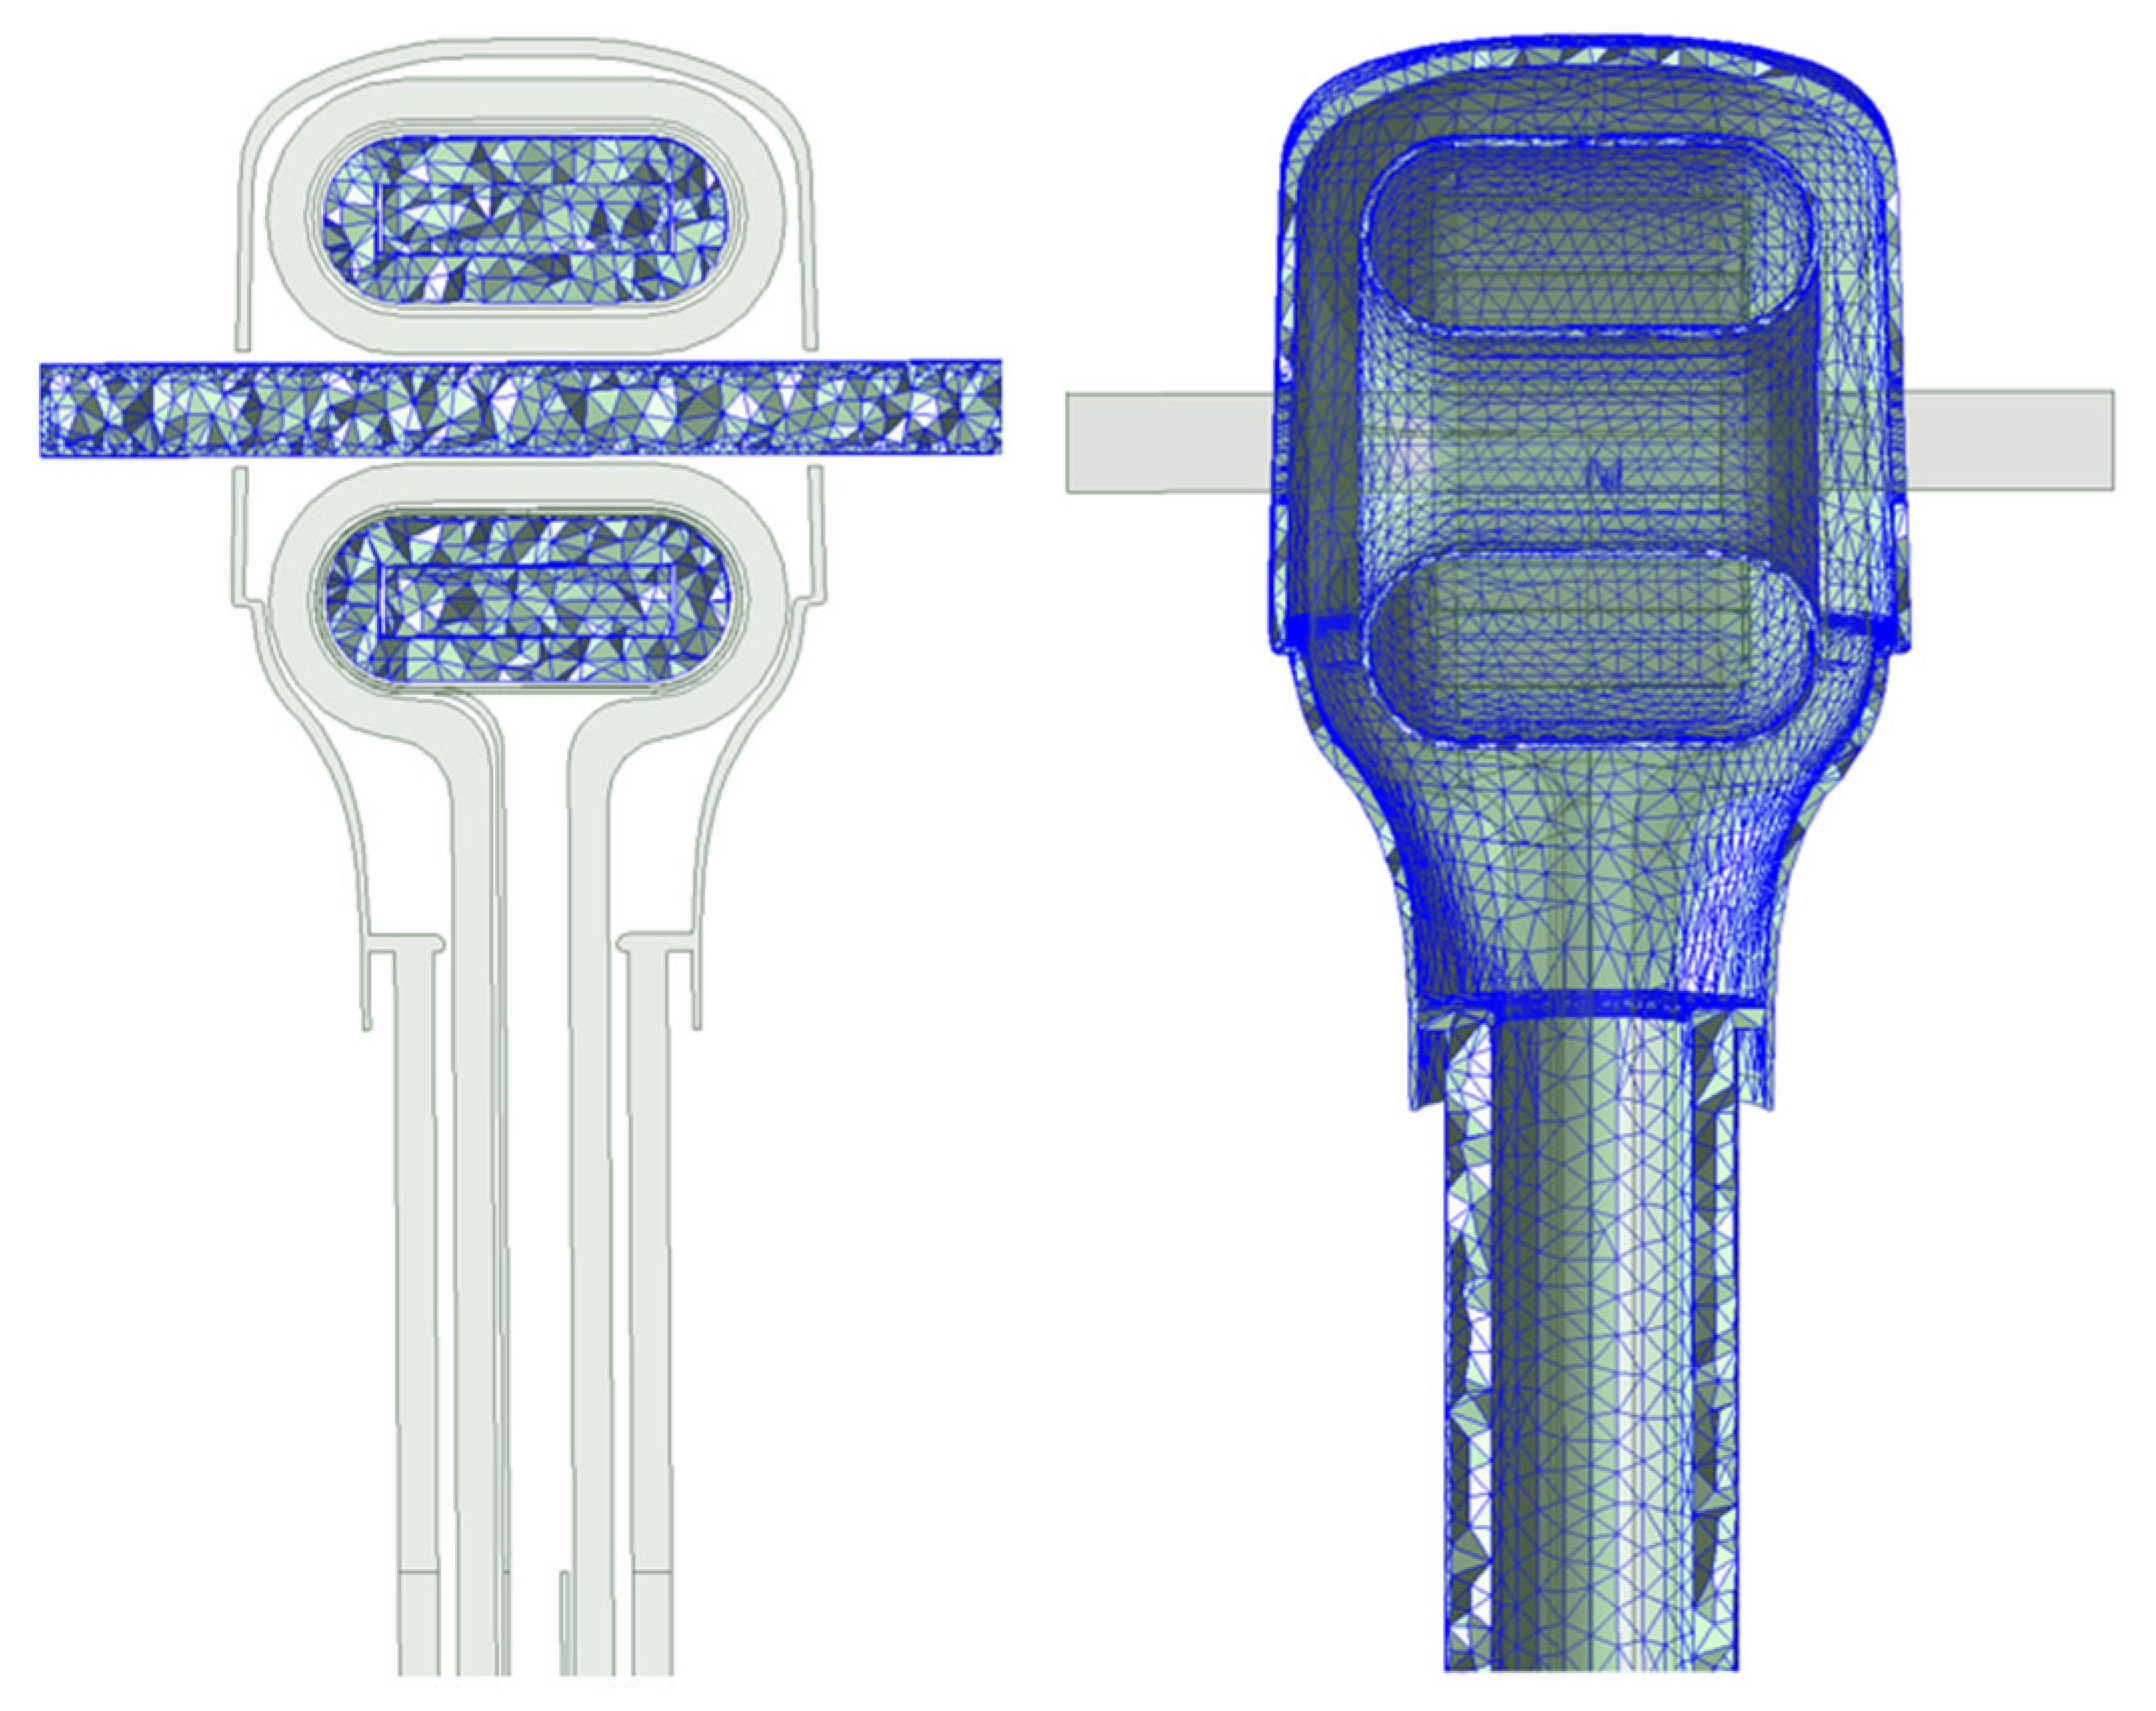
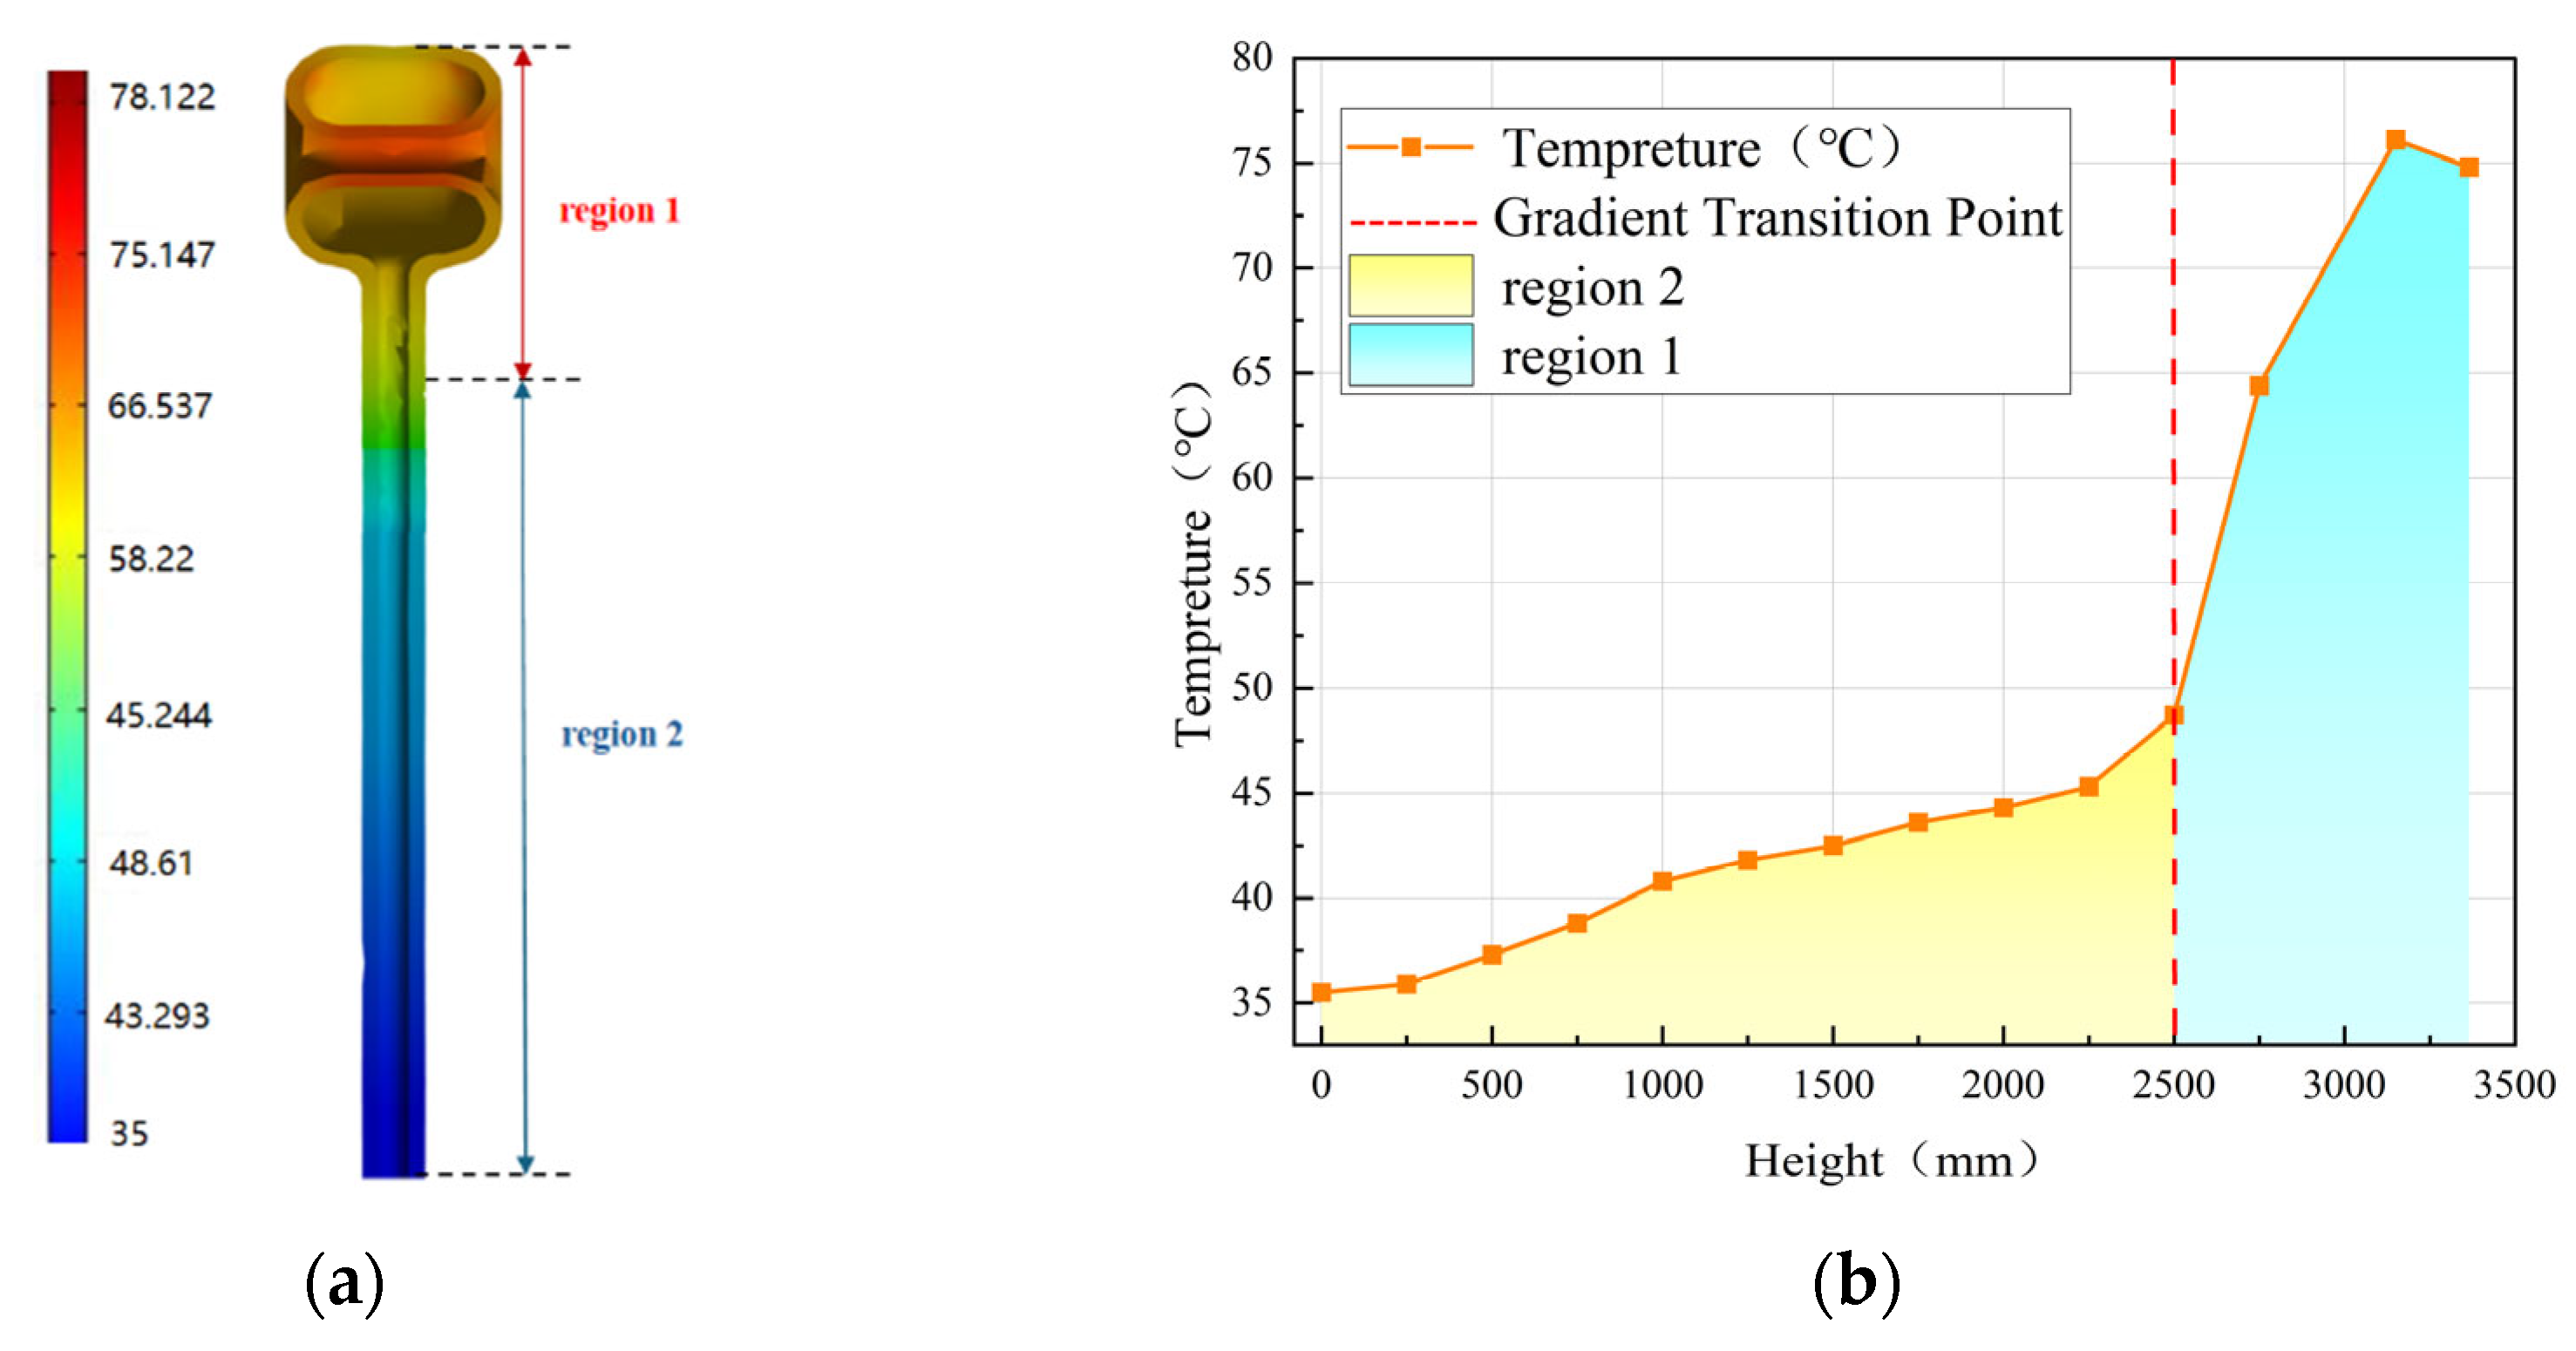
3.1. Thermal Simulation
3.2. Accelerated Thermal Aging Test
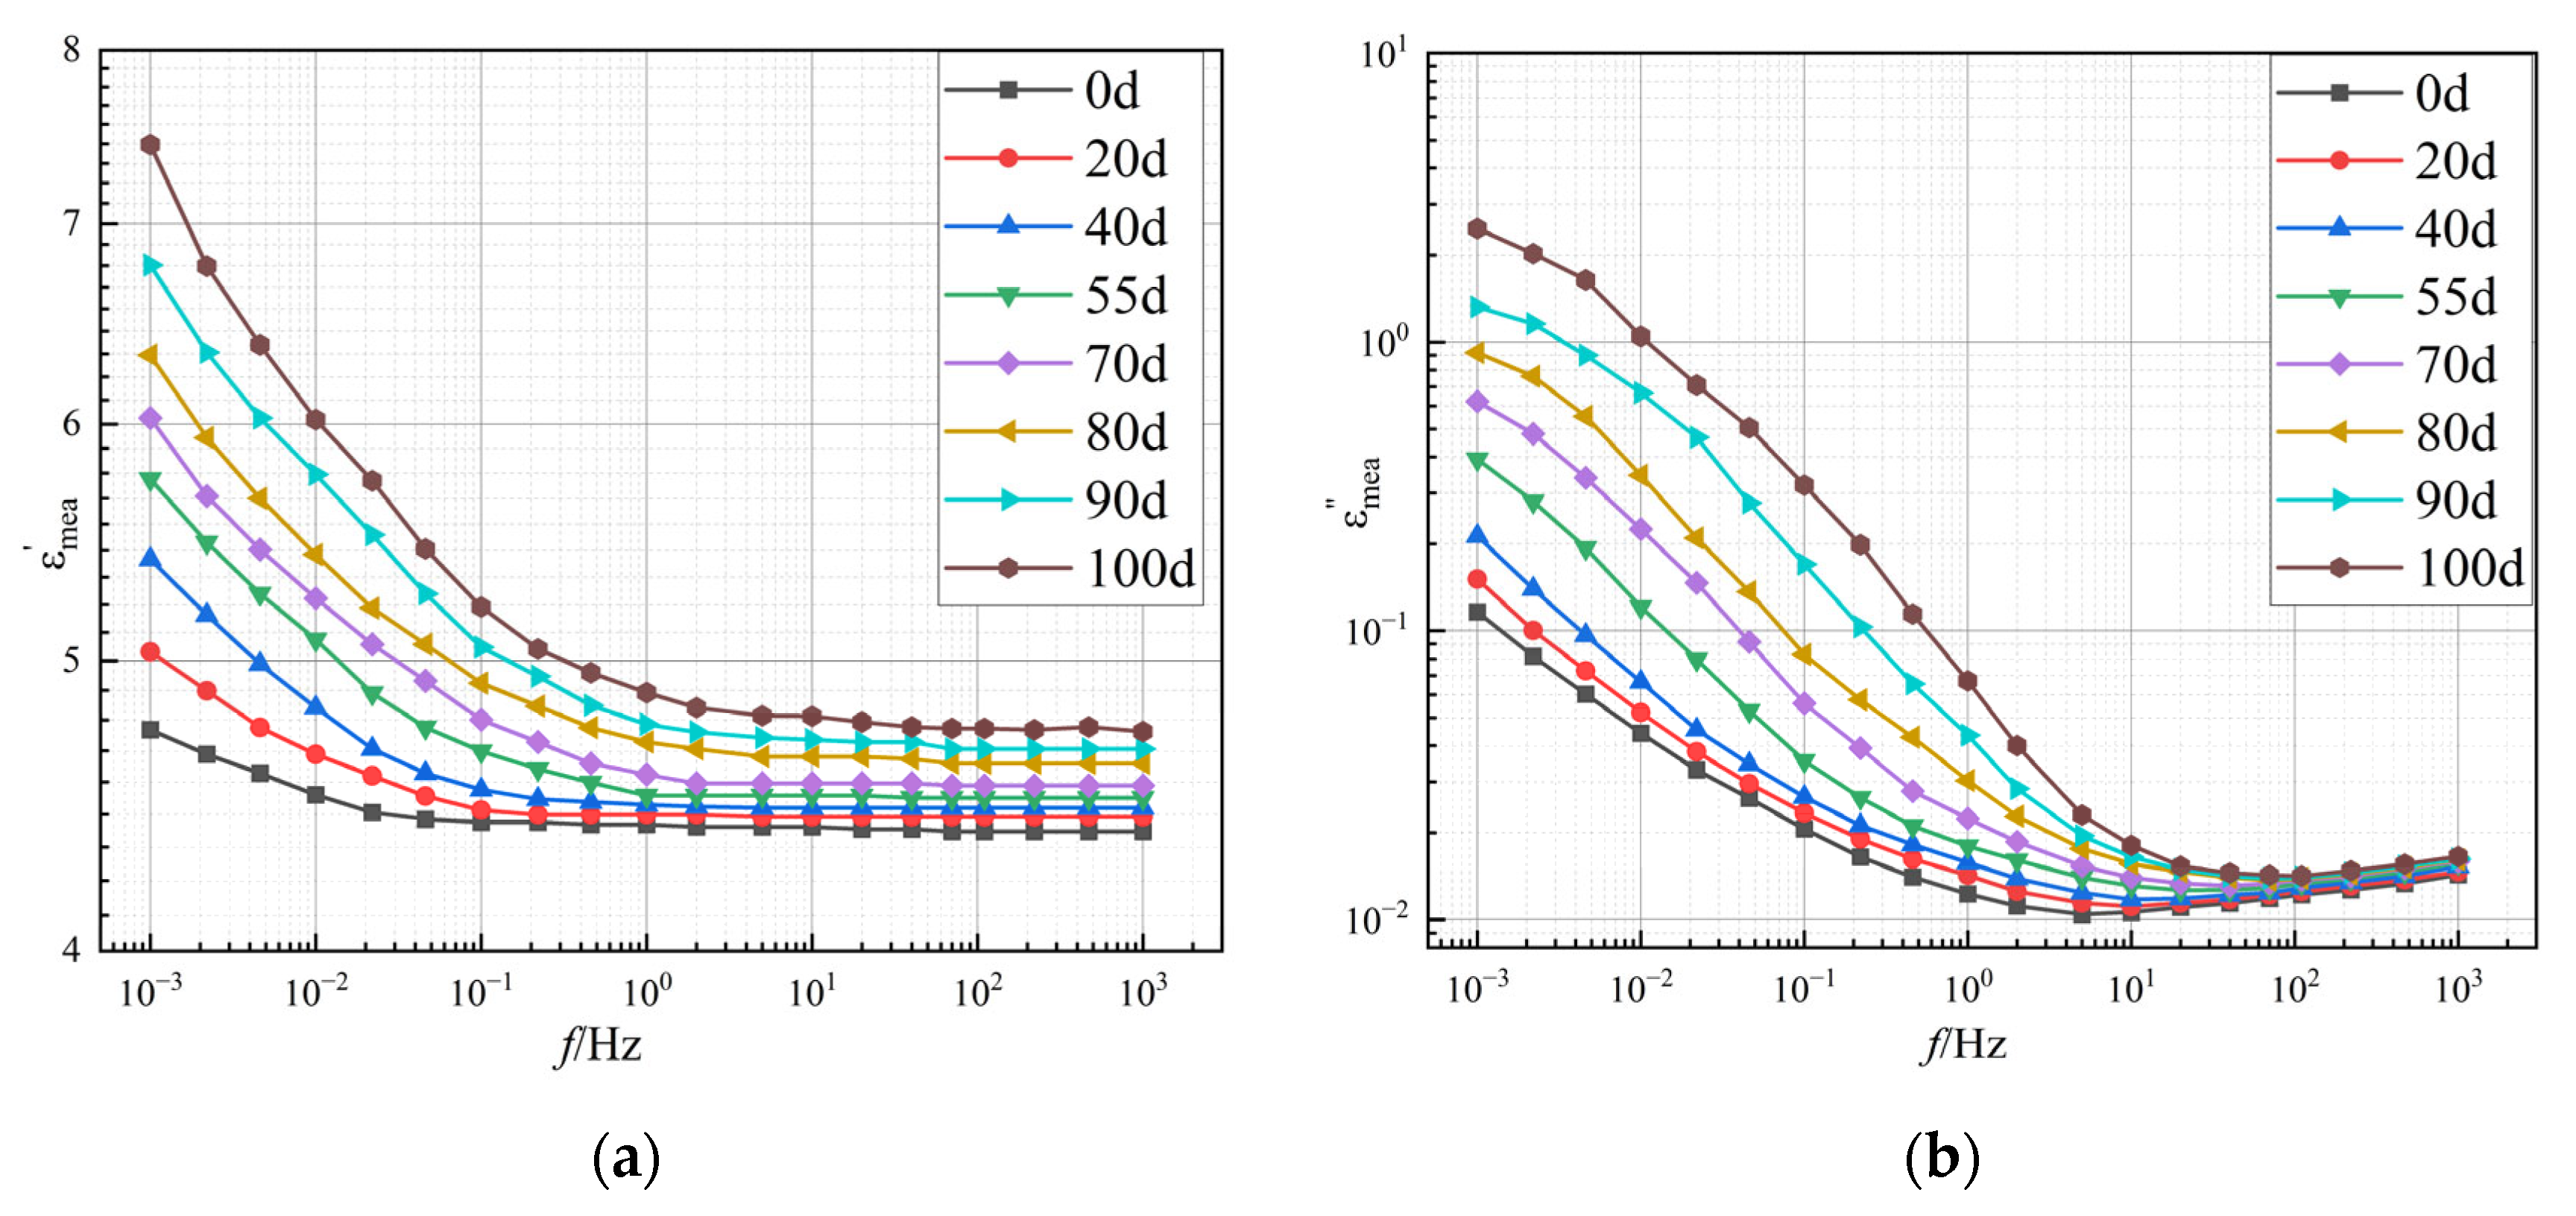
3.3. FDS Testing of the Prototype and OIP Samples
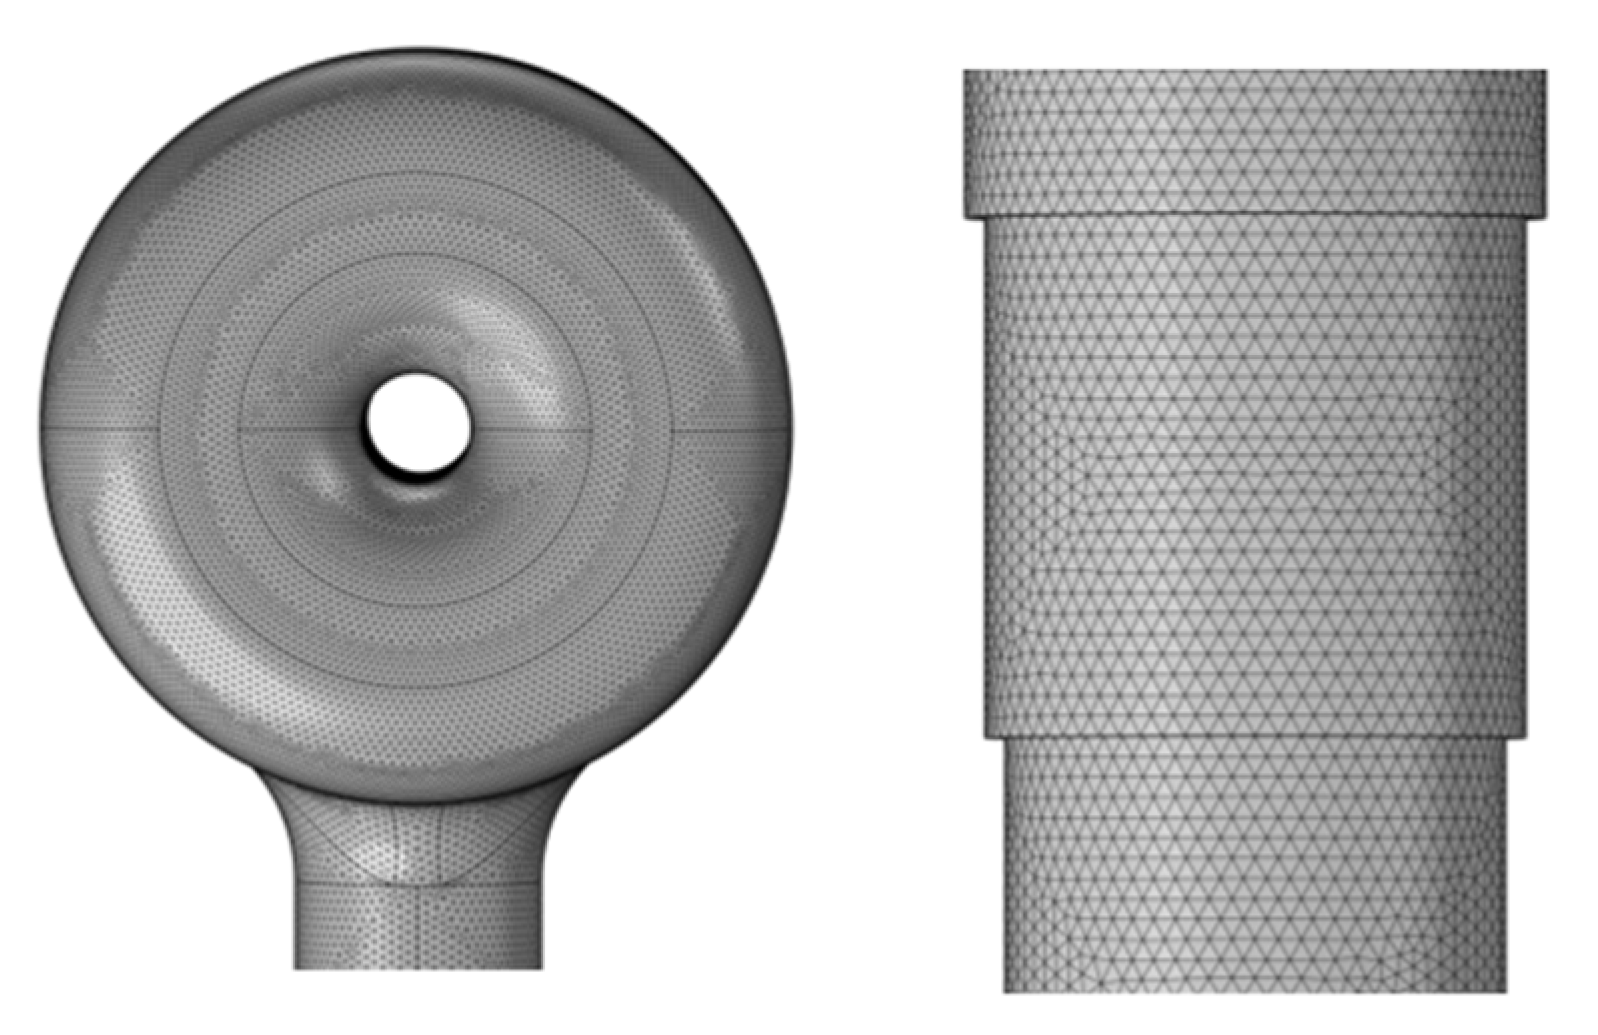
4. Construction of FEM Model for Main Insulation of CT
5. Results and Discussion
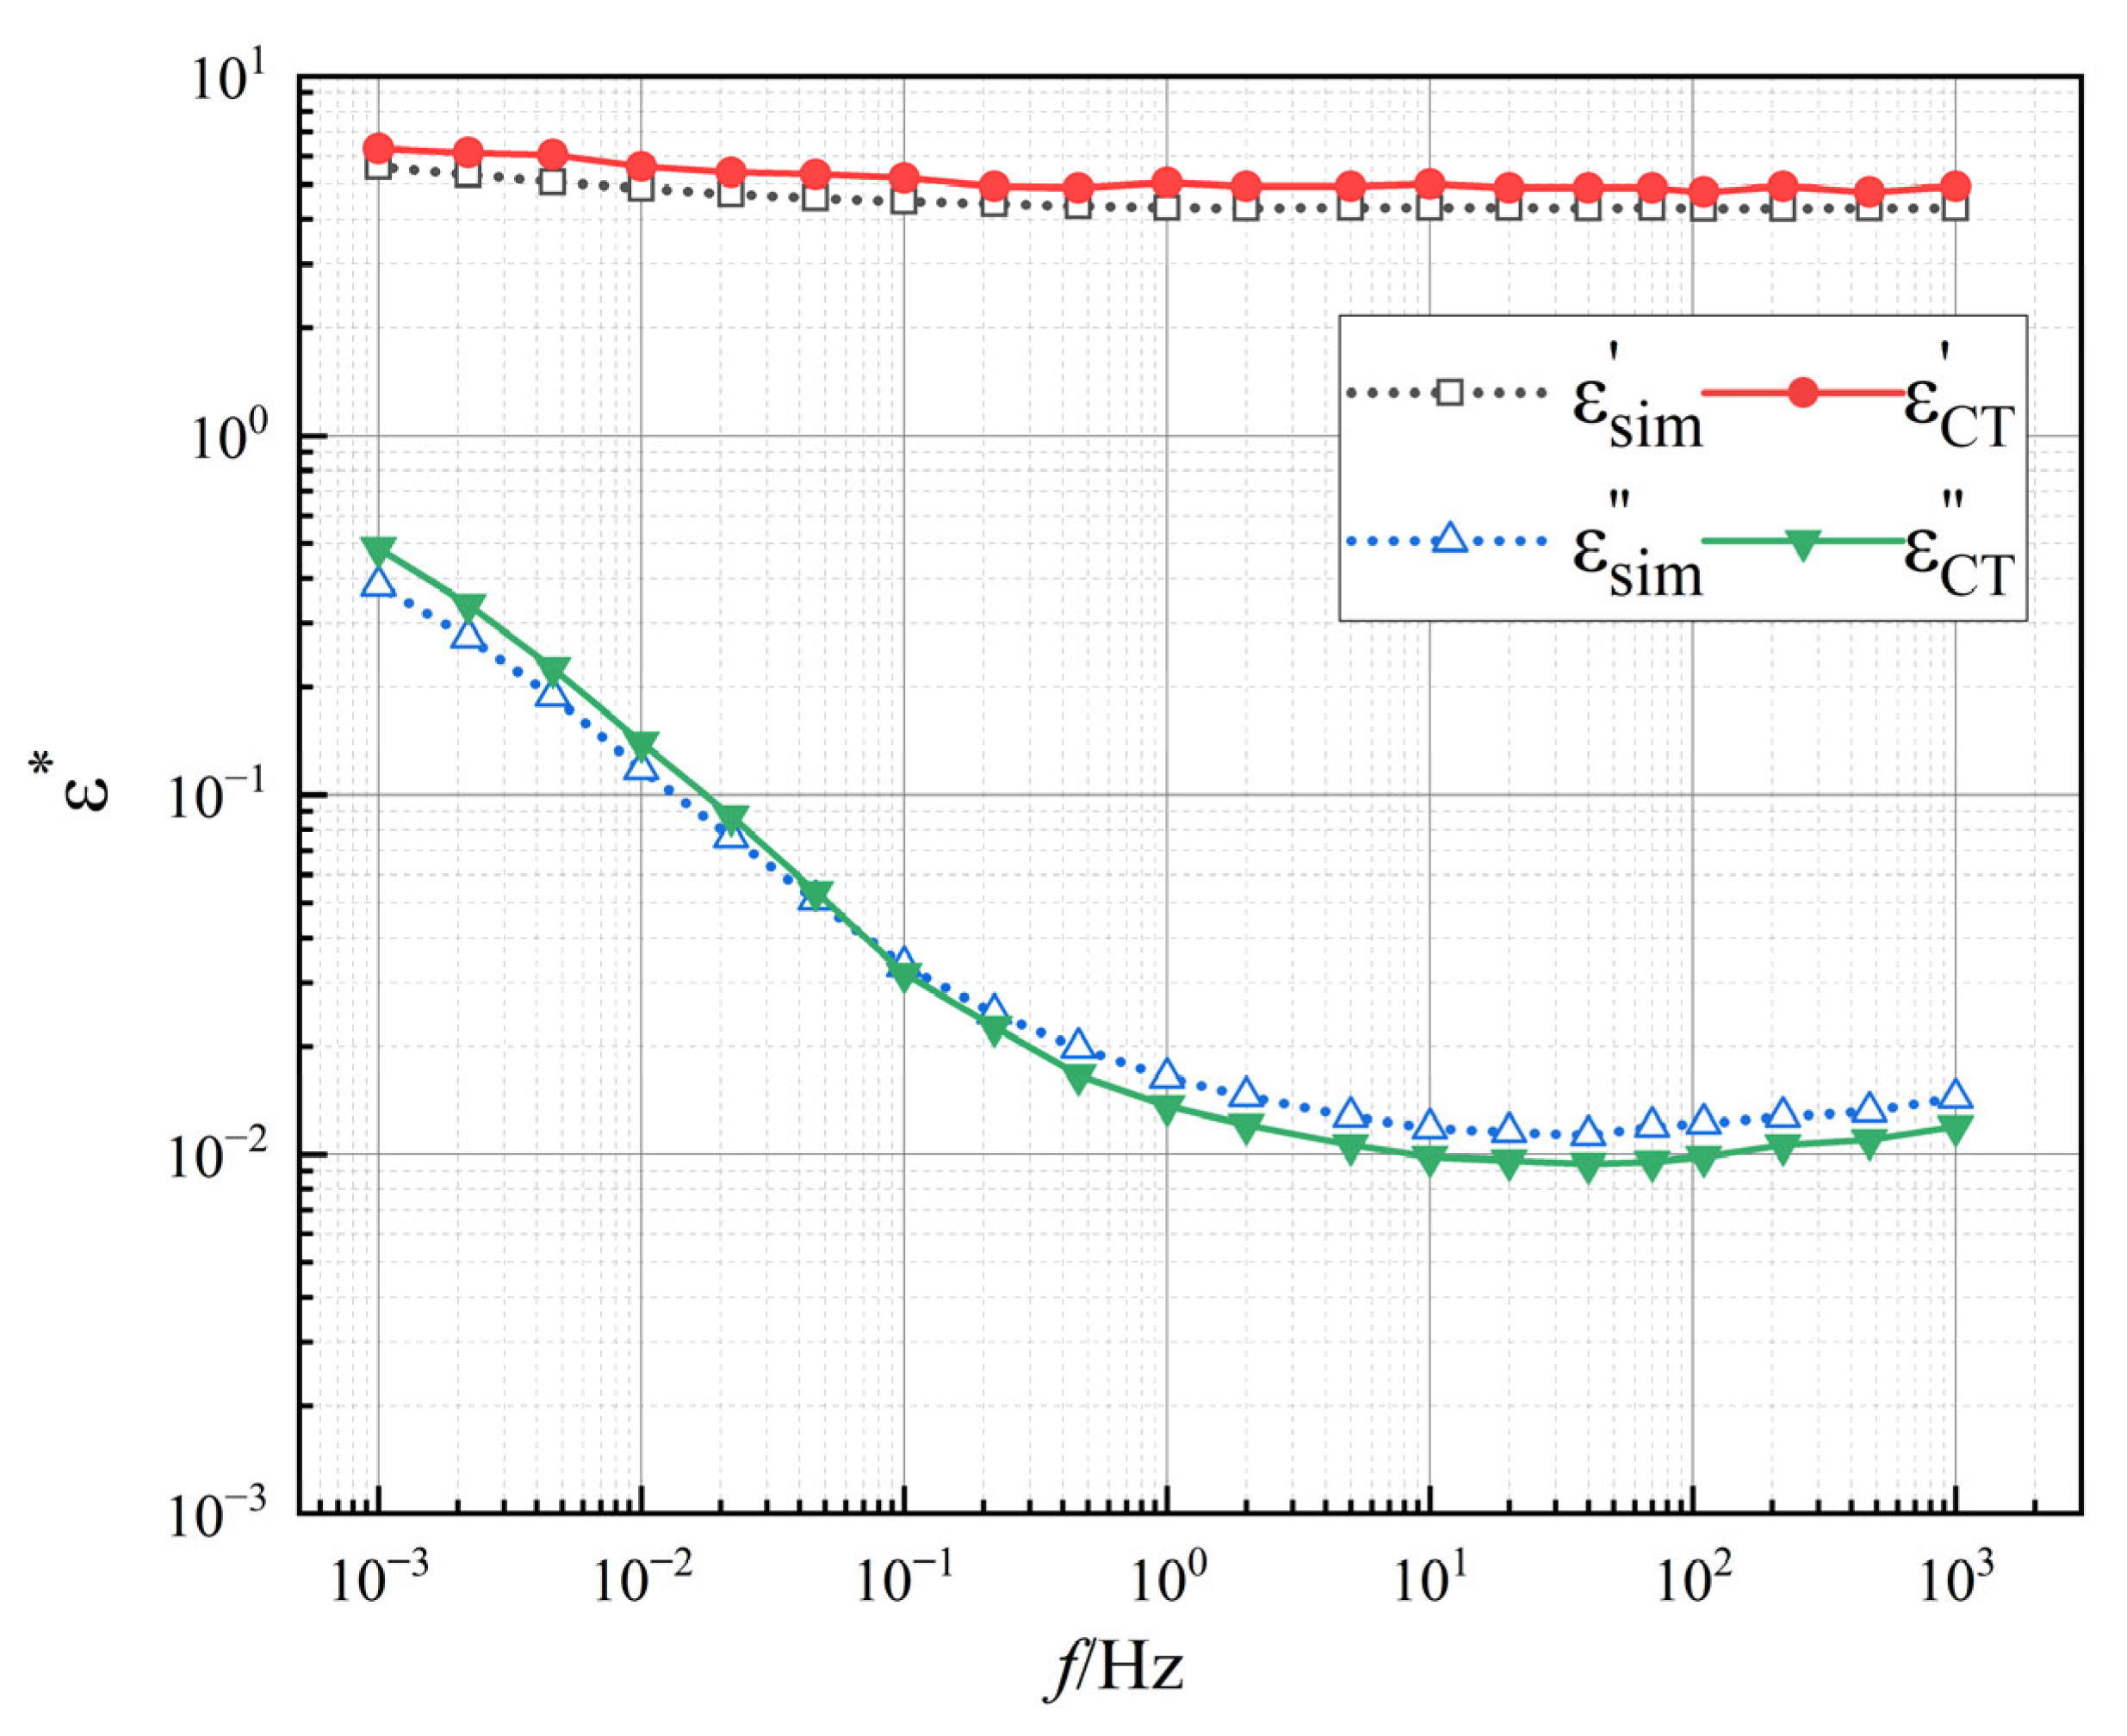
5.1. Validation of Simulation and Experimental Results
5.2. Model Application Validation Using In-Service CT
6. Conclusions
Author Contributions
Funding
Data Availability Statement
Conflicts of Interest
Acronyms
| CT | Current Transformer |
| OIP | Oil-Impregnated Paper |
| FDS | Frequency Domain Spectroscopy |
| FEM | Finite Element Method |
| HV | High Voltage |
| LV | Low Voltage |
| DFR | Dielectric Frequency Response |
| RE’ | Relative Error of Real Part |
| RE” | Relative Error of Imaginary Part |
| AC | Alternating Current |
| DC | Direct Current |
References
- Wang, Q.; Yang, W.L.; Che, C.Q.; Liu, Z.L.; Yang, B.; Chen, H. Diagnosis and Analysis of Oil-Immersed Current Transformer with PD Defects. Transformer 2020, 57, 82–86. (In Chinese) [Google Scholar]
- Chen, R.G.; Han, H.G.; Sun, Y.H. Problem Analysis of 220kV Oil-Immersed Inverted Current Transformer. Transformer 2010, 47, 68–71+74. (In Chinese) [Google Scholar]
- Lee, J.Y.; Ahn, H.M.; Kim, J.K. Finite-Element Analysis of Short-Circuit Electromagnetic Force in Power Transformer. IEEE Trans. Ind. Appl. 2011, 47, 1267–1272. [Google Scholar]
- Wang, K.; Liu, J.; Li, G.; Li, J.; Zhang, S.; Yan, Y.; Wu, C. 3-D FEM Analysis of Loss and Temperature Distribution in Steady State for 550kV Oil Immersed Current Transformer. In Proceedings of the 2020 IEEE International Conference on High Voltage Engineering and Application (ICHVE), Beijing, China, 6 September 2020; IEEE: New York, NY, USA, 2020; pp. 1–5. [Google Scholar]
- Allahbakhshi, M.; Akbari, M. Heat Analysis of the Power Transformer Bushings Using the Finite Element Method. Appl. Therm. Eng. 2016, 100, 714–720. [Google Scholar] [CrossRef]
- Bai, X.Y.; Liu, J.Y.; Wang, K.; Yang, Y.; Gao, B.; Wu, G.N. 3-D FEM Analysis of Loss and Temperature Distribution in Steady State for 550kV Oil-Immersed Composite Bushing. Electr. Eng. 2021, 13, 6–10. (In Chinese) [Google Scholar]
- Li, Y.S.; Wang, B.; Liu, J. Modeling and Experimental Study on Temperature Characteristics of All-Fiber Optic Current Transformers. Proc. CSEE 2018, 38, 2772–2782+2847. (In Chinese) [Google Scholar]
- Liu, J.; Wang, Q.; Fan, X.; Sun, T.; Zhang, Y. An Improved Geometric Model for Constructing Frequency-Domain Spectroscopy of Nonuniform Aged Oil–Paper Insulation. IEEE Trans. Dielect. Electr. Insul. 2023, 30, 317–325. [Google Scholar] [CrossRef]
- Saha, T.K.; Purkait, P. Understanding the Impacts of Moisture and Thermal Ageing on Transformer’s Insulation by Dielectric Response and Molecular Weight Measurements. IEEE Trans. Dielect. Electr. Insul. 2008, 15, 568–582. [Google Scholar] [CrossRef]
- Qi, B.; Dai, Q.; Li, C.; Zeng, Z.; Fu, M.; Zhuo, R. The Mechanism and Diagnosis of Insulation Deterioration Caused by Moisture Ingress into Oil-Impregnated Paper Bushing. Energies 2018, 11, 1496. [Google Scholar] [CrossRef]
- Yang, F.; Du, L.; Yang, L.; Wei, C.; Wang, Y.; Ran, L.; He, P. A Parameterization Approach for the Dielectric Response Model of Oil Paper Insulation Using FDS Measurements. Energies 2018, 11, 622. [Google Scholar] [CrossRef]
- Fan, X.; Liu, J.; Goh, H.H.; Zhang, Y.; Zhang, C.; Rahman, S. Acquisition of FDS for Oil-Immersed Insulation at Transformer Hotspot Region Based on Multiconstraint NSGA Model. IEEE Trans. Ind. Electron. 2022, 69, 13625–13635. [Google Scholar] [CrossRef]
- Fan, X.; Jiang, K.; Liu, J.; Wang, Q.; Zhang, Y. Analysis of Moisture Diffusion of Oil-Impregnated Bushing under Axial Non-Uniform Distribution Based on FEM and Fick’s Second Law. In Proceedings of the 22nd International Symposium on High Voltage Engineering (ISH 2021), Xi’an, China, 21–26 November 2021; Institution of Engineering and Technology: Beijing, China, 2021; pp. 1802–1805. [Google Scholar]
- Su, Z.; Zhang, Y.; Du, Y.; Goh, H.H.; Jia, P.; Abdul-Malek, Z. Two Models for Predicting Frequency-Domain Spectroscopy of Nonuniformly Damped OIP Bushings Based on FEM and Dielectric Theory. IEEE Trans. Instrum. Meas. 2024, 73, 3519810. [Google Scholar] [CrossRef]
- Walczak, K.; Gielniak, J. Temperature Distribution in the Insulation System of Condenser-Type HV Bushing—Its Effect on Dielectric Response in the Frequency Domain. Energies 2021, 14, 4016. [Google Scholar] [CrossRef]
- Thanua, N.; Kumbhar, G.B. A Modified Simulation Model Using FEM for Monitoring Transformer Insulation Health Under Non Uniform Aging. In Proceedings of the 2022 IEEE Conference on Electrical Insulation and Dielectric Phenomena (CEIDP), Denver, CO, USA, 30 October–2 November 2022; IEEE: New York, NY, USA, 2022; pp. 65–68. [Google Scholar]
- Liu, J.; Yang, S.; Zhang, Y.; Zheng, H.; Shi, Z.; Zhang, C. A Modified X-Model of the Oil-Impregnated Bushing Including Non-Uniform Thermal Aging of Cellulose Insulation. Cellulose 2020, 27, 4525–4538. [Google Scholar] [CrossRef]
- Li, H. Introdiction of Dielectric Physics; Chendu University of Science and Technology Press: Chengdu, China, 1990; pp. 127–130. (In Chinese) [Google Scholar]
- Liu, J.; Sun, T.; Fan, X.; Zhang, Y.; Lai, B. A Modified Simulation Model for Predicting the FDS of Transformer Oil-Paper Insulation Under Nonuniform Aging. IEEE Trans. Instrum. Meas. 2021, 70, 6004709. [Google Scholar] [CrossRef]
- Subocz, J.; Mrozik, A.; Bohatyrewicz, P.; Zenker, M. Condition Assessment of HV Bushings with Solid Insulation based on the SVM and the FDS Methods. Energies 2020, 13, 853. [Google Scholar] [CrossRef]
- Spressola, F.E.; Roman, Z.; Oliveira, R.G.; Lagos, F.M.; Neto, E.T.W. Aging of Oil-Impregnated Paper High Voltage Current Transformers: Long Duration Test and Lifespan Estimation. IEEE Trans. Dielect. Electr. Insul. 2024, 31, 358–365. [Google Scholar] [CrossRef]
- Ji, K.Y.; Liu, Y.; Li, B.N.; Li, X.; Huang, L.F.; Chen, T. Study on the Distribution of Internal Temperature Field and the Impact Characteristics of Internal Pressure in Inverted Oil-Immersed Current Transformers. J. Chongqing Univ. 2021, 44, 134–145. (In Chinese) [Google Scholar]
- Dong, M.; Liu, Y.; Ren, M.; Wu, X.Z.; Li, J.Z.; Cheng, H.C. Finite Element Simulation and Research on the Influence of Moisture Content and Distribution on the Frequency Domain Dielectric Spectrum of Oil-Paper Insulation. High Volt. Eng. 2014, 40, 3403–3410. (In Chinese) [Google Scholar]
- Fofana, I.; Hemmatjou, H.; Meghnefi, F.; Farzaneh, M.; Setayeshmehr, A.; Borsi, H.; Gockenbach, E. On the Frequency Domain Dielectric Response of Oil-Paper Insulation at Low Temperatures. IEEE Trans. Power Deliv. 2010, 17, 799–806. [Google Scholar] [CrossRef]
- GB/T 1094.2-2013; Power Transformers—Part 2: Temperature Rise for Liquid-Immersed Transformers. Standardization Administration of China: Beijing, China, 2013. (In Chinese)
- DL/T 984-2018; Guidelines for Insulation Aging Evaluation of Oil-Immersed Transformers. China Electric Power Enterprise Federation: Beijing, China, 2018.
- Raetzke, S.; Koch, M.; Anglhuber, M. Modern Insulation Condition Assessment for Instrument Transformers. In Proceedings of the 2012 IEEE International Conference on Condition Monitoring and Diagnosis (CMD), Bali, Indonesia, 23–27 September 2012; IEEE: New York, NY, USA, 2013; pp. 52–55. [Google Scholar]
- Su, Z.; Liu, Y.; Chen, H.; Wang, X. Frequency Domain Dielectric Response of Oil-Paper Capacitor Bushing Under Uneven Thermal Aging. In Proceedings of the 2024 11th International Forum on Electrical Engineering and Automation (IFEEA), Shenzhen, China, 22–24 November 2024; IEEE: New York, NY, USA, 2025; pp. 765–768. [Google Scholar]
- Yan, Z.; Zhu, D. High Voltage Insulation Technology; China Electric Power Press: Beijing, China, 2002; pp. 154–196. (In Chinese) [Google Scholar]


| Component | Material | Density/kg·m−3 | Specific Heat Capacity/J·(kg·K)−1 | Thermal Conductivity/W·(m·K)−1 |
|---|---|---|---|---|
| Primary conductor | Aluminum | 2719 | 871 | 202.4 |
| Iron core | Silicon steel | 7650 | 502 | 42.5 |
| insulation | OIP/Aluminum | 1200 | 1800 | 0.17 |
| Aging Time (days) | 20 | 40 | 55 | 70 | 80 | 90 | 100 |
| Equivalent Service Life (years) | 5.57 | 11.13 | 15.31 | 19.48 | 22.27 | 25.05 | 27.83 |
| Capacitive Screen | Straight Section Diameter/mm | Inter-Screen Step Difference/mm | Screen Length/mm | Annular Inner Diameter/mm | Annular Outer Diameter/mm |
|---|---|---|---|---|---|
| high-voltage screen | 289.98 | 10 | 1065.58 | 144.49 | 890.91 |
| intermediate screen | 182.78 | 14 | 2262.96 | 227.34 | 806.90 |
| final screen | 77.52 | - | 3191.41 | 309.76 | 722.40 |
| Aging Time | Aging Strategy | |
|---|---|---|
| Uniform Aging | Localized Aging | |
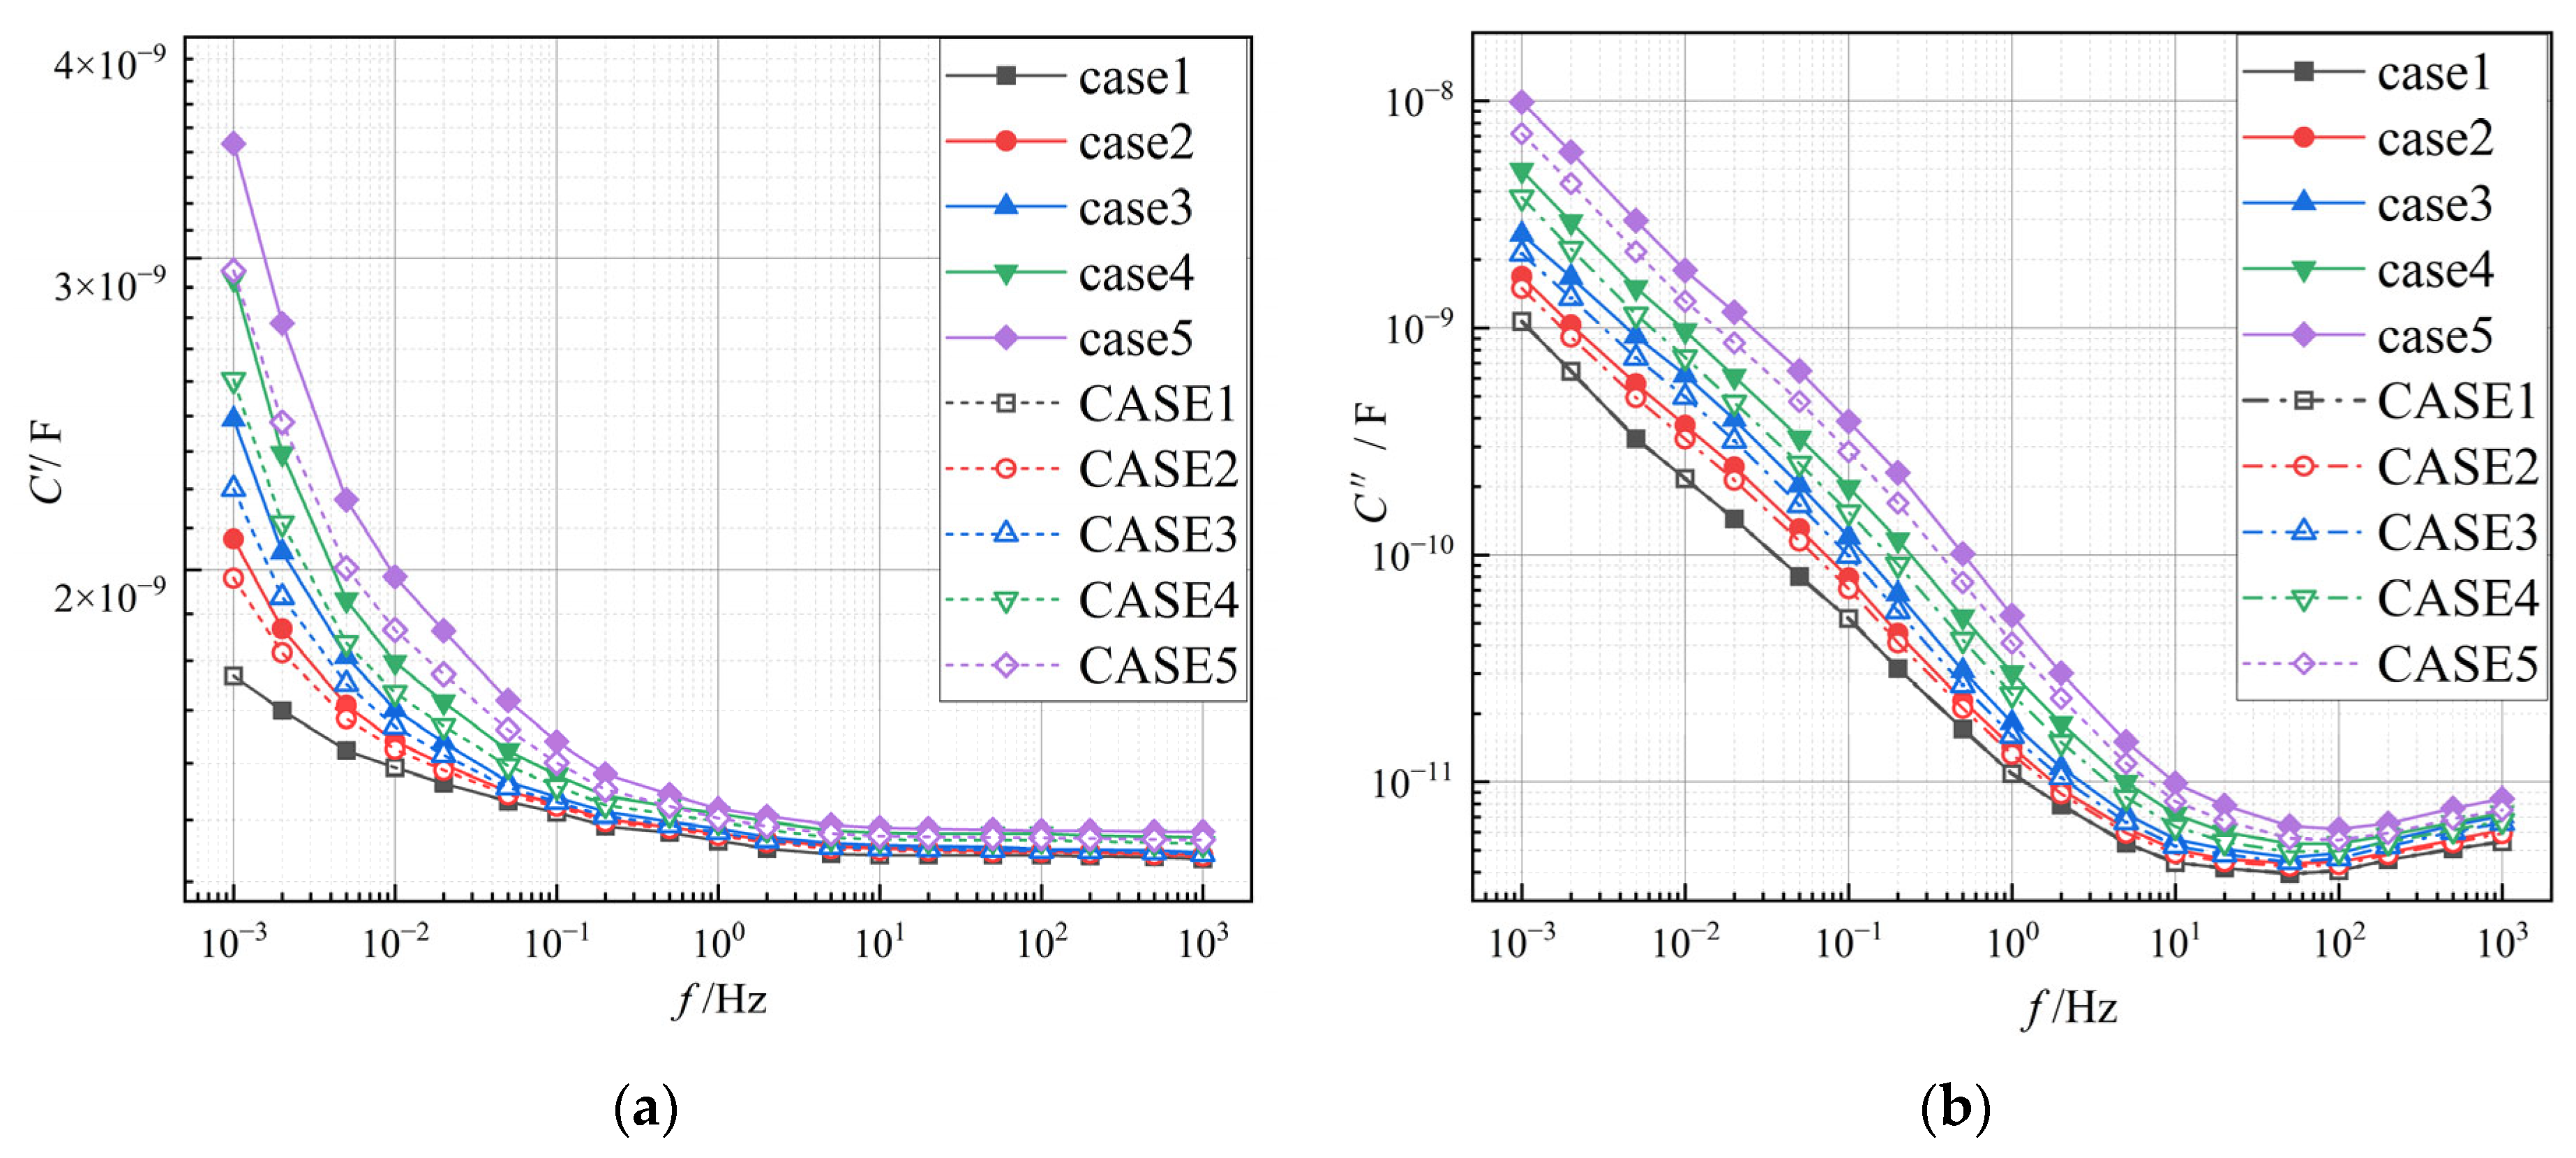
| 0 day aging | case 1 | CASE 1 |
| 20 day aging | case 2 | CASE 2 |
| 55 day aging | case 3 | CASE 3 |
| 80 day aging | case 4 | CASE 4 |
| 100 day aging | case 5 | CASE 5 |
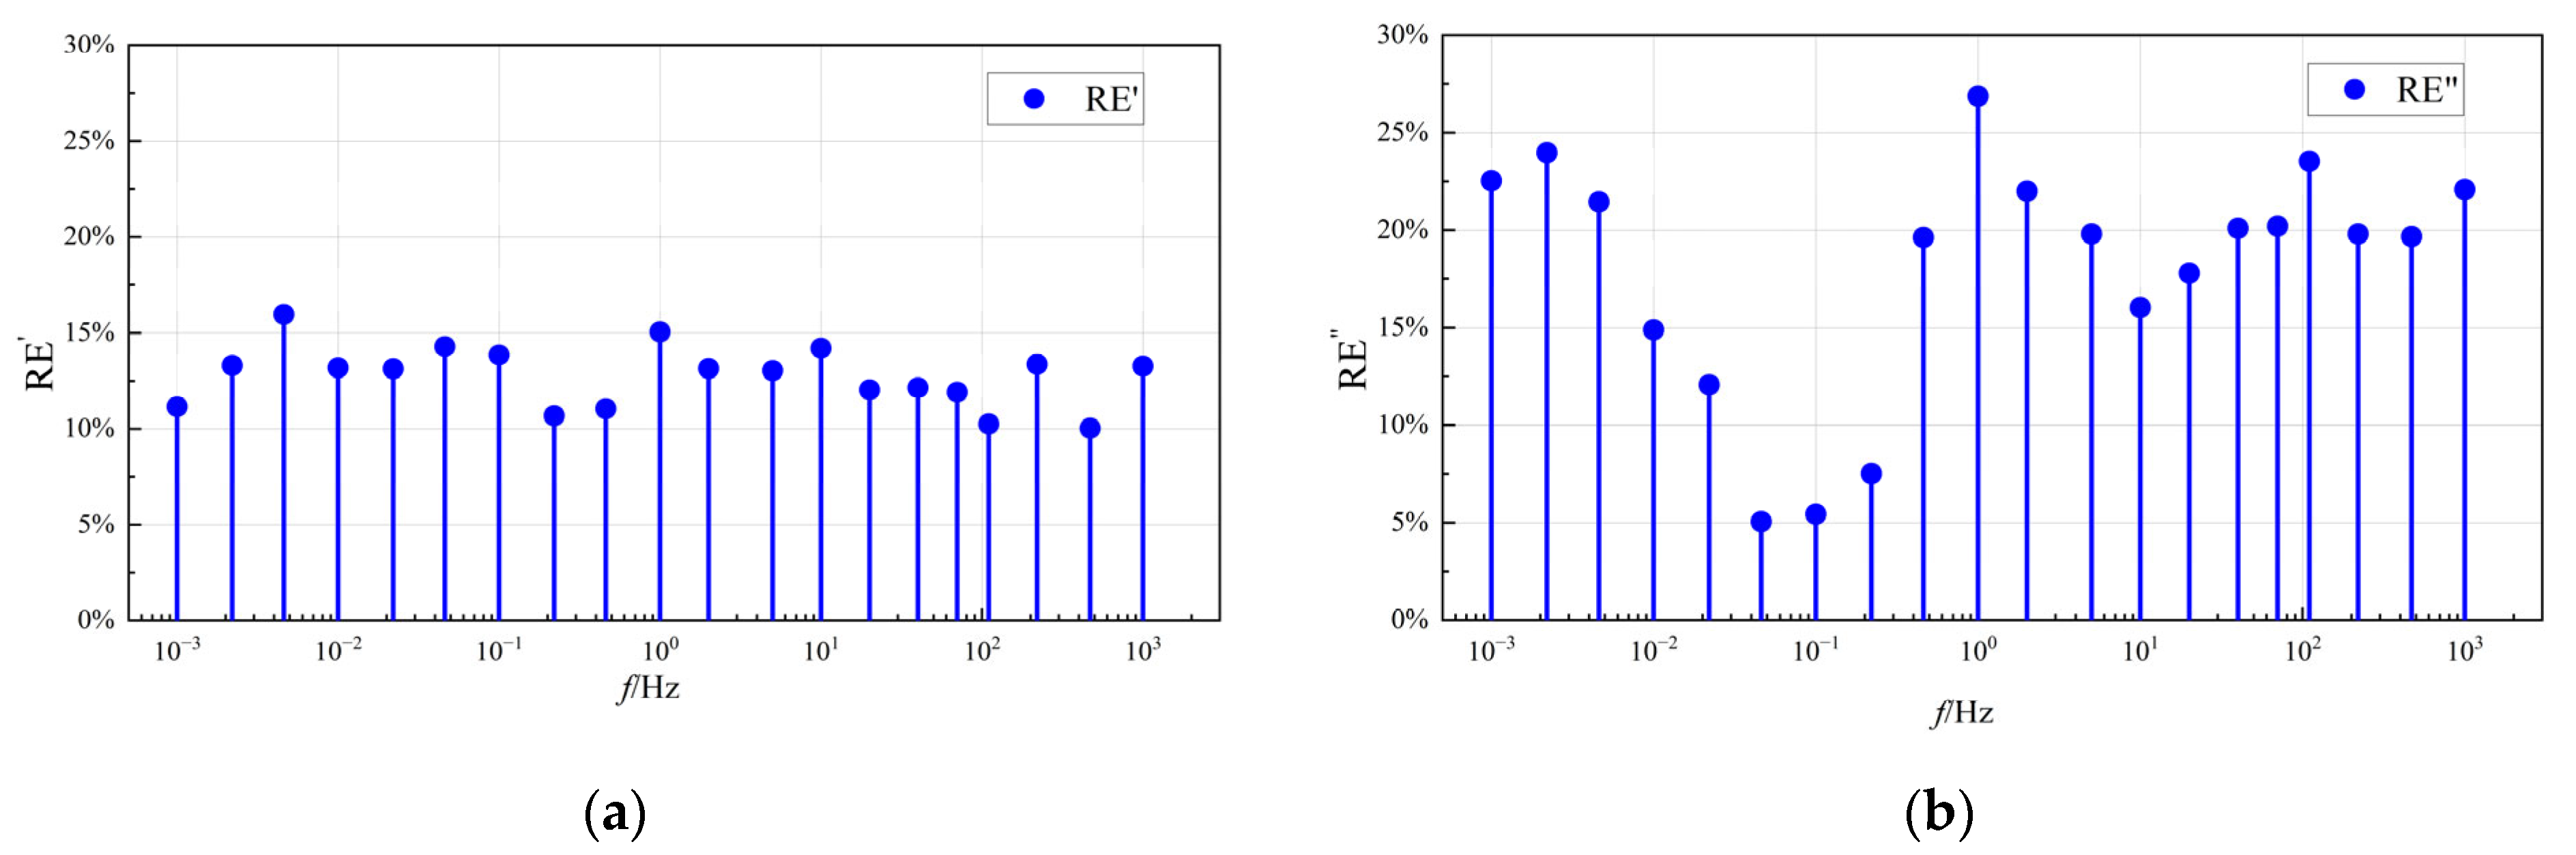
| Average Relative Error | Aging Stages | ||||
|---|---|---|---|---|---|
| 0 d | 20 d | 55 d | 80 d | 100 d | |
| RE′ | 4.8% | 4.49% | 4.27% | 3.74% | 3.41% |
| RE″ | 8.67% | 9.22% | 6.84% | 6.48% | 6.93% |
Disclaimer/Publisher’s Note: The statements, opinions and data contained in all publications are solely those of the individual author(s) and contributor(s) and not of MDPI and/or the editor(s). MDPI and/or the editor(s) disclaim responsibility for any injury to people or property resulting from any ideas, methods, instructions or products referred to in the content. |
© 2025 by the authors. Licensee MDPI, Basel, Switzerland. This article is an open access article distributed under the terms and conditions of the Creative Commons Attribution (CC BY) license (https://creativecommons.org/licenses/by/4.0/).
Share and Cite
Wang, L.; Zhang, Y.; Yang, L.; Hu, X.; Xu, S.; Huang, W.; Wang, L. FEM Simulation of FDS Response in Oil-Impregnated Paper Insulation of Current Transformers with Axial Aging Variation. Energies 2025, 18, 3163. https://doi.org/10.3390/en18123163
Wang L, Zhang Y, Yang L, Hu X, Xu S, Huang W, Wang L. FEM Simulation of FDS Response in Oil-Impregnated Paper Insulation of Current Transformers with Axial Aging Variation. Energies. 2025; 18(12):3163. https://doi.org/10.3390/en18123163
Chicago/Turabian StyleWang, Lujia, Yutong Zhang, Ling Yang, Xiaoyu Hu, Sien Xu, Weimin Huang, and Longzhen Wang. 2025. "FEM Simulation of FDS Response in Oil-Impregnated Paper Insulation of Current Transformers with Axial Aging Variation" Energies 18, no. 12: 3163. https://doi.org/10.3390/en18123163
APA StyleWang, L., Zhang, Y., Yang, L., Hu, X., Xu, S., Huang, W., & Wang, L. (2025). FEM Simulation of FDS Response in Oil-Impregnated Paper Insulation of Current Transformers with Axial Aging Variation. Energies, 18(12), 3163. https://doi.org/10.3390/en18123163