1. Introduction
The transition toward more sustainable and energy-efficient buildings has become a key priority within the architectural, urban, and environmental disciplines. New constructions are increasingly aligned with innovative technologies and ecological strategies; however, the following persistent and complex challenge remains: how can we effectively retrofit and manage the vast stock of existing buildings, particularly those with heritage or institutional value, which account for a substantial portion of urban carbon emissions [
1].
Public and educational buildings present a unique testing ground due to their size, operational complexity, and social impact. They are particularly well-suited for prototyping sensor-based monitoring systems and low-intrusive retrofitting strategies [
2,
3]. Monitoring these buildings not only provides actionable insights for optimizing energy consumption and indoor environmental quality [
4] but also creates an opportunity for scalable models to become applicable across campuses and public infrastructures [
5].
This article presents a living laboratory case study of a 50-year-old architectural building—the School of Architecture at the Universidad de Navarra—that was transformed by installing a dense, wired sensor network. Over 50 sensors and 270 m of internal cabling now generate 5568 data points daily, enabling the precise tracking of variables such as temperature, humidity, CO
2 levels, and solar radiation. Unlike studies based on simulations or isolated IoT devices [
6], our approach is grounded in the systematic, real-time collection of empirical data and its structured use through a private/public dual-interface system. This proposal addresses an un-described need: how can we transform a heritage building into a living lab? How can we integrate sensors and monitor the building during unlimited periods? The article’s object will be explaining a methodology that can respond to these questions.
The principal contribution of this work is to establish a methodological and operational model for sensor integration in Do.Co.Mo.Mo. (Documentation and Conservation of buildings, sites and neighborhoods of the Modern Movement) buildings that (1) optimizes HVAC performance and energy consumption, (2) supports user well-being and adaptive comfort strategies, and (3) lays the groundwork for digital twin integration via Geographic Information Systems (GISs) [
7,
8]. This intervention also correlates with broader European sustainable development policy objectives, such as the Green Deal and New European Bauhaus initiatives, which advocate for integrating data-driven and human-centered design in existing environments [
9].
In contrast to high-cost smart building retrofits dependent on wireless technologies or battery-powered sensors—which often suffer from interruptions or limited lifespan—this project highlights the advantages of wired, robust, and scalable sensory infrastructures in operational and academic settings [
10]. Furthermore, by integrating data visualization tools, such as Grafana for professionals and real-time public dashboards for students, the initiative reinforces intelligent systems’ pedagogical and community-facing value.
In summary, this study describes the step-by-step methodological process followed to integrate over 50 sensors, which justifies the relevance of monitoring Do.Co.Mo.Mo. buildings within sustainability goals. Moreover, describes the practical deployment of a multi-sensory network in a heritage-listed academic facility. Furthermore, evaluates the system’s effectiveness in improving energy and environmental management and reflects on the potential for replication and further integration into digital planning platforms.
This work positions building sensorization not merely as a technological enhancement but as capable of causing a paradigmatic shift in how we understand and operate architecture, as a performative, responsive, and data-enriched infrastructure.
1.1. Literature Review
The integration of sensor technologies, smart systems, and digital modeling tools in heritage and educational buildings has emerged as a vital field within sustainable architecture and building science. Even though no methodology has been found to integrate those technologies. Intelligent systems offer not only technical innovation but also serve as enablers of holistic and human-centered transformation [
11]. The transition towards energy-efficient and resilient buildings has particularly stimulated interest in retrofitting existing structures responsible for a large share of global energy consumption and CO
2 emissions [
1]. As built environments age and educational needs evolve, these retrofitting initiatives serve to both modernize and preserve institutional identity.
Refurbishment strategies are central to climate change mitigation and the extension of architectural value. Numerous studies affirm that transforming buildings into nearly Zero Energy Buildings (nZEBs) is not only ecologically [
12] necessary but also economically viable [
13]. They are designed to reduce operational emissions while dramatically maximizing thermal and lighting performance. Research by Zaferanchi and Sozer [
11] demonstrates the successful conversion of educational buildings into nZEBs through envelope insulation, HVAC upgrades, and daylighting strategies. Ahmed [
2] further emphasizes the value of user engagement in low-energy renovation, highlighting its role in public and higher education buildings. Such user-centered design methodologies are essential not only for energy outcomes but also for improving pedagogical environments.
A key component of these transformations is real-time energy monitoring. Energy usage patterns often vary significantly throughout the day and across user profiles. Iavorschi and Milici [
13] discuss the role of thermographic and sensor-based diagnostics in detecting energy inefficiencies, while Romano and Donato [
14] highlight the link between monitoring and optimizing indoor comfort which is especially relevant in learning environments where cognitive performance correlates with thermal and acoustic stability. Monitoring enables proactive facility management, allowing institutions to predict and prevent discomfort or malfunction before they arise.
Transforming a conventional building into a Smart Building requires systematically implementing multiple technological and methodological components. According to the specialized literature, this adaptation process can be structured into five fundamental phases: the deployment of IoT sensor networks, energy efficiency optimization, the integration of Geographic Information Systems (GIS), the establishment of a Living Laboratory, and the installation of a comprehensive Smart Building Management System. Each of these stages constitutes an essential element for achieving the complete functionality of an intelligent building and must be addressed sequentially and coordinated.
1.1.1. Sensor Technologies and Placement Strategies in Historic Buildings
Monitoring requires non-invasive, durable, and precise sensor deployments [
15]. In historic or protected buildings, these installations must also respect architectural integrity. The 3ENCULT project is a foundational reference, offering tested methodologies for integrating temperature, humidity, and light sensors into protected structures. These approaches include hiding sensors behind architectural features or embedding them within furniture. Martín-Gómez [
16] and Desogus [
8] advocate for strategic zoning and robust wired systems in complex university buildings where wireless signals may be disrupted. In contrast, other studies favor wireless sensor networks (WSNs) for their ease of deployment and adaptability.
Recent comparative research [
1,
4] evaluated sensor network typologies, addressing accuracy, cost, and battery life. Important parameters identified included data granularity, sampling frequency, and synchronization across sensor nodes. Advances in data fusion—such as Kalman filtering, decision trees, and machine learning—enable robust environmental profiling and predictive analysis [
17,
18]. These techniques reduce noise and improve insight, transforming raw data into actionable intelligence.
1.1.2. Energy Retrofitting and Efficiency in Heritage Buildings
Energy retrofitting solutions must respect historic fabric while ensuring gains in measurable efficiency [
19]. Conservation-compatible solutions often involve interior insulation, reversible interventions, and low-impact technologies. Ahmed [
2] document effective, low-energy renovations for public heritage buildings, incorporating insulation, advanced HVAC systems, and user-oriented interfaces. The Zero-Carbon Pavilion in Shanghai [
1] exemplifies successful lifecycle carbon management through careful material selection, passive solar design, and smart envelope controls. The ITC Carrara case [
14] demonstrates how an occupant-centric design enhances thermal performance during interventions, confirming that environmental and educational goals can align.
The IEA-SHC Task 59 initiative combines European best practices in deep retrofitting, offering performance benchmarks and retrofitting packages tailored to conservation-sensitive contexts. These findings suggest that heritage buildings—once considered obstacles to energy efficiency—can become exemplars of sustainability through innovation and collaboration.
1.1.3. HBIM and GIS Integration for Heritage Monitoring
Digital twins based on HBIM (Heritage Building Information Modeling) and GIS (Geographic Information Systems) are pivotal for modeling, simulating, and managing historic assets. These platforms allow stakeholders to visualize degradation, simulate interventions, and plan coordinated maintenance. Bruno [
7] and Gargaro [
3] describe multi-layered HBIM platforms that can integrate sensor inputs, historical documentation, and predictive analytics. Acampa [
5] demonstrates GIS’s ability to both visualize intervention priorities at an urban scale and support the strategic planning of public authorities.
These platforms enable predictive maintenance, energy scenario modeling, and stakeholder engagement. HBIM is increasingly used for restoration and as a coordination tool in smart campus infrastructure. Osello [
20] and recent university strategies propose using GIS-HBIM to scale data across interconnected educational buildings. By integrating real-time monitoring with spatial data, institutions can better manage resource allocation, emergency responses, and sustainability reporting.
1.1.4. Living Laboratories in Building Research
E3LAB exemplifies the “living lab” paradigm: a real-world setting for innovation and iterative testing. Unlike conventional buildings, livlabs are purposefully designed to support experimentation, reflexive learning, and collaborative research. Internationally, the Edge in Amsterdam and SmartBuilt4EU projects have established benchmarks in participatory, sensor-based building operations. The University of Alberta has leveraged its campus as a testbed for smart technologies and behavioral research. These precedents confirm that livlabs are not just architectural prototypes, but socio-technical systems embedded in active communities.
Bavaresco [
21] and Pannier [
22] explore how livlabs enable the continuous monitoring of occupancy, air quality, and comfort, aligning environmental and human performance goals. Such platforms are uniquely suited for integrating interdisciplinary agendas, from pedagogy and technology to climate science. By providing data transparency and engaging users in feedback loops, Livlabs fosters ecological awareness and empowers building occupants to become co-managers of their space.
1.1.5. Smart Building Management Systems (SBMSs) in Educational Buildings
SBMSs are gaining traction in public and university contexts. These systems integrate control over lighting, HVAC, security, and occasionally occupancy tracking. Robillart [
18,
23] shows how predictive control strategies improve energy efficiency by aligning HVAC operations with occupancy data. These systems reduce operational costs and allow a finer balance between automated and user-led comfort control. Schalbart & Vorger [
24] describe using stochastic modeling to optimize building operations and enhance responsiveness.
Other studies [
25,
26] report up to 40% carbon reductions in SBMS-enabled buildings, particularly when combined with renewable energy sources and demand response technologies. These systems lower operational costs, improve learning conditions, and foster sustainability awareness among users. Importantly, SBMS also offers valuable data for research and teaching, allowing buildings to become pedagogical assets and energy infrastructures.
2. Materials and Methods
This methodology integrates theoretical and empirical approaches, addressing a significant research gap given the limited number of Do.Co.Mo.Mo. heritage buildings monitored with such precision through wired connections rather than wireless systems, while enabling public access to selected datasets. Moreover, this approach reinforces the critical importance of four key methodological considerations: building characterization, equipment selection, strategic sensor placement, and data collection protocols.
2.1. A Description of the Case Study
In this instance, the School of Architecture at the Universidad de Navarra, constructed in 1975, revolutionized an educational building approach through its architectural design cataloged at Do.Co.Mo.Mo. (
Figure 1) and the New European Bauhaus prize.
The building is isolated from the campus and dedicated to education and supplementary services. It also possesses surrounding land suitable for the project’s needs. Transitioning from a standalone building to a “Living lab” offers complete freedom to adjust system operations, which can be evaluated for insights. The building’s orientation and the surrounding vegetation are critical due to their exposure to natural phenomena (
Figure 2).
The building’s elongated rectangular geometry, 120 m × 35 m, with its narrowest facade oriented along the North–South axis, significantly influences its thermal behavior patterns. Solar radiation directly impacts the eastern and southeastern facades during morning hours, whereas the western facade remains shaded until afternoon. This asymmetrical solar exposure generates three distinct thermal zones within the building envelope, each characterized by different heat gain patterns and temporal temperature variations.
The building spans 9486 m
2 across two floors and sees a daily confluence of roughly 600 individuals (on school days); these are predominantly students but also professors, architects, construction workers, and other public sector representatives.
Figure 3 shows the complexity of this space. Areas that serve specific functions are detailed, including departments and workshops on the first floor
Figure 3C, classrooms, and public areas on the ground floor,
Figure 3A,B. The School of Architecture offers a teaching and service program that covers spaces of different surfaces, heights, and uses. The monitoring system had to adapt to this heterogeneity of geometries and occupations.
A metal sheet spans the entire roof of the building, resting on a metallic space mesh spanning the whole building and supported by a few defined points. The roof is built with a sandwich panel of galvanized steel and gravel on the exterior; the facades are made of brick with air chambers and combined with glass openings framed in metal. Natural light dominates, penetrating from the roof’s skylights and large glass surfaces.
The enclosures’ lack of thermal efficiency and the roof’s inertia negatively impact their thermal management.
The building’s energy management is adjusted manually for heating, cooling, and setpoint temperature control in various spaces. By default, it operates in three modes: ventilation, heating, and cooling. The switch between these modes is based on personal criteria (season changes, heat waves, and cold spells). Lastly, it should be noted that there is no control and verification system in place to correlate the setpoint temperature with the space’s actual temperature.
2.2. Selected Equipment
Monitoring the building involves creating a fundamental tool and developing a database to predict, optimize, and visualize its performance. Due to the mounting requirements, three types of sensors were purchased and installed, (which eventually increased to six, types due to the different forms of support to surfaces): combined sensor (temperature, air quality, and humidity) on the one hand, temperature sensors on the other, and solar radiation temperature sensors as the last type.
The choice of sensor brand was based on experience, supplier availability, and the research team’s power supply requirements. The sensors are powered and communicate via cable (Modbus) for the following reasons:
Batteries become depleted and need to be recharged or replaced.
Data collection via Wi-Fi may experience interruptions.
It is not feasible for someone to manually collect data from each sensor periodically.
For many sensors, synchronizing and automating data collection via cable is more accessible and less error-prone.
This approach minimizes future costs since this project involved multiple partners. Once operational, a minimum price is guaranteed.
Based on this approach, wired equipment creates robust and scalable sensory infrastructures that are operational and have a wide and relative lifespan.
The object of the measures is to periodically collect temperature, humidity, and CO2 information from two opposite thermal areas and the middle one, as will be explained later. Consequently, these measures can reveal the thermal response characteristics of individual rooms and the overall building, with HVAC operational schedules and temperature setpoints serving as reference baselines.
The selected sensor, explained in
Table 1, identifies its measure, location, model, parameters, image, and amount of purchase.
The choice of sensors and their quantity are crucial. The optimal sensor density is determined through a balance between the need to monitor the building’s three spatial dimensions and the project’s budgetary constraints. To verify the ideal quantity of measurement devices, comparative studies would be necessary through experimental installations with different instrumentation densities, for example, configurations incorporating double the number of sensors relative to the baseline design, as well as installations with reduced density at half capacity, thereby enabling the evaluation of cost–benefit ratios and the precision of obtained data. In this case, the purchase of the sensors amounted to EUR 5500.
A PLC was installed to collect the information sent via a cable, which sent the data to the server in OPC UA format.
2.3. Building Monitors
Sensor placement process in a multi-sensory network. It incorporates many heterogeneous input sources capable of accurately monitoring data related to energy consumption, comfort levels, and environmental quality. Based on the research team’s similar experiences, it is an agile and scalable architectural prototype that allows training and calibration as a decision-making toolkit for Facility Managers [
15].
The building’s sensor array was divided into three distinct zones based on identifying spatial characteristics and the limited number of installable sensors. Based on the east–west orientation, three north–south axes, were integrated, as illustrated in
Figure 4. The selection of three zones—two with opposite orientations and one central—demonstrated the building’s various thermal and humidity behaviors throughout the day. With its 120 m longitudinal development, the building generates multiple heterogeneous microclimates due to temporal variations in solar radiation incidence.
The resulting microclimatic variability manifests in substantial differences in temperature, relative humidity, and thermal loads between the building’s extremes and center, requiring environmental monitoring and control strategies specifically adapted to each identified thermal micro zone [
27]. In other words, each axis monitored a different thermal trend and response due to the building’s orientation. The first axis is a line on the westernmost side of the building. The second axis is located in the center. The third axis is the line on the eastern side of the building. This approach ensures that data are collected from the most significant areas of the building, representing the maximum, minimum, and average conditions.
In total, 50 sensor units were installed, collecting data on humidity, temperature, supply temperature, and air quality. Sensors were placed to collect representative data from different areas and installations while also considering the potential effect of enclosures on ambient temperature.
The location of each sensor was repeated along each of the defined axes. The summation of the sensors, installed in each axis, covers all surfaces and areas with one combined sensor and at least one of the temperature sensors. As shown in
Figure 5, a temperature sensor was placed near the exterior south-facing enclosure, a combined sensor (temperature, humidity, and air quality) was positioned in the middle of the room (classroom, office), the next temperature sensor is placed next to the interior enclosure on the exterior side of the room; and this continued to the exterior enclosure in the north-facing orientation.
Supply temperature sensors were installed since the building had an old HVAC system. The building has five central air handling units (AHUs) in the basement. These units transport air through large ducts throughout the school. Each unit serves a specific function with a tree-shaped distribution. There is one AHU for the ground floor classrooms and the laboratory, a second AHU for the classroom area on the semi-basement floor, a third AHU for the workshop area on the first floor, a fourth AHU for the office area on the semi-first floor, and the last AHU serves the hall and central space of the building.
As shown in
Figure 6, the sensorized outlets are located along the previously mentioned axes. Each zone, area, or space was serviced using an AHU and monitored via three sensors at different points. As such, the offices, workshops, classrooms, and ground floor each had a supply temperature sensor along the defined axes.
2.4. Collecting the Information
Ensuring proper wiring to connect sensors to the PLC (Programmable Logic Controller) was challenging. A wired system was chosen, necessitating the creation of a network throughout the building to connect every sensor with the PLC. Creating a robust wired network in the building is crucial to an intelligent building management system.
A wired setup allowed for effective real-time data collection and analysis, ensuring the data reflected building conditions without interference. Moreover, we ensured continuous data collection over time by creating a daily-use tool solely based on the wiring system.
As shown in
Figure 7, the wiring follows the lines of the sensorized axes. The cables are grouped to obtain the service shaft upon reaching the south facade. Through this shaft, they descend to the basement, where the PLC is located.
To ensure control and organization, each axis is segmented into four distribution boxes distributed by floor and usage. The primary function of such grouping is to optimize maintenance and monitoring resources. In addition to distributing the necessary cables, the box powers and transmits sensor data. This distribution allows for the quicker detection of potential failures compared to a system where each cable runs directly to the PLC.
The 50 sensors required 270 m of wiring to connect. This cable connection allowed 5568 daily measurements from the building to begin to be received after the system was activated in June 2023. Data were collected and transmitted every 15 min, and a time unit was determined to detect trend changes before compromising occupants.
The wired system converges at the central server in the building’s basement, where data undergoes filtering and processing through private and public visualization interfaces. Data processing and filtering are executed automatically through specifically programmed algorithms designed for this function. This same software system manages the automatic calibration of all sensors from the moment of their initial activation. Measurements, scheduled to execute automatically every 15 min, are hierarchically structured by thermal zones, spatial axes, and floor levels, enabling differentiated analyses according to the specific parameters required for investigation.
The private viewer is designed to study and visualize historical data, create comparisons, and set alarms. The primary user of this platform, GRAFANA, is the building’s maintenance manager. On the other hand, the public viewer is a dissemination tool intended for students and general building users. This open viewer displays real-time measurements from each sensor in the building.
Figure 8 shows the units comprising the entire monitoring system described in this building section. This helps to understand the system’s complexity, as each decision affects its neighboring units. At the bottom of the image, photos and screenshots of the installation, from the sensor cable to the public viewer, are included.
3. Results and Discussion
The documentation of the methodology implemented during sensor installation and management and the processing of obtained data enables the replicability of this process in other heritage Do.Co.Mo.Mo. buildings of historical value. The results of sensorization provide multifunctional datasets that simultaneously serve three fundamental purposes: building energy management optimization, feeding geospatial databases (GIS) for territorial analysis, and establishing a Living Laboratory that facilitates continuous research and innovation in sustainable building practices.
Sensorizing a large-scale existing building is costly. However, the cost of the sensors is only a minor part of the overall expenses involved in monitoring an existing structure. The complexity of the spaces, the building’s thermal behavior, and building control are critical factors that define the sensor system.
The sensorization of the School of Architecture primarily involved a significant financial effort due to personnel costs. As shown in
Table 2, the sensors and PLCs cost EUR 10,308.63 compared to EUR 656,228.37 for personnel. Additional costs included materials, such as wiring, tubes, trays, and supports.
Considering these total figures, creating a sensor model for a rectangular building using wired equipment costs EUR 77.55/m2. In other words, installing, commissioning, and integrating a wired sensor into a database costs EUR 14,713.74 per unit.
The entire process, from deciding which measurements to collect to reading the first results, took one year of work. It is important to note that during the installation of the sensors (from months 5 to 7, December 2022 to June 2023), a shortage of raw materials directly impacted the process. It is estimated that this caused a delay of around three months.
The timeline chart in
Table 3 shows all the tasks required to create the sensor model: T1: Decision on measurements. T2: Sensor placement. T3: Sensor selection. T4: Purchase of materials. T5: Installation. T6: PLC connection. T7: Programming. T8: Commissioning. T9: Data filtering and accumulation. T10: Private viewer. T11: Public viewer. T12: Results analysis. Monitoring an existing building is complex and requires the organization and synchronization of multiple agents and synchronizing their work. In this case, executing the tasks involved the participation of four technicians, two installers, three programmers, two data scientists, one safety manager, and two graphic developers.
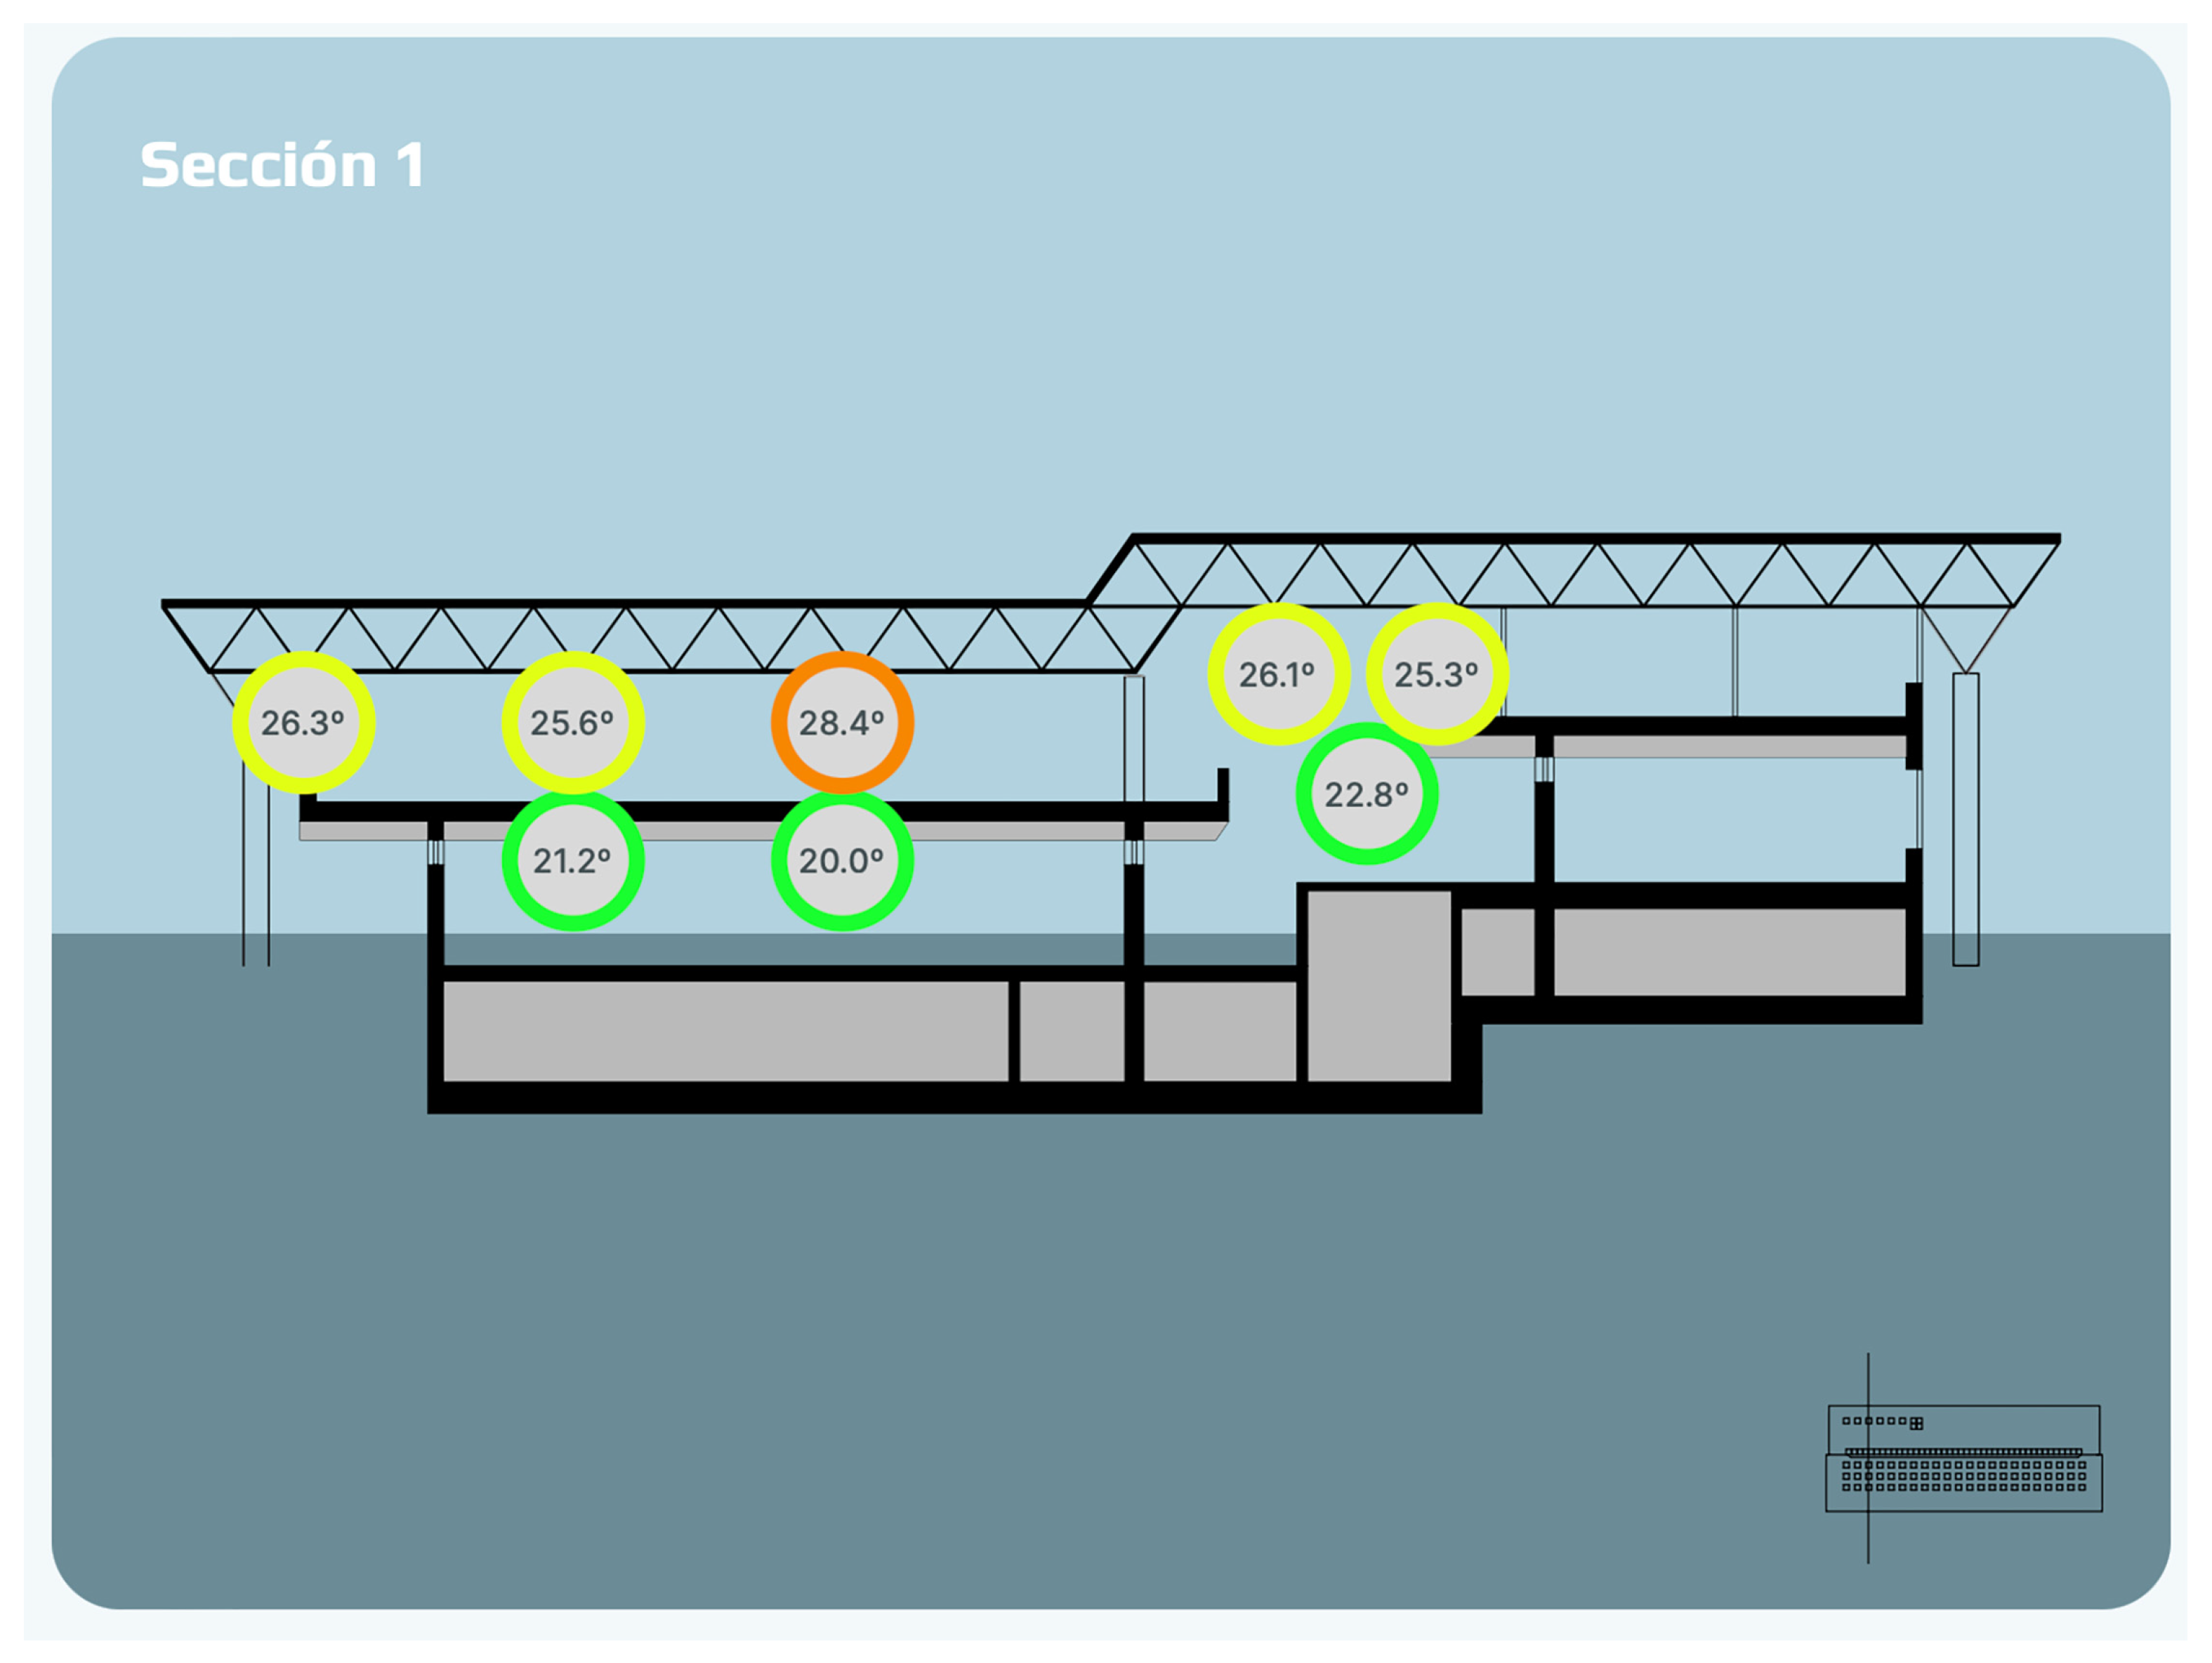
The measurement results indicated different thermal behaviors between the zones with the same function, located on the same floor, and supplied by the same climate control system. Data confirms the sensation perceived by users, but it has not been recorded so far. As shown in
Figure 9, the temperature difference between the offices at both east and west ends could reach 6 °C at a given time. Based on the analysis of recorded data, a fundamental technical recommendation is established that buildings with linear floor configurations should not implement longitudinal ventilation systems that integrate both main orientations. This recommendation is grounded in the fact that the thermal response of interior spaces will present significant deviations from established setpoint conditions, as a direct consequence of differences in solar exposure and thermal loads associated with each orientation. Implementing zoned HVAC systems that consider the specific thermal characteristics of each orientation proves more efficient for maintaining comfort conditions and optimizing energy consumption.
Monitoring has also charted (in the graphs) and confirmed certain building behaviors of the building. Among these is the effect of the roof on sunny days, where the temperature can rise by up to 9 °C compared to the main floor
Figure 10. Since this effect had not been quantified before, users identified discomfort due to heat, and the heating was turned off following complaints during the winter. The upper floor is not heated on sunny days anymore. An extended period is necessary to evaluate the energetic impact throughout the year. Nevertheless, it is considered that buildings equipped with lightweight roofing systems require the installation of specific thermal sensors for temperature control due to the effects of direct solar radiation. This preventive measure aims to prevent users from being exposed to extreme thermal conditions, particularly during periods of maximum solar incidence. The low thermal inertia characteristic of lightweight roofs generates more pronounced thermal fluctuations and rapid responses to solar radiation variations, requiring more sensitive and reactive thermal monitoring and control systems to ensure occupant well-being.
The public viewer allows users to access information about the building anytime, including the temperature of different spaces and identifying risk areas. For example, in the summer, users can determine which zones are within a suitable temperature range for the work they plan to complete. In
Figure 11, the thermal differences within the building at the exact moment can be observed.
Through a methodological approach, we demonstrate how integrating sensory models can mature into a robust tool for optimizing building functions. The tangible results obtained from the measurements have allowed the following to take place:
Adjusted the setpoint schedule of the air handling units. In the summer, the building is ventilated at night and in the morning, taking advantage of the lower outdoor temperatures and reducing energy consumption.
Ventilating the building while maintaining recommended comfort temperatures. Air handling units can be turned off at the end of the day to ensure proper indoor conditions.
Identifying risk zones for users due to high levels of CO2 and VOCs. Due to the machinery used in the laboratory area, it has been shown that it is not a recommended zone for constant work.
Objectively addressing subjective temperature perceptions. With sensors in place, complaints about feeling too hot or cold can be compared with measurements and adequately addressed.
Leveraging energy inefficiencies as opportunities. For example, on sunny days, the heating on the top floor can be turned off.
During the implementation of the proposed methodology, various technical and economic limitations conditioned its execution. Installing wired sensor systems requires specialized technical personnel, necessitating outsourcing these tasks with the consequent increase in project costs. The objective of establishing a functional Living Laboratory demands complete automation of data collection, filtering, and transfer processes. This technical requirement has necessitated the installation and programming of a programmable logic controller (PLC) specifically configured to manage the integral automation of the system. As a direct consequence, this implementation has resulted in a significant increase in specialized technical personnel requirements, development time, and project budget, which must be considered in future replications of the methodology.
The following issues were encountered during the process and deemed essential to mention. Working with an existing building, almost fifty years old, presents challenges, such as discrepancies between the building plans and the actual building performance. Furthermore, wiring multiple meters of a building and its circuits increases the chance of human error. In one instance, the sensor zone became inoperative due to an incorrect connection in the box. Synchronizing the sensors with the display requires complex programming that a professional team must carry out. The average user cannot setup sensors, as the programming needed to visualize all this information must be developed and coded.
The availability of specialized technical personnel is conditioned by contractor company scheduling, which is not typically immediate and requires planning. Additionally, the project remains subject to specialized material supply chains, a circumstance that manifested during the installation phase and can generate significant delays in the project timeline.
The proposed methodology aims to structure and standardize the sensorization process for heritage buildings with a long-term monitoring perspective. Although for short-term punctual studies the installation of wireless sensors might be considered sufficient, it is recommended to maintain the connection protocol to the programmable logic controller (PLC) and its corresponding programming, as this approach guarantees the acquisition of pre-filtered and processed data, essential for quality analysis and temporal consistency in longitudinal research.
A database was created to work with an existing building. From this point, the creation of a digital twin was considered through integration into the Campus Geographic Information System or the creation of a new one.
In future work, it would be interesting to consider the following points:
Enhanced Building Climate Control: The implemented models have significantly improved internal temperature regulation within the building, demonstrating their potential as indispensable tools for cost management and operational efficiency. These models enabled the creation of alarm systems, facilitated efficiency assessments, provided aid to prepare for extreme atmospheric conditions, and supported the strategic integration of renewable energy sources within the School of Architecture.
Integrated Sensory and Energy Modeling: Concerted efforts were made to integrate sensory and energy models and forge a unified system that comprehensively addresses the building’s dynamics. This holistic model enhances the accuracy of energy consumption forecasts and elevates the building’s overall energy efficiency and operational resilience.
Consider installing cheaper sensors. Installing cheaper sensors could result in certain discontinuities in the measurements obtained. However, these sensors could be placed in areas with higher thermal inertia, where temperature changes are slower, and thus, communication errors would remain accurate.
4. Conclusions
From this article, the following conclusions can be derived:
The developed methodology facilitates the replication of this process in existing buildings by providing a comprehensive framework for implementation. Moreover, critical technical and economic data, including specifications of installed sensors, connection protocols, and cost analysis, are thoroughly documented and made accessible. This represents essential information previously unavailable in the literature, thereby filling a significant knowledge gap in heritage building monitoring and smart building retrofitting applications.
The implications for replicating this methodology are independent of geographical or climatic considerations. In this case, to achieve a similar level of detail and determine whether the method is appropriate for other listed buildings, the most crucial factor is the existing construction and structural systems, as they constitute the primary value to be respected in the existing heritage.
After a comprehensive preliminary study, existing buildings should have a sensor model installed. This research demonstrates the effectiveness of this approach, where monitoring-based management can lead to optimized energy use and enhanced environmental performance. This can help assess a building’s acceptable comfort parameters without receiving user complaints. Building temperature fluctuations tend to be periodic and predictable. By identifying them, palliative measures can also be implemented in similar cases.
The integration of a quality sensor model enables data to be constantly collected. Proper installation is as important as choosing a communication system that aligns with the information’s final use. In this case, in addition to collecting data for more efficient management, they are shared in real time through a public viewer.
Sensorizing an existing DO.CO.MO.MO. building permanently is a long and complex process involving several stakeholders. It took twelve months and is estimated to cost EUR 14,713.74 per sensor. The installation of 270 m of wiring successfully gathered 5568 data points daily. Moreover, the installation must be meticulous and follow a design that allows errors to be easily detected.
The ability to accumulate and filter the information is critical to evaluating the effects of the measures implemented. After grouping by use and zones, the data is stored on a dedicated server, making it easily accessible and consultable for managers and maintenance staff.
Through a methodological approach, we demonstrate how sensor integration can mature into a robust tool for optimizing building functions through an intelligent building management system.


 ,
, 


