Article

Influence of Overcharge Abuse on the Thermal-Electrochemical Performance of Sodium Ion Cells

1
School of Materials and Energy, Guangdong University of Technology, Guangzhou 510006, China
2
School of Mechanical and Aerospace Engineering, Nanyang Technological University, Singapore 639789, Singapore
3
Department of Electric Power Engineering, Guangdong Polytechnic of Water Resources and Electric Engineering, Guangzhou 510925, China
4
International Copper Association, Room 2582, 25F, 381 Huaihai Zhong Road, Huangpu District, Shanghai 200020, China
5
Dongguan Guixiang Insulation Material Co., Ltd., Dongguan 523861, China
6
Guangdong Greenway Technology Co., Ltd., Dongguan 523000, China
*
Authors to whom correspondence should be addressed.
Energies 2025, 18(13), 3580; https://doi.org/10.3390/en18133580
Submission received: 9 May 2025 / Revised: 2 July 2025 / Accepted: 3 July 2025 / Published: 7 July 2025
(This article belongs to the Section D: Energy Storage and Application)

Abstract

Thermal safety issues of sodium-ion batteries have become a major challenge, particularly under abusive conditions where the risk of thermal runaway is heightened. This study investigates the effects of overcharging on the thermal safety of sodium-ion batteries. Discharge capacity and time, internal resistance, and electrochemical impedance spectroscopy (EIS) at different states of charge (SOCs) are analyzed. Additionally, heat generation behaviors are evaluated at both normal/elevated temperatures. It is found that the overcharged batteries (OBs) demonstrate a significant increase in internal resistance from 46.72 Ω to 65.99 Ω. The discharge time of OBs at 1 C current (the ratio of the rate at which a battery discharges per unit time to its rated capacity) is reduced by 4.26% compared to normal batteries (NBs). The peak temperature and temperature difference increase by 5.6% and 36.1%, respectively. When discharged at 1 C at 40 °C, OBs have a 5.47% reduction in discharge time compared to NBs. Furthermore, the OBs exhibit an increase in the peak discharge temperature and temperature difference of 0.99 °C and 0.4 °C, respectively. Microscopic analysis of the electrode materials makes clear the irreversible damage to the internal structures of the sodium-ion battery caused by overcharging. This study potentially provides fundamental data support and theoretical insights for sodium-ion battery module thermal safety.

1. Introduction

In the global race toward achieving dual carbon goals and amidst the swift expansion of the new energy market, energy storage technology has emerged as a critical component. The urgent need to tackle challenges, such as the instability and intermittency inherent in renewable energy generation, underscores the importance of accelerating the development and deployment of advanced energy storage solutions [1]. Among the array of energy storage technologies, electrochemical energy storage shines as a promising contender, owing to its high efficiency, safety, and environmental advantages, which have led to its widespread adoption and extensive development. Presently, electrochemical energy storage finds its primary applications in energy storage power stations, portable electronic devices, and hybrid electric vehicles [2]. Among various energy storage technologies, lithium-ion batteries currently represent the most mature option, with breakthroughs demonstrating > 90% capacity retention after numerous cycles at high energy densities [3]. Nonetheless, despite their widespread utilization in electric vehicles and electrochemical energy storage systems, they encounter challenges such as the finite availability of lithium resources and heightened safety concerns. In response, sodium-ion batteries are emerging as a promising contender in the field of energy storage. These batteries offer a multitude of advantages, including abundant sodium reserves, high energy density, extended lifespan, environmental benignity, cost-effectiveness, robust performance across a wide temperature range, and superior safety standards. They operate on an energy storage mechanism comparable to that of lithium-ion batteries and present viable solutions to address battery thermal safety issues [4,5,6,7,8]. Although sodium-ion batteries exhibit a lower specific capacity compared to their lithium-ion counterparts, their resource abundance and cost advantages position them as a highly promising alternative for future applications, particularly in electrochemical energy storage power stations, with considerable potential for widespread adoption [9,10,11,12].
Recently, the rapid growth of electrochemical energy storage power stations has highlighted the benefits of related energy storage batteries, including flexible layout, rapid response, and high energy efficiency. However, safety concerns have become a major bottleneck, particularly for high-energy-density systems [13]. Recent incidents underscore these risks: September 2023: Valley Energy Storage Center fire (140 MW·560 MWh−1 system) [14]; October 2023: Idaho substation fire (2 MW system) [15]; and April 2023: Gothenburg industrial park fire (9000 kg Li-ion container) [16]. These incidents highlight the critical need to ensure the safety of energy storage batteries for the overall integrity of energy storage systems. The thermal safety concerns pertaining to sodium-ion batteries can be outlined as follows: (1) During high-rate or extended discharge cycles, continuous heat generation elevates the battery’s internal temperature. Discrepancies in heat dissipation boundary conditions among individual cells create significant temperature variations within the module. This thermal gradient exacerbates performance disparities during operation, ultimately degrading overall service performance [17,18,19]. (2) In the event of thermal runaway, multiple interdependent heat sources contribute to catastrophic failure, including decomposition of the solid electrolyte interface (SEI) film, degradation of electrode materials, and decomposition of both electrolyte and separator. The rapid accumulation of these heat sources initiates a vicious cycle where material degradation intensifies side reactions, accelerating thermal runaway that may result in combustion and explosion [20,21,22,23,24,25].
Sodium-ion batteries exhibit a lower maximum temperature during thermal runaway. While sodium-ion batteries exhibit a significantly higher thermal runaway onset temperature [26], the localized heat accumulation mechanisms under overcharging abuse remain poorly understood—precisely the knowledge gap this study aims to fill. While the positive electrode plays a significant role in overall heat generation, the thermal stability of the negative electrode is pivotal in determining the onset of thermal runaway. Hence, the safety of sodium-ion batteries hinges critically on both the negative electrode and the electrolyte. Moreover, abnormal operating conditions can also precipitate thermal runaway in these batteries [27]. Therefore, investigating the thermal safety concerns of sodium-ion batteries is of paramount importance and should not be neglected in research endeavors.
Research on the thermal safety of sodium-ion batteries, particularly concerning failure mechanisms under abusive conditions, primarily examines electrochemical reactions at a microscopic level. Compared to lithium-ion batteries, the literature on sodium-ion battery safety is less extensive [28,29,30], with most studies focusing on thermal stability [31,32,33]. Yue et al. [34] used accelerating rate calorimetry to compare the thermal runaway risks of sodium-ion and lithium-ion batteries. Their assessment, using three battery thermal runaway models, found that the thermal hazards ranked as follows: Li(Ni0.5Co0.2Mn0.3)O2(NCM) battery > NaxTMO2(NTM) battery > LiFePO4(LFP) 18,650-type battery. Key material developments include the following: Zhang et al. [35] developed NaTi2(PO4)3/N-doped carbon composites for enhanced performance. Kanematsu et al. [36] synthesized phosphonium-based compounds with thermal stability up to 300 °C. Wang et al. [37] identified Na0.66Li0.22Ti0.78O2 as a promising low-consumption material. Significant electrolyte advances feature the following studies: Deblock et al. [38] studied polydimethylsiloxane copolymer combinations for ionic gels. Sirengo et al. [39] explored ionic liquid electrolytes preventing thermal runaway. Kim et al. [40] created Pyr13FSI-based electrolytes achieving > 98% Coulombic efficiency. Critical safety mechanisms include the following: Zhou et al. [41] demonstrated high-power sodium-ion batteries maintaining long cycle life. Feng et al. [42] investigated biphenyl compounds as overcharge protection additives. Ji et al. [43] presented triamine cyclopropenyl perchlorate as an innovative redox shuttle.
Recent advances in thermal management strategies have highlighted the role of material modifications in enhancing thermal stability under abusive conditions. For instance, Deng et al. [44] developed a calcium-doped layered oxide cathode material that significantly suppresses lattice oxygen loss and enhances cycling stability, thereby reducing thermal degradation risks during overcharge. Similarly, Byun et al. [45] demonstrated that lithium salt additives in the electrolyte can simultaneously strengthen cathode and anode interfaces, improving capacity retention and mitigating mild overcharge-induced damage. Kolachi et al. [46] further contributed by designing a bimetallic Mg/Zn MOF-derived carbon material with ultrahigh sodium-ion storage capacity, which may promote more uniform heat distribution in high-performance systems. These innovations provide critical insights for developing thermally robust sodium-ion batteries.
The aforementioned research on the thermal safety of sodium-ion batteries emphasizes intrinsic safety improvements, including the optimization and modification of cathode materials, anode materials, separators, and electrolytes. For sodium-ion batteries, the inherent physicochemical properties of electrode materials, electrolytes, and separators within the battery do not ensure complete safety. The risks associated with thermal runaway in sodium-ion batteries are comparable to those in lithium-ion batteries. Therefore, the thermal safety of sodium-ion batteries requires attention [47]. Additionally, there is a significant gap in research concerning the thermal safety of complete sodium-ion battery systems, particularly under abusive conditions. A significant concern is the overcharging of sodium-ion batteries, which can result from failures in the battery thermal management system. Overcharging increases the potential of sodium-ion batteries, causing excessive sodium metal to deposit on the anode surface from the cathode. This reaction with the electrolyte at high temperatures generates substantial heat and gas, threatening the battery’s safety and stability. Concurrently, the cathode material dissolves due to excessive sodium desorption and elevated potential, while the electrolyte oxidizes under high battery potential, leading to increased internal battery pressure. Overcharging also generates ohmic heat, gas production, and a series of reactions that can lead to severe thermal runaway [48,49,50]. Gui et al. [51] compared the thermal runaway characteristics of two types of pouch sodium-ion batteries with different cathode materials. Using thermal runaway experiments and microscopic analysis, they revealed the differences in electro-thermal-mechanical-gas responses between the two batteries, as well as the sodium plating and gas generation processes. This study provides a foundation for the research on sodium-ion battery materials and thermal runaway monitoring methods. Xu et al. [52] investigated the degradation behavior of a pouch sodium-ion battery under overcharge conditions and found that the safe overcharge limit of the battery was 120% state of charge (SOC), with a significant capacity decrease observed when exceeding 140% SOC. After overcharging beyond 120% SOC, cathode particle damage and structural collapse occurred, while sodium plating started to grow on the anode, highlighting the severe impact of overcharge on battery safety risks and performance. Zakharchenko et al. [53] explored the thermal runaway process of a pouch sodium-ion battery based on a Na3V2O2(PO4)2F cathode and discovered that its onset temperature was significantly higher than that of lithium-ion batteries based on NMC. The study revealed that thermal runaway was triggered by the decomposition of the anode and separator, rather than the cathode process, suggesting that sodium-ion batteries with polyanionic cathodes have the potential to pave the way for safer metal-ion energy storage technologies. Kurzweil et al. [54] investigated lithium-ion batteries, sodium-ion batteries, and supercapacitors using impedance spectroscopy. They also outlined the correct calculation of relevant parameters and proposed new types of diagrams for performance and fault diagnosis. He et al. [55] evaluated a prototype battery with a capacity of 0.61 Ah, a specific energy of 68 Wh/kg, and an energy density of 135 Wh/L (1 C). This battery exhibited excellent performance at up to 20 C discharge and 10 C charge, retaining > 90% of its capacity and >80% of its energy at 20 C discharge (compared to 1 C). Safety tests showed that the battery did not exhibit thermal runaway under any abuse conditions. Chen et al. [56] modified a pouch sodium-ion battery with an initial discharge specific capacity of 151.46 mAh/g at 0.1 C and a capacity retention rate of 95.04% after 100 cycles at 0.5 C. Additionally, the 1.7 Ah pouch battery remained safe even when it was overcharged to 8.29 V. Wang et al. [57] induced thermal runaway in sodium-ion batteries using electrical abuse experiments and thoroughly studied the electrical/thermal/gas/strain characteristics during the thermal runaway process. They found that the evolution trends of sodium-ion batteries were similar to those of lithium batteries and analyzed the early warning capabilities of multiple parameters at different charging rates, providing a comprehensive reference for thermal runaway warning in sodium-ion batteries. Lin et al. [58] enhanced the electrochemical performance of sodium-ion batteries and sodium metal batteries by relying on functional electrolyte additives. The additives were classified according to their specific functions, including flame retardancy, overcharge protection, and high voltage. They proposed potential future research directions in this field. Sodium-ion batteries are safe in theory, but they are not absolutely safe in practical application, especially under abuse conditions. The previous literature on the thermal safety of sodium ion batteries was mainly carried out from three aspects: (1) improvements in the basic electrochemical performance and intrinsic safety of batteries through material modification; (2) research on the occurrence of thermal runaway under normal operating conditions and abuse conditions by testing the heat production and electrochemical performance of the cell; and (3) the thermal safety performance of sodium batteries was compared with that of other chemical systems. The research on the thermal safety performance of sodium ion battery was more from the macroscopic perspective. The correlation between heat production and electrochemical characteristics of sodium batteries was less involved, and the root cause of the aforementioned performance decline was not revealed. Therefore, investigations on the influence of overcharge abuse on the thermal-electrochemical performance of sodium ion cells is crucial and highly valuable.
To solve the aforementioned issues, this study focused on 18650-type sodium-ion battery cells, providing a comprehensive analysis of the impact of mild overcharging abuse on battery performance from both macroscopic and microscopic perspectives. At the macroscopic level, it examines changes in key electrochemical performance parameters such as discharge voltage plateaus, discharge capacity, discharge time, direct current (DC) internal resistance, and alternating current (AC) impedance resulting from overcharging. Simultaneously, the study investigates the maximum temperature and temperature variations of sodium-ion batteries under different operating conditions and discharge rates, elucidating how overcharging abuse affects temperature rise and uniformity in sodium-ion batteries. From a microscopic perspective, it explores the fundamental causes of electrochemical performance degradation and increased heat generation in overcharged sodium-ion batteries. The research aimed to provide crucial experimental data and theoretical insights to support future studies on enhancing the thermal safety of sodium-ion batteries and improving battery thermal management systems. Therefore, our current research mainly focuses on the representative small-scale 18,650 cell to explore fundamental aspects of battery safety and performance. Our study aimed to lay the foundation for subsequent experiments on larger-format battery modules. Similar research methods and ideas could be transferred and applied.
The primary objective of this study is to establish a comprehensive mechanistic understanding of how overcharge abuse induces performance degradation in sodium-ion batteries using a multi-scale experimental approach. By integrating electrochemical testing, thermal characterization, and microstructural analysis, we aim to quantitatively correlate electrode-level structural damage—particularly the anode-dominated failure mechanisms observed in hard carbon electrodes—with macroscopic thermal-electrical performance decay. Building on our discovery of voltage plateau anomalies during overcharge, this work further seeks to elucidate the fundamental relationship between these electrochemical signatures and thermal runaway progression, providing critical insights for developing safer battery management strategies. Ultimately, we propose practical safety thresholds based on the electrochemical-thermal coupling behavior observed under controlled overcharge scenarios at 25 °C and 40 °C.

2. Experiment

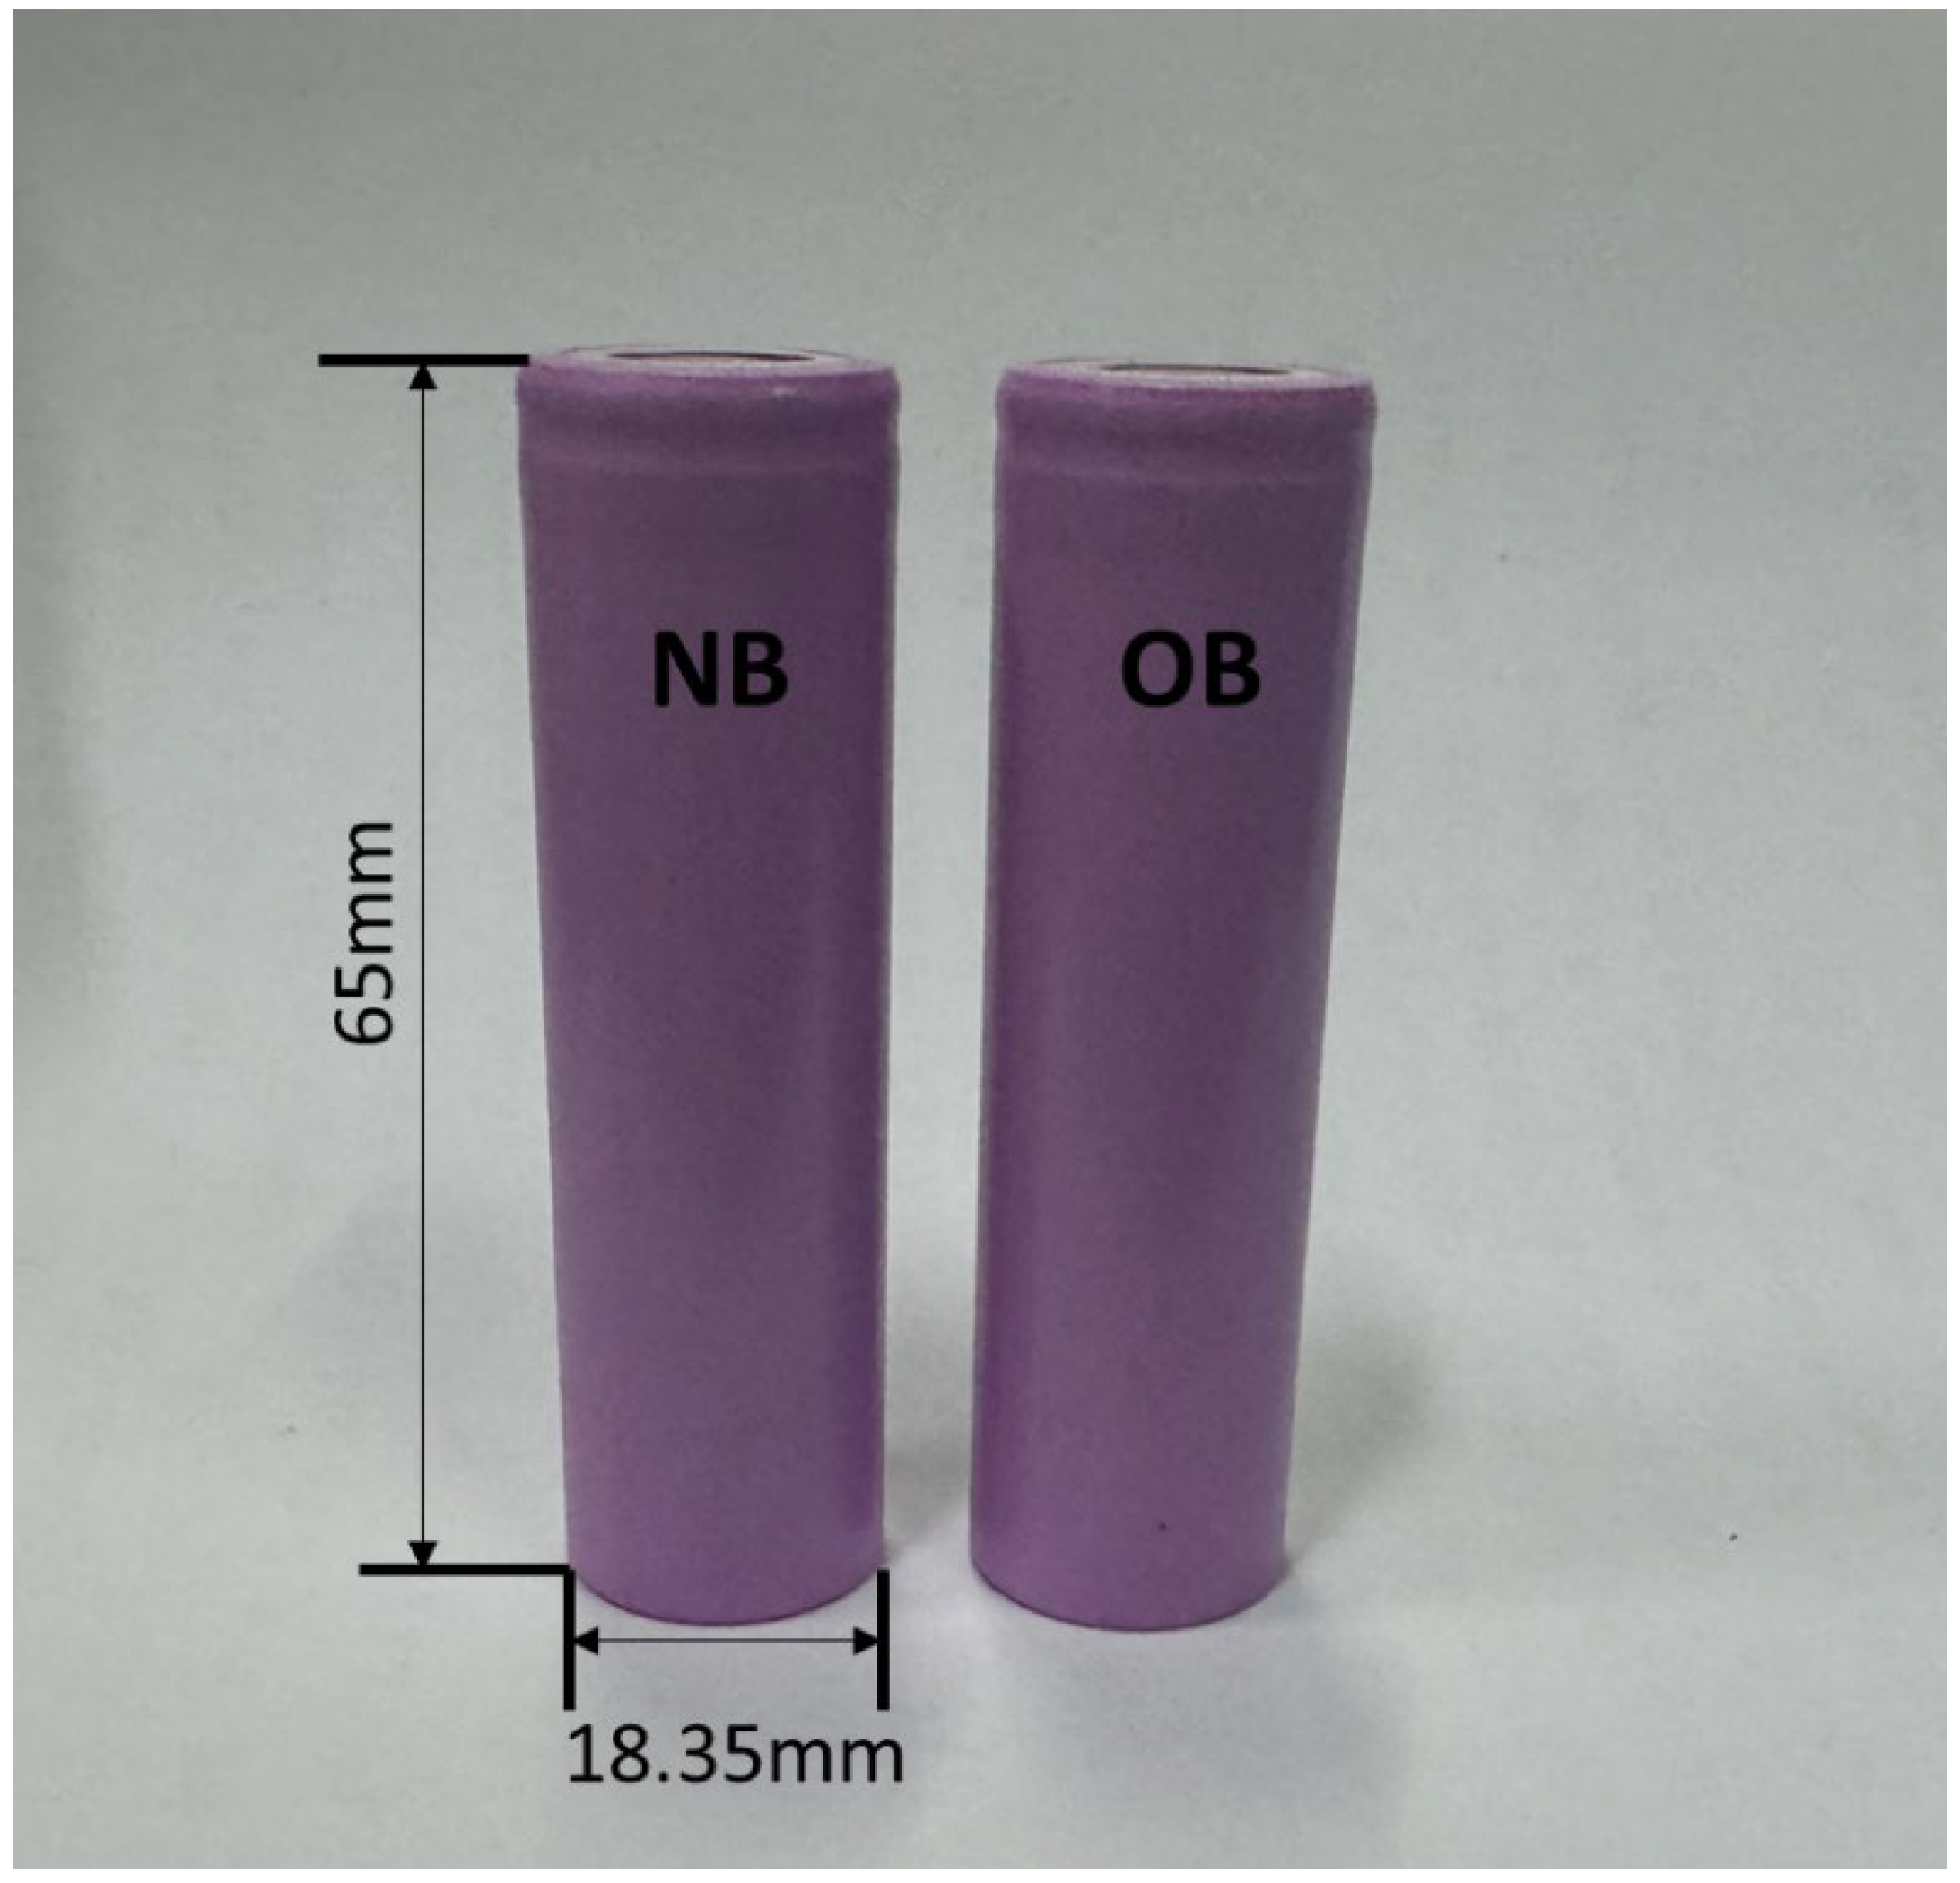
2.1. Sodium-Ion Battery Cells for Experimental Testing

Commercial 18,650 sodium-ion battery cells of the same batch (Purchased from Zhejiang Changyi Sodium Energy Storage Co., Ltd., Shaoxing, China) were employed in this experiment. Detailed technical parameters are also listed (Table 1). Fifty identical sodium-ion cells were initially selected as candidate samples, from which two cells demonstrating optimal consistency were chosen for subsequent testing. The consistency test of this batch of cells was conducted using voltage and internal resistance technical indicators. At present, the consistency index of cell voltage and internal resistance for battery modules was ≤5 mV and ≤5 mΩ. Samples for testing were selected according to the aforementioned consistency index for improving the reliability of the test results. The standard charging cut-off voltage of this sodium-ion battery cell during the normal charge–discharge process was 3.8 V, and the standard discharging cut-off voltage was 1.5 V. The charging cut-off voltage referred to the highest ideal voltage reached by the battery during charging, while the discharging cut-off voltage represented the lowest ideal voltage the battery drops to during discharging. The mild overcharging procedure for sodium-ion cells involved charging the cells at 0.5 C (600 mA) in constant current (CC) mode at 25 °C until reaching a voltage cut-off limit of 4.2 V. This voltage corresponds to ~110% SOC based on capacity integration and aligns with 85% of the theoretical maximum sodium extraction level (x = 0.35 in NaxNi0.4Fe0.2Mn0.4O2) [52,59]. The overcharge level (~10% SOC excess) fulfills the criteria for mild overcharge operation as defined by Xu et al. [52]. Then, the charging switched to constant voltage (CV) mode until the current decreased to 240 mA. Following a 20-min rest period, the battery cells were discharged at a CC rate of 0.5 C (600 mA) until reaching a cut-off voltage of 1.5 V. After another 30-min rest period, this charging and discharging cycle was repeated 20 times to produce overcharged battery (OB) cells. Battery cells that did not undergo this procedure were called normal battery (NB) cells. Gas evolution analysis was precluded by the hermetic design of 18,650 cells. Future module-scale studies will integrate pressure sensors and post-test gas chromatography-mass spectrometry (GC-MS) to quantify gas species. Testing indicated that the DC internal resistance of the OB escalated from 29.51 to 73.18 mΩ. Figure 1 illustrates the NB and OB used in the experiment.
The 4.2 V cut-off voltage was selected to achieve mild overcharge of approximately 10% SOC, aligning with safety thresholds reported for pouch-type sodium-ion batteries (e.g., 120% SOC setting in Xu et al. [52]). This conservative configuration ensures observable degradation while preventing catastrophic failure, thereby enabling repeated electrochemical/thermal testing [51,59]. More distinct differences between mild and severe overcharge are detailed in Table 2.

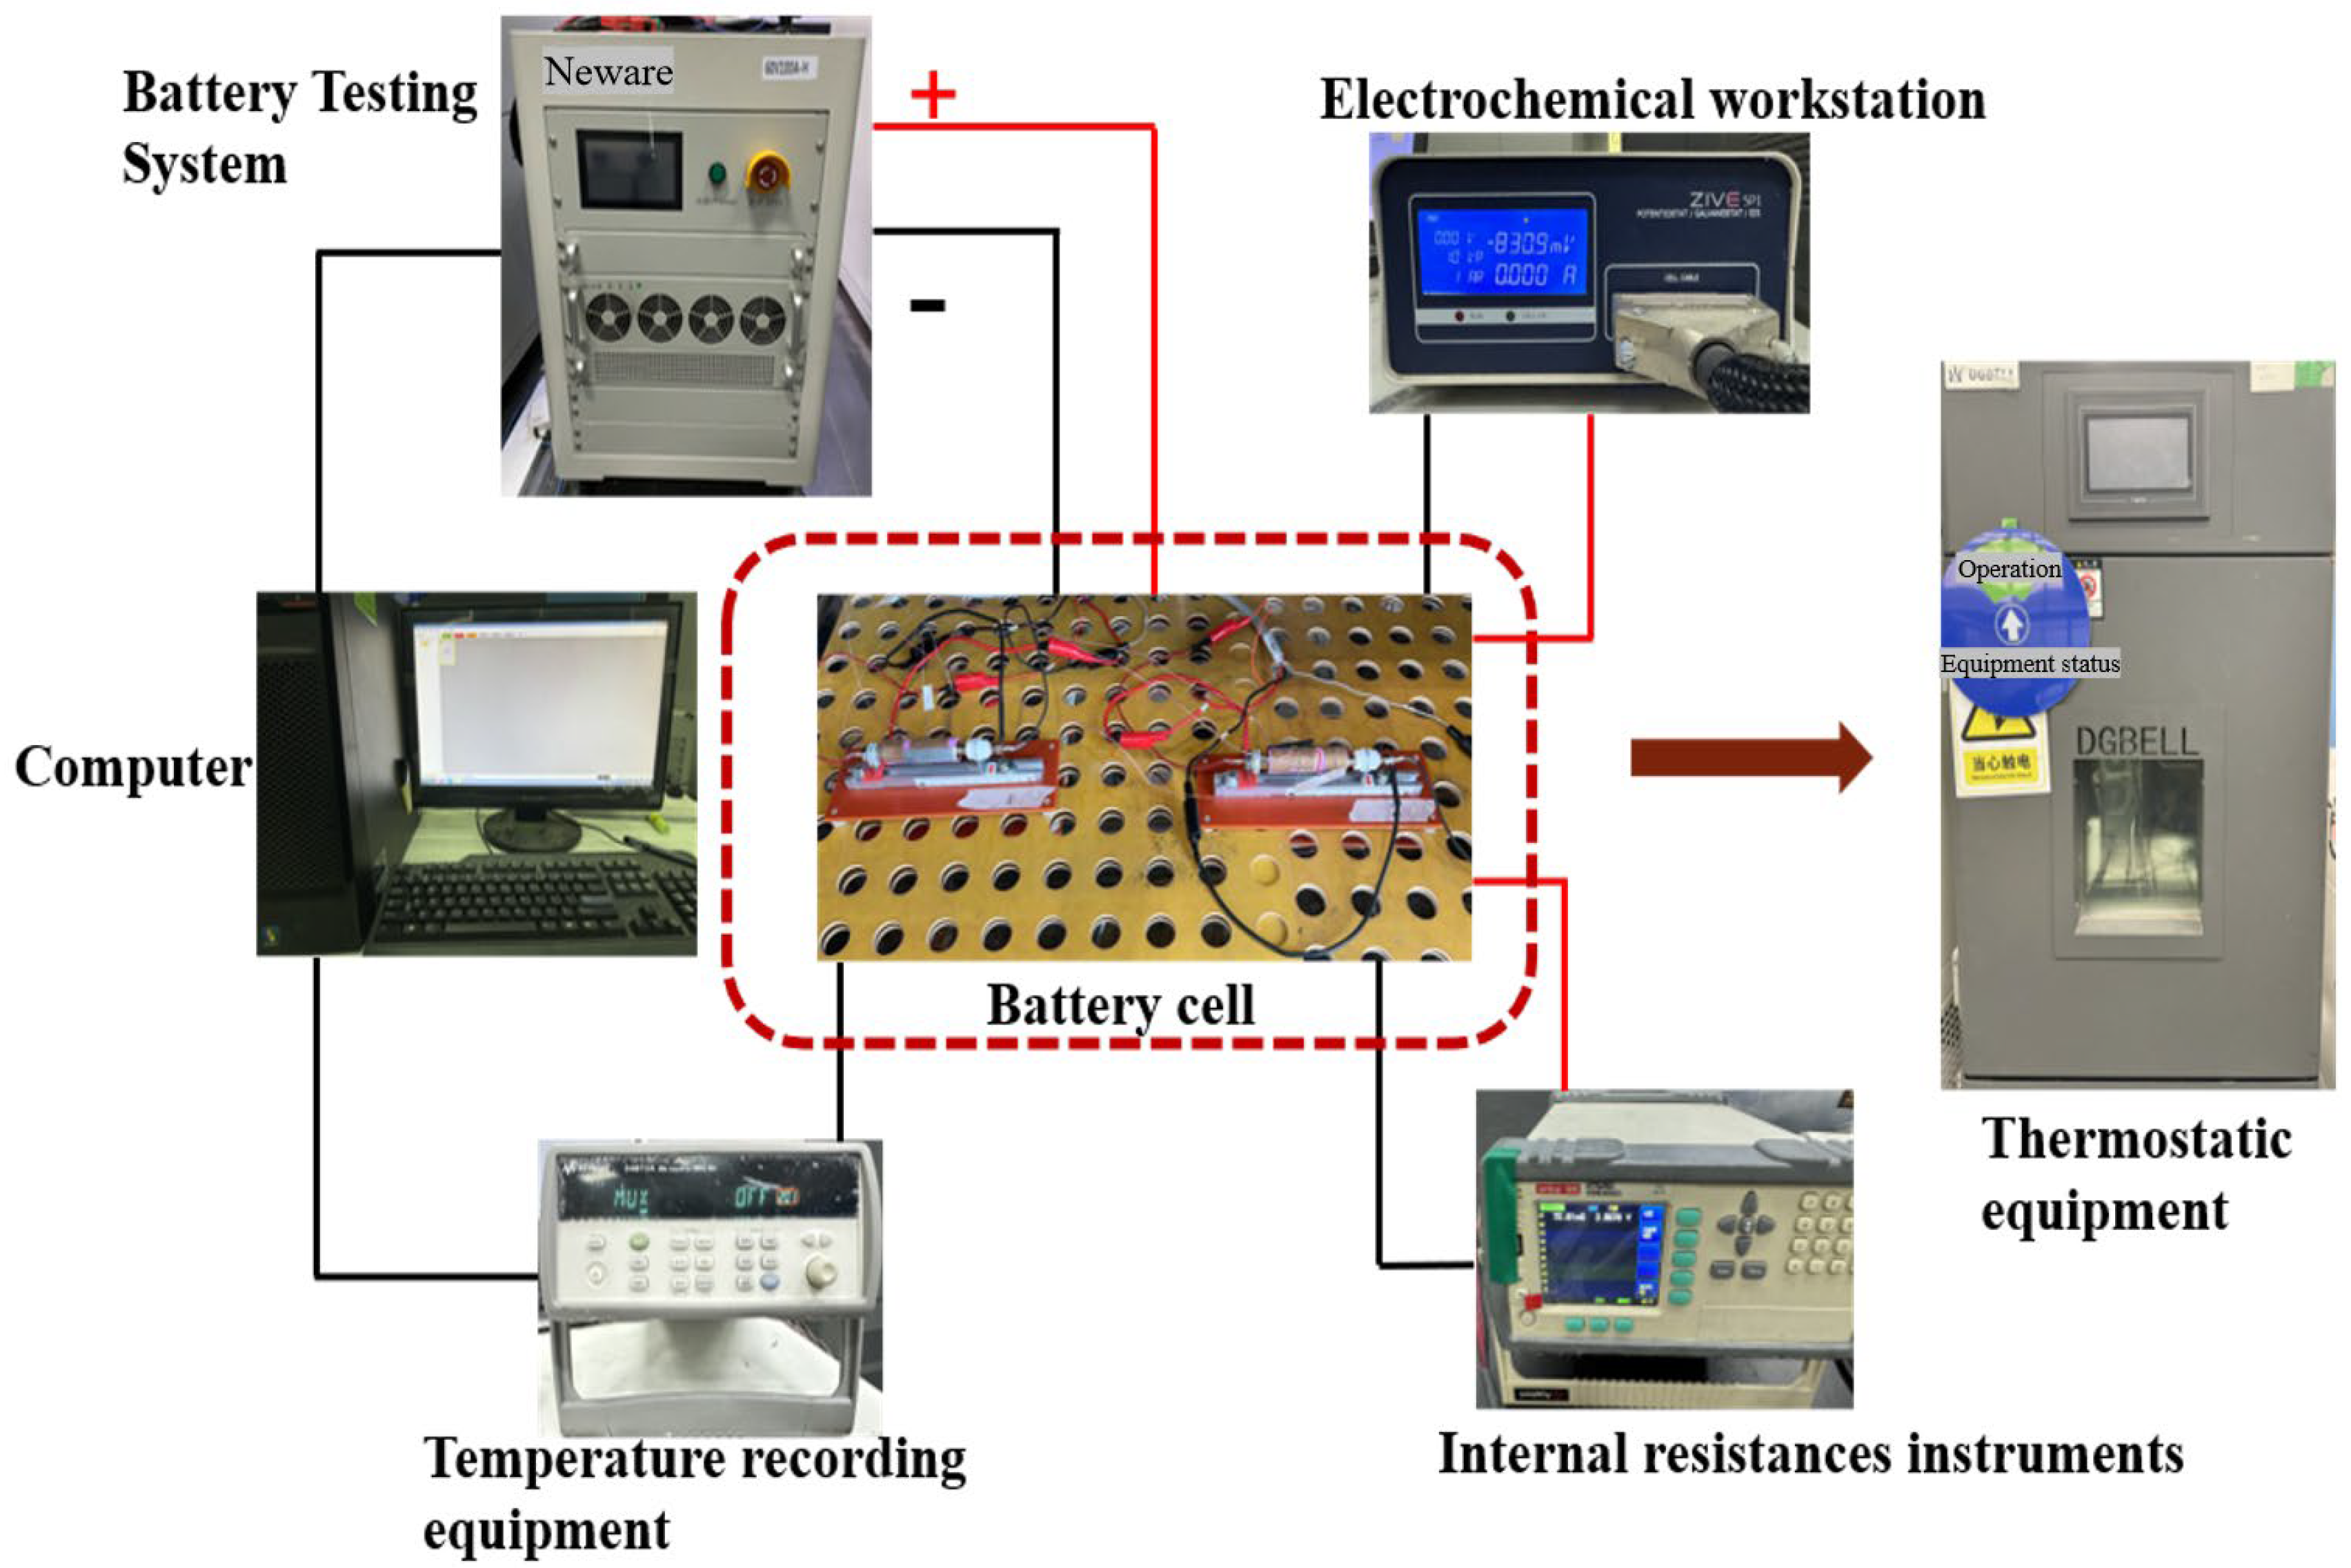
2.2. Establishment of the Experimental Testing System

The entire experimental setup is depicted in Figure 2. A constant temperature chamber (model BTH-80C, temperature accuracy ±0.5 °C, Dongguan Bell Measurement Equipment Co., Ltd., Guangzhou, China) with a temperature range of –40 °C to +150 °C was used to maintain stable environmental conditions of 25 °C and 40 °C throughout the experiments. All procedures were conducted within this chamber. Battery charging and discharging were performed using a testing cabinet (model CT-3001W-50 V120 A-NTF, Current accuracy ±0.1% FS, Shenzhen Neware Testing Co., Ltd., Guangzhou, China). Key electrochemical parameters, including current, voltage, and capacity, generated during the charging and discharging procedures were monitored in real-time using specialized testing software, with data collected at 1-s intervals. T-type thermocouples (Ω-type TT-T-30-SLE-1M, response time < 0.2 s, with an accuracy of ±0.1 °C, Guangzhou Saituo Instrument Technology Co., Ltd., Guangzhou, China) were positioned at the positive terminal, geometric center, and negative terminal of both NB and OB sodium-ion cells to measure their real-time temperatures (Figure 3). The thermocouples’ compensation was connected to an Agilent temperature scanner (model 34901A, Number of channels 20, Keysight Technology Co., Ltd., Beijing, China). A DC internal resistance tester (model BK-300, measurement range 0.1 mΩ–3 kΩ, Guangzhou Lanjian Electronic Industry Co., Ltd., Guangzhou, China) was used to assess the DC internal resistance of NB and OB cells at various states of charge (SOCs). Additionally, an electrochemical workstation (model ZIVESP 1, frequency range 10 μHz–1 MHz, Shanghai Anxin Co., Ltd., Fengxian, China) was employed to measure the electrochemical impedance spectroscopy (EIS) spectra of NBs and OBs. For crystallographic analysis of electrode materials, X-ray diffraction (XRD) measurements were conducted using a Rigaku Ultima III diffractometer (Rigaku Corporation, Akishima, Tokyo, Japan) with Cu Kα radiation (λ = 0.154056 nm) at a scanning rate of 10°/min over the 2 θ range of 10–80°. Surface morphology characterization was performed with a Hitachi TM3030 scanning electron microscope (Hitachi High-Technologies Corporation, Minato, Tokyo, Japan) operating at an accelerating voltage of 20 kV. It should be noted that, to ensure the comparability and accuracy of the experimental results, all the experiments mentioned above, including the subsequent battery disassembly procedures, were conducted using the NB and OB cells shown in Figure 1 as the subjects for all experiments.

2.3. Electrochemical Performance Testing

2.3.1. Variation in the Discharge Voltage Plateau

To evaluate the influence of overcharging abuse on the fundamental electrochemical properties of sodium-ion battery cells, two cells were subjected to discharge tests at both ambient temperature and an elevated temperature of 40 °C. The experimental procedure initiated by setting the thermostat to a constant temperature of 25 °C, ensuring that the entire charge–discharge process was conducted under these controlled conditions. Following a 10-min rest period, the cells were charged at a CC rate of 0.5 C until reaching the cutoff voltage of 3.8 V. Subsequently, a constant voltage charging mode was applied until the current decreased to 240 mA, signifying the end of the charging phase. After a 20-min rest, the cells were discharged at CC rates of 0.25, 0.5, and 1.0 C until the voltage dropped to 1.5 V, indicating the end of the discharge process. This procedure was then repeated at 40 °C to obtain the discharge voltage data for both NB and OB cells at three discharge rates. This rigorous approach enabled a thorough assessment of the effects of overcharging on the electrochemical performance of sodium-ion battery cells, underscoring the practical importance and novelty of the research.

2.3.2. Discharge Capacity

Further analysis was performed to assess the discharge capacity of NB and OB cells at both room and high temperatures based on the discharge voltage profiles discussed in Section 2.3.1. The battery cells were discharged at 0.25, 0.5, and 1.0 C, separately, in temperature-controlled chambers set at 25 °C and 40 °C. Discharge capacity was determined as follows [60]:
D n = I t 3600 × 1000  
where Dn represents the discharge capacity, mAh; I is the discharge current, A; and t denoted the discharge time, s.

2.3.3. Internal Resistance Test

Under ambient conditions of 25 °C, the internal resistance of NB and OB cells was evaluated across a range of SOC levels from 0 to 100%. The procedure involved charging the NB and OB cells following the specified charging protocol. Upon reaching 100% SOC, the cells were allowed to rest for 20 min. Subsequently, a discharge test was then performed on fully charged battery cells at a rate of 0.5 C, with discharge capacity intervals set at 5% (60 mAh) of the nominal capacity (1200 mAh). After each discharge test, the battery was removed from the charge–discharge cabinet for an internal resistance test. Subsequently, the battery was subjected to a discharge operation with a specified discharge capacity of 60 mAh once again. The SOC adjustment procedure strictly followed the charge–discharge protocol detailed in Section 2.1 of this paper, specifically Steps 3–5. This systematic methodology allowed for the accurate measurement of internal resistance across the entire range of SOC levels from 0 to 100%. A similar approach was utilized for testing the internal resistance of OB at different SOCs. The SOC values were accurately determined using the following equation [60] under CC discharge conditions:
S O C = 1 ( I t 3600 C n )
where SOC represented the state of charge; I represented the discharge current in amperes; t denoted the discharge time in seconds; and Cn was the nominal capacity in Ah.

2.3.4. Comparison of EIS

To evaluate the impact of overcharging abuse on the electrochemical impedance of battery cells, an electrochemical workstation was employed to perform EIS. Measurements were conducted on NB and OB cells at 0% SOC. The EIS measurements were carried out under conditions of an AC amplitude voltage of 5 mV and a frequency range spanning from 100,000 to 0.001 Hz, ensuring a comprehensive analysis of the cells’ impedance characteristics.

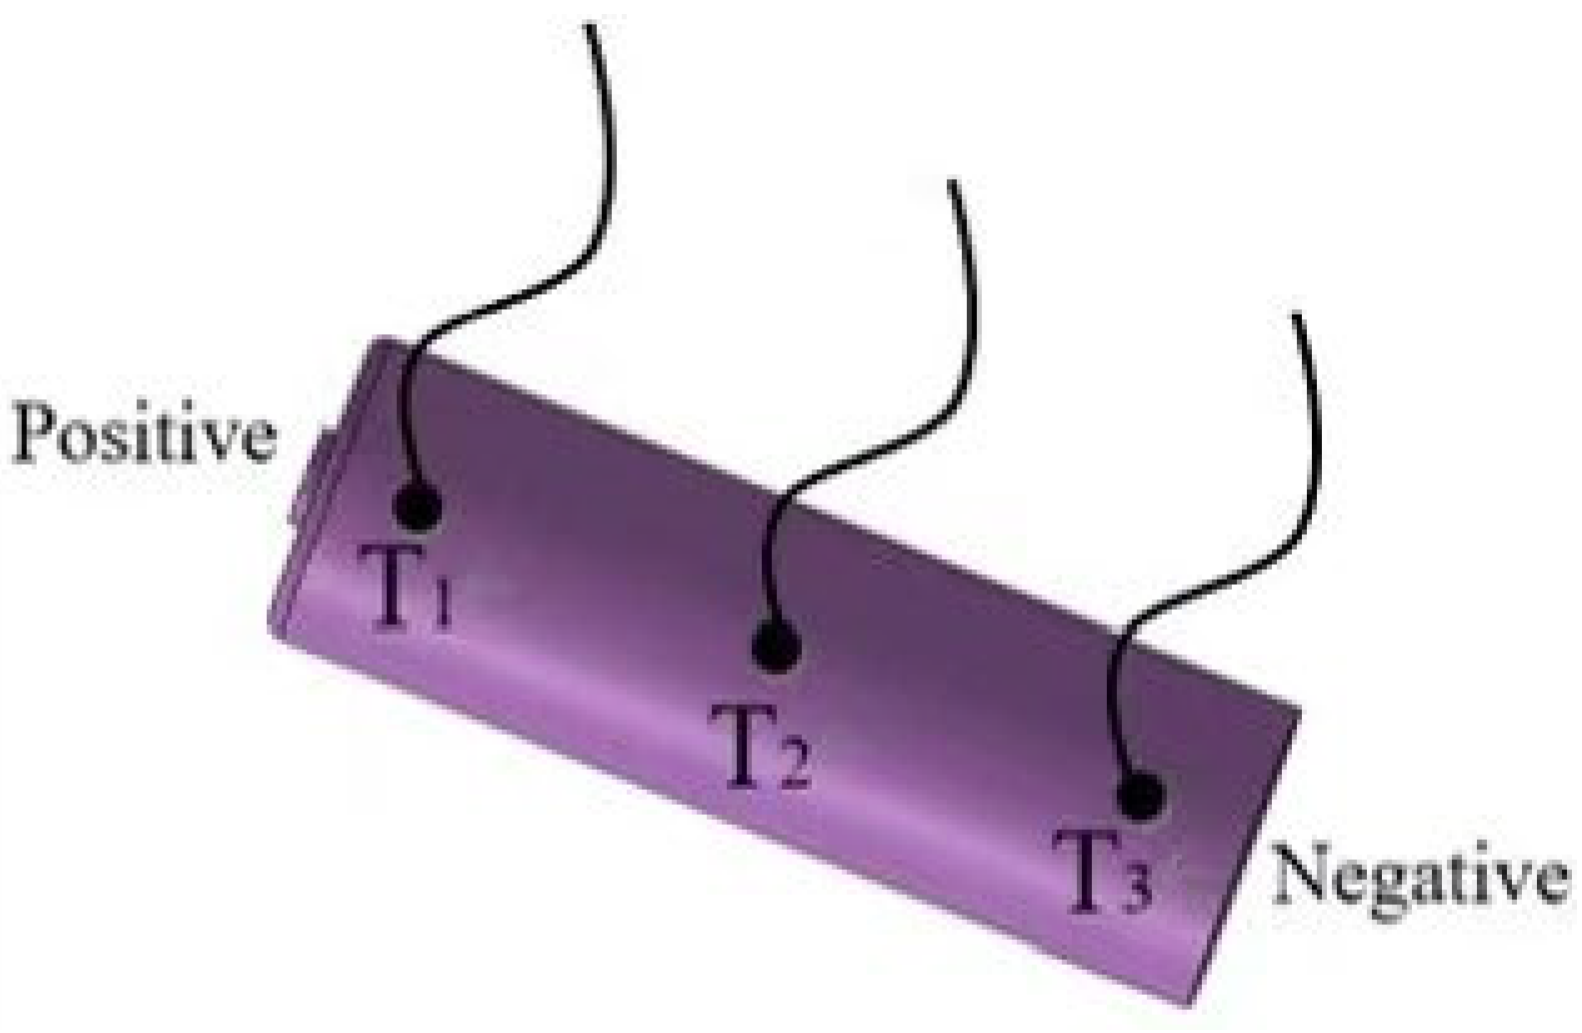
2.4. Analysis of Temperature Variations

A comprehensive analysis was conducted to investigate heat generation in both NB and OB cells across a range of ambient temperatures and discharge rates. The objective was to elucidate the influence of overcharging abuse on the thermal behavior of these cells. The detailed experimental procedures were outlined in Section 2.3.1. Utilizing the experimental test system illustrated in Figure 2, real-time temperature data were meticulously collected during the battery discharge process, with a particular focus on the maximum discharge temperature and the peak temperature difference observed. This rigorous approach provided valuable insights into the thermal management of power battery cells under overcharging conditions, highlighting the practical significance and novelty of the research in the field of electrochemical energy storage and safety.

2.5. Microscopic Morphology and Crystal Structure of Internal Electrode Materials in NB and OB Cells

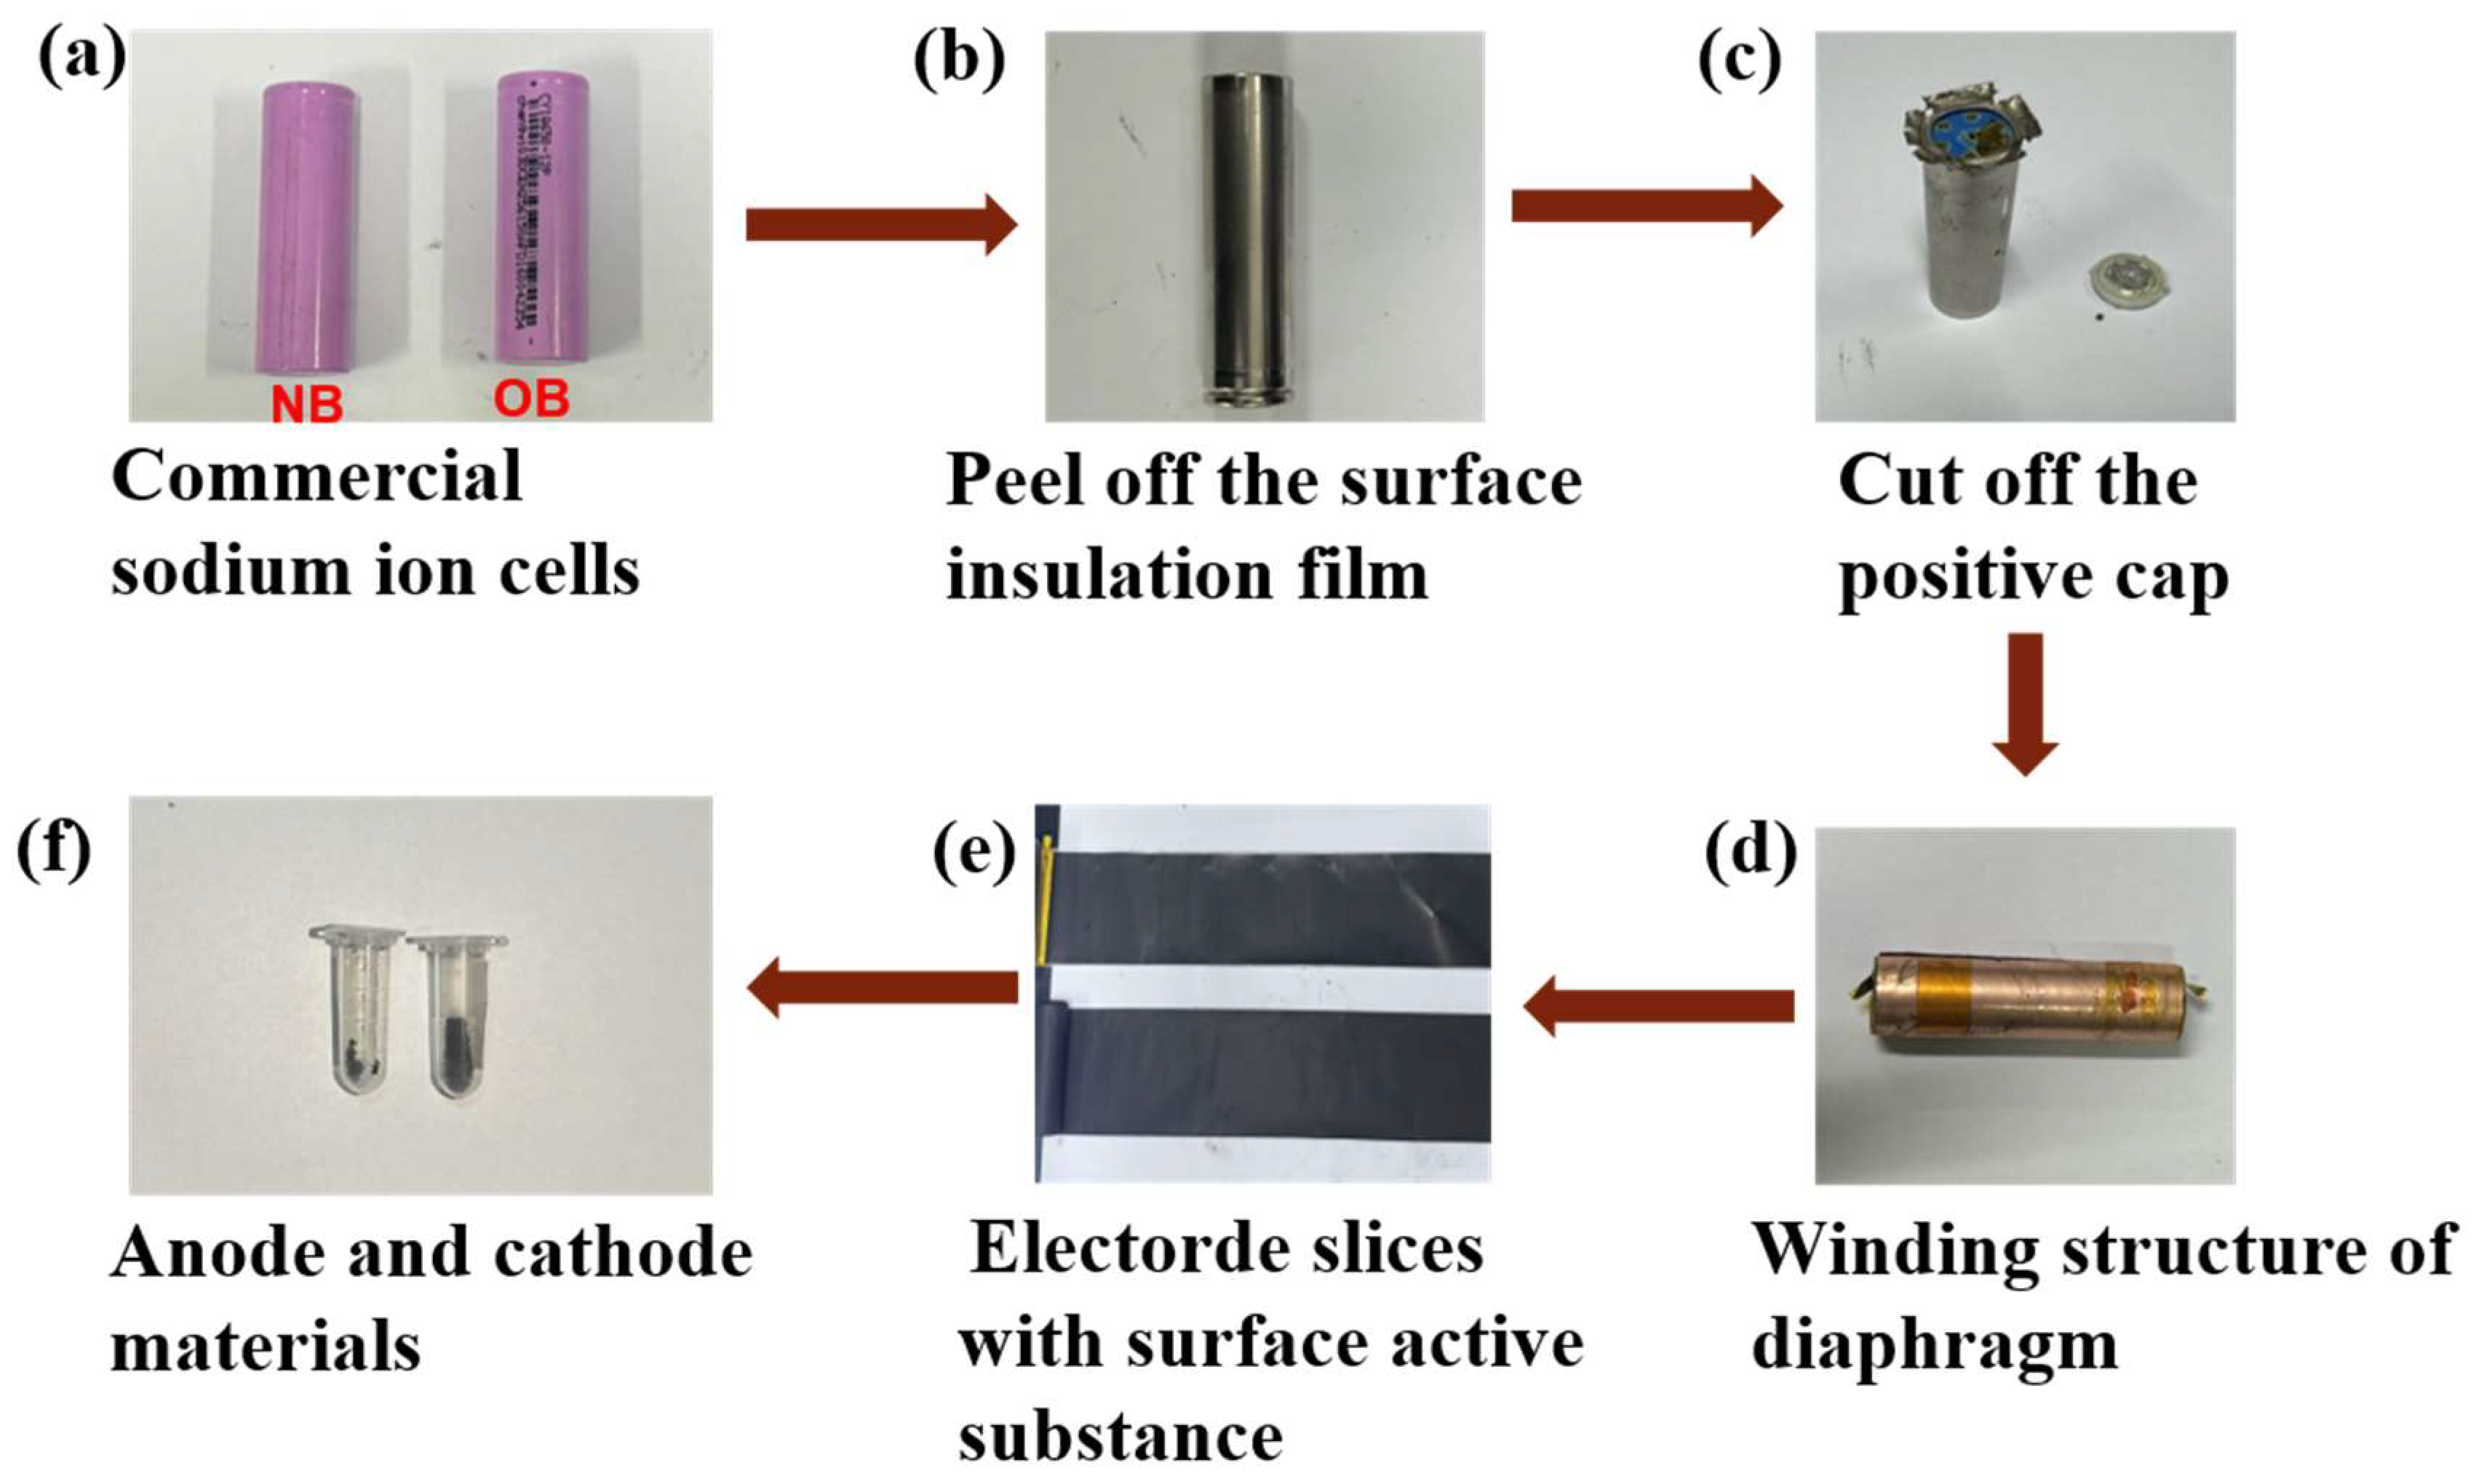
2.5.1. Disassembly of Full NB and OB Cells

To investigate the impact of overcharging abuse on the morphology and crystal structure of internal electrode materials in sodium-ion battery cells, both NB and OB cells, each at 0% SOC, were carefully dissected in a helium-filled environment at 25 °C within a Mikrouka glove box. The detailed dissection procedure is illustrated in Figure 4. Initially, a utility knife was utilized to incise the outer heat-shrinkable film, which was subsequently gently removed using tweezers. Subsequently, pliers were employed to carefully pry open the metal casing surrounding the positive electrode’s rubber ring, and the connection between the cap and the battery cell was meticulously severed. It was crucial to avoid simultaneous contact with both the positive and negative electrodes during the dissection process to prevent potential short-circuiting of the battery cell.
After removing the metal casing, the unique separator and the intricate winding structure of the electrode sheets were revealed. The positive and negative current collectors were then unfolded, and the electrode sheets, which were initially warm, were allowed to cool to a safe temperature before further manipulation. Extreme caution was exercised throughout the procedure to prevent any possibility of short-circuiting the cell.
At a controlled temperature of 25 °C, the electrode sheets were gently cleaned using cotton swabs soaked in dimethyl carbonate. After thorough drying, a scraper was employed to carefully remove the conductive powder from the electrode sheets. This powder was subsequently lightly ground and placed in an oven (model DHG-9070 A, Shanghai Jinghong Co., Ltd., Qingpu, China) to dry at 70 °C for 12 h. Finally, the positive and negative electrode powders were collected in sample tubes for subsequent microscopic characterization. The concrete disassembly process of NB and OB cells is described in Figure 4.
This meticulous approach allowed for a detailed examination of the effects of overcharging on the microstructure of sodium-ion battery electrodes, providing valuable insights into the degradation mechanisms and highlighting the practical significance of this research in the field of battery safety and performance.

2.5.2. Scanning Electron Microscopy (SEM)

SEM (Hitachi S-3400 N-II, High-Technologies Corporation, Minato, Tokyo, Japan) was utilized to investigate the microstructure of the active material at an accelerating voltage of 20 kV. The procedure involved uniformly spreading the active material, derived from the electrode sheets described in Section 2.5.1, onto a platform coated with conductive adhesive. The sample then underwent a 90 s gold coating process to improve conductivity. After this preparation, the sample was placed on the scanning electron microscope and a suitable area was selected for microscopic scanning. Furthermore, specific dimensions of the positive and negative electrode sheets from both NB and OB cells were cut, and the cross-sectional morphology of these electrode sheets was analyzed following the same procedure.

2.5.3. X-Ray Diffraction Analysis (XRD)

XRD was performed on the active materials of the positive and negative electrodes of NB and OB cells using a XRD (Rigaku D/max-2550 Corporation, Akishima, Tokyo, Japan) instrument. The diffraction patterns obtained were compared to assess the characteristics of the crystal structures. The diffractometer used Cu Kα radiation (0.154056 nm) and scanned at a rate of 10°/min across a 2θ range of 10–80°.

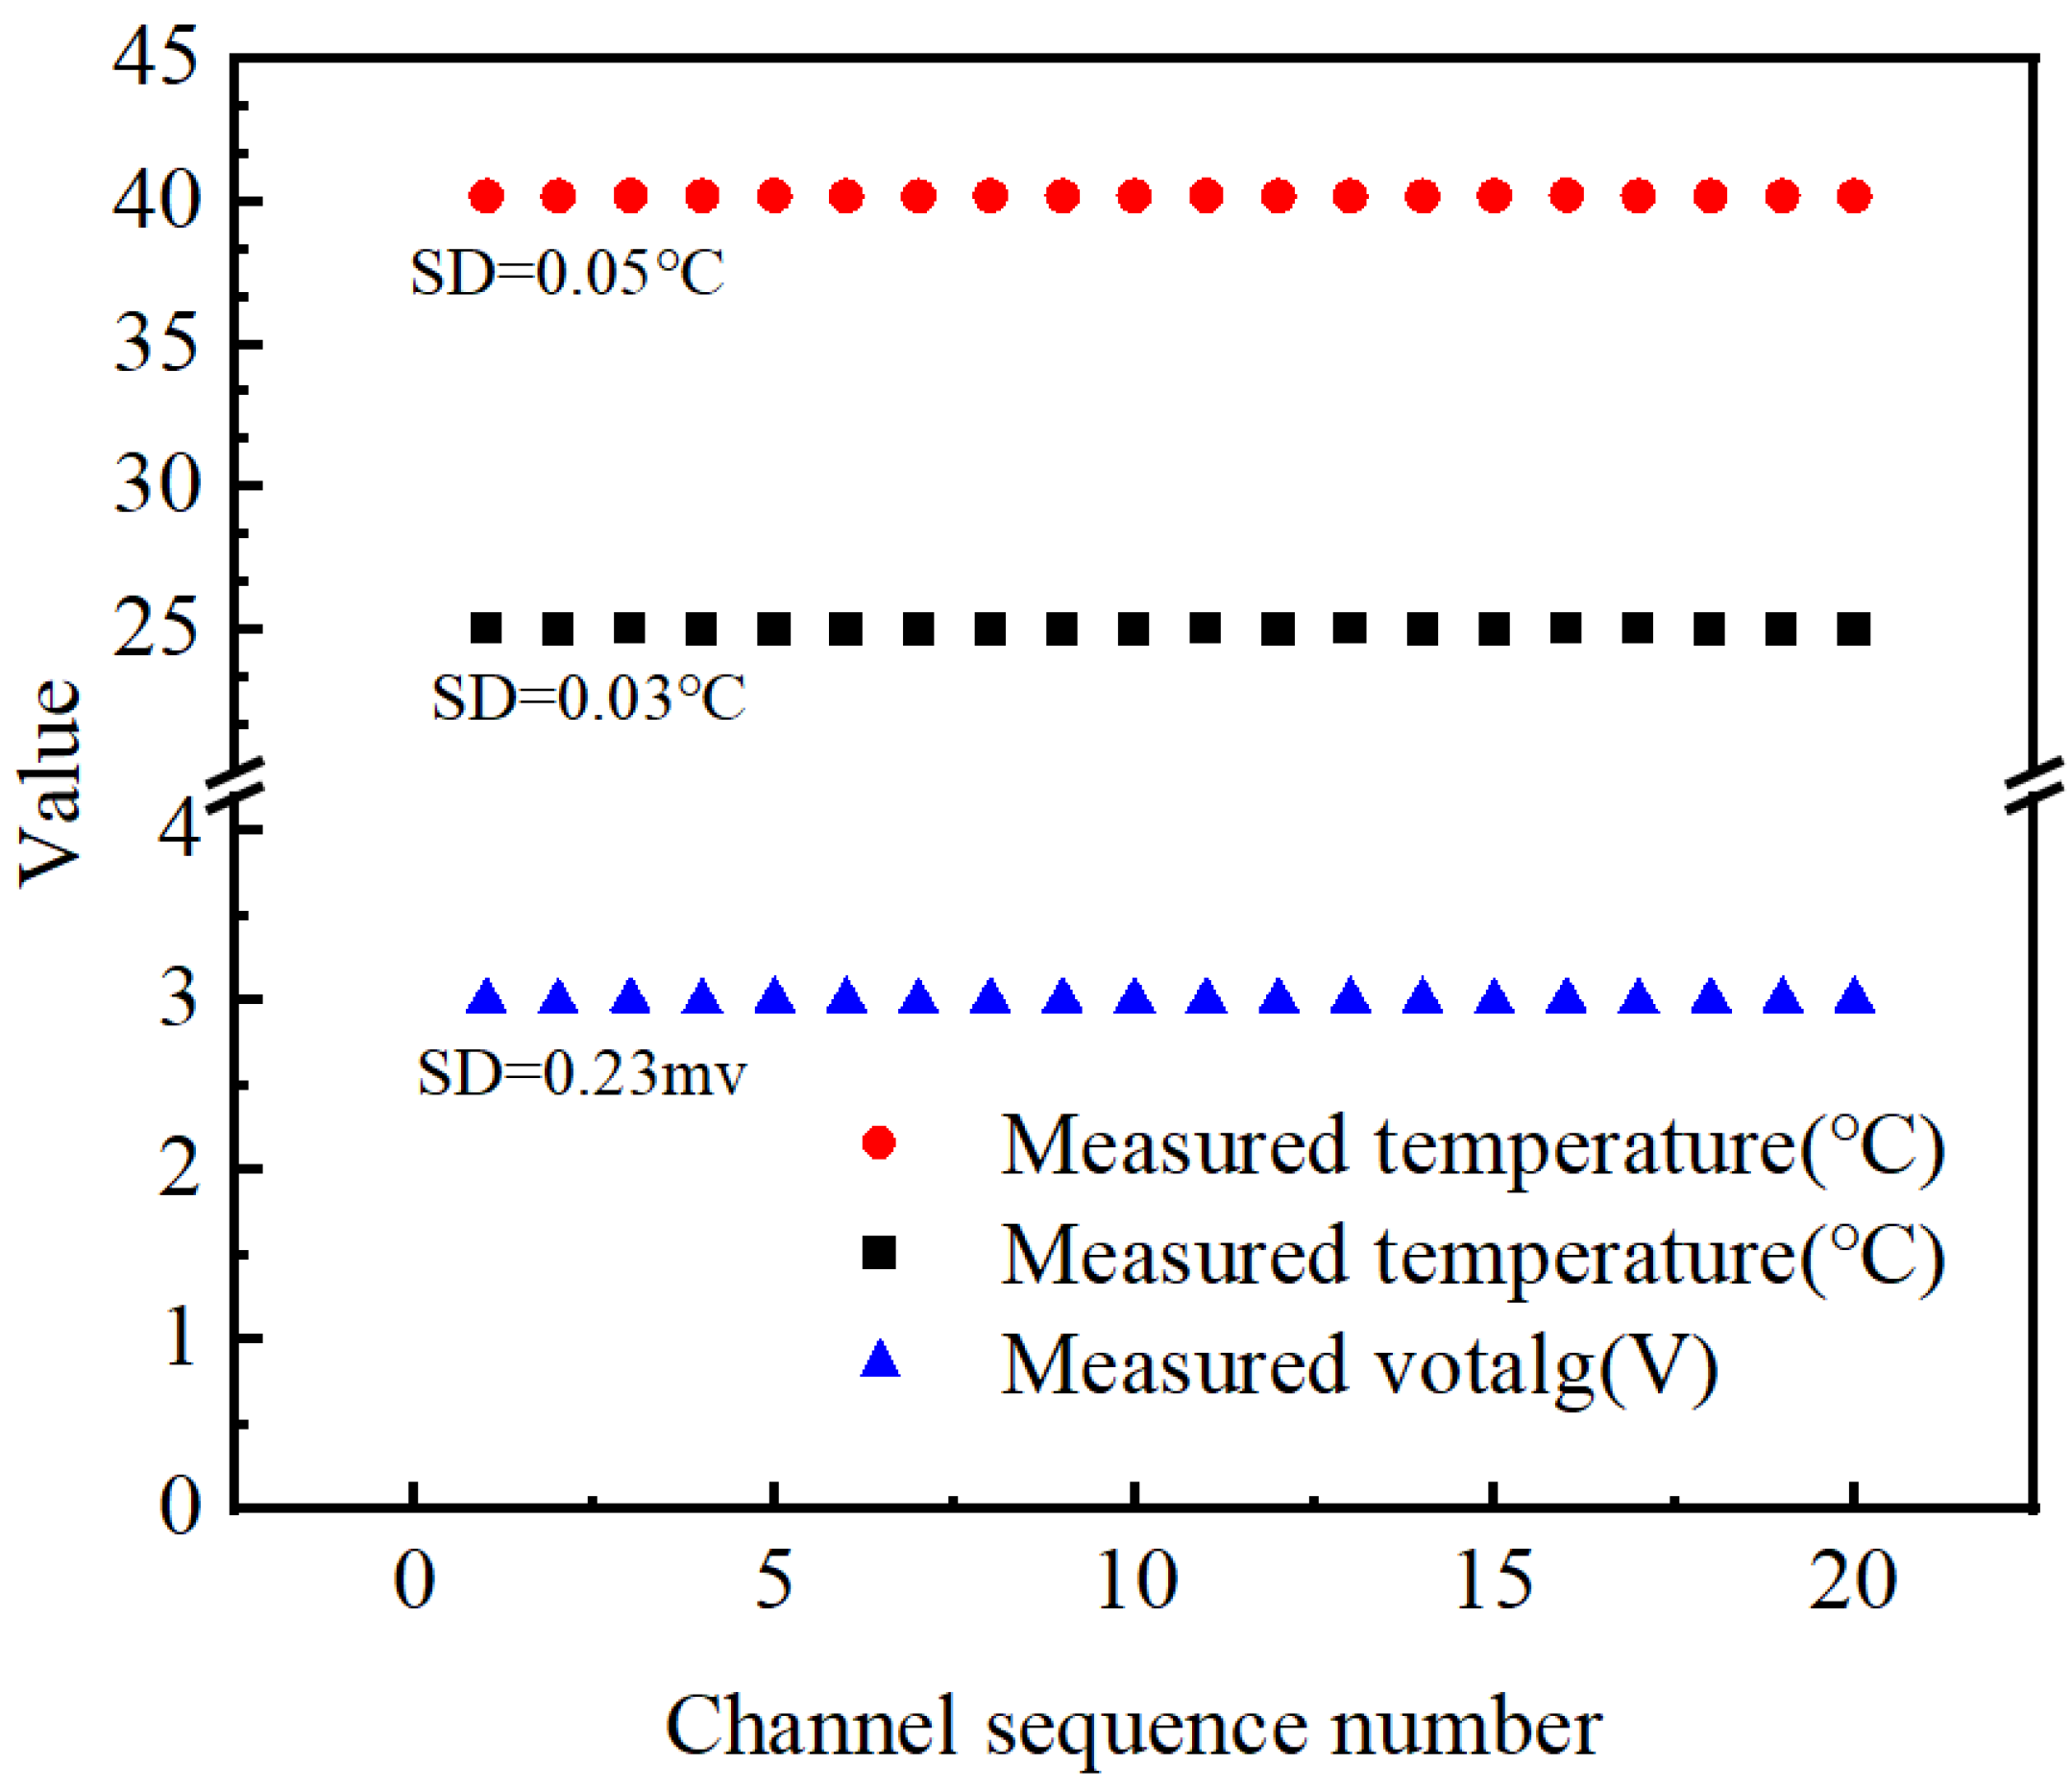
2.6. Experimental Uncertainty Analysis

The experimental error was characterized by the experimental uncertainty, and the instrumental measurement error belongs to the class A uncertainty, which was judged by the standard deviation (SD), and is calculated as follows [61,62]:
S D = 1 N ( N 1 ) i = 1 N ( x i x ¯ )
x ¯ = 1 N i = 1 N x i
where N was the number of channels, xi was the data of the ith channel, and x ¯ was the average value of the measured data.
The SD value for the voltage at room temperature was 0.23 mV, while the temperature SD value for the 20-channel Agilent data logger was 0.03 °C at 25 °C and 0.05 °C at 60 °C, as shown in Figure 5. To a certain extent, the experimental uncertainty of voltage measurement is almost zero. At 25 °C, it was the actual value of x ± 0.03 . At 40 °C, it was the actual value of x ± 0.05 .

3. Results and Discussion

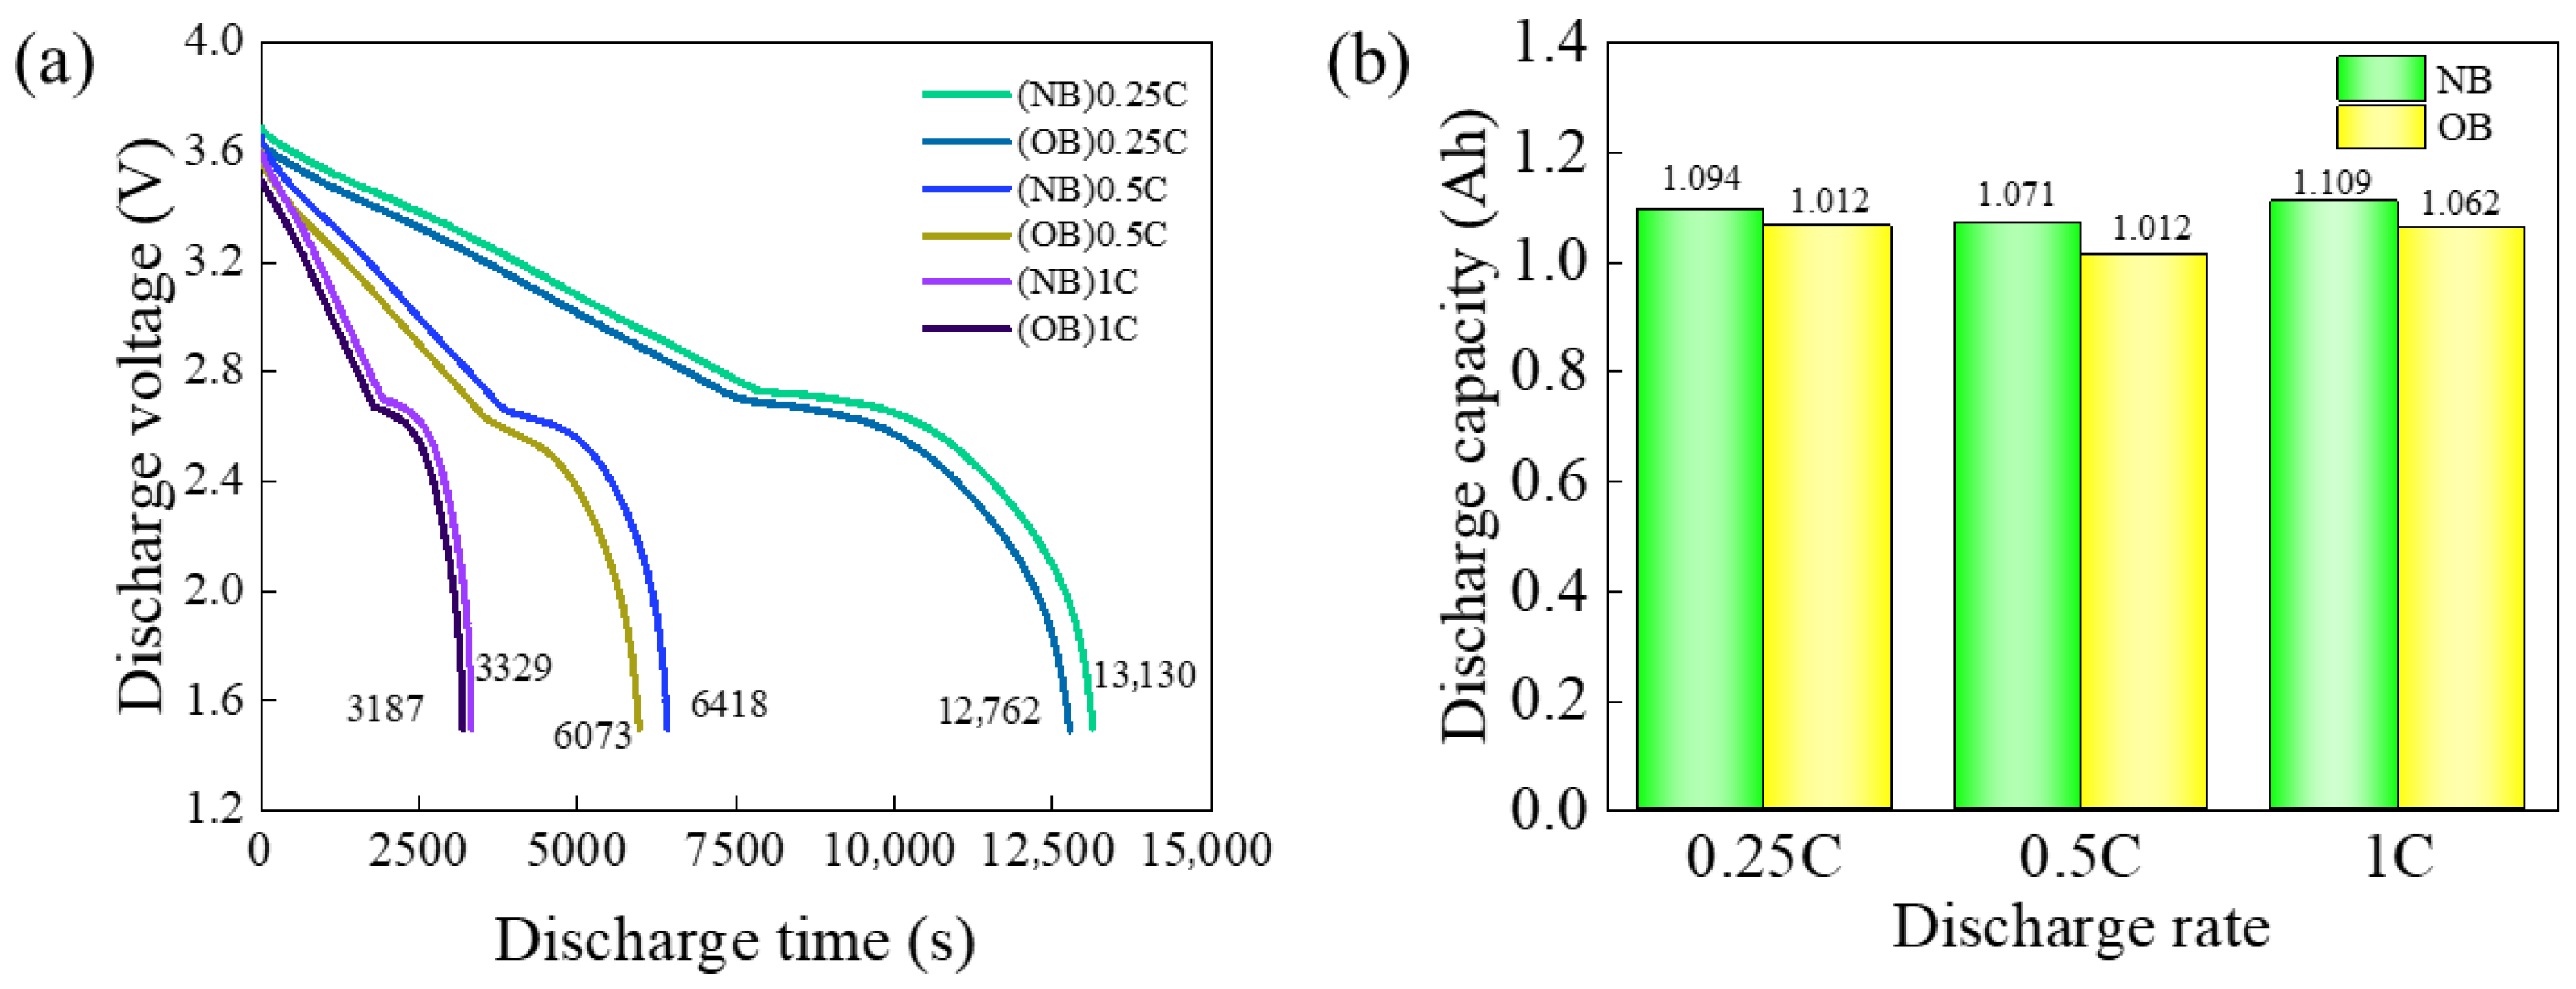
3.1. Comparative Analysis of the Discharge Voltage Plateau and Discharge Capacity Between NB and OB Cells

At an ambient temperature of 25 °C, NB and OB batteries were subjected to constant-current discharged at rates of 0.25 C, 0.5 C, and 1 C, separately. Figure 6 elucidates the disparities in discharge voltage plateau and discharge capacity between the NB and OB. As depicted in Figure 6a,b, an increase in the discharge rate leads to a decrease in both the initial discharge voltage and the voltage decay rate for both cell types. Notably, across all discharge rates examined, the OB cells exhibit lower discharge voltage plateaus and reduced discharge capacities compared to their NB counterparts. A comprehensive analysis of the data reveals that, at discharge rates of 0.25, 0.5, and 1 C, the discharge times for OB cells are 13,130 s, 6418 s, and 3329 s, respectively. These times represent respective reductions of 2.81%, 5.38%, and 4.26% relative to NB cells at the same discharge rates. Correspondingly, the discharge capacities of OB cells after overcharging at these rates reach 1.064, 1.012, and 1.062 Ah, respectively, consistently lower than those of NB cells. The observed decrease in discharge capacities correlates well with the reduction in discharge times, indicating that overcharging had a detrimental effect on both the discharge duration and the capacity of the cells.
To investigate the impact of overcharge on the electrochemical performance of sodium-ion traction batteries at higher ambient temperature, NB and OB cells were used in constant current experiments at 0.25 C, 0.5 C and 1.0 C, separately, under a temperature condition of 40 °C. The comparisons of discharge voltage plateau and capacity for the cells are presented in Figure 7. Consistent with the observations at 25 °C, the OB exhibits lower voltage plateau, discharge time, and capacity compared to the NB. As depicted in Figure 7a,b, at discharge rates of 0.25, 0.5, and 1 C at 40 °C, the discharge times for the OB are 14,300 s, 7010 s, and 3435 s, respectively. These times represent respective reductions of 3.17, 3.27, and 5.47% relative to the NB at the same rates. Furthermore, the discharge capacities of the OB after overcharging at these discharge rates are 1.154, 1.131, and 1.082 Ah, respectively, all lower than those of the NB cell. These results indicate a significant deterioration in the electrochemical performance of the OB. This decline in performance can be attributed to the adverse effects of overcharging on sodium ion transport efficiency and the reversibility of the intercalation/deintercalation process, leading to reduced cell capacity [52]. Overcharging causes excessive deintercalation of sodium ions from the cathode material, leading to structural degradation (Figures 13 and 14). Specifically, regional active material detachment occurs at the cathode (Figure 12b), reducing the effective reaction interface. Concurrently, fragmentation and agglomeration of hard carbon particles at the anode (Figure 13d) obstruct ion transport pathways. These structural damages collectively impair the battery’s discharge capacity and overall performance. Therefore, overcharging significantly reduces the charge–discharge time and battery capacity, with these effects becoming more pronounced as the discharge rate increased.

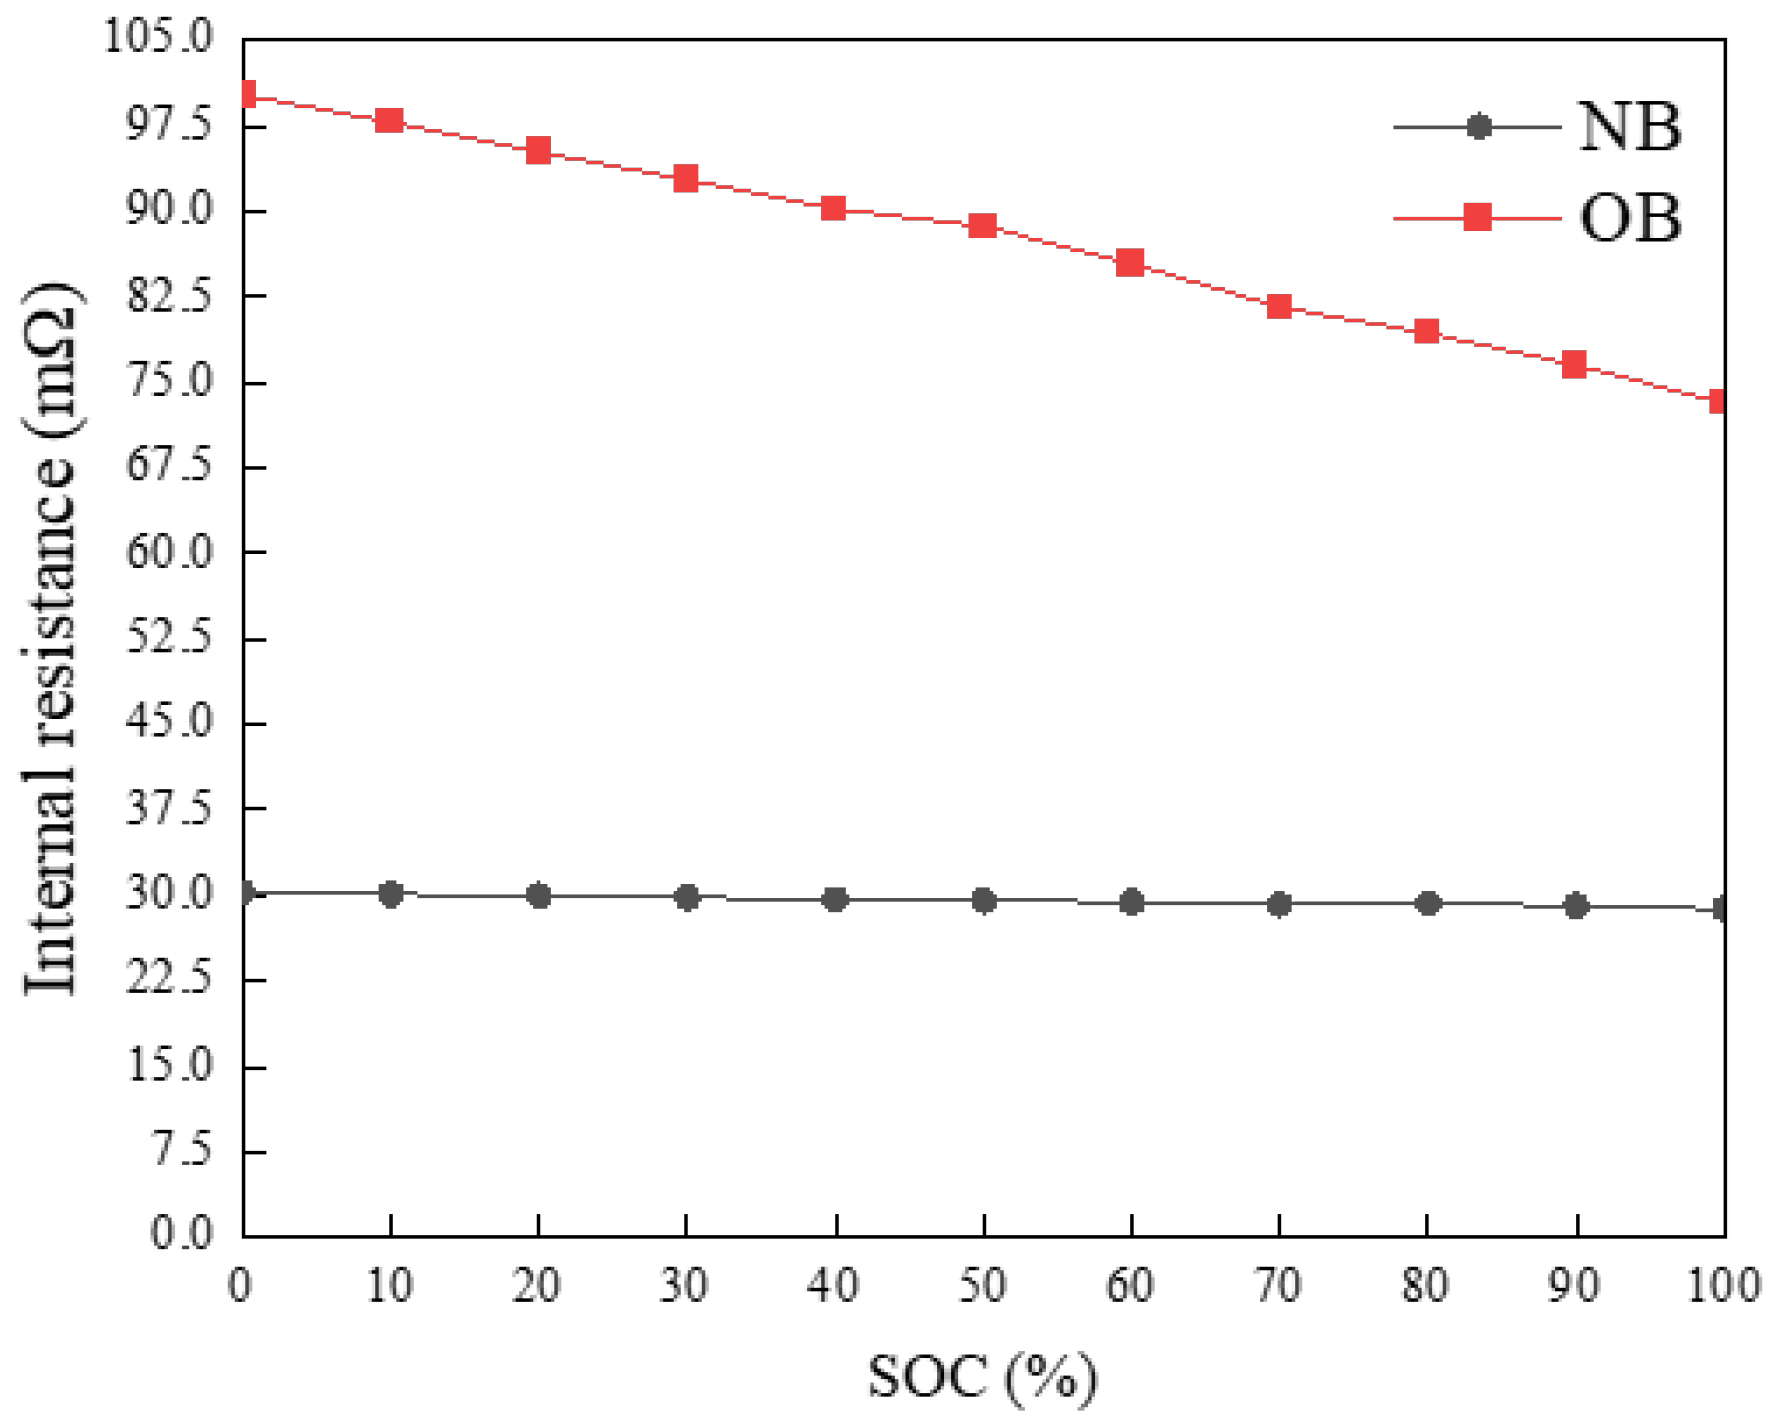
3.2. Internal Resistance Variations Post-Overcharge
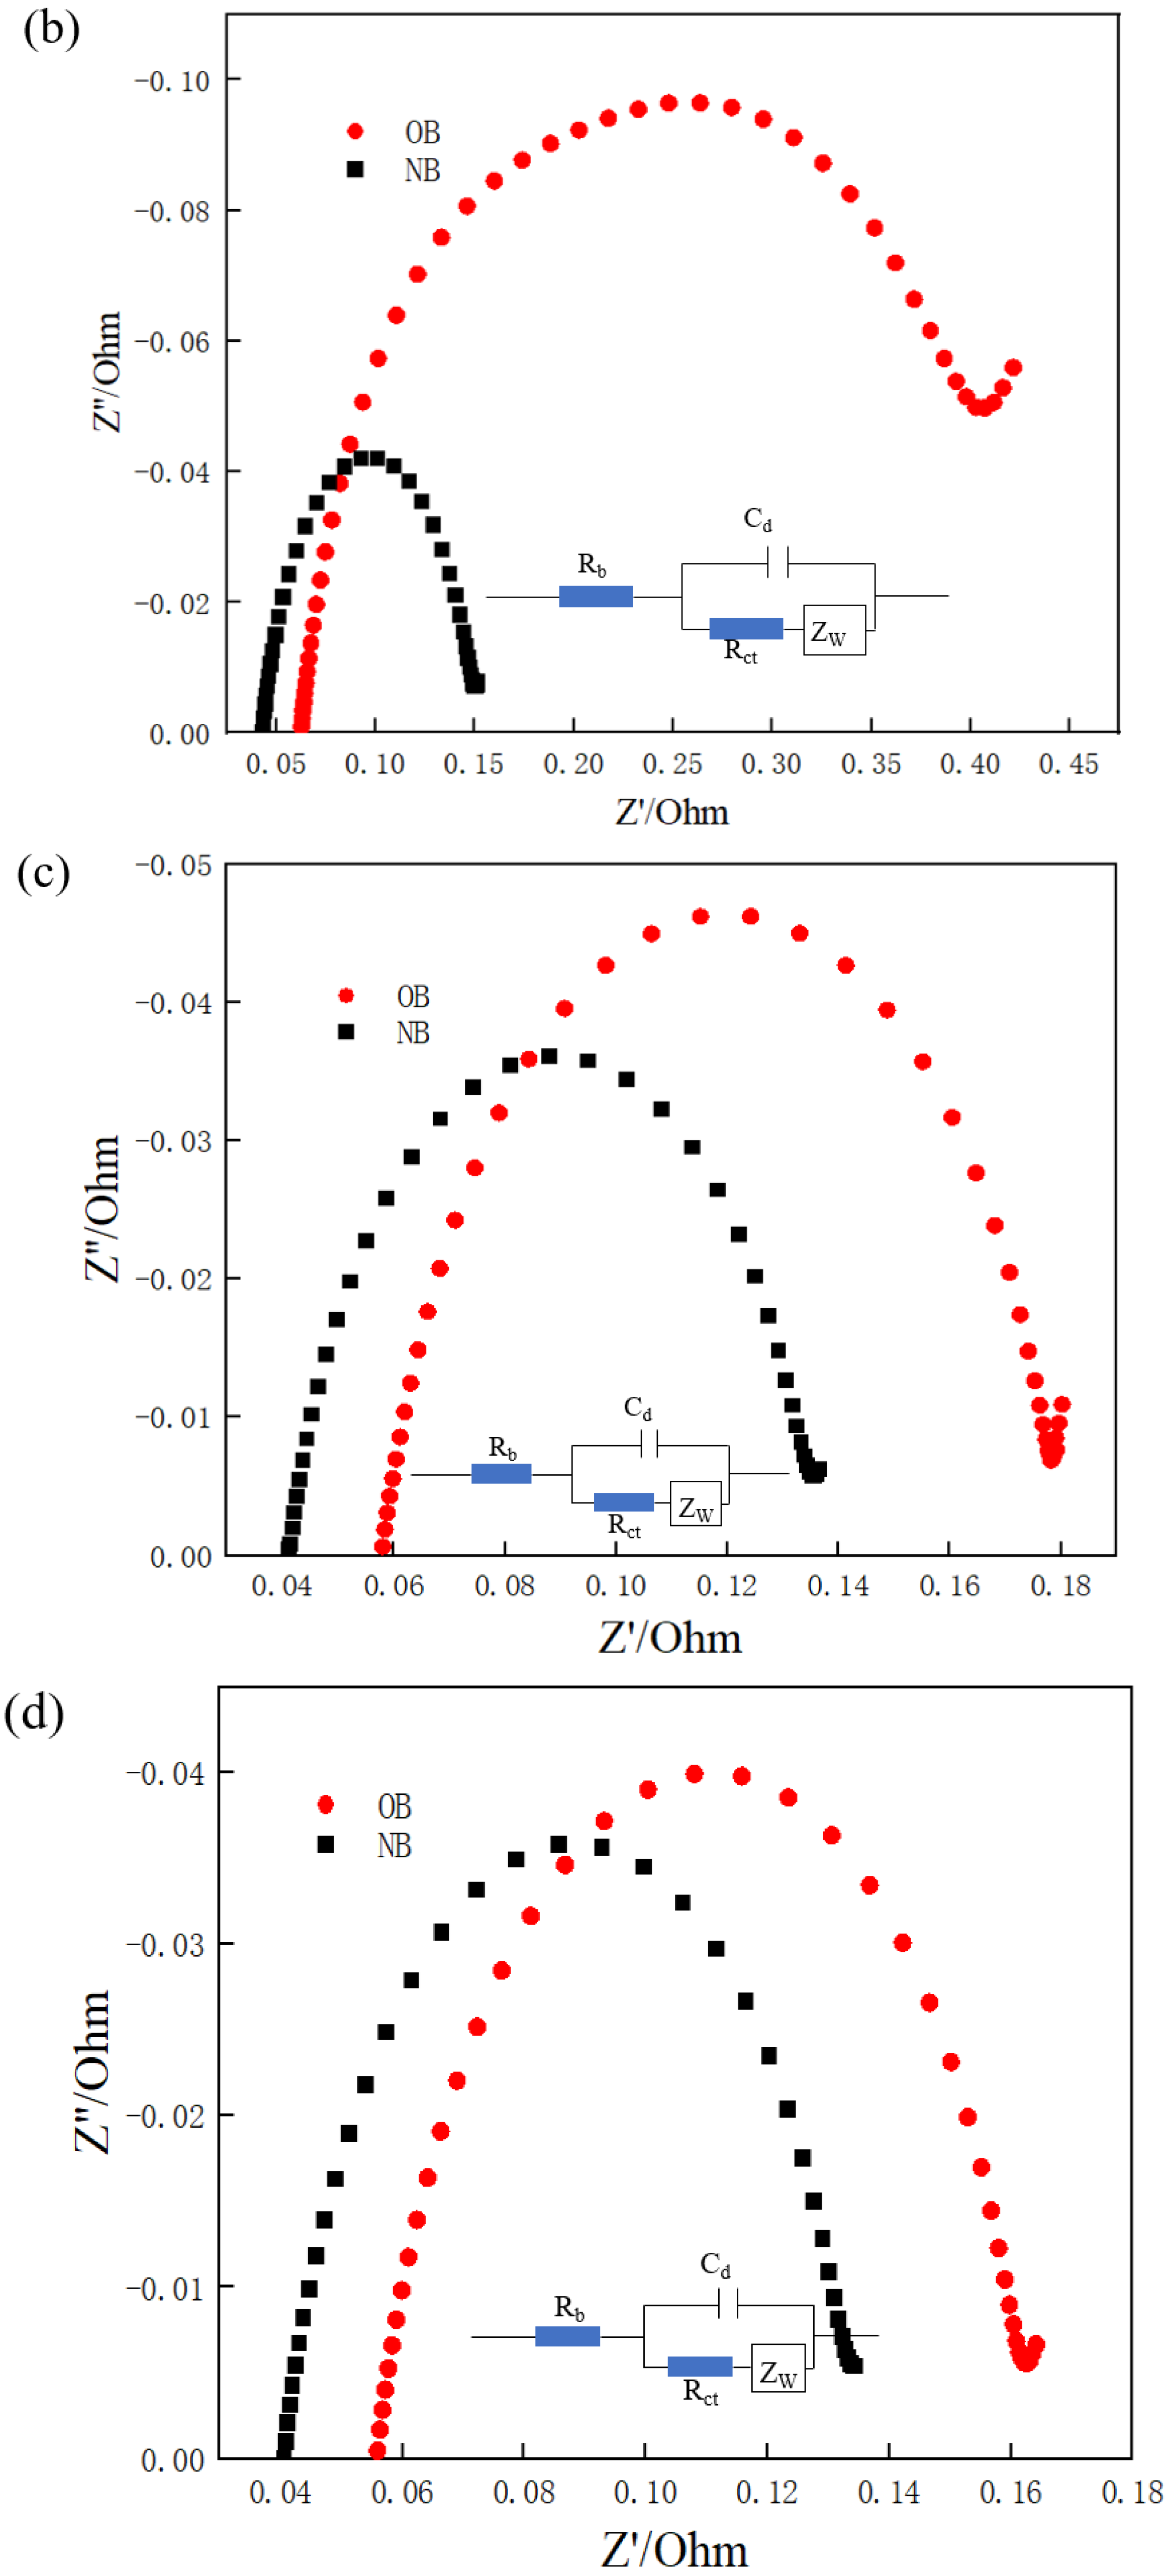
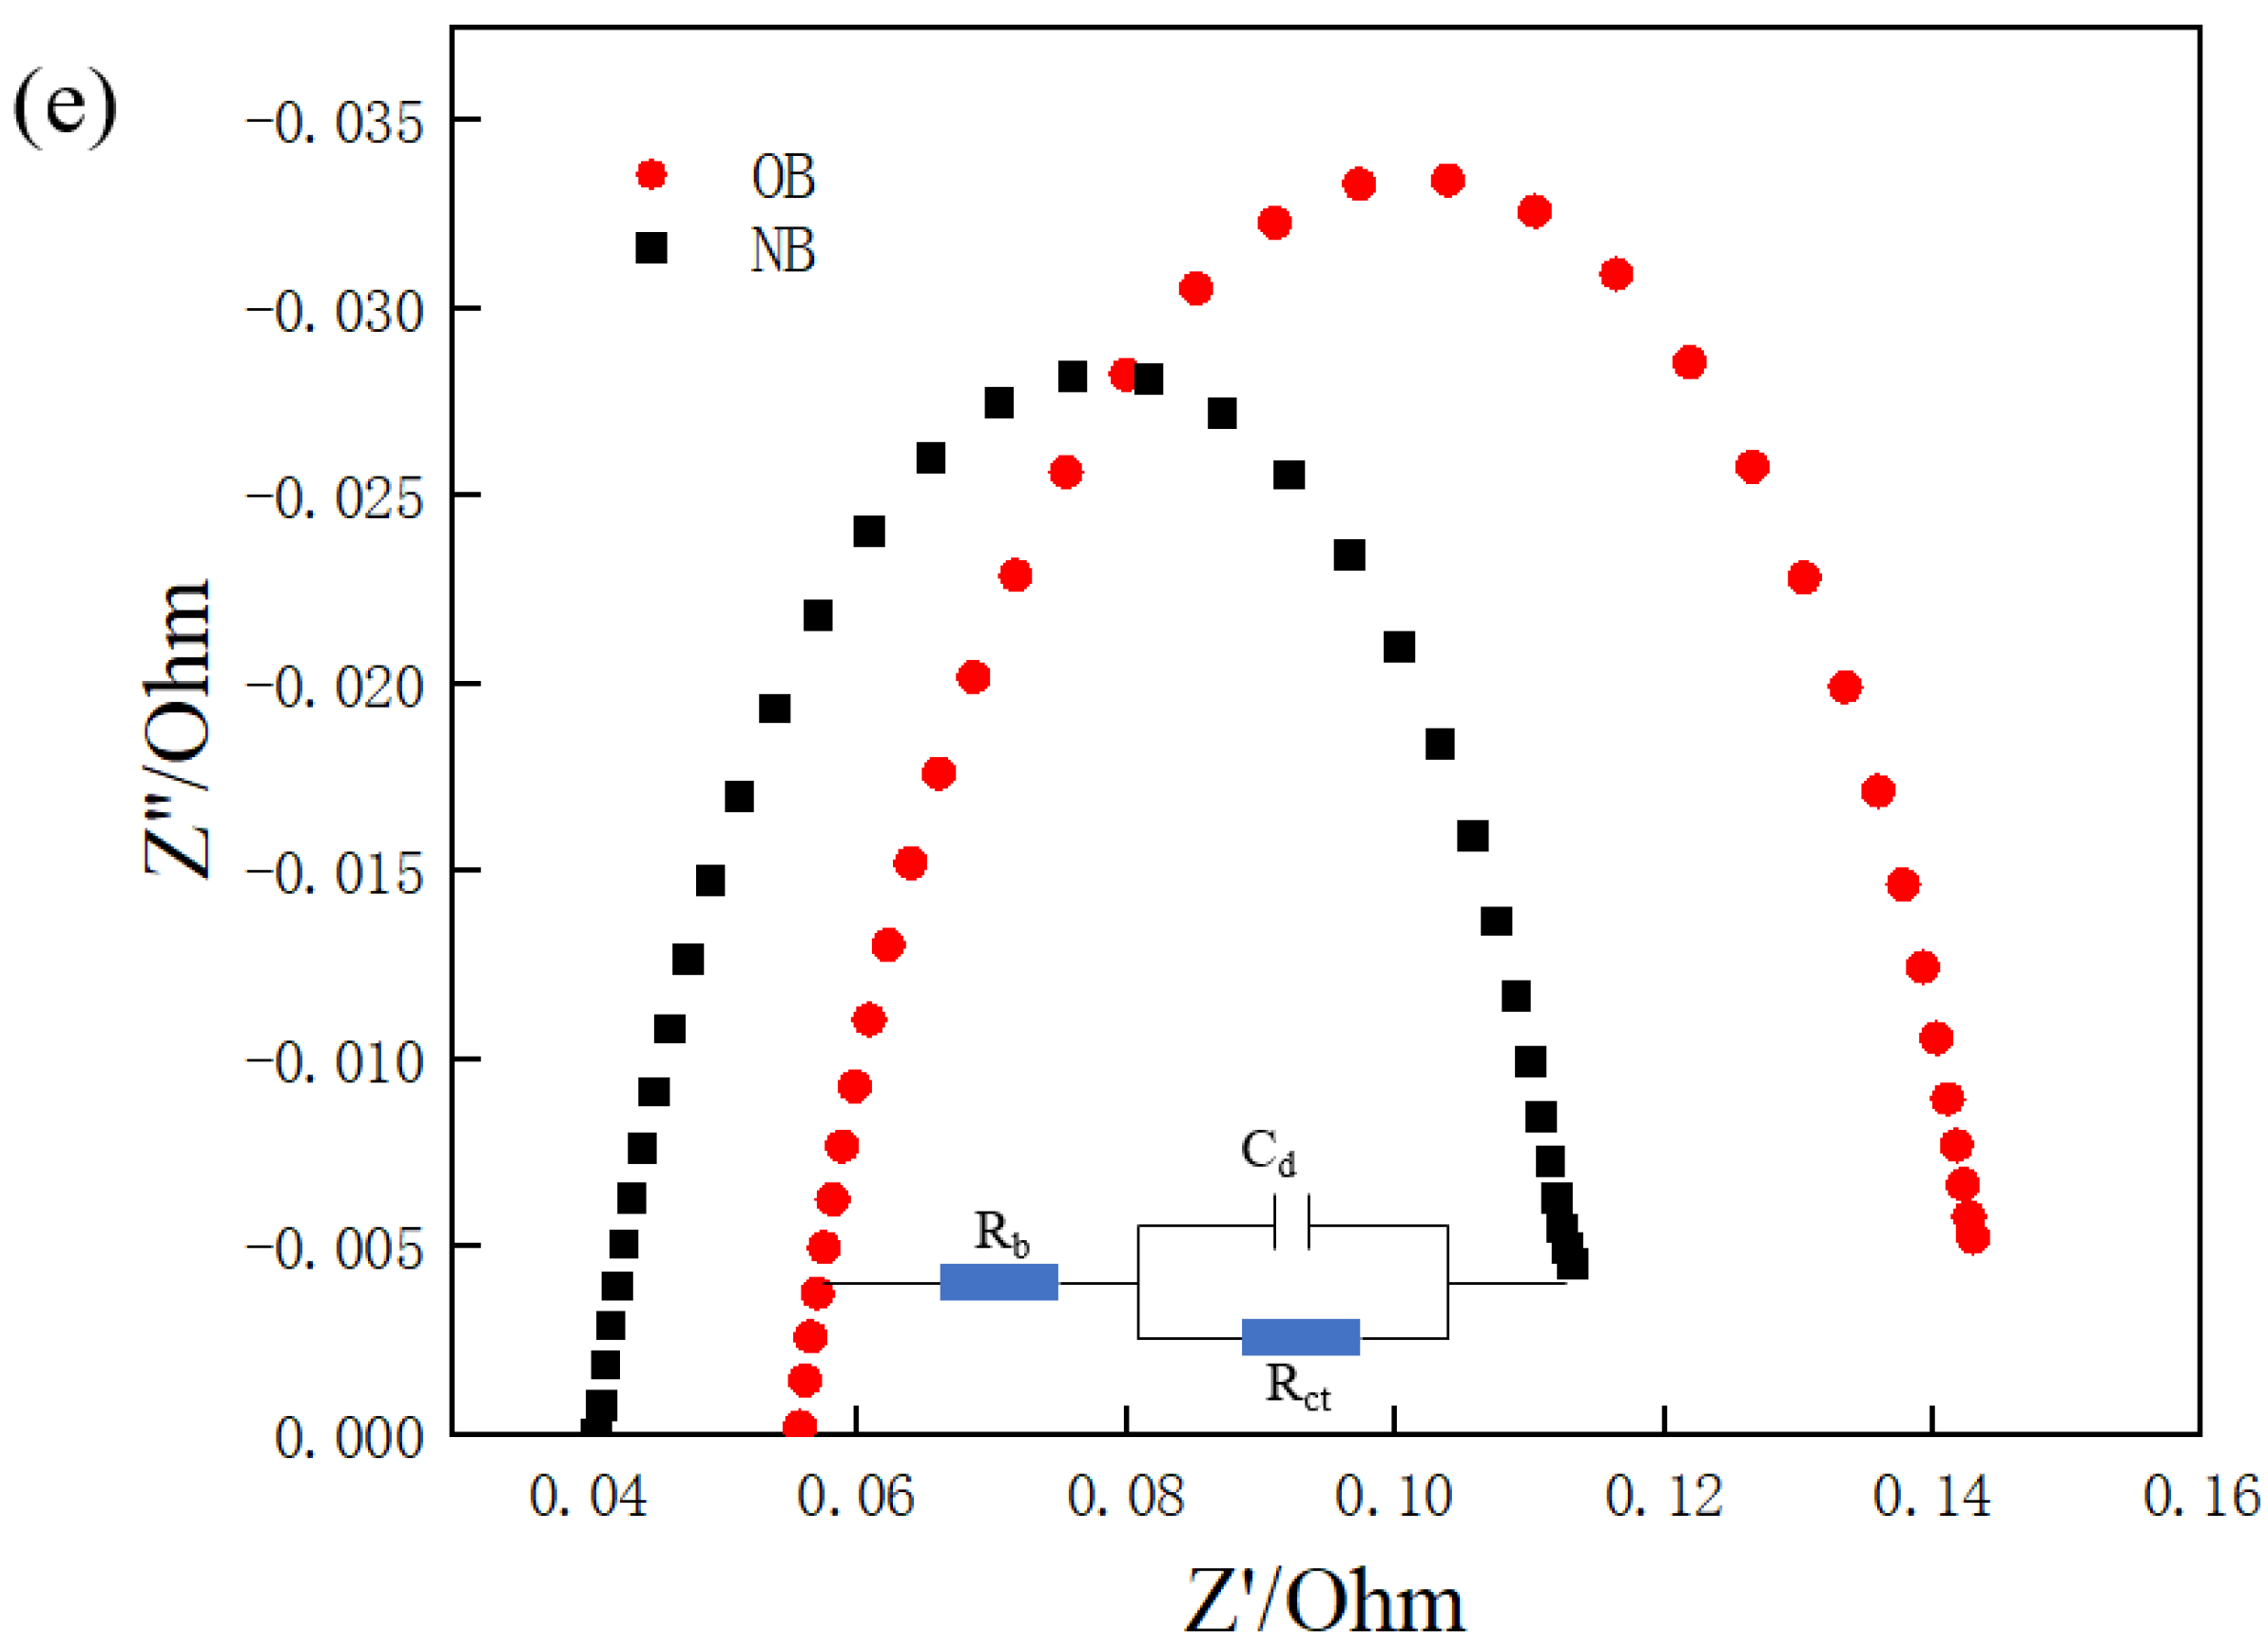
It is widely acknowledged that battery heat generation is closely related to its internal resistance. Therefore, investigating the changes in internal resistance following an overcharge event is of utmost importance [63,64]. Figure 8 provides a comparative analysis of the internal resistance in NB and OB across different SOCs at a constant temperature of 25 °C. The results reveal a substantial increase in the internal resistance of the OB. Specifically, there is an elevation of 46.72 Ω prior to CC discharge (at SOC = 100%), and a further increase of 65.99 Ω post-discharge (at SOC = 0%), relative to the NB. This finding underscores the significant impact of overcharging on the internal resistance of the cell. The improvement of internal resistance can be attributed to irreversible reactions within the negative electrode material induced by overcharging, potentially causing structural modifications in the hard carbon negative electrode (Figures 13 and 14). Such changes can impair the sodium storage capacity of the electrode, subsequently elevating the battery’s internal resistance. Furthermore, overcharging adversely affects the key components of the sodium-ion battery, deteriorating the quality of the electrolyte and reducing electron transport efficiency. These detrimental effects ultimately lead to a decline in electrochemical performance and a notable rise in the direct current (DC) internal resistance of cell.

3.3. EIS Analysis

Figure 9 presents the AC impedance spectra, specifically the Nyquist plots, of NB and OB. Figure 9a–e correspond to the AC impedance spectra of NB and OB at different SOCs levels of 0%, 25%, 50%, 75%, and 100%, respectively, including the equivalent circuit model proposed by Itagaki et al. [65]. This model comprises resistive elements Rb, ZW, RSEI, and Rct, as well as constant phase elements Cd and CSEI. Herein, Rb represents the resistance of the electrolyte and electrical contacts, Rct denotes the charge transfer resistance, RSEI indicates the resistance of the SEI film on the battery, and ZW signifies the Warburg impedance associated with the charge diffusion process.
Figure 9a illustrates the results at SOC = 0%. Compared to NB, OB exhibits higher values for Rb (234.2 mΩ vs. 74.6 mΩ) and Rct (30.1 mΩ vs. 26.38 mΩ). Figure 9b shows the results at SOC = 25%, where OB has higher Rb (62.72 mΩ vs. 43.29 mΩ) and Rct (96.13 mΩ vs. 41.93 mΩ) compared to NB. Figure 9c elucidates the results at SOC = 50%, with OB displaying higher Rb (58.1 mΩ vs. 41.2 mΩ) and Rct (46.17 mΩ vs. 36.05 mΩ) than NB. Similarly, Figure 9d demonstrates the results at SOC = 75%, where OB exhibits higher Rb (55.91 mΩ vs. 40.56 mΩ) and Rct (39.93 mΩ vs. 35.81 mΩ) compared to NB. Figure 9e illustrates the results at SOC = 100%, with OB showing higher Rb (55.75 mΩ vs. 40.67 mΩ) and Rct (33.42 mΩ vs. 28.18 mΩ) than NB. At SOC = 100%, it is evident that the Warburg impedance, ZW, is almost absent in the EIS. This might be attributed to the relatively high ion concentration within the cell at SOC = 100%, which can facilitate faster diffusion of sodium ions in the electrode materials, thereby rendering the Warburg impedance less prominent.
Overall, the results indicate that overcharging abuse leads to an increase in the AC impedance of the battery. The primary reason for the increase in Rb is surface corrosion and damage to the battery current collector. A minor increase in RSEI may relate to excessive reactions between sodium ions and the electrolyte induced by overcharging. The reduction in the number of battery particles available for intercalation and deintercalation, caused by overcharging, results in an increase in Rct. This increase in resistance leads to enhanced heat generation in OB. Although electrolyte oxidation may contribute to partial capacity loss, the magnitude of the RSEI increase is an order of magnitude lower than that of Rct, indicating its impact is significantly less than other factors. Furthermore, the larger arc radius observed in the high-frequency region of the impedance spectra for OB compared to NB indicates an increase in charge transfer resistance, which adversely affects the electrochemical performance of OB. The variations in EIS parameters—such as increased Rct and elevated Rb—indicate that overcharging not only intensifies corrosion on the current collectors of electrode sheets but also alters ion diffusion behavior. Combined with the observed electrode material delamination and structural collapse (Figures 13 and 14) in SEM images, these findings collectively reveal the microscopic origins of degradation caused by overcharging.

3.4. Analysis of Heat Generation Behavior

To investigate the impact of overcharging on heat generation in power battery cells and to elucidate the underlying heat generation mechanism during discharge, both NB and OB were subjected to CC discharge at rates of 0.25, 0.5, and 1 C under controlled temperatures of 25 °C and 40 °C. The resulting maximum temperatures and temperature differences are illustrated in Figure 10 and Figure 11, respectively. Figure 10 illustrates the variations in the maximum temperature and peak temperature difference during CC discharge at different rates at 25 °C for NB and OB. Specifically, Figure 10a reveals that at 25 °C, the peak temperatures for both cell types increase with higher discharge rates and prolongs discharge times. Notably, the peak temperature of OB consistently surpasses that of NB at each discharge rate. At the maximum discharge current of 1 C, the peak temperature of OB reaches 31.79 °C, representing a 5.6% increase relative to the peak temperature of NB. Furthermore, Figure 10b shows that the peak temperature differences for OB at discharge rates of 0.25, 0.5, and 1 C are 1.61 °C, 2.71 °C, and 6.29 °C, respectively. These values correspond to increases of 0.9 °C, 0.66 °C, and 1.67 °C compared to NB at the same discharge rates. The ΔTmax of 6.29 °C represents an extreme case under abuse. Conservative BMS designs could consider activating cooling at 40% of this value (i.e., >2.5 °C), pending validation in practical applications. It is found that as the discharge rate increases, the temperature disparity between OB and NB becomes more pronounced.
To delve deeper into the impact of overcharging on heat generation in sodium-ion batteries at elevated temperatures, experiments were conducted on two types of battery cells, denoted NB and OB, at a controlled temperature of 40 °C with various discharge rates. The experimental results, presented in Figure 11, detail the variations in maximum temperature and maximum temperature difference during CC discharge at discharge rates of 0.25, 0.5, and 1.0 C for both NB and OB cells under environmental conditions of 40 °C. Based on Figure 11a,b, the peak temperature and peak temperature difference of OB consistently exceed those of NB throughout the discharge process. Specifically, at the maximum discharge rate of 1 C, OB reaches peak temperatures of 43.42 °C and a maximum temperature difference of 3.03 °C, surpassing NB by 0.99 °C and 0.4 °C, respectively. This increase can be attributed to irreversible damage to the positive and negative electrode materials and the decomposition of active materials and electrolytes caused by overcharging misuse. These variations in temperature lead to a reduction in the thermal stability of the battery, resulting in a higher discharge temperature. Hence, overcharging intensifies heat generation and temperature inconsistency in power battery cells, significantly degrading electrochemical performance and increasing the risk of thermal runaway [66].
To quantitatively assess the thermal hazard induced by overcharging, the heat generation rate (Q)(W/g) during discharge for both NB and OB at 25 °C was calculated using Equation (5) [19,34] based on temperature rise data (Figure 10a) and cell mass (Table 1).
Q = m C p T t
Here, m = 37 g (Table 1);
Cp = 1.2 J/g·K (typical specific heat capacity for Na-ion batteries, ref. Velumani et al. [19]);
ΔT and t are extracted from 1C discharge data in Figure 10a;
NB: ΔT = 5.09 °C (30.09 − 25 °C), t = 3477 s,OB: ΔT = 6.79 °C (31.79 − 25 °C), t = 3329 s.
Based on Equation (5), the calculated heat generation rates are 0.065 W/g for NB and 0.091 W/g for OB. Overcharging causes a 40% increase in the average heat generation rate. This result forms a mechanistic correlation.

3.5. Appearance and Morphology of Electrode Materials

The experiments aim to investigate the macroscopic thermal-electrochemical characteristics of NB and OB under various conditions. To gain deeper insights into the effects of overcharging on the microstructure of electrode materials within the cells, NB and OB cells with 0% SOC were disassembled in a helium-filled glove box. Figure 12 presents the appearance and morphology of the disassembled electrode sheets, highlighting substantial alterations in the surface active materials following overcharging. A comparison of the cathodes (Figure 12a,b) of NB and OB cells reveals that the cathode material in NB remains well-ordered, uniformly smooth, and firmly adhered to the electrode sheet, with no discernible changes. In contrast, the OB cathode exhibits evident detachment between the surface active material and the electrode sheet, accompanied by areas where the material has separated. Regarding the anodes, the anode in NB (Figure 12c) features a uniform coating of hard carbon on the copper current collector, with no signs of detachment or damage. However, the anode in OB (Figure 12d) displays severe detachment of hard carbon material over a large area, along with significant structural collapse of the hard carbon, particularly at the core and edges of the copper foil. This observation suggests that overcharging induces more severe and irreversible damage to the anode material structure. The observed electrode sheet morphology is consistent with previous macroscopic findings. Overcharging abuse causes extensive damage to both cathode and anode structures within the battery cells, impeding sodium ion migration between the positive and negative electrodes. This damage markedly degrades the electrochemical performance of the cells. Additionally, normal electrochemical reactions in the sodium-ion battery cells are disrupted, leading to increased side reactions that generate excess heat and abnormal temperature rises. These issues exacerbate the safety risks associated with power battery cells in practical applications.

3.6. Microscopic Morphology of Electrode Materials

SEM was employed to conduct microscopic scanning of the active materials on the collectors. Figure 13 illustrates the microstructures of the cathode and anode materials for both NB and OB. Observations indicate that the materials in NB (Figure 13a,c) exhibit a uniform and densely packed arrangement with minimal interstitial gaps between the conductive substances. On the contrary, the microscopic analysis of OB materials (yellow-marked regions in Figure 13b,d) reveals the presence of spherical agglomerates in certain regions. The overall material arrangement is relatively loose, resulting in larger interstitial spaces. This agglomeration of electrode materials furtherly hinders the migration of sodium ions and the diffusion of electrolytes, thereby reducing the cell storage capacity and increasing heat generation. The structural damage to the electrode materials caused by overcharging also degrades their sodium storage performance [67]. Consequently, overcharging distorts the distribution of active substances within the electrode materials, leading to a decline in the electrochemical performance of OB and an intensification of thermal reactions.

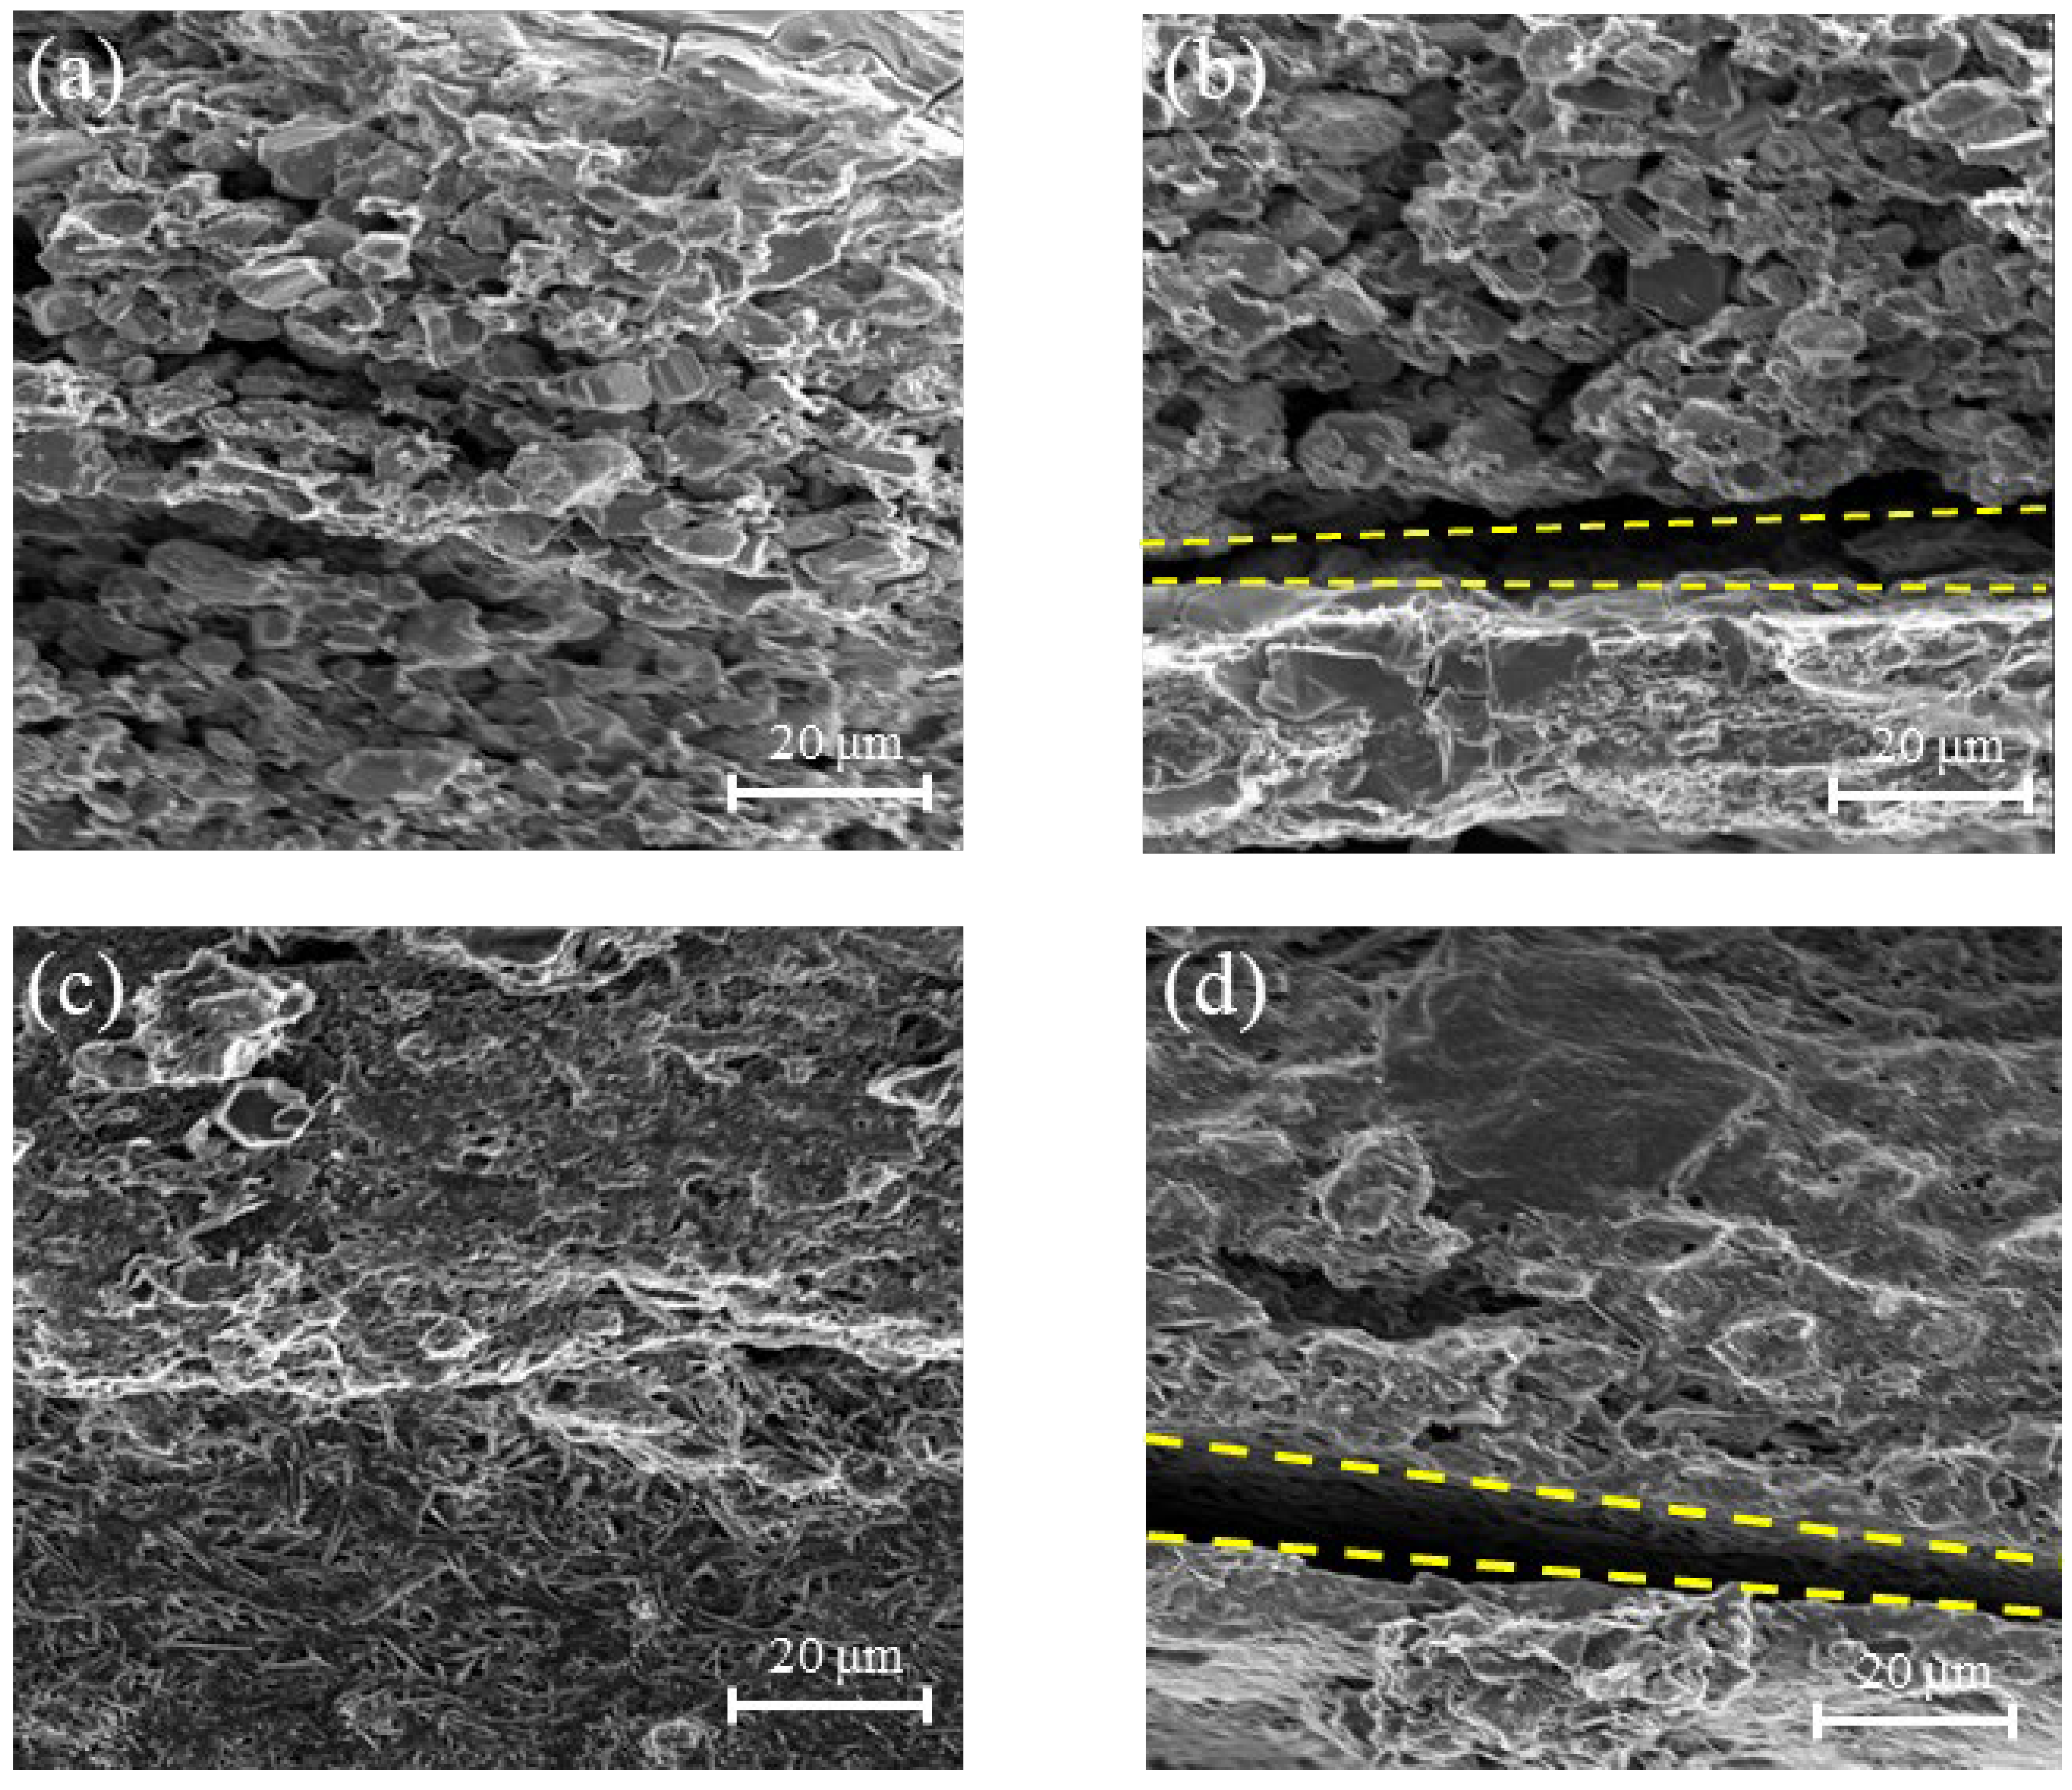
3.7. Microscopic Morphology of Electrode Sheet Cross-Sections

Electron microscope imaging was conducted on cross-sections of both the positive and negative electrode sheets for NB and OB, with the results presented in Figure 14. Figure 14a demonstrates that the surface active materials on the cross-section of the NB cathode electrode sheet are uniformly distributed, densely packed, and exhibit strong adhesion to the electrode sheet. In stark contrast, the yellow-marked region in Figure 14b describes significant detachment and a less dense structure of the surface active materials on the cross-section of the OB cathode electrode sheet. Microscopic examination of the hard carbon anode material indicates even more pronounced damage. Specifically, Figure 14c presents that the surface active materials on the cross-section of the NB anode are tightly and uniformly distributed. However, the yellow-marked region in Figure 14d displays a more severe separation of active materials in the OB anode compared to the cathode, with a disordered and chaotic structural distribution. These findings indicate that overcharging induces significant and irreversible damage to the electrode material structure of the cell, impairing the reversible insertion and extraction of sodium ions. Furthermore, the detachment of active materials from the electrode sheet disrupts electrolyte diffusion, resulting in a substantial decline in the electrochemical performance of OB cells.

3.8. XRD Patterns of Electrode Materials

XRD analysis was performed on the active materials of both the positive and negative electrodes of NB and OB cells using a Rigaku D/max-2550 XRD instrument (Rigaku Corporation, Akishima, Tokyo, Japan). The results, presented in Figure 15a,b, reveal a nearly identical alignment of characteristic peaks for both cathodes and anodes. Specifically, the cathode peaks for NB and OB are observed at 2θ values of 15.66°, 31.88°, 36.06°, 37.18°, 45.08°, 52.76°, 57.18°, 64.18°, and 66.8°, while the anode peaks are detected at 2θ = 23.38° and 43.46° for both samples. During the scanning process, no shifts in the characteristic peaks or the presence of impurity peaks are detected. However, it is noteworthy that the intensity of the main characteristic peaks for OB exhibits a slight decrease after overcharging. This decrease indicates a reduction in the crystallinity of the electrode active material under these conditions [68]. Consequently, the hindered insertion and extraction of sodium ions lead to a reduction in storage capacity.

4. Conclusions and Outlooks

This study documented the concurrent deterioration of electrochemical performance and excessive heat generation in 18,650 sodium-ion battery cells subjected to overcharge conditions. The investigation encompassed both macroscopic thermal-electrical characteristics and microstructural analyses. Key parameters, such as discharge voltage plateaus, DC internal resistance, AC impedance, and temperature, were measured under ambient conditions of 25 °C and 40 °C to evaluate the thermal behavior of NB and OB cells and the impact of overcharging on their electrochemical performance.
Following these measurements, the battery cells were dissected, and SEM and XRD techniques were employed to examine the microstructure and morphology of the active materials on the electrode sheets at a microscopic level. The underlying causes of performance degradation in power battery cells due to overcharging were successfully identified. The primary conclusions are drawn as follows:
(1)
At 25 °C, OB cells exhibited a 2.81% reduction in discharge time compared to NB cells at a discharge rate of 0.25 C, with a corresponding discharge capacity of 1.064 Ah. At a discharge rate of 0.5 C, the discharge time of OB decreased by 5.38%, accompanied by a discharge capacity of 1.012 Ah. Furthermore, at a discharge rate of 1 C, the discharge time of OB decreased by 4.26%, with a discharge capacity of 1.062 Ah. When the temperature was elevated to 40 °C, the OB discharge time decreased by 3.17% at a discharge rate of 0.25 C, with a discharge capacity of 1.154 Ah. At a discharge rate of 0.5 C, the OB discharge time decreased by 3.27%, with a discharge capacity of 1.131 Ah. Lastly, at a discharge rate of 1 C, the discharge time of OB was decreased by 5.47%, with a discharge capacity of 1.082 Ah. After the same charging procedure, the internal resistance of OB increased by 46.72 Ω before CC discharge (SOC = 100%) and by 65.99 Ω after discharge (SOC = 0%), compared to NB. The macroscopic thermal-electrical characteristic data of NB and OB cells indicated that overcharging significantly diminished both battery charge–discharge time and discharge capacity. Higher discharge rates exacerbated these reductions, resulting in more pronounced declines. Additionally, overcharging elevated battery internal resistance and AC impedance, further deteriorating the charge–discharge capacity and shortening the cell’s service life.
(2)
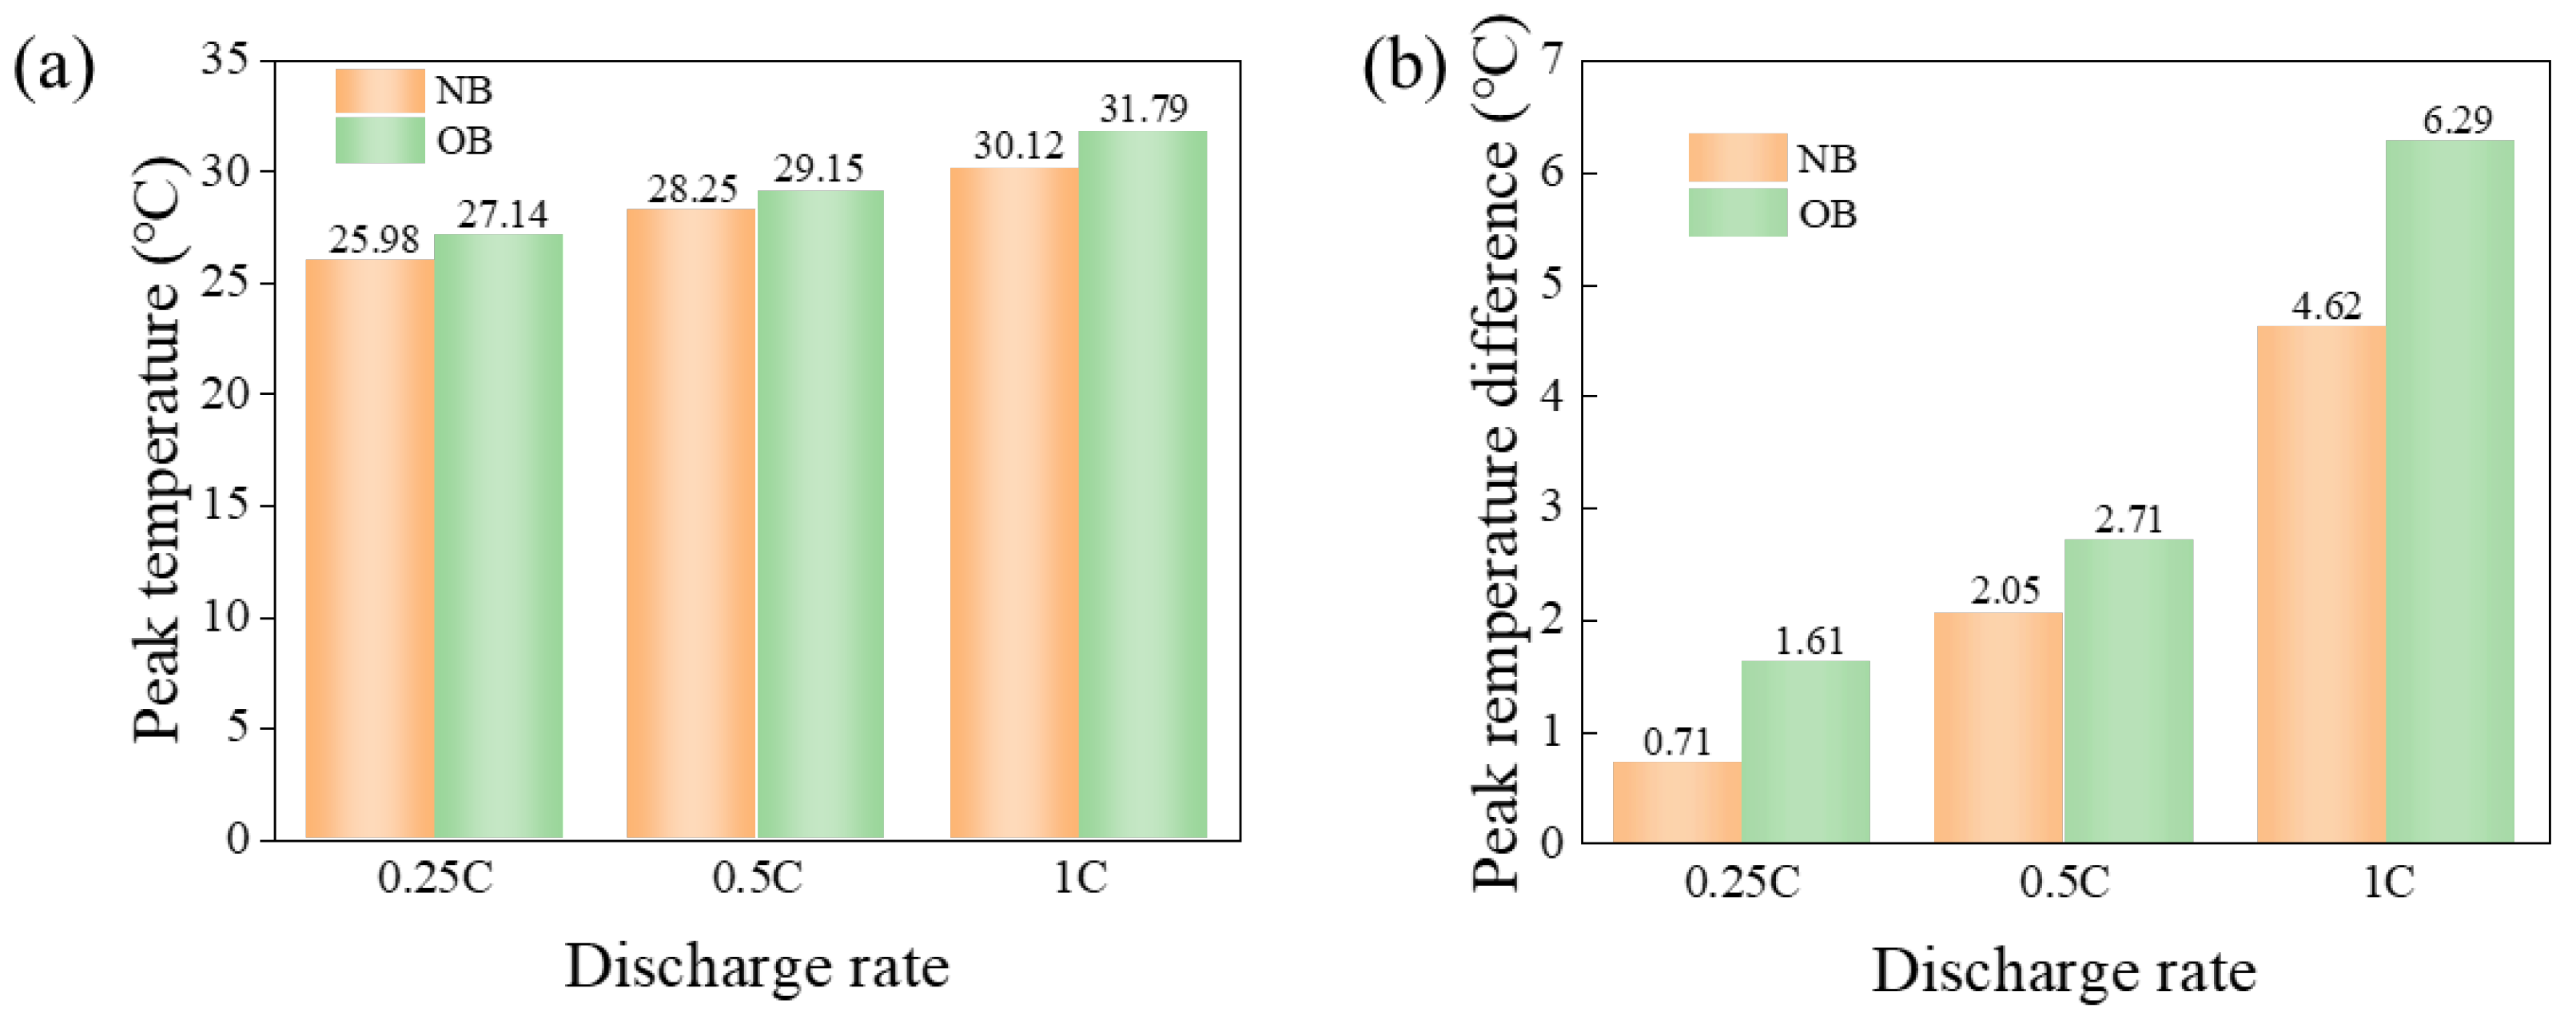
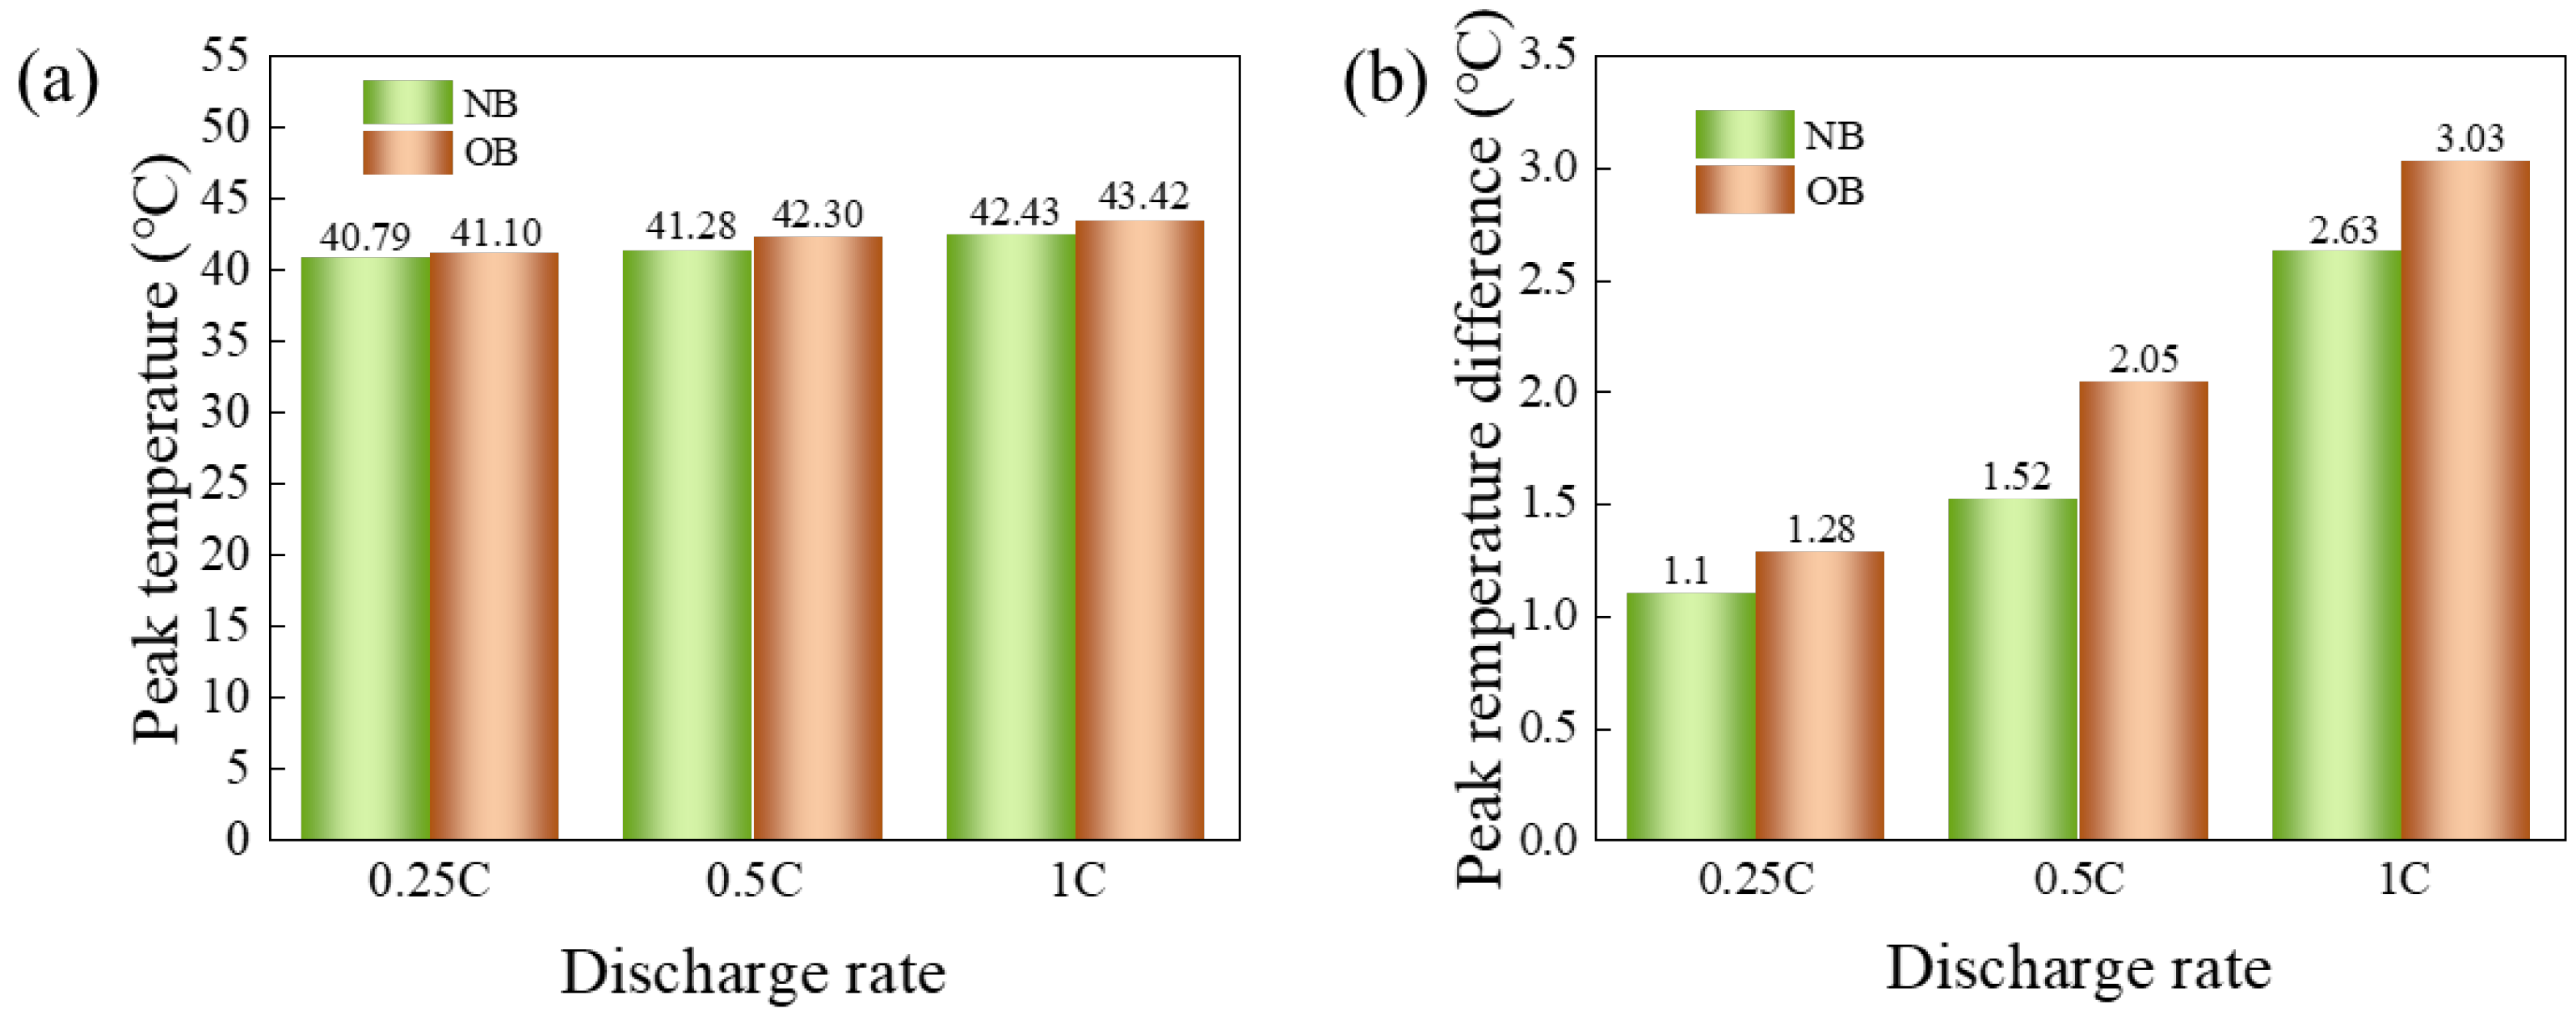
At an ambient temperature of 25 °C, the OB exhibited peak temperature differences of 1.61 °C, 2.71 °C, and 6.29 °C at discharge rates of 0.25 C, 0.5 C, and 1 C, respectively. These values represented increases of 0.9 °C, 0.66 °C, and 1.67 °C compared to the NB under the same conditions. At the maximum discharge rate of 1 C, the OB peak temperature reached 31.79 °C, which was 5.6% higher than that of the NB. When the ambient temperature rose to 40 °C and the discharge rate was maintained at 1 C, the peak temperature and temperature difference of OB were 43.42 °C and 3.03 °C, respectively, exceeding those of the NB by 0.99 °C and 0.4 °C. These results suggested that overcharging exacerbated heat generation and temperature variability within the power battery cell, leading to a significant deterioration in electrochemical performance. Overcharge abuse promoted heat generation and accelerated temperature rise within the battery cell, increasing the risk of thermal runaway and potential safety hazards.
(3)
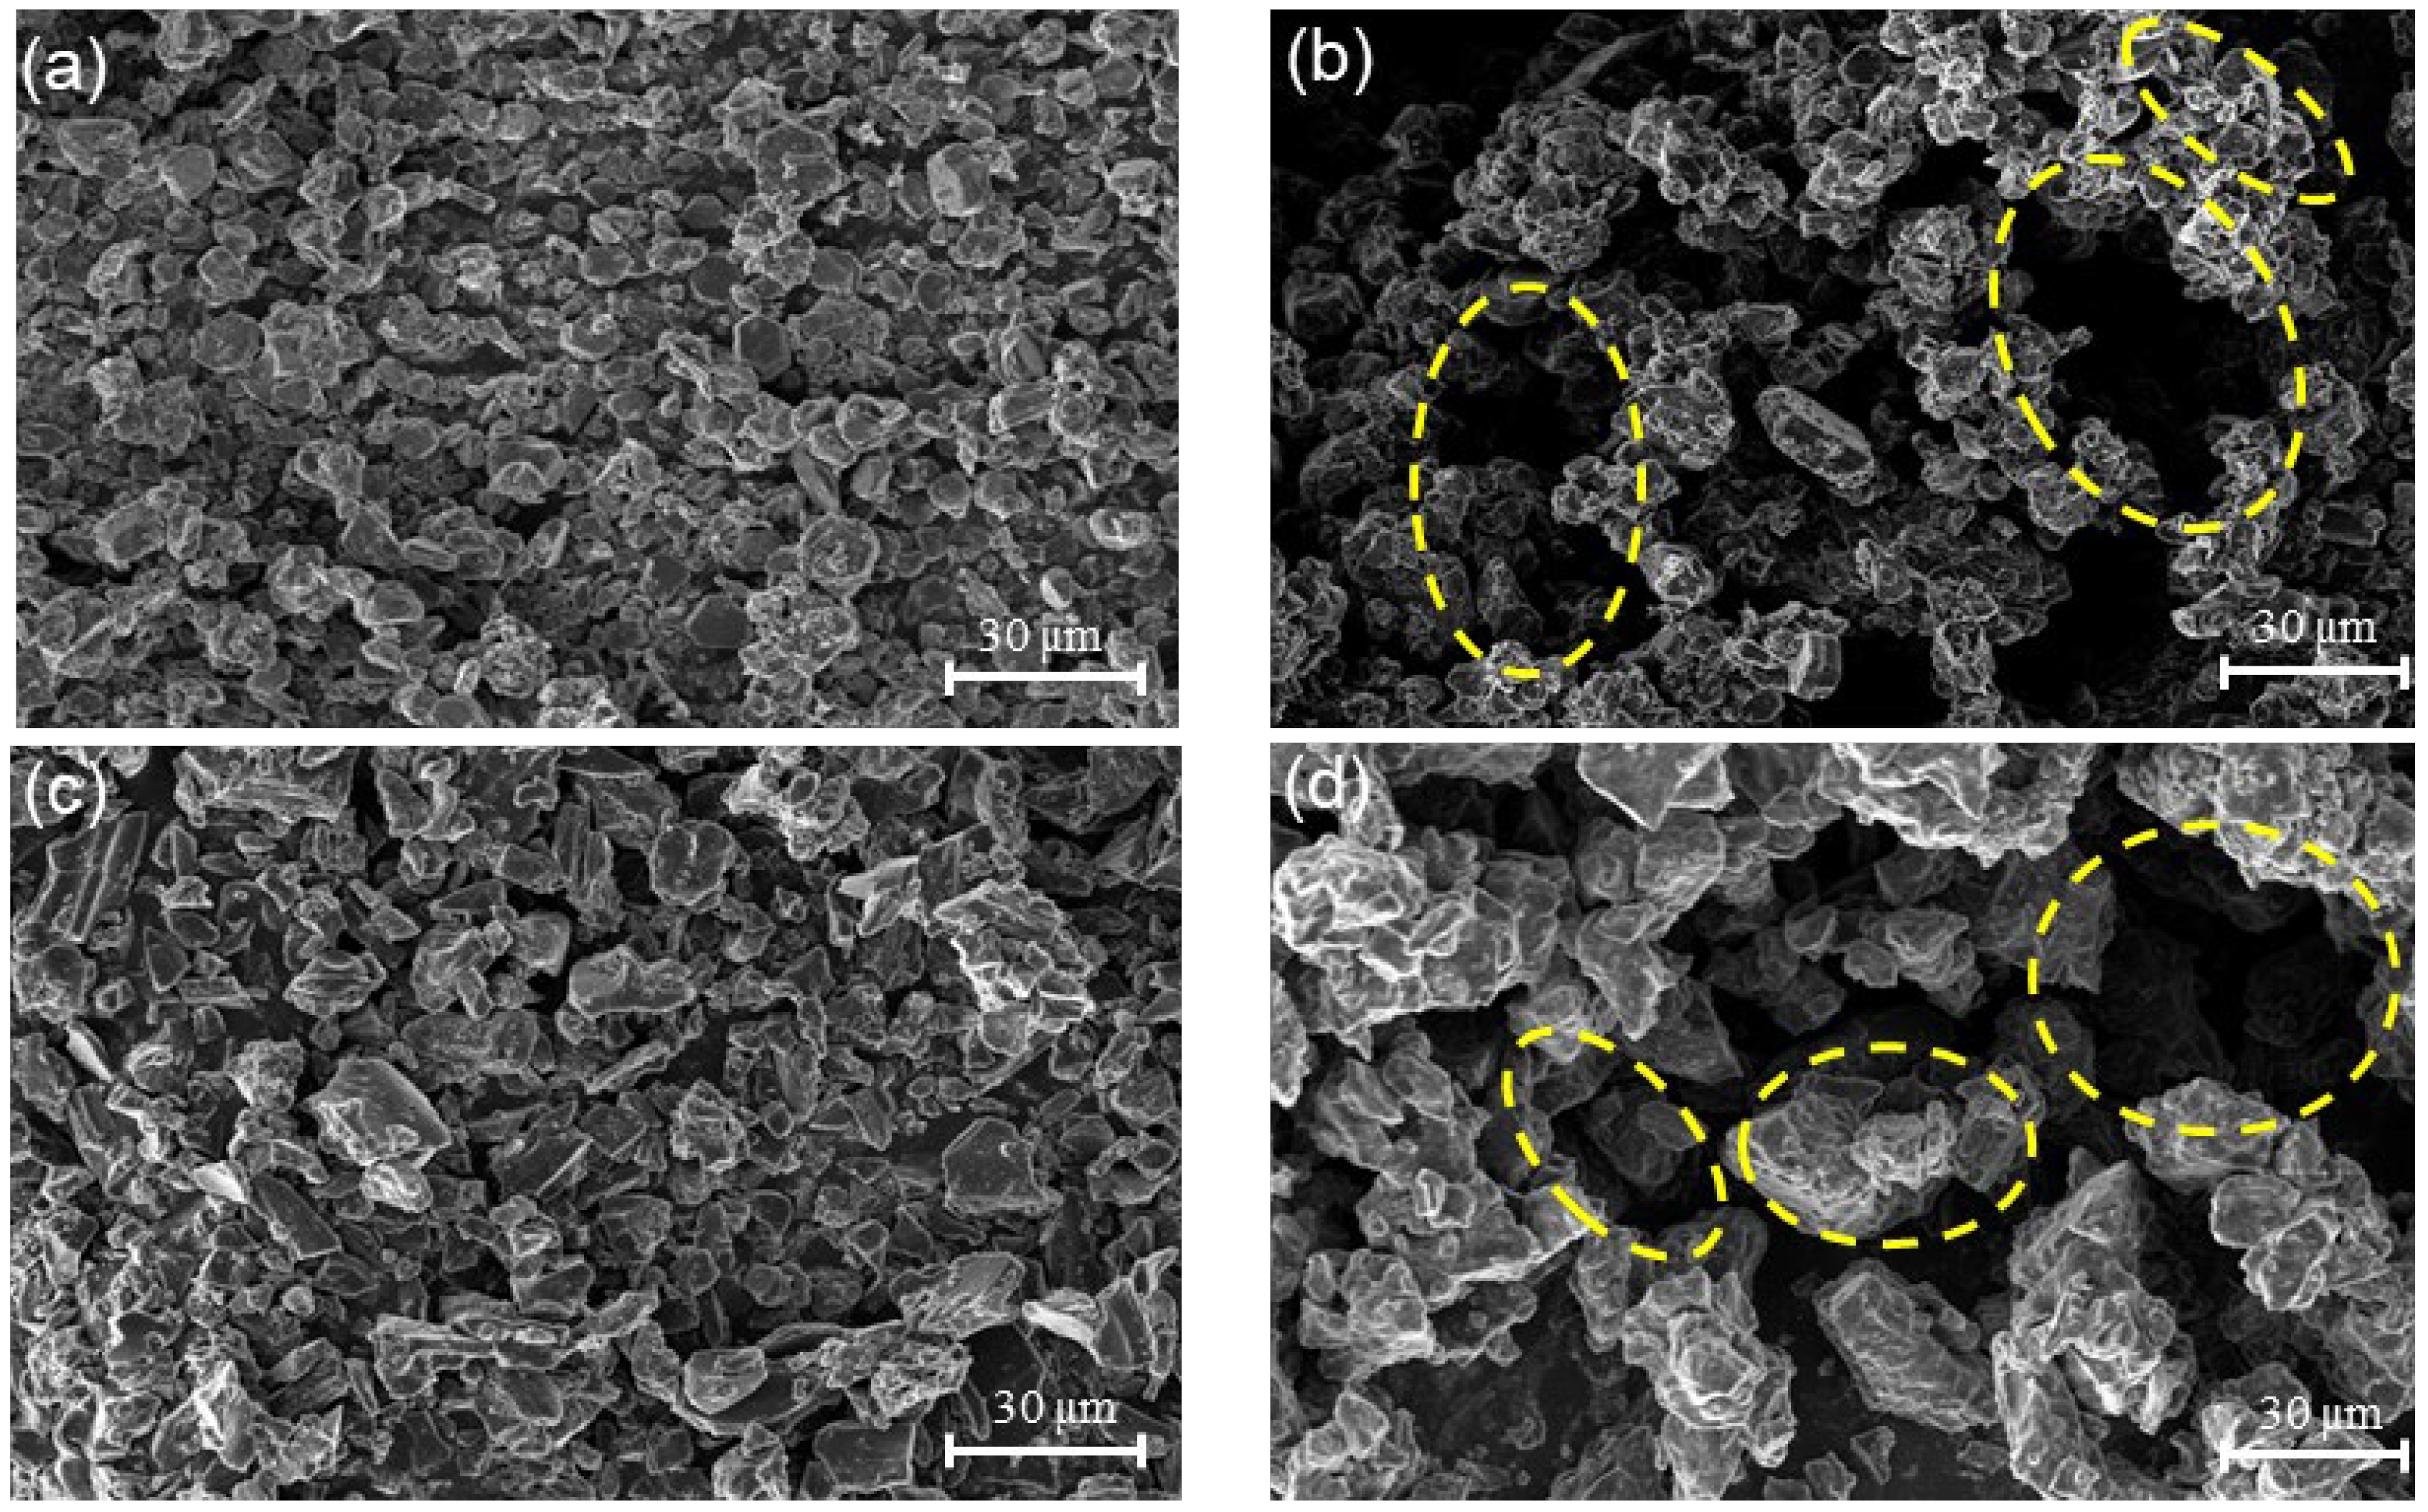
Microscopic examination of the NB and OB revealed that the primary cause of the electrochemical performance decline following overcharging was the degradation of the electrode material structure. This structural damage impeded sodium ion migration between the positive and negative electrodes, further reducing discharge capacity. Additionally, overcharging disrupted the normal electrochemical reactions within the battery, promoting side reactions. These side reactions generated substantial heat and cause abnormal temperature elevations, posing significant safety risks in practical applications.
(4)
Consequently, in the actual application of sodium-ion batteries, we should try to avoid subjecting the battery to a variety of abuse conditions (including electrical abuse, thermal abuse and mechanical abuse). Electric abuse includes overcharge, overdischarge, internal short circuit, and so on. In particular, overcharging is the most common electrical abuse. It is necessary to conduct real-time monitoring and monitoring of battery operating state parameters (current, voltage, temperature), that is, the normal and effective operation of the battery management system.
This research established a foundational understanding of the degradation mechanism of 18,650 sodium-ion batteries under overcharge conditions, providing invaluable insights that could guide the optimization of electrode materials and the enhancement of battery thermal management systems. Frankly speaking, this thesis has not delved too deeply into gas evolution and potential safety risks. This is a limitation of this thesis and also a key focus area for our future research and next paper.
Currently, sodium-ion battery energy storage technology remains in the research and development stage, primarily focused on developing high-performance and high-safety systems. Future advancements in sodium-ion battery technology will target breakthroughs in critical technologies, such as battery systems, to design and produce battery cells that provide high safety, high discharge rates, and operation across wide temperature ranges, thereby fulfilling the needs of large-scale energy storage applications. Moving forward, we aim to focus on conducting more comprehensive research on sodium-ion battery systems, aiming to strengthen the theoretical foundation for the safety design of sodium-ion battery materials and the development of effective thermal management systems, which are described as follows:
(1)
This study examines the electrochemical characteristics and changes in the internal material structure of sodium-ion battery cells subjected to overcharging within the electrical abuse scale. Future studies will include the development of testing platforms for mechanical and thermal abuse to evaluate sodium-ion batteries from various abuse perspectives.
(2)
Large format batteries are becoming the mainstream trend in the energy storage field and demonstrate totally different characteristics compared with small size cells. Future research will extend to large-scale sodium-ion battery cells.
(3)
This research analyzes sodium-ion battery cells using experimental testing methods supported by relevant theories. The parameter thresholds identified herein serve as preliminary references for BMS design. Their robustness must be rigorously tested in future module prototypes accounting for cell-to-cell variations and aging effects.
(4)
This paper focuses on commercial 18650-type sodium-ion battery cells. Future research will expand to include sodium-ion batteries of various geometries and large-scale battery modules. Comprehensive testing at the module level will be conducted, and a range of battery thermal management solutions will be developed to improve safety, particularly in temperature uniformity and control, for OB modules.
(5)
Future research will focus on applying machine learning and neural network models to predict sodium-ion battery life, surface temperature, SOC, and state of health. Future research will integrate image statistics and pore analysis to establish a quantitative model between structural parameters and performance degradation. These advancements will play a crucial role in developing battery management systems.
(6)
For future studies on 18,650 modules, gas composition analysis using gas chromatography–mass spectrometry (GC–MS) will be implemented. Built-in sensors will measure the rising gas pressure during overcharging to quantify correlations between SOC overages (>110%) and gas species (e.g., CO2, H2).

Author Contributions

Investigation, R.Z.; Resources, M.N., G.Z., T.H., X.W., Y.W., N.X. and X.L.; Writing—review & editing, J.Z., R.Z., F.D. and M.N.; Supervision, J.Z., F.D. and G.Z.; Funding acquisition, J.Z. All authors have read and agreed to the published version of the manuscript.

Funding

This research was financially supported by Major Science and Technology Project in Dongguan (20231200300022), Science and Technology Project of Guangdong Administration for Market Regulation (2023ZZ06, 2024CZ08), and Science and Technology Plan Project in the Field of Social Development of Zhuhai City (2420004000156).

Data Availability Statement

The research data can be provided upon request.

Conflicts of Interest

Authors Xiaoyong Wang and Yuliang Wen were employed by the company Dongguan Guixiang Insulation Material Co., Ltd. Authors Ning Xu and Xin Liu were employed by the company Guangdong Greenway Technology Co., Ltd. The remaining authors declare that the research was conducted in the absence of any commercial or financial relationships that could be construed as a potential conflict of interest.

Nomenclature

ACAlternating current
CCConstant current
CVConstant voltage
CThe ratio of the rate at which a battery discharges per unit time to its rated capacity
CdDouble layer capacitance
CnNominal capacity
CSEISolid electrolyte interphase capacitance
DCDirect current
DnDischarge capacity
EISElectrochemical impedance spectroscopy
ICurrent
LFPLiFePO4
NBsNormal batteries
NTMNaxTMO2
NTPNaTi2(PO4)3
NCMLi(Ni0.5Co0.2Mn0.3)O2
NCNitrogen-doped carbon
OBsOvercharged batteries
PDMSPolydimethylsiloxane copolymer
PVDF-HFPPolyvinylidene fluoride-co-hexafluoropropylene
RSEISolid electrolyte interphase resistance
RResistance
RbSolution resistance
RctCharge transfer resistance
SEMScanning electron microscope
SDStandard deviation
SEISolid electrolyte interface
SOCState of charge
XRDX-ray diffraction analysis
ZwWarburg impedance

References

  1. Appiah-Otoo, I.; Chen, X.D.; Ampah, J.D. Does financial structure affect renewable energy consumption? Evidence from G20 countries. Energy 2023, 272, 127130. [Google Scholar] [CrossRef]
  2. Yang, Y.; Yu, D.D.; Wang, H.; Guo, L. Smart electrochemical energy storage devices with self-protection and self-adaptation abilities. Adv. Mater. 2017, 29, 1703040. [Google Scholar] [CrossRef] [PubMed]
  3. Shi, C.M.; Wang, T.Y.; Liao, X.B.; Qie, B.Y.; Yang, P.F.; Chen, M.J.; Wng, X.; Srinivasan, A.; Cheng, Q.; Ye, Q.; et al. Accordion-like stretchable Li-ion batteries with high energy density. Energy Storage Mater. 2019, 17, 136–142. [Google Scholar] [CrossRef]
  4. Usiskin, R.; Lu, Y.X.; Popovic, J.; Law, M.; Balaya, P.; Hu, Y.S.; Maier, J. Fundamentals, status and promise of sodium-based batteries. Nat. Rev. Mater. 2021, 6, 1020–1035. [Google Scholar] [CrossRef]
  5. Palomares, V.; Serras, P.; Villaluenga, I.; Hueso, K.B.; Carretero-González, J.; Rojo, T. Na-ion batteries, recent advances and present challenges to become low cost energy storage systems. Energy Environ. Sci. 2012, 5, 5884–5901. [Google Scholar] [CrossRef]
  6. Ramasubramanian, B.; Ling, J.; Jose, R.; Ramakrishna, S. Ten major challenges for sustainable lithium-ion batteries. Cell Rep. Phys. Sci. 2024, 5, 102032. [Google Scholar] [CrossRef]
  7. Sirengo, K.; Babu, A.; Brennan, B.; Pillai, S.C. Ionic liquid electrolytes for sodium-ion batteries to control thermal runaway. J. Energy Chem. 2023, 81, 321–338. [Google Scholar] [CrossRef]
  8. Zhao, Q.; Lu, Y.; Chen, J. Advanced organic electrode materials for rechargeable sodium-ion batteries. Adv. Energy Mater. 2017, 7, 1601792. [Google Scholar] [CrossRef]
  9. Wu, H.; Hao, J.N.; Jiang, Y.L.; Jiao, Y.R.; Liu, J.H.; Xu, X.; Davey, K.; Wang, C.S.; Qiao, S.Z. Alkaline-based aqueous sodium-ion batteries for large-scale energy storage. Nat. Commun. 2024, 15, 575. [Google Scholar] [CrossRef]
  10. Cai, X.; Yue, Y.; Yi, Z.; Liu, J.; Sheng, Y.; Lu, Y. Challenges and industrial perspectives on the development of sodium ion batteries. Nano Energy 2024, 129, 110052. [Google Scholar] [CrossRef]
  11. Tarascon, J.M. Na-ion versus li-ion batteries: Complementarity rather than competitiveness. Joule 2020, 4, 1616–1620. [Google Scholar] [CrossRef]
  12. Yabuuchi, N.; Kubota, K.; Dahbi, M.; Komaba, S. Research development on sodium-ion batteries. Chem. Rev. 2014, 114, 11636–11682. [Google Scholar] [CrossRef] [PubMed]
  13. Sharma, R.; Kumar, H.; Kumar, G.; Sharma, S.; Aneja, R.; Sharma, A.K.; Kumar, R.; Kumar, P. Progress and challenges in electrochemical energy storage devices: Fabrication, electrode material, and economic aspects. Chem. Eng. J. 2023, 468, 143706. [Google Scholar] [CrossRef]
  14. Digital Energy Storage Network. “Terra-Gen Investigates Cause of Fire...”. September 2023. Available online: https://desn.com.cn/news/show-2023875.html (accessed on 7 August 2024). (In Chinese).
  15. International Energy Network. “Year-End Review: Top 10...-Idaho Power Substation Fire”. December 2023. Available online: https://www.in-en.com/article/html/energy-2329962.shtml (accessed on 8 August 2024). (In Chinese).
  16. Solarbe Network. “Top 10 International...-Gothenburg Fire Incident”. January 2024. Available online: https://cn.solarbe.com/news/20240103/84105.html (accessed on 2 September 2024). (In Chinese).
  17. Wang, J.; Ruan, L. Cell-to-cell inconsistency analysis and structure optimization for a liquid-cooled cylindrical battery module. Appl. Therm. Eng. 2023, 224, 120021. [Google Scholar] [CrossRef]
  18. Zarrabeitia, M.; Salazar, I.; Acebedo, B.; Muñoz-Márquez, M.Á. Stabilization of p2 layered oxide electrodes in sodium-ion batteries through sodium evaporation. Commun. Mater. 2024, 5, 130. [Google Scholar] [CrossRef]
  19. Velumani, D.; Bansal, A. Thermal behavior of lithium- and sodium-ion batteries: A review on heat generation, battery degradation, thermal runway-perspective and future directions. Energy Fuels 2022, 36, 14000–14029. [Google Scholar] [CrossRef]
  20. Bordes, A.; Marlair, G.; Zantman, A.; Chesnaye, A.; Lore, P.-A.L.; Lecocq, A. Safety evaluation of a sodium-ion cell: Assessment of vent gas emissions under thermal runaway. ACS Energy Lett. 2022, 7, 3386–3391. [Google Scholar] [CrossRef]
  21. Wang, Y.; Ou, R.; Yang, J.; Xin, Y.; Singh, P.; Wu, F.; Qian, Y.; Gao, H. The safety aspect of sodium ion batteries for practical applications. J. Energy Chem. 2024, 95, 407–427. [Google Scholar] [CrossRef]
  22. Wei, T.; Xian, X.L.; Dou, S.X.; Chen, W.; Chou, S.L. Comprehensive analysis and mitigation strategies for safety issues of sodium-ion batteries. Rare Met. 2024, 43, 1343–1349. [Google Scholar] [CrossRef]
  23. Jin, Y.; Le, P.M.L.; Gao, P.; Xu, Y.; Xiao, B.; Engelhard, M.H.; Cao, X.; Vo, T.D.; Hu, J.; Zhong, L.; et al. Low-solvation electrolytes for high-voltage sodium-ion batteries. Nat. Energy 2022, 7, 718–725. [Google Scholar] [CrossRef]
  24. Zhang, L.; Tsolakidou, C.; Mariyappan, S.; Tarascon, J.-M.; Trabesinger, S. Unraveling gas evolution in sodium batteries by online electrochemical mass spectrometry. Energy Storage Mater. 2021, 42, 12–21. [Google Scholar] [CrossRef]
  25. Lu, Z.; Yang, H.; Guo, Y.; He, P.; Wu, S.; Yang, Q.-H.; Zhou, H. Electrolyte sieving chemistry in suppressing gas evolution of sodium-metal batteries. Angew. Chem. Int. Ed. Engl. 2022, 61, e202206340. [Google Scholar] [CrossRef] [PubMed]
  26. Xu, H.; Zhang, G.Q.; Zhang, J.T.; Zhang, J.Y.; Wu, H.W.; Jiang, L.Q.; Jiang, W.Z.; Liu, J.; Peng, K. Comparative analysis of electrochemical properties and thermal behaviors of sodium ion and lithium ion batteries. Int. J. Electrochem. Sci. 2025, 20, 101027. [Google Scholar] [CrossRef]
  27. Cao, J.; Ling, Z.; Lin, S.; He, Y.; Fang, X.; Zhang, Z. Thermochemical heat storage system for preventing battery thermal runaway propagation using sodium acetate trihydrate/expanded graphite. Chem. Eng. J. 2022, 433, 133536. [Google Scholar] [CrossRef]
  28. Xia, X.; Dahn, J.R. Study of the reactivity of na/hard carbon with different solvents and electrolytes. J. Electrochem. Soc. 2012, 159, A515–A519. [Google Scholar] [CrossRef]
  29. Chayambuka, K.; Mulder, G.; Danilov, D.L.; Notten, P.H.L. From li-ion batteries toward na-ion chemistries: Challenges and opportunities. Adv. Energy Mater. 2020, 10, 2001310. [Google Scholar] [CrossRef]
  30. Li, Y.; Hu, Y.-S.; Qi, X.; Rong, X.; Li, H.; Huang, X.; Chen, L. Advanced sodium-ion batteries using superior low cost pyrolyzed anthracite anode: Towards practical applications. Energy Storage Mater. 2016, 5, 191–197. [Google Scholar] [CrossRef]
  31. Xie, Y.; Xu, G.-L.; Che, H.; Wang, H.; Yang, K.; Yang, X.; Guo, F.; Ren, Y.; Chen, Z.; Amine, K.; et al. Probing thermal and chemical stability of naxni1/3fe1/3mn1/3o2 cathode material toward safe sodium-ion batteries. Chem. Mater. 2018, 30, 4909–4918. [Google Scholar] [CrossRef]
  32. Zhao, J.; Zhao, L.; Chihara, K.; Okada, S.; Yamaki, J.-I.; Matsumoto, S.; Kuze, S.; Nakane, K. Electrochemical and thermal properties of hard carbon-type anodes for na-ion batteries. J. Power Sources 2013, 244, 752–757. [Google Scholar] [CrossRef]
  33. Barpanda, P.; Liu, G.; Ling, C.D.; Tamaru, M.; Avdeev, M.; Chung, S.-C.; Yamada, Y.; Yamada, A. Na2FeP2O7: A safe cathode for rechargeable sodium-ion batteries. Chem. Mater. 2013, 25, 3480–3487. [Google Scholar] [CrossRef]
  34. Yue, Y.; Jia, Z.; Li, Y.; Wen, Y.; Lei, Q.; Duan, Q.; Sun, J.; Wang, Q. Thermal runaway hazards comparison between sodium-ion and lithium-ion batteries using accelerating rate calorimetry. Process Saf. Environ. Prot. 2024, 189, 61–70. [Google Scholar] [CrossRef]
  35. Zhang, L.C.; Zhou, Y.; Li, Y.Q.; Ma, W.L.; Wu, P.; Zhu, X.S.; Wei, S.H.; Zhou, Y.M. Achieving in-situ hybridization of NaTi2(PO4)3 and n-doped carbon through a one-pot solid state reaction for high performance sodium-ion batteries. J. Solid State Chem. 2022, 310, 123036. [Google Scholar] [CrossRef]
  36. Kanematsu, S.; Matsumoto, K.; Hagiwara, R. Electrochemically stable fluorohydrogenate ionic liquids based on quaternary phosphonium cations. Electrochem. Commun. 2009, 11, 1312–1315. [Google Scholar] [CrossRef]
  37. Wang, Y.S.; Yu, X.Q.; Xu, S.Y.; Bai, J.M.; Xiao, R.J.; Hu, Y.S.; Li, H.; Yang, X.Q.; Chen, L.Q.; Huang, X.J. Erratum: A zero-strain layered metal oxide as the negative electrode for long-life sodium-ion batteries. Nat. Commun. 2013, 4, 2858. [Google Scholar] [CrossRef]
  38. DeBlock, R.H.; Wei, Q.L.; Ashby, D.S.; Butts, D.M.; Whang, G.J.; Choi, C.S.; Dunn, B.S. Siloxane-modified, silica-based lonogel as a pseudosolid electrolyte for sodium-ion batteries. ACS Appl. Energy Mater. 2021, 4, 154–163. [Google Scholar] [CrossRef]
  39. Sun, H.; Zhu, G.Z.; Xu, X.T.; Liao, M.; Li, Y.Y.; Angell, M.; Gu, M.; Zhu, Y.M.; Hung, W.H.; Li, J.C.; et al. A safe and non-flammable sodium metal battery based on an ionic liquid electrolyte. Nat. Commun. 2019, 10, 3302. [Google Scholar] [CrossRef]
  40. Kim, Y.; Kim, G.T.; Jeong, S.; Dou, X.W.; Geng, C.X.; Kim, Y.; Passerini, S. Large-scale stationary energy storage: Seawater batteries with high rate and reversible performance. Energy Storage Mater. 2019, 16, 56–64. [Google Scholar] [CrossRef]
  41. Zhou, Q.; Li, Y.Q.; Tang, F.; Li, K.X.; Rong, X.H.; Lu, Y.X.; Chen, L.Q.; Hu, Y.S. Thermal stability of high power 26650-type cylindrical na-ion batteries. Chin. Phys. Lett. 2021, 38, 076501. [Google Scholar] [CrossRef]
  42. Feng, J.K.; Ci, L.; Xiong, S.L. Biphenyl as overcharge protection additive for nonaqueous sodium batteries. RSC Adv. 2015, 5, 96649–96652. [Google Scholar] [CrossRef]
  43. Ji, W.X.; Huang, H.; Zhang, X.X.; Zheng, D.; Ding, T.Y.; Lambert, T.H.; Qu, D.Y. A redox-active organic salt for safer na-ion batteries. Nano Energy 2020, 72, 104705. [Google Scholar] [CrossRef]
  44. Deng, Y.Y.; Jin, T.; Li, C.; Zhang, T.; Zhang, W.J.Y.; Cui, S.J.; Shen, C.; Jiao, L.F.; Huang, H.T.; Xie, K.Y. Lattice strengthening enables reversible anionic redox chemistry in sodium-ion batteries. Energy Storage Mater. 2025, 74, 103935. [Google Scholar] [CrossRef]
  45. Kolachi, U.A.; Solangi, N.H.; Sun, Y.Z.; Andavar, R.; Shahid, I.; Zhao, J.J.; Pan, J.Q. Precisely controlling the nanostructure ofbimetallic Mg/Zn MOFs to construct a highperformance material for supercapacitors and sodium-ion batteries. Energy Storage Mater. J. Mater. Chem. A 2025. [Google Scholar] [CrossRef]
  46. Byun, J.; Chang, J.H.; Hwang, C.; Lee, C.R.; Kim, M.; Song, J.H.; Heo, B.; Choi, S.; Han, J.H.; Jeon, H.-J.; et al. Transformative Effect of Li Salt for Proactively Mitigating Interfacial Side Reactions in Sodium-Ion Batteries. Nano-Micro Lett. 2025, 17, 226. [Google Scholar] [CrossRef] [PubMed]
  47. Yang, C.; Xin, S.; Mai, L.; You, Y. Materials design for high-safety sodium-ion battery. Adv. Energy Mater. 2021, 11, 2000974. [Google Scholar] [CrossRef]
  48. Ji, C.W.; Zhang, S.Q.; Wang, B.; Sun, J.J.; Zhang, Z.Z.; Liu, Y.Y. Study on thermal safety of the overcharged lithium-ion battery. Fire Technol. 2023, 59, 1089–1114. [Google Scholar] [CrossRef]
  49. Lv, Y.F.; Geng, X.W.; Luo, W.M.; Chu, T.Y.; Li, H.N.; Liu, D.F.; Cheng, H.; Chen, J.; He, X.; Li, C.C. Review on influence factors and prevention control technologies of lithium-ion battery energy storage safety. J. Energy Storage 2023, 72, 108389. [Google Scholar] [CrossRef]
  50. Song, Y.H.; Lyu, N.; Shi, S.; Jiang, X.; Jin, Y. Safety warning for lithium-ion batteries by module-space air-pressure variation under thermal runaway conditions. J. Energy Storage 2022, 56, 105911. [Google Scholar] [CrossRef]
  51. Gui, Q.H.; Xu, B.; Yu, K.; Wang, X.Y.; Li, J.Z. Comparison of NaNi1/3Fe1/3Mn1/3O2 and Na4Fe3(PO4)2(P2O7) cathode sodium-ion battery behavior under overcharging induced thermal runaway. Chem. Eng. J. 2024, 497, 154732. [Google Scholar] [CrossRef]
  52. Xu, B.; Li, J.Z.; Xie, Y.G.; Gui, Q.H.; Wu, Q.; Liu, W.L.; Mao, L. Capacity degradation study of NaNi1/3Fe1/3Mn1/3O2 cathode sodium-ion batteries induced by overcharge. J. Power Sources 2024, 623, 235448. [Google Scholar] [CrossRef]
  53. Zakharchenko, T.K.; Nikiforov, D.I.; Serdyukov, G.D.; Komissarov, P.V.; Shkuratov, M.O.; Dzuban, A.V.; Lakienko, G.P.; Gordienko, Y.A.; Yashina, L.V.; Itkis, D.M. cathode materials for sodium-ion batteries Na3V2O2 (PO4) 2F cathodes. Batter. Supercaps 2024, 8, 2566–6223. [Google Scholar] [CrossRef]
  54. Kurzweil, P.; Scheuerpflug, W.; Schell, C.; Schottenbauer, J. Useful quantities and diagram types for diagnosis and monitoring of electrochemical energy converters using impedance spectroscopy: State of the art, review and outlook. Batteries 2024, 10, 177. [Google Scholar] [CrossRef]
  55. He, M.L.; Mejdoubi, A.E.L.; Morcrette, M.; Troendle, P.; Castiglioni, R.; Chartouni, D. High power NVPF/HC-based sodium-ion batteries. J. Power Sources 2023, 588, 233741. [Google Scholar] [CrossRef]
  56. Chen, M.M.; Zhang, W.J.; Chen, C.; Zhang, T.; Zhao, C.; Li, Y.; Wang, H.; Wang, K.H.; Yang, S.C.; Gao, Y.; et al. Breaking boundaries in O3-type NaNi1/3Fe1/3Mn1/3O2 Lattice strengthening enables reversible anionic: An industrially scalable reheating strategy for superior electrochemical performance. J. Energy Chem. 2025, 102, 107–119. [Google Scholar] [CrossRef]
  57. Wang, X.Y.; Gui, Q.H.; Liu, Z.Y.; Li, J.Z.; Xie, Y.G.; Liu, P.; Mao, L. Evaluation of multiparameter warning capability of sodium-ion battery. IEEE Trans. Instrum. Meas. 2024, 73, 3541308. [Google Scholar] [CrossRef]
  58. Lin, S.S.; Yang, Z.; Chen, J.; Qiao, Y.; Li, L.; Chou, S.L. Functional electrolyte additives for sodium-ion and sodium-metal batteries: Progress and perspectives. Adv. Funct. Mater. 2024, 34, 2400731. [Google Scholar] [CrossRef]
  59. Gui, Q.H.; Jin, B.W.; Liu, P.; Yu, K.; Zhang, J.R.; Mao, L. Revealing the Hazard of Mild Electrical Abuse on the SafetyCharacteristics of NaNi1/3Fe1/3Mn1/3O2 Cathode Sodium-Ion Battery. Adv. Sci. 2025, 2501649. [Google Scholar] [CrossRef]
  60. Zhang, J.Y.; Li, X.X.; Zhang, G.Q.; Guo, J.W.; Huang, Q.Q.; Wang, C.H.; Zhou, D.Q.; Wei, D.Y. Experimental investigation on the essential cause of the degrading performances for an overcharging ternary battery. Int. J. Energy Res. 2020, 44, 3134–3147. [Google Scholar] [CrossRef]
  61. Zhong, K.W.; Wang, C.H.; Luo, Q.Y.; Zhang, Z.H.; Zheng, J.X. Experimental study of a novel guided sequential immersion cooling system for battery thermal management. Appl. Therm. Eng. 2024, 257, 124337. [Google Scholar] [CrossRef]
  62. Liu, Q.; Sun, C.; Zhang, J.S.; Shi, Q.L.; Li, K.X.; Yu, B.X.; Xu, C.; Ju, X. The electro-thermal equalization behaviors of battery modules with immersion cooling. Appl. Energy 2023, 351, 121826. [Google Scholar] [CrossRef]
  63. Mei, W.X.; Liu, Z.; Wang, C.D.; Wu, C.; Liu, Y.B.; Liu, P.J.; Xia, X.D.; Xue, X.B.; Han, X.L.; Sun, J.H.; et al. Operando monitoring of thermal runaway in commerciallithiumion cells via advancd lab-on-fiber technologies. Nat. Commun. 2024, 14, 5251. [Google Scholar] [CrossRef]
  64. Sun, L.; Sun, W.; You, F.Q. Core temperature modelling and monitoring of lithium-ion battery in the presence of sensor bias. Appl. Energy 2020, 271, 115243. [Google Scholar] [CrossRef]
  65. Itagaki, M.; Suzuki, S.; Shitanda, I.; Watanabe, K. Electrochemical impedance and complex capacitance to interpret electrochemical capacitor. Electrochemistry 2007, 75, 649–655. [Google Scholar] [CrossRef]
  66. Lalinde, I.; Berrueta, A.; Arza, J.; Sanchis, P.; Ursua, A. On the characterization of lithium-ion batteries under overtemperature and overcharge conditions: Identification of abuse areas and experimental validation. Appl. Energy 2024, 354, 122205. [Google Scholar] [CrossRef]
  67. Guo, M.Y.; Zhang, H.; Huang, Z.; Li, W.B.; Zhang, D.Y.; Gao, C.Q.; Gao, F.; He, P.; Wang, J.G.; Chen, W.H.; et al. Liquid template assisted activation for “egg puff”-like hard carbontoward high sodium storage performance. Small 2023, 19, 39. [Google Scholar] [CrossRef]
  68. Yamamoto, T.; Yamaguchi, T.; Nohira, T.; Hagiwara, R.; Fukunaga, A.; Sakai, S.; Nitta, K. Structural and electrochemical properties of hard carbon negative electrodes for sodium secondary batteries using the Na[FSA]-[C3C1pyrr][FSA] ionic liquid electrolyte. J. Electrochem. 2017, 85, 391–396. [Google Scholar] [CrossRef]
Figure 1. NB and OB sodium-ion battery cells used for the experiment.
Energies 18 03580 g001
Figure 2. Layout of the experimental test system.
Energies 18 03580 g002
Figure 3. Schematic diagram of the thermocouple layout.
Energies 18 03580 g003
Figure 4. Disassembly process of NB and OB cells: (a) Commercial sodium ion cells; (b) Peel off the surface insulation; (c) Cut off the positive cao; (d) Winding structure of diaphragm; (e) Electorde slices with surface active substance; (f) Anode and cathode materials.
Energies 18 03580 g004
Figure 5. The experimental uncertainty of voltage-impedance-temperature detections.
Energies 18 03580 g005
Figure 6. Comparison of (a) discharge voltage plateau and (b) discharge capacity between NB and OB cells at 25 °C.
Energies 18 03580 g006
Figure 7. Comparison of (a) discharge voltage plateau and (b) discharge capacity between NB and OB cells at 40 °C.
Energies 18 03580 g007
Figure 8. Comparison of internal resistance between NB and OB cells at different SOCs.
Energies 18 03580 g008
Figure 9. Comparison of AC impedance between NB and OB. (a) EIS and equivalent circuit diagram of NB and OB (SOC = 0%), (b) EIS and equivalent circuit diagram of NB and OB (SOC = 25%), (c) EIS and equivalent circuit diagram of NB and OB (SOC = 50%), (d) EIS and equivalent circuit diagram of NB and OB (SOC = 75%), (e) EIS and equivalent circuit diagram of NB and OB (SOC = 100%).
Energies 18 03580 g009aEnergies 18 03580 g009bEnergies 18 03580 g009c
Figure 10. Temperature variations during discharge at different rates for NB and OB at 25 °C. Comparison of peak temperature (a) changes and (b) differences.
Energies 18 03580 g010
Figure 11. Temperature variations during discharge at different rates for NB and OB at 40 °C: (a) peak temperatures and (b) peak temperature differences.
Energies 18 03580 g011
Figure 12. Surface morphology of electrode sheets. (a) NB cathode. (b) OB cathode. (c) NB anode. (d) OB anode.
Energies 18 03580 g012
Figure 13. SEM images of electrode sheet surface. (a) NB cathode. (b) OB cathode. (c) NB anode. (d) OB anode.
Energies 18 03580 g013
Figure 14. SEM images of electrode sheet cross-sections. (a) NB cathode. (b) OB cathode. (c) NB anode. (d) OB anode.
Energies 18 03580 g014
Figure 15. XRD patterns of electrode materials: (a) cathodes of NB and OB and (b) anodes of NB and OB.
Energies 18 03580 g015
Table 1. Technical parameters of 18650-type sodium-ion battery cells.
ItemsTechnical Parameters
Cathode and anode materialsNa(Ni0.4Fe0.2Mn0.4)O2/HC
Nominal voltage, V3
Nominal capacity, mAh1200 (25 ± 2 °C)
Charging cut-off voltage, V3.8 ± 0.05
Maximum charging current, A1.2
Maximum discharge current, A1.8
Discharge cut-off voltage, V1.5 ± 0.05
Operating temperature interval, °CCharging: 0–45
Discharging: –20 to 60
Storage temperature interval, °C–20 to 60
Cell weight, g37 ± 1.0
Cell size, mmHeight: 65.0 ± 0.3
Diameter: 18.35 ± 0.2
Table 2. Comparison table of mild vs. severe overcharge characteristics.
CharacteristicsMild Overcharge (100–120% SOC)Severe Overcharge (>140% SOC)
Voltage rangeSlightly exceeds cut-off voltage
(this study: 4.2 V vs. 3.8 V)
Far exceeds cut-off voltage
(>150% nominal voltage)
Capacity fadeReversible fade (<5%)Irreversible fade (>20%)
Structural damageSEI thickeningCathode phase transition/collapse, anode dendrite growth
Thermal behaviorTemperature rise ~5 °CLocal hotspots > 10 °C,
high thermal runaway risk
Safety riskLow (BMS interruptible)High (potential thermal runaway)
Note: The 4.2 V cut-off (~110% SOC) represents 85% of the cathode’s theoretical desodiation limit (x < 0.4 in NaxTMO2) [59]. This ensures structural reversibility, whereas >140% SOC exceeds the phase transition threshold (x < 0.2) causing irreversible collapse [52].
Disclaimer/Publisher’s Note: The statements, opinions and data contained in all publications are solely those of the individual author(s) and contributor(s) and not of MDPI and/or the editor(s). MDPI and/or the editor(s) disclaim responsibility for any injury to people or property resulting from any ideas, methods, instructions or products referred to in the content.

