Article

Determination of Residual Oil in Biodiesel via Quasi-Isothermal Thermogravimetry (TGA-qISO) and Differential Scanning Calorimetry (DSC)

by
Mário Rodrigues Cortes
1,
Joice Ferreira de Queiroz
1,
Marcio José Rodrigues Amorim
2,
David Johane Machate
1,
Euclésio Simionatto
3,
Carlos Eduardo Domingues Nazário
1 and
Lincoln Carlos Silva de Oliveira
1,*
1
Institute of Chemistry, Federal University of Mato Grosso do Sul, Campo Grande 79070-900, Brazil
2
Campus Três Lagoas, Federal Institute of Mato Grosso do Sul, Tres Lagoas 79641-162, Brazil
3
Department of Chemistry, State University of Mato Grosso do Sul, Naviraí 79950-000, Brazil
*
Author to whom correspondence should be addressed.
Energies 2025, 18(13), 3518; https://doi.org/10.3390/en18133518
Submission received: 24 January 2025 / Revised: 5 March 2025 / Accepted: 27 April 2025 / Published: 3 July 2025
(This article belongs to the Section A4: Bio-Energy)

Abstract

The present work aims to determine the levels of contaminant oils in biodiesel obtained from the residual oil of the industrial processing of Nile tilapia via Quasi-Isothermal Thermogravimetry (TGA-qISO) and Differential Scanning Calorimetry (DSC). For this purpose, mixtures of tilapia oil (OT) and biodiesel (BD) were prepared in the mass proportions of OT/BD (5:95 m/m), OT/BD (10:90 m/m), OT/BD (15:85 m/m), OT/BD (20:80 m/m), OT/BD (25:75 m/m) and OT/BD (30:70 m/m). These mixtures were used to construct the calibration curve of the TGA-qISO and DSC techniques. To evaluate the efficiency of these techniques, three samples were prepared at concentrations of 7.01 OT%, 16.66 OT% and 27.05 OT%. The data obtained show that the biodiesel/oil mixtures presented two stages of mass loss, the first between 100 and 200 °C, which was attributed to the decomposition of the biodiesel, and from 250 °C, to the decomposition of the oil. In the DSC curves of the mixtures, it was observed that as the concentration of tilapia oil in the mixtures increases, there is a decrease in the intensity of the peaks and a shift to a higher temperature range. Statistical tools show that the TGA-qISO measurements presented analytical curves with a correlation coefficient (r) of 0.9999, while in the DSC analyses, r of −0.9727 and −0.9903 were obtained. Analysis of variance (ANOVA) confirmed that there is no significant difference between the measurements performed by TGA-qISO and DSC. This result shows that both techniques can be used to determine the oil adulteration in biodiesel samples.

1. Introduction

The tilapia filleting process yields an average of 32% fillet, and the remaining 68% is waste, including head, viscera, skin and scales [1]. Of this, approximately 23% is sent to landfills, and 9% is dumped into rivers, generating negative impacts on the environment [2].
Some of this waste (viscera and fresh carcasses) can be reused to produce flour, oil and silage, aiming to use these by-products in animal feed, while for others (naturally dead fish and decomposing carcasses), the only environmentally correct destination is organic composting [3].
In addition, studies report the use of oil extracted from Nile tilapia (Oreochromis niloticus) waste as a potential raw material for biodiesel production [4,5,6].
Biodiesel is sold mixed with diesel. Currently, the biodiesel content in diesel is 15% (v/v) [7]. Diesel–biodiesel blends can be adulterated via the illegal addition of lower-value vegetable oil, which can cause overheating and excessive engine acceleration, in addition to increasing the fuel consumption, particulate matter and exhaust gas emissions [8].
Thermogravimetry/Derived Thermogravimetry (TG/DTG) has been successfully used to determine the purity of biodiesel [9,10,11]. In this sense, the present study aims to determine the levels of contaminant oils in biodiesel obtained from the residual oil of the industrial processing of Nile tilapia (Oreochromis niloticus) via Quasi-Isothermal Thermogravimetry (TGA-qISO) and Differential Scanning Calorimetry (DSC).
TG/DTG is a thermal analysis technique that evaluates the variation in mass (loss or gain) of a given sample as a function of temperature or time. This analysis can be performed in dynamic, isothermal and quasi-isothermal heating modes [12]. Generally, TG/DTG is performed in the dynamic heating mode, in which the mass loss is continuously recorded as the temperature increases linearly [12]. Thus, the overlapping of ester volatilization events with the thermodecomposition of oils may occur, resulting in considerable percentage differences compared to the reference method.
However, in the quasi-isothermal mode (TGA-qISO), the temperature increases linearly (dynamic mode), until changes in the initial mass of the sample occur within an evaluated limit. Then, the programmed sequence switches to a constant temperature (isothermal mode), and the oven stops increasing the temperature until the sample mass stabilizes, from which point the equipment returns to the dynamic mode until the end of the curve [12,13]. In this way, it allows the separation of close thermal events, which increases the accuracy of the technique.
Differential Scanning Calorimetry (DSC) is a thermal analysis technique frequently used to assess the quality of biodiesel. It measures the oxidative stability, decomposition kinetics and cold flow properties of biodiesel and oil. Therefore, it can be used to determine the cold flow characteristics of biodiesel samples to check for adulteration. In addition, the TGA-qISO and DSC techniques have the advantage of not requiring solvents, being simple to apply and being able to determine other parameters, such as water content, flash point and oxidative stability.

2. Materials and Methods

2.1. Quasi-Isothermal Thermogravimetry (TGA-qISO)

In the determination of the residual oil in biodiesel via TGA-qISO, mixtures of tilapia oil (OT) and biodiesel (BD) were prepared in the mass proportions of OT/BD (5:95 m/m), OT/BD (10:90 m/m), OT/BD (15:85 m/m), OT/BD (20:80 m/m), OT/BD (25:75 m/m) and OT/BD (30:70 m/m). The TG curves of the mixtures were obtained in the TGA—Q50 (TA Instruments, New Castle, DE, USA). The samples were analyzed using a nitrogen (N2) atmosphere with a sample flow of 60 mL min−1, a platinum crucible as the sample support and an average sample mass of 5.5 ± 2 mg. The following program was adopted:
  • Equilibrate the temperature at 25 °C;
  • Stop the next segment if the mass variation is greater than 2% min−1;
  • Apply a 10 °C min−1 ramp from 25–350 °C;
  • Stop the next segment if the sample mass variation is less than 2%;
  • Use a 125 min isotherm;
  • Apply a 10 °C min−1 ramp to 550 °C.

2.2. Differential Scanning Calorimetry (DSC)

Differential Scanning Calorimetry (DSC) allows the obtaining of qualitative and quantitative information about physical and chemical changes involving endothermic processes (heat absorption), exothermic processes (heat evolution) or changes in heat capacity, in relation to the reference material.
In this sense, the DSC technique was used to determine the crystallization and melting points of tilapia oil and biodiesel. The DSC curves were obtained on the DSC-Q20 equipment with the RCS-90 cooling system (TA Instruments, New Castle, DE, USA), using aluminum crucibles without lids as sample holders and a similar, empty crucible as the reference. A nitrogen atmosphere, with a flow rate of 60 mL min−1, heating rate of 10 °C min−1 and heating and cooling cycle from −80 to 40 °C was used.

2.3. Determination of the Linear Regression Coefficients

In order to evaluate the linearity of the TGA-qISO and DSC techniques, the coefficients of the simple linear regression model and the linear correlation coefficient (r) were calculated according to the GUIDANCE ON VALIDATION OF ANALYTICAL METHODS manual published by the National Institute of Metrology (INMETRO) [14]. From the following equation:
y = a + bx
where y: measured response (instrumental signal such as absorbance, peak height or area, etc.); x: concentration; a: linear coefficient (intersection with the y-axis, when x = 0); b: angular coefficient (slope of the analytical curve = sensitivity). The coefficients of the straight line equation were calculated from the equations below:
a =   y i b x i   n p
b = ( x i x ¯ ) ( y i y ¯ ) ( x i x ¯ ) 2  
r = ( x i x ¯ ) ( y i y ¯ ) ( x i x ¯ ) 2 ( y i y ¯ ) 2
where xi: individual concentration values, yi: individual instrumental signal values; x ¯ : average of x values (concentration); y ¯ : average of y values (instrumental signal). The value of the linear correlation coefficient varies between 1 and −1, and the closer it is to 1 the greater the probability of linear statistical dependence between the variables x and y. In this sense, a value of r = 1 indicates a positive linear correlation between the variables x and y, and r = −1 refers to a negative linear correlation between the variables x and y, and if r = 0, there is no linear correlation between the variables x and y, but they may be related in a non-linear way [15].

2.4. Analysis of Variance (ANOVA)

ANOVA was applied to assess whether the difference between the oil content values determined via TGA-qISO and DSC, at a 95% confidence level, was significant or not. In the null hypothesis (H0), the differences between the means are not significant, and in the alternative hypothesis (H1), the mean values are different. In this sense, if Fcalculated > Ftable, H0 is rejected; otherwise, i.e., Fcalculated < Ftable, H0 is accepted.

3. Results

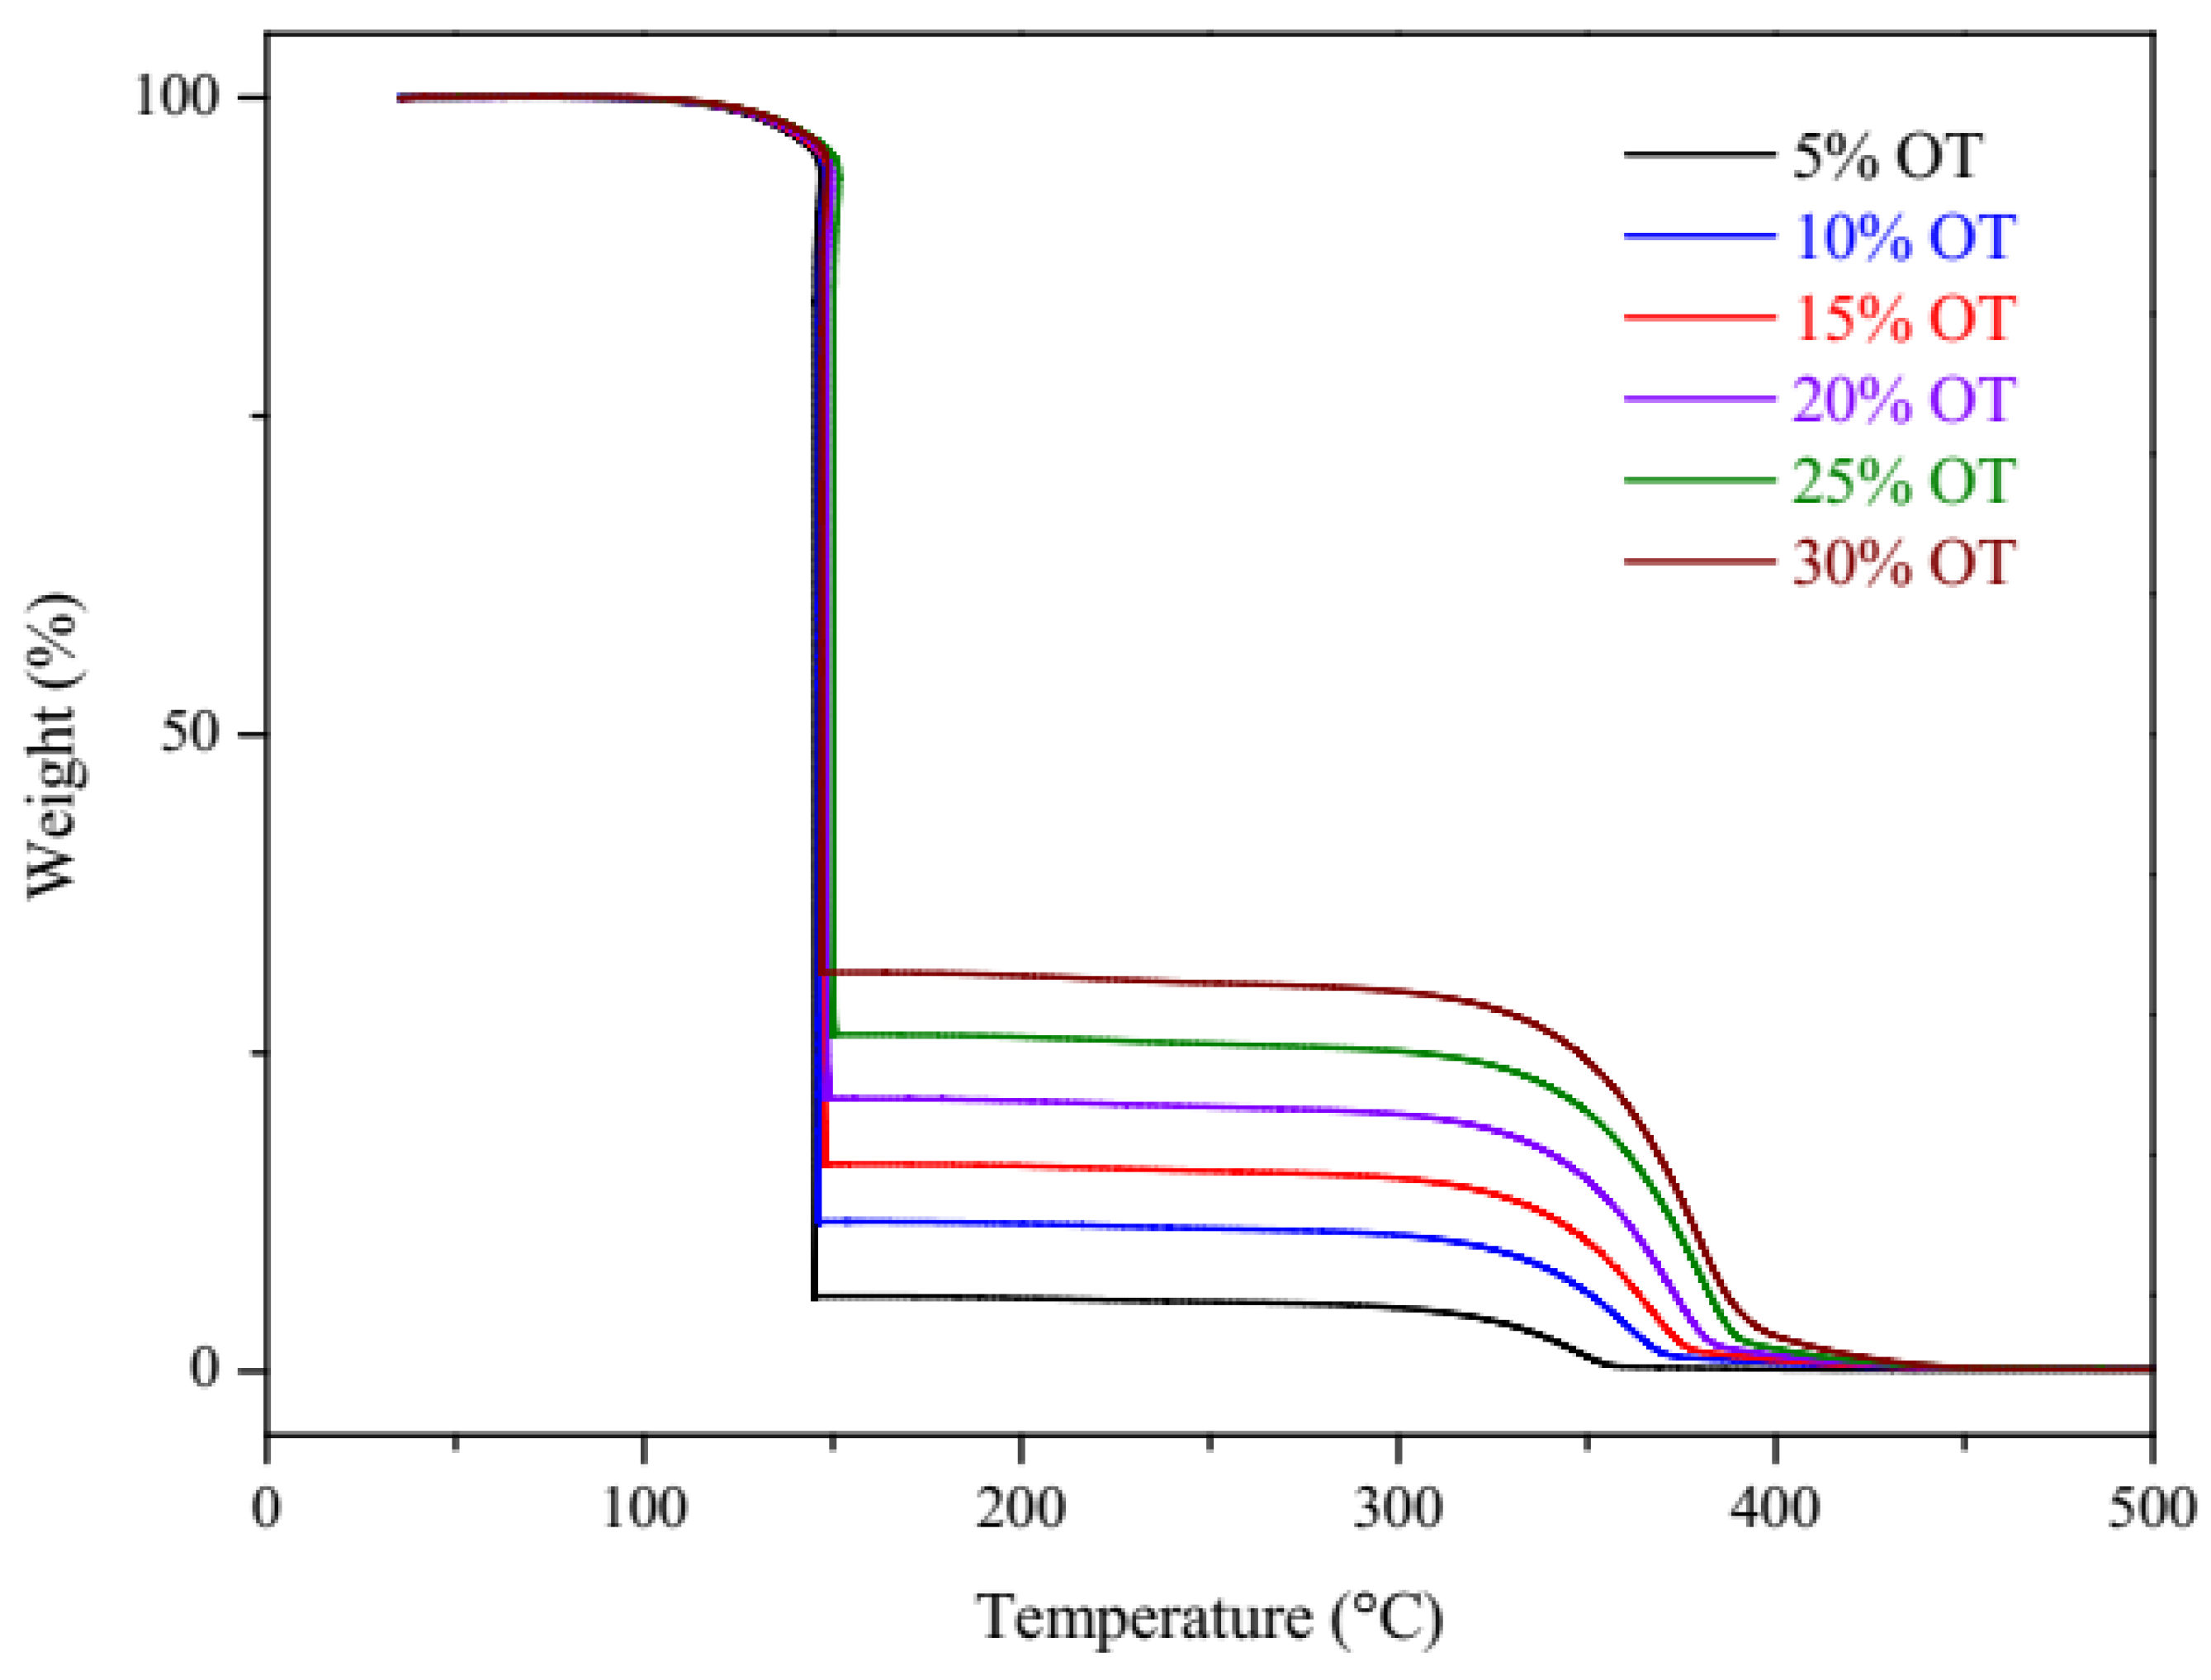
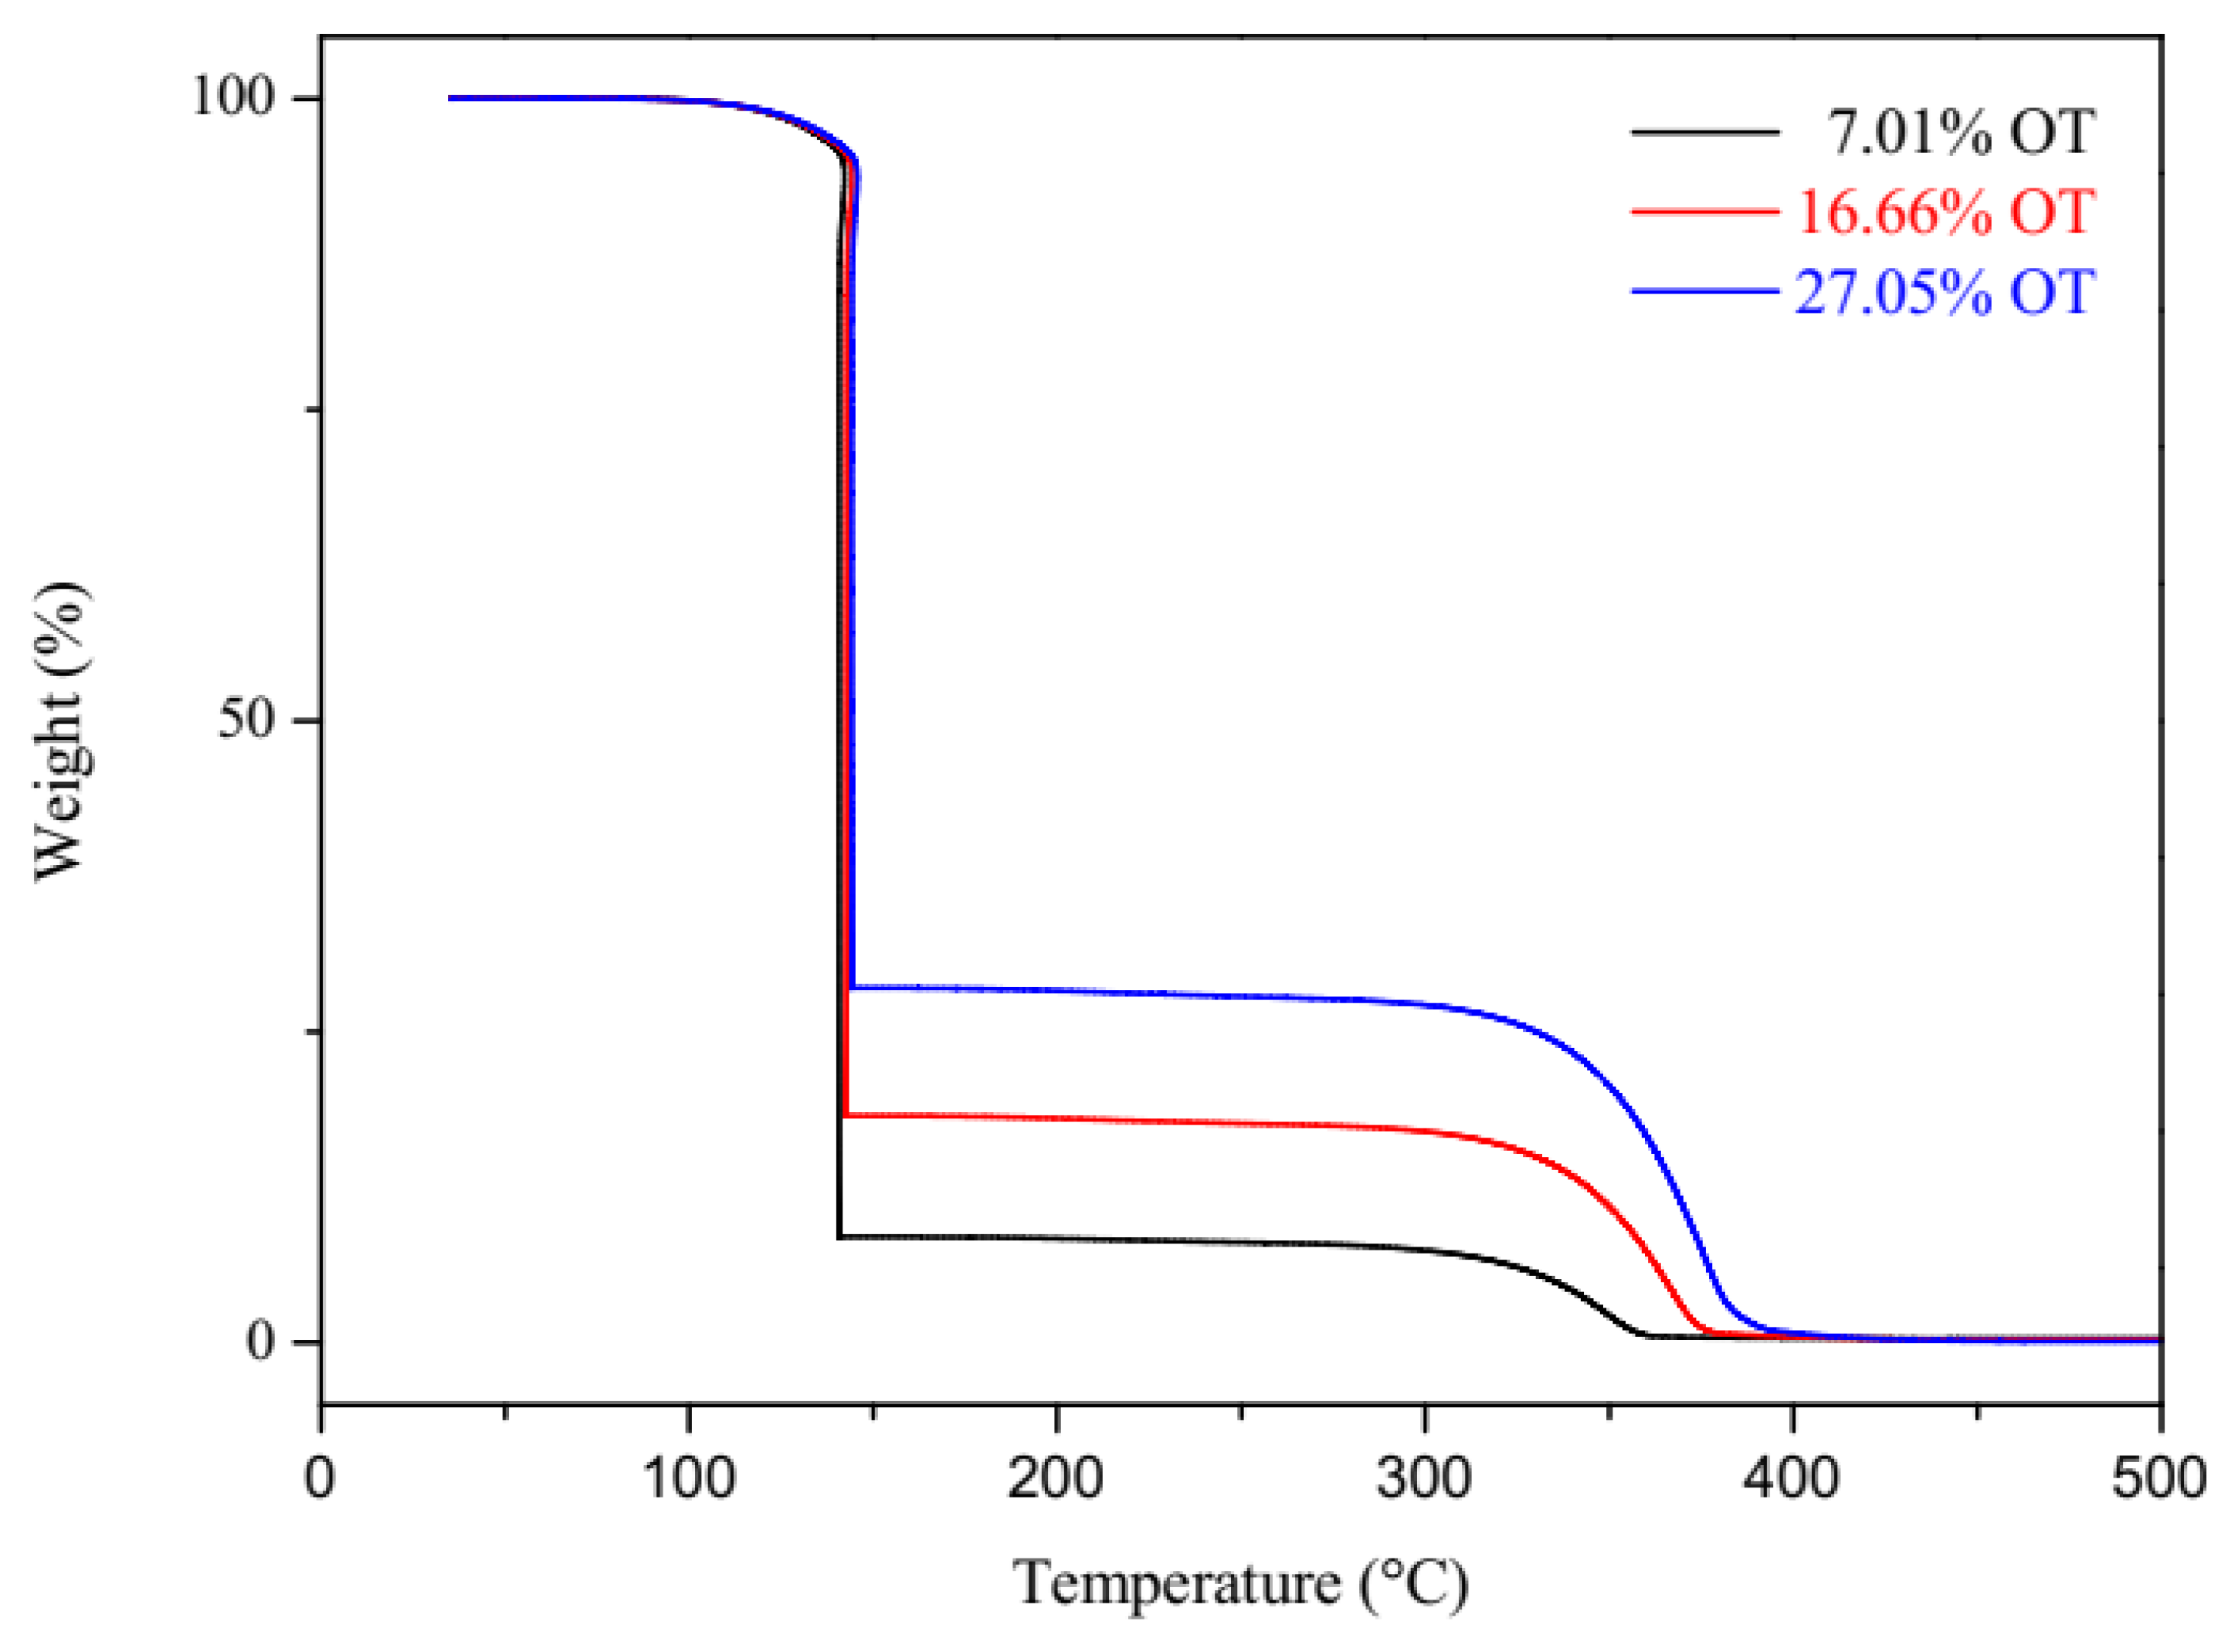
3.1. Quasi-Isothermal Thermogravimetry (TG-qISO)

Figure 1 shows the TGA-qISO curve of the oil/biodiesel mixtures in a nitrogen atmosphere with a flow of 60 mL min−1 in the sample, with a heating rate of 10 °C min−1 from 35 °C to 550 °C and an isotherm of 125 min.
Figure 2 shows the analytical curve obtained from the analysis carried out in nitrogen, which relates the mass loss (%) of the mixtures in the temperature range of 250 to 450 °C and the oil concentration in the mixtures (m/m).
Figure 3 shows the TGA-qISO curve of the mixtures at three different levels of oil concentration. It is noted that the three mixtures presented decomposition in two stages of mass loss. The first in the temperature range of 100 to 150 °C was attributed to the volatilization of biodiesel, and the second in the temperature range of 250 to 450 °C refers to the volatilization of tilapia oil.

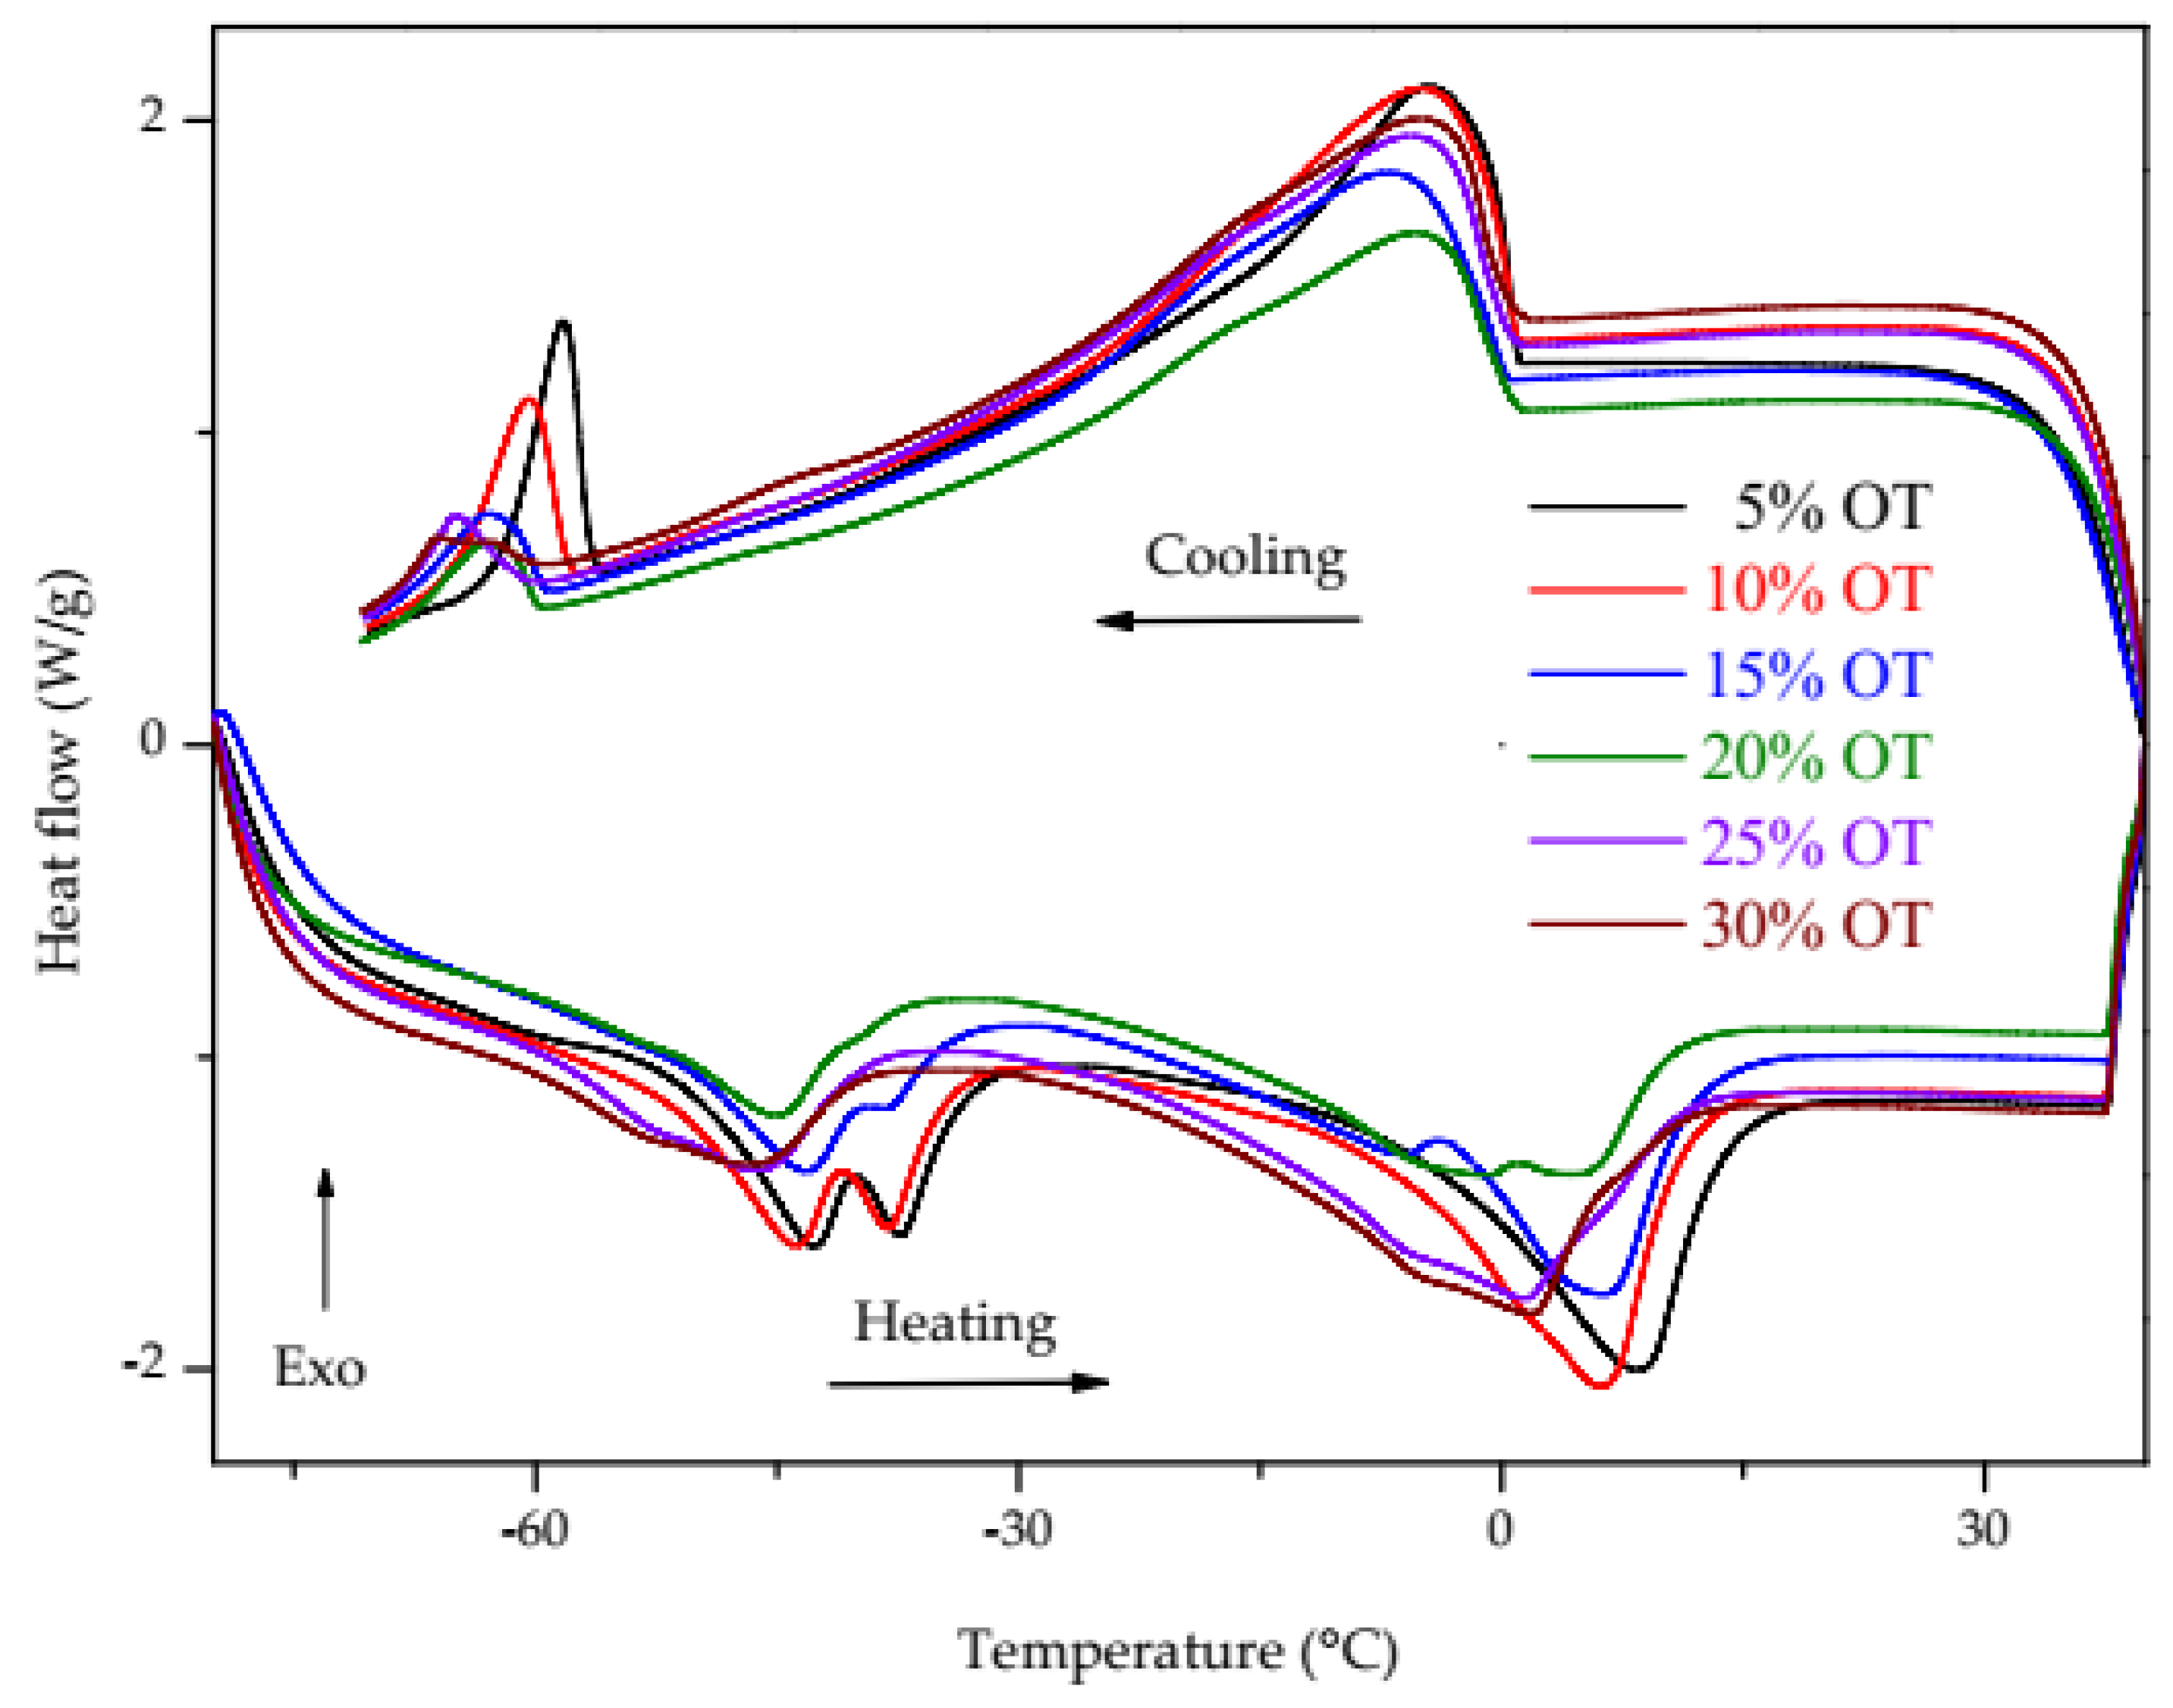
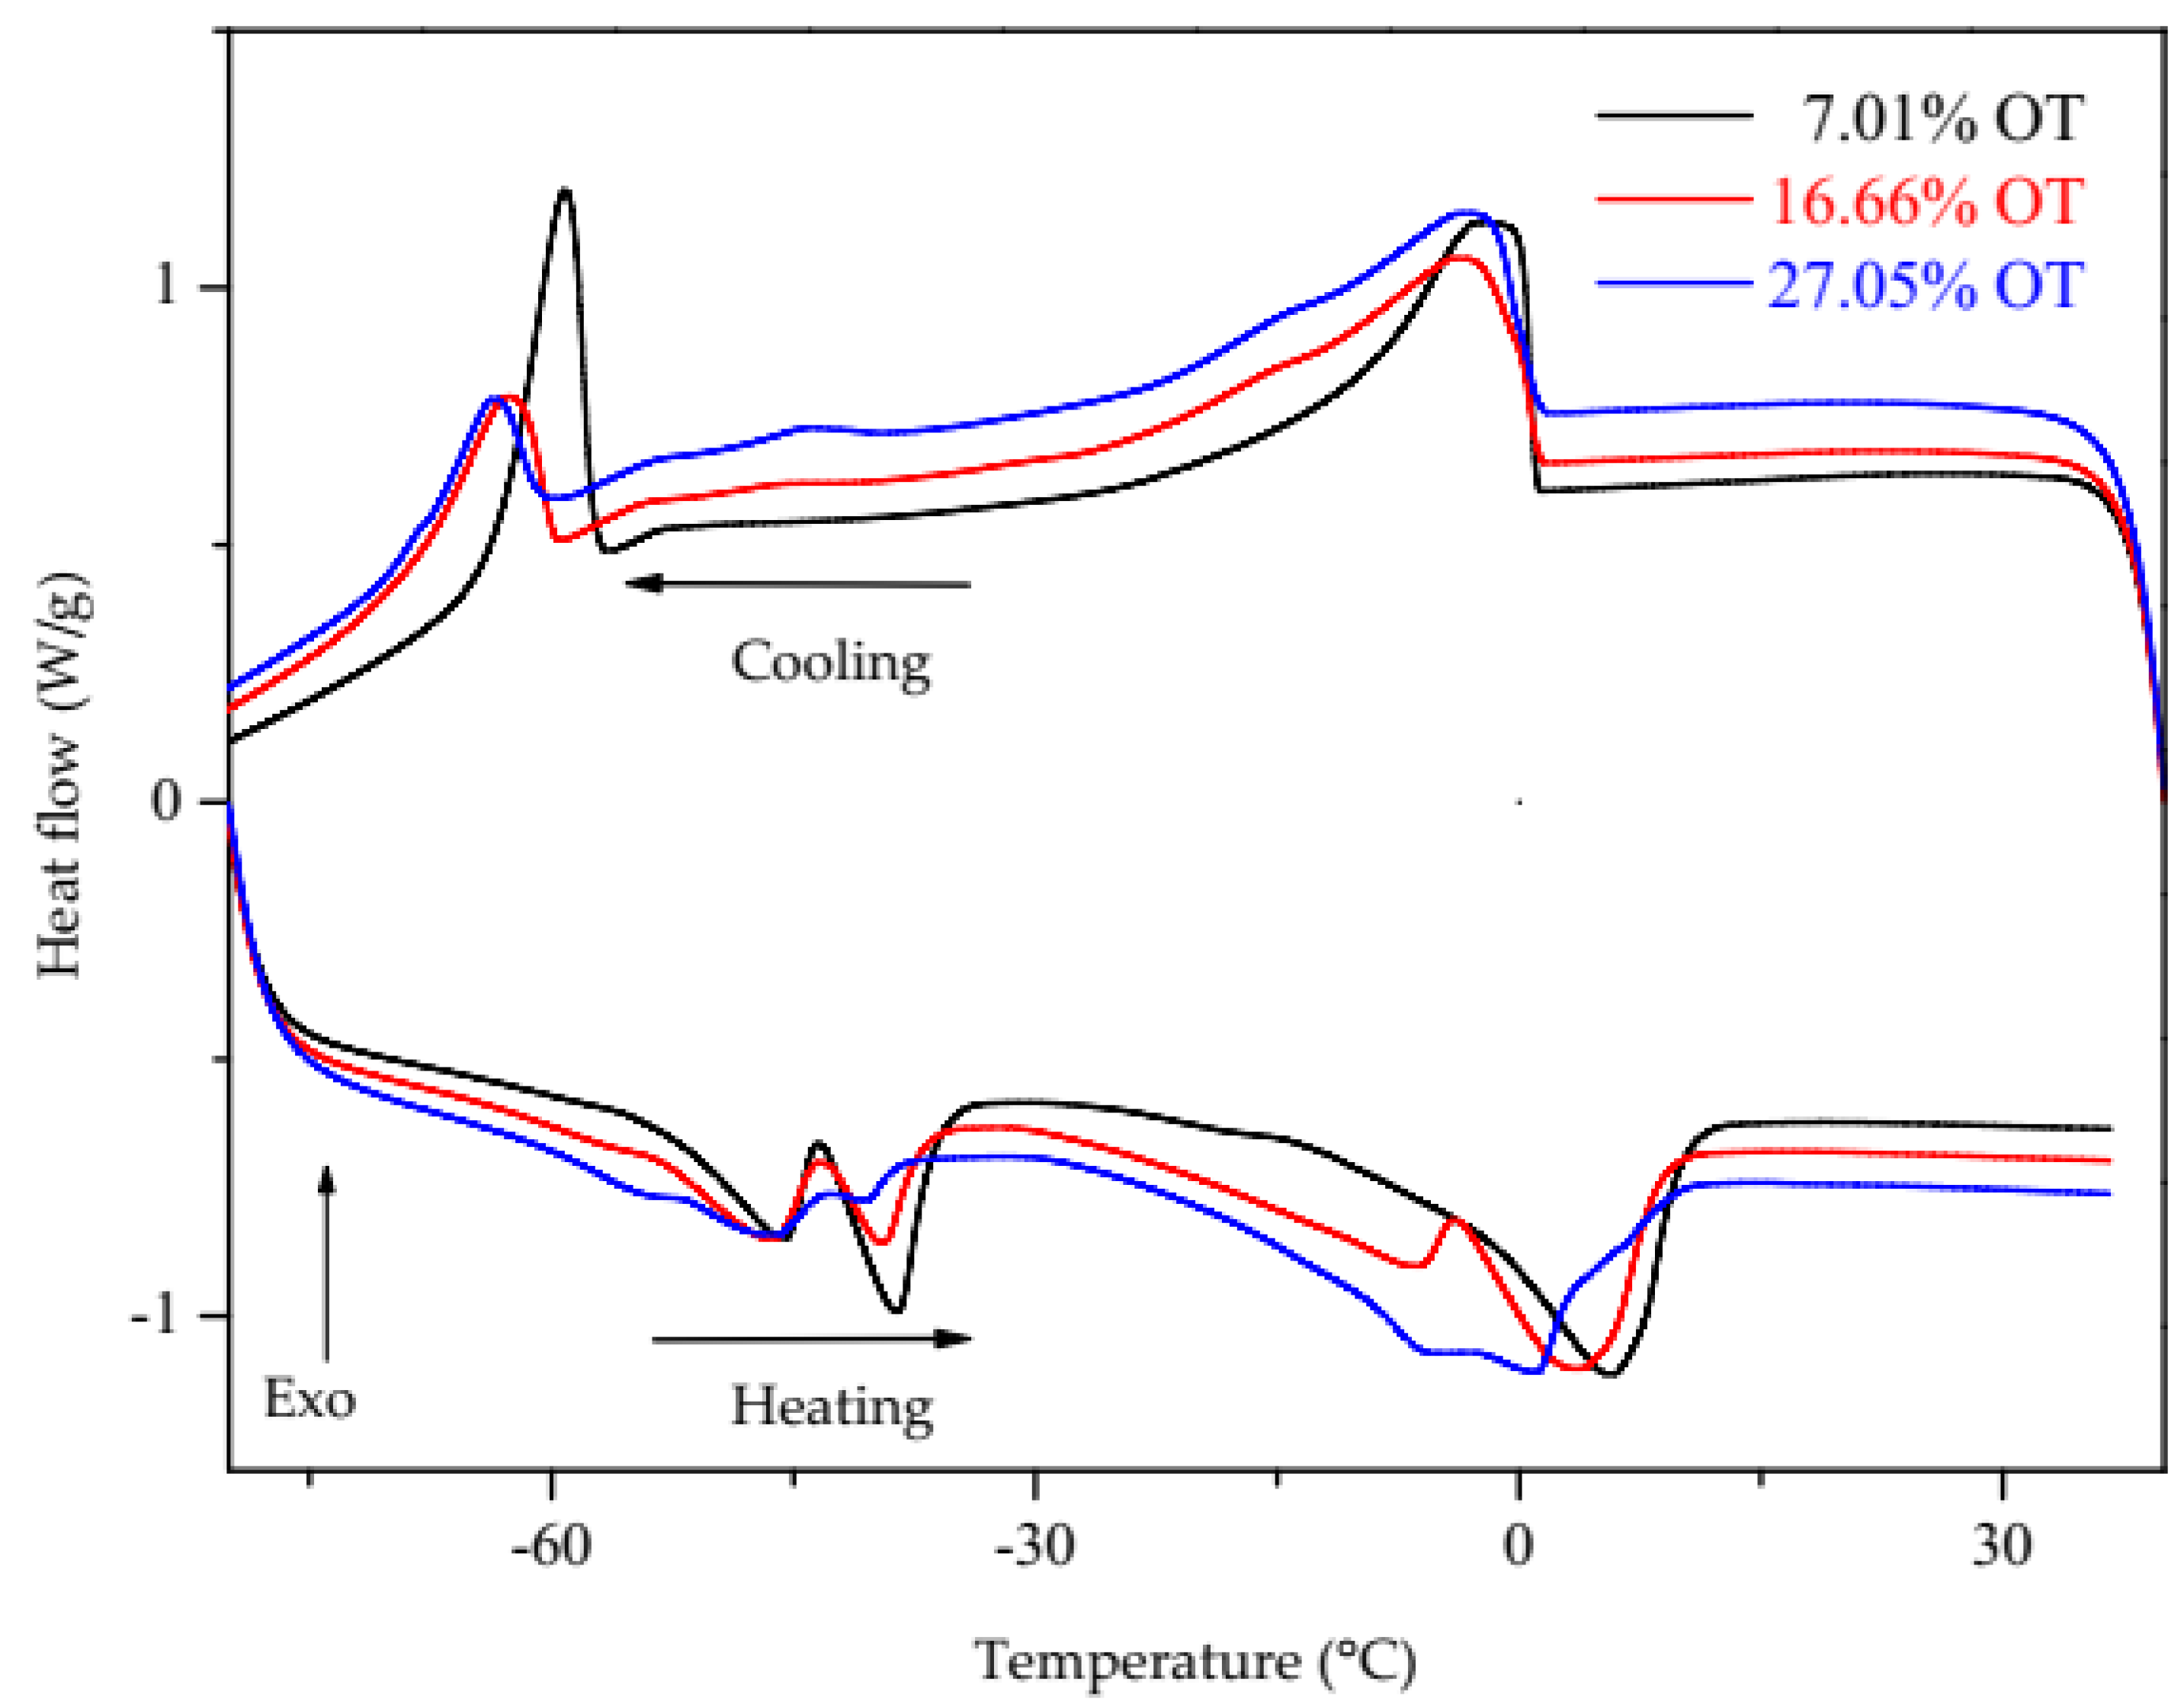
3.2. Differential Scanning Calorimetry (DSC)

Figure 4 shows the DSC crystallization and melting curves of the oil/biodiesel mixtures in a nitrogen atmosphere with a sample flow rate of 60 mL min−1.
Table 1 shows the oil content in the mixtures and the enthalpy values (∆H) related to the crystallization and fusion of the mixtures in the temperature range of 40 to −80 °C (DSC curves).
Table 2 presents the equations of the straight lines and the correlation coefficients of the analyses performed via DSC.
Figure 5 shows the DSC curve of biodiesel and oil blends at three concentration levels.

4. Discussion

Figure 1 shows the TGA-qISO curve of the mixtures, in which two thermal events are observed; the first in the temperature range of 100 to 150 °C was attributed to the volatilization of biodiesel, and the second in the temperature range of 250 to 450 °C refers to the volatilization of tilapia oil. Moraes et al. (2020) analyzed the thermal stability of crude tilapia oil and biodiesel and observed that the oil volatilizes in the temperature range of 350 to 550 °C, while biodiesel volatilizes in the range of 170 to 250 °C [16]. Figure 2 shows the analytical curve obtained from the TGA-qISO analysis, which relates to the mass loss (%) of the mixtures in the temperature range of 250 to 450 °C and the concentration of oil in the mixtures (w/w). The correlation coefficient (R) can vary from −1 to 1, and the closer it is to 1 or −1, the smaller the error in y and, therefore, it will be a good indicator of how adequate the line is considered as a mathematical model. In the case of R = −1, all the points on the analytical curve will be contained in a line with a negative slope. However, if R = 1, all the points on the curve must be on a line with a positive slope [17]. In this sense, it can be observed (Figure 2) that the measurements of the mixtures using the TGA-qISO technique generated an analytical curve with a positive slope with an R value of 0.9999, which indicates a strong correlation between the mass loss values and the oil concentration in the mixtures.
TGA-qISO measurements were performed on three mixtures, and the oil concentration was determined. Figure 3 shows the TGA-qISO curve of the mixtures at three different levels of oil concentration. In it, it can be noted that the three mixtures presented decomposition in two steps of mass loss. The first in the temperature range of 100 to 150 °C was attributed to the volatilization of biodiesel, and the second in the temperature range of 250 to 450 °C refers to the volatilization of tilapia oil. The mass loss in this temperature range was used to determine the oil content in the mixtures, in which contents of 7.53%, 17.09 and 27.05% (m/m) were found, respectively.
Figure 4 shows the DSC curves of the oil/biodiesel mixtures, in which two exothermic and two endothermic events are observed, which refer to the crystallization and fusion of saturated and unsaturated fatty acids. Table 1 shows the oil content in the mixtures and the enthalpy values related to the crystallization and fusion of the mixtures in the temperature range of 40 to −80 °C. In this sense, it is noted that as the concentration of the tilapia oil in the mixtures increases, the intensity of the peaks decreases and they shift to higher temperature ranges.
Table 2 presents the equations of the straight lines and the correlation coefficients of the analyses performed via DSC. In it, it is observed that the events, P2 and P3, presented correlation coefficient values (R) of −0.9723 and −0.9903, which may indicate a strong negative correlation between the variables’ enthalpy values and oil concentration in the mixtures. In this sense, the equations of the straight line of these analytical curves were used to determine the oil concentration in the mixtures.
Figure 5 presents the DSC curve of the biodiesel and oil mixtures at three concentration levels. With event P2, the oil contents were 6.90 ± 2.07%, 18.22 ± 0.97% and 25.10 ± 0.94%, while in event P3 the values found were 7.86 ± 0.79%, 17.41 ± 0.34% and 27.78 ± 1.82%.
In order to verify whether there are significant differences between the TGA-qISO and DSC measurements, a single-factor analysis of variance (ANOVA) was performed with a 95% confidence level. The null hypothesis (H0) assumes that there is no significant difference between the means and the alternative hypothesis (H1) that the difference between the means is significant [18]. In this sense, it was obtained that the value of Fcalculated < Fcritical, and the value of p is higher than the chosen significance level of 0.05; therefore, H0 is accepted; that is, there is no significant difference between TGA-qISO and DSC.
Tables with additional data on tilapia oil and biodiesel can be seen in Supplementary Materials.

5. Conclusions

The proposed TGA-qISO and DSC methods were efficient in determining the oil in biodiesel/oil mixtures, as they presented correlation coefficients higher than 0.99 (TGA-qISO) and −0.99 (P3 -DSC). In the determination of residual oil via the TGA-qISO and DSC of three mixtures at different concentration levels, similar results were obtained. From the ANOVA, it was observed that the residual oil values determined via TGA-qISO and DSC did not present significant differences, as Fcalculated < Fcritical and the p-value was greater than the confidence level of 0.05. This confirms the efficiency of TGA-qISO and DSC in determining the residual oil in biodiesel samples.

Supplementary Materials

The following supporting information can be downloaded at: https://www.mdpi.com/article/10.3390/en18133518/s1, Table S1: Chemical composition of tilapia oil and biodiesel (CG-FID); Table S2: Identification of functional groups present in tilapia oil and biodiesel (FTIR); Table S3: 1H NMR data of tilapia oil and biodiesel; Table S4: Analysis of variance (ANOVA) of TGA-qISO and DSC measurements.

Author Contributions

J.F.d.Q., M.R.C., M.J.R.A., D.J.M., C.E.D.N. and E.S., topic conceptualization, investigation, formal analysis, writing—original draft, visualization, data curation, supervision; L.C.S.d.O., review, funding acquisition, project administration. All authors have read and agreed to the published version of the manuscript.

Funding

This study was supported by the Federal University of Mato Grosso do Sul (UFMS), Coordination for the Improvement of Higher Education Personnel (CAPES)—Finance Code 001, National Council for Scientific and Technological Development (CNPq) grant number 303285/2022-2 and the Foundation for the Support of the Development of Education, Science and Technology of the State of Mato Grosso do Sul—FUNDECT-MS—grant number 288/2022.

Data Availability Statement

The original research data is not available due to privacy and security restrictions at the Federal University of Mato Grosso do Sul.

Acknowledgments

The authors extend their gratitude to the Institute of Chemistry and the Graduate Program in Chemistry at the Federal University of Mato Grosso do Sul (UFMS) for their support.

Conflicts of Interest

The authors declared no conflicts of interest.

Abbreviations

TG/DTGThermogravimetry/Derivative Thermogravimetry
TGA-qISOQuasi-Isothermal Thermogravimetry
DSCDifferential Scanning Calorimetry
INMETRONational Institute of Metrology

References

  1. Barroso, R.M.; Muñoz, A.E.P.; Cai, J. Social and Economic Performance of Tilapia Farming in Brazil; Fisheries and Aquaculture Circular No. 1181; FAO: Rome, Italy, 2019. [Google Scholar]
  2. Pires, D.R.; Morais, A.C.N.d.; Costa, J.F.d.; Góes, L.C.D.S.d.A.; Oliveira, G.M.d. Utilization of waste edible fish: Application and feasibility. Rev. Verde 2015, 9, 34–46. Available online: https://www.gvaa.com.br/revista/index.php/RVADS/article/view/2956 (accessed on 21 January 2025).
  3. Rose Meire, V.; Ivã Guidini, L. Organic waste generated in fish farming. Res. Technol. 2016, 13, 1–6. [Google Scholar]
  4. Jayasinghe, P.; Hawboldt, K. A review of bio-oils from waste biomass: Focus on fish processing waste. Renew. Sustain. Energy Rev. 2012, 16, 798–821. [Google Scholar] [CrossRef]
  5. Menegazzo, M.L.; Lucas, B.F.; Alcade, L.B.; Petenucci, M.E.; Fonseca, G.G. Production of biodiesel via methyl and ethyl routes from Nile tilapia and hybrid Sorubim crude oils. J. Environ. Chem. Eng. 2015, 3, 150–154. [Google Scholar] [CrossRef]
  6. Mota, F.A.S.; Costa Filho, J.T.; Barreto, G.A. The Nile tilapia viscera oil extraction for biodiesel production in Brazil: An economic analysis. Renew. Sustain. Energy Rev. 2019, 108, 1–10. [Google Scholar] [CrossRef]
  7. Ministry of Mines and Energy. Resolution N° 8, of December 19, 2023. Available online: https://www.gov.br/mme/pt-br/assuntos/conselhos-e-comites/cnpe/resolucoes-do-cnpe/2023/ResoluoCNPE8Publicada.pdf (accessed on 21 January 2025).
  8. Sitoe, B.V.; Costa, L.G.D.; Santos, B.A.D.; Santos, D.Q.; Borges Neto, W. Monitoring of adulterants in crambe methyl biodiesel in mixtures with diesel, using ft-mir and multivariate control charts based on net analyte signal. Química Nova 2020, 43, 1–8. [Google Scholar] [CrossRef]
  9. Chand, P.; Reddy, C.V.; Verkade, J.G.; Wang, T.; Grewell, D. Thermogravimetric quantification of biodiesel produced via alkali catalyzed transesterification of soybean oil. Energy Fuels 2009, 23, 989–992. [Google Scholar] [CrossRef]
  10. Sousa, F.P.; Luciano, M.A.; Pasa, V.M.D. Thermogravimetry and viscometry for assessing the ester content (FAME and FAEE). Fuel Process. Technol. 2013, 109, 133–140. [Google Scholar] [CrossRef]
  11. Gaglieri, C.; Alarcon, R.T.; de Moura, A.; Mendes, R.A.; Caires, F.J. Is Thermogravimetry an efficient alternative to gas chromatography in degree of biodiesel conversion? J. Therm. Anal. Calorim. 2019, 135, 2591–2597. [Google Scholar] [CrossRef]
  12. Ionashiro, M.; Caires, F.J.; Gomes, D.J.C. Giolite: Fundamentals of Thermogravimetry and Differential Thermal Analysis/Differential Scanning Calorimetry, 2nd ed.; Giz Editorial: São Paulo, Brazil, 2014; pp. 1–192. [Google Scholar]
  13. Cortes, M.R.; de Queiroz, J.F.; dos Santos, T.M.; Cavalheiro, L.F.; Misutsu, M.; Ravaglia, L.M.; Alcantara, G.B.; Vian, L.H.; Nazário, C.E.; Simionatto, E.; et al. Applying quasi-isothermal thermogravimetry to determine degrees of oil conversion into biodiesel. J. Therm. Anal. Calorim. 2022, 147, 4397–4402. [Google Scholar] [CrossRef]
  14. National Institute of Metrology, Quality and Technology—INMETRO. DOQ-CGCRE-008: Guidance on Validation of Analytical Methods. 2020. Available online: https://app.sogi.com.br/Manager/texto/arquivo/exibir/arquivo?eyJ0eXAiOiJKV1QiLCJhbGciOiJIUzI1NiJ9AFFIjAvMTM4ODM3NS9TR19SZXF1aXNpdG9fTGVnYWxfVGV4dG8vMC8wL0RPUS1DZ2NyZS04XzA5LnBkZi8wLzAiAFFBcMYdNmecpDn0m0Dj4vzJmvMJZMAYtW6mtkIlj0C7fk (accessed on 21 January 2025).
  15. Ribani, M.; Bottoli, C.B.G.; Collins, C.H.; Jardim, I.C.S.F.; Melo, L.F.C. Validation for chromatographic and electrophoretic methods. Química Nova 2004, 27, 771–780. [Google Scholar] [CrossRef]
  16. Moraes, P.S.; Igansi, A.V.; Cadaval, T.R., Jr.; Pinto, L.A. Biodiesel produced from crude, degummed, neutralized and bleached oils of Nile tilapia waste: Production efficiency, physical-chemical quality and economic viability. Renew. Energy 2020, 161, 110–119. [Google Scholar] [CrossRef]
  17. de Lima Ribeiro, F.A.; Ferreira, M.M.C.; Morano, S.C.; da Silva, L.R.; Schneider, R.P. Validation spreadsheet: A new tool for estimating figures of merit in the validation of univariate analytical methods. Química Nova 2008, 31, 164–171. [Google Scholar] [CrossRef]
  18. Skoog, D.A.; West, M.D.; Holler, F.J.; Crouch, S.R. Fundamentos de Química Analítica, 8th ed.; Pioneira Thomson Learning: São Paulo, Brazil, 2006. [Google Scholar]
Figure 1. TGA-qISO curves of the mixtures obtained in nitrogen.
Energies 18 03518 g001
Figure 2. Analytical curve of the mixtures analyzed via TGA-qISO.
Energies 18 03518 g002
Figure 3. TGA-qISO curve of the mixtures at three different levels.
Energies 18 03518 g003
Figure 4. DSC crystallization and melting curves of oil/biodiesel blends.
Energies 18 03518 g004
Figure 5. DSC curve of biodiesel and oil blends at three concentration levels.
Energies 18 03518 g005
Table 1. Enthalpy values.
Oil/Biodiesel BlendsOil Content
(% m/m)
∆H (J/g)
(1.93 to −24 °C)
P1
∆H (J/g)
(−55 to −64 °C)
P2
∆H (J/g)
(−56 to −30 °C)
P3
∆H (J/g)
(−7.38 to 19.84)
P3
5% OT4.9834.35 ± 1.3826.02 ± 1.0824.09 ± 1.1441.32 ± 0.72
10% OT10.1533.80 ± 3.2220.84 ± 1.1220.90 ± 1.3740.45 ± 1.59
15% OT15.0733.37 ± 1.9614.06 ± 1.0017.86 ± 1.6242.16 ± 1.71
20% OT20.1625.73 ± 1.7610.99 ± 1.2812.85 ± 1.8637.91 ± 2.90
25% OT25.0427.96 ± 1.589.58 ± 1.1012.56 ± 0.6542.75 ± 1.35
30% OT30.0425.03 ± 5.705.90 ± 1.548.46 ± 1.6235.23 ± 6.57
Table 2. Analytical curve data.
EventsLine EquationR
P1 (1.93 to −24 °C)y = 38.09 − 0.4156 x−0.9027
P2 (−55 to −64 °C)y = 28.56 − 0.8015 x−0.9723
P3 (−56 to −30 °C)y = 26.02 − 0.5451 x−0.9903
P4 (−7.38 to 19.84 °C)y = 41.02 − 0.08693 x−0.3473
Disclaimer/Publisher’s Note: The statements, opinions and data contained in all publications are solely those of the individual author(s) and contributor(s) and not of MDPI and/or the editor(s). MDPI and/or the editor(s) disclaim responsibility for any injury to people or property resulting from any ideas, methods, instructions or products referred to in the content.

