4. Results and Discussion
4.1. Flow-Field Characteristics and Analysis
To investigate the generation and evolution mechanisms of unsteady flow within the entire flow passage under the turbine-mode operation of a pump turbine, we first conducted an in-depth analysis of the flow structures in both the cascade (stay vane and movable guide vanes) and the VS.
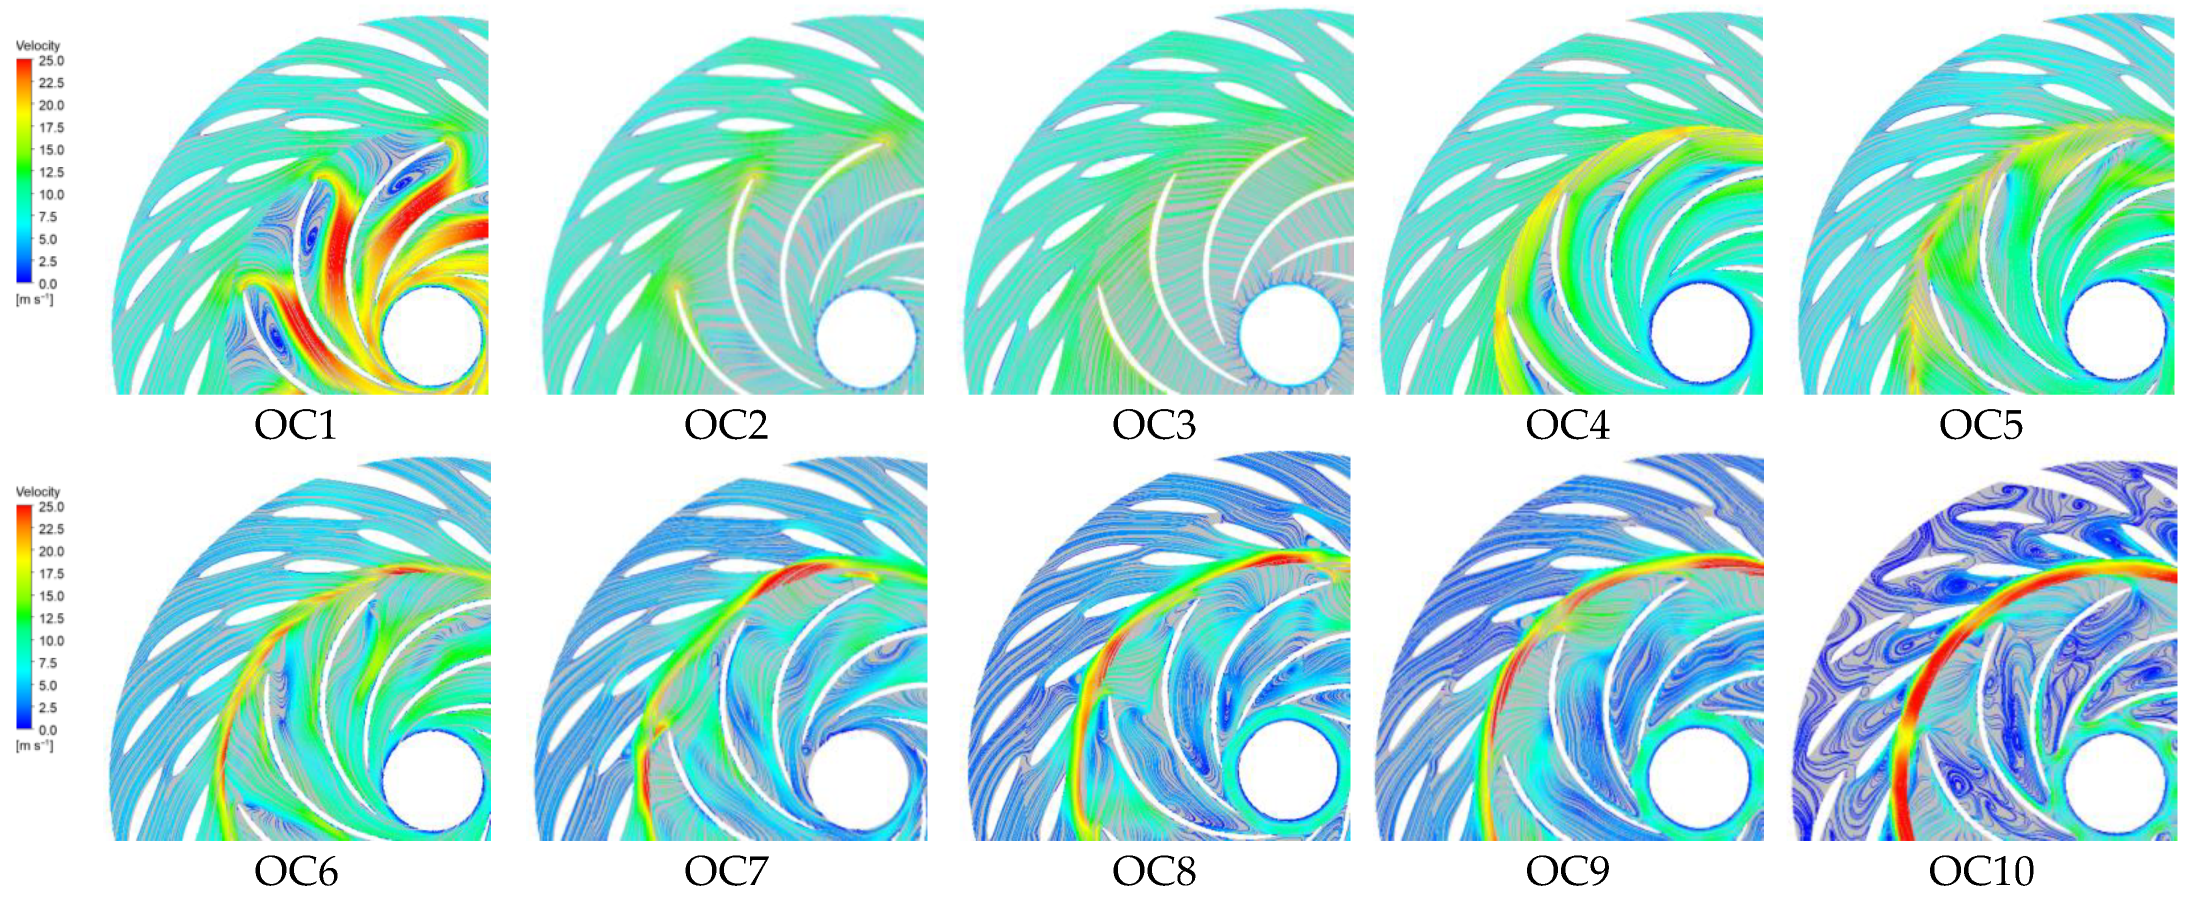
Figure 8 presents the velocity streamline distributions across ten characteristic operating conditions spanning the full operational range, showing the flow patterns at the fixed guide vanes, movable guide vanes, vaneless space, and runner blades. As shown in
Figure 8, the streamline distributions in the cascade and VS underwent significant modifications when transitioning from the low-speed condition (OC1) to the near-zero-flow condition (OC10).
This study conducts in-depth research on various flow phenomena within the unit, investigates the unsteady flow characteristics across the full operating range, and comprehensively analyzes multiple types of flow instabilities. The research holds practical significance for optimized design, operation, and control of the unit, and is vital for enhancing stable operation of pumped storage power stations in modern power grids.
Detailed flow analysis revealed that during OC1 operation, the unit experienced high inflow discharge but low rotational speed, resulting in a large inflow incidence angle at the runner blade leading edge (BLE). This creates a significant flow impingement on the blade pressure surface (BPS), forming a stagnation zone at the impact location where flow separation occurs. The separated flow develops two distinct counter-directed components: an attached flow component along the BPS following the inter-blade passage downstream and a reverse flow component toward the VS. The VS-directed component interacts with the circumferential inflow in the VS, creating a flow obstruction that accelerates into a high-velocity jet near the runner blade tip. This jet propagates downstream and converges with the BPS-attached component in the mid-chord region of the inter-blade passage, forming a localized high-velocity zone. The pronounced velocity gradient between the blade suction surface (BSS) and the BPS establishes a strong pressure gradient, generating large-scale attached vortices along the BSS that exhibit an axisymmetric distribution about the rotational axis of the runner.
Under OC2 conditions, with minimal flow variation but an approximately four-fold increase in rotational speed compared to OC1, the flow separation at the BLE disappears completely, eliminating both the stagnation zone and jet phenomena observed previously. The attached vortices in the inter-blade passage vanish. Instead, a wavelike flow pattern developed within the runner passage, with high-velocity regions predominantly distributed along both sides of the BLE. The VS exhibits slightly higher velocities near the blade tip region compared to other VS locations, significantly influencing the outflow from the movable guide vanes. Notably, pronounced wake effects emerge at the trailing edges of the guide vanes. When transitioning to the OC3 operation, further rotational speed enhancement leads to substantial flow pattern improvement in the inter-blade passages. The high-velocity zones became more uniformly distributed, primarily concentrated in the runner inlet region and VS. This resulted in markedly improved flow conditions at the movable guide vane outlet section.
Under OC4 conditions with a further increased rotational speed but reduced flow rate, the inflow in the cascade region interacts with the high-speed circumferential flow in the VS, generating a high-velocity jet near the BSS that propagates downstream. This jet establishes a strong pressure gradient between the pressure and suction surfaces, inducing severe flow separation across nearly the entire BPS, without forming distinct vortex structures. The high-velocity flow in the VS creates a pronounced velocity demarcation line between the movable guide vane outlet and runner inlet regions, with significantly lower velocities observed near the guide vane side compared with the runner inlet side. Transitioning to the OC5 operation, the cascade inflow experiences substantial disturbance upon interacting with the VS high-speed circumferential flow, leading to flow pattern deterioration in the inter-blade channels. Flow separation occurs both at the BPS near the runner inlet region and at the BSS owing to unstable inter-blade flow conditions.
When the OC6 operation approaches runaway conditions, a preliminary high-speed water ring begins to form in the VS, with velocities significantly influenced by the runner blade tip position. The rotating blades disturbed the high-speed VS inflow near the tip region, causing reverse flow tendencies along the BSS. Localized small-scale vortex structures emerge at discrete blade positions.
Under runaway conditions (OC7), a highly asymmetric high-speed water ring formed in the VS, significantly disrupting the flow at the movable guide vane outlet. Localized small-scale vortex structures emerge near individual guide vanes, whereas VS flow instability peaks near the runaway speed. The flow pattern at the runner inlet severely deteriorated, substantially affecting the runner passage flow characteristics.
During braking (OC8 and OC9), the vortex structures within the runner inter-blade channels progressively enlarged. Meanwhile, the VS flow instability gradually diminished, continuing through the near-zero-flow condition (OC10). Under the OC8 and OC9 operations, the unstable VS flow extends upstream, reaching the vicinity of the movable guide vane inlet. Under the OC10 condition, the entire dual-cascade region was filled with numerous vortices of varying scales. This results in a large-scale vortex formation within the fixed guide vanes propagating toward the spiral case region.
A comprehensive analysis revealed distinct flow characteristics in the cascade region under different operating conditions. Under OC1, large-scale attached vortex structures dominate all inter-blade channel BSSs, accompanied by pronounced flow separation on the BPS. As the rotational speed increases from OC1 to OC3, a substantial flow-field improvement occurs within the inter-blade passages. In the OC4 operation, significant flow separation developed on both the BSS and BPS of all blades, while VS velocities increased markedly. With progressive flow rate reduction, vortex structures re-emerged in the inter-blade channels, exhibiting asymmetric growth patterns. The expanding vortices generate substantial reverse flow toward the VS, intensifying the flow instability that peaks under runaway conditions. During turbine braking operations, large-scale passage vortices obstruct multiple flow channels with instability propagating upstream to the fixed guide vanes. Under near-zero-flow conditions (OC10), the reversed flow at the fixed guide vanes penetrated into the spiral case region.
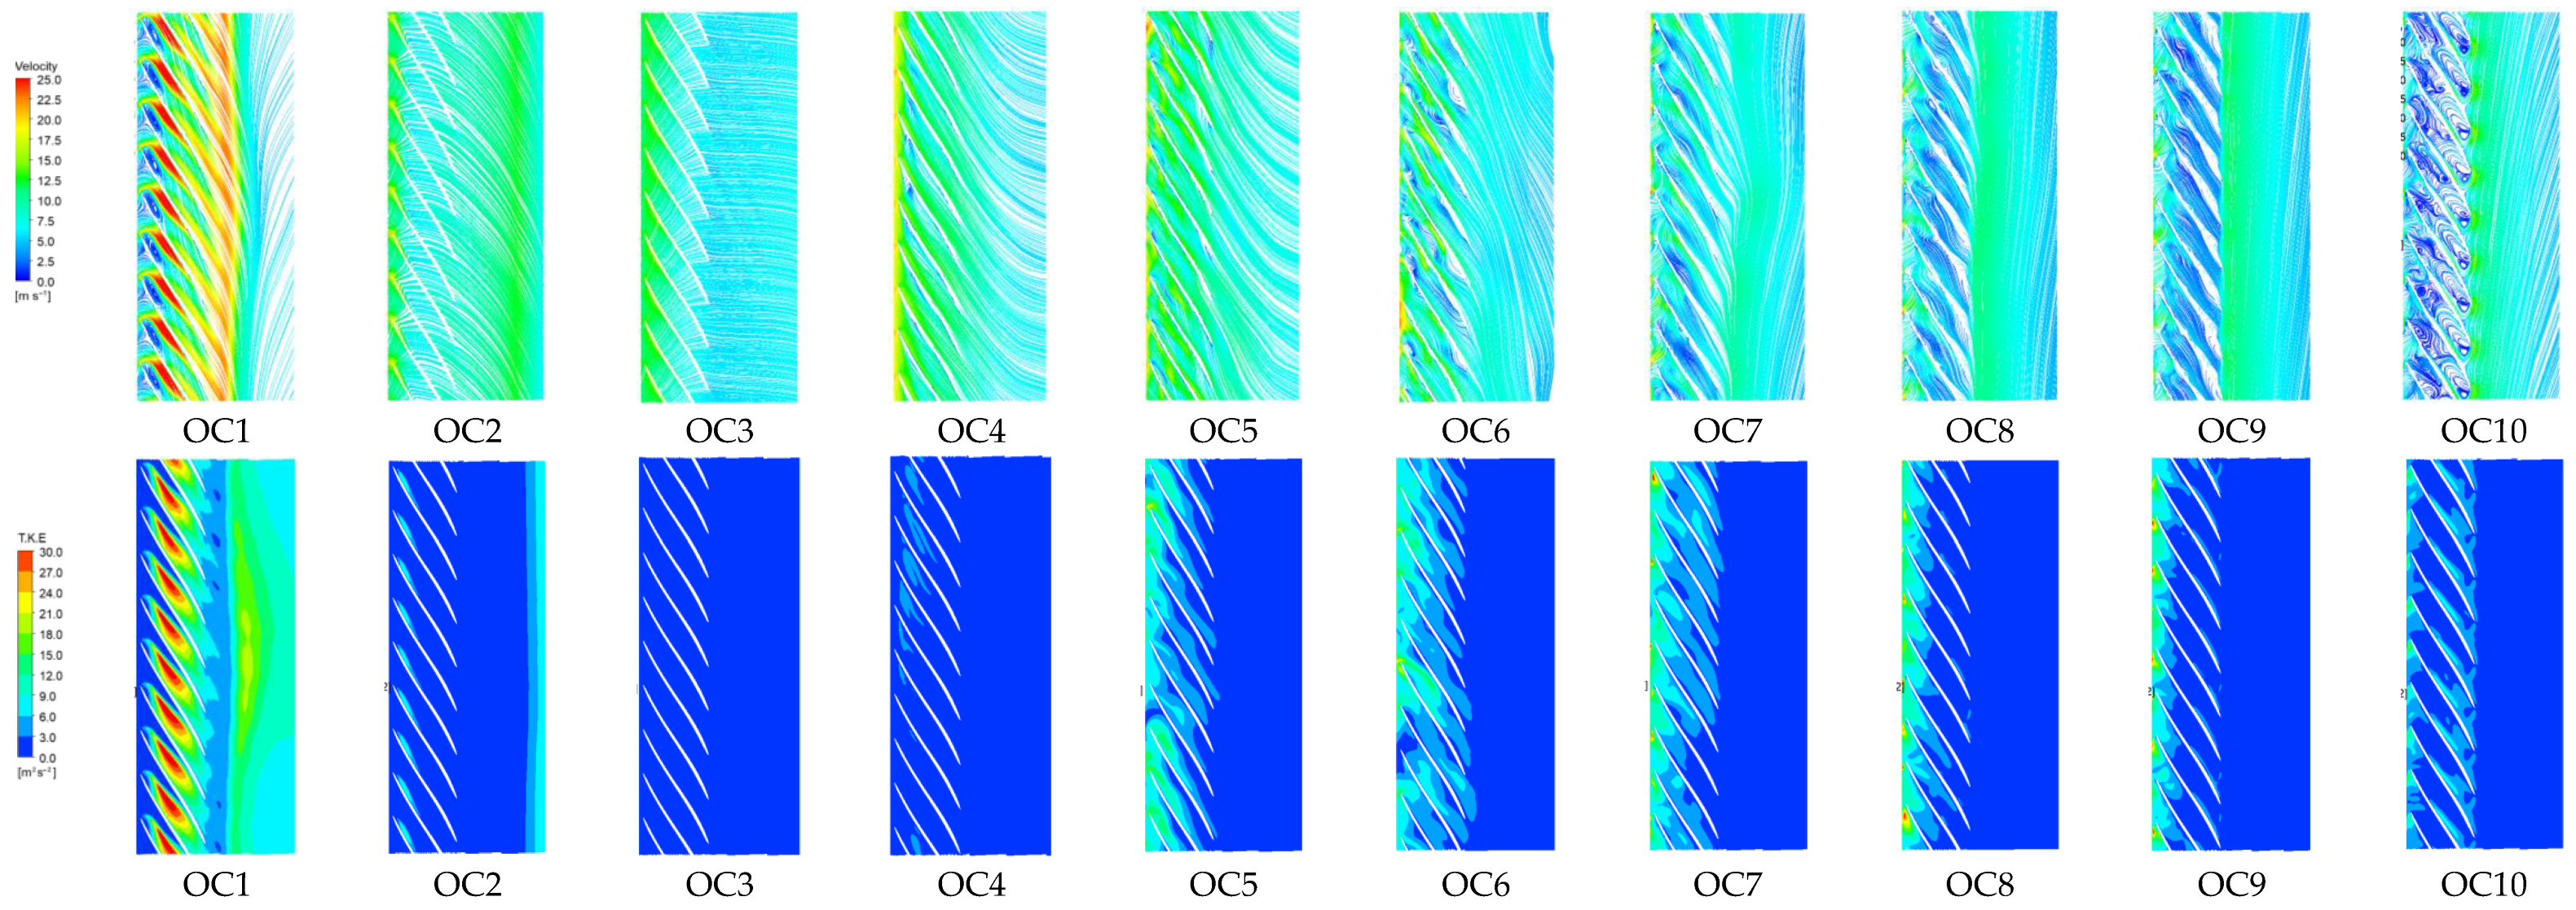
Figure 9 shows the velocity streamline distributions and turbulent kinetic energy (TKE) fields within the runner inter-blade passages under various operating conditions. The comprehensive analysis revealed that the flow field undergoes a progressive transition from initially disturbed patterns to improved conditions, followed by subsequent deterioration as the runner’s rotational speed and flow rate vary. Correspondingly, the passage vortices exhibited a complete evolutionary cycle, from complete disappearance to re-emergence, followed by continuous expansion and spatial migration. Notably, the runner outlet region demonstrates significant variations in the flow characteristics owing to disturbances induced by the draft tube backflow. Furthermore, distinct operating conditions profoundly influenced both the magnitude and spatial distribution of turbulent kinetic energy.
Detailed flow analysis of the dual-cascade region revealed distinct flow characteristics under OC1 conditions. Flow separation occurred at the runner BLE, generating two distinct flow components accompanied by jet formation. The presence of high-velocity zones induced the attachment of vortices along the BSS. Further examination of
Figure 9 demonstrates the vortex structures and reverse flow phenomena near the runner outlet region. The draft tube backflow penetrates the runner discharge area, creating flow obstruction and resulting in a pronounced high-velocity zone at the runner blade trailing edge.
Through analysis of turbulent kinetic energy distribution in the inter-blade flow passage of the runner.. Key observations include the following: (1) An extensive high-TKE region develops in the mid-to-downstream portion of the inter-blade passages, primarily attributed to the passage vortices. (2) Elevated TKE levels at the runner outlet display circumferential symmetry with a concentrated high-TKE core region. (3) Draft tube vortex structures were identified as the dominant mechanism for TKE enhancement at the runner outlet. These high-TKE regions indicated strong turbulent fluctuations and increased energy dissipation, which adversely affected the hydraulic efficiency of the unit.
Under OC2 conditions, the velocity streamline analysis revealed the complete disappearance of the flow separation. The high-velocity zone was primarily concentrated near the blade tip region and extended along the BSS, forming an attached high-speed flow. The pressure gradient induced a wavelike streamline pattern in the mid-to-downstream region of the inter-blade passage, accompanied by relatively low flow velocities. Additionally, a pronounced wake flow was observed at the blade trailing edge, extending toward the runner outlet. The flow pattern at the runner outlet showed significant improvement, with no reverse flow detected.
The TKE distribution indicates elevated TKE levels in two key regions: the high-velocity zone along the BSS near the runner inlet and runner outlet. This was attributed to the strong flow disturbances caused by the high-speed attached flow along the BSS. Furthermore, the residual backflow from the draft tube exerted a minor influence on the runner outlet flow. Under the OC3 conditions, which approach the best efficiency point (BEP), the runner flow field exhibits superior uniformity without distinct high-velocity zones. The absence of localized flow instabilities resulted in a homogeneous TKE distribution, with no significant high-TKE regions observed.
Under the OC4 operating conditions, the flow velocity in the VS increased significantly, reaching its maximum near the blade tip region. A high-velocity jet developed along the suction surface and propagated downstream, inducing vortex formation along the BPS. These vortical structures tend to extend toward the runner outlet, causing flow fluctuations in the region between the blade trailing edge and runner discharge. Analysis of the TKE distribution revealed that elevated TKE levels were primarily concentrated in the vortical flow regions, although with relatively moderate intensity.
Under OC5 operating conditions, the velocity streamline analysis revealed a non-uniform flow distribution in the VS characterized by marginally reduced velocities, while relatively high flow speeds persisted near the runner blade tip region. The flow separation zone migrated to the BSS of the blade’s leading edge, generating a pronounced low-velocity region along the BSS side of the inter-blade passage. Unsteady flow conditions at the inlet region significantly perturb downstream flow patterns, inducing marked flow separation at the trailing edge of the runner blade and substantial flow fluctuations in the discharge region.
The TKE distribution demonstrated concentrated high-TKE regions in both the VS and inter-blade channels, exhibiting strong spatial non-uniformity with predominant accumulation near the blade BSS regions. This TKE pattern indicates enhanced turbulent fluctuations and pronounced flow instability adjacent to the blade suction surfaces, suggesting intensified energy dissipation mechanisms in these areas. The observed flow characteristics under the OC5 conditions reflect a complex interaction between the separation phenomena, velocity gradients, and turbulent energy distribution within the runner passage.
Under OC6 conditions approaching the runaway speed, the flow field exhibits progressive deterioration characterized by the development of prominent vortex structures in both the vaneless space and along the blade suction surfaces. These large-scale vortical flows create substantial blockages within the inter-blade passages, leading to degraded flow conditions at the blade trailing edges where flow separation occurs owing to enhanced shear stresses in the runner discharge region resulting from increased rotational speeds.
The runner outlet region experiences significant influence from wall-bounded reverse flow originating in the draft tube, while turbulent kinetic energy analysis reveals patterns similar to OC5 conditions but with expanded spatial extent and more pronounced heterogeneity. The intensified turbulent kinetic energy distribution, particularly in regions affected by developing vortex structures and flow separation zones, clearly indicates heightened flow instability as the unit approaches runaway conditions.
These flow characteristics collectively demonstrate how vortical flows, flow separation phenomena, and enhanced turbulent energy dissipation progressively degrade the hydraulic performance during operation near the runaway speed. The compounding effects of these flow mechanisms create a feedback loop, which further exacerbates the instability of the flow field in this critical operating regime.
Under runaway conditions (OC7), the velocity streamline patterns revealed a distinct expansion of the vortex structure within the VS, accompanied by pronounced flow separation at the leading edge of the runner blade. This separation phenomenon generates large-scale vortical structures in the inter-blade passages, which significantly obstruct the flow path. Concurrently, the flow instability at the blade trailing edge intensifies significantly owing to these flow disturbances.
The runner outlet region is substantially affected by the strong backflow from the draft tube, which establishes a high-velocity radial flow between the blade trailing edge and runner outlet. The TKE distribution maintains spatial characteristics similar to OC6 conditions while exhibiting increased intensity levels, particularly in regions influenced by expanding vortices and flow separation.
These flow features collectively demonstrate the progressive flow deterioration characteristic of the runaway operation, where enhanced vortex development, intensified flow separation, and elevated turbulence levels create a self-reinforcing cycle of instability. The emerging radial flow patterns at the runner outlet represent a critical aspect of this unstable operating regime that significantly affects the overall flow behavior in the discharge region.
Under OC8 conditions, the turbine unit operates in the braking mode with a relatively high flow velocity in the VS and highly disordered flow patterns. Flow separation occurs at the leading edge of the runner blades, generating large-scale vortex structures along with multiple small-scale vortices in the inter-blade channels, resulting in nearly complete flow blockage with minimal throughflow velocity. In this operating regime, the runner outlet region is entirely dominated by backflow structures from the draft tube, forming predominantly high-velocity radial flow patterns at the runner discharge. The turbulent kinetic energy distribution reveals that high-intensity regions are primarily concentrated in the VS while showing significant attenuation within the inter-blade passages. The flow field deteriorates further under OC9 conditions, with a continued reduction in the turbulent kinetic energy intensity.
During the OC10 operation, the inter-blade channels exhibit extensive vortex structures of varying scales, with each passage developing large vortical structures near the runner blade trailing edge. The flow passages experience complete blockage with markedly diminished flow velocities in both the VS and inter-blade regions. A substantial decrease in turbulent kinetic energy intensity was observed throughout the flow domain.
Under off-design conditions, flow separation at runner blade leading edges (BLEs) generates vortices and high-velocity jets along blade suction surfaces (BSSs). Runaway conditions exhibit progressive flow deterioration: large-scale vortices expand in the vaneless space, intensifying backflow-induced radial jets and TKE heterogeneity. Braking modes show complete passage blockage with attenuated TKE, confirming that vortex-driven energy dissipation directly compromises hydraulic performance at extreme operating points.
4.2. Evolution of Draft Tube Flow Dynamics
To gain a deeper insight into the flow instability mechanisms and their propagation within the passage of a pump turbine, the preceding analysis reveals that the flow characteristics in the draft tube exert a significant influence on the runner region. Consequently, unsteady flow dynamics in the draft tube must be rigorously considered. This section presents a comprehensive investigation of the flow characteristics and evolutionary mechanisms within the draft tube under various operating conditions by analyzing the velocity streamline distribution, pressure field, and vortex core structure in the conical section of the draft tube.
The flow field in the conical section of the draft tube exerted a substantial influence on both the upstream and downstream flow domains, necessitating a focused analysis of this critical region.
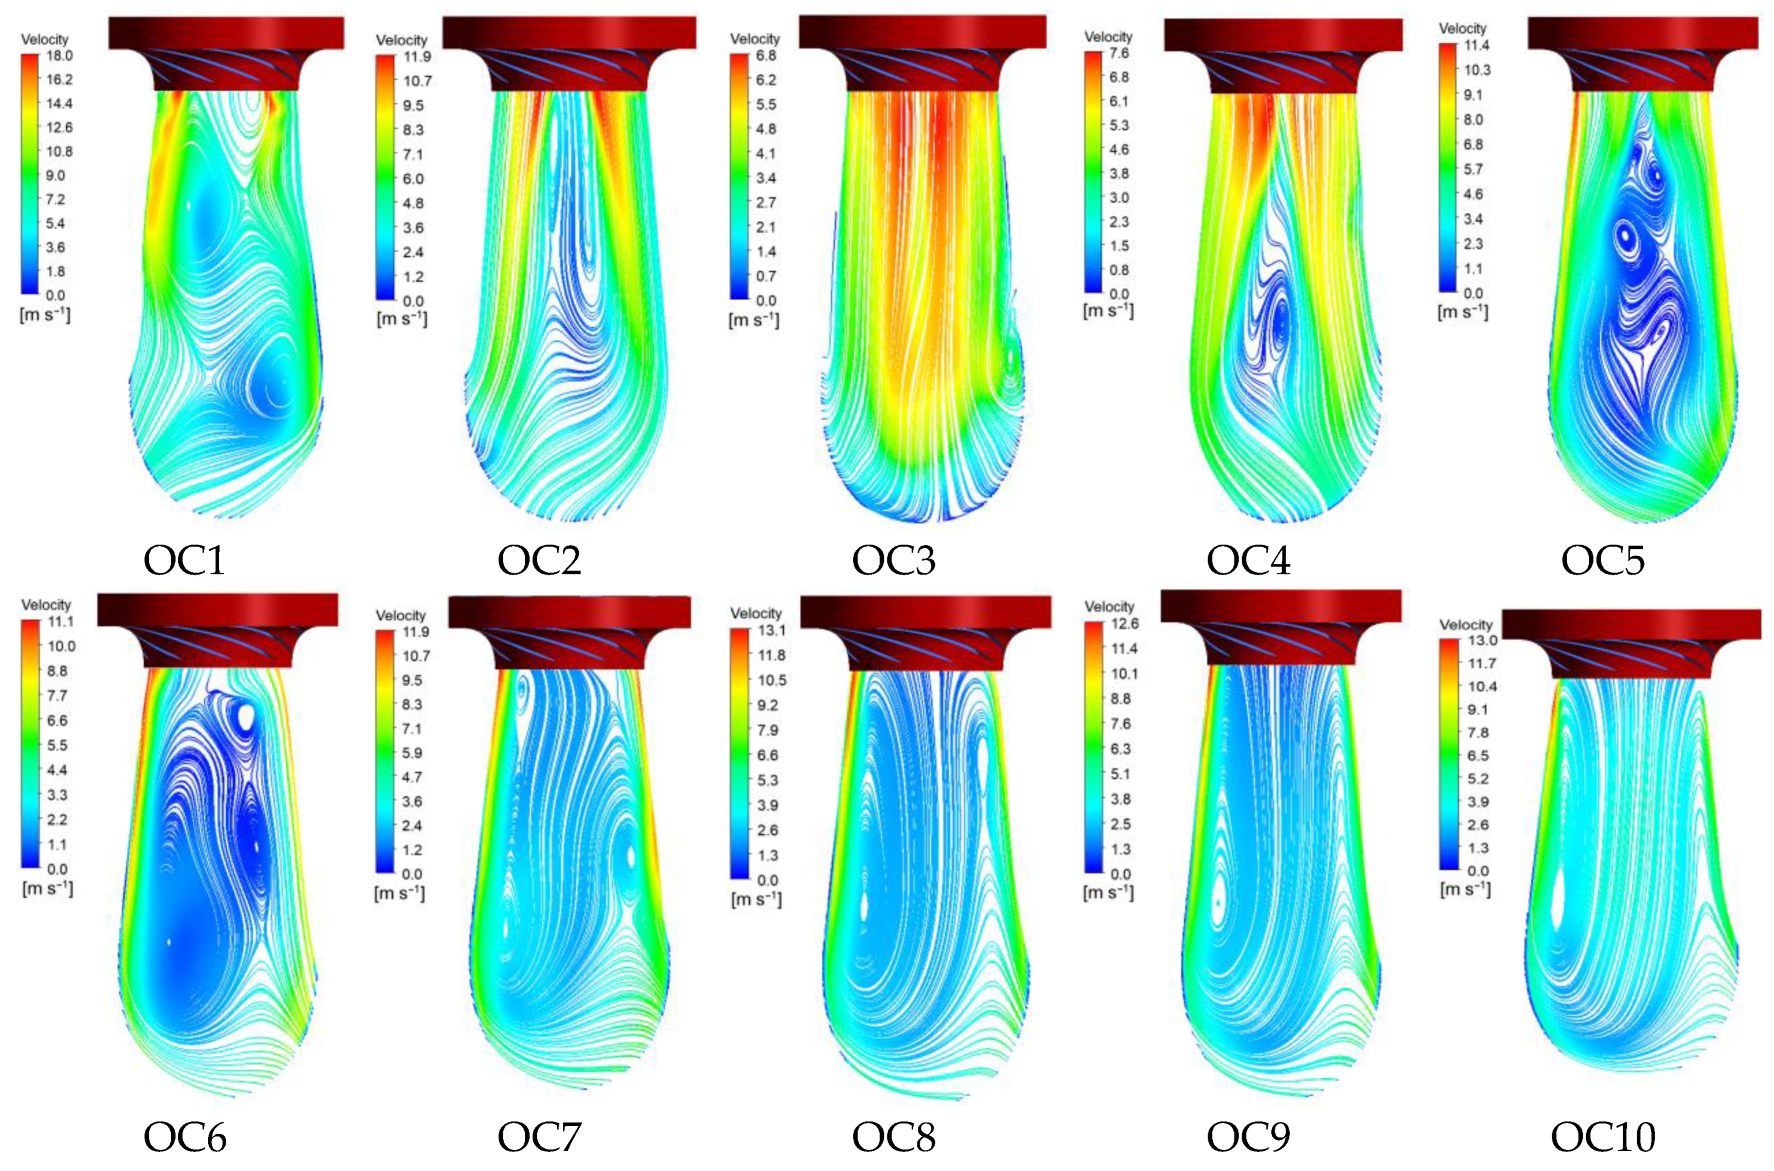
Figure 10 shows the velocity streamline distributions within the conical section of the draft tube under various operating conditions. The results demonstrate that the vortex patterns and backflow phenomena in the conical section exhibit distinct variations with changes in the runner rotational speed and flow rate, significantly altering the flow characteristics in the adjacent upstream and downstream regions.
The analysis of ten operating conditions reveals distinct vortex-driven flow patterns in the conical draft tube. Under OC1, three dominant vortices develop: a primary reverse flow core at the inlet obstructing incoming flow, a secondary wall-attached mid-section vortex bifurcating upstream flow, and an elbow vortex formed through vortex-rotating flow/wall-jet interaction. This configuration induces near-complete central blockage, confining high-velocity flow to the wall boundary and altering upstream/downstream characteristics.
OC2 exhibits improved flow with increasing rotational speed, featuring two axially elongated inlet vortices that establish an organized high-velocity region between vortices and walls. Slender vortex structures cause moderate elbow flow perturbation. Transitioning to near-optimal OC3 conditions yields superior conical flow with enhanced velocity magnitude, characterized by a symmetric axial high-velocity core and minor elbow vortices exerting negligible runner influence.
Flow degradation initiates at OC4 with a large mid-to-downstream central vortex. While the inlet maintains high velocity and organized flow with minimal runner impact, this vortex significantly disturbs incoming flow. Substantial deterioration occurs at OC5, featuring multiple central non-uniform vortices and a weak centerline reverse flow toward the runner. These vortices amplify downstream, while primary flow becomes wall-confined, substantially influencing both upstream and downstream domains.
OC6 undergoes severe vortex amplification causing draft-tube-wide blockage. Enlarged vortices substantially obstruct the inlet center, forcing radial deflection toward the runner and inducing notable runner disturbance. During OC7 (runaway speed operation), the conical flow markedly deteriorates with asymmetric multiscale vortices generating highly disorganized patterns and extensive runner-directed backflow. This instability creates complex vortex–main flow interactions, significantly compromising hydraulic performance.
Braking condition OC8 develops two disparate vortices: a dominant cross-section-filling vortex generating substantial runner backflow and near-complete elbow blockage, alongside a smaller vortex. In OC9, the smaller vortex dissipates, while the primary vortex radially expands, intensifying runner backflow penetration. OC10 maintains vortex configurations and backflow intensity patterns consistent with OC9.
The conical draft tube’s vortex evolution directly dictates hydraulic performance across operating conditions. Under low-load regimes (OC1), triple-vortex structures induce near-complete central blockage, forcing wall-jet dominance and upstream/downstream flow distortion. Optimal conditions (OC3) exhibit symmetric axial flow with minimal vortex influence. Progressive deterioration emerges from OC4 onward, characterized by amplified vortices causing radial flow deflection and intensified backflow—culminating in OC7 runaway where asymmetric vortices generate severe runner-domain disturbances. Braking modes (OC8–OC10) feature persistent large-scale vortices establishing near-total elbow blockage through sustained reverse flow penetration, notably compromising efficiency.
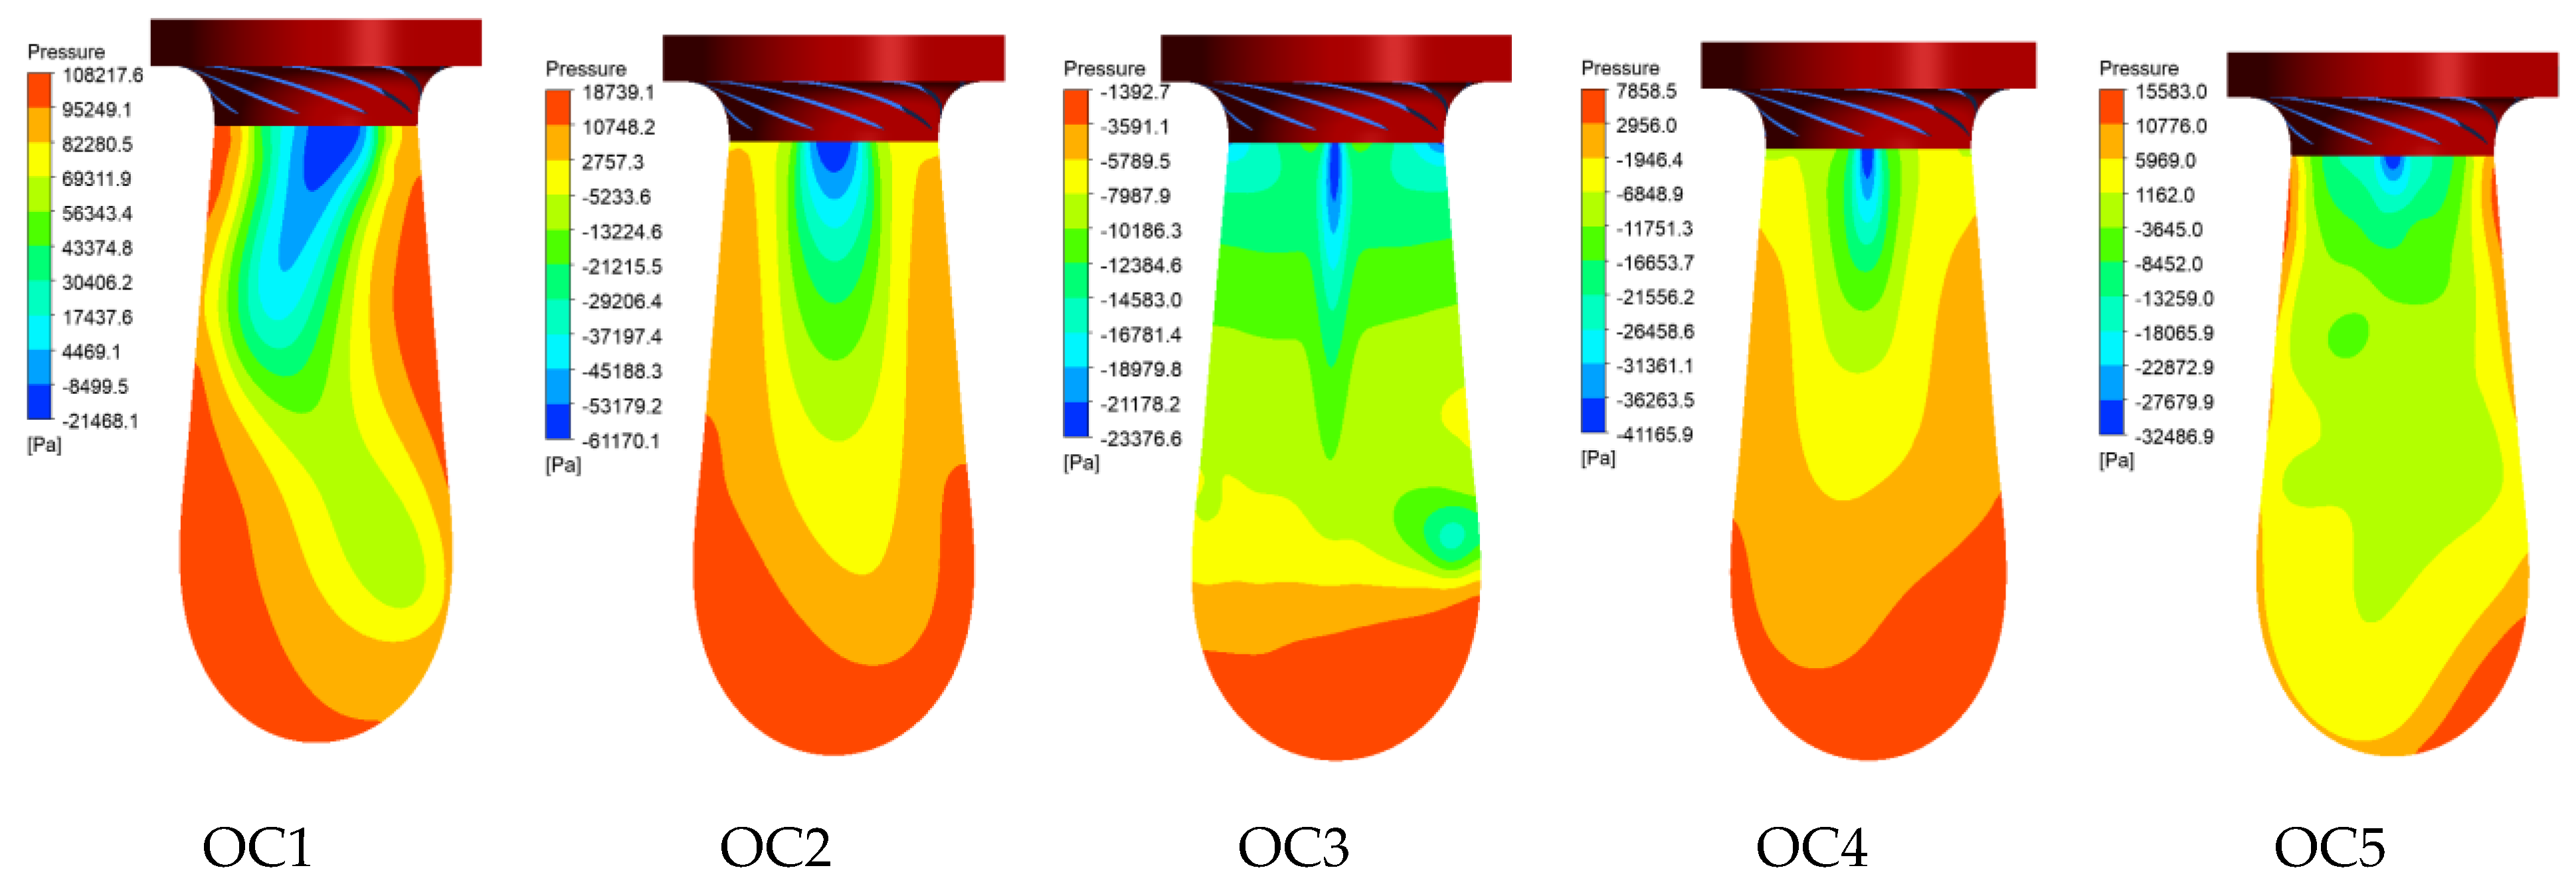
Figure 11 details the meridional pressure distribution and vortex core structures within the conical draft tube section across ten operating conditions. During OC1, a helical vortex rope forms, inducing progressively increasing downstream pressure. This structure generates rotationally symmetric low-pressure regions (LPRs) along the tube axis, creating significant pressure non-uniformity from inlet to elbow. The rope’s rotational motion drives substantial pressure pulsations throughout the draft tube.
OC2 features a distinct central LPR at the draft tube inlet, establishing a stagnation zone. A prominent large-scale vortex rope creates a progressively increasing axial pressure gradient along the conical section, with the LPR exhibiting relative symmetry. Transitioning to the optimal OC3 condition reveals axially symmetric pressure distribution about the centerline. Minimum pressure occurs near the inlet, followed by gradual downstream recovery. A slender vortex filament develops along the axis, generating only a minimal central LPR due to residual runner vorticity. The flow field remains largely unaffected by vortices or pressure fluctuations, indicating superior hydraulic performance.
OC4 exhibits a vortex rope structure resembling OC2 but with a markedly reduced length and cross-section, maintaining comparable pressure-field characteristics. At OC5, the conical section undergoes substantial pressure reduction with diminished high-pressure regions (HPRs), resulting in more uniform distribution. The vortex rope dissipates nearly completely, leaving only localized wall-bound vortex cores at the inlet.
OC6 development is characterized by an extensive central LPR driven by strong backflow vortices propagating toward the runner, substantially altering draft tube hydraulics. While the coherent vortex rope disappears, a compact arrangement of vortex cores forms along the entire wall periphery, signaling complex secondary flow.
During runaway speed operation (OC7), helically distributed LPRs substantially degrade flow stability. This configuration intensifies upstream-propagating backflow, significantly disrupting runner inflow. Pronounced helical vortex cores along the wall boundary create complex 3D separation patterns. These instabilities collectively drive the unit into critical instability, characterized by severe hydraulic oscillations and energy dissipation.
OC8 generates an expanded LPR originating at the inlet and encompassing most of the conical section. This extensive low-pressure region substantially disrupts the flow field, exacerbating backflow while inducing densely distributed wall-bound vortex cores. Deterioration manifests through intensified reverse flow penetration into the runner and enhanced instability. Transitioning to OC9, both pressure distribution and vortex core configurations exhibit similar degradation patterns, with further amplification of LPR coverage and vortex core concentration. These characteristics precipitate marked performance deterioration, evidenced by severe pressure fluctuations and disordered vortex interactions.
In contrast to braking conditions (OC8–OC9), OC10 operation demonstrates a significantly reduced LPR confined to the central region, with complete absence at the draft tube inlet. This configuration indicates partial recovery from the extreme instability observed during braking, although residual flow disturbances persist in the core flow region.
Vortex rope dynamics in the conical draft tube dictate pressure-field characteristics across operating regimes. Helical vortex ropes under low-load conditions (OC1–OC2) generate rotationally symmetric low-pressure regions (LPRs) driving significant pressure non-uniformity and pulsations. Near-optimal operation (OC3) achieves axial pressure symmetry with minimal LPRs. High-load transitions (OC4–OC6) feature progressive vortex rope dissipation yielding uniform pressure distributions. Runaway conditions (OC7) develop helical LPRs that intensify backflow and three-dimensional separation. Braking regimes (OC8–OC10) exhibit expanding LPRs exacerbating backflow penetration and vortex core concentration, critically degrading hydraulic stability through amplified pressure fluctuations.
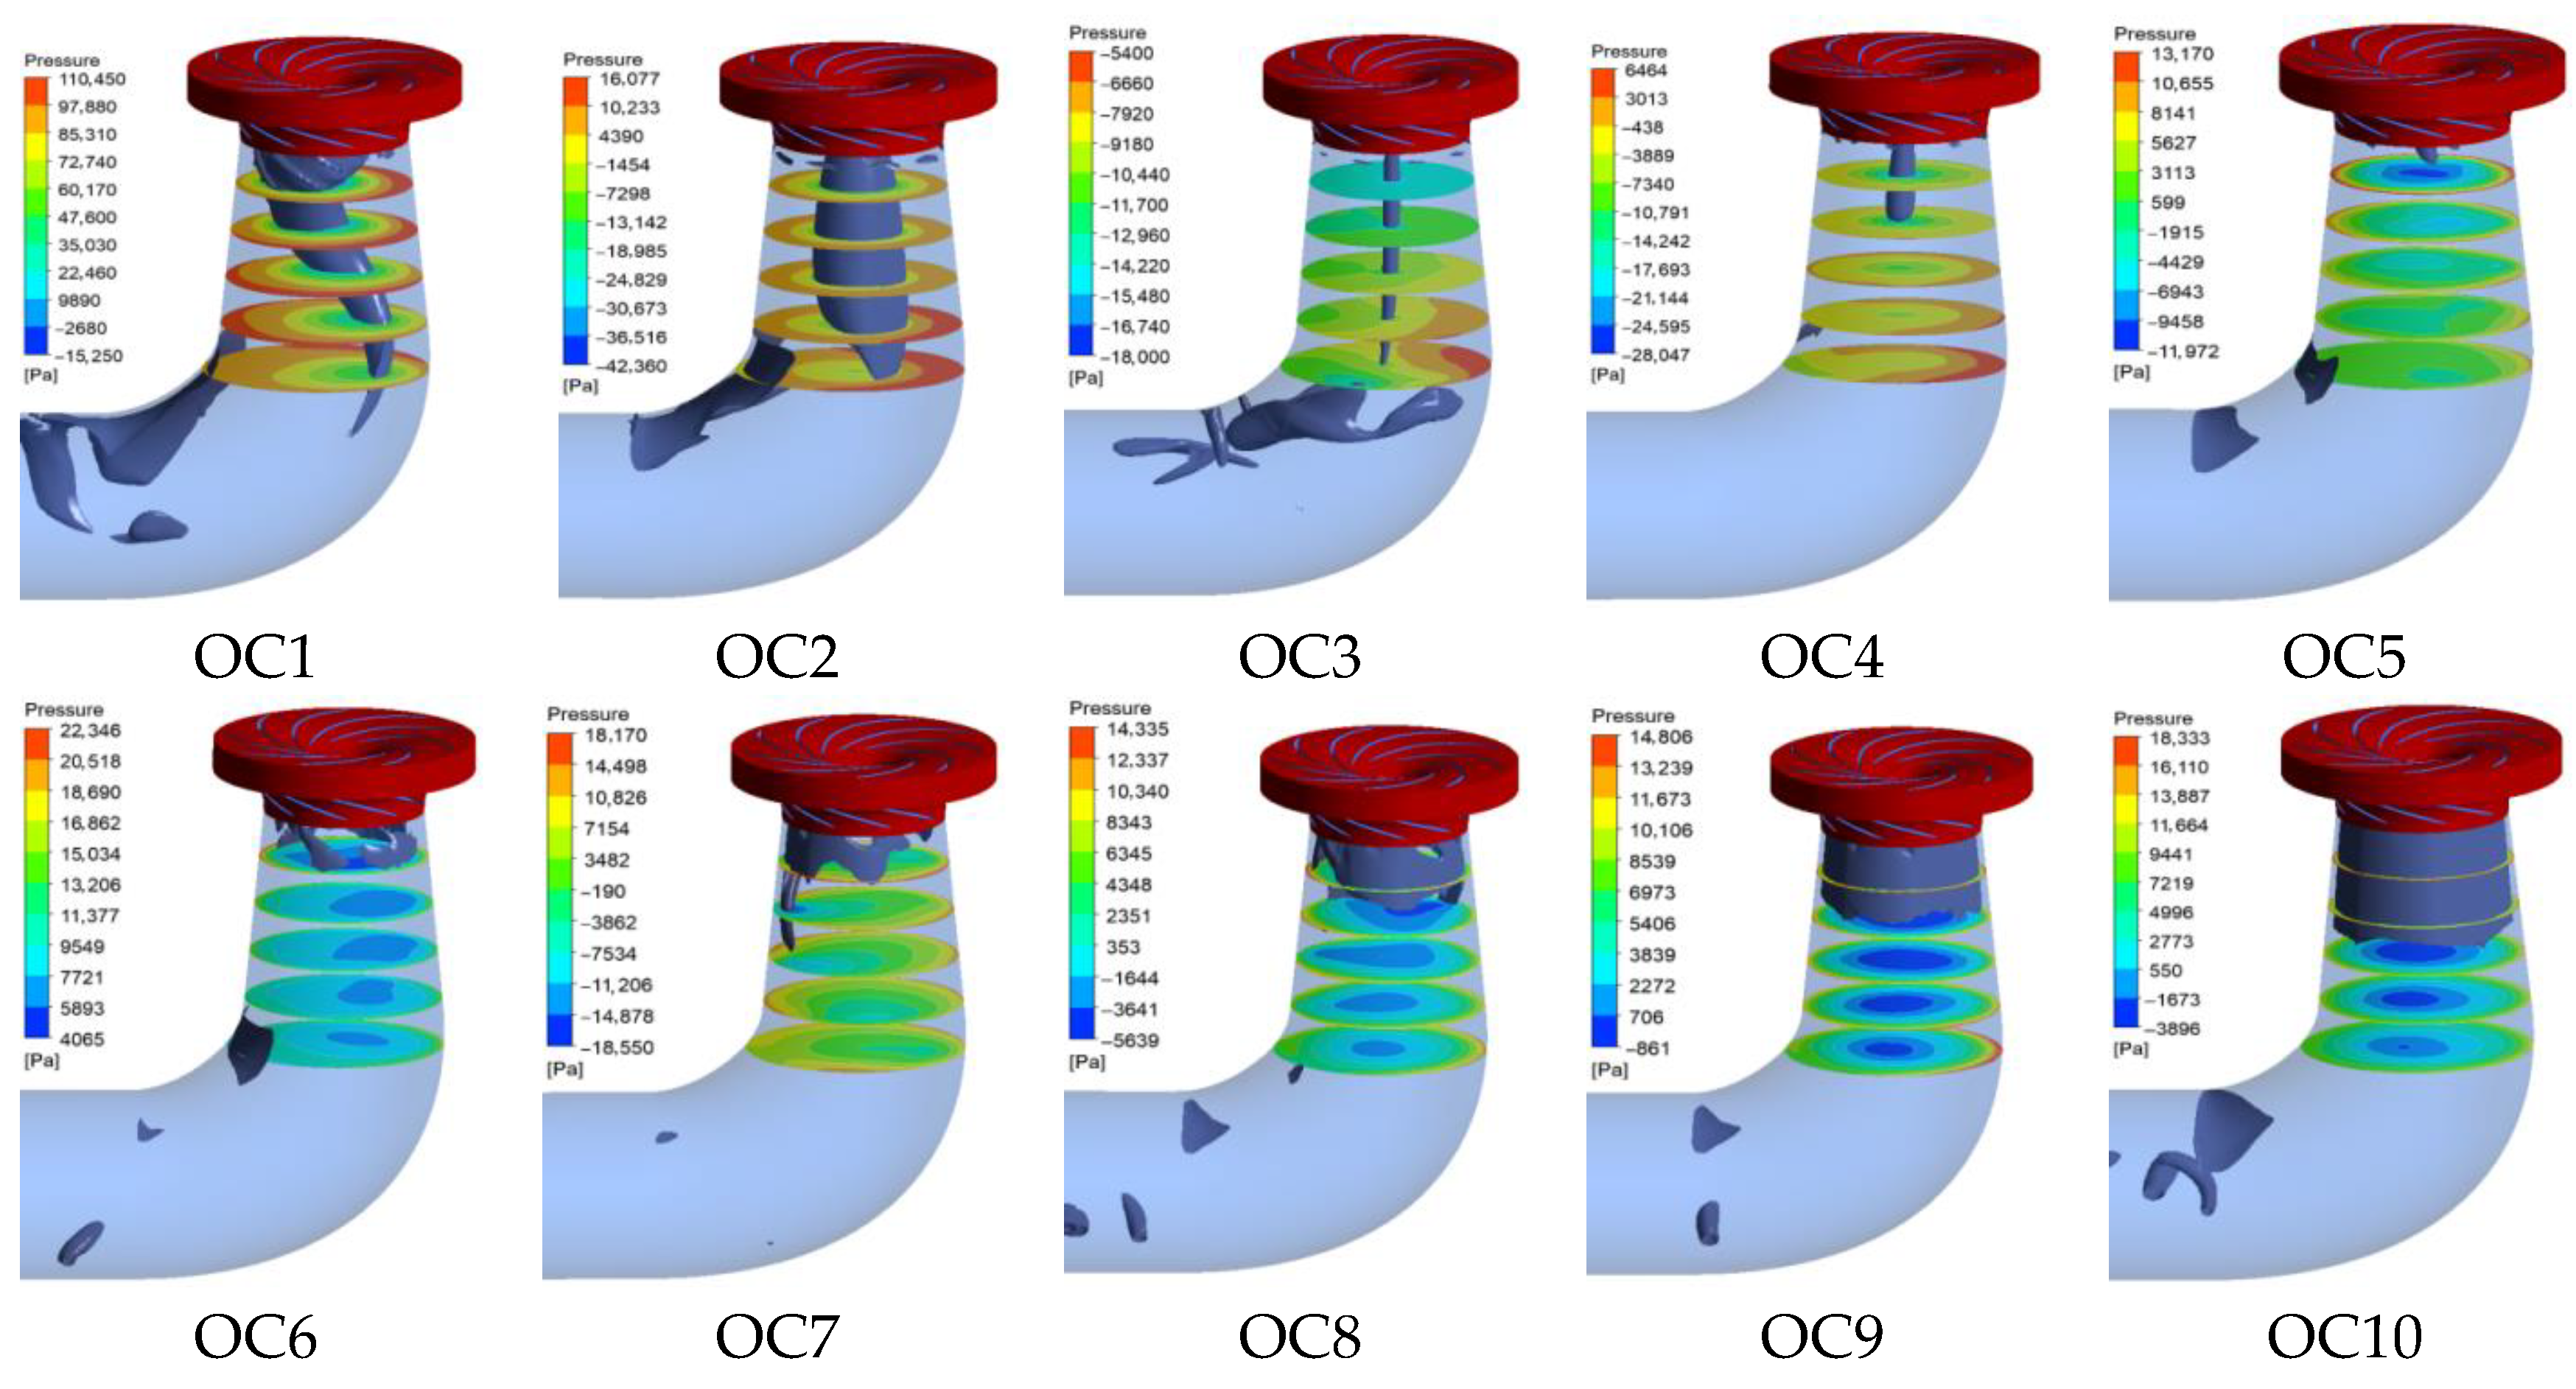
Figure 12 shows the vortex core distributions and pressure profiles at selected axial locations within the conical draft tube section under various operating conditions. The analysis employed five equally spaced measurement planes along the conical-section axis. The results demonstrate that under OC1–OC5 conditions, coherent vortex ropes consistently form in the central region, with OC1 exhibiting a pronounced helical vortex rope structure. During these operating regimes (OC1–OC5) characterized by high flow rates and rapidly increasing rotational speed, the vortex ropes undergo progressive attenuation in both the length and cross-sectional dimensions.
As the unit approaches runaway conditions in OC6, a fundamental transition occurs, where the central vortex rope completely dissipates from OC6 to OC10. Instead, well-defined vortex cores emerge along the wall boundary, showing an increasing spatial density as the flow rate decreases rapidly. The data revealed that all conditions, except OC4, developed distinct vortex core distributions in the elbow section, which significantly altered the flow characteristics of the draft tube through enhanced flow separation and secondary flow generation.
Analysis of the pressure distributions across various cross-sections revealed distinct patterns under different operating conditions. Under OC1 conditions, the LPR was confined within the helical vortex rope structure, whereas a well-defined HPR developed adjacent to the wall boundary. Transitioning to OC2 conditions, the pressure field was organized with symmetrically distributed LPRs in the central region and corresponding HPRs along the wall periphery. This symmetric configuration persists in the OC3–OC5 conditions for cross-sections near the draft tube inlet, maintaining central LPRs and wall-bounded HPRs with axial symmetry. However, in downstream sections approaching the elbow, the pressure distribution loses symmetry owing to vortex core interactions, although distinct LPRs and HPRs remain evident in the central and wall-adjacent regions, respectively. The OC6 condition exhibited irregular LPZs preferentially located near the outer wall of the elbow.
During the runaway operation (OC7), the LPRs appear at varying circumferential positions across different cross-sections. When the unit enters the braking conditions (OC8–OC10), OC8 develops relatively uniform wall-bounded HPRs with irregular but centrally located LPRs. In contrast, OC9–OC10 re-establish symmetric pressure distributions, with well-organized HPRs along the walls and corresponding LPRs in the central region.
Vortex core evolution governs conical draft tube pressure-field characteristics across operating regimes. Central helical vortex ropes under OC1–OC5 progressively attenuate with increasing flow rates, maintaining symmetric pressure distributions featuring central LPRs and wall-bounded HPRs. A critical transition occurs at OC6 where central vortices dissipate while wall-confined vortex cores intensify during decreasing flows, disrupting symmetry particularly in elbow sections. Runaway conditions (OC7) induce circumferential pressure disorganization, whereas braking regimes (OC8–OC10) re-establish axial symmetry despite persistent wall vortex cores, confirming that vortex-driven pressure patterns directly dictate draft tube hydraulic stability beyond critical operational thresholds.
4.3. Pressure-Field Characteristics and Analysis
The pressure pulsation characteristics exhibit a fundamental correlation with the evolution mechanisms of internal flow dynamics in hydraulic machinery. This investigation employed the relative pressure pulsation amplitude as a quantitative metric to assess pulsation intensity across various operating conditions, with particular emphasis on elucidating the underlying pulsation mechanisms in the VS through comparative analysis. The relative pressure pulsation amplitude is mathematically expressed as
where
represents the amplitude of the relative pressure pulsation,
represents the amplitude of the maximum pressure pulsation, and
represents the amplitude of the Minimum pressure pulsation.
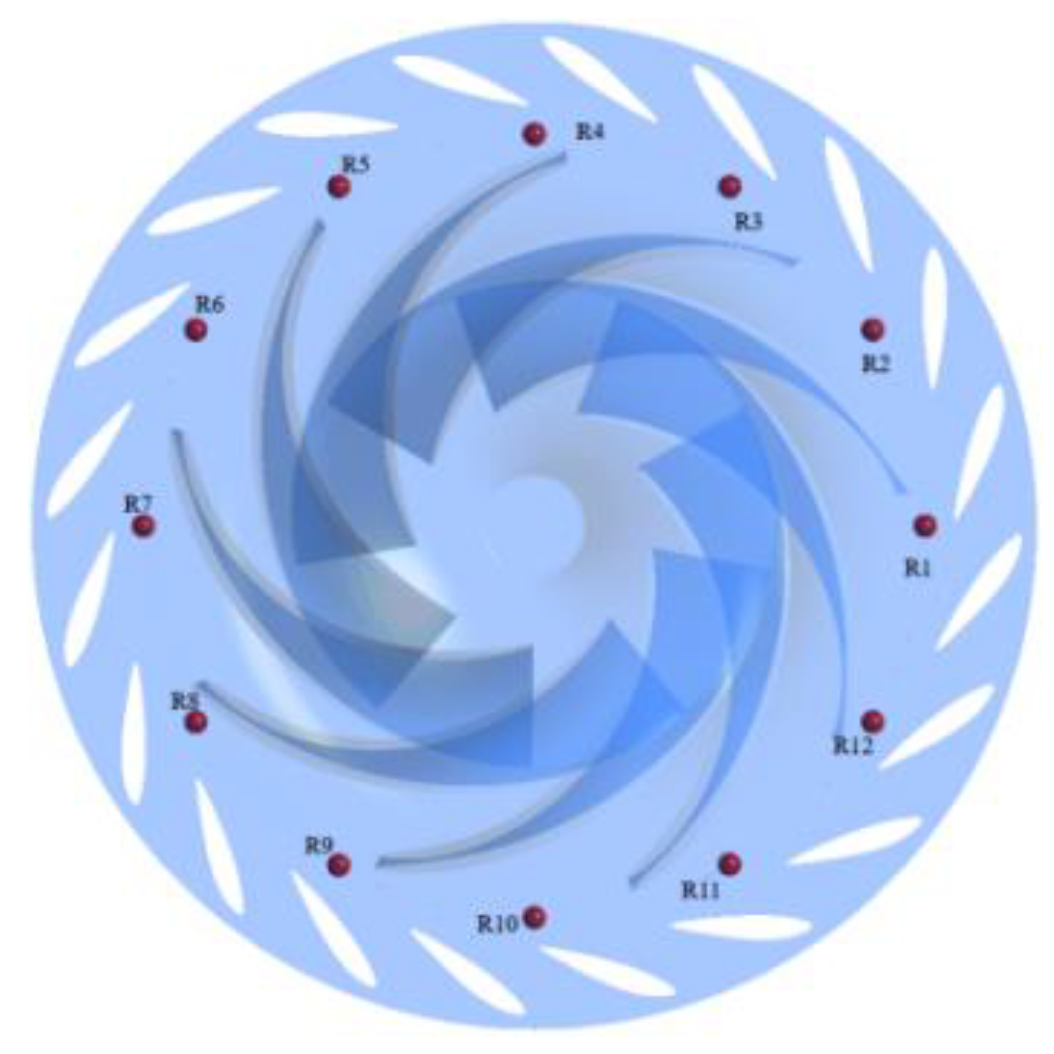
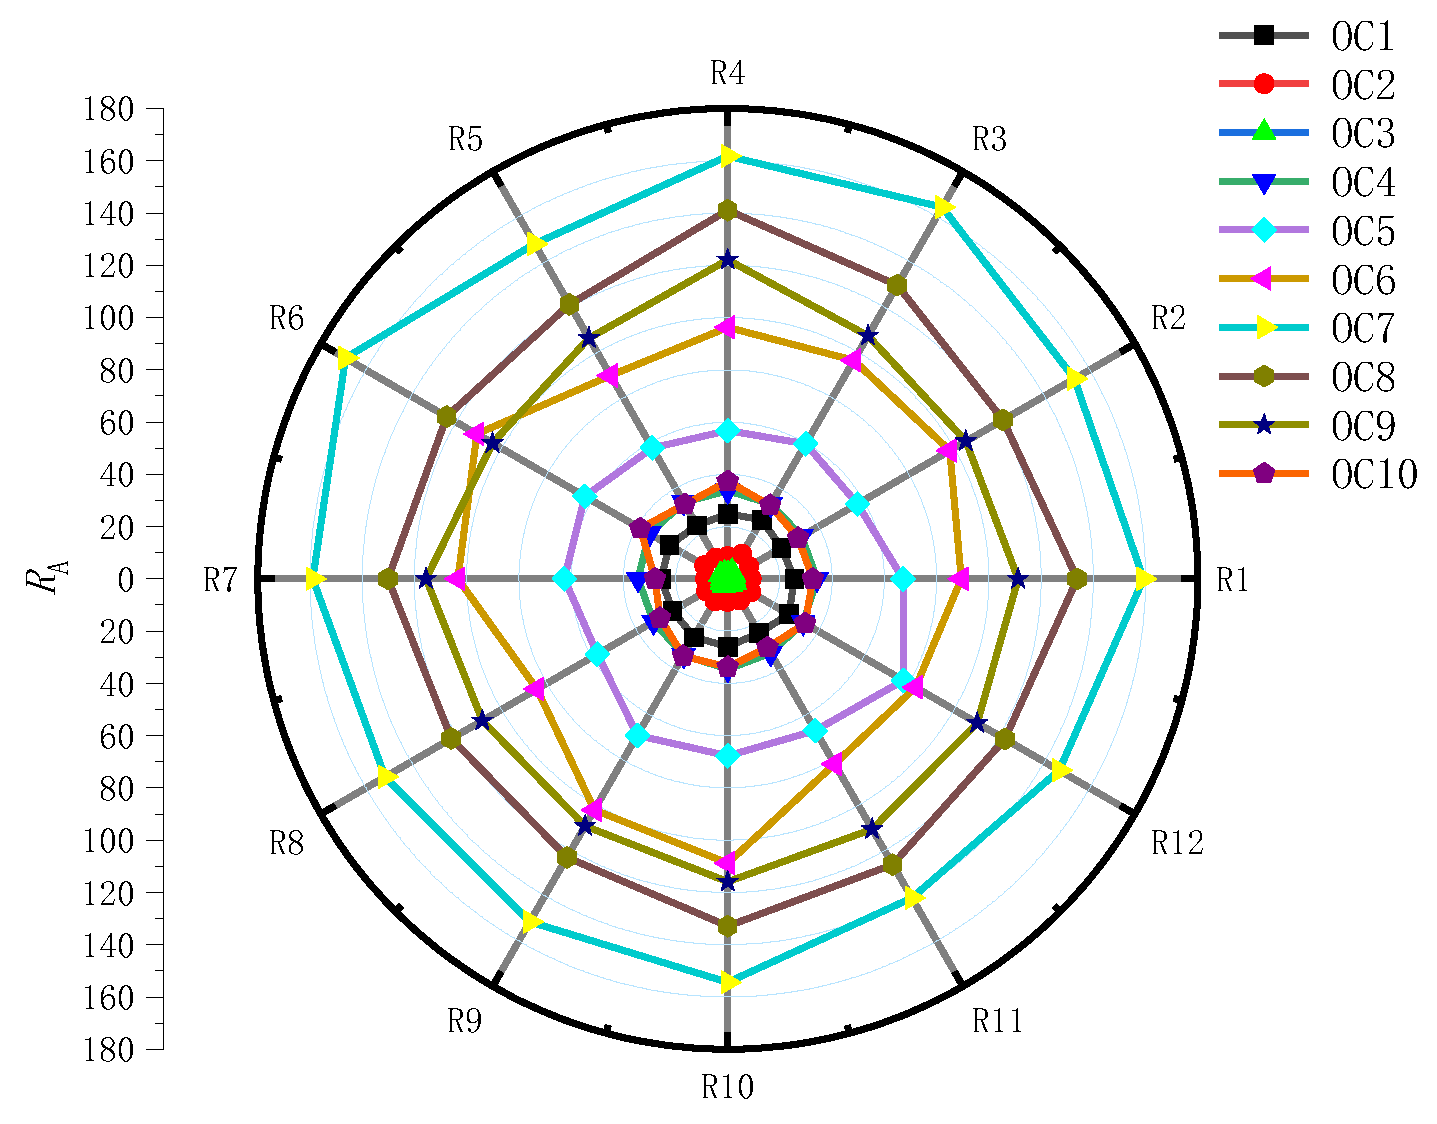
Figure 13 presents the distribution of the relative pressure pulsation amplitudes in the VS across ten off-design operating conditions. The analysis reveals that the runaway condition (OC7) exhibits the most severe pressure pulsation intensity, followed by braking conditions (OC8 and OC9) and turbine-mode operations at low discharge (OC5 and OC6). In comparison, milder pulsation amplitudes were observed during high-discharge turbine operations (OC1–OC4) and near-zero-flow conditions (OC10). These findings demonstrate that both the rotational speed and flow rate collectively influence the pressure pulsation characteristics in the vaneless space, although the rotational speed effect predominates significantly. Furthermore, the tongue position exerts considerable influence on vaneless space pulsations, with monitoring points adjacent to the tongue region consistently recording markedly higher relative pulsation amplitudes. This spatial variation highlights the critical role of geometric discontinuities in modulating the local pressure fluctuations.
Detailed analysis revealed distinct pressure pulsation characteristics across the operational spectrum. Under OC7 conditions, the unit attains the maximum rotational speed while experiencing significant flow reduction, resulting in the most severe pressure pulsations that critically compromise the operational stability. During braking conditions (OC8 and OC9) characterized by high rotational speed and reduced flow, the vaneless space exhibits secondary pulsation intensity following the runaway operation. Notably, while OC9 maintains a rotational speed comparable to that of OC8 with approximately 23% flow reduction, it demonstrates attenuated pulsation amplitudes, indicating an inverse relationship between the flow rate and pulsation intensity in braking regimes.
In turbine-mode low-flow conditions (OC5 and OC6), where the rotational speed remains elevated but flow rates are higher than the braking conditions, the pulsation levels are moderately lower. However, within this operational range, the pulsation intensity increases markedly with decreasing flow. OC6 exhibits a particularly asymmetric pressure pulsation distribution across the vaneless space, revealing substantial flow-field disorder.
The near-optimal OC3 condition, along with OC2, operated at high flow rates and low rotational speeds, yielding minimal pulsations. While OC3 maintains a nearly identical flow to that of OC2, its 33% higher rotational speed corresponds to significantly reduced pulsation amplitudes. Deviation from optimal conditions in OC4, with increasing speed and decreasing flow, elevates the pulsation levels. Both OC1 (maximum flow, minimum speed) and OC10 (maximum speed, near-zero flow) demonstrate pulsation intensities comparable to that of OC4 yet exhibit unique pulsation characteristics in the vaneless space that warrant special consideration.
The preceding analysis of the relative pressure pulsations in the VS provides a comprehensive characterization of the pulsation behavior across various operating conditions. To further elucidate the specific influences of different operational regimes on the VS pressure pulsations, we examined the frequency-domain characteristics of these pulsations. In our numerical analysis methodology, the initial transient solution phase exhibiting computational instability was excluded by discarding the data from the first ten runner rotation cycles. The subsequent ten rotation periods were retained for detailed analysis, with all monitoring point data processed using Fast Fourier Transform (FFT) techniques to obtain spectral characteristics.
The direct use of absolute pressure values from acquired data is inadequate for characterizing the pressure pulsation dynamics. In practice, two principal methodologies are conventionally employed to quantify pressure pulsations: peak-to-peak amplitude analysis and pressure coefficient evaluation. The pressure coefficient has three distinct mathematical formulations.
where
represents the difference between the pressure and its average value,
represents the average pressure, and
represents the circumferential velocity at the impeller outlet.
In addition to the two aforementioned methods, the peak-to-peak value can also be employed to characterize the pressure pulsation, which is defined as the difference between the maximum and minimum pressure values over a specified time interval. To mitigate the influence of the interference signals, a confidence level is sometimes introduced to represent the peak-to-peak pressure pulsation amplitude. In this study, the first approach, namely, Equation (9), was adopted to quantify the pressure pulsations. Frequency-domain waterfall plots of the pressure pulsations at the VS of the unit were obtained.
Figure 14,
Figure 15 and
Figure 16 present the FFT-based frequency-domain waterfall plots of the VS pressure pulsations under various operating conditions.
Figure 14 presents the frequency-domain waterfall plot of the pressure pulsations in the pump turbine under turbine operating conditions within the high-flow region, where the unit operates at high flow rates with minimal variation in discharge but significant changes in rotational speed across different operating points. Analysis of the frequency-domain characteristics of the VS pressure pulsations under three distinct operating conditions in this high-flow regime reveals that the amplitude of the pressure pulsations in the VS decreases markedly with a rapid increase in the unit rotational speed.
Under OC1 and OC2 operating conditions, the blade passing frequency (BPF) component induced by the rotor–stator interaction (RSI) serves as the dominant frequency in the VS. In contrast, under OC3 conditions, both the BPF and its second harmonic (2BPF) collectively constitute the primary frequency components in the VS. Furthermore, the BPF value exhibits an increasing trend with increasing rotational speed, with measured values of 28 Hz, 104 Hz, and 146 Hz corresponding to OC1, OC2, and OC3, respectively. The pressure pulsation amplitudes remained nearly uniform across the different monitoring locations under the OC1 and OC2 conditions, displaying a symmetric distribution along the circumferential direction at the runner blade inlet. However, under OC3 conditions, significant variations in the pressure pulsation amplitude emerged among the monitoring points.
Further analysis revealed that the low-frequency component (LFC) demonstrated markedly distinct characteristics across the three operating conditions as the flow regime changed. Under OC1 conditions, the LFC primarily consists of four distinct components at 2.75fn, 3.66fn, 6.42fn, and 7.33fn, where fn represents the rotational frequency. Notably, the LFC exhibits a substantial amplitude in this operating regime, becoming the dominant contributor to the VS pressure pulsations.
Under OC2 operating conditions, the LFC is predominantly composed of two distinct frequencies at 1.03fn and 2.06fn. Compared to the OC1 conditions, the spectral composition of the LFC becomes simpler, and its contribution to the VS pressure pulsations is negligible. In the OC3 regime, the LFC primarily consists of 0.97fn and 1.87fn components, with 0.97fn exhibiting a significantly higher amplitude than other minor components, resulting in only limited LFC influence on VS pressure pulsations.
Regarding high-frequency, low-amplitude components (HF-LACs) across different operating conditions, the OC1 condition demonstrated numerous HF-LAC elements predominantly distributed between the BPF and 3BPF, with 18.33fn and 22fn being the most prominent, while other components remained minimal. The HF-LACs became virtually nonexistent under OC2 conditions, exerting no measurable effect on the VS pressure pulsation characteristics. In contrast, the OC3 condition exhibits multiple HF-LACs primarily clustered between 2BPF and 4BPF, where 19.5fn, 20.43fn, and 29.26fn emerge as dominant frequencies with other constituents showing negligible amplitudes.
The rotor–stator interaction induces blade passing frequency (BPF) dominance in vaneless space pressure pulsations under OC1–OC2, transitioning to combined BPF and 2BPF prominence at OC3. Low-frequency components exhibit condition-specific signatures—multi-peak high-amplitude at OC1 versus negligible influence at OC2–OC3—while high-frequency clusters emerge in distinct BPF-harmonic bands, demonstrating operational-regime-dependent spectral evolution.
This study examined the operating conditions under which the OC5 unit enters Region II of the investigation scheme (as illustrated in
Figure 7). Within Region II, the unit exhibits substantial flow rate variations but minimal rotational speed changes across different operating points.
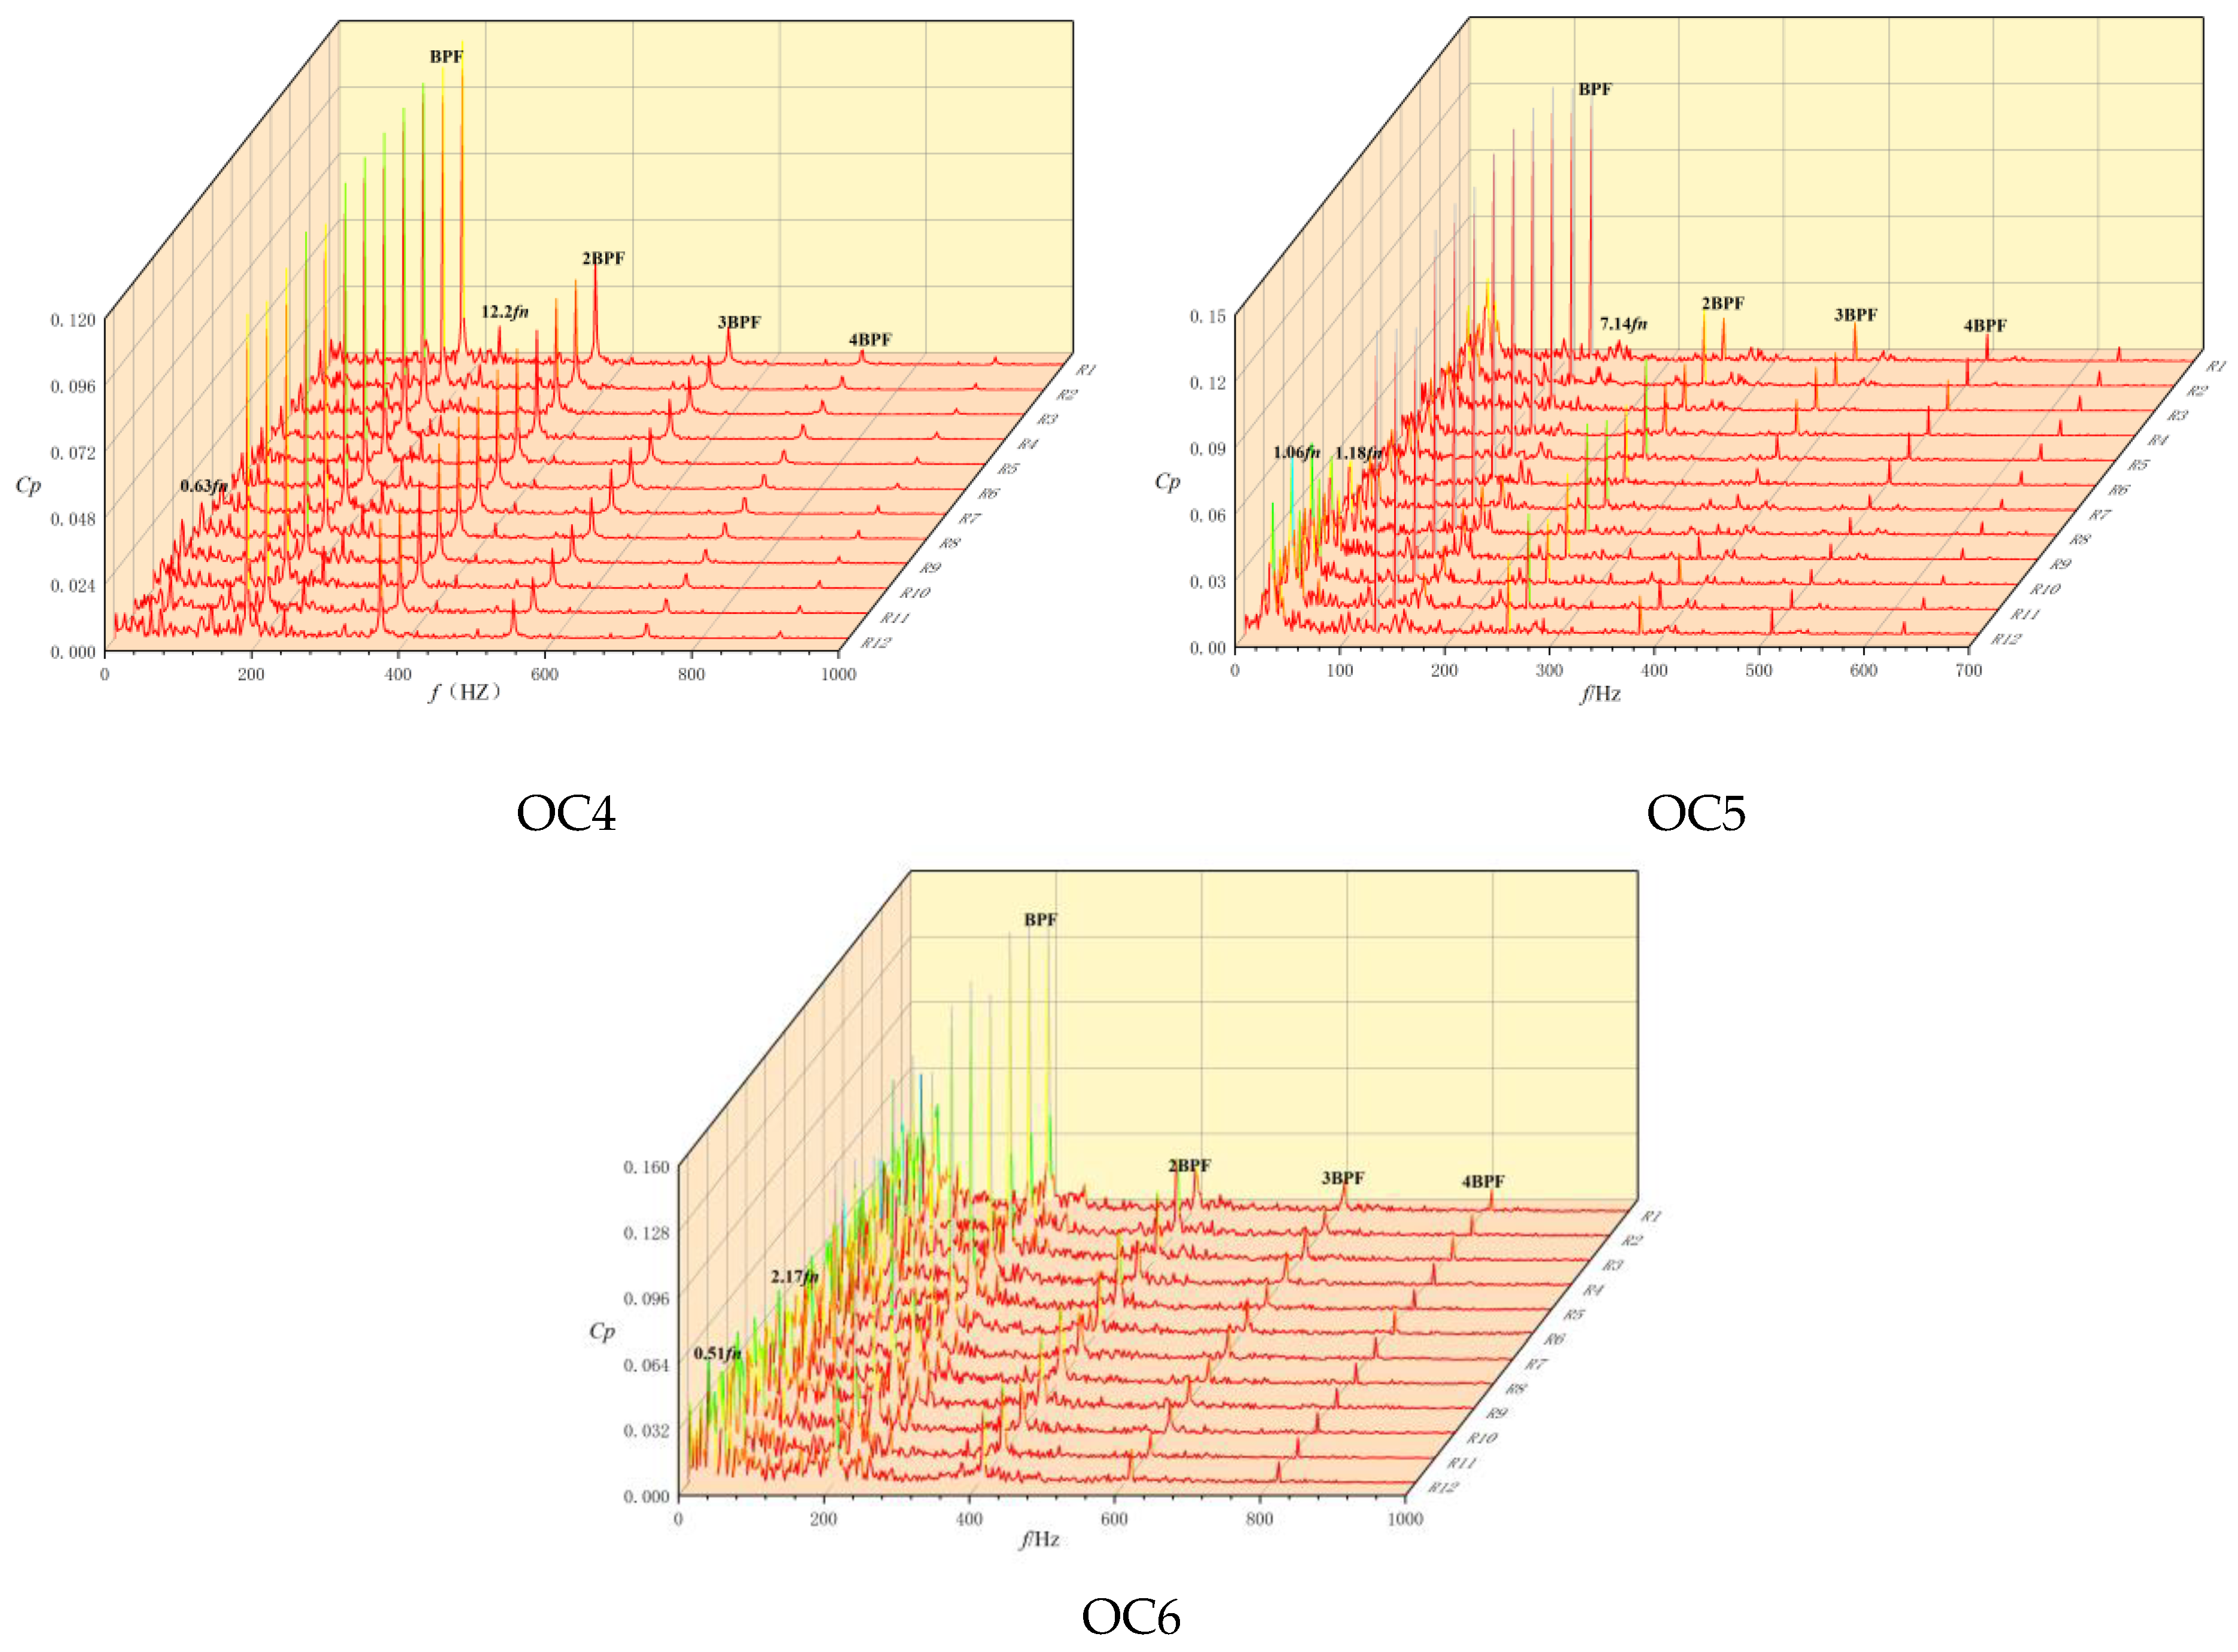
Figure 15 presents the frequency-domain waterfall plot of the pressure pulsations in the pump turbine under turbine-mode operation under low-flow conditions. Compared to high-flow turbine conditions, the VS pressure pulsation amplitudes increased significantly under low-flow conditions, accompanied by a notable increase in both the LFC and HF-LAC constituents.
Under OC4 conditions, where the flow rate decreased substantially while the rotational speed increased further, the VS pressure pulsation amplitudes increased rapidly compared with OC3. This amplification results from the combined effect of the increased rotational speed and reduced flow rate, which exacerbates the flow instabilities within the machine. While the BPF remains the dominant frequency of VS pressure pulsations under OC4, both the LFCs (e.g., 0.63fn) and HF-LACs (e.g., 12.2fn) become more numerous, although their amplitudes remain relatively low. The HF-LACs were primarily distributed between the BPF and 2BPF.
From the OC4 to OC5 conditions, the unit experiences minimal rotational speed variation but significant flow reduction, leading to continued growth in the VS pressure pulsation amplitudes. The LFC amplitudes show a pronounced increasing trend, becoming non-negligible contributors to the VS pressure pulsations (e.g., 1.06fn and 1.18fn). Meanwhile, the HF-LACs between 2BPF and 4BPF demonstrate enhanced presence while maintaining low amplitude levels.
Under OC6 conditions approaching runaway operation, the VS pressure pulsation amplitudes increased further with significantly amplified LFCs (e.g., 0.51fn and 2.17fn) that dominated the pressure pulsation spectrum. The HF-LACs between the BPF and 2BPF exhibited growing amplitudes, while other frequency constituents remained relatively unchanged. This progression demonstrates how flow instabilities intensify as the machine approaches its operational limits, with low-frequency phenomena becoming increasingly dominant in pressure pulsation characteristics.
Progressive flow reduction from OC4 to OC6 exacerbates vaneless space pressure pulsations, amplifying low-frequency components which transition from secondary contributors to spectral dominants approaching runaway conditions. While the blade passing frequency persists as the primary component, harmonic-distributed high-frequency elements intensify across off-design operations, confirming that flow instability escalation correlates directly with discharge diminution near critical thresholds.
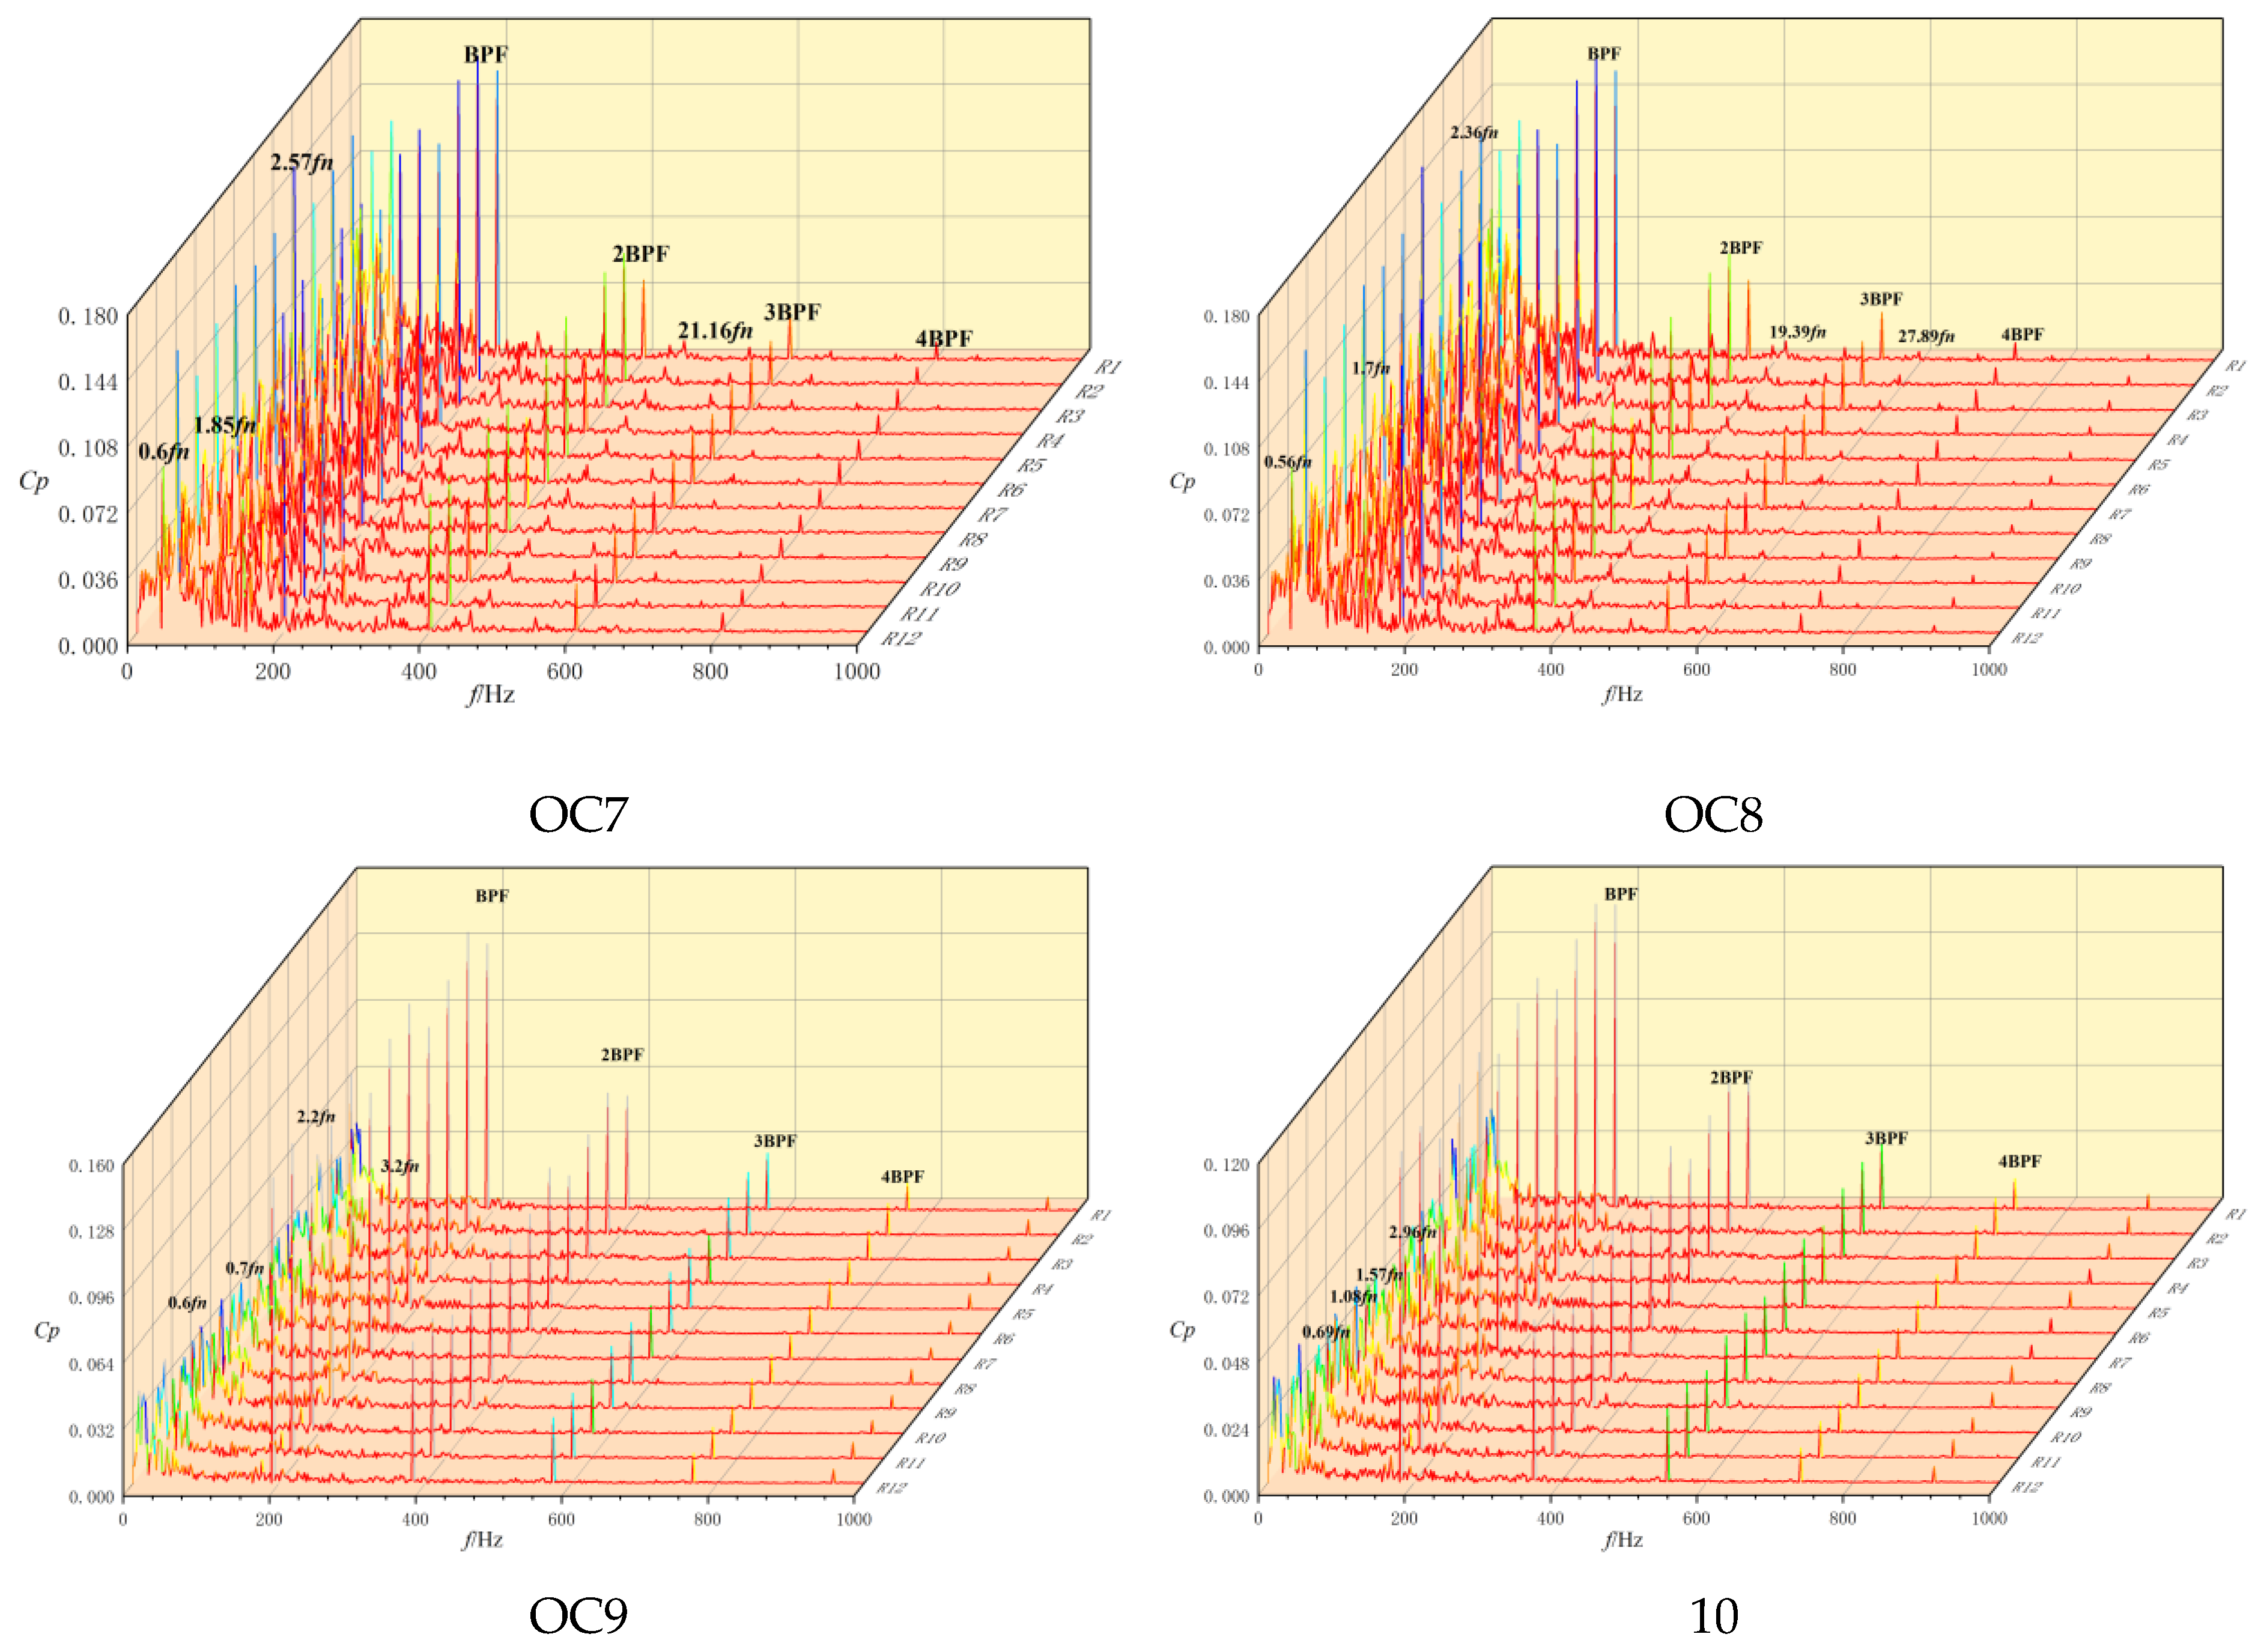
Figure 16 displays the frequency-domain waterfall plot of pressure pulsations in the pump turbine under runaway, braking, and near-zero-flow conditions, where the unit operates at high rotational speeds with minimal flow rates. Spectral analysis of the VS pressure pulsations in these regimes reveals that both the LFCs and HF-LACs constitute the dominant elements of the pressure fluctuation spectrum.
During the OC7 operation, the unit reaches the maximum rotational speed while operating at minimal flow rates, resulting in peak pressure pulsation amplitudes within the VS. The LFC exhibits substantial amplitude amplification, forming the dominant frequencies of VS pressure pulsations alongside the BPF, with prominent components at 0.6fn, 1.85fn, and 2.57fn. Concurrently, the HF-LACs demonstrated a modest increasing trend in amplitude, as exemplified by the 21.16fn component, although their overall contribution remained secondary to the dominant LFC and BPF signatures. This behavior reflects the intensified flow instability characteristic of runaway conditions, where the combined effects of extreme rotational speeds and reduced throughflow significantly alter the pressure pulsation spectrum.
A comprehensive analysis revealed distinct pressure pulsation characteristics across different operating regimes. Under turbine-mode high-flow conditions (Region I in
Figure 7), the BPF remains the dominant component of VS pressure pulsations, while both LFCs and HF-LACs exhibit minimal presence with negligible amplitudes, with the exception of isolated spectral components.
When operating in turbine-mode low-flow and runaway conditions (Region II in
Figure 7), the BPF persists as the primary frequency of VS pressure pulsations across all operating points. However, both LFCs and HF-LACs become significantly more pronounced throughout Region II, appearing in greater numbers with substantially higher amplitudes that establish them as major constituents of the VS pressure pulsations.
The transition into the “S-shaped” characteristic curve region during low-flow and runaway operations corresponds to generally elevated VS pressure pulsation amplitudes, whose specific magnitudes vary according to the particular operating conditions within this unstable region. Notably, under runaway conditions, the LFC amplitudes reached their maximum values among all the investigated operating points, ultimately emerging as the dominant frequencies in the VS pressure pulsation spectrum. This progression demonstrates how flow instabilities in the “S” region fundamentally alter the spectral composition and amplitude characteristics of the pressure fluctuations in the VS.
Under the OC8 conditions, the BPF and LFCs jointly form the primary frequency components of the VS pressure pulsations. Compared to runaway conditions, OC8 operation shows minimal variation in the BPF and its harmonic amplitudes, whereas the LFC amplitudes exhibit a decreasing trend. The transition to the OC9 and OC10 conditions is characterized by a significant reduction in VS pressure pulsation amplitudes, accompanied by a pronounced decrease in both the quantity and amplitude of the HF-LACs. This behavior reflects the modified flow dynamics that occur under extreme off-design operating conditions, where the interaction between rotational effects and severely restricted throughflow alters the fundamental characteristics of pressure pulsations in the VS.
The analysis demonstrates that during pump-turbine operation in the turbine braking mode, where rotational speed variations are minimal, the pressure pulsation amplitudes exhibit a continuous decreasing trend as the inlet flow rate undergoes significant reduction. Both the LFCs and HF-LACs showed a progressive decline in both the spectral density and amplitude magnitude across the operating conditions. Nevertheless, these components remain the predominant constituents of the VS pressure pulsation spectrum, maintaining their fundamental role in characterizing unsteady flow phenomena despite their attenuated intensity. This behavior reflects the modified flow dynamics under braking conditions, where the constrained throughflow interacts with sustained rotational effects to produce this distinctive pressure pulsation signature.
The analysis of VS pressure pulsation across ten operating conditions covering the full range confirmed the blade passing frequency (BPF) from the rotor–stator interaction (RSI) as the dominant component throughout, establishing dynamic–static interference as the primary source. Pressure pulsation amplitudes exhibited distinct regional patterns: they decreased monotonically in Operational Region I, whereas Region II displayed an initial decrease, followed by an increase and subsequent decline, correlating strongly with operation in the “S-shaped” characteristic curve region. The spectral composition differed significantly between regions. Low-frequency components (LFCs) and high-frequency, low-amplitude components (HF-LACs) were scarce with negligible amplitudes in Region I. In contrast, Region II featured substantially more numerous and pronounced LFCs and HF-LACs, which became significant constituents of the pulsations. Their prevalence and amplitude progressively increased approaching runaway, peaking at the runaway point where LFCs became co-dominant with the BPF, followed by a decline beyond this point.
5. Conclusions
This study conducts a comprehensive numerical investigation into the evolutionary mechanisms and spatial distributions of vortex structures and backflow phenomena in a pump turbine operating across ten characteristic conditions in turbine mode at a fixed 33 mm guide vane opening. Through a systematic analysis of the complete operational range, we established quantitative correlations between VS pressure fluctuations and transient flow structures, with particular emphasis on backflow dynamics under off-design conditions. Numerical simulations, confirmed by experimental data, accurately captured these transient flow characteristics, providing a reliable tool for further analysis and design optimization. The principal findings are described below.
The synergistic variation in rotational speed and flow rate governs the evolution of passage vortices by modulating the pressure gradient and inflow incidence angle. Under low-speed operation (OC1), large incidence angles induce flow separation at the leading edge of the runner blades, generating a stagnation zone on the BPS while forming large-scale attached vortices accompanied by inter-blade high-velocity jets on the BSS. The speed elevation (OC2–OC3) significantly improved the flow regime. Low-flow conditions (OC4–OC6) trigger VS high-velocity jets, with further flow reduction exacerbating flow separation and promoting vortex structure migration from the pressure surface to the suction surface. During runaway conditions (OC7), an asymmetric high-velocity water ring forms, reaching a peak flow instability. Under braking conditions (OC8–OC9), the passage vortices expand upstream, and at near-zero-flow operation (OC10), the cascade region becomes saturated with multiscale vortex structures.
The draft tube backflow significantly alters the runner exit flow, inducing intense radial flow under the OC1 and OC6–OC10 conditions, with the most severe fluctuations occurring during runaway operation. High-TKE regions are concentrated in the VS and inter-blade passages, exhibiting a distinctive distribution pattern under low-speed conditions. At the best efficiency point, the flow field attains optimal stability, whereas under partial-discharge conditions (OC4–OC6), VS-induced jets exacerbate flow separation and amplify TKE distribution non-uniformity. Post-runaway conditions (OC8–OC9) exhibit pronounced flow blockage, whereas near-zero discharge (OC10) leads to a fully developed multiscale vortex system occupying the entire flow domain.
The pressure distribution and vortex structures within the draft tube exhibited pronounced operational condition dependence. Under low-speed conditions, the helical vortex rope induces a rotating LPR. As the operating conditions vary, the vortex rope contracts progressively, and the pressure distribution becomes more uniform. During the runaway operation (OC7), a spiral LPR distribution emerges alongside compact vortex cores concentrated near the wall, with intensification observed under braking conditions. In the conical diffuser section, the radial pressure distribution was significantly modulated by both vortex rope and reverse flow vortex structures. Under higher-discharge conditions (OC1–OC5), a distinct vortex rope formed in the central region, with LPRs predominantly localized to the vortex rope trajectory. Conversely, under reduced-discharge conditions (OC6–OC10), LPRs primarily occupied the diffuser centerline because of the large-scale recirculation vortices driving reverse axial flow. The pressure gradients induced by the vortex rope structures exhibit substantially greater magnitudes.
The pressure pulsations in the VS arise from the coupled mechanisms of the RSI and LFU. Throughout the complete operational envelope in the turbine mode, the pulsation amplitude attains its maximum during runaway and braking conditions while reaching a global minimum under high-discharge operation. Under low-rotational-speed, high-discharge conditions and near-zero-discharge regimes, the VS pressure field exhibits strong sensitivity to flow separation phenomena and vortical structures; however, the resultant pulsation amplitudes remain consistently attenuated because of a critically insufficient specific speed and volumetric flow rate. During the OC6 operation, pronounced spatial amplitude modulation occurs across the VS, driven by turbulent vortex dynamics in the runner inlet region.
Under high-discharge conditions in turbine mode, the VS pressure pulsations exhibit minimal LFU-induced LFCs and HF-LACs, indicating negligible influence from local flow instabilities and upstream/downstream interactions. As the discharge decreases, the quantity of both LFCs and HF-LACs increases markedly, with LFC amplitudes demonstrating rapid growth that peaks during runaway conditions, where they dominate the VS pressure spectrum alongside the BPF. Conversely, the braking conditions show a progressive LFC amplitude reduction with decreasing flow rate. The HF-LAC amplitude remained relatively stable across the entire operating range. Their spectral distribution primarily occupied the BPF-3BPF band in the high-discharge regions, shifted to BPF-2BPF during braking, and expanded to BPF-4BPF under both the runaway and low-discharge conditions.
The present investigation reveals that operational conditions exert a substantial influence on the internal flow characteristics, pressure pulsation magnitude, and spatial distribution patterns of pump turbines. Specifically, vortex rope formation occurs in the draft tube under high-flow conditions, whereas a rotating stall develops in the VS during low-flow operation. These phenomena exhibit distinctive behaviors under critically low rotational speeds and low flow rates.


