Article

Decoupling Analysis of Parameter Inconsistencies in Lithium-Ion Battery Packs Guiding Balancing System Design

1
China Academy of Space Technology Hangzhou Institute, Hangzhou 310024, China
2
China Academy of Space Technology, Beijing 100094, China
3
College of Engineering, South China Agricultural University, Guangzhou 510642, China
*
Author to whom correspondence should be addressed.
Energies 2025, 18(13), 3439; https://doi.org/10.3390/en18133439
Submission received: 30 May 2025 / Revised: 24 June 2025 / Accepted: 26 June 2025 / Published: 30 June 2025
(This article belongs to the Section D: Energy Storage and Application)

Abstract

Inconsistencies in lithium-ion battery packs pose significant challenges for both electric vehicles and energy storage systems, causing diminished energy utilization and accelerated battery aging. This study investigates the characteristics and aging processes of 32 batteries, creating simulation models for cells and packs based on experimental data. Through a controlled single-variable approach, the decoupled analysis of multi-parameter inconsistencies is carried out. Simulation results demonstrate that parallel-connected packs can maintain charge consistency without the need for external balancing systems, thanks to their self-balancing mechanisms. On the other hand, series-connected packs experience accelerated capacity degradation primarily due to charge inconsistencies linked to differences in Coulombic efficiency (CE) and the initial state of charge (SOC). For packs with minor capacity variations and temperature inconsistencies, a passive balancing current of 0.001 C can effectively eliminate up to 3.8% of capacity loss caused by charge inconsistencies within 15 cycles. Active balancing systems outperform passive ones primarily when there is significant capacity inconsistency. However, for packs that have undergone capacity screening before assembly, both active and passive balancing systems prove to be equally effective. Additionally, inconsistencies in internal resistance have a minimal impact on overall pack capacity but limit the power of both series-connected and parallel-connected packs. These findings offer essential insights for the development of balancing systems within battery management systems.

1. Introduction

As one of the key components driving the development of new energy technologies, lithium-ion batteries have been widely adopted in energy storage systems and new energy vehicles due to their advantages of high energy density and long cycle life [1]. Cells are typically connected in series-parallel configurations to satisfy power and capacity demands. However, inconsistencies in cell parameters can lead to the ‘barrel effect’, significantly compromising the operational safety and lifespan of the battery pack [2]. Consequently, research on battery consistency management holds critical importance for advancing the efficient utilization of large-scale battery systems.
Battery inconsistency refers to the differences in parameters such as voltage, state of charge (SOC), capacity, and internal resistance among cells of the same specification [3]. As shown in Figure 1, the differences in external characteristics of batteries arise from the coupled effects of multiple internal and external factors [4]. Externally, critical factors affecting consistency include the resistance of tab welds and connectors [5], thermal management conditions [6], and preload forces exerted on cell surfaces [7]. Internally, variations in the initial state and aging processes of cells lead to inconsistencies in internal parameters like SOC, capacity, and internal resistance [8]. The initial state differences primarily depend on battery materials and manufacturing process quality during steps such as electrode coating and formation [9]. The differences in the aging process are primarily attributed to factors such as Coulombic efficiency (CE), capacity fade rate, and resistance growth rate. These depend not only on the materials and manufacturing techniques but also on the structural design and management strategies of the battery pack [10]. Inconsistent CE induces SOC variations in the short term [11], which indirectly causes uneven depth of discharge (DOD) and further aggravates inconsistent capacity fade rates [12]. Additionally, inconsistent internal resistance causes temperature differences during operation, further affecting CE and capacity fade rate [13].
As demonstrated above, inconsistency evolution is a complex process involving the interaction of multiple factors. Without effective management, it can lead to accelerated capacity fade and significant reduction in service life [14]. Therefore, first, cells must undergo screening prior to pack assembly to enhance initial consistency [15,16]. Second, external inconsistencies should be mitigated through optimized mechanical structures and thermal management systems [17,18]. However, inconsistencies arising from battery aging remain unavoidable. To address this, balancing systems are required to improve the performance of the battery pack after aging.
Common balancing systems are classified into two categories: active and passive balancing systems [19,20]. Active balancing systems transfer energy from high-energy cells to low-energy ones via external circuits [21] or individually charge low-energy cells using external power sources [22]. There is almost no energy loss in this process. Conversely, passive balancing systems dissipate excess energy from high-energy cells through parallel resistors as heat until energy equalization is achieved [23]. This reduces the total system energy, making it also known as dissipative balancing.
Current research suggests that passive balancing is suitable for small-to-medium-sized battery packs with good consistency, offering simple structure and ease of operation. In contrast, complicated active balancing is preferred for high-power application scenarios such as large-scale packs with significant inconsistency [24]. However, detailed studies remain scarce regarding the specific applicability of active and passive balancing under varying battery parameter inconsistencies. Systematic investigation into the impact of cell parameter inconsistencies on pack performance and the applicability of active and passive balancing is critical for enhancing the efficient and safe utilization of energy. Nevertheless, conducting such research using actual battery packs faces significant challenges due to the following factors:
  • Parameter coupling: The influence of cell parameter inconsistencies on overall pack performance exhibits strong interdependencies [25].
  • Measurement constraints: Key parameters of cells such as capacity, SOC, and CE cannot be directly measured during aging tests without disassembling the pack.
  • Irreversibility and non-reproducibility: Irreversible parameter changes and non-repeatable experimental conditions prevent result verification.
To address these limitations, this paper establishes battery models based on experimental data, with investigations conducted through simulation. The major contributions of this paper are as follows:
  • A controlled single-variable approach is innovatively introduced to inconsistency evolution analysis. Based on the developed battery pack simulation model, this study quantitatively decouples how each factor (e.g., initial capacity, internal resistance, CE) independently drives pack capacity degradation. This solves the problem of unclear fade mechanisms of pack capacity under multi-parameter coupling in traditional experimental science and offers crucial evidence for identifying the main factors of pack capacity fade.
  • Previous studies select active/passive balancing systems based solely on cost and balancing time. The correlation between inconsistency types (SOC/capacity/resistance) and optimal balancing system is systematically proposed for the first time based on decoupling analysis. These findings provide new guidance and a novel dimension for selecting balancing systems.
The remaining sections are organized as follows: Section 2 describes the lithium-ion batteries and experimental protocols employed in this paper. Section 3 presents the methodology for constructing the battery simulation model. Section 4 systematically conducts a decoupling analysis of parameter inconsistencies of battery packs configured in series and parallel. Section 5 discusses the applicability of active and passive balancing. Finally, Section 6 summarizes the findings.

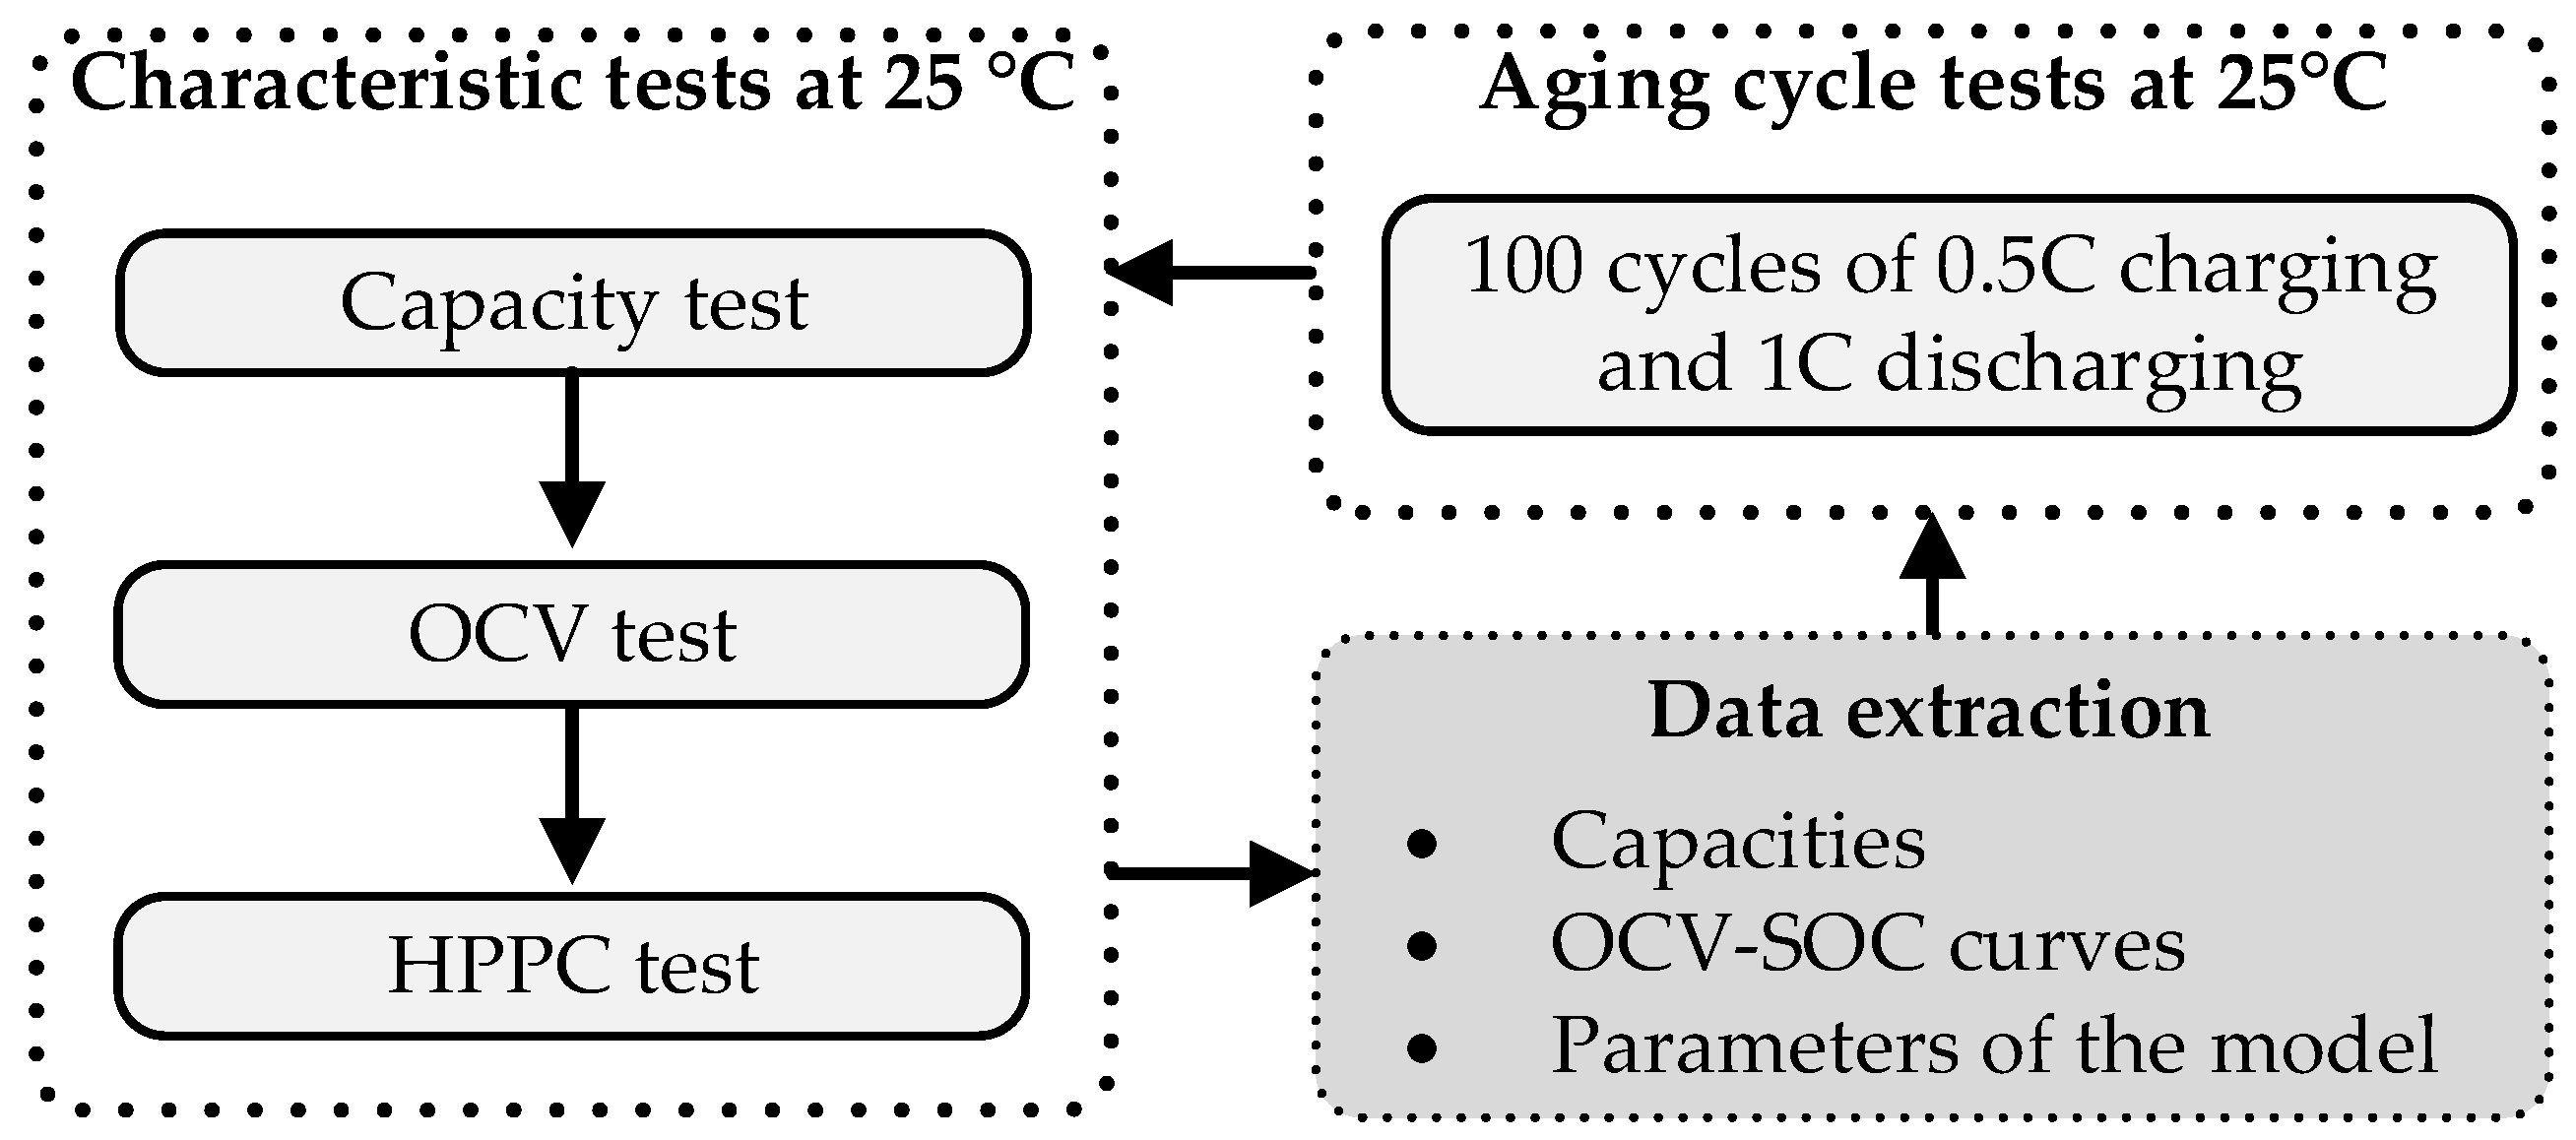
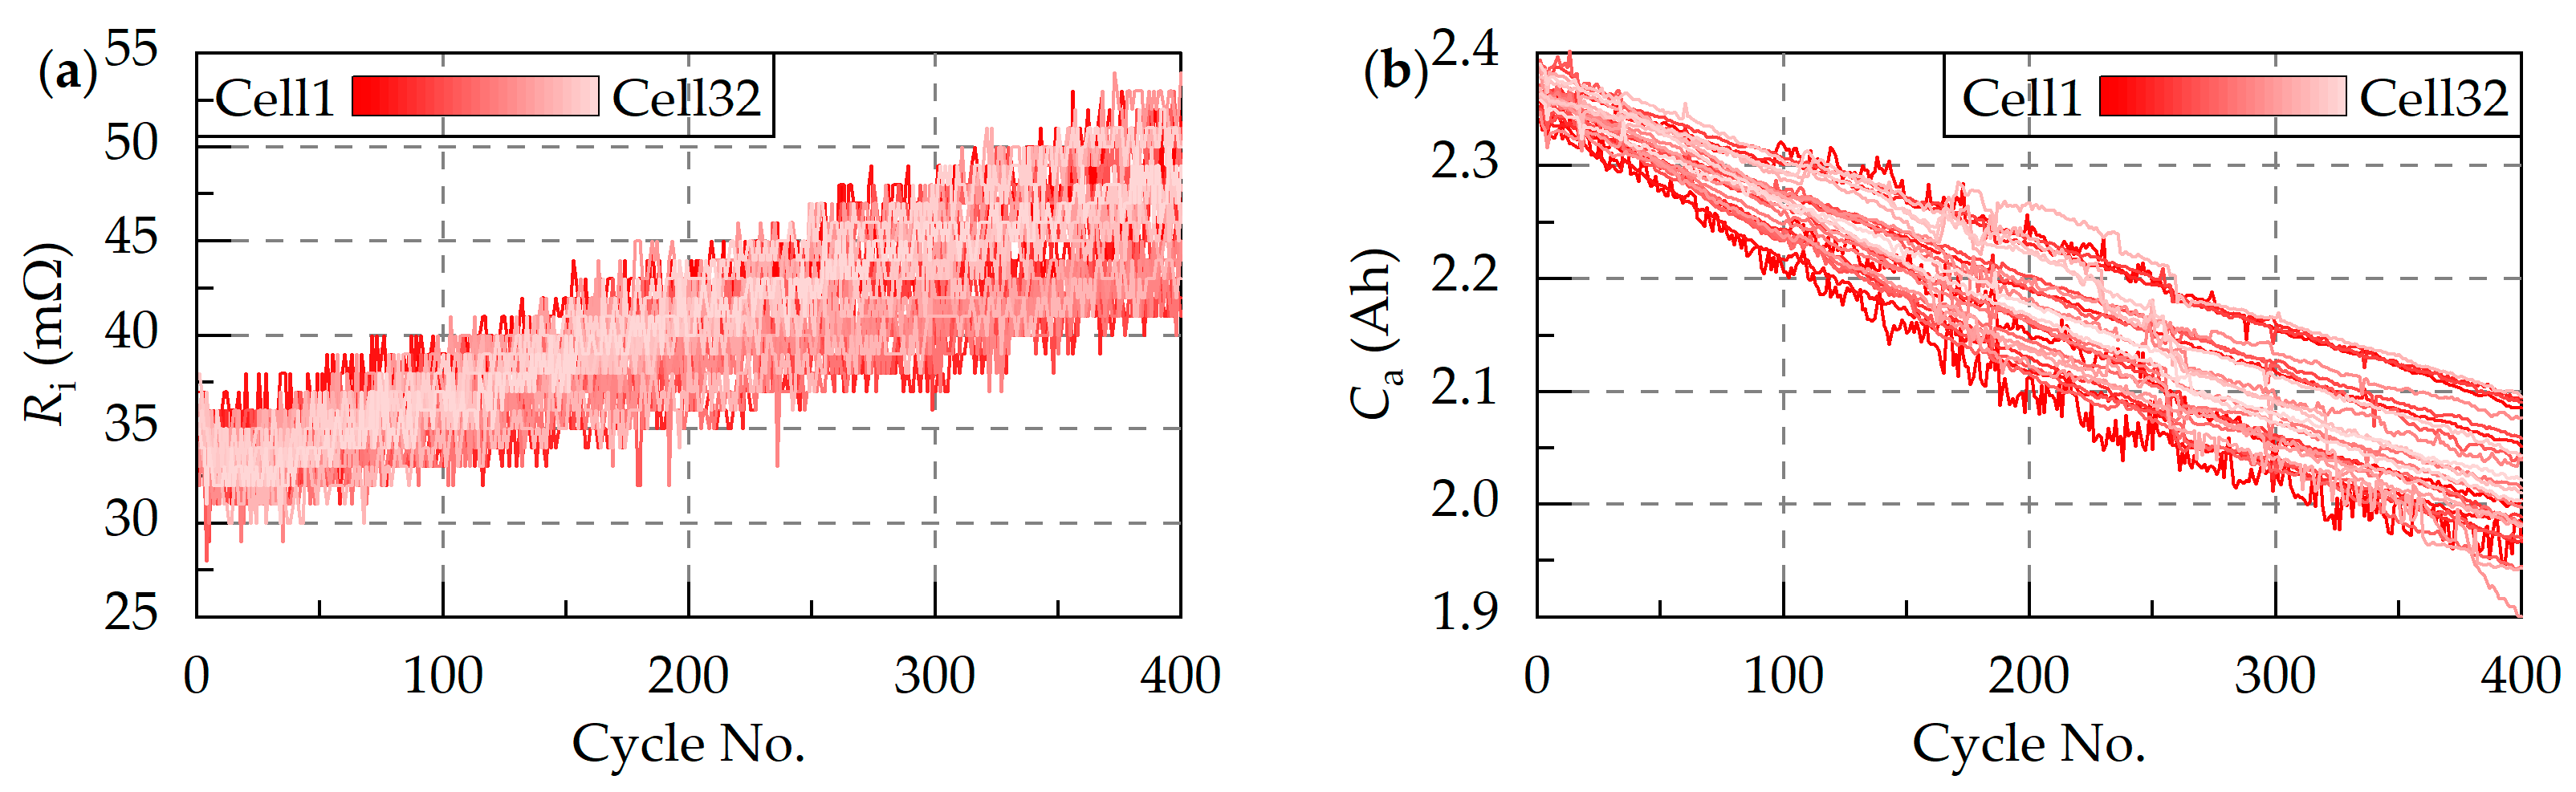
2. Battery Experiment

To comprehensively characterize the probability distribution of battery parameters and mitigate the effects of random experimental errors, 32 lithium nickel manganese cobalt oxide (NMC) batteries of the same batch are selected as test subjects. These cells, sequentially labeled NMC01 to NMC32, exhibit specifications detailed in Table 1.
The experimental platform consists of an ARBIN-BT2000, an environmental simulation chamber, and a host computer. As shown in Figure 2, the experimental procedure mainly consists of four parts: capacity tests, open-circuit voltage (OCV) tests, hybrid power pulse characteristic (HPPC) tests, and aging cycle tests. Characteristic tests are performed every 100 aging cycles. All tests are conducted at 25 °C.

3. Construction of Simulation Model

Battery management algorithms often employ equivalent circuit models, electrochemical models, or neural network models to characterize both long-term and short-term battery behaviors [26,27]. However, the evolution of inconsistencies involves multi-factor coupling effects, and precise modeling of all cells can lead to excessive computational demands. Given that this paper primarily focuses on long-term battery parameter evolution (e.g., capacity and internal resistance), short-term battery behaviors such as concentration polarization are omitted in the modeling framework. Consequently, the simulation model developed in this section incorporates certain simplifications.

3.1. Battery Cell Model

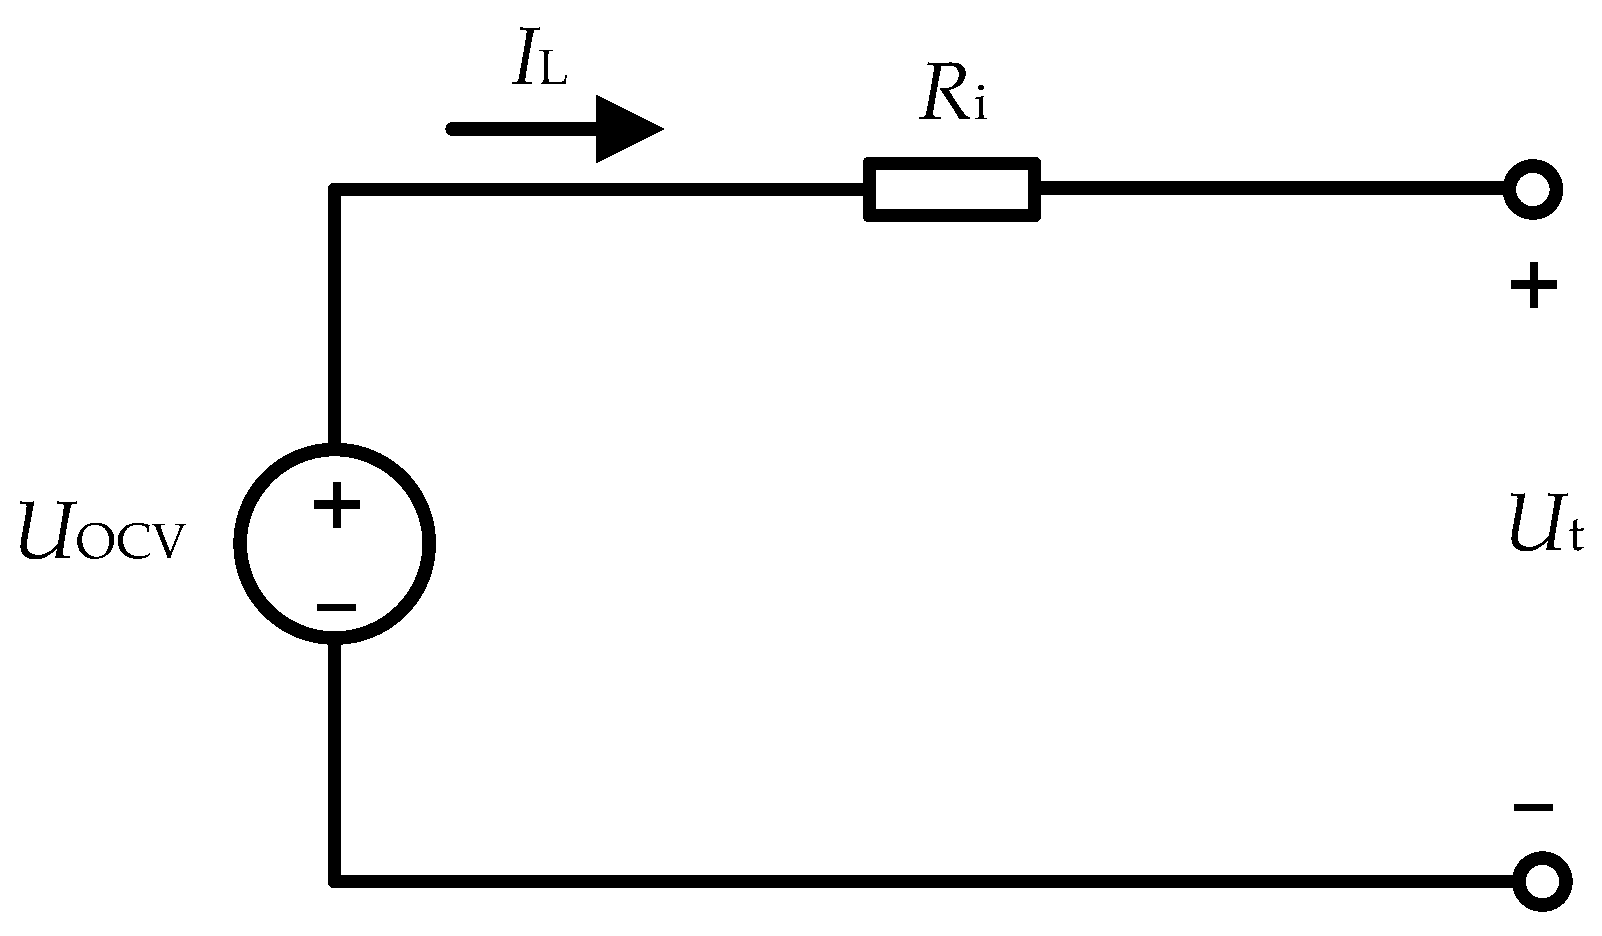
3.1.1. Equivalent Circuit Model

The Rint model is selected in this paper. The model structure is shown in Figure 3. Here, Ut denotes the terminal voltage of the battery, IL represents the load current (positive during discharge and negative during charge), Ri is the internal resistance, and UOCV is the open-circuit voltage. While Ri and UOCV vary with temperature, changes caused by temperature fluctuations under constant ambient conditions are neglected in this section. Therefore, Ri and UOCV are only related to the aging state and SOC.
The SOC can be determined using the following equation:
z k = Q k C a , k × 100 % ,
Q k = Q 0 η I L + I B d t ,
where zk denotes the SOC at time k, Qk represents the remaining charge at time k, Ca,k is the capacity, Q0 indicates the initial charge, IB denotes the balancing current, and η is the CE. CE is challenging to obtain experimentally. The discharge CE is generally assumed to be approximately 1, while the charge CE is modeled using Equation (3) in this study to characterize its temperature-dependent behavior.
η dch = 1 η chg = 1 + k η T 298 ,
where ηdch and ηchg denote the discharge and charge CE, respectively. T denotes the Kelvin temperature. kη is the temperature negative correlation coefficient, which is set to −2 × 10⁻⁵ in this paper. This implies that the charge CE generally decreases with rising temperature [28].

3.1.2. Thermal Model

The thermal model used in this paper is shown in Equation (4):
T = T 0 + I L + I B 2 R i q T T 0 A / m C m d t ,
where m is the cell mass, and T0 is the ambient temperature in Kelvin. Cm indicates the specific heat capacity, taken as 1000 J/(kg·K). A represents the heat dissipation area and is set to 0.0042 m2. q denotes the heat dissipation coefficient. Optimized thermal management ensures approximate uniformity in heat dissipation across cells. Thus, q is assumed constant at 20 W/(K·m2) here.

3.1.3. Aging Model

The aging model in this paper is established based on experimental data. As shown in Figure 4a, the cells exhibit good initial consistency in internal resistance, with a mean value of 34.78 mΩ and a standard deviation of 1.53 mΩ.
After 400 aging cycles, the internal resistances increase overall. The inconsistency further aggravates, with the mean value rising to 47.04 mΩ and the standard deviation increasing to 3.08 mΩ. In addition, due to divergent aging trajectories, the cells with the maximum and minimum internal resistance shift after the aging cycles compared to before. Similarly, the capacity distribution is shown in Figure 4b. The initial capacity demonstrates a mean value of 2.36 Ah with a standard deviation of 0.014 Ah. After 400 aging cycles, the capacity exhibits a reduced mean value of 2.01 Ah and an increased standard deviation of 0.05 Ah. It indicates an overall capacity fade and increased inconsistency.
Figure 5 illustrates the internal resistance growth trajectories and capacity fade trajectories of 32 cells over 400 aging cycles.
Based on the experimental data, simplified linear aging models for battery resistance and capacity are established, as shown in Equations (5) and (6), respectively.
R i , N = R i , 0 + k R N ,
C a , N = C a , 0 + k C N ,
where N ∈ [0, 400] denotes the equivalent cycle number, defined as the ratio of total charge/discharge ampere-hour (Ah) to the rated capacity. Ri,N and Ca,N represent the internal resistance and capacity at equivalent cycle N. Ri,0 and Ca,0 indicate the initial internal resistance and initial capacity, respectively. kR is the positive internal resistance growth rate, and kC is the negative capacity fade rate.

3.2. Battery Pack Model

The battery pack model comprises basic models and difference models. The basic models establish relationships between cell-level and pack-level parameters, defining pack capacity, SOC, resistance, and other pack-level parameters under varying topologies and balancing system configurations. Difference models generate parameter variations among cells to simulate inconsistencies. The overall flowchart for constructing the battery pack model is illustrated in Figure 6.

3.2.1. Basic Model

The calculation methods for parameters such as capacity, internal resistance, and SOC in the battery pack differ from those for the cell. For series-connected battery packs, the total current equals the main circuit current, and the total voltage and internal resistance correspond to the sum of terminal voltages and internal resistances of all series-connected cells, respectively. However, the definitions of usable capacity and SOC vary with the applied balancing systems [29]. As shown in Figure 7, we take three series-connected cells as an example:
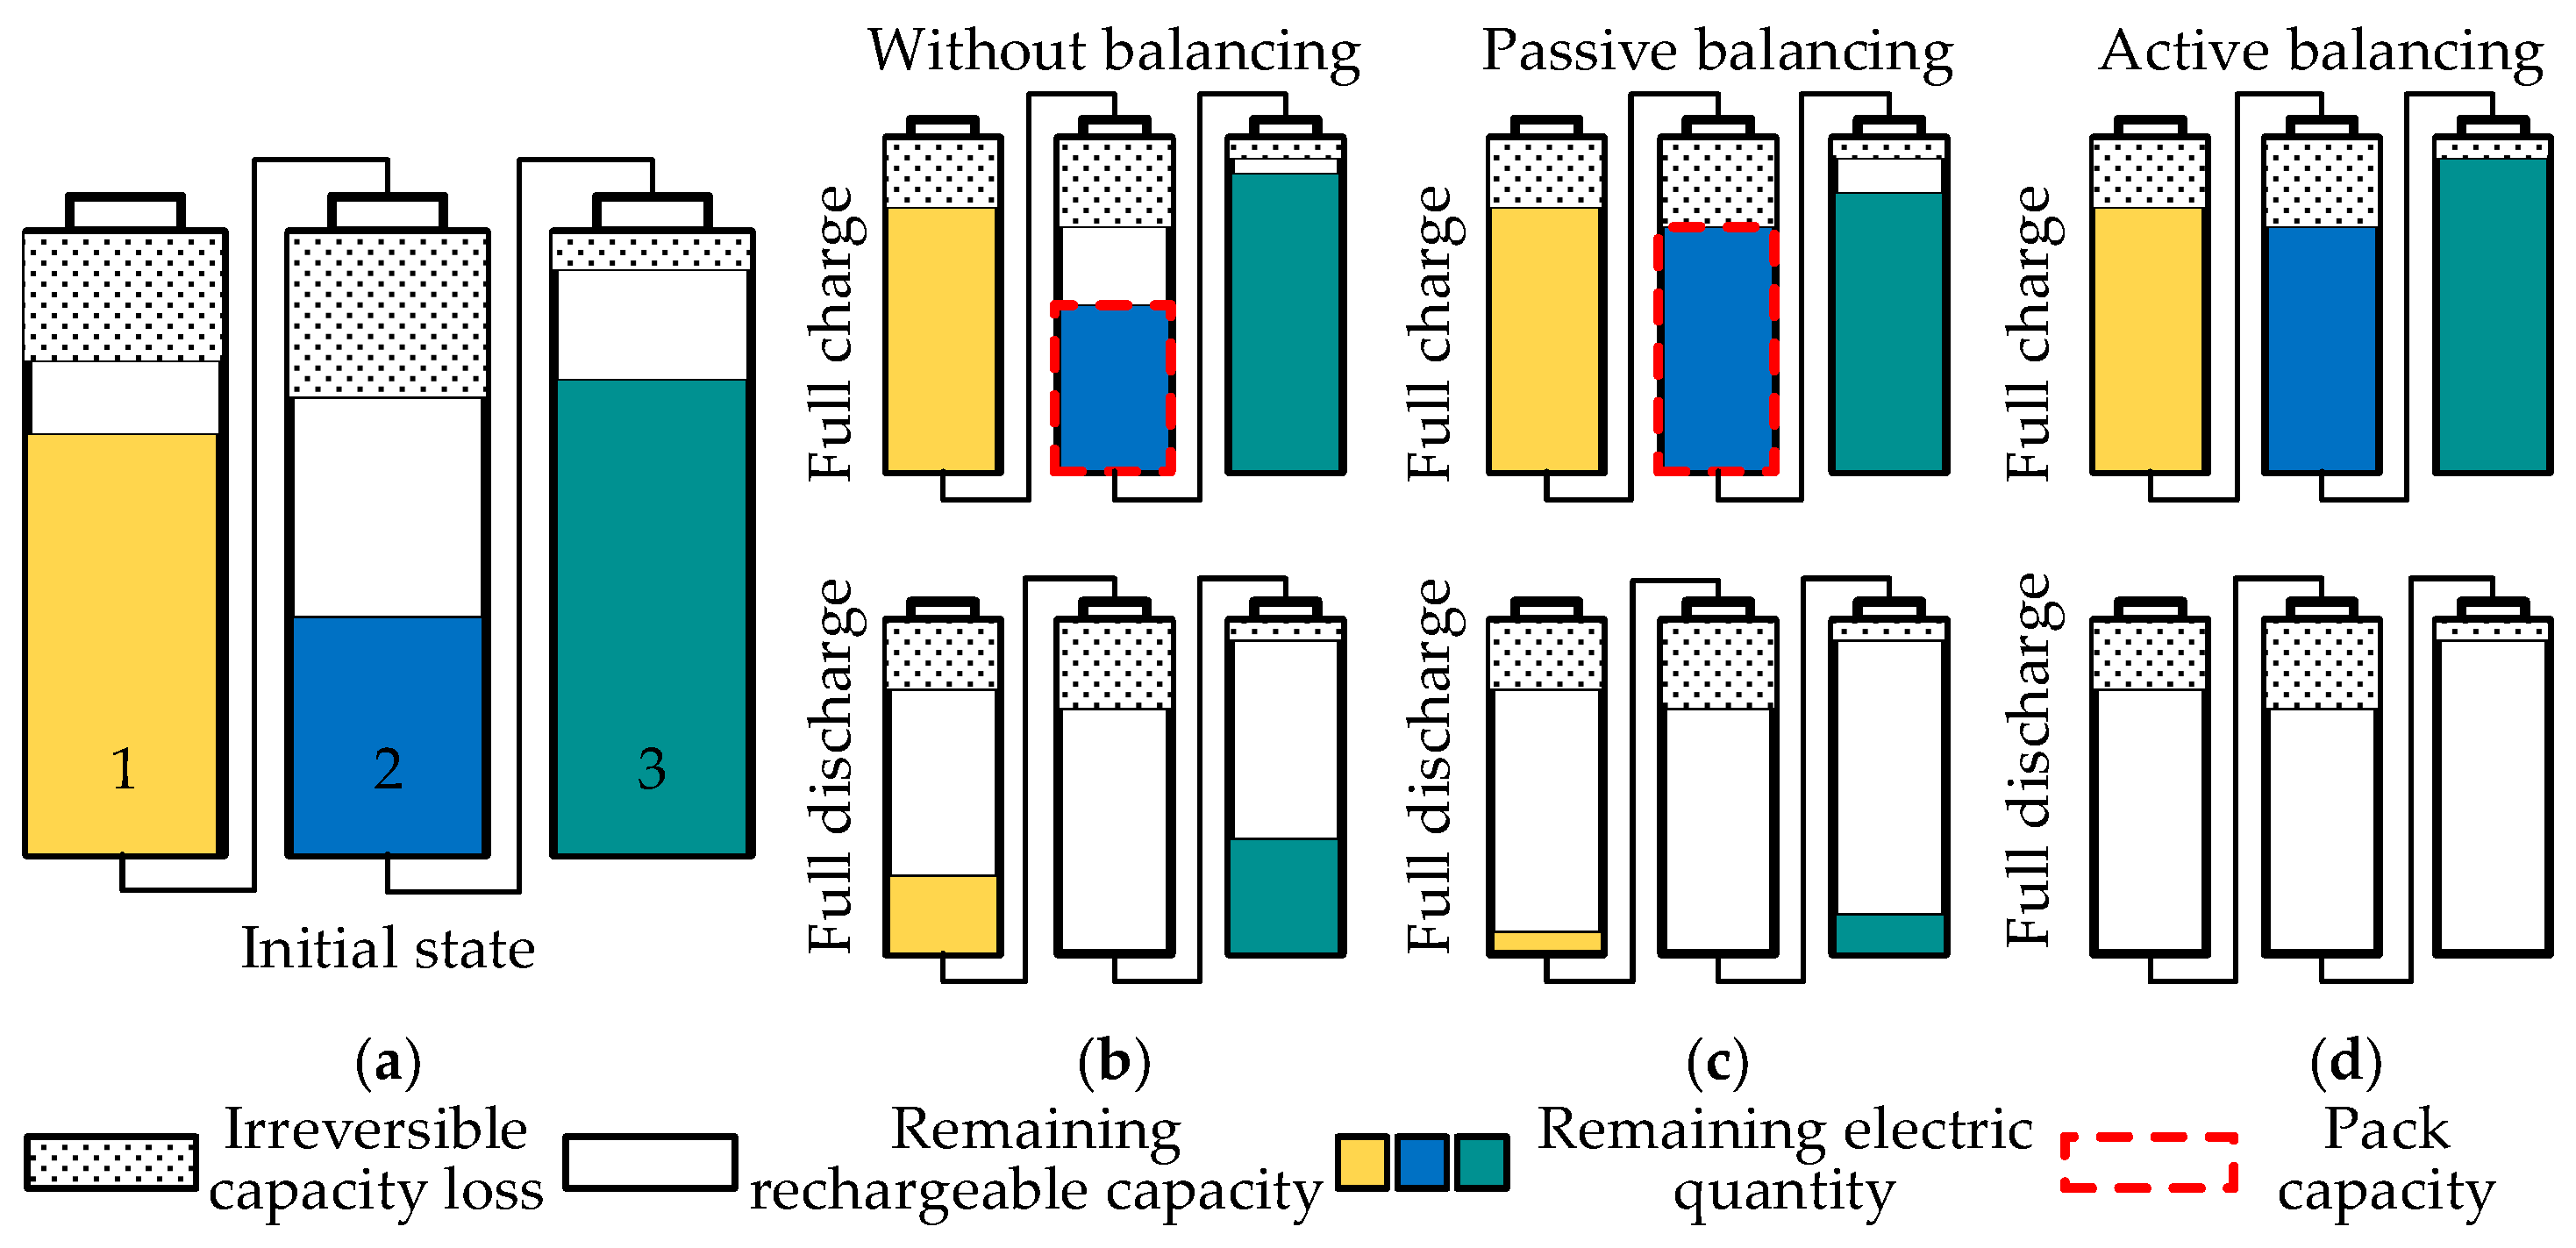
  • Battery packs without balancing systems. Cell 1 exhibits the minimum remaining rechargeable capacity in the initial state, while Cell 2 demonstrates the minimum remaining electric quantity and the smallest total capacity. During charging, Cell 1 gets fully charged first, whereas Cell 2 gets fully discharged first during discharging. This demonstrates that the total pack capacity is constrained by the two cells, and the battery pack state is defined accordingly as follows [30]:
    C a , pack no = min ( C a , i z i ) + min C a , j 1 z j ,
    z pack no = min ( C a , i z i ) C a , pack no × 100 % ,
    where C a , pack no and z pack no denote the capacity and SOC of the battery pack without the balancing system, and Ca and z indicate the capacity and SOC of cells.
  • Battery packs with passive balancing systems. Dissipative resistors continuously discharge Cells 1 and 3 during charging to ensure Cell 2 achieves full charge. Passive balancing is disabled during discharging, allowing Cell 2 (with the minimum remaining electric quantity) to get fully discharged first. Consequently, the theoretical maximum capacity of the battery pack with the passive balancing system equals the capacity of the weakest cell. The battery pack state is defined as follows:
    C a , pack pa = min ( C a , i ) ,
    z pack pa = min ( C a , i z i ) C a , pack pa × 100 % ,
    where C a , pack pa and z pack pa denote the capacity and SOC of the battery pack with the passive balancing system.
  • Battery packs with active balancing systems. Since energy can be transferred among cells, it can theoretically ensure that all cells reach full charge or full discharge simultaneously. The state is defined as follows for the battery pack:
    C a , pack ac = mean C a , i ,
    z pack ac = mean ( C a , i z i ) C a , pack ac × 100 % ,
    where C a , pack ac and z pack ac denote the capacity and SOC of the battery pack with the active balancing system.
Figure 7. State differences in battery packs with different balancing systems. (a) Initial state of the battery packs. (b) Battery packs without balancing systems. (c) Battery packs with passive balancing systems. (d) Battery packs with active balancing systems.
Energies 18 03439 g007
Compared to series-connected battery packs, the basic model of parallel-connected battery packs is relatively simpler. All cells share identical terminal voltages, while the total pack capacity equals the sum of cell capacities. The pack resistance can be calculated using Equation (13):
R pack = R 1 R 2 R n R 1 + R 2 + + R n ,
where Rpack denotes the pack resistance, and Rn represents the internal resistance of each cell. Due to the self-balancing mechanism, the OCVs of all cells equalize after prolonged rest periods [31]. During operation, differences in internal resistance cause varying branch currents. These currents can be calculated according to Equation (14):
1 R 1 0 0 0 1 0 R 2 0 0 0 1 0 0 R n 0 1 1 1 U t I 1 I 2 I n = U OCV , 1 U OCV , 2 U OCV , n I L ,
where UOCV,n represents the OCV of the n-th cell, and In is the current in each branch.

3.2.2. Difference Model

To characterize inconsistency, models for differences in CE, internal resistance, and capacity are added. This section introduces an efficiency variation coefficient Kη to represent the inconsistency in CE among cells, as formulated below:
η dch , i = K η , i η chg , i = K η , i 1 + k η T i 298
where the values of Kη are selected based on experimental data, following a normal distribution with a mean of 0.9884 and a standard deviation of 5 × 10⁻⁵.
The difference models for cell capacity and internal resistance are also generated based on experimental data. The initial internal resistances of cells follow a normal distribution with a mean of 34.78 mΩ and a standard deviation of 1.53 mΩ. After 400 aging cycles, the internal resistances conform to another normal distribution with a mean of 47.04 mΩ and a standard deviation of 3.13 mΩ. Initial and post-aging internal resistances for simulated cells are randomly generated using normal distribution functions. The slope of the line connecting the initial point and the aged point represents kR in Equation (5). Then the internal resistance difference models for each simulated cell can be generated accordingly. The capacity difference models are constructed following a similar methodology.

4. Decoupling Analysis of Inconsistencies

This section employs a controlled single-variable approach to conduct battery pack simulation experiments. The battery parameters are configured according to experimental data, as specified in Table 2.

4.1. Simulation of Battery Pack Connected in Parallel

In parallel-connected battery packs, where all cells maintain identical terminal voltages, self-balancing during prolonged rest periods ensures equal initial SOC. Consequently, the primary factors influencing inconsistency include initial capacity, initial internal resistance, CE, capacity fade rate, and internal resistance growth rate. The simulation focuses on a 12p1s battery pack, and operational conditions are the same as those of aging cycle experiments to maintain degradation trajectory consistency. To reduce simulation time, rest periods between consecutive cycles are omitted.

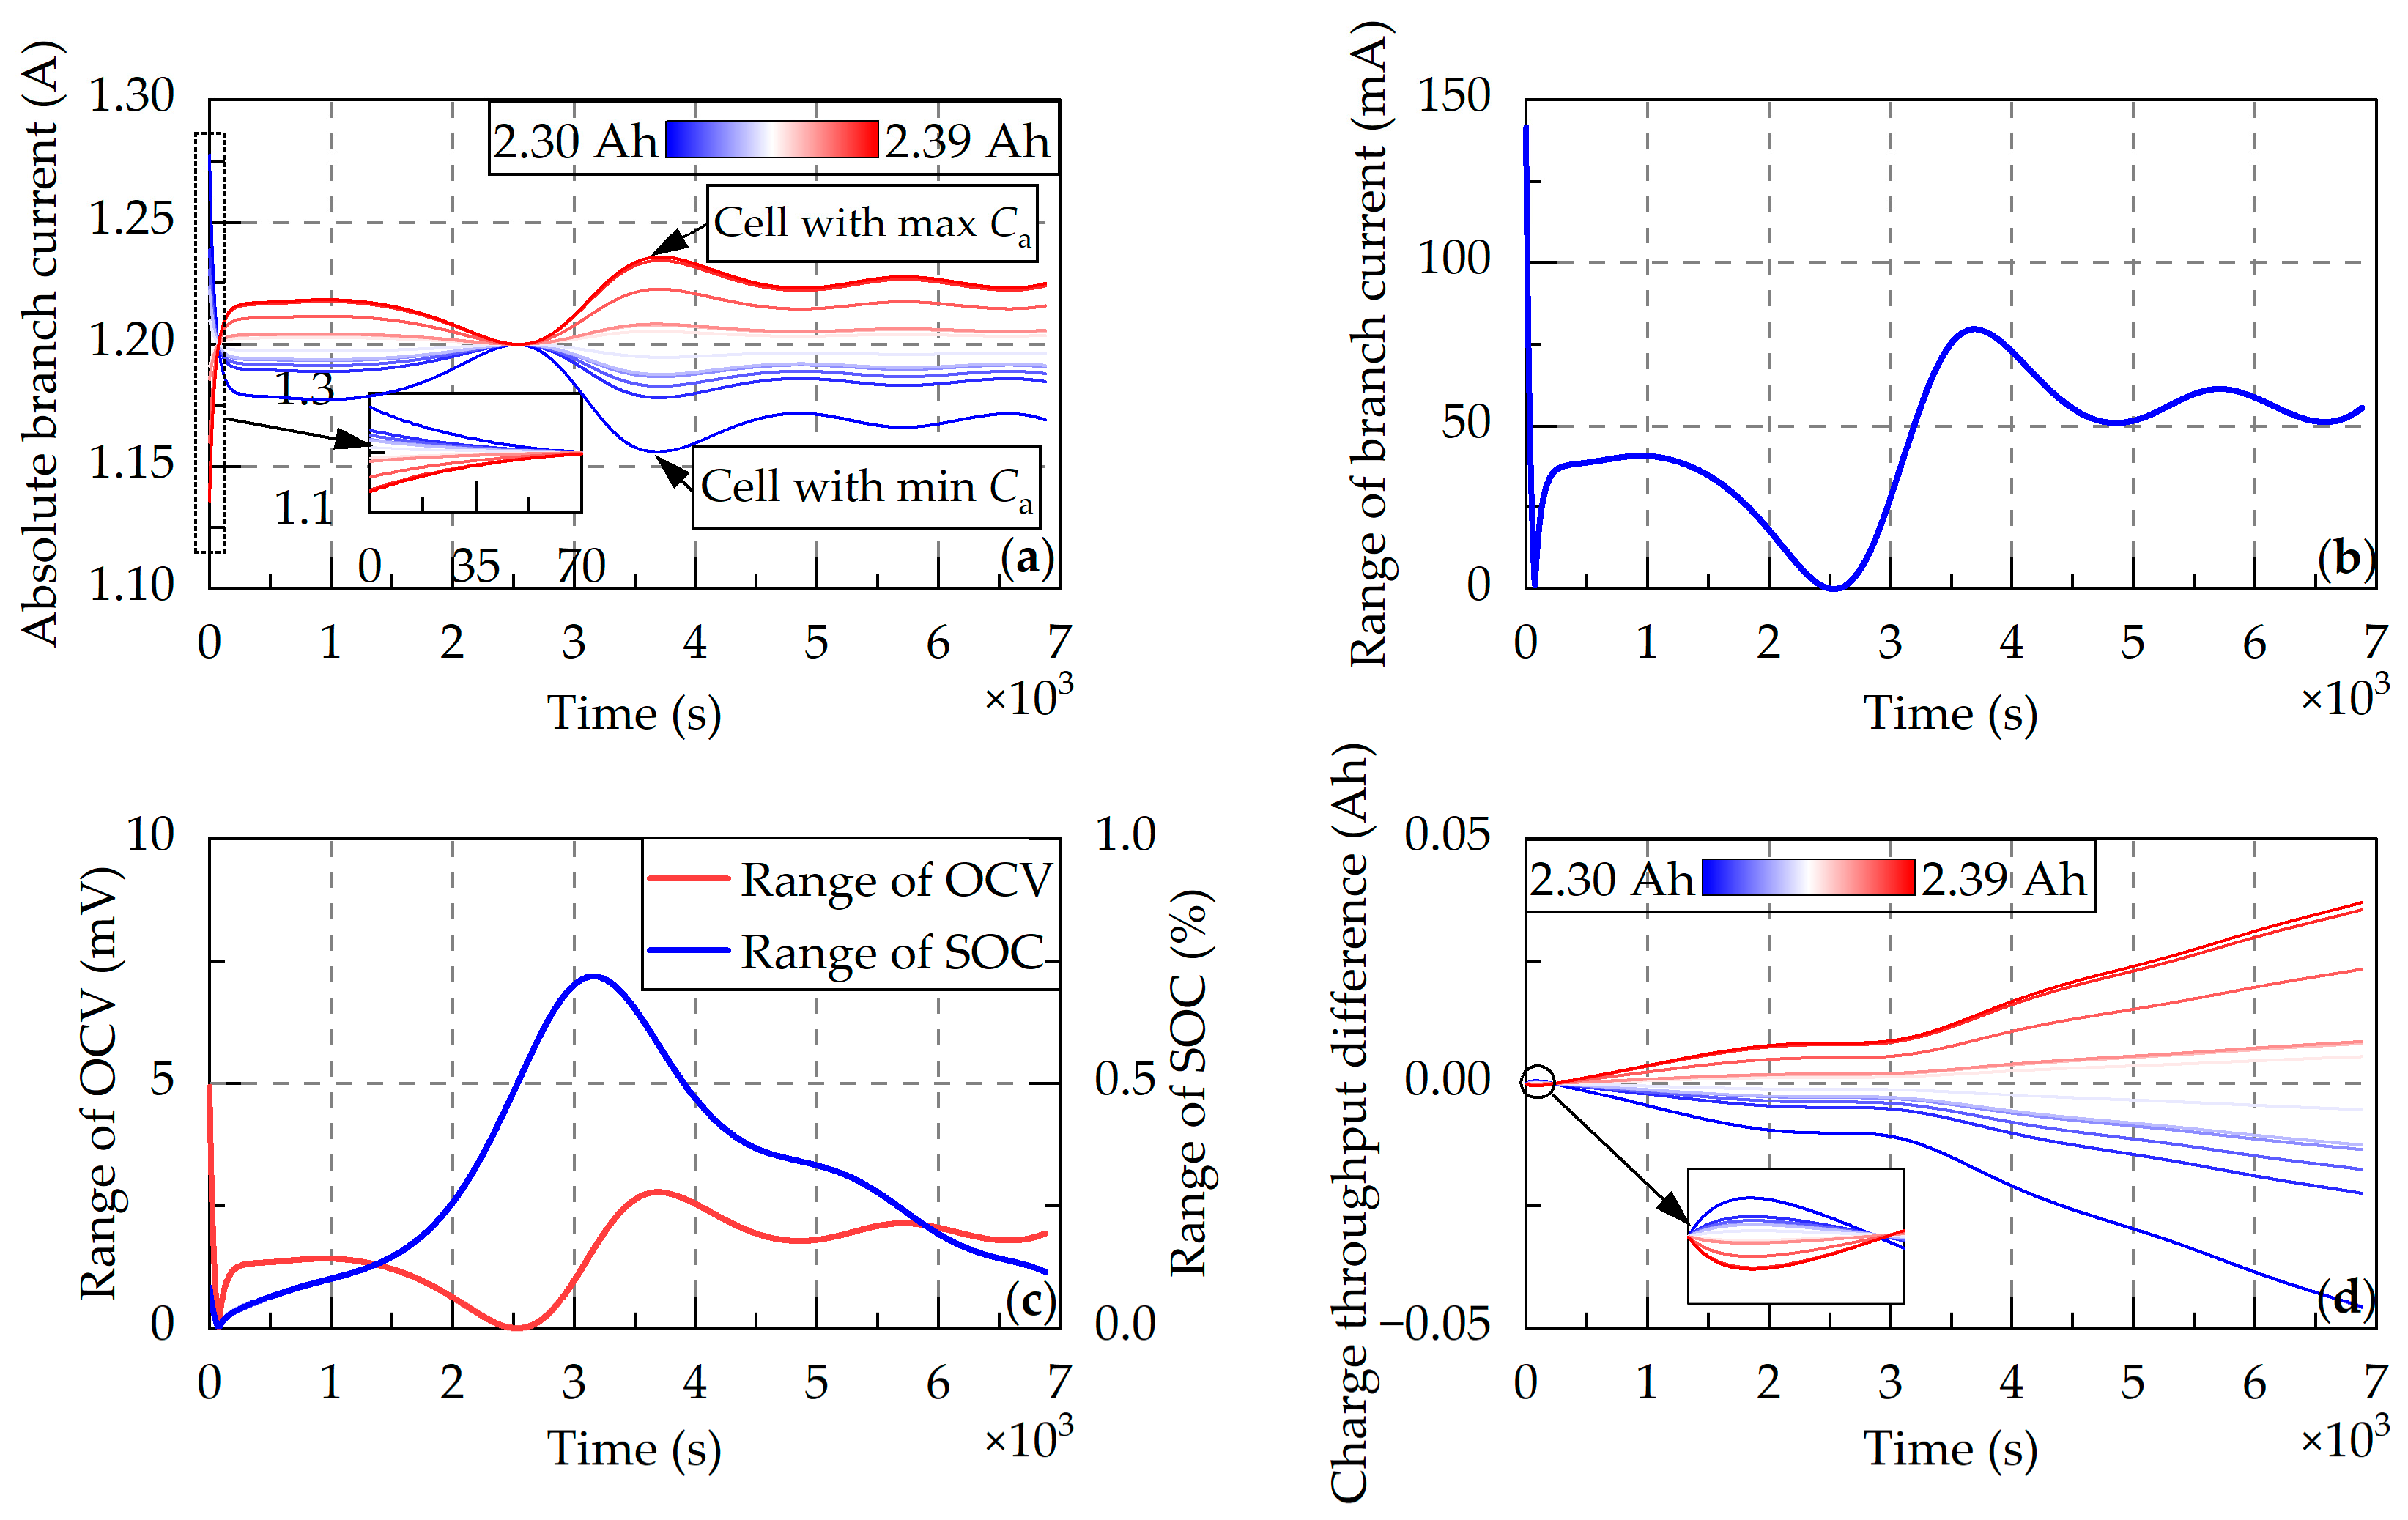
4.1.1. Inconsistent Initial Capacity

The initial capacities of cells, generated stochastically based on Table 2, are listed in Table 3. The capacity fade rate is set to −7.8 × 10⁻⁴ Ah, and the other parameters are all taken as expected values.
Figure 8a reveals fluctuating branch currents during charging. At the transition from discharge to charge, cells with smaller initial capacities exhibit higher branch currents. After approximately 70 s, branch currents turn to uniform levels. Subsequent current fluctuations show that higher-capacity cells sustain larger branch currents, while lower-capacity cells maintain higher SOC. This phenomenon originates from self-balancing mechanisms driven by capacity inconsistencies. When branch currents equalize, all cells have identical ohmic voltage drops and charge throughput. However, higher-capacity cells show smaller SOC increments and correspondingly smaller SOC increments. To preserve terminal voltage uniformity, branch currents of higher-capacity cells will increase to reduce SOC differences between cells, and ohmic voltage drops will also increase accordingly. As SOC differences decrease progressively, current inconsistencies diminish correspondingly, thus establishing a dynamic equilibrium. Figure 8b,c demonstrate that upon entering the OCV plateau, the differences in both branch currents and OCV are minimized. Charge throughput difference is defined as the difference between the charge/discharge throughput of each branch and the average throughput. As shown in Figure 8d, except during initial cycle transitions, lower-capacity cells consistently have less charge throughput. The curves exhibit fishtail-like expansion throughout the process. During the entire charging cycle, the maximum current difference reaches 0.06 C, the maximum variation of OCV is 5 mV, and the SOC difference remains below 1%.
Following the transition from charging to discharging cycles, the SOC of the cell with the minimum capacity becomes the lowest. Since the discharging rate is higher than the charging rate, Figure 9b,c demonstrate that with an initial capacity difference of 3.8%, the range of branch currents reaches 0.1 C, the range of OCVs attains 8.3 mV, and the range of SOCs exceeds 1%.

4.1.2. Inconsistent Initial Internal Resistance

Initial internal resistances of cells, randomly generated based on Table 2, are listed in Table 4. The internal resistance growth rates are set to 0.03 mΩ.
Simulation results for a single discharging cycle are shown in Figure 10. The cell with the lowest initial internal resistance exhibits the smallest ohmic voltage drop and the lowest SOC. Upon entering the OCV plateau, discharge currents in lower-resistance branches increase to maintain terminal voltage uniformity, further amplifying the SOC differences. However, after exiting the OCV plateau, the discharge currents in lower-resistance branches rapidly decrease. Figure 10a,d illustrate the dynamic evolution of branch currents and charge throughput differences. Lower-resistance cells initially release more energy, while their discharge rates progressively decrease. The charge throughput difference curves first expand and then contract like a “spindle”. Notably, despite identical cell capacities, lower-resistance cells deliver more energy during discharging cycles and absorb more charge during charging cycles, creating differences in C-rates and DOD. Figure 10b,c reveal that given the initial maximum internal resistance difference of 18.1%, the range of branch currents reaches 0.33 C, the range of OCVs attains 40 mV, and the range of SOCs exceeds 5%.

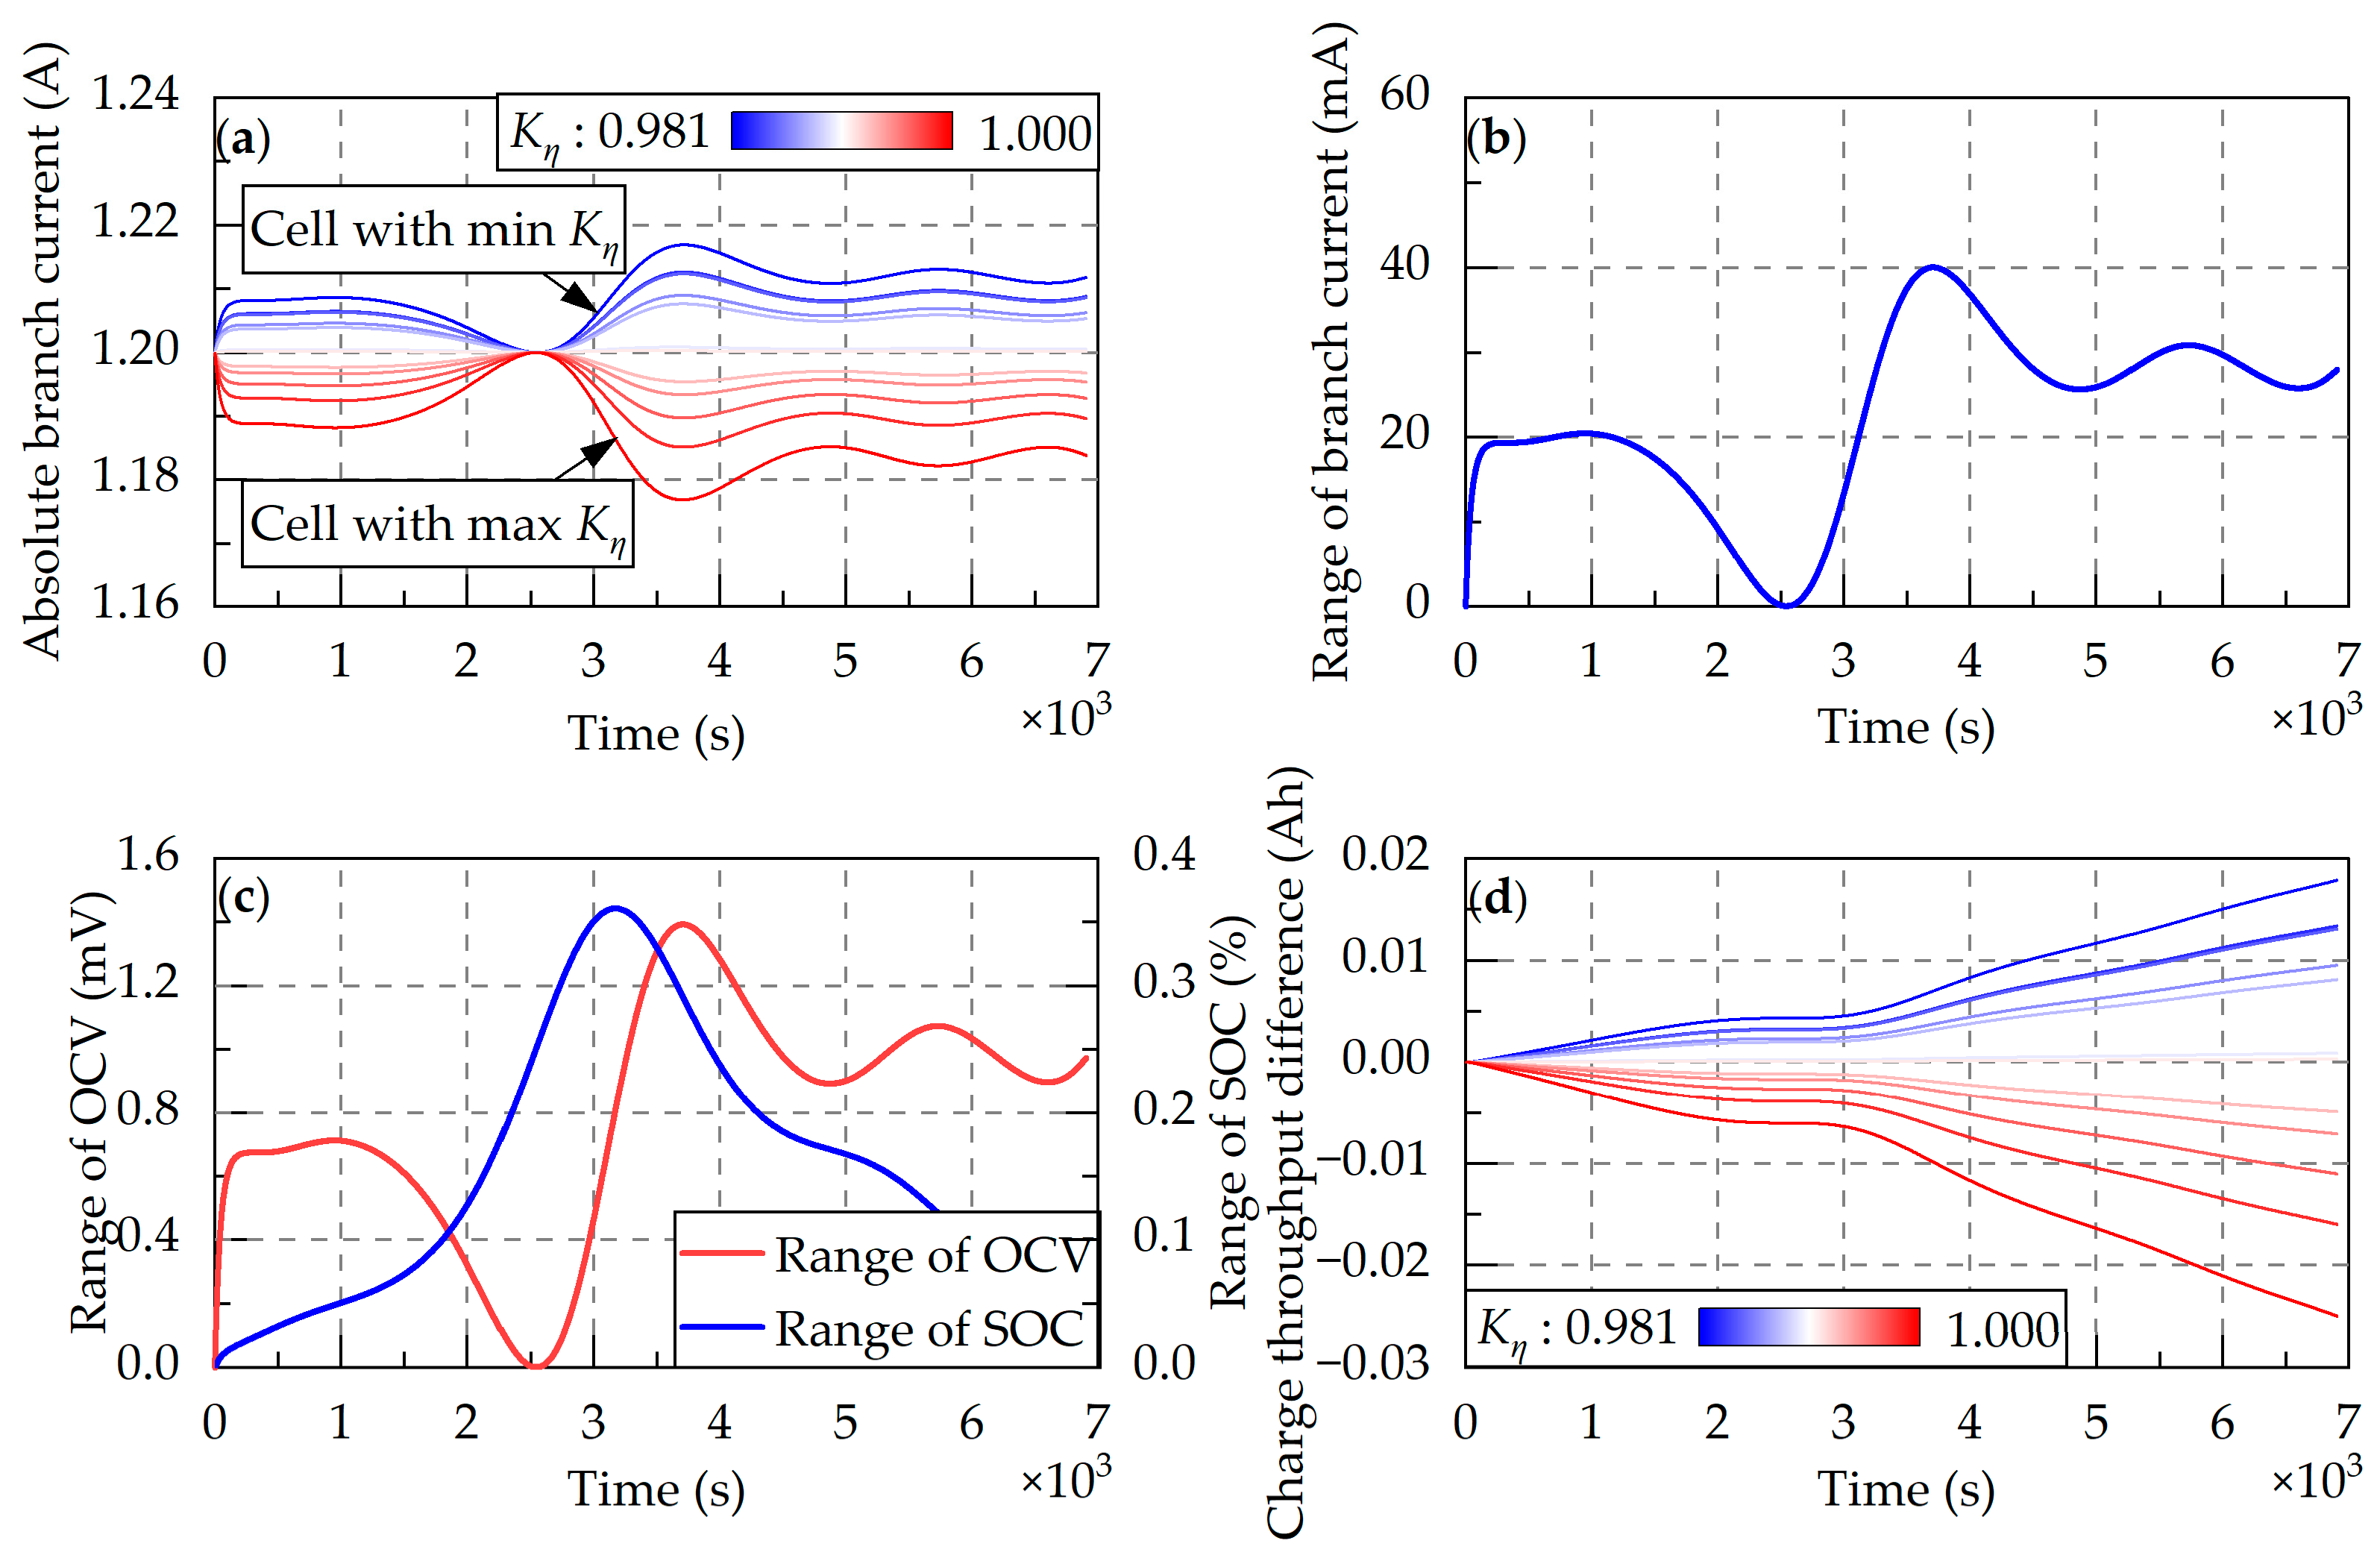
4.1.3. Inconsistent Coulombic Efficiency

Given the small inconsistencies in actual CE, this section amplifies the standard deviation of the efficiency variation coefficient to enhance simulation clarity. The efficiency variation coefficients for cells are specified in Table 5, while other parameters are set to their expected values. CE inconsistencies impact the battery pack on a relatively small timescale. Within a single cycle, CE inconsistencies directly induce SOC differences among cells. As demonstrated in Figure 11 during charging, cells with lower CE have higher branch currents but lower SOC, similar to simulation results with inconsistent initial capacities. The maximum range of branch currents is about 0.02 C, the range of OCVs attains 1.4 mV, and the range of SOCs is less than 0.4%.
As shown in Figure 12, inconsistencies show no significant progression even after 400 aging cycles. It indicates that parallel-connected battery packs are virtually unaffected by CE inconsistencies.

4.1.4. Inconsistent Capacity Fade Rate or Resistance Growth Rate

Inconsistent capacity fading rate and resistance growth rate affect the battery pack over a long-term timescale. Their effects resemble those caused by initial capacity and internal resistance inconsistencies. As cycles accumulate, the cumulative impacts of C-rate, DOD, equivalent cycle number, and temperature differences become stronger. This further exacerbates inconsistencies in capacity fade rates and resistance growth rates, ultimately accelerating capacity degradation in parallel-connected battery packs. In extreme cases, it can induce certain cells’ actual charge/discharge rates to exceed the maximum limit, causing safety risks [32].

4.2. Simulation of Battery Pack Connected in Series

The simulation focuses on a 12s1p battery pack, and operational conditions are the same as those of aging cycle experiments.

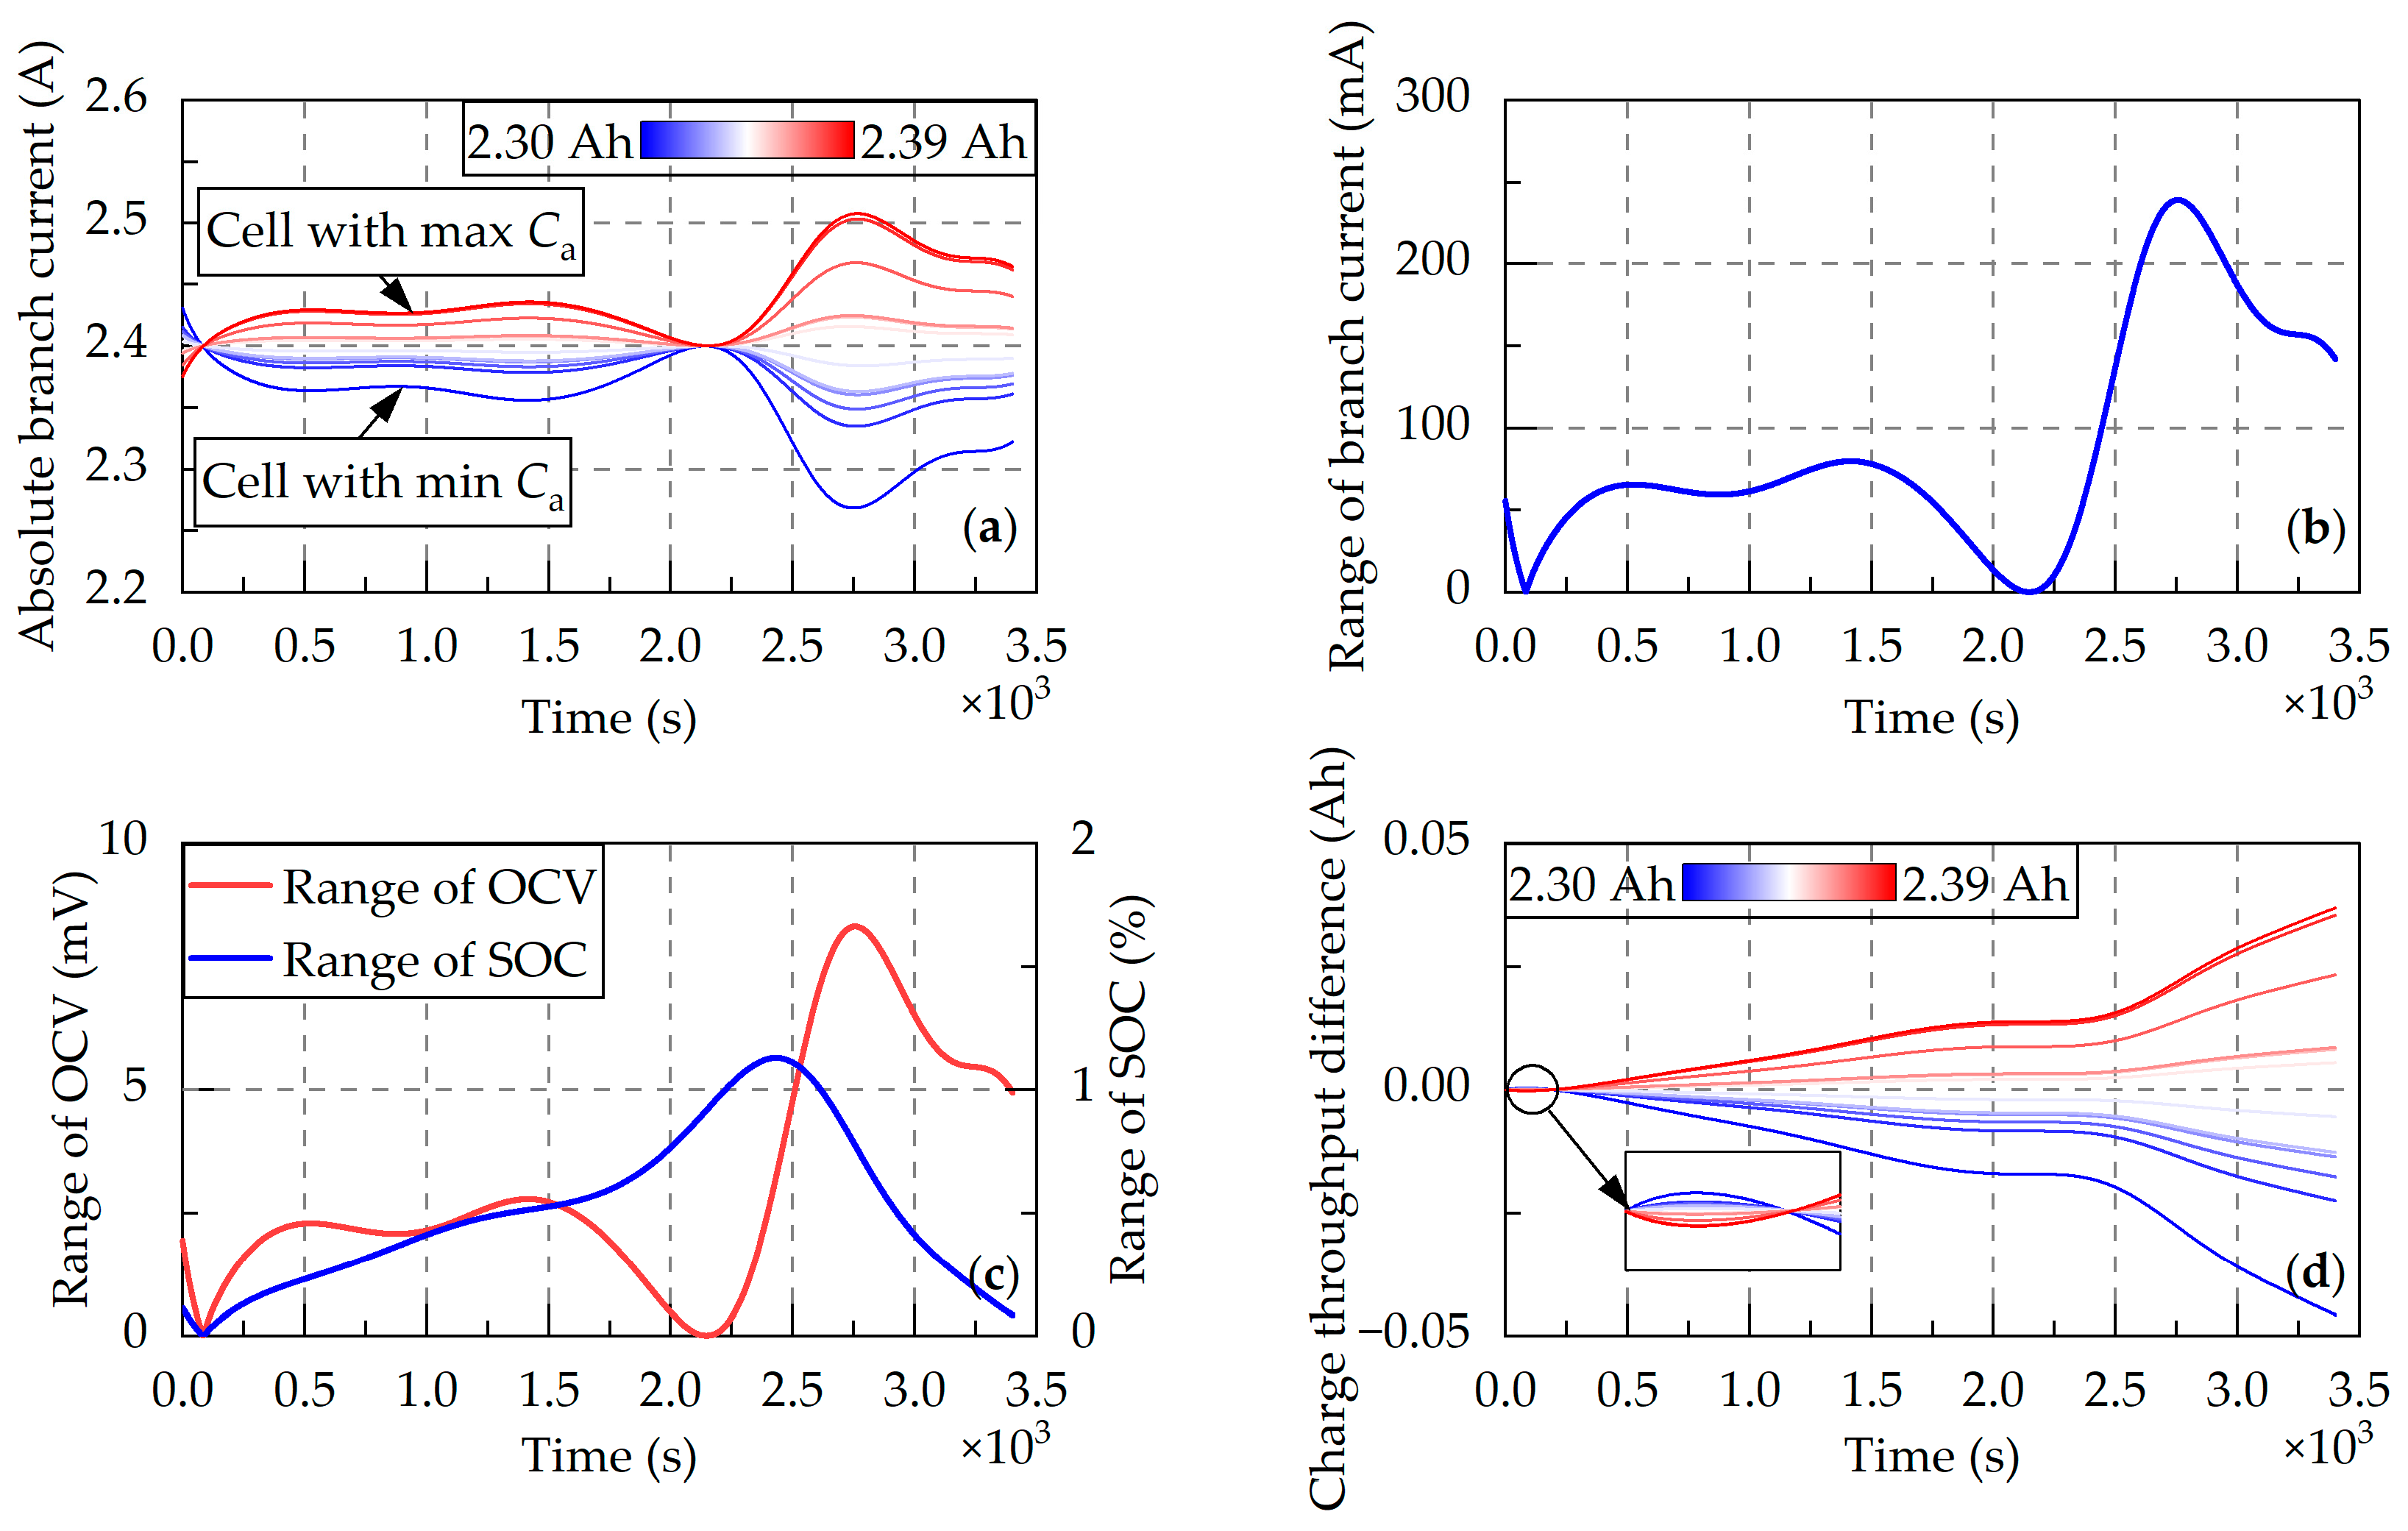
4.2.1. Inconsistent Initial Capacity

The cell parameters align with those in Section 4.1.1. Figure 13a illustrates the fade trajectories of average cell capacity, minimum cell capacity, and pack capacity. The fade trajectory of pack capacity fully overlaps with that of the weakest cell, maintaining a constant offset from the average cell capacity. This demonstrates that the fade rates of series-connected packs are determined solely by the weakest cell, independent of initial capacity inconsistencies. While excessive initial capacity inconsistencies reduce the pack’s lifetime average capacity, such effects remain stable and do not gradually expand with aging. Notably, the capacity gaps between the pack and the minimum/average cell capacities represent theoretically recoverable capacity losses through passive or active balancing systems, respectively. As shown in Figure 13b, passive balancing systems cannot restore capacity losses due to initial capacity inconsistencies, while active balancing systems can recover a fixed capacity equal to the difference between average and minimum cell capacities. For packs with an initial capacity range of 3.8%, active balancing systems can restore capacity by approximately 2%. Since cells are typically screened based on initial capacities before assembly, the impact of initial capacity inconsistency on series-connected packs can generally be eliminated.

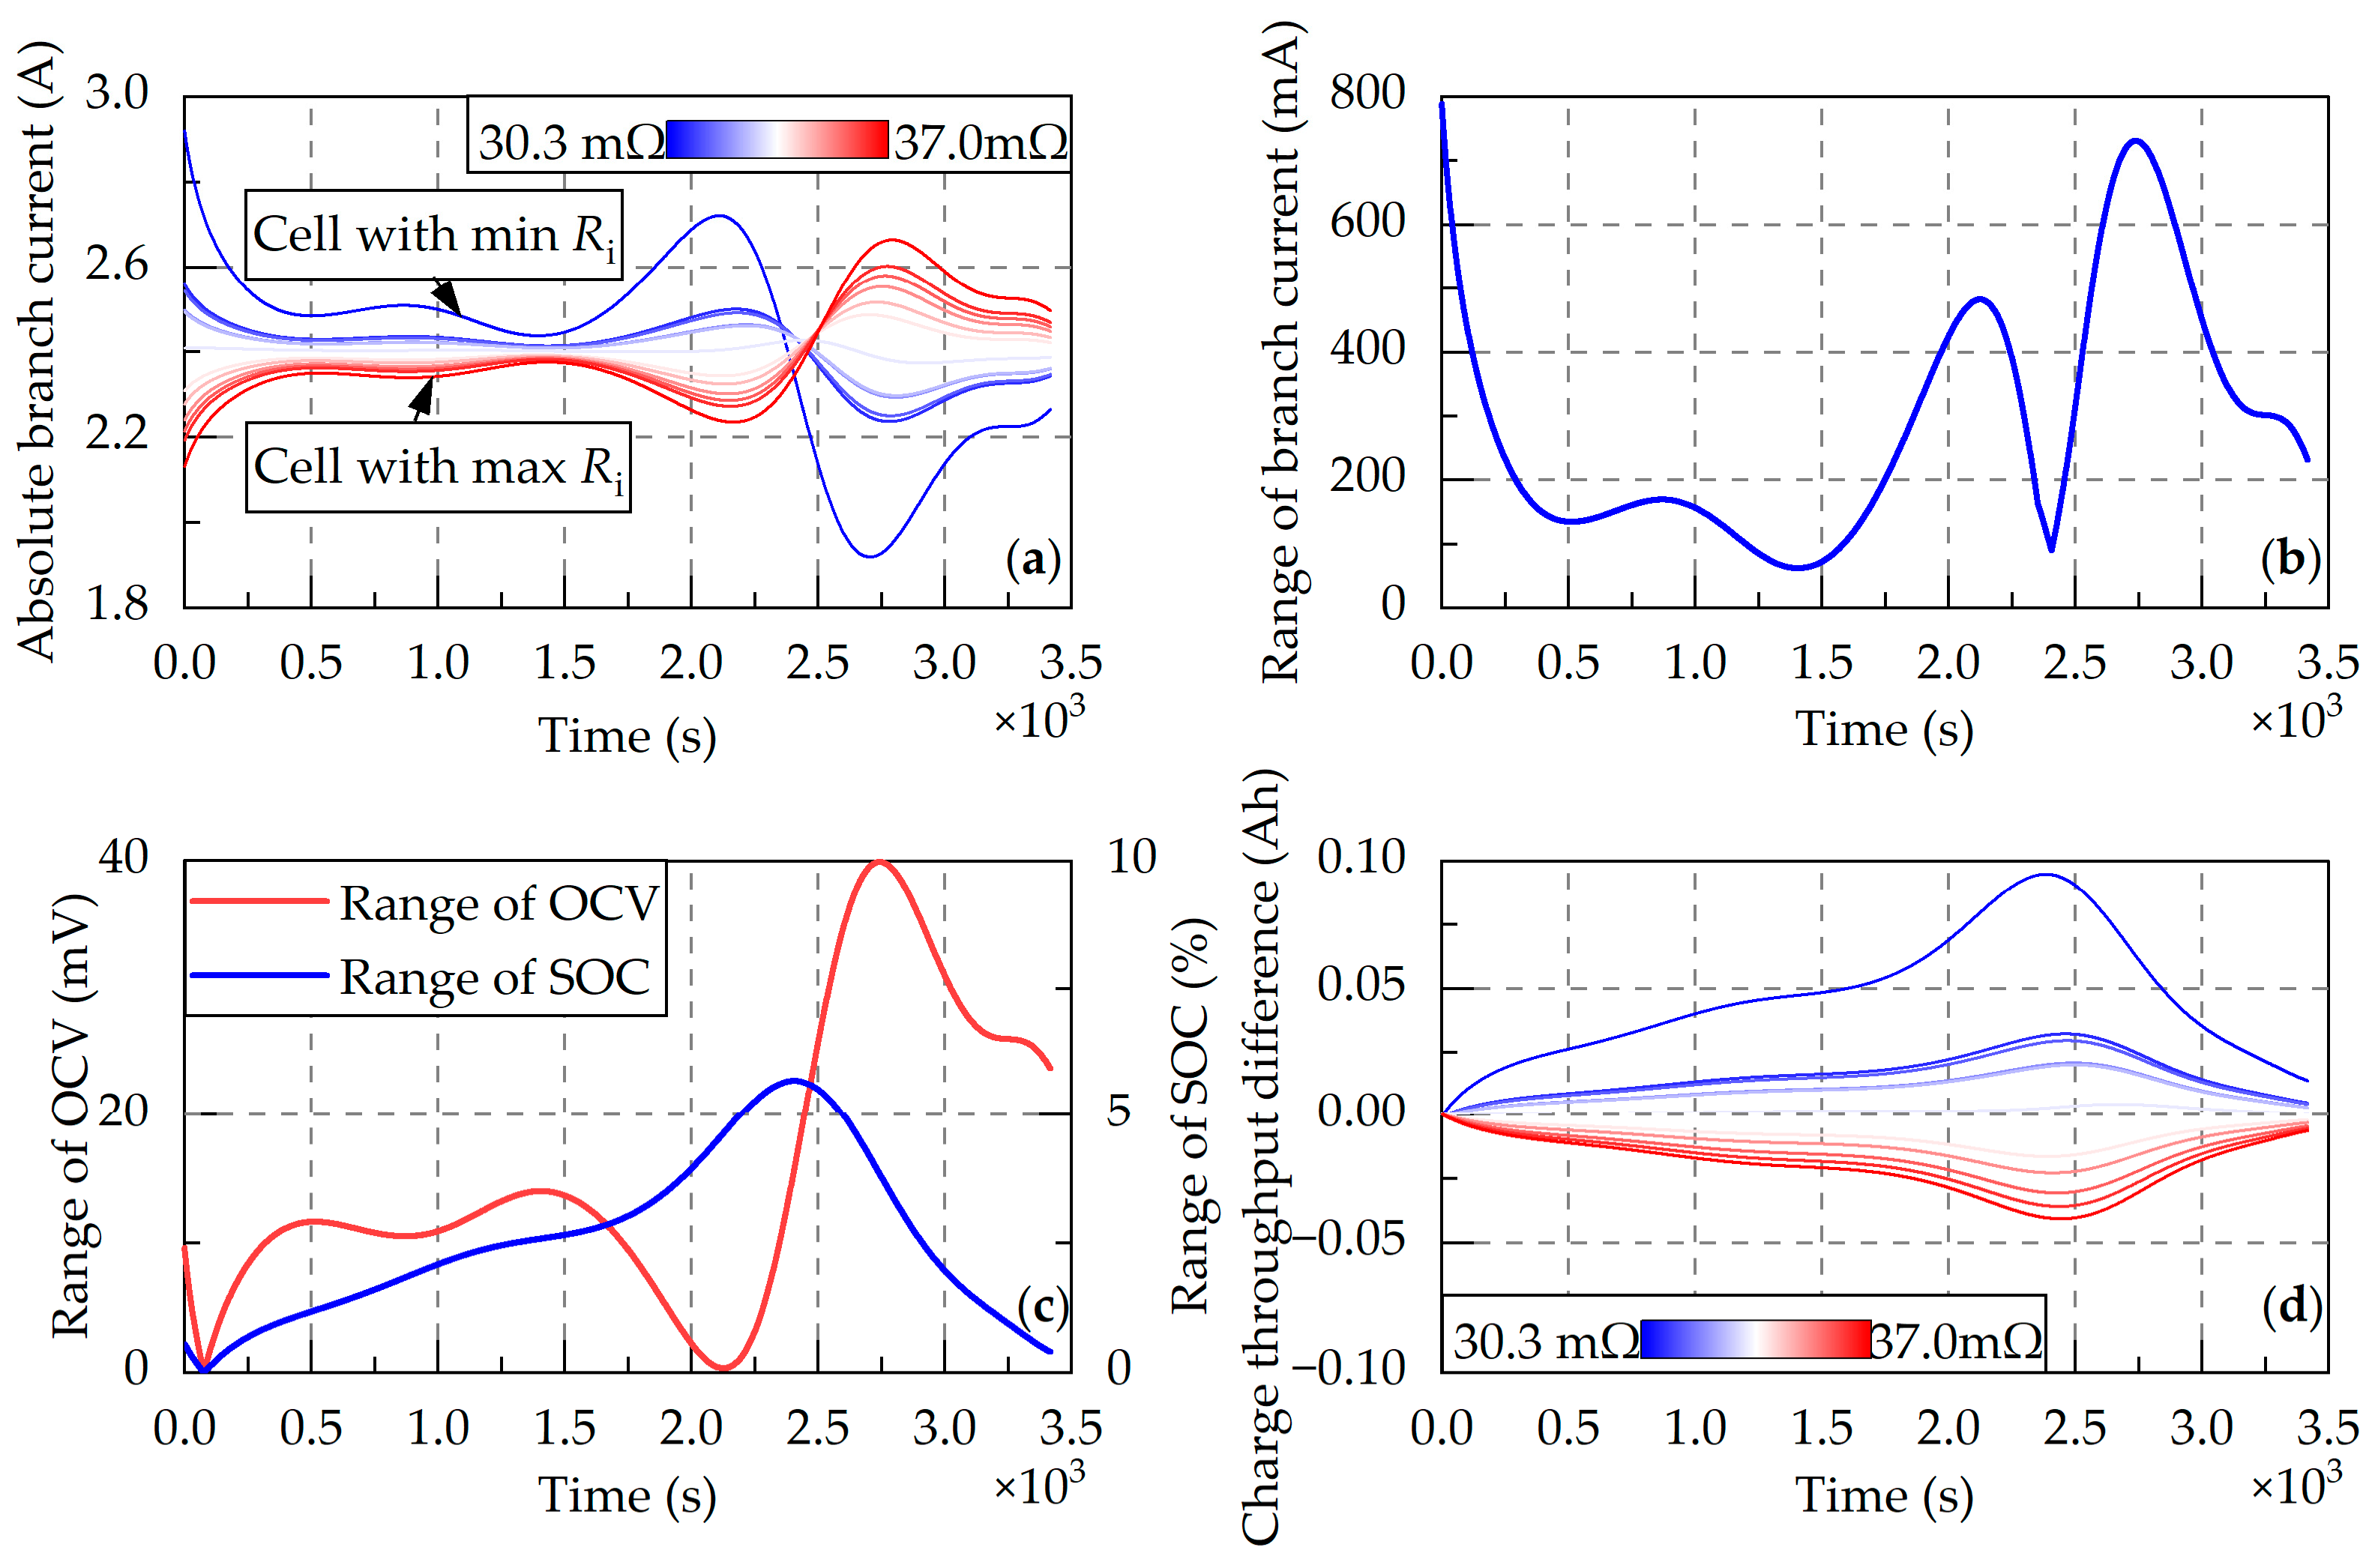
4.2.2. Inconsistent Initial Internal Resistance

The parameters of cells align with those in Section 4.1.2. It should be noted that internal resistance inconsistencies lead to temperature variations, thereby causing differences in CE. However, during the simulation, the temperature difference induced by internal resistance does not exceed 1 °C, resulting in minimal SOC differences. As shown in Figure 14b, the capacity improvement through balancing is nearly zero, so the initial internal resistance inconsistency has almost no effect on the series-connected battery pack’s capacity.

4.2.3. Inconsistent Initial SOC

The initial SOCs of cells are generated according to Table 2, as detailed in Table 6. All other parameters are set to their expected values. Figure 15 reveals identical fade trajectories of the minimum cell capacity and average cell capacity, both maintaining a constant offset from the pack capacity fade trajectory. Notably, the recoverable capacity losses through active/passive balancing remain consistent, with normalized values closely matching the initial SOC range. This indicates that initial SOC inconsistencies have no persistent impact on battery packs, as such inconsistencies can be fully eliminated through balancing in the early stage.

4.2.4. Inconsistent Coulombic Efficiency

The efficiency variation coefficients are randomly generated based on Table 2 as shown in Table 7, with other parameters set to their expected values.
As shown in Figure 16, after 400 aging cycles, the minimum cell capacity retains 86.5% of the rated value, while the pack capacity declines to 81%. This is mainly due to the CE variations causing varying charge throughput across cells. Charge throughput differences accumulate progressively with aging, resulting in pack capacity losses illustrated in Figure 7b. Critically, CE inconsistencies induce negligible capacity variations, as evidenced by nearly identical minimum and average cell capacities in Figure 16a. Figure 16b further demonstrates that both active and passive balancing systems effectively reduce the battery pack capacity loss caused by CE inconsistencies.

4.2.5. Inconsistent Capacity Fade Rate

The capacity fade rates of cells are set as specified in Table 8, with other parameters assigned their expected values.
Figure 17 demonstrates that the battery pack capacity always equals the minimum cell capacity, while the difference between pack capacity and average cell capacity gradually increases. This pack capacity loss can only be recovered by active balancing systems.

4.2.6. Inconsistent Resistance Growth Rate

The resistance growth rates of cells are set as specified in Table 9, with other parameters assigned their expected values.
As shown in Figure 18a, even with a 50% range in resistance growth rates, the minimum cell capacity, average cell capacity, and pack capacity are roughly equal. Figure 18b reveals that increased internal resistance differences indirectly induce minor CE variations, though the recoverable capacity loss through balancing systems remains below 0.1%. These results conclusively demonstrate that inconsistencies in resistance growth rates have a negligible impact on battery pack capacity.

5. Discussion

The preceding analysis demonstrates that the self-balancing mechanism in parallel-connected battery packs functionally equates to terminal voltage-based active balancing. Throughout the aging process, normal cell inconsistencies exhibit minimal impact on the capacity of parallel-connected battery packs, so no extra balancing system is needed. However, significant inconsistencies, particularly large differences in internal resistance, can cause individual cells to experience higher current rates than the pack average, accelerating cell aging or causing safety risks. Consequently, pre-assembly screening of capacity and resistance, especially resistance, is critical for parallel-connected packs.
For series-connected battery packs, supplemental balancing systems prove essential. The applicability of the active/passive balancing system is discussed below from three perspectives.
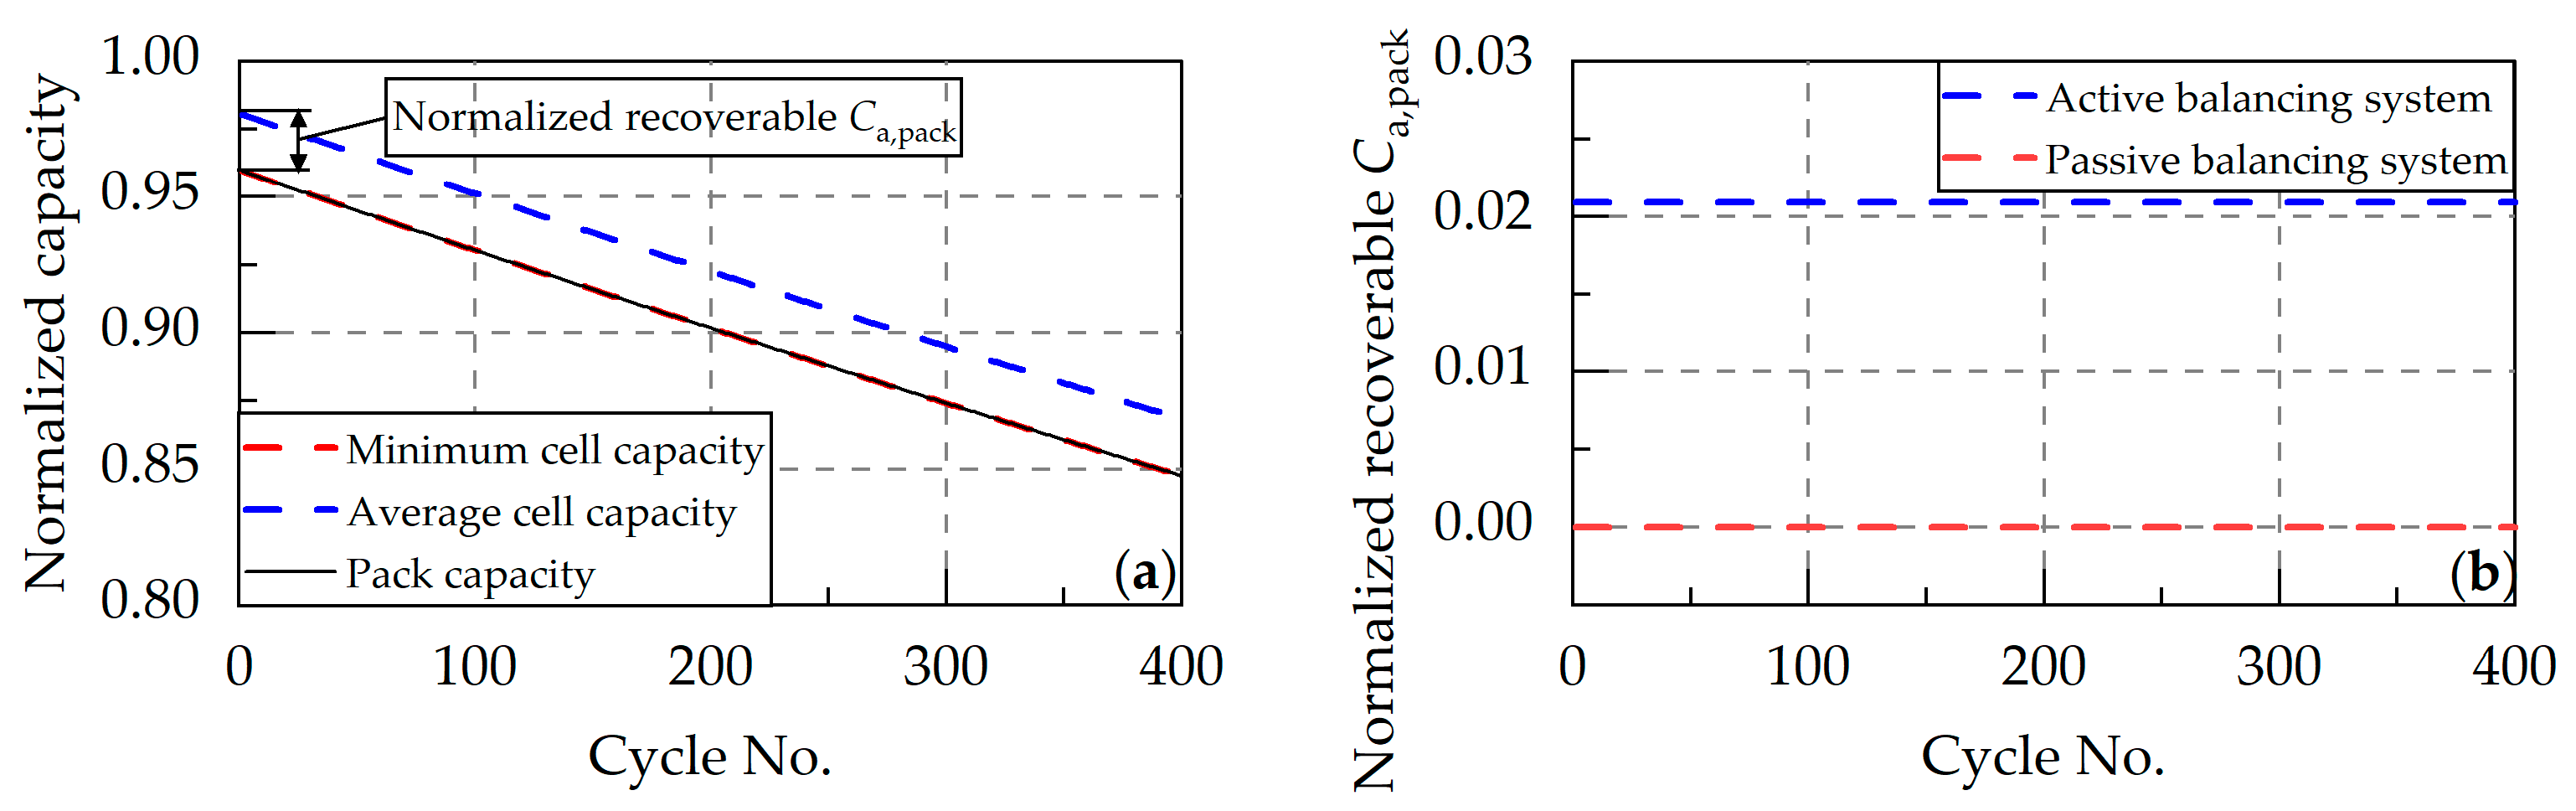
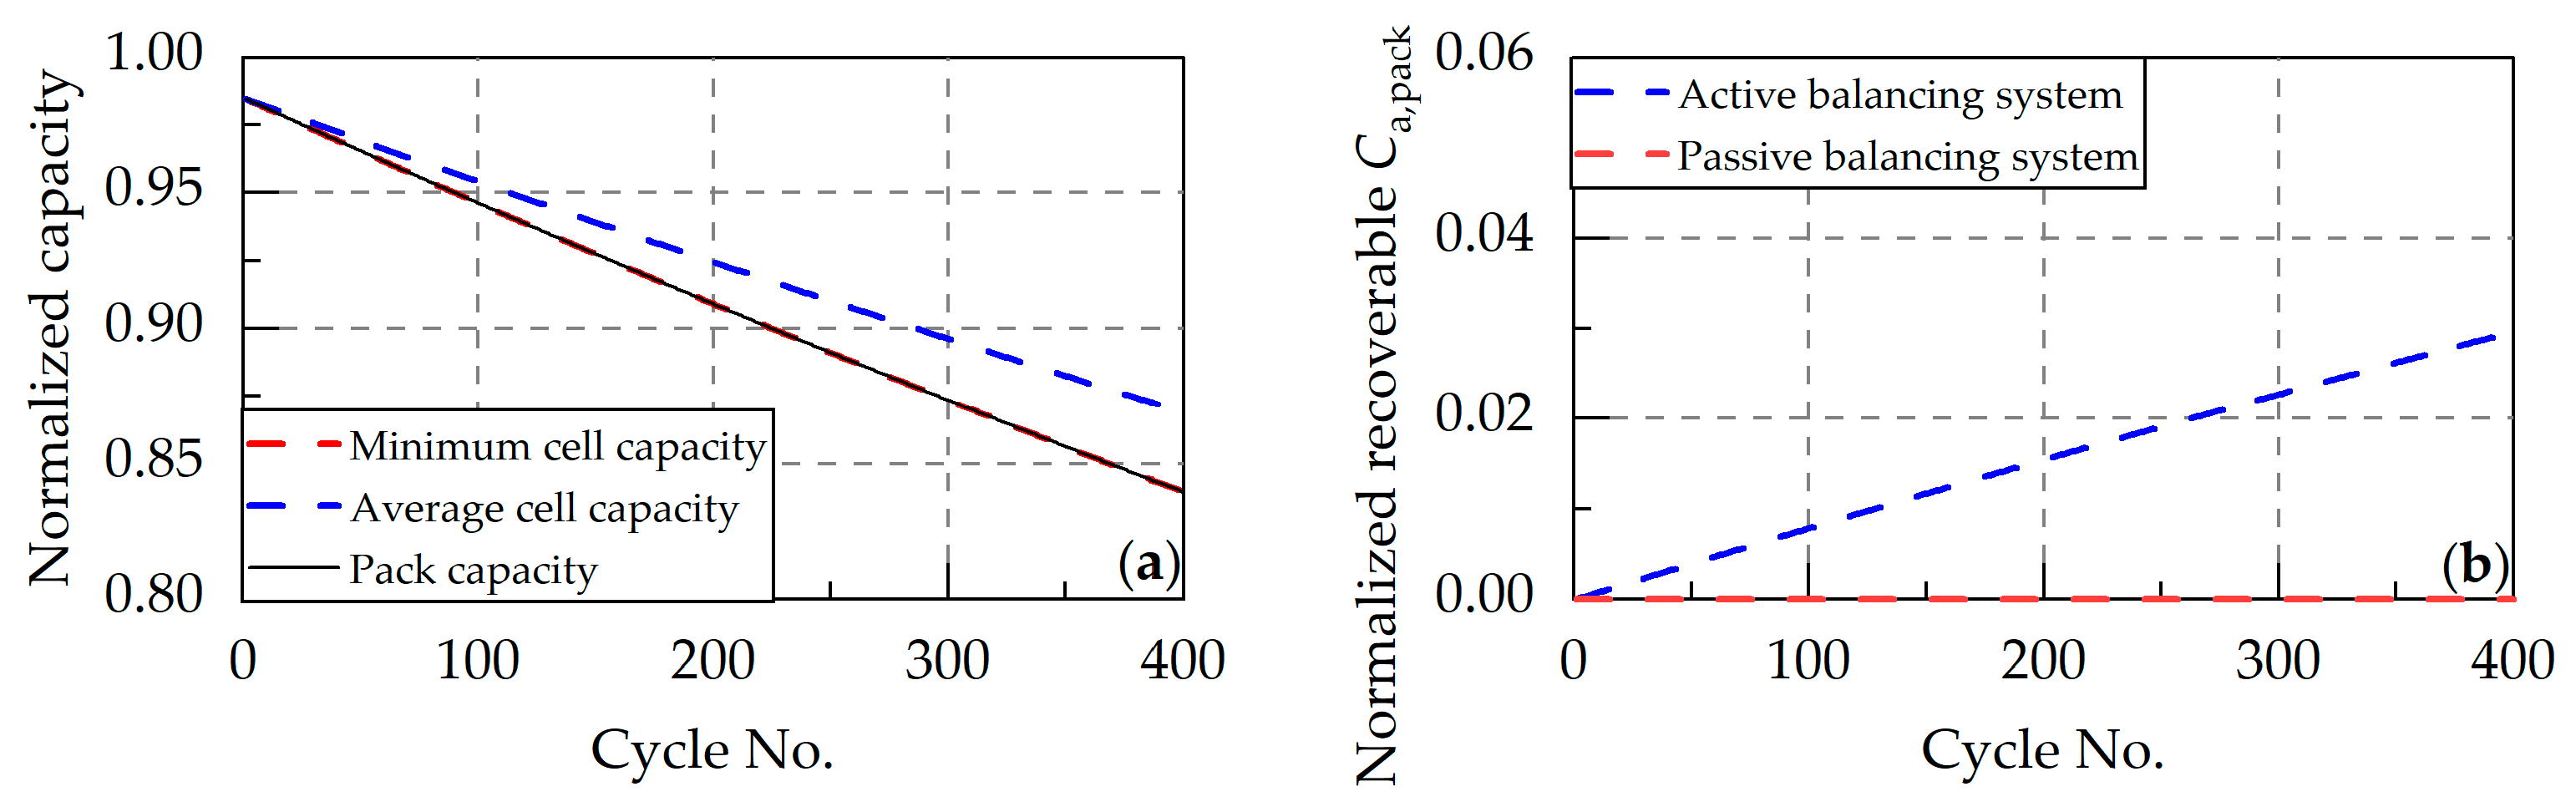
  • Capacity inconsistency. Capacity inconsistencies primarily arise from steady-state differences from initial capacity and dynamic differences caused by varying capacity fade rates. Although CE inconsistencies indirectly contribute to capacity inconsistencies, their impact remains negligible compared to the former factors. As mentioned earlier, passive balancing systems cannot address capacity inconsistencies. Only active balancing systems ensuring full charge and discharge of all cells can achieve theoretical maximum pack capacity, while persistent capacity inconsistencies impose heavy loads on active balancing circuits. For well-managed packs with pre-screened capacities, the costly and complex active balancing systems can be avoided.
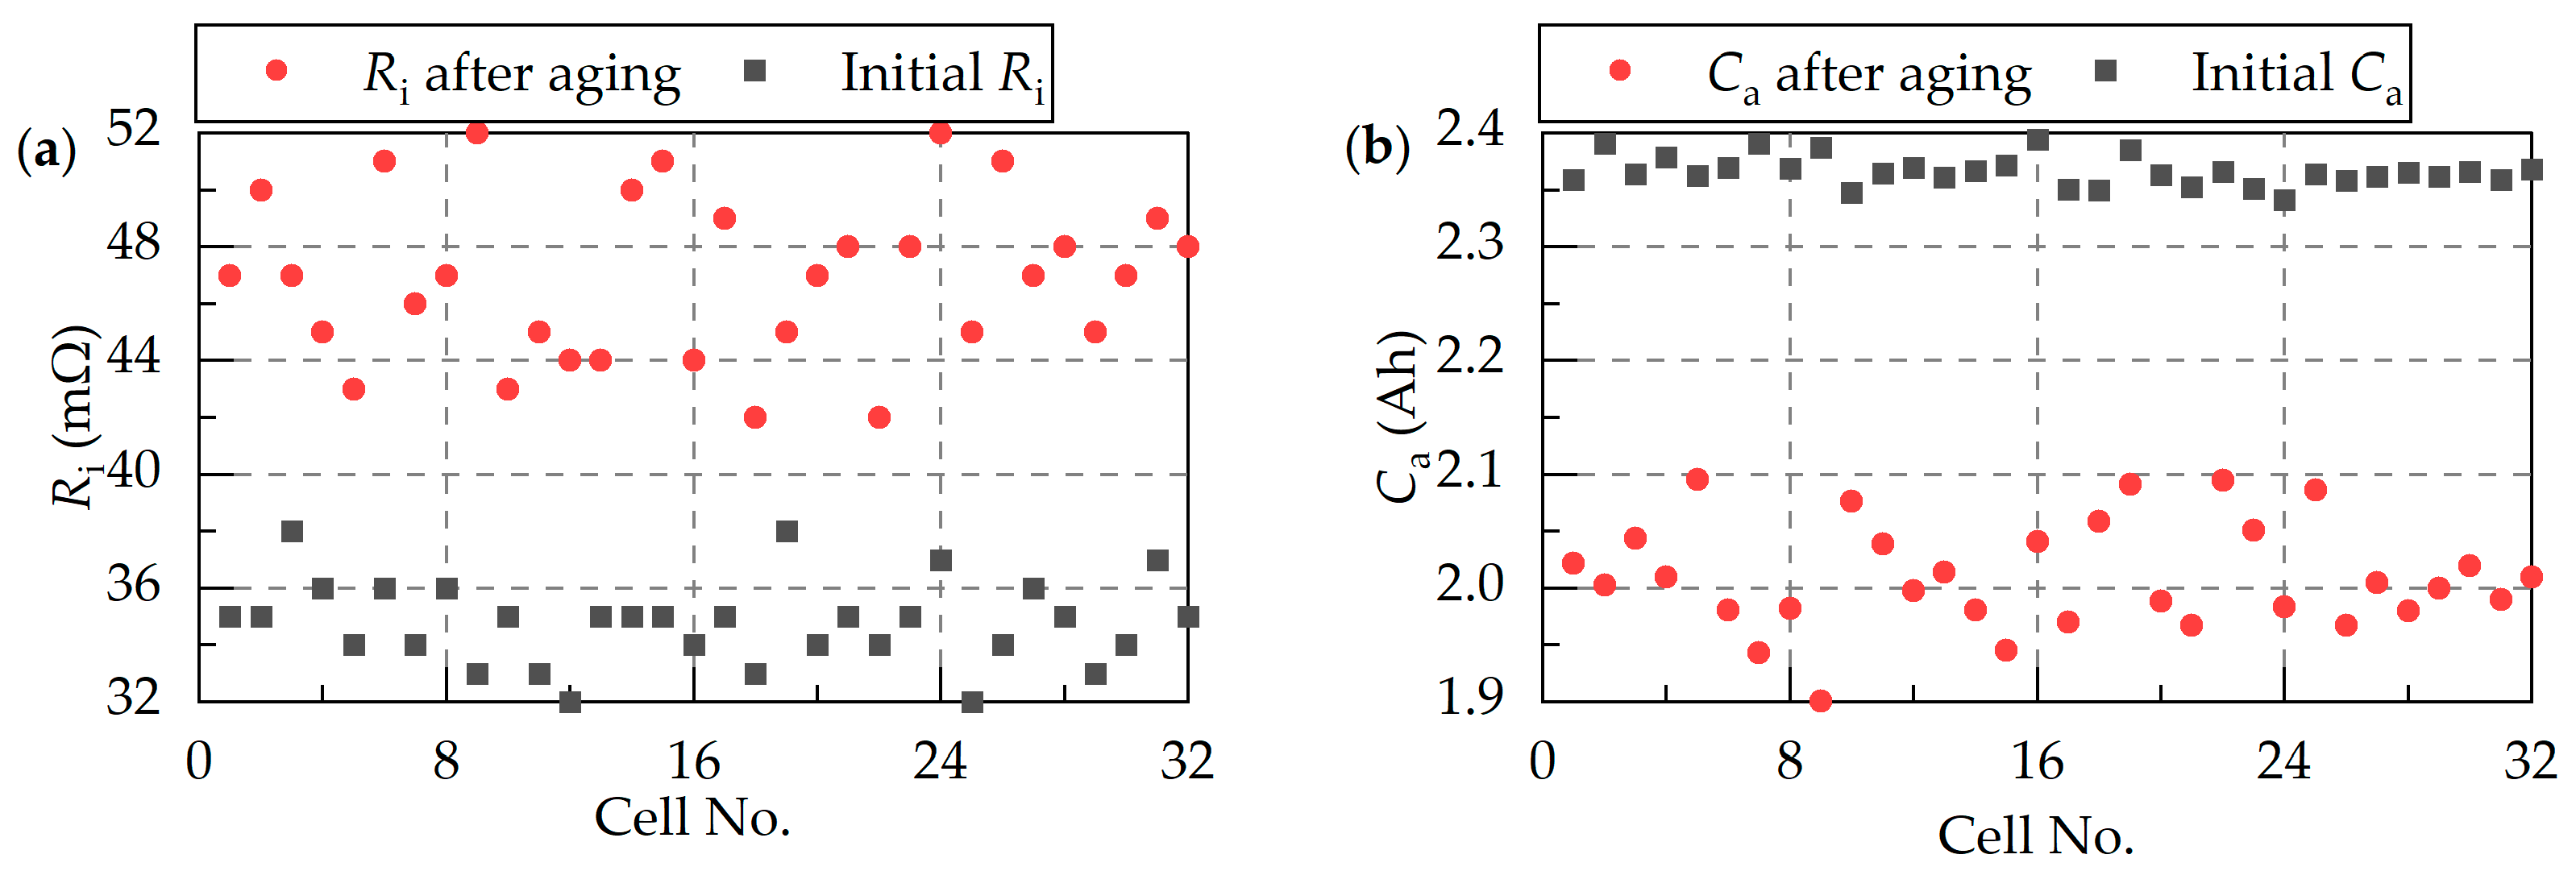
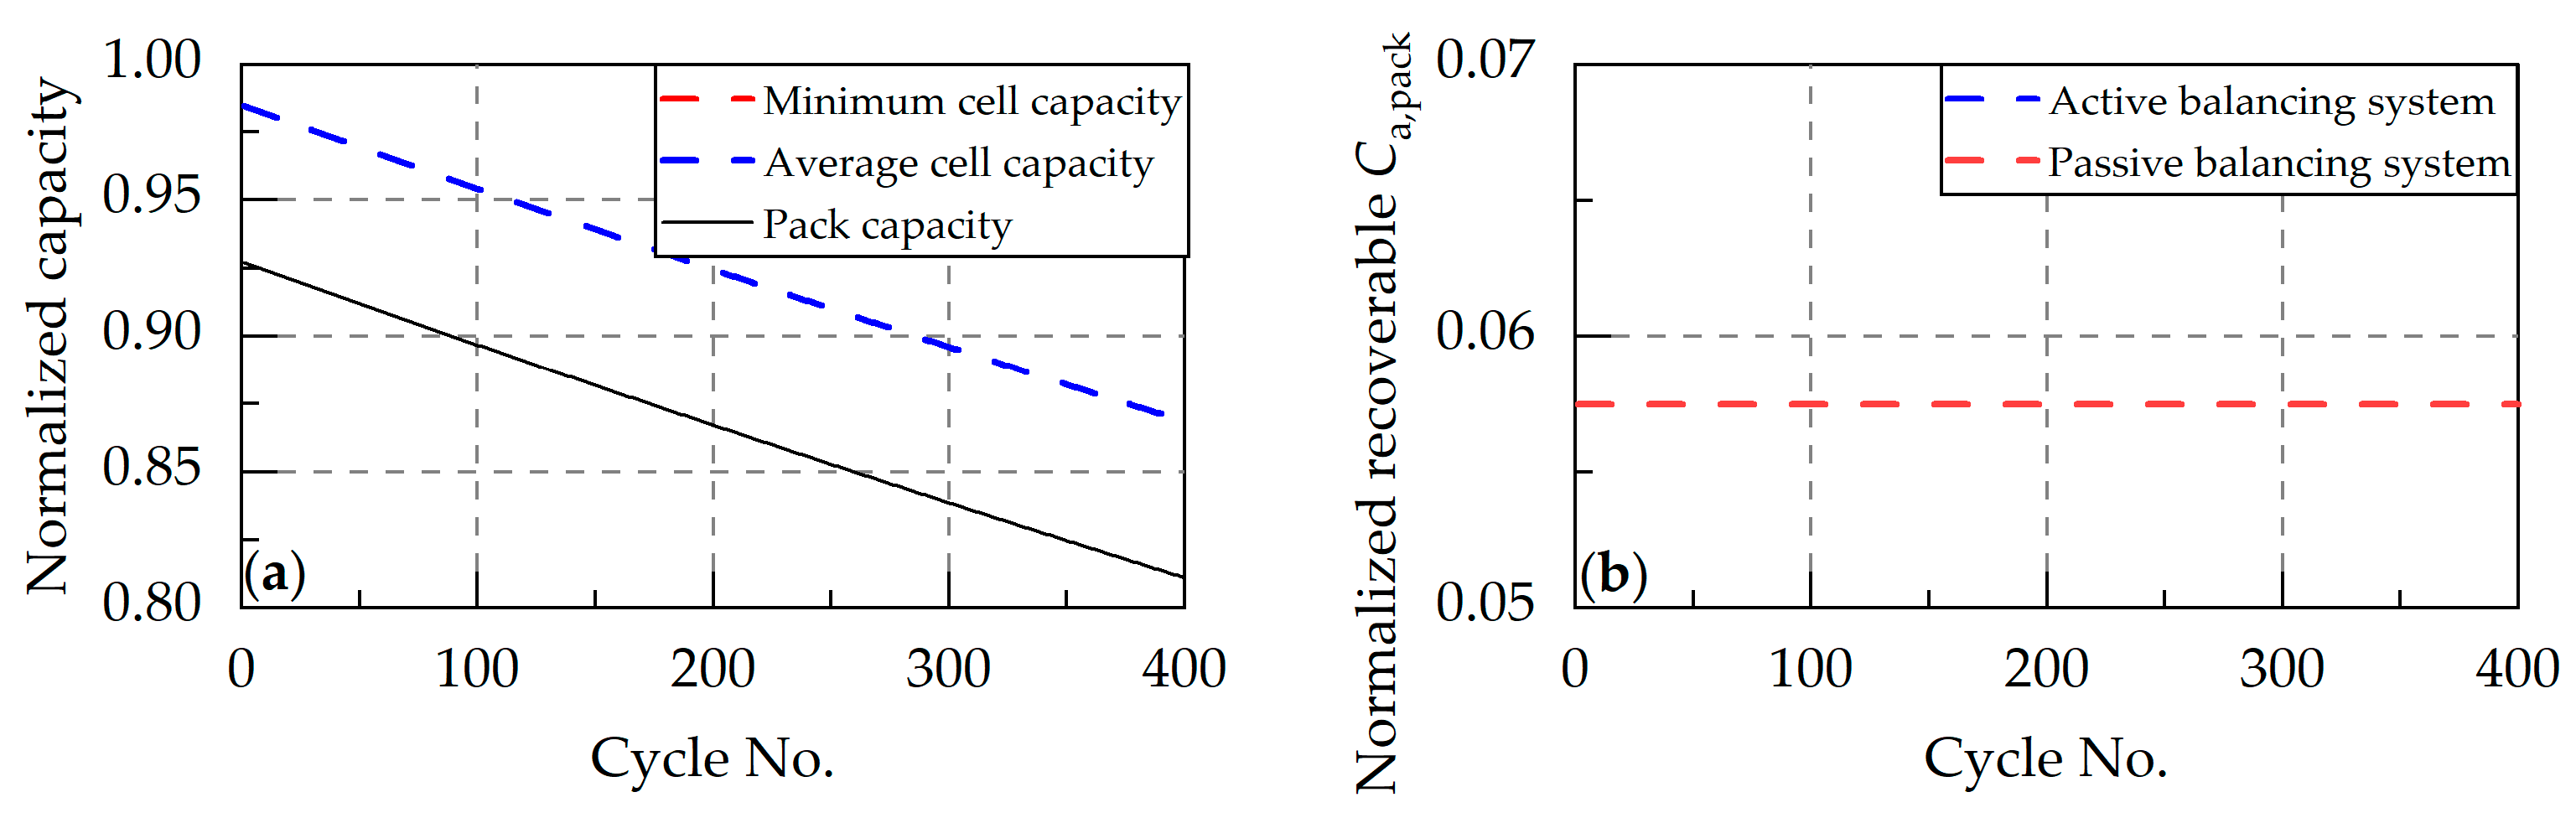
  • Resistance inconsistency. Resistance inconsistencies originate from inconsistent initial resistances and resistance growth rates. Large resistance differences can induce thermal differences, indirectly affecting CE and capacity fade rates. However, in packs with optimized thermal management systems, such effects remain negligible. Simulations confirm that resistance inconsistencies do not greatly affect the capacity of series-connected battery packs. However, like parallel-connected packs, they can limit the available power and overall performance. Notably, series-connected packs demand stricter consistency in capacity and charge during pre-assembly screening, with resistance uniformity being comparatively less critical.
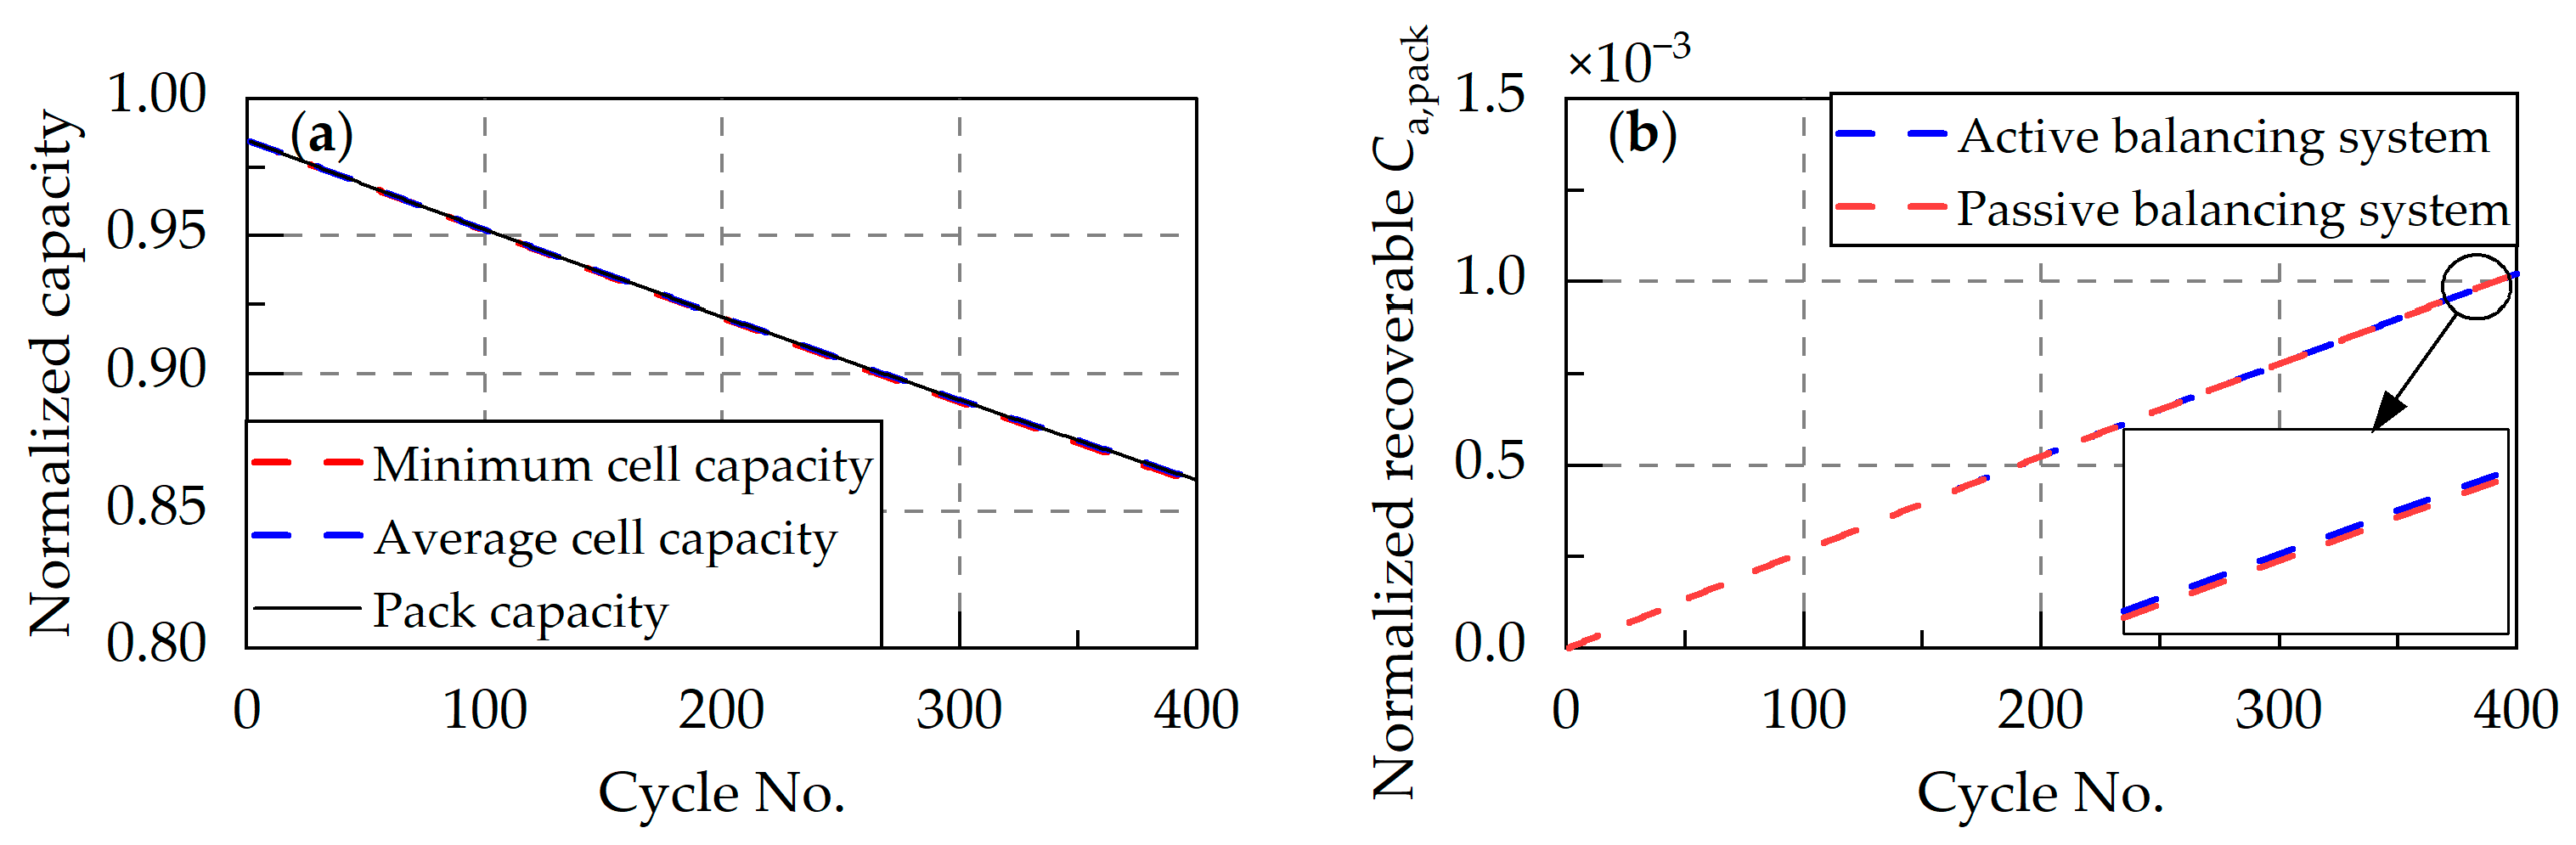
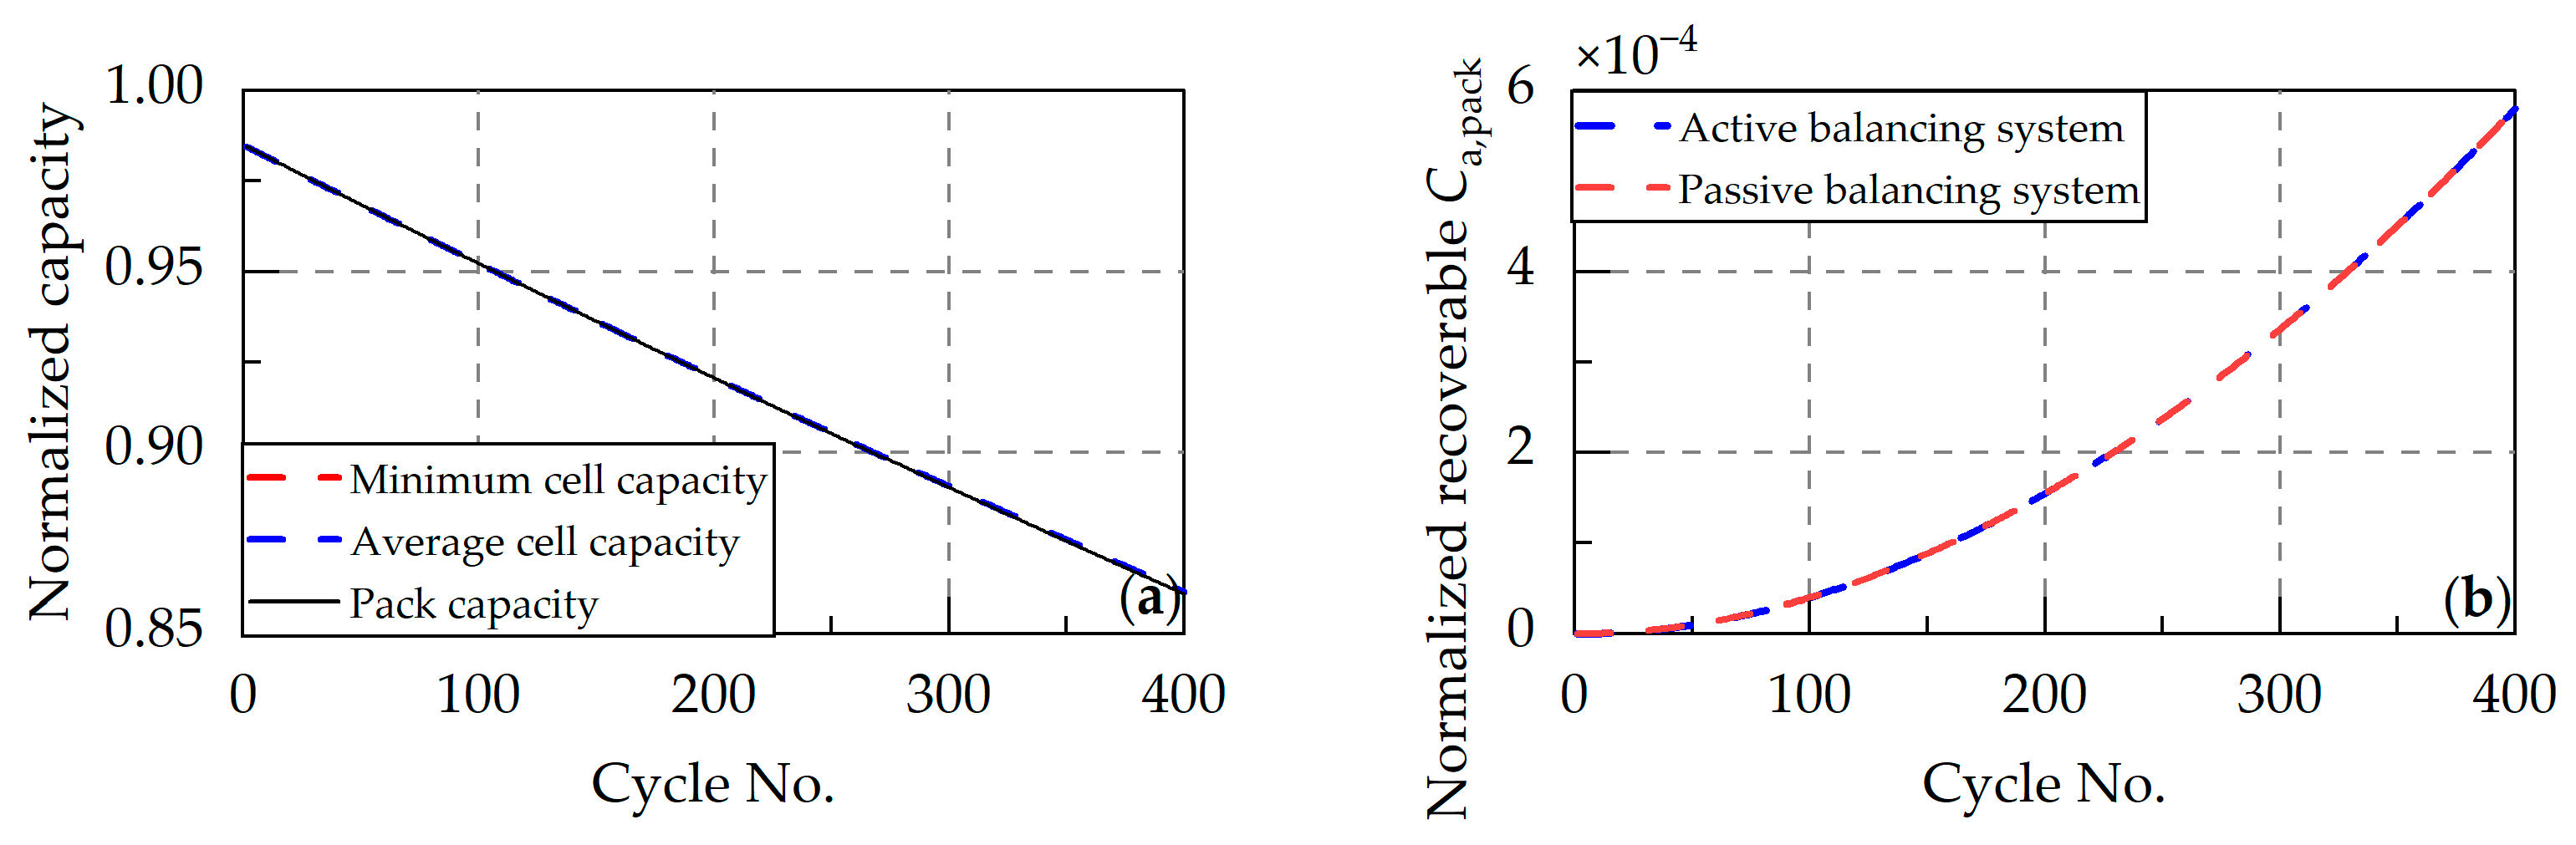
  • Charge inconsistency. Initial SOC and CE variations jointly determine charge inconsistency. Initial SOC-induced charge inconsistencies remain constant during cycling, while CE-induced charge differences accumulate with aging. Initial SOC variations can be eliminated early in the pack’s life through balancing systems, so their impact is transient. In contrast, CE-induced charge differences are persistent, requiring continuous balancing throughout the pack’s life. Simulation experiments show that charge inconsistencies are the main cause of pack capacity fading, while in the case of only inconsistent charge, there is almost no difference in the pack capacity loss that can be restored through passive or active balancing systems. To reduce balancing loads, pre-assembly screening should minimize initial SOC variations, coupled with manufacturing process improvements to reduce CE inconsistencies. Notably, the above simulation is for battery packs with uniform heat dissipation. Long-term aging may amplify thermal inconsistencies, which can further indirectly cause charge differences due to temperature-dependent CE. While balancing systems can address resultant pack capacity losses, an effective thermal management system remains essential throughout the battery’s lifecycle, significantly reducing the operational burden on balancing circuits.
Given that passive balancing currents are typically limited, further discussion is required to assess their applicability in packs with large charge inconsistencies. In automotive battery packs, the standard deviation of initial SOC is generally below 0.005, while the CE standard deviation is less than 3 × 10⁻⁵. Considering extreme cases, this section sets initial SOC and CE standard deviations to 0.01 and 5 × 10⁻⁵, respectively. Furthermore, the cell with the lower initial SOC also has the lower CE. Initial SOCs and efficiency variation coefficients are randomly generated and sorted in ascending order, as detailed in Table 10. Other parameters are set to expected values based on Table 2.
Figure 19a presents simulation results without passive balancing. It indicates that the capacity of the battery pack declines rapidly. After approximately 350 aging cycles, the capacity of the battery pack is less than 80% of the rated value. Initial SOC inconsistencies account for a 3.8% capacity loss, while CE differences lead to increasing charge inconsistencies, contributing an additional 9.1% recoverable capacity loss after 400 cycles.
For comparison, the simulation is repeated with passive balancing enabled. The passive balancing current is set to 0.001 C. This indicates that for automotive battery packs with capacities of 100–200 Ah, the balancing current does not exceed 200 mA, consistent with practical implementations [33]. As shown in Figure 19b, capacity losses caused by charge inconsistencies are fully eliminated within approximately 15 cycles. Then, the pack capacity remains equal to the theoretical maximum capacity. These findings confirm that even with severe charge inconsistencies, a 0.001 C passive balancing current remains fully sufficient.
In summary, passive balancing systems cannot recover pack capacity losses caused by capacity inconsistencies. Therefore, active balancing systems are superior for scenarios with significant differences in initial capacities or capacity fade rates, or where fast balancing is required, such as second-life applications or large-scale battery maintenance operations. However, for pre-screened packs exhibiting minimal capacity inconsistencies, passive balancing systems achieve equivalent recoverable pack capacity as active balancing systems. Crucially, the passive balancing remains effective even when initial SOC and CE standard deviations reach 0.01 and 5 × 10⁻⁵, respectively. Given their simple structure and low cost, passive balancing systems are the optimal solution in such scenarios.

6. Conclusions

This study investigates battery pack inconsistencies under multi-parameter coupling conditions. Characterization and aging experiments are conducted on 32 NMC batteries at 25 °C to extract cell parameters and degradation trajectories. The data from these experiments are used to develop simulation models for both cells and packs. A controlled single-variable approach is used to conduct the decoupled analysis of the impacts of multi-parameter inconsistencies on battery packs. The capacity degradations of series-connected and parallel-connected battery packs are systematically investigated under varying conditions, including inconsistent capacity, internal resistance, charge, and aging rates. Detailed discussions on the applicability of active and passive balancing systems are conducted based on simulation results. Key conclusions are summarized below.
  • Parallel-connected packs can avoid the need for external balancing systems due to self-balancing mechanisms. However, excessive internal resistance inconsistencies may cause individual cells to experience current rates that exceed the pack averages, which accelerates aging and poses safety risks.
  • In series-connected packs, inconsistencies in capacity and charge accelerate degradation, with charge inconsistency caused by different CE and initial SOC being the primary factor. Capacity inconsistency can only be addressed through active balancing systems, while both active and passive balancing systems are effective for packs with charge inconsistencies. Although internal resistance inconsistencies have a relatively minor impact on the capacity of series-connected packs, they do constrain power performance.
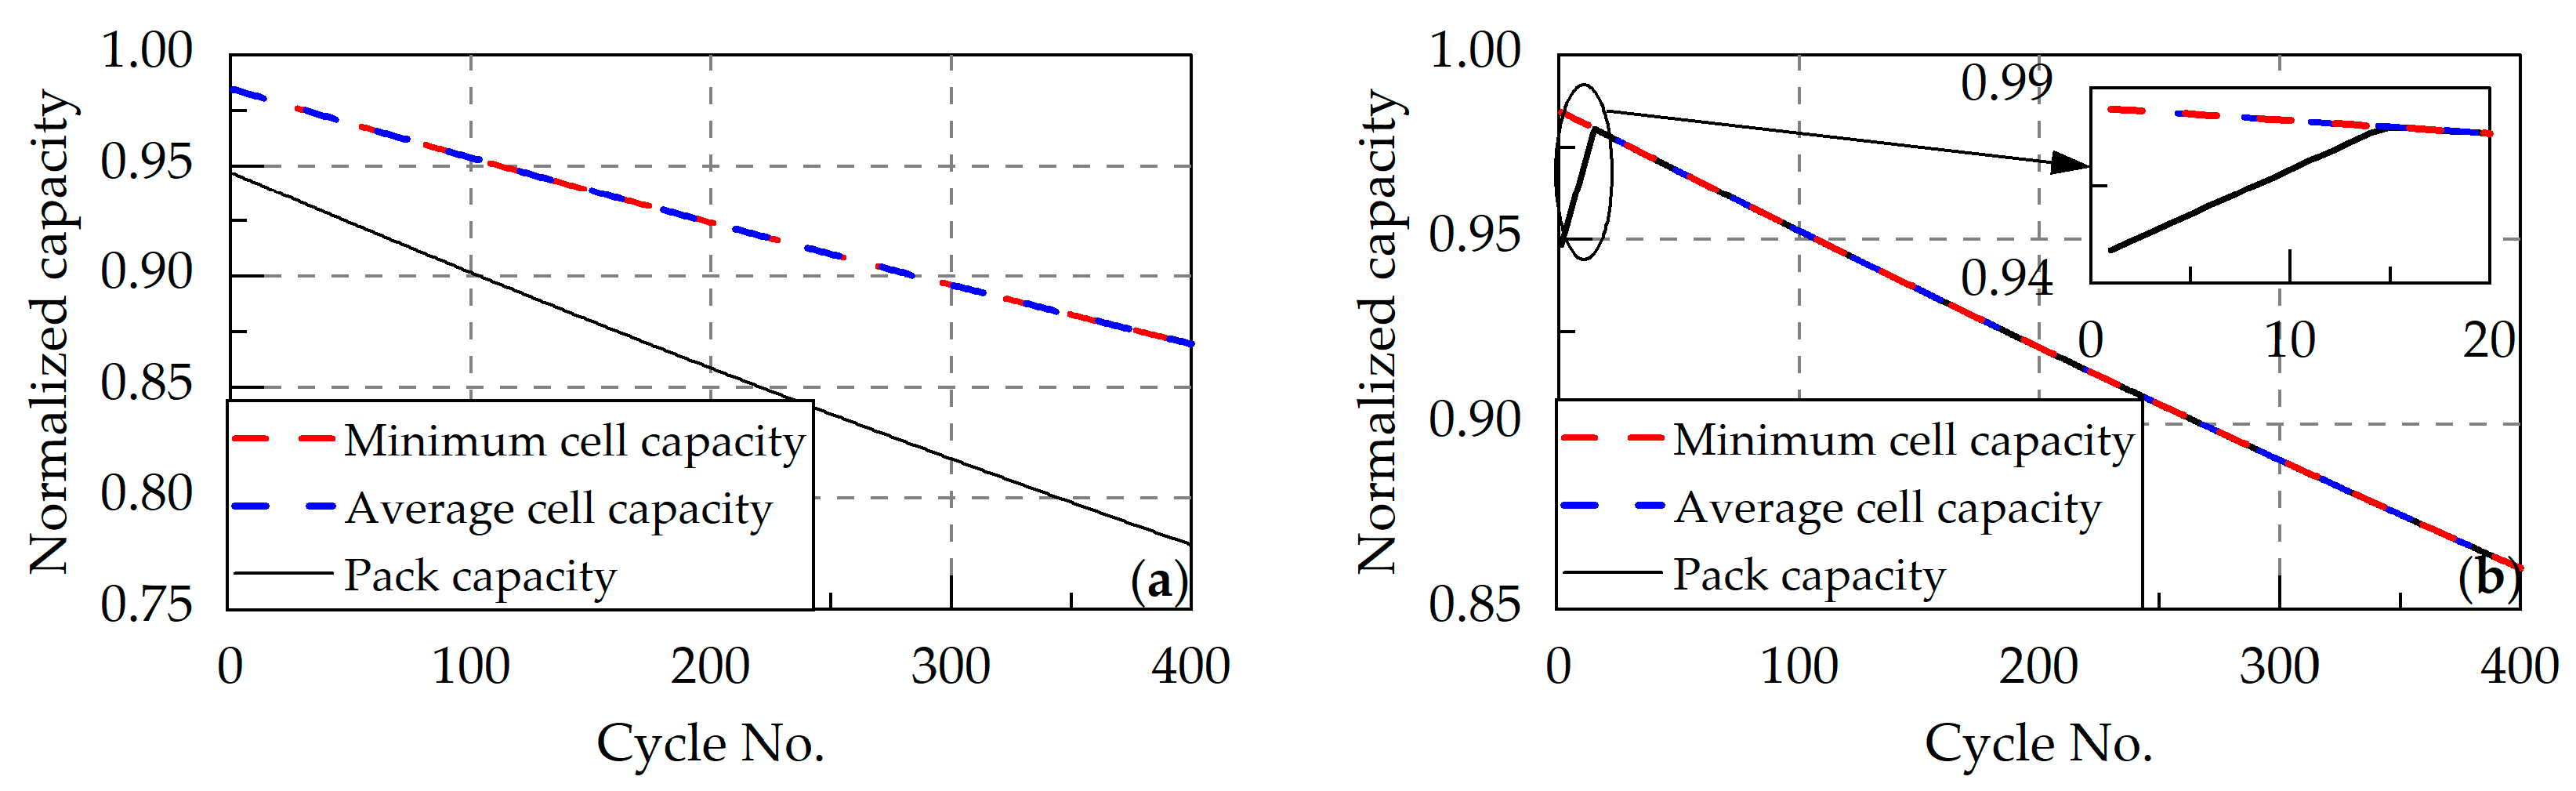
  • For packs with well-controlled capacity and thermal uniformity, a passive balancing current of 0.001 C can eliminate up to 3.8% capacity loss within 15 cycles. Therefore, pre-assembly capacity screening and thermal management during operation are critical. Under these conditions, passive balancing systems can significantly reduce complexity and costs.
Future advancements in rapid pack assembly screening technologies and more efficient balancing strategies will enhance pack lifespan and operational safety. Furthermore, constructing more precise system-level thermal models will assist in the prediction of consistency evolution and enable early-stage diagnostics for cells exhibiting consistency deterioration.

Author Contributions

Conceptualization, Y.D. and J.L.; Methodology, Q.Z., J.L. and Y.D.; Software, Investigation, and Validation, Y.D. and W.Y.; Writing—Original Draft, Y.D. and W.Y.; Reviewing and Editing, Q.Z., J.W., J.L. and Y.D. All authors have read and agreed to the published version of the manuscript.

Funding

This research was funded by National Natural Science Foundation of China, Grant 52407246.

Data Availability Statement

The original contributions presented in this study are included in the article. Further inquiries can be directed to the corresponding author.

Conflicts of Interest

The authors declare no conflicts of interest.

References

  1. Ashok, B.; Kannan, C.; Mason, B.; Ashok, S.D.; Indragandhi, V.; Patel, D.; Wagh, A.S.; Jain, A.; Kavitha, C. Towards Safer and Smarter Design for Lithium-Ion-Battery-Powered Electric Vehicles: A Comprehensive Review on Control Strategy Architecture of Battery Management System. Energies 2022, 15, 4227. [Google Scholar] [CrossRef]
  2. Wang, Y.; Zhao, Y.; Zhou, S.; Yan, Q.; Zhan, H.; Cheng, Y.; Yin, W. Impact of Individual Cell Parameter Difference on the Performance of Series–Parallel Battery Packs. ACS Omega 2023, 8, 10512–10524. [Google Scholar] [CrossRef] [PubMed]
  3. Tian, J.; Fan, Y.; Pan, T.; Zhang, X.; Yin, J.; Zhang, Q. A Critical Review on Inconsistency Mechanism, Evaluation Methods and Improvement Measures for Lithium-Ion Battery Energy Storage Systems. Renew. Sustain. Energy Rev. 2024, 189, 113978. [Google Scholar] [CrossRef]
  4. Dhanaselvam, J.; Rukkumani, V.; Saravanakumar, K.; Rajesh, R. A Critical Review on Key Issues of Performance Degradation Factors for Lithium-Ion Batteries. IOP Conf. Ser. Earth Environ. Sci. 2024, 1375, 012021. [Google Scholar] [CrossRef]
  5. Kumar, N.; Ramakrishnan, S.M.; Panchapakesan, K.; Subramaniam, D.; Masters, I.; Dowson, M.; Das, A. In-Depth Evaluation of Micro-Resistance Spot Welding for Connecting Tab to 18,650 Li-Ion Cells for Electric Vehicle Battery Application. Int. J. Adv. Manuf. Technol. 2022, 121, 6581–6597. [Google Scholar] [CrossRef]
  6. Ghaeminezhad, N.; Wang, Z.; Ouyang, Q. A Review on Lithium-Ion Battery Thermal Management System Techniques: A Control-Oriented Analysis. Appl. Therm. Eng. 2023, 219, 119497. [Google Scholar] [CrossRef]
  7. Yu, H.; Wang, L.; Zhang, Z.; Li, Y.; Yang, S.; He, X. Insight Understanding of External Pressure on Lithium Plating in Commercial Lithium-Ion Batteries. Adv. Funct. Mater. 2024, 34, 2406966. [Google Scholar] [CrossRef]
  8. Roy, P.K.; Shahjalal, M.; Shams, T.; Fly, A.; Stoyanov, S.; Ahsan, M.; Haider, J. A Critical Review on Battery Aging and State Estimation Technologies of Lithium-Ion Batteries: Prospects and Issues. Electronics 2023, 12, 4105. [Google Scholar] [CrossRef]
  9. Schomburg, F.; Heidrich, B.; Wennemar, S.; Drees, R.; Roth, T.; Kurrat, M.; Heimes, H.; Jossen, A.; Winter, M.; Cheong, J.Y.; et al. Lithium-Ion Battery Cell Formation: Status and Future Directions towards a Knowledge-Based Process Design. Energy Environ. Sci. 2024, 17, 2686–2733. [Google Scholar] [CrossRef]
  10. Uzair, M.; Abbas, G.; Hosain, S. Characteristics of Battery Management Systems of Electric Vehicles with Consideration of the Active and Passive Cell Balancing Process. World Electr. Veh. J. 2021, 12, 120. [Google Scholar] [CrossRef]
  11. Mohammadi, F. Lithium-Ion Battery State-of-Charge Estimation Based on an Improved Coulomb-Counting Algorithm and Uncertainty Evaluation. J. Energy Storage 2022, 48, 104061. [Google Scholar] [CrossRef]
  12. Simolka, M.; Heger, J.-F.; Traub, N.; Kaess, H.; Friedrich, K.A. Influence of Cycling Profile, Depth of Discharge and Temperature on Commercial LFP/C Cell Ageing: Cell Level Analysis with ICA, DVA and OCV Measurements. J. Electrochem. Soc. 2020, 167, 110502. [Google Scholar] [CrossRef]
  13. Spitthoff, L.; Shearing, P.R.; Burheim, O.S. Temperature, Ageing and Thermal Management of Lithium-Ion Batteries. Energies 2021, 14, 1248. [Google Scholar] [CrossRef]
  14. Lipu, M.S.H.; Hannan, M.A.; Karim, T.F.; Hussain, A.; Hussain, A.; Saad, M.H.M.; Ayob, A.; Miah, M.S.; Miah, M.S.; Miah, M.S.; et al. Intelligent Algorithms and Control Strategies for Battery Management System in Electric Vehicles: Progress, Challenges and Future Outlook. J. Clean. Prod. 2021, 292, 126044. [Google Scholar] [CrossRef]
  15. Tan, C.M.; Yang, Y.; Kumar, K.J.M.; Mishra, D.D.; Liu, T.-Y. Addressing Practical Challenges of LiB Cells in Their Pack Applications. Sci. Rep. 2024, 14, 10126. [Google Scholar] [CrossRef]
  16. Xia, B.; Yang, Y.; Zhou, J.; Chen, G.; Liu, Y.; Wang, H.; Wang, M.; Lai, Y. Using Self Organizing Maps to Achieve Lithium-Ion Battery Cells Multi-Parameter Sorting Based on Principle Components Analysis. Energies 2019, 12, 2980. [Google Scholar] [CrossRef]
  17. Feng, X.-H.; Li, Z.-Z.; Gu, F.-S.; Zhang, M.-L. Structural Design and Optimization of Air-Cooled Thermal Management System for Lithium-Ion Batteries Based on Discrete and Continuous Variables. J. Energy Storage 2024, 86, 111202. [Google Scholar] [CrossRef]
  18. Zhang, H.; Zhang, Y.; Huang, L.; Song, J.; Huang, Z. Study on the Influence of Connection Structure between Batteries on Battery Pack Performance. Electronics 2024, 13, 817. [Google Scholar] [CrossRef]
  19. Ashraf, A.; Ali, B.; Alsunjury, M.S.A.; Goren, H.; Kilicoglu, H.; Hardan, F.; Tricoli, P. Review of Cell-Balancing Schemes for Electric Vehicle Battery Management Systems. Energies 2024, 17, 1271. [Google Scholar] [CrossRef]
  20. Xie, J.; Lin, H.; Qu, J.; Shi, L.; Chen, Z.; Chen, S.; Zheng, Y. Hierarchical Structure-Based Wireless Active Balancing System for Power Batteries. Energies 2024, 17, 4602. [Google Scholar] [CrossRef]
  21. Sun, W.; Li, Y.; Liu, L.; Mai, R. A Switched-capacitor Battery Equalization Method for Improving Balancing Speed. IET Electr. Power Appl. 2021, 15, 555–569. [Google Scholar] [CrossRef]
  22. Abareshi, M.; Hamzeh, M.; Farhangi, S.; Alavi, S.M.M. Robust Control of a Forward-converter Active Battery Cell Balancing. IET Power Electron. 2023, 16, 1271–1280. [Google Scholar] [CrossRef]
  23. Duraisamy, T.; Kaliyaperumal, D. Adaptive Passive Balancing in Battery Management System for E-mobility. Int. J. Energy Res. 2021, 45, 10752–10764. [Google Scholar] [CrossRef]
  24. Hemavathi, S. Overview of Cell Balancing Methods for Li-ion Battery Technology. Energy Storage 2021, 3, e203. [Google Scholar] [CrossRef]
  25. Xia, Q.; Yang, D.; Wang, Z.; Ren, Y.; Sun, B.; Feng, Q.; Qian, C. Multiphysical Modeling for Life Analysis of Lithium-Ion Battery Pack in Electric Vehicles. Renew. Sustain. Energy Rev. 2020, 131, 109993. [Google Scholar] [CrossRef]
  26. Wang, Y.; Tian, J.; Sun, Z.; Wang, L.; Xu, R.; Li, M.; Chen, Z.; Chen, Z.; Chen, Z.; Chen, Z. A Comprehensive Review of Battery Modeling and State Estimation Approaches for Advanced Battery Management Systems. Renew. Sustain. Energy Rev. 2020, 131, 110015. [Google Scholar] [CrossRef]
  27. Zhou, W.; Zheng, Y.; Pan, Z.; Lu, Q. Review on the Battery Model and SOC Estimation Method. Processes 2021, 9, 1685. [Google Scholar] [CrossRef]
  28. Lai, X.; Zhou, L.; Zhu, Z.; Zheng, Y.; Sun, T.; Shen, K. Experimental Investigation on the Characteristics of Coulombic Efficiency of Lithium-Ion Batteries Considering Different Influencing Factors. Energy 2023, 274, 127408. [Google Scholar] [CrossRef]
  29. Zhang, Z.; Cheng, X.; Lu, Z.-Y.; Gu, D.-J. SOC Estimation of Lithium-Ion Battery Pack Considering Balancing Current. IEEE Trans. Power Electron. 2018, 33, 2216–2226. [Google Scholar] [CrossRef]
  30. Hu, L.; Hu, X.S.; Che, Y.H.; Feng, F.; Lin, X.K.; Zhang, Z.Y. Reliable State of Charge Estimation of Battery Packs Using Fuzzy Adaptive Federated Filtering. Appl. Energy 2020, 262, 15. [Google Scholar] [CrossRef]
  31. Song, Z.; Yang, X.-G.; Yang, N.; Delgado, F.P.; Hofmann, H.; Sun, J. A Study of Cell-to-Cell Variation of Capacity in Parallel-Connected Lithium-Ion Battery Cells. eTransportation 2021, 7, 100091. [Google Scholar] [CrossRef]
  32. Gong, X.; Xiong, R.; Mi, C.C. Study of the Characteristics of Battery Packs in Electric Vehicles With Parallel-Connected Lithium-Ion Battery Cells. IEEE Trans. Ind. Appl. 2015, 51, 1872–1879. [Google Scholar] [CrossRef]
  33. Lv, J.; Song, W.; Feng, Z.; Li, Y.; Ding, Y. Performance and Comparison of Equalization Methods for Lithium Ion Batteries in Series. Int. J. Energy Res. 2021, 45, 4669–4680. [Google Scholar] [CrossRef]
Figure 1. Influencing factors of inconsistency and their relationships.
Energies 18 03439 g001
Figure 2. Experimental procedure.
Energies 18 03439 g002
Figure 3. Rint model.
Energies 18 03439 g003
Figure 4. Distributions of internal resistance and capacity across 32 cells. (a) Initial internal resistance and internal resistance after aging. (b) Initial capacity and capacity after aging.
Energies 18 03439 g004
Figure 5. Internal resistance growth trajectories and capacity fade trajectories of 32 cells over 400 aging cycles. (a) Internal resistance growth trajectories. (b) Capacity fade trajectories.
Energies 18 03439 g005
Figure 6. Overall flowchart for constructing the battery pack model.
Energies 18 03439 g006
Figure 8. Simulation of the single charging cycle of battery packs with inconsistent initial capacities. (a) Absolute values of branch currents. (b) Range of branch currents. (c) Ranges of OCVs and SOCs. (d) Charge throughput differences in cells.
Energies 18 03439 g008
Figure 9. Simulation of the single discharging cycle of battery packs with inconsistent initial capacities. (a) Absolute values of branch currents. (b) Range of branch currents. (c) Ranges of OCVs and SOCs. (d) Charge throughput differences in cells.
Energies 18 03439 g009
Figure 10. Simulation of the single discharging cycle of battery packs with inconsistent initial internal resistances. (a) Absolute values of branch currents. (b) Range of branch currents. (c) Ranges of OCVs and SOCs. (d) Charge throughput differences in cells.
Energies 18 03439 g010
Figure 11. Simulation of the single charging cycle of battery packs with inconsistent CE. (a) Absolute values of branch currents. (b) Range of branch currents. (c) Ranges of OCVs and SOCs. (d) Charge throughput differences in cells.
Energies 18 03439 g011
Figure 12. Aging trajectories of the parallel-connected battery pack and cells with inconsistent CE.
Energies 18 03439 g012
Figure 13. Simulation of series-connected packs with inconsistent initial capacities. (a) Fade trajectories of average cell capacity, minimum cell capacity, and pack capacity. (b) Theoretical recoverable capacity losses by active or passive systems.
Energies 18 03439 g013
Figure 14. Simulation of series-connected packs with inconsistent initial internal resistances. (a) Fade trajectories of average cell capacity, minimum cell capacity, and pack capacity. (b) Theoretical recoverable capacity losses by active or passive systems.
Energies 18 03439 g014
Figure 15. Simulation of series-connected packs with inconsistent initial SOCs. (a) Fade trajectories of average cell capacity, minimum cell capacity, and pack capacity. (b) Theoretical recoverable capacity losses by active or passive systems.
Energies 18 03439 g015
Figure 16. Simulation of series-connected packs with inconsistent CE. (a) Fade trajectories of average cell capacity, minimum cell capacity, and pack capacity. (b) Theoretical recoverable capacity losses by active or passive systems.
Energies 18 03439 g016
Figure 17. Simulation of series-connected packs with inconsistent capacity fade rates. (a) Fade trajectories of average cell capacity, minimum cell capacity, and pack capacity. (b) Theoretical recoverable capacity losses by active or passive systems.
Energies 18 03439 g017
Figure 18. Simulation of series-connected packs with inconsistent resistance growth rates. (a) Fade trajectories of average cell capacity, minimum cell capacity, and pack capacity. (b) Theoretical recoverable capacity losses by active or passive systems.
Energies 18 03439 g018
Figure 19. Simulation of series-connected battery packs with inconsistent initial SOC and CE. (a) Simulation results without passive balancing. (b) Simulation results with passive balancing.
Energies 18 03439 g019
Table 1. Specifications of NMC batteries.
ParameterValue
SizeØ18 × 65 mm
Normal capacity2.4 Ah
Cut-off voltages3.0–4.2 V
Max discharge rate4 C (0~40 °C)
Normal charge rate0.5 C at 25 °C
Operating temperature−20–60 °C for discharge and 10–45 °C for charge
Mass48 g
Table 2. Battery simulation parameter configuration.
Parametersz0Ca,0Ri,0KηCa,400Ri,400
Expectation0.52.363 Ah34.78 mΩ0.98842.026 Ah47.04 mΩ
Standard deviation0.010.03 Ah1.53 mΩ5 × 10−50.06 Ah3.13 mΩ
Table 3. Initial capacities of cells.
No.123456789101112
Ca,0 (Ah)2.342.332.332.352.302.392.382.362.362.342.392.36
Table 4. Initial internal resistances of cells.
No.123456789101112
Ri,0 (mΩ)35.536.435.934.335.233.636.133.033.133.530.337.0
Table 5. Efficiency variation coefficients of cells.
No.123456789101112
Kη (10−1)9.839.899.919.949.969.899.819.859.8310.009.859.92
Table 6. Initial SOCs of cells.
No.123456789101112
SOC0 (%)50.551.847.750.950.348.749.650.353.652.848.753.0
Table 7. Efficiency variation coefficients of cells.
No.123456789101112
Kη (10−1)9.88349.88449.88419.88399.88409.88319.88399.88479.88399.88399.88359.8839
Table 8. Capacity fade rates of cells.
No.123456789101112
kC (−10−4 Ah)8.478.538.077.026.208.028.407.858.3510.06.877.87
Table 9. Resistance growth rates of cells.
No.123456789101112
kR (10−2 mΩ)2.862.654.163.232.294.384.232.242.222.903.213.73
Table 10. Initial SOCs and efficiency variation coefficients of the simulated cells.
No.123456789101112
SOC0 (%)47.948.048.949.249.850.150.550.751.051.451.451.7
Kη (10−1)9.88319.88349.88359.88399.88399.88399.88399.88399.88409.88419.88449.8847
Disclaimer/Publisher’s Note: The statements, opinions and data contained in all publications are solely those of the individual author(s) and contributor(s) and not of MDPI and/or the editor(s). MDPI and/or the editor(s) disclaim responsibility for any injury to people or property resulting from any ideas, methods, instructions or products referred to in the content.

