Article

Selective Lithium Plating on Graphite–Silicon Composite Anodes During Fast Charging in Rechargeable Lithium Batteries

School of Materials Science and Engineering, Pusan National University, Busandaehak-Ro 63 Beon-Gil, Geumjeong-gu, Busan 46241, Republic of Korea
*
Author to whom correspondence should be addressed.
Energies 2025, 18(13), 3423; https://doi.org/10.3390/en18133423
Submission received: 30 May 2025 / Revised: 23 June 2025 / Accepted: 27 June 2025 / Published: 29 June 2025
(This article belongs to the Special Issue Advanced Electrochemical Energy Storage Materials)

Abstract

In this study, we systematically analyzed selective lithium plating on graphite (Gr)–silicon (Si) composite anodes for lithium-ion batteries during fast charging, using electrochemical techniques. To achieve this, half-cells were first constructed with single Gr and Si electrodes, and lithium plating on each electrode was examined at different charging rates. It was observed that lithium plating on both electrodes began at a lower state of charge (SoC) as the charge rate increased. Furthermore, at a given charge rate, lithium plating occurred on the Si electrode at a lower SoC than on the Gr electrode. Based on the experimental findings, the lithium plating behavior of Gr and Si as a function of the charge rate was formulated to investigate the plating behavior of hypothetical composite electrodes with varying Gr–Si ratios. The lithium plating behavior observed on the actual composite electrode was consistent with that predicted from the hypothetical composite electrode, which was simulated using the same Gr–Si ratio based on the behaviors of the individual electrodes. By comparing the results from the single and composite electrodes, it is proposed that lithium plating occurs first on Si and then on Gr at low charge rates, whereas, at high charge rates, it proceeds first on Gr and then on Si. We discuss how to extrapolate the preferential plating signals—namely, plating onto Si at low charge rates and onto Gr at high charge rates—that are not directly evident in the signal from the actual composite electrode.

1. Introduction

Due to climate change and environmental pollution, the demand for eco-friendly transportation solutions (e.g., electric vehicles) and energy storage systems (ESSs) linked to renewable energy sources has significantly increased [1,2,3]. Lithium-ion batteries (LIBs) are currently the most widely used energy storage systems, thanks to their high energy and power densities. With the onset of the fourth industrial revolution, which emphasizes hyper-intelligence, hyper-connectivity, and hyper-convergence, there is an ongoing effort to continuously enhance the performance of energy devices, including LIBs [4,5,6,7]. In particular, the cathode and anode active materials, which have the greatest impact on LIB performance, remain the primary focus of ongoing research and development [8,9]. From an anode perspective, silicon (Si), with a theoretical capacity nearly ten times higher than that of graphite (Gr), has emerged as a promising candidate [10,11,12]. However, previous studies have shown that Si electrodes suffer from significant capacity fading due to the detachment of the active material (Si) caused by large volume changes (>300%) during alloying and dealloying, as well as poor high-rate performance resulting from their low electronic conductivity and sluggish solid-state lithium diffusion [13,14,15].
To address the limitations of Si anodes, several strategies have been explored. These include nanostructuring approaches—such as Si nanowires [16,17,18], nanotubes [19], and porous [20,21] and hollow nanostructures [22,23]—to mitigate volume expansion; surface coatings with carbon [24,25], silver [26], or copper [27] to enhance the electronic conductivity; and techniques to improve solid-state lithium diffusion, such as thin-film electrodes [28], aligned Si architectures [29], and oxygen doping [30]. However, despite these efforts, pure Si has not yet been successfully implemented as a practical anode material for LIBs. From a practical standpoint, efforts to enhance the capacity of pure Gr electrodes by incorporating small amounts of Si into Gr–Si composite electrodes have already been implemented by several battery manufacturers. This approach has been recognized as an effective strategy for achieving high-capacity anodes [31,32,33,34]. In addition to the capacity improvement, the porous composite based on Gr helps to buffer the expansion and contraction of Si, maintaining the integrity of the electrode even during significant volume changes of Si [35,36,37,38].
Despite the advantages of Gr–Si composites, the intrinsic drawbacks of Si—namely, its low electrical conductivity and sluggish solid-state lithium diffusion—result in reduced rate performance compared to pure Gr electrodes [39,40]. To overcome these limitations, various strategies have been proposed, including coating Si thin films onto carbon nanotubes to shorten the electron and ion transport paths [41,42]; enhancing the surface conductivity of Si through different modifications [24,25,26,27,43]; minimizing the lithium diffusion distances using thin-film Gr–Si composite electrodes [28,44]; and promoting lithium diffusion by uniformly dispersing or structurally aligning Si within the composite matrix [29,30,45]. These approaches have significantly improved the high-rate discharge performance. However, in contrast to the substantial progress made in the discharge characteristics, studies on the high-rate charging behavior remain limited—despite its critical importance. While reducing the cell resistance and overpotential is essential during high-rate charging, and many discharge-optimized designs also contribute positively to charging, a unique challenge persists: lithium plating at the anode. This phenomenon demands special attention, as it poses a major obstacle to the practical implementation of fast-charging LIBs.
Under typical charging conditions at room temperature, the anode potential is generally maintained above 0 V vs. Li+/Li, which favors lithium insertion into Gr and minimizes the likelihood of lithium plating. However, under low-temperature conditions and/or high charging rates, increased overpotentials can drive the anode potential below 0 V vs. Li+/Li, leading to concurrent lithium insertion into Gr and lithium plating on its surface [46,47]. In contrast to the lithium insertion mechanism that governs the lithiation of Gr during charging, Si undergoes lithiation through an alloying reaction with lithium. As a result, when the anode potential drops below 0 V vs. Li+/Li during charging, lithium plating on the Si surface and lithium–Si alloying may occur simultaneously [48,49,50]. Beyond this fundamental difference in the lithiation mechanism, Gr and Si also exhibit a significant disparity in their lithium solid-state diffusion coefficients—ranging from 6.5 × 10⁻¹¹ to 1.12 × 10⁻¹⁰ cm2·s−1 for Gr [51] and from 1 × 10⁻¹³ to 1 × 10⁻¹² cm2·s−1 for Si [52]. Given these differences in both the lithiation mechanisms and lithium diffusion kinetics, the overpotentials experienced by Gr and Si during charging are expected to differ, leading to distinct lithium plating behaviors on their respective surfaces.
The most commonly employed approach in lithium plating studies is destructive analysis, which typically involves the post-mortem microscopic examination of lithium deposits [53,54,55] or the spectroscopic quantification of their thickness and amount [56,57,58]. While these methods provide direct evidence of metallic lithium, they are susceptible to surface contamination following battery disassembly and are inherently incapable of capturing the time-dependent dynamics of lithium plating. Non-destructive techniques can overcome many of these limitations. Representative non-destructive approaches include electrochemical methods [59,60,61,62], neutron diffraction [63,64,65], and spectroscopic analyses [66,67,68]. Neutron diffraction offers the reliable detection of light elements such as lithium and provides a high depth resolution within active materials. However, it requires expensive instrumentation, prolonged data acquisition due to the limited beam size, and specially designed cells. Spectroscopic techniques enable time-resolved surface analysis, but their practical use is limited by the need for complex cell configurations and costly equipment. In contrast, electrochemical methods analyze the intrinsic redox signals of the electrode and require no specialized equipment beyond a potentiostat, making them highly versatile and suitable for practical applications.
Electrochemical studies on lithium plating in Gr–Si composite electrodes have employed several approaches: (1) the analysis of the open-circuit voltage (OCV) immediately after charging [69]; (2) voltage and differential capacity (dQ/dV) curve analysis during charging [70,71]; and (3) distribution of relaxation times (DRT) analysis [72,73]. Study (1) investigated the effects of the Si content and temperature on the high-rate performance and the extent of lithium plating, showing increased lithium deposition with higher Si ratios. Study (2) examined capacity fade trends during cycling following lithium plating on the composite electrode. Study (3) analyzed how significant interfacial polarization in Si affects the lithium plating locations and the growth of the solid electrolyte interphase (SEI) layer. In recent studies, methods for detecting lithium plating have been developed using a combination of modeling and impedance spectroscopy [74,75,76,77]. Despite these contributions, prior studies have largely focused on the overall electrochemical response of the composite electrode, without differentiating the behaviors of Gr and Si individually [59], or have exclusively analyzed one of the two components [70]. As a result, they present inherent limitations in elucidating the distinct lithium plating characteristics of Gr and Si, thereby hindering a comprehensive understanding of the lithium plating mechanisms in Gr–Si composite systems.
In this work, we aimed to gain a deeper understanding of the lithium plating behavior in Gr–Si composite electrodes using electrochemical techniques. Previous studies have typically interpreted the electrochemical signals of Gr–Si composite anodes without differentiating the individual contributions of Gr and Si. To address this, the lithium plating behavior was first investigated separately in individual Gr and Si electrodes to compare their distinct electrochemical responses. Additionally, a simple equivalent circuit model, based on the interfacial resistances of both electrodes, was employed to conceptually analyze the current distribution between Gr and Si. This analysis enabled a direct comparison of the lithium plating signals from Gr and Si, offering insights into their respective deposition characteristics and allowing for informed inferences about the behavior in the Gr–Si composite systems. Finally, the same experimental framework was applied to composite electrodes with varying Gr-to-Si ratios to evaluate the influence of the Si content on the lithium plating behavior within the composite structure.

2. Experimental Procedures

2.1. Electrode Fabrication and Cell Preparation

The Gr electrode was composed of artificial graphite (Sigma-Aldrich, >99.95%, D50 ≈ 15 μm, St. Louis, MO, USA) as the active material, Super P (Timcal (Bodio, Switzerland), Carbon Black Super-P Li) as the conductive agent, and polyvinylidene fluoride (PVdF, Sigma-Aldrich, Mw~534,000) as the binder. These components were mixed in a weight ratio of 5:4:1. For the Si electrode, crystalline Si powder (APS ≈ 100 nm, 99%, plasma-synthesized) was used as the active material, with acetylene carbon black (100%, compressed, Thermo Fisher Scientific, Oxford, UK) as the conductive agent and with the same PVdF binder. The Si electrode composition was also mixed in a 5:4:1 weight ratio. The Gr and Si active materials contained within the Gr and Si electrodes, respectively, were ensured to have the same mass. Gr–Si composite electrodes were prepared by mixing Gr and Si in weight ratios of 1:1, 2:1, and 1:2, along with carbon black as the conductive agent and PVdF as the binder, maintaining an overall composition ratio of 5:4:1. These electrodes are hereafter referred to as 1Gr–1Si, 2Gr–1Si, and 1Gr–2Si, respectively. N-methyl-2-pyrrolidinone (NMP, Sigma-Aldrich, ≥99.0%) was used as the solvent to prepare a slurry by dispersing the Gr, Si, carbon black, and binder. The slurry was cast onto copper foil (18 μm, >99.96%, Honjo Metal Co., Osaka, Japan), dried in an oven at 70 °C for 12 h, pressed, and then punched into circular electrodes with a diameter of 16 mm.
The fabricated electrodes were used as working electrodes in a two-electrode half-cell configuration, with lithium metal serving as the counter-electrode. The electrolyte solution, supplied in a pre-mixed form by Dongwha Electrolyte (Nonsan-si, Republic of Korea), contained 1 M lithium hexafluorophosphate (LiPF6) dissolved in a 3:7 volume ratio mixture of ethylene carbonate (EC) and ethyl methyl carbonate (EMC). A Celgard 2400 membrane was employed as the separator. All cell assembly was conducted in an argon-filled glove box (MBraun, München, Germany) with oxygen and moisture levels maintained below 1 ppm.

2.2. Electrochemical Experiments

2.2.1. Cell Activation

The five fabricated electrodes were assembled into two-electrode half-cells and subjected to initial charge–discharge cycles at a rate of 0.1 C (corresponding to current densities of 37.2, 357.9, 197.0, 143.3, and 250.6 mA·g−1 for Gr, Si, 1Gr–1Si, 2Gr–1Si, and 1Gr–2Si, respectively) within a voltage window of 0.01–1.5 V vs. Li+/Li at room temperature (25 °C). The applied current (C-rate) was calculated based on the full lithiation states of Gr and Si—Li6C and Li3.75Si, respectively—corresponding to their theoretical capacities of 372 and 3579 mAh·g−1. Although the thermodynamically stable phase of fully lithiated Si is Li4.4Si, it is known to be kinetically difficult to form [78,79,80]. In practice, lithiation often terminates around the Li3.75Si composition, as discussed in prior studies [80,81,82]. Therefore, Li3.75Si, which is more readily formed under practical conditions, was considered as the 100% state of charge (SoC) for Si. Based on these assumptions, the theoretical capacities of the composite electrodes were calculated as 1970, 1433, and 2506 mAh·g−1 for 1Gr–1Si, 2Gr–1Si, and 1Gr–2Si, respectively. Figure 1 presents the initial charge–discharge profiles of the half-cells using the five electrode compositions. The initial discharge capacities were measured to be 320, 1120, 718, 586, and 882 mAh·g−1 for Gr, Si, 1Gr–1Si, 2Gr–1Si, and 1Gr–2Si, respectively. Subsequent constant-current tests were conducted by adjusting the applied current (C-rate) based on the actual specific capacities of each electrode.

2.2.2. Lithium Plating Test

To standardize the SoC across all half-cells described in Section 2.2.1, fully discharged cells were charged to 30% SoC at room temperature at a rate of 0.1 C. This corresponded to current densities of 32, 112, 71.8, 58.6, and 88.2 mA·g−1 for the Gr, Si, 1Gr–1Si, 2Gr–1Si, and 1Gr–2Si electrodes, respectively. After reaching 30% SoC, the cells were rested under open-circuit conditions for 15 min to allow voltage stabilization. Electrochemical impedance spectroscopy (EIS) was then performed over a frequency range of 1 MHz to 100 mHz with a sinusoidal voltage amplitude of 10 mVrms to investigate the interfacial characteristics of the individual Gr and Si electrodes. To analyze the lithium plating behavior under varying charge rates, SoC 30% cells were charged at constant currents corresponding to C-rates ranging from 2 C to 14 C, in 2 C increments—equivalent to 0.64 to 4.48 A·g−1 for Gr and 2.24 to 15.68 A·g−1 for Si. Charging was continued until each cell reached 100% SoC. Following the charging step, all cells were held under open-circuit conditions for 4 h to monitor the potential relaxation behavior. All charge–discharge and open-circuit relaxation experiments were performed using a multi-channel potentiostat/galvanostat system (VMP3, Bio-Logic, Seyssinet-Pariset, France). Impedance measurements were carried out using a Solartron 1470E multichannel potentiostat coupled with a Solartron 1455A frequency response analyzer (AMETEK Scientific Instruments, Wrexham, UK).

3. Results and Discussion

Figure 2a shows the potential profile of the Gr half-cell charged at a 4 C-rate, plotted as a function of the SoC, along with its corresponding differential curve (dV/dSoC). The overall potential profile closely mirrors the typical shape observed for Gr electrodes. However, a distinct minimum in the potential curve (i.e., dV/dSoC = 0) appears near an SoC of 95% (see inset figure). This feature is associated with the nucleation and growth of lithium on the Gr surface—specifically, lithium plating [70]. That is, the potential curve is divided into two distinct regions—pre-SoC and post-SoC (denoted as regions A and B, respectively, in the figure)—based on the minimum value, which depends on the presence of lithium plating: region A corresponds to the portion before the point where dV/dSoC = 0, while region B refers to the region that follows this point.
In region A, lithium insertion into the Gr structure dominates, resulting in the formation of various compounds (LiC24, LiC18, LiC12, LiC6) depending on the amount of lithium inserted. In this region, the dV/dSoC remains negative, with the maximum and minimum values on the dV/dSoC curve corresponding to the inflection points in the potential curve. These inflection points are closely associated with phase transitions, often referred to as ‘staging’, within the Gr structure [83]. Compared to previously reported Gr potential profiles, the peak at SoC ≈ 45% is attributed to the LiC18 → LiC12 (stage 2) transition, while the dip at SoC ≈ 65% corresponds to the LiC12 → LiC6 (stage 1) transition [84]. However, due to the relatively high charge rate used in this study (4 C), the phase transition occurs at lower SoC values than those typically reported in the literature, as a result of the increased overpotential.
In region B, both lithium insertion into the Gr and lithium plating on the Gr occur simultaneously due to the high overpotential. However, the fact that the potential curve stops decreasing and begins to rise after reaching the minimum point suggests that lithium plating becomes the dominant process, surpassing further lithium insertion into the Gr [70]. Therefore, the starting point of region B (where dV/dSoC = 0) can be interpreted as a significant signal for the onset of lithium plating. In this study, the corresponding SoC value is denoted as Smin,Gr and is used as a key indicator for lithium plating analysis. To indirectly confirm the occurrence of lithium plating upon observing a potential minimum during charging, the relaxation behavior of the open-circuit potential was analyzed immediately after a 4 C charge (Figure 2b). Overall, it shows the typical relaxation of the potential, with the potential rising over time. Of particular note is the potential inflection point (the peak in the dV/dt curve) identified near 0.3 h s, which is known to occur when lithium electroplated on the Gr surface is inserted into the Gr [69]. In fact, these two features—namely dV/dSoC = 0 and an inflection point in the open-circuit potential—have been directly and spectroscopically confirmed in the literature as reliable indicators of lithium plating [59,74,77] and are widely recognized as definitive electrochemical signatures that provide clear evidence of its occurrence [69,70,84].
Figure 2c,d present the potential profiles of the Gr half-cell charged at different C-rates and their corresponding differential curves, respectively. As the C-rate increases, the SoC at which the potential minimum occurs (i.e., Smin,Gr) decreases consistently (see red arrow in the inset of Figure 2d). This trend indicates that higher charging rates promote an earlier onset of lithium plating on Gr surfaces [84]. Although not the focus of this study, it is worth noting that, at ultra-high charging rates above 10 C, a first potential minimum appears at even lower SoC values than Smin,Gr. This minimum is not associated with lithium plating but is more likely attributed to kinetic effects—specifically, the rapid rise and subsequent recovery of the lithium concentration on the Gr surface at the onset of charging under ultra-high rates.
Figure 3a presents the potential profiles as a function of the SoC, along with its derivative, for the Si half-cell charged at a 4 C-rate. As in the previous case of Gr (Figure 2a), regions A and B are identified based on the potential minima, with the corresponding SoC values denoted as Smin,Si. Region A, characterized by a continuous decrease in potential with an increasing SoC, corresponds to the alloying of Si with lithium [72]. In contrast, Region B, where the potential rises, is believed to be dominated by lithium plating on the Si rather than alloying. The relaxation behavior of the open-circuit potential immediately after charging is very interesting (Figure 3b). The inflection point observed when lithium on Gr is inserted into the Gr structure under open-circuit conditions (Figure 2b) is similarly seen in the case of lithium-plated Si. Notably, this inflection point is absent in Si samples without lithium plating (see the inset figures), strongly suggesting that it originates from the interaction between surface-plated lithium and Si. Thus, as with Gr, the inflection point in the open-circuit potential curve appears to serve as an indicator of surface lithium deposits on Si. Figure 3c,d demonstrate the potential profiles and their corresponding differential curves, respectively, for the Si half-cell charged at different C-rates. As in the case of Gr, Smin,Si decreases continuously with an increasing C-rate in Si (see red arrow in the inset of Figure 3d). The first potential minimum that appears ahead of Smin,Si at very high-C-rate charging (e.g., 14 C-rate) is neglected here, as in the case of Gr.
Based on Figure 2c,d and Figure 3c,d, the variations in Smin,Gr and Smin,Si with respect to the C-rate are summarized in Figure 4. Interestingly, both Smin,Gr and Smin,Si exhibit a roughly linear relationship with the C-rate. Accordingly, an empirical formula for the C-rate dependence of Smin is derived as follows:
S m i n , M = α M · C r a t e + c M , w h e r e   M = G r   o r   S i
From Figure 4, the empirical parameters are determined as follows: α G r = 2.1 , c G r = 103.6 , α S i = 0.93 , and c S i = 74.0 . We would like to note that, while a linear trend is observed, this linearity serves as a convenient phenomenological tool for interpretation rather than as the foundation of our conclusions. The key finding is the substantial difference in both the slope and value between Gr and Si.
Given that the kinetics of the reaction at the Gr and Si interfaces are expected to significantly influence lithium plating on each material, we analyze the interfacial resistance of the Gr and Si electrodes. Figure 5 shows the Nyquist plots of the impedance spectra measured from the Gr and Si half-cells at SoC 30%. In both spectra, a positive imaginary impedance at high frequencies is observed, followed by approximately two depressed semicircles and a linear tail in the low-frequency region. The positive imaginary impedance in the high-frequency region is attributed to stray inductance (L) [83]. The subsequent two arcs correspond to the combined signals of surface SEI resistance (RSEI) and capacitance (CSEI), followed by the charge transfer resistance (Rct) and double-layer capacitance (Cdl), respectively [84,85]. The final linear segment in the low-frequency region is known as the Warburg impedance, which reflects lithium-ion diffusion behavior [86]. An equivalent circuit (shown in the inset of Figure 5) is employed to analyze the interfacial resistance components and fit the impedance data, excluding the diffusion tail. Constant phase elements (CPE) are used instead of ideal capacitors to account for the non-ideal interfacial behavior. The impedance data are fitted to the proposed equivalent circuit using the complex nonlinear least squares (CNLS) method via ZView (version 3.5g), within the frequency range of 100 kHz to 1 Hz. The values of the resistance components obtained from the fitting, along with the fitting reliability (chi-squared values), are summarized in Table 1.
Figure 6a is the equivalent circuit introduced to separately analyze the currents applied to the Gr and Si components during the charging of the Gr–Si composite electrode. Although the equivalent circuit model is a simplification and does not capture the full complexity of electrochemical processes in composite anodes, it is used to conceptually illustrate the current distribution between Gr and Si based on their relative resistances. Under the charging current i, the currents iGr and iSi experienced by Gr and Si, respectively, are determined by the interfacial resistances of the two components in the Gr–Si composite electrode, rintf,Gr and rintf,Si, as shown below.
i G r = r i n t f , s i r i n t f , G r   + r i n t f , s i   × i
i S i = r i n t f , G r   r i n t f , G r   + r i n t f , s i   × i
In this study, the interfacial resistance of a single Gr electrode was determined to be Rintf,Gr = 6.13 Ω, and that of a single Si electrode was Rintf,Si = 24.8 Ω (Table 1; note—the amounts of Si and Gr active materials in the Si and Gr electrodes were matched (refer to Section 2.1)). Therefore, by using these interfacial resistances and assuming that the weight ratio of Gr to Si in the composite electrode is mGr–mSi, the currents applied to Gr (iGr) and Si (iSi) can be expressed through Equations (3a) and (3b).
i G r = R i n t f , S i m S i R i n t f , G r m G r + R i n t f , s i m s i × i
i S i = R i n t f , G r m G r R i n t f , G r m G r + R i n t f , s i m s i × i
In other words, the interfacial resistance will vary depending on the Gr-to-Si ratio, which will, in turn, affect the currents applied to these materials. When the respective capacities of Gr and Si in the composite electrode are denoted as QGr and QSi, the C-rate for each material will be related to the applied current as follows:
C r a t e G r = i G r / Q G r
C r a t e S i = i S i / Q S i
Substituting Equation (3) into Equation (4), we obtain the following relationship:
C r a t e G r = R i n t f , s i m s i R i n t f , G r m G r + R i n t f , s i m s i × i Q G r
C r a t e S i = R i n t f , G r m G r R i n t f , G r m G r + R i n t f , s i m s i × i Q S i
Therefore, if the total capacity of the composite electrode is Q, the C-rate (=i/Q) experienced by the entire composite electrode can be expressed in the following two forms:
C r a t e = R i n t f , G r m G r + R i n t f , s i m s i R i n t f , s i m s i Q G r Q × C r a t e G r = γ G r × C r a t e G r ,   w h e r e   γ G r = R i n t f , G r m G r + R i n t f , s i m s i R i n t f , s i m s i Q G r Q
C r a t e = R i n t f , G r m G r + R i n t f , s i m s i R i n t f , G r m G r Q S i Q × C r a t e S i = γ S i × C r a t e S i ,   w h e r e   γ S i = R i n t f , G r m G r + R i n t f , s i m s i R i n t f , G r m G r Q S i Q
Here, γ G r and γ S i are constants determined by the compound composition and do not depend on the C-rate, making Equation (6) a linear expression. Substituting Equation (6) into Equation (1) finally gives us Equation (7):
S m i n , G r = α G r × γ G r × C r a t e G r + c G r
S m i n , S i = α S i × γ S i × C r a t e S i + c S i
Using Equation (7), the relationship between the C-rate and Smin was estimated for three hypothetical composite electrodes with different Gr-to-Si ratios: mGr–mSi = 1:1 (1Gr–1Si sample), 2:1 (2Gr–1Si sample), and 1:2 (1Gr–2Si sample), as illustrated in Figure 6b–d. In all three cases, the Smin,Gr value at a low C-rate is higher than Smin,Si; however, due to the higher C-rate dependency of Gr (i.e., slope α G r · γ G r > α S i · γ S i ), the two plots intersect at a specific C-rate. To examine how the trend predicted by the hypothetical composite electrodes manifests in real systems, three actual electrodes (1Gr–1Si, 2Gr–1Si, and 1Gr–2Si samples) were fabricated. The variation in the potential curves with the C-rate for these actual samples is shown in Figure 7, and the corresponding minimum points, Smin, for each composite electrode are presented in Figure 8. Notably, in all three actual composite samples, based on the intersection of Smin,Gr (red dashed line) and Smin,Si (blue dashed line) estimated for the individual Gr and Si electrodes, it is confirmed that, at low rates, the experimental results align with the Gr signal (Smin,Gr), while, at high rates, they align with the Si signal (Smin,Si). That is, although Smin,Si < Smin,Gr at low rates and Smin,Gr < Smin,Si at high rates from single-electrode predictions—suggesting that Smin,Si should be reached first at low rates and Smin,Gr at high rates during the charging process—the experimental results show the opposite trend: Smin,Gr appears at low rates and Smin,Si at high rates.
This unusual behavior can be explained as follows: since Smin,Si < Smin,Gr at low rates, based on the intersection point, lithium plating is expected to occur preferentially on the Si surface. However, even during lithium plating on Si, lithium insertion into Gr continues. Although the signal (Smin,Si) from lithium plating on Si may be expected, the overall potential curve of the composite electrode continues to decrease due to the ongoing lithium insertion into Gr, which prevents the Smin,Si signal from appearing. This decline continues until lithium insertion into Gr is complete, at which point lithium plating begins on Gr, resulting in the appearance of the Smin,Gr signal at low rates. Conversely, since Smin,Gr < Smin,Si at high rates, lithium plating occurs first on the Gr surface. However, similar to the low-rate case, the Smin,Gr signal is masked by the potential drop caused by Si alloying, and only the lithium plating signal on Si (Smin,Si) appears once Si alloying is complete. Nevertheless, it should be noted that this interpretation has not yet been experimentally validated and requires further investigation through independent approaches, such as tailored experimental conditions that could uncover masked phenomena [87,88], or complementary spectroscopic analyses.
In summary, at low rates, the signal follows Gr, while lithium plating preferentially occurs on Si, whereas, at high rates, the signal follows Si and lithium plating occurs preferentially on Gr. This indicates that, when the minimum points (Smin) of the potential curve for a Gr–Si composite electrode are plotted as a function of the C-rate (closed symbols in Figure 8), extrapolating the two linear regions on either side of the turning point enables the determination of the SoC at which lithium plating begins on Si and Gr at low and high rates, respectively. In conclusion, by analyzing the variation in the minimum points of the potential curve of a Gr–Si composite electrode with respect to the charging C-rate, the onset points of lithium plating on Si and Gr can be estimated. These results offer valuable insights into the design of fast-charging anodes. Lithium plating typically occurs when the rate of lithium-ion insertion into the electrode material is slower than the supply of lithium ions at the surface, resulting in the formation of metallic lithium instead of intercalated lithium. Therefore, understanding the rate-dependent lithiation and plating characteristics of Gr–Si composites is critical in minimizing the risk of lithium plating. Based on these findings, tailoring electrode formulations can help to optimize their safety and cycle life, particularly under high-rate charging conditions.

4. Conclusions

This study systematically analyzed the selective lithium plating behavior of Gr–Si composite electrodes under high-rate charging. The key findings are summarized as follows:
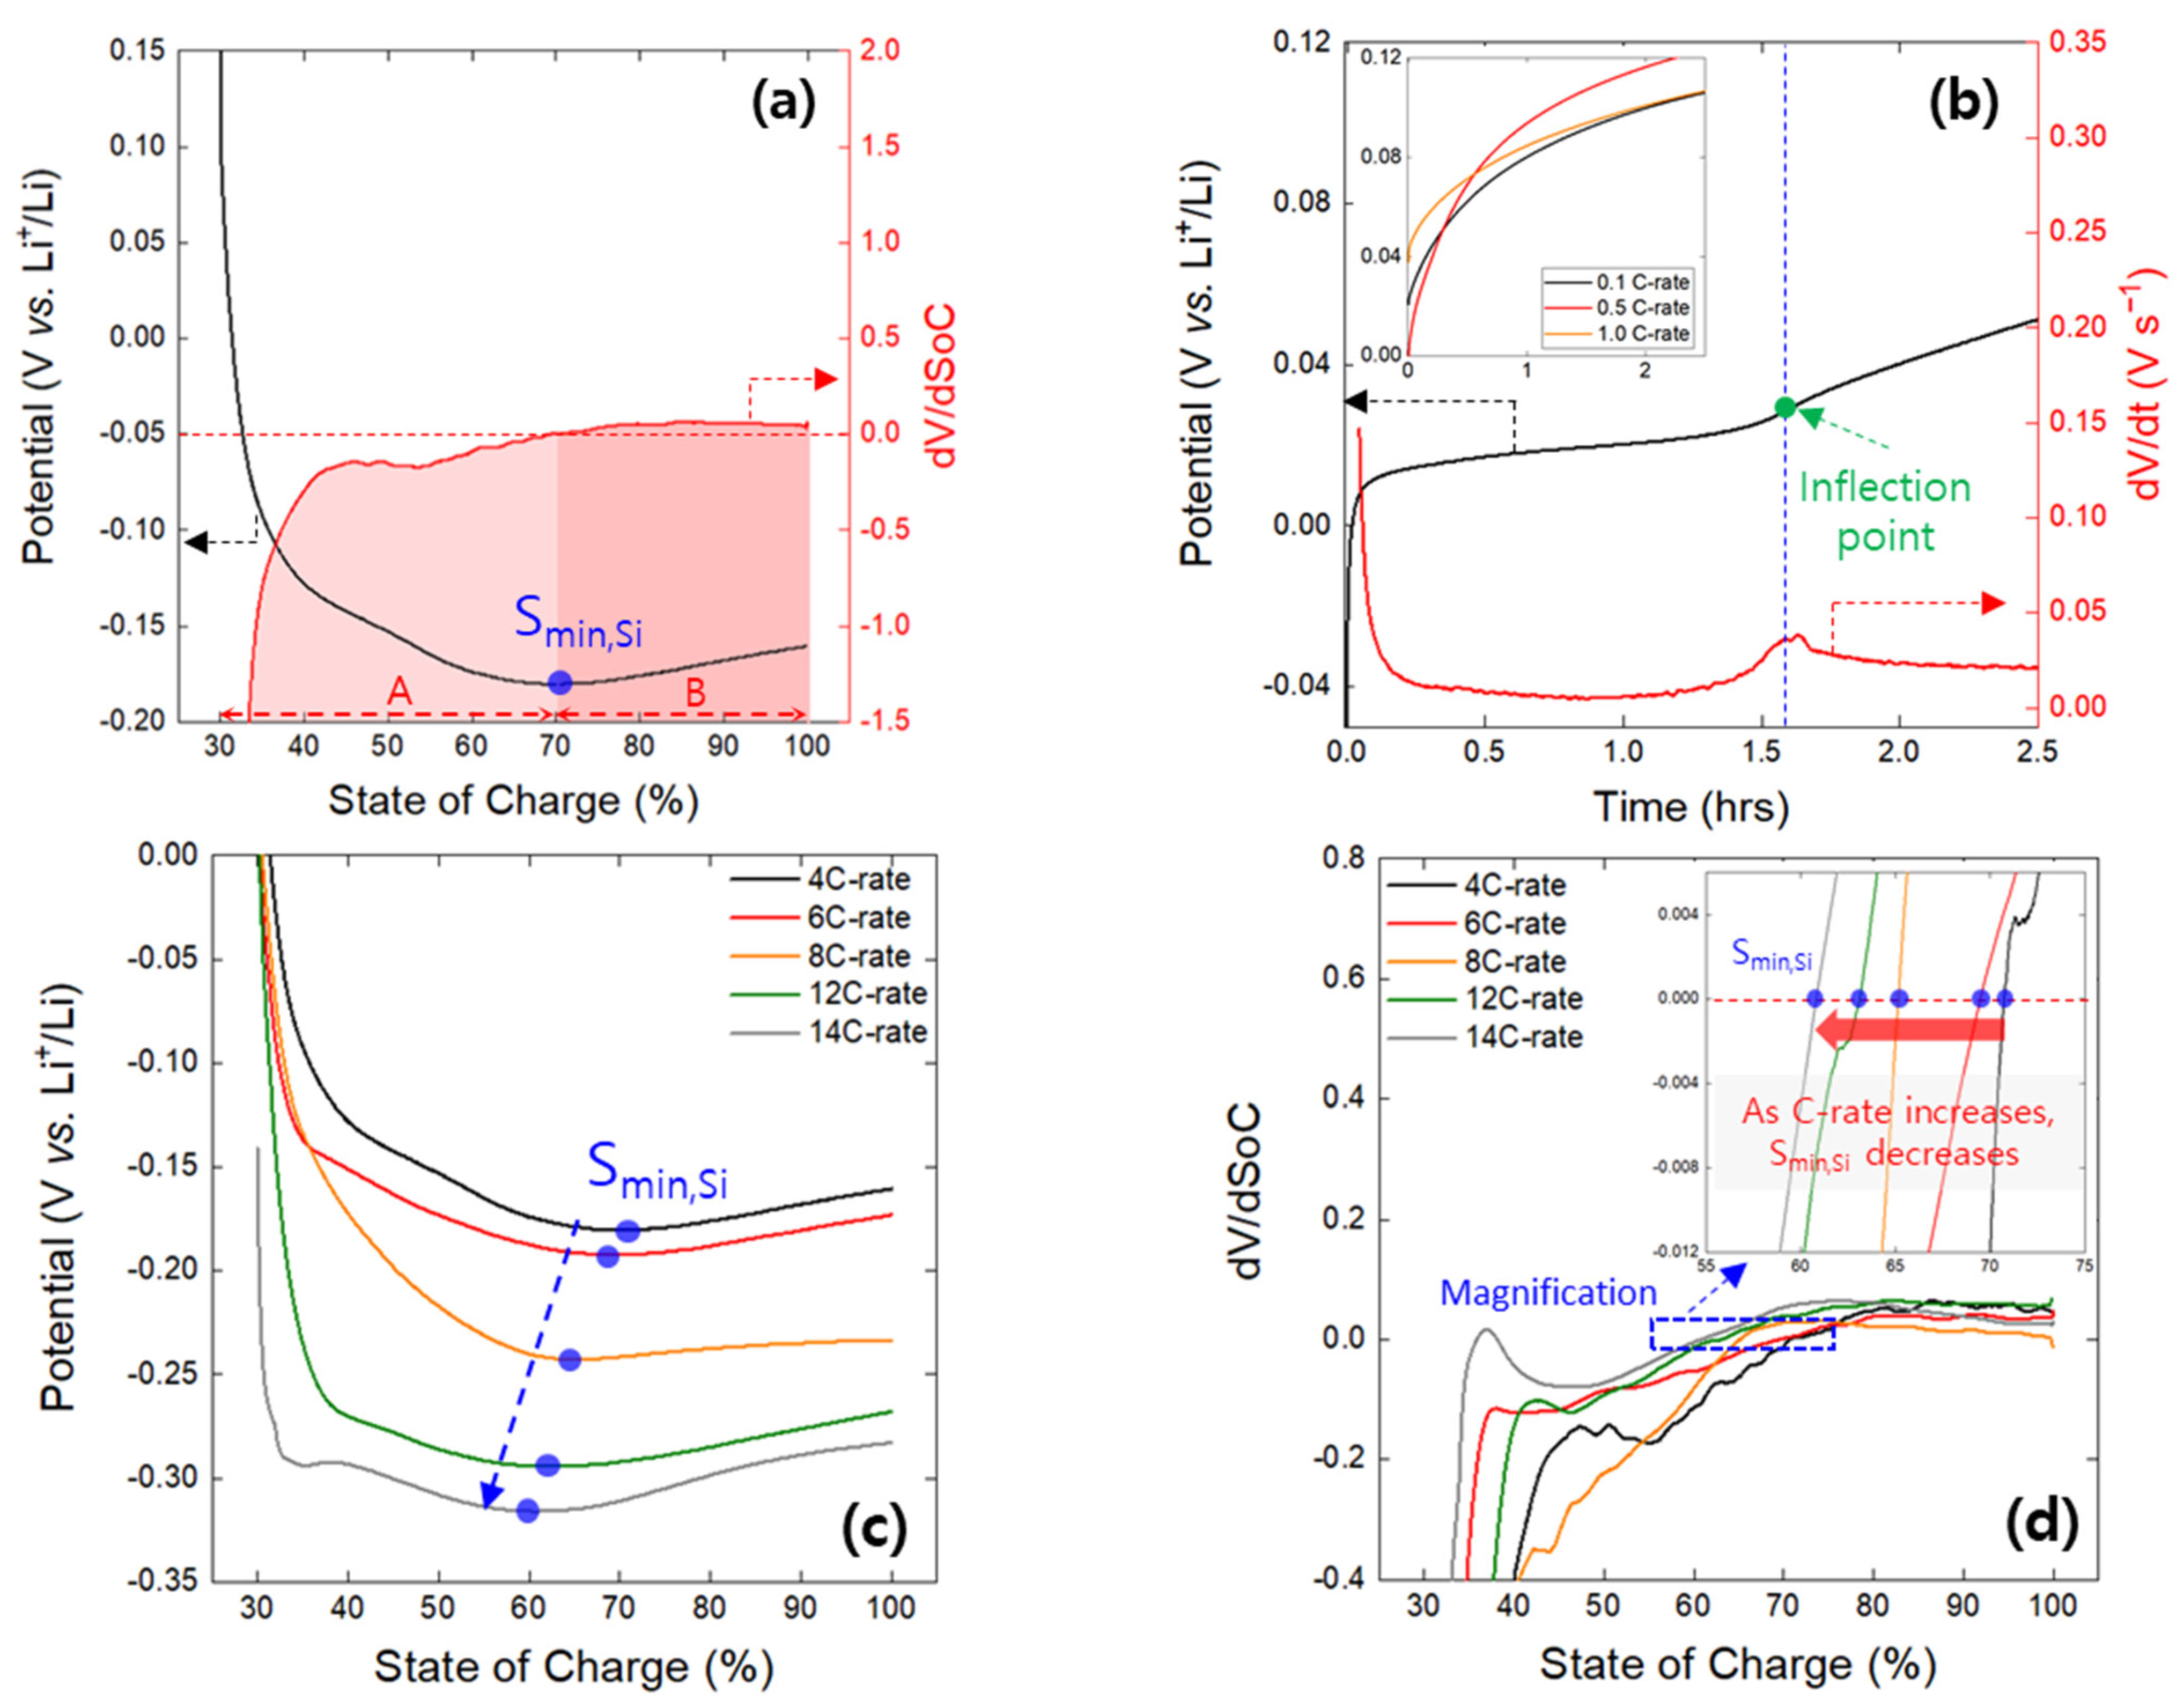
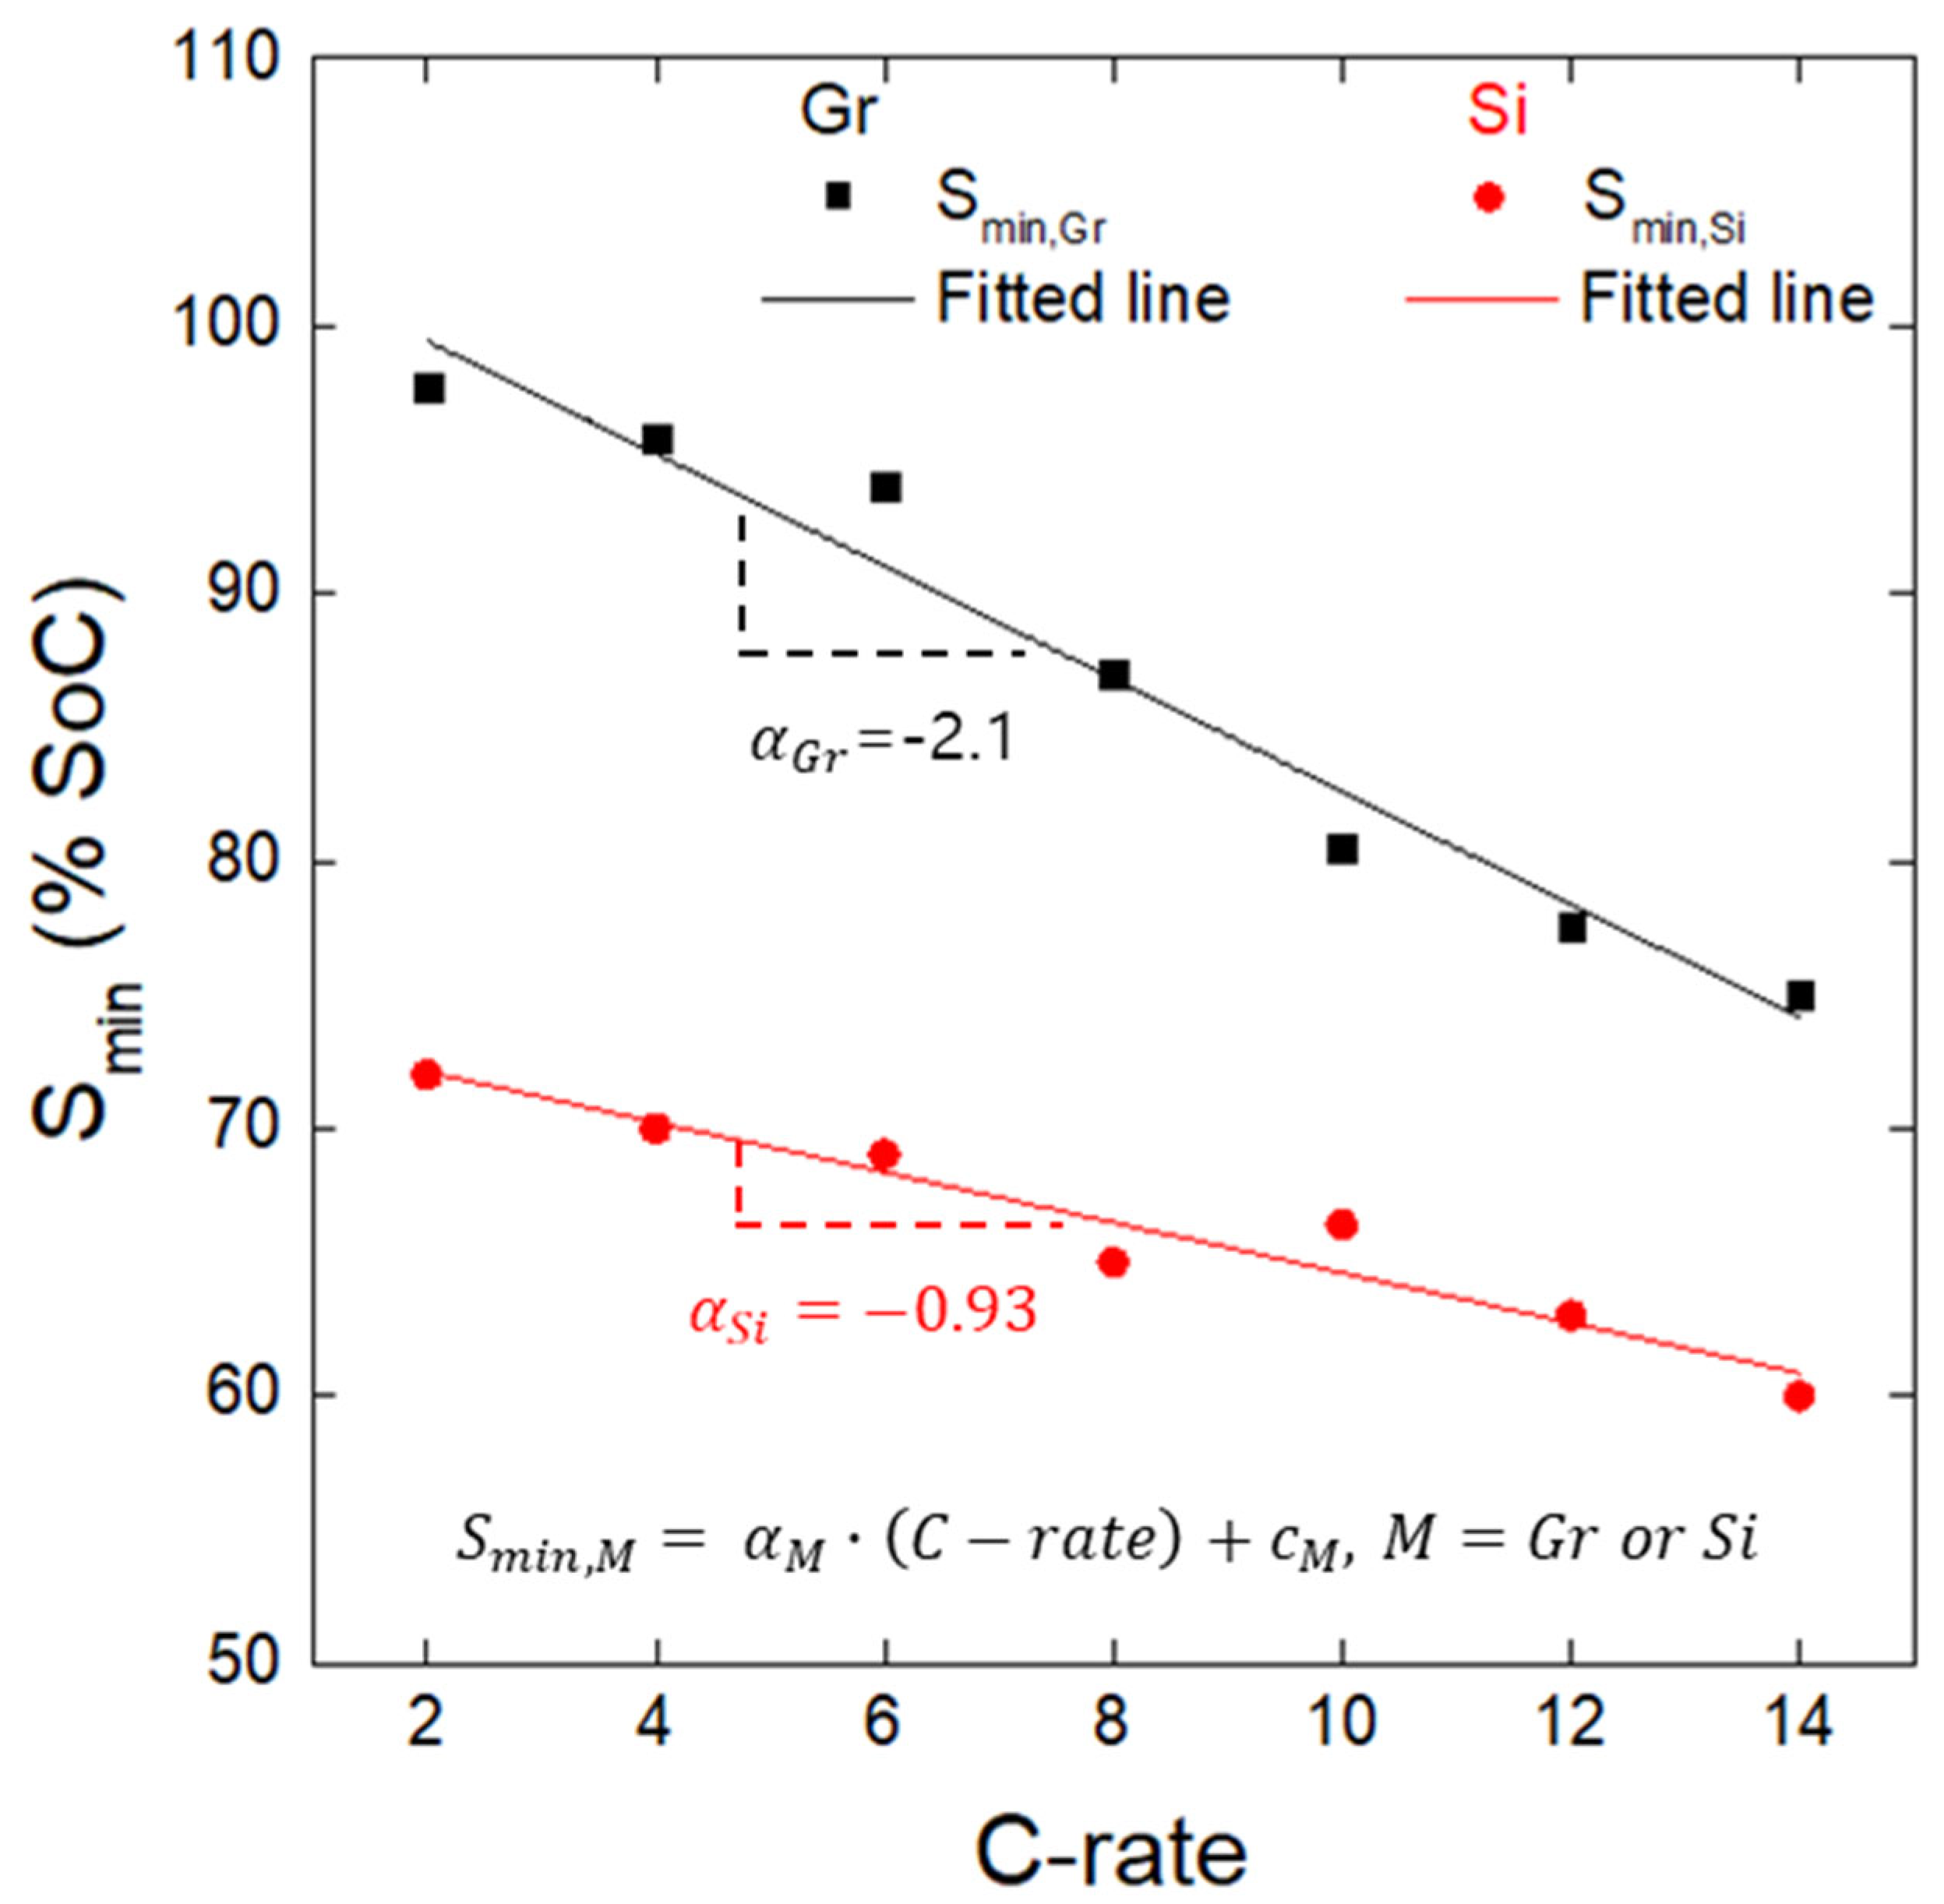
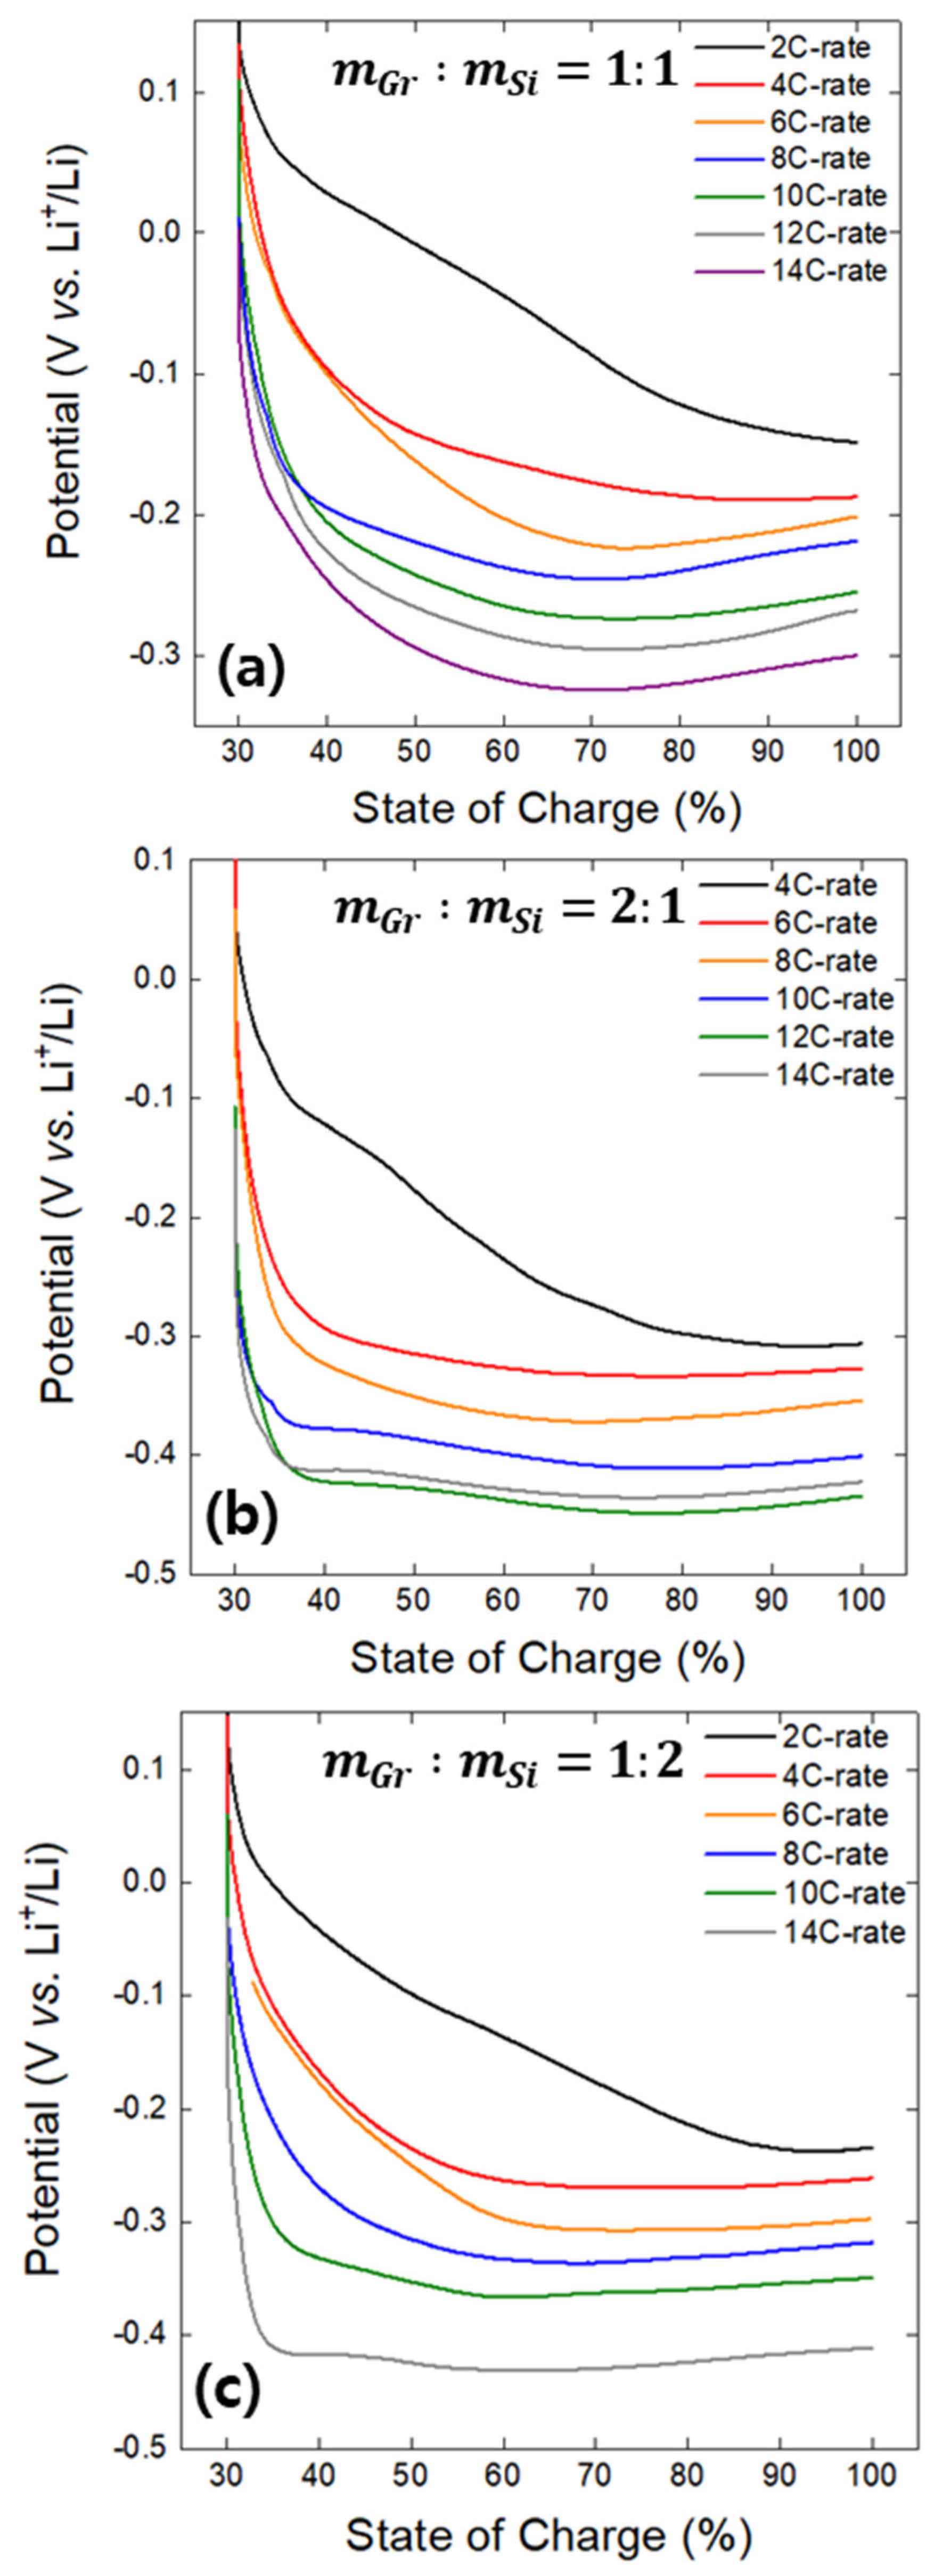
  • The minima observed in the charge potential curves of the Gr and Si single electrodes were designated as the onset SoC for lithium plating (Smin). The appearance of inflection points on the open-circuit potential curves of both the Gr and Si electrodes, charged beyond the Smin value, indirectly confirmed the presence of lithium plating on the electrode surfaces. It was confirmed that Smin has a linear relationship with the charging rate (C-rate), and, based on this, a linear empirical equation between Smin and the C-rate was derived.
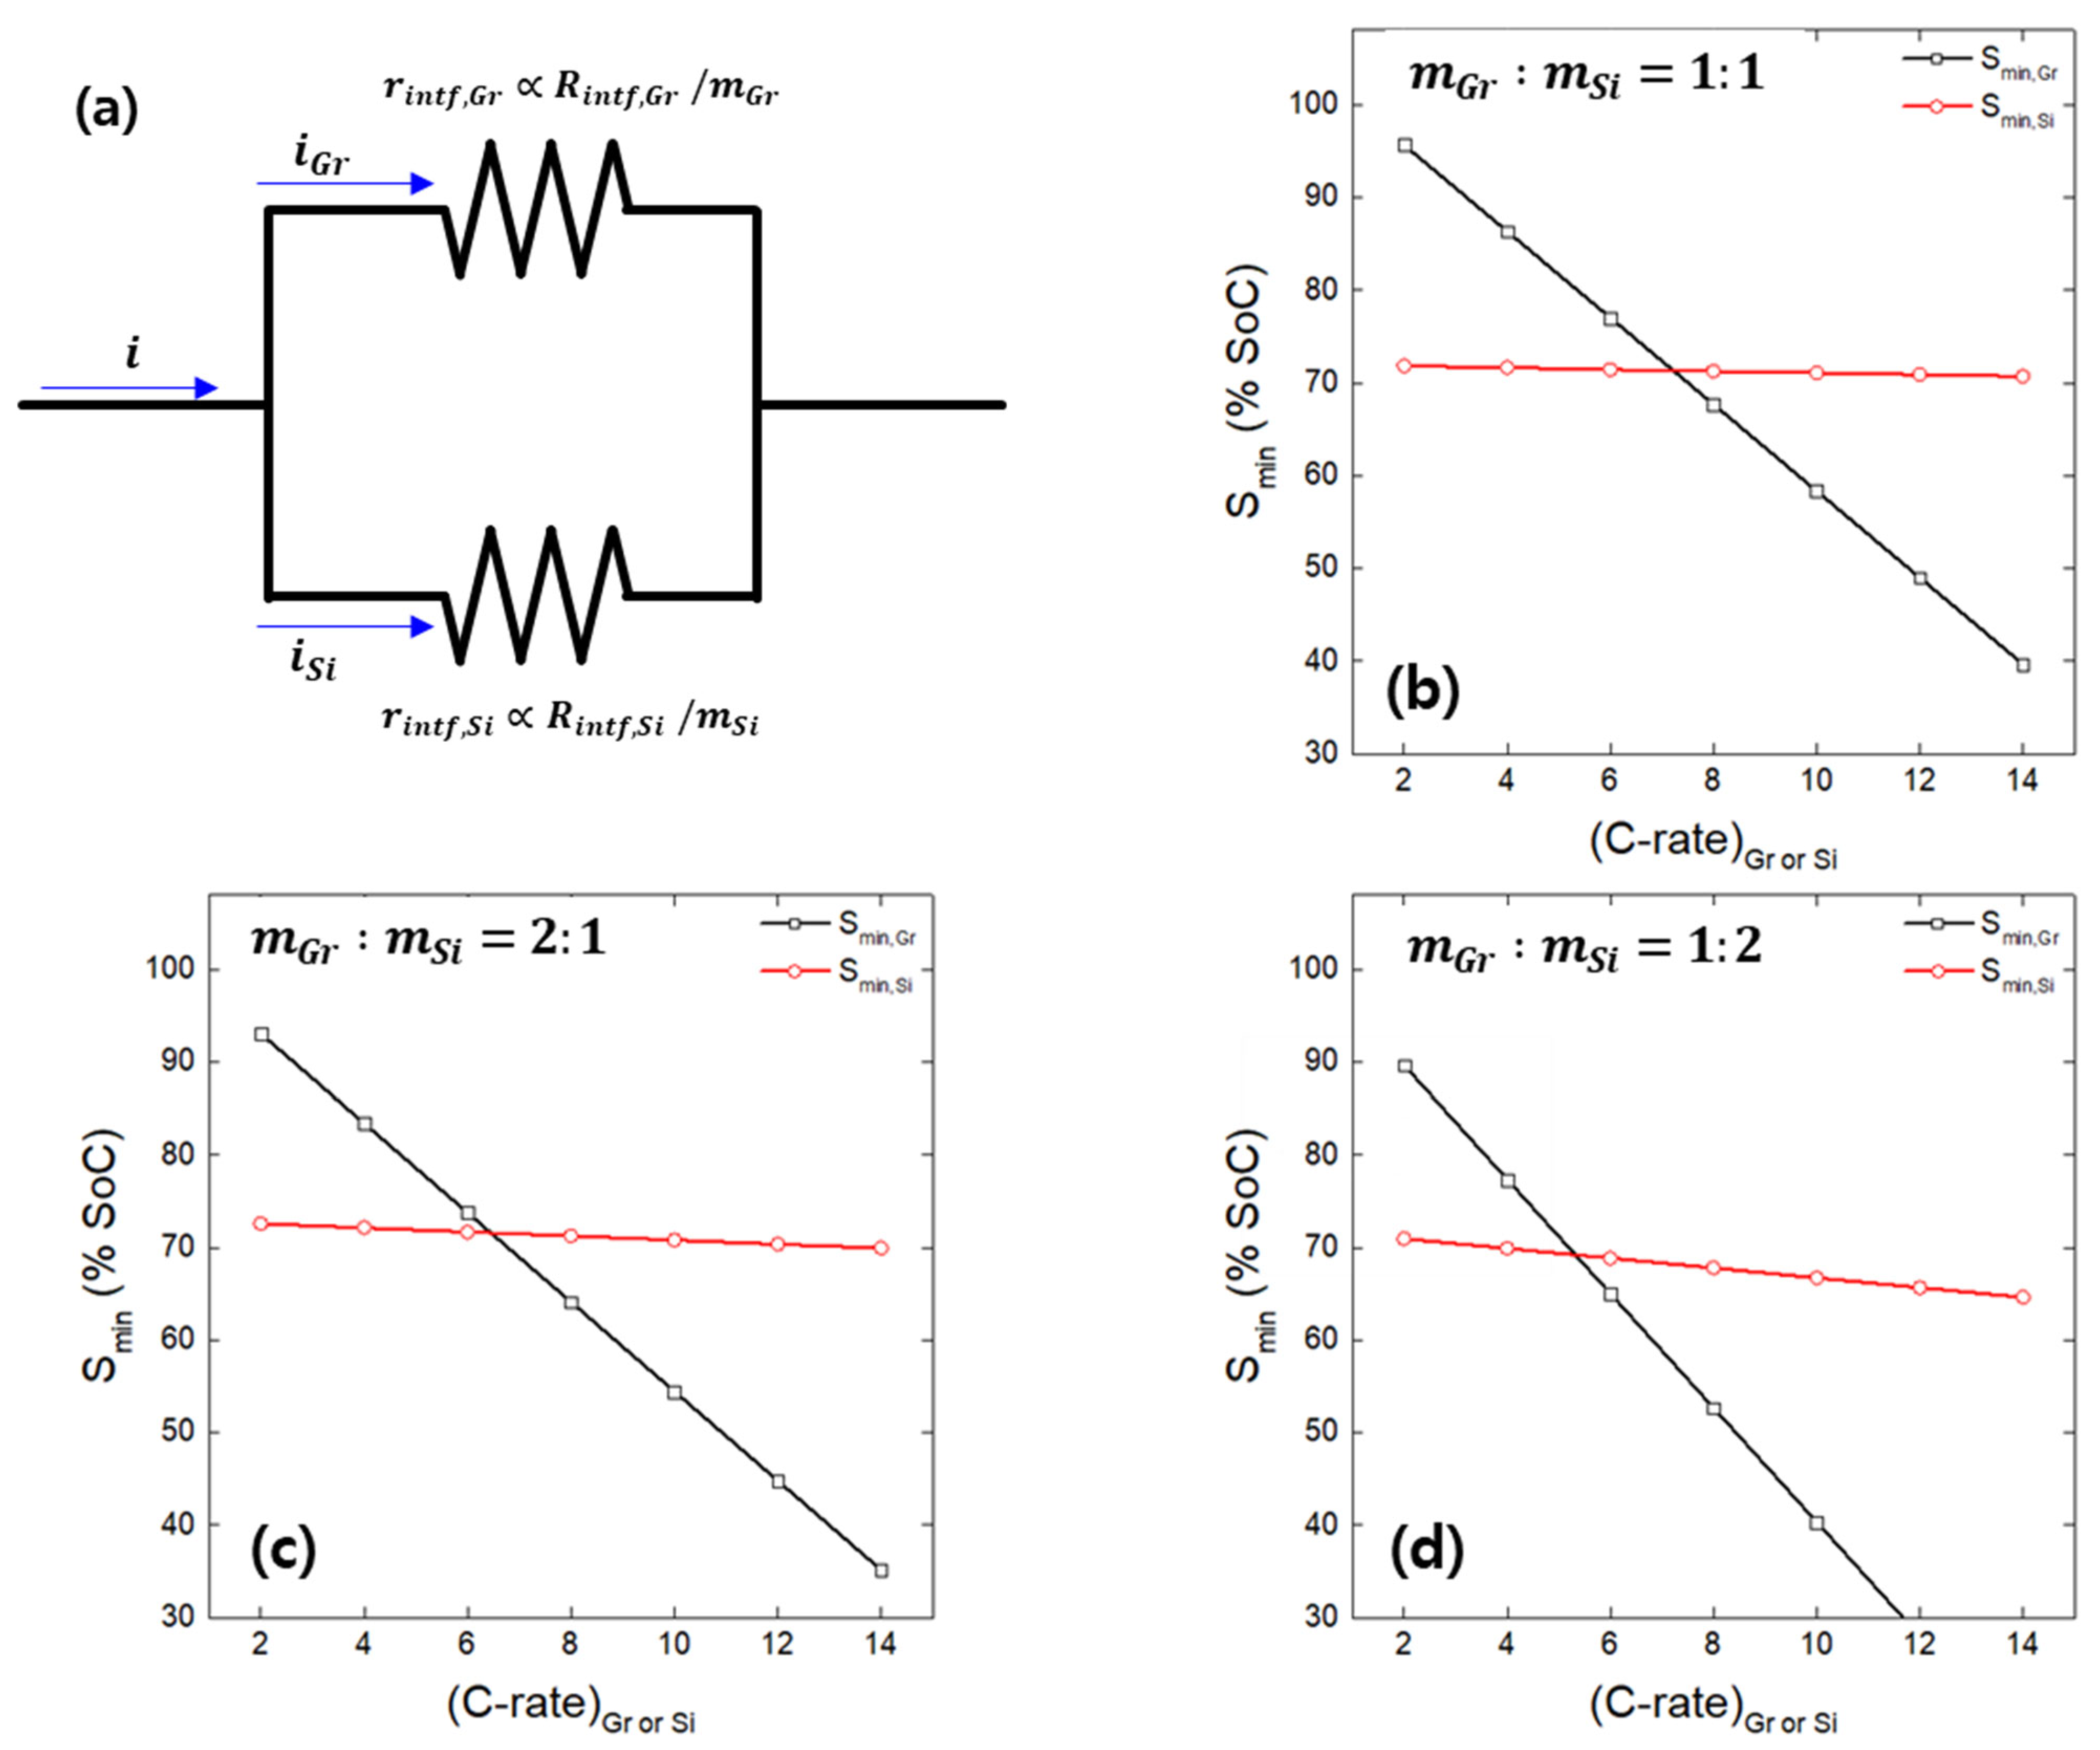
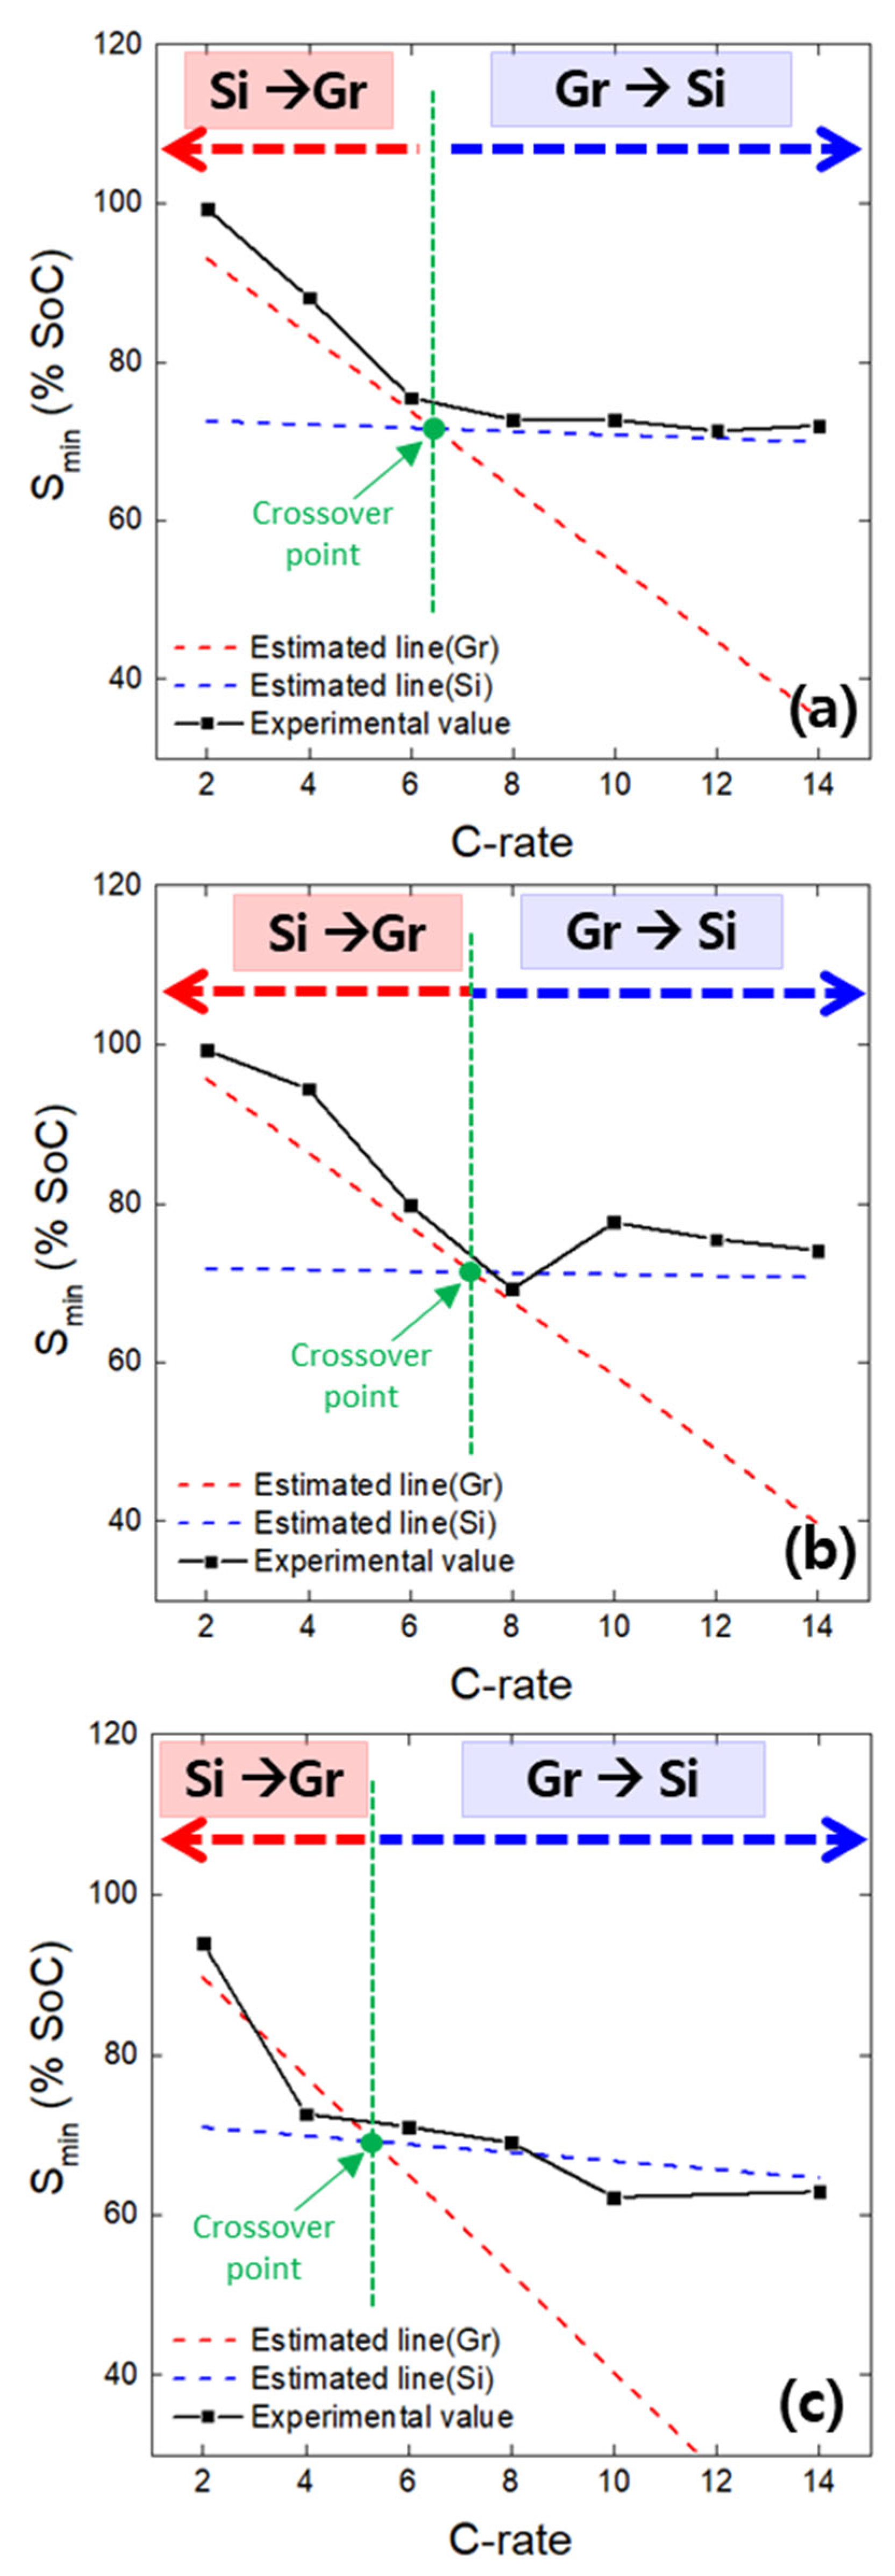
  • Based on the interfacial resistances of Gr and Si, the Gr–Si ratio in the composite electrode, and the linear relationship between Smin and the C-rate, the lithium plating behavior on Gr and Si in the hypothetical Gr–Si composite electrode was estimated. Within the charging rate range used in the study (2 to 14 C-rate), it was observed that the Smin values for Gr and Si intersected as the C-rate increased. This suggests that, at a specific C-rate (the crossover point), the active material undergoing preferential lithium plating changes.
  • An analysis of the variation in Smin with the C-rate using actual Gr–Si composite electrodes with varying Gr–Si ratios revealed a transition in the lithium plating behavior: Smin followed that of Gr at low rates and Si at high rates, with the crossover point indicating the shift in plating behavior. This unusual behavior observed in the composite electrode is attributed to rate-dependent lithium reaction pathways: at low rates, there is simultaneous lithium plating on Si and lithium insertion into Gr; at high rates, there is simultaneous lithium plating on Gr and lithium alloying with Si. Furthermore, an analysis of the potential curve minima of composite electrodes as a function of the charge C-rate revealed that the onset of lithium plating on Si and Gr can be estimated.
  • The observed differences in the lithium plating behavior between Gr and Si are likely influenced by their intrinsic properties. At low C-rates, Gr may tend to favor earlier lithium plating, which could be related to its high electrical conductivity facilitating efficient electron transport during slower lithiation. In contrast, at higher C-rates, Si might become more prone to lithium plating, possibly due to its lower lithium diffusivity, which limits the rate at which lithium ions can diffuse into the material, leading to lithium accumulation and plating on the surface.
  • This study provides valuable insights into the C-rate-dependent lithium plating of Gr–Si composite anodes by interpreting it through validated electrochemical signals. However, surface characterization and elemental analysis were not conducted in this work. Incorporating these techniques in future studies could offer a more comprehensive understanding of the electrode’s physicochemical state under fast-charging conditions.

Author Contributions

Conceptualization, M.P. and H.-C.S.; Methodology, M.P. and H.-C.S.; Validation, S.-H.H. and J.J.; Formal analysis, M.P. and S.-H.H.; Investigation, J.J.; Writing—original draft, M.P.; Writing—review & editing, H.-C.S.; Supervision, H.-C.S.; Project administration, H.-C.S. All authors have read and agreed to the published version of the manuscript.

Funding

This work was supported by the National Research Foundation of the Ministry of Science and ICT (RS-2025-00512708); by the Technology Innovation Program (20007045) funded by the Ministry of Trade, Industry & Energy (MOTIE); and by the Korea Institute of Energy Technology Evaluation and Planning (KETEP) and the MOTIE of the Republic of Korea (No. 20224000000400).

Data Availability Statement

The original contributions presented in the study are included in the article, further inquiries can be directed to the corresponding author.

Conflicts of Interest

The authors declare no conflict of interest.

References

  1. Zhu, X.; Wang, H.; Wang, X.; Gao, Y.; Allu, S.; Cakmak, E.; Wang, Z. Internal short circuit and failure mechanisms of lithium-ion pouch cells under mechanical indentation abuse conditions: An experimental study. J. Power Sources 2020, 455, 227939. [Google Scholar] [CrossRef]
  2. Du, J.; Ouyang, D. Progress of Chinese electric vehicles industrialization in 2015: A review. Appl. Energy 2017, 188, 529–546. [Google Scholar] [CrossRef]
  3. Nykvist, B.; Nilsson, M. Rapidly falling costs of battery packs for electric vehicles. Nat. Clim. Change 2015, 5, 329–332. [Google Scholar] [CrossRef]
  4. Kang, Y.; Deng, C.; Chen, Y.; Liu, X.; Liang, Z.; Li, T.; Hu, Q.; Zhao, Y. Molecular sieve-modified separator for high-performance lithium-ion batteries. Nanoscale Res. Lett. 2020, 15, 107. [Google Scholar] [CrossRef]
  5. Yang, J.; Liu, X.; Tian, J.; Ma, X.; Wang, B.; Li, W.; Wang, Q. Adhesive nanocomposites of hypergravity induced Co3O4 nanoparticles and natural gels as Li-ion battery anode materials with high capacitance and low resistance. RSC Adv. 2017, 7, 21061–21067. [Google Scholar] [CrossRef]
  6. Prior, A. Past, Present and Future; Oxford University Press: Oxford, UK, 1967. [Google Scholar]
  7. Liu, Z.; Yu, Q.; Zhao, Y.; He, R.; Xu, M.; Feng, S.; Li, S.; Zhou, L. Silicon oxides: A promising family of anode materials for lithium-ion batteries. Chem. Soc. Rev. 2019, 48, 285–309. [Google Scholar] [CrossRef]
  8. Kim, M.; Robertson, D.C.; Dees, D.W.; Yao, K.P.; Lu, W.; Trask, S.E.; Kirner, J.T.; Bloom, I. Estimating the diffusion coefficient of lithium in graphite: Extremely fast charging and a comparison of data analysis techniques. J. Electrochem. Soc. 2021, 168, 070506. [Google Scholar] [CrossRef]
  9. Son, S.B.; Trask, S.; Tsai, Y.; Lopykinski, S.; Kim, M.; Bloom, I. Across-Depth Heterogeneity and Irreversibility of Fast-Charge-Driven Lithium Plating. J. Electrochem. Soc. 2022, 169, 060506. [Google Scholar] [CrossRef]
  10. Kim, M.; Yang, Z.; Bloom, I. The lithiation/delithiation behavior of Si-based electrodes: A connection between electrochemistry and mechanics. J. Electrochem. Soc. 2021, 168, 010523. [Google Scholar] [CrossRef]
  11. Kim, M.; Yang, Z.; Son, S.B.; Trask, S.E.; Jansen, A.; Bloom, I. Effect of cathode on crosstalk in Si-based lithium-ion cells. J. Mater. Chem. A 2021, 9, 26904–26916. [Google Scholar] [CrossRef]
  12. Kim, M.; Yang, Z.; Trask, S.E.; Bloom, I. Understanding the effect of cathode composition on the interface and crosstalk in NMC/Si full cells. ACS Appl. Mater. Interfaces 2022, 14, 15103–15111. [Google Scholar] [CrossRef] [PubMed]
  13. Jin, Y.; Zhu, B.; Lu, Z.; Liu, N.; Zhu, J. Challenges and recent progress in the development of Si anodes for lithium-ion battery. Adv. Energy Mater. 2017, 7, 1700715. [Google Scholar] [CrossRef]
  14. He, Y.; Jiang, L.; Chen, T.; Xu, Y.; Jia, H.; Yi, R.; Xue, D.; Song, M.; Genc, A.; Bouchet-Marquis, C.; et al. Progressive growth of the solid–electrolyte interphase towards the Si anode interior causes capacity fading. Nat. Nanotechnol. 2021, 16, 1113–1120. [Google Scholar] [CrossRef] [PubMed]
  15. Son, Y.; Kim, N.; Lee, T.; Lee, Y.; Ma, J.; Chae, S.; Sung, J.; Cha, H.; Yoo, Y.; Cho, J. Calendering-compatible macroporous architecture for silicon–graphite composite toward high-energy lithium-ion batteries. Adv. Mater. 2020, 32, 2003286. [Google Scholar] [CrossRef]
  16. Chan, C.K.; Peng, H.; Liu, G.; McIlwrath, K.; Zhang, X.F.; Huggins, R.A.; Cui, Y. High-performance lithium battery anodes using silicon nanowires. Nat. Nanotechnol. 2008, 3, 31–35. [Google Scholar] [CrossRef]
  17. Choi, J.W.; Cui, Y.; Nix, W.D. Size-dependent fracture of Si nanowire battery anodes. J. Mech. Phys. Solids 2011, 59, 1717–1730. [Google Scholar]
  18. Ruffo, R.; Hong, S.S.; Chan, C.K.; Huggins, R.A.; Cui, Y. Impedance analysis of silicon nanowire lithium ion battery anodes. J. Phys. Chem. C 2009, 113, 11390–11398. [Google Scholar] [CrossRef]
  19. Song, T.; Xia, J.; Lee, J.-H.; Lee, D.H.; Kwon, M.-S.; Choi, J.-M.; Wu, J.; Doo, S.K.; Chang, H.; Park, W.I.; et al. Arrays of sealed silicon nanotubes as anodes for lithium ion batteries. Nano Lett. 2010, 10, 1710–1716. [Google Scholar] [CrossRef]
  20. Li, X.; Gu, M.; Hu, S.; Kennard, R.; Yan, P.; Chen, X.; Wang, C.; Sailor, M.J.; Zhang, J.-G.; Liu, J. Mesoporous silicon sponge as an anti-pulverization structure for high-performance lithium-ion battery anodes. Nat. Commun. 2014, 5, 4105. [Google Scholar] [CrossRef]
  21. Yang, Y.; Yuan, W.; Kang, W.; Ye, Y.; Yuan, Y.; Qiu, Z.; Wang, C.; Zhang, X.; Ke, Y. Silicon-nanoparticle-based composites for advanced lithium-ion battery anodes. Nanoscale 2020, 12, 7461–7484. [Google Scholar] [CrossRef]
  22. Gao, P.; Huang, X.; Zhao, Y.; Hu, X.; Cen, D.; Gao, G.; Bao, Z.; Mei, Y.; Di, Z.; Wu, G. Formation of Si hollow structures as promising anode materials through reduction of silica in AlCl3–NaCl molten salt. ACS Nano 2018, 12, 11481–11490. [Google Scholar] [CrossRef] [PubMed]
  23. Yao, Y.; McDowell, M.T.; Ryu, I.; Wu, H.; Liu, N.; Hu, L.; Nix, W.D.; Cui, Y. Interconnected silicon hollow nanospheres for lithium-ion battery anodes with long cycle life. Nano Lett. 2011, 11, 2949–2954. [Google Scholar] [CrossRef]
  24. Shi, J.; Gao, H.; Hu, G.; Zhang, Q. Core-shell structured Si@C nanocomposite for high-performance Li-ion batteries with a highly viscous gel as precursor. J. Power Sources 2019, 438, 227001. [Google Scholar] [CrossRef]
  25. Dimov, N.; Kugino, S.; Yoshio, M. Carbon-coated silicon as anode material for lithium ion batteries: Advantages and limitations. Electrochim. Acta 2003, 48, 1579–1587. [Google Scholar] [CrossRef]
  26. Chen, D.; Mei, X.; Ji, G.; Lu, M.; Xie, J.; Lu, J.; Lee, J.Y. Reversible lithium-ion storage in silver-treated nanoscale hollow porous silicon particles. Angew. Chem. Int. Ed. 2012, 51, 2409–2413. [Google Scholar] [CrossRef]
  27. Murugesan, S.; Harris, J.T.; Korgel, B.A.; Stevenson, K.J. Copper-coated amorphous silicon particles as an anode material for lithium-ion batteries. Chem. Mater. 2012, 24, 1306–1315. [Google Scholar] [CrossRef]
  28. Kulova, T.L.; Skundin, A.M.; Pleskov, Y.V.; Terukov, E.I.; Kon’kov, O.I. Lithium insertion into amorphous silicon thin-film electrodes. J. Electroanal. Chem. 2007, 600, 217–225. [Google Scholar] [CrossRef]
  29. Li, L.; Fang, C.; Wei, W.; Zhang, L.; Ye, Z.; He, G.; Huang, Y. Nano-ordered structure regulation in delithiated Si anode triggered by homogeneous and stable Li-ion diffusion at the interface. Nano Energy 2020, 72, 104651. [Google Scholar] [CrossRef]
  30. Wang, G.; Xu, B.; Shi, J.; Wu, M.; Su, H.; Ouyang, C. New insights into Li diffusion in Li–Si alloys for Si anode materials: Role of Si microstructures. Nanoscale 2019, 11, 14042–14049. [Google Scholar] [CrossRef]
  31. Wu, J.; Cao, Y.; Zhao, H.; Mao, J.; Guo, Z. The critical role of carbon in marrying silicon and graphite anodes for high-energy lithium-ion batteries. Carbon Energy 2019, 1, 57–76. [Google Scholar] [CrossRef]
  32. Anothumakkool, B.; Holtstiege, F.; Wiemers-Meyer, S.; Nowak, S.; Schappacher, F. Electropolymerization triggered in situ surface modification of electrode interphases: Alleviating first-cycle lithium loss in silicon anode lithium-ion batteries. ACS Sustain. Chem. Eng. 2020, 8, 12788–12798. [Google Scholar] [CrossRef]
  33. Müller, J.; Abdollahifar, M.; Vinograd, A.; Nöske, M.; Nowak, C.; Chang, S.-J.; Placke, T.; Haselrieder, W.; Winter, M.; Kwade, A.; et al. Si-on-Graphite fabricated by fluidized bed process for high-capacity anodes of Li-ion batteries. Eng. J. 2020, 407, 126603. [Google Scholar] [CrossRef]
  34. Beaulieu, L.Y.; Hatchard, T.D.; Bonakdarpour, A.; Fleischauer, M.D.; Dahn, J.R. Reaction of Li with alloy thin films studied by in situ AFM. J. Electrochem. Soc. 2003, 150, A1457. [Google Scholar] [CrossRef]
  35. Sun, W.; Hu, R.; Liu, H.; Zhang, H.; Liu, J.; Yang, L.; Wang, H.; Zhu, M. Silicon/Wolfram Carbide@Graphene composite: Enhancing conductivity and structure stability in amorphous-silicon for high lithium storage performance. Electrochim. Acta 2016, 191, 462–472. [Google Scholar] [CrossRef]
  36. Li, J.; Dozier, A.K.; Li, Y.; Yang, F.; Cheng, Y.T. Crack pattern formation in thin film lithium-ion battery electrodes. J. Electrochem. Soc. 2011, 158, A689. [Google Scholar] [CrossRef]
  37. Liu, X.H.; Zhong, L.; Huang, S.; Mao, S.X.; Zhu, T.; Huang, J.Y. Size-dependent fracture of silicon nanoparticles during lithiation. ACS Nano 2012, 6, 1522–1531. [Google Scholar] [CrossRef]
  38. Wang, Y.; Liu, Y.; Zheng, J.; Zheng, H.; Mei, Z.; Du, X.; Li, H. Electrochemical performances and volume variation of nano-textured silicon thin films as anodes for lithium-ion batteries. Nanotechnology 2013, 24, 424011. [Google Scholar] [CrossRef]
  39. Wang, S.; Ren, P.; Takyi-Aninakwa, P.; Jin, S.; Fernandez, C. A critical review of improved deep convolutional neural network for multi-timescale state prediction of lithium-ion batteries. Energies 2022, 15, 5053. [Google Scholar] [CrossRef]
  40. Li, X.; Wu, M.; Feng, T.; Xu, Z.; Qin, J.; Chen, C.; Wang, D. Graphene enhanced silicon/carbon composite as anode for high performance lithium-ion batteries. RSC Adv. 2017, 7, 48286–48293. [Google Scholar] [CrossRef]
  41. Liu, R.; Shen, C.; Dong, Y.; Qin, J.; Wang, Q.; Iocozzia, J.; Lin, Z. Sandwich-like CNTs/Si/C nanotubes as high performance anode materials for lithium-ion batteries. J. Mater. Chem. A 2018, 6, 14797–14804. [Google Scholar] [CrossRef]
  42. Liu, N.; Lu, Z.; Zhao, J.; McDowell, M.T.; Lee, H.W.; Zhao, W.; Cui, Y. A pomegranate-inspired nanoscale design for large-volume-change lithium battery anodes. Nat. Nanotechnol. 2014, 9, 187–192. [Google Scholar] [CrossRef] [PubMed]
  43. Bang, B.M.; Lee, J.I.; Kim, H.; Cho, J.; Park, S. High-performance macroporous bulk silicon anodes synthesized by template-free chemical etching. Adv. Energy Mater. 2012, 2, 878. [Google Scholar] [CrossRef]
  44. Jiménez, A.R.; Klöpsch, R.; Wagner, R.; Rodehorst, U.C.; Kolek, M.; Nölle, R.; Placke, T.; Winter, M. A step toward high-energy silicon-based thin film lithium ion batteries. ACS Nano 2017, 11, 4731–4744. [Google Scholar] [CrossRef]
  45. Yang, Y.; Yang, X.; Chen, S.; Zou, M.; Li, Z.; Cao, A.; Yuan, Q. Rational design of hierarchical carbon/mesoporous silicon composite sponges as high-performance flexible energy storage electrodes. ACS Appl. Mater. Interfaces 2017, 9, 22819–22825. [Google Scholar] [CrossRef]
  46. Heubner, C.; Nikolowski, K.; Reuber, S.; Schneider, M.; Wolter, M.; Michaelis, A. Recent insights into rate performance limitations of Li-ion batteries. Batter. Supercaps 2020, 4, 268–285. [Google Scholar] [CrossRef]
  47. Zhang, H.; Yang, Y.; Ren, D.; Wang, L.; He, X. Graphite as anode materials: Fundamental mechanism, recent progress and advances. Energy Storage Mater. 2021, 36, 147–170. [Google Scholar] [CrossRef]
  48. Gao, B.; Sinha, S.; Fleming, L.; Zhou, O. Alloy formation in nanostructured silicon. Adv. Mater. 2001, 13, 816–819. [Google Scholar] [CrossRef]
  49. Li, H.; Huang, X.; Chen, L.; Zhou, G.; Zhang, Z.; Yu, D.; Pei, N. The crystal structural evolution of nano-Si anode caused by lithium insertion and extraction at room temperature. Solid State Ion. 2000, 135, 181–191. [Google Scholar] [CrossRef]
  50. Limthongkul, P.; Jang, Y.I.; Dudney, N.J.; Chiang, Y.M. Electrochemically-driven solid-state amorphization in lithium-silicon alloys and implications for lithium storage. Acta Mater. 2003, 51, 1103–1113. [Google Scholar] [CrossRef]
  51. Yu, P.; Popov, B.N.; Ritter, J.A.; White, R.E. Lithium Diffusion in Graphite Carbon and Implications for the Rate Capability of Anodes. J. Electrochem. Soc. 1999, 146, 8–13. [Google Scholar] [CrossRef]
  52. Ding, N.; Xu, J.; Yao, Y.X.; Wegner, G.; Fang, X.; Chen, C.H.; Lieberwirth, I. Determination of the diffusion coefficient of lithium ions in nano-Si. Solid State Ion. 2009, 180, 222–225. [Google Scholar] [CrossRef]
  53. Liu, G.; Wang, D.; Zhang, J.; Kim, A.; Lu, W. Preventing dendrite growth by a soft piezoelectric material. ACS Mater. Lett. 2019, 1, 498–505. [Google Scholar] [CrossRef]
  54. Sagane, F.; Shimokawa, R.; Sano, H.; Sakaebe, H.; Iriyama, Y. In-situ scanning electron microscopy observations of Li plating and stripping reactions at the lithium phosphorus oxynitride glass electrolyte/Cu interface. J. Power Sources 2013, 225, 245–250. [Google Scholar] [CrossRef]
  55. Gireaud, L.; Grugeon, S.; Laruelle, S.; Yrieix, B.; Tarascon, J.M. Lithium metal stripping/plating mechanisms studies: A metallurgical approach. Electrochem. Commun. 2006, 8, 1639–1645. [Google Scholar] [CrossRef]
  56. Flügel, M.; Richter, K.; Wohlfahrt-Mehrens, M.; Waldmann, T. Detection of Li deposition on Si/Graphite anodes from commercial Li-ion cells: A post-mortem GD-OES depth profiling study. J. Electrochem. Soc. 2022, 169, 050533. [Google Scholar] [CrossRef]
  57. Chang, H.J.; Trease, N.M.; Ilott, A.J.; Zeng, D.; Du, L.S.; Jerschow, A.; Grey, C.P. Investigating Li microstructure formation on Li anodes for lithium batteries by in situ 6Li/7Li NMR and SEM. J. Phys. Chem. C 2015, 119, 16443–16451. [Google Scholar] [CrossRef]
  58. Leskes, M.; Kim, G.; Liu, T.; Michan, A.L.; Aussenac, F.; Dorffer, P.; Paul, S.; Grey, C.P. Surface-sensitive NMR detection of the solid electrolyte interphase layer on reduced graphene oxide. J. Phys. Chem. Lett. 2017, 8, 1078–1085. [Google Scholar] [CrossRef] [PubMed]
  59. Flügel, M.; Bolsinger, M.; Marinaro, M.; Knoblauch, V.; Hölzle, M.; Wohlfahrt-Mehrens, M.; Waldmann, T. Onset shift of Li plating on Si/Graphite anodes with increasing Si content. J. Electrochem. Soc. 2023, 170, 060536. [Google Scholar] [CrossRef]
  60. Koleti, U.R.; Zhang, C.; Dinh, T.Q.; Marco, J.; Amietszajew, T.; Malik, R. A new concept to improve the lithium plating detection sensitivity in lithium-ion batteries. Int. J. Smart Grid Clean Energy 2019, 8, 505–516. [Google Scholar] [CrossRef]
  61. Schindler, S.; Bauer, M.; Petzl, M.; Danzer, M.A. Voltage relaxation and impedance spectroscopy as in-operando methods for the detection of lithium plating on graphitic anodes in commercial lithium-ion cells. J. Power Sources 2016, 304, 170–180. [Google Scholar] [CrossRef]
  62. Brown, D.E.; McShane, E.J.; Konz, Z.M.; Knudsen, K.B.; McCloskey, B.D. Detecting onset of lithium plating during fast charging of Li-ion batteries using operando electrochemical impedance spectroscopy. Cell Rep. Phys. Sci. 2021, 2, 100589. [Google Scholar] [CrossRef]
  63. von Lüders, C.; Zinth, V.; Erhard, S.V.; Osswald, P.J.; Hofmann, M.; Gilles, R.; Jossen, A. Lithium plating in lithium-ion batteries investigated by voltage relaxation and in situ neutron diffraction. J. Power Sources 2017, 342, 17–23. [Google Scholar] [CrossRef]
  64. Zinth, V.; von Lüders, C.; Hofmann, M.; Hattendorff, J.; Buchberger, I.; Erhard, S.; Gilles, R. Lithium plating in lithium-ion batteries at sub-ambient temperatures investigated by in situ neutron diffraction. J. Power Sources 2014, 271, 152–159. [Google Scholar] [CrossRef]
  65. Senyshyn, A.; Mühlbauer, M.J.; Dolotko, O.; Ehrenberg, H. Low-temperature performance of Li-ion batteries: The behavior of lithiated graphite. J. Power Sources 2015, 282, 235–240. [Google Scholar] [CrossRef]
  66. II, R.E.G.; Klingler, R.J.; Sandí, G.; Johnson, C.S.; Scanlon, L.G.; Rathke, J.W. 7Li NMR study of intercalated lithium in curved carbon lattices. J. Power Sources 2000, 89, 237–243. [Google Scholar]
  67. Hsieh, Y.-C.; Leißing, M.; Nowak, S.; Hwang, B.-J.; Winter, M.; Brunklaus, G. Quantification of dead lithium via in situ nuclear magnetic resonance spectroscopy. Cell Rep. Phys. Sci. 2020, 1, 100139. [Google Scholar] [CrossRef]
  68. Wandt, J.; Marino, C.; Gasteiger, H.A.; Jakes, P.; Eichel, R.A.; Granwehr, J. Operando electron paramagnetic resonance spectroscopy–formation of mossy lithium on lithium anodes during charge–discharge cycling. Energy Environ. Sci. 2015, 8, 1358–1368. [Google Scholar] [CrossRef]
  69. Petzl, M.; Danzer, M.A. Nondestructive detection, characterization, and quantification of lithium plating in commercial lithium-ion batteries. J. Power Sources 2014, 254, 80–87. [Google Scholar] [CrossRef]
  70. Wang, X.; Li, C.; Liu, S.; Sun, Y. Revealing the overlithiation effect on cycling and calendar aging of a silicon/graphite electrode for high-energy lithium-ion batteries. Chem. Sci. 2024, 15, 17979–17987. [Google Scholar] [CrossRef]
  71. Waldmann, T.; Wohlfahrt-Mehrens, M. Effects of rest time after Li plating on safety behavior—ARC tests with commercial high-energy 18650 Li-ion cells. Electrochim. Acta 2017, 230, 454–460. [Google Scholar] [CrossRef]
  72. Tao, J.; Liu, L.; Han, J.; Peng, J.; Chen, Y.; Yang, Y.; Lin, Y. New perspectives on spatial dynamics of lithiation and lithium plating in graphite/silicon composite anodes. Energy Storage Mater. 2023, 60, 102809. [Google Scholar] [CrossRef]
  73. Cheng, Z.; Li, Y.; Sun, Q.; Yang, R.; Zhang, Q.; Xu, Y. Fundamental understanding and facing challenges in structural design of porous Si-based anodes for lithium-ion batteries. Adv. Funct. Mater. 2023, 33, 2301109. [Google Scholar] [CrossRef]
  74. Chen, Y.; Torres-Castro, L.; Chen, K.H.; Penley, D.; Lamb, J.; Karulkar, M.; Dasgupta, N.P. Operando detection of Li plating during fast charging of Li-ion batteries using incremental capacity analysis. J. Power Sources 2022, 539, 231601. [Google Scholar] [CrossRef]
  75. Arora, P.; Doyle, M.; White, R.E. Mathematical modeling of the lithium deposition overcharge reaction in lithium-ion batteries using carbon-based negative electrodes. J. Electrochem. Soc. 1999, 146, 3543–3553. [Google Scholar] [CrossRef]
  76. Chang, H.J.; Ilott, A.J.; Trease, N.M.; Mohammadi, M.; Jerschow, A.; Grey, C.P. Correlating microstructural lithium metal growth with electrolyte salt depletion in lithium batteries using 7Li MRI. J. Am. Chem. Soc. 2015, 137, 15209–15216. [Google Scholar] [CrossRef]
  77. Yang, X.G.; Ge, S.; Liu, T.; Leng, Y.; Wang, C.Y. A look into the voltage plateau signal for detection and quantification of lithium plating in lithium-ion cells. J. Power Sources 2018, 395, 251–261. [Google Scholar] [CrossRef]
  78. Obrovac, M.N.; Christensen, L. Structural changes in silicon anodes during lithium insertion/extraction. Electrochem. Solid-State Lett. 2004, 7, A93–A96. [Google Scholar] [CrossRef]
  79. Song, W.; Chae, O.B. Surface-Coating Strategies of Si-Negative Electrode Materials in Lithium-Ion Batteries. Batteries 2024, 10, 327. [Google Scholar] [CrossRef]
  80. McDowell, M.T.; Lee, S.W.; Nix, W.D.; Cui, Y. Understanding the lithiation of silicon and other alloying anodes for lithium-ion batteries. Adv. Mater. 2013, 25, 4966–4985. [Google Scholar] [CrossRef]
  81. Sitinamaluwa, H.S.; Lee, M.V.; Lee, H.W.; Chen, Y.; Dasgupta, N.P. Lithium concentration dependent structure and mechanics of amorphous silicon. J. Appl. Phys. 2016, 119, 245102. [Google Scholar] [CrossRef]
  82. Wang, X.; Lee, H.; Chen, Y.; Dasgupta, N.P. High damage tolerance of electrochemically lithiated silicon. Nat. Commun. 2015, 6, 8417. [Google Scholar] [CrossRef] [PubMed]
  83. Zhou, D.; Liu, Z.; Lv, X.; Zhou, G.; Yin, J. Electrochemical studies of LiB compound as anode material for lithium-ion battery. Electrochim. Acta 2006, 51, 5731–5737. [Google Scholar] [CrossRef]
  84. Morita, T.; Takami, N. Characterization of oxidized boron-doped carbon fiber anodes for Li-ion batteries by analysis of heat of immersion. Electrochim. Acta 2004, 49, 2591–2599. [Google Scholar] [CrossRef]
  85. Funabiki, A.; Inaba, M.; Ogumi, Z. A.c. impedance analysis of electrochemical lithium intercalation into highly oriented pyrolytic graphite. J. Power Sources 1997, 68, 227–231. [Google Scholar] [CrossRef]
  86. Li, J.; Murphy, E.; Winnick, J.; Kohl, P.A. Studies on the cycle life of commercial lithium ion batteries during rapid charge–discharge cycling. J. Power Sources 2001, 102, 294–301. [Google Scholar] [CrossRef]
  87. Tanim, T.R.; Dufek, E.J.; Dickerson, C.C.; Wood, S.M. Electrochemical quantification of lithium plating: Challenges and considerations. J. Electrochem. Soc. 2019, 166, A2689–A2696. [Google Scholar] [CrossRef]
  88. Zhu, Y.; Yan, L.; Han, S.; Gu, M.; Ma, S.; Luo, Y.; Meng, A.; Zhao, C.; Xie, J.; Yang, C.; et al. In situ lithium plating monitor for lithium-ion batteries enabled by operando pressure detection. J. Power Sources 2025, 631, 236281. [Google Scholar] [CrossRef]
Figure 1. First-cycle charge–discharge profiles of single and composite electrodes: (a) graphite (Gr), (b) silicon (Si), (c) 1Gr–1Si, (d) 2Gr–1Si, and (e) 1Gr–2Si.
Energies 18 03423 g001
Figure 2. (a) Potential profile (black arrow) and corresponding differential curve (red arrow) of the Gr half-cell charged at a 4 C-rate as a function of the state of charge (SoC). Inset: magnified view of the dotted region. The green dashed line in the main figure and the red dashed line in the inset indicate where dV/dSoC = 0. Regions A and B correspond to the pre-SoC and post-SoC regions, respectively, based on the minimum value (see text for details). (b) Open-circuit potential relaxation curve (black arrow) and corresponding differential curve (red arrow). (c) Potential profiles and (d) corresponding differential curves as functions of the SoC at various C-rates (4 C to 14 C). Inset in (d): magnified view of the dotted region.
Energies 18 03423 g002
Figure 3. (a) Potential profile (black arrow) and corresponding differential curve (red arrow) of the Si half-cell charged at a 4 C-rate as a function of the SoC. Inset: magnified view of the dotted region. Regions A and B correspond to the pre-SoC and post-SoC regions, respectively, based on the minimum value (see text for details). (b) Open-circuit potential relaxation curve (black arrow) and corresponding differential curve (red arrow). Inset: open-circuit potential relaxation curves at low C-rates, illustrating cases without lithium plating. Blue dashed line marks the time of the inflection point. (c) Potential profiles and (d) corresponding differential curves as functions of the SoC at various C-rates (4 C to 14 C). Blue dashed arrow in (c): change in Smin,Si with increasing C-rate. Inset in (d): magnified view of the dotted region.
Energies 18 03423 g003
Figure 4. Relationship between Smin and C-rate for Gr (black squares) and Si (red circles) electrodes.
Energies 18 03423 g004
Figure 5. Nyquist plots of Gr (black squares) and Si (red circles) electrodes. Upper left inset: equivalent circuit used for impedance analysis. Upper right inset: magnified view of the Gr electrode’s Nyquist plot within the dotted region.
Energies 18 03423 g005
Figure 6. (a) Equivalent circuit model for the Gr–Si composite electrode. (bd) Estimated Smin as a function of the C-rate for the Gr and Si components in hypothetical composite electrodes: (b) 1Gr–1Si, (c) 2Gr–1Si, and (d) 1Gr–2Si.
Energies 18 03423 g006
Figure 7. Potential profiles of actual Gr–Si composite electrodes as functions of the SoC at various C-rates: (a) 1Gr–1Si, (b) 2Gr–1Si, (c) 1Gr–2Si.
Energies 18 03423 g007
Figure 8. Experimental Smin as a function of the C-rate for actual Gr–Si composite electrodes (solid squares), along with the estimated Smin for the Gr (red dotted lines) and Si (blue dotted lines) components in hypothetical composite electrodes: (a) 1Gr–1Si, (b) 2Gr–1Si, (c) 1Gr–2Si.
Energies 18 03423 g008
Table 1. Resistance component values obtained from fitting, along with corresponding fitting reliability (chi-squared values).
R o h m (Ω) R S E I (Ω) R c t (Ω) R i n t f   = R S E I + R c t (Ω)Chi-Squared (χ2)
Gr1.72.173.966.135.87 × 10−5
Si2.63.221.624.82.27 × 10−4
Disclaimer/Publisher’s Note: The statements, opinions and data contained in all publications are solely those of the individual author(s) and contributor(s) and not of MDPI and/or the editor(s). MDPI and/or the editor(s) disclaim responsibility for any injury to people or property resulting from any ideas, methods, instructions or products referred to in the content.

