Abstract
Traditional coal-fired power units are required to improve their operational flexibility to accommodate increasing renewable energy. In this paper, an optimized operation approach of the cold-end system is proposed to improve the flexibility of coal-fired power units. The dynamic models of the cold-end system of a 330 MW coal-fired power unit are developed. The model validation results show that the error between the simulated results and measured values is <3% at the common load range and <5% at the low load range. The applications of cold-end optimization in the load-variation processes with ±3% Pe/min ramps and actual automatic generation control (AGC) response are then studied. The results show that when the back pressure of the unit is relatively low, the cold-end optimization is more effective in improving the ramp-down rate. On the contrary, when the unit operates with relatively high back pressure, this approach is more suitable for improving the ramp-up rate. Moreover, the AGC response quality is noticeably enhanced, which improves the phenomenon of overshooting and reverse regulation. The comprehensive performance indicator KP increased from 2.27 to 4.63 in the summer scenario, while it increased from 2.08 to 4.34 in the winter scenario. Moreover, the profits under the two scenarios are raised by 39.2% and 42.5%, respectively. The findings of this study are also applicable to supercritical units or other power units with the cold end adopting similar water cooling systems. Future work will incorporate advanced control theories to enhance control robustness, which is critical for the practical implementation of the proposed cold-end optimization approach.
1. Introduction
The 14th Five-Year Plan for renewable energy development issued by the National Energy Administration of China in 2022 states that it will accelerate the green and low-carbon transformation of energy, and promote the evolution of the power system in the direction of adapting to large-scale and high-percentage renewable energy sources. By the end of 2023, the installed capacity of solar power and wind power in China reached 609 million kilowatts and 441 million kilowatts, respectively, an increase of 55.2% and 20.7% compared with 2022 [1]. Moreover, by the end of 2024, the cumulative installed capacity of China’s renewable energy reached 1.889 billion kilowatts, a 25% increase from the previous year [2]. Due to the characteristics of solar power and wind power, i.e., volatility and randomness, the demand for flexibility in grid load regulation has grown rapidly in recent years [3]. With the increasing penetration of renewable energy, not only is the peak-shaving operation of power units necessary, the need to increase load is equally prominent. Therefore, tapping the load-adjustment flexibility of coal-fired power units, which currently account for the largest share in northern China, is the key to achieving the transformation of China’s energy structure [4].
Currently, power-to-heat [5] and flexibility retrofit technologies [6] are used during the heating season to increase the flexibility of coal-fired units. However, in summer, the efficacy of these technologies to enhance the load-adjustment flexibility of power units is weakened, especially for enhancing the unit’s load-increase capacity. In addition, optimizing the heating load distribution of a combined heat and power (CHP) unit can achieve the lowest total output power of the whole unit, which in turn expands the operational flexibility at the unit level. Moreover, integrating compressed air energy storage (CAES) or molten salt thermal energy storage (TES) into CHP units enlarges the operation region of coal-fired CHP units, which has been studied in the past years. Li et al. [7] proposed a CHP-CAES system, where the condensation water was used to absorb the compression heat. The results showed that the minimum load ratio could be decreased by 11.7%. Wang et al. [8] designed a CHP-CAES system based on the district heating network. They reported that the feasible minimum load was reduced by 2%. Zhang et al. [9] proposed a CHP system integrated with a molten salt TES, where the main steam and the flue gas were used to heat the molten salt. The minimum load ratio of the power unit was reduced from 30% to 14.5%. Miao et al. [10] found that the combination of molten salt TES and P2H could achieve a power unit’s zero power output. However, the enhancement of the power unit’s flexibility by molten TES is limited by the maximum steam flow of the steam turbine. That is, when the unit reaches its 100% load, no further load enhancement is possible. Although the above-mentioned flexibility technologies can enhance the flexibility of coal-fired units, their real-world applications remain limited due to the high investment costs and control complexities in system integration. In contrast, advanced control approaches, such as the condensate throttling [11], high-pressure extraction steam throttling [12], and feedwater active regulation [13], also demonstrate potential to improve the flexibility of power units. However, the above-mentioned control methods are prone to transiently affecting the safe operation of the regeneration system and boiler, thus limiting their engineering applications. Therefore, there is an urgent need to explore a flexibility enhancement technology with lower cost and high safety assurance.
The condenser is the main heat transfer equipment at the cold-end system of the power unit, and the back pressure affects the output power. Indeed, the back pressure of the inland coal-fired power unit varies greatly within a year due to the seasonal ambient temperature, which affects the operational economy and the dynamic characteristics of load-adjustment processes to a certain extent. In recent years, many works have been performed on optimizing the cold-end operation. In ref. [14], an artificial neural network and a hybrid improved particle swarm algorithm were used to optimize the operation condition of the circulating water pump. The results showed the output power of the 330 MW coal-fired power unit increased by 35 to 1423 kW in different seasons. Naderi et al. [15] optimized the cold-end operation using the modified whale algorithm with the objective function of minimum water consumption, and the water consumption was reduced by 556 m3/kWh. Wang et al. [16] determined the optimal operation mode of a circulating water pump for a 330 MW unit through the thermodynamic experiment, and the coal consumption of the power generation was reduced by 0.42 g/kWh. However, all of the above studies aimed at increasing the unit’s output power in order to improve the operational economy. More importantly, their studies were based on steady-state models and could only disclose the power increment achieved by optimizing the cold-end operation, failing to reveal the dynamic characteristics of power over time. Therefore, it is necessary to develop the dynamic models of the cold-end systems in power units to illustrate the transient characteristics. Wang et al. [17,18] developed the dynamic model of the condenser and proposed a condenser cooling water control system. They reported that the turbine power load was rapidly improved by 0.26–0.68% without wasting too much coal. Moreover, Li et al. [19] investigated the dynamic power change curves and the energy consumption of a 350 MW power unit under various ramp rates based on a dynamic mode of the cold-end system.
This literature review shows that cold-end operation optimization could increase the output power and improve the economic performance of the power unit. However, the findings in refs. [14,15,16] were obtained based on steady-state models and failed to reveal the dynamic response characteristics of the output power. Although some studies [17,18,19] have addressed the dynamic modeling of the cold-end system, it is still unknown how to utilize the dynamic characteristics of the cold-end system to improve the unit’s response efficacy to automatic generation control (AGC) commands and benefit from the power ancillary services market. Therefore, to fill this knowledge gap, this study investigated the application feasibility of the cold-end optimization to improve the power unit’s flexibility in AGC response. Firstly, a dynamic model of the cold-end system of a coal-fired power unit is developed and validated. Next, the load-adjustment strategy based on the optimization of the cold-end operation was proposed. The improvement effect of this strategy on the ramp rate and AGC response efficacy was then quantified. Although subcritical coal-fired units generally have lower efficiency than supercritical ones, they remain a typical type of thermal power unit in China, accounting for over one-third of the total thermal power unit capacity. Therefore, while this study focuses on a 330 MW subcritical coal-fired power unit, the findings are transferable to supercritical units or other capacity power units with the cold end adopting similar water cooling systems. This study provides deep insights and transferable ideas for improving the ramp rate and the accuracy of AGC responses of coal-fired power units.
2. Thermodynamic Model
2.1. System Description
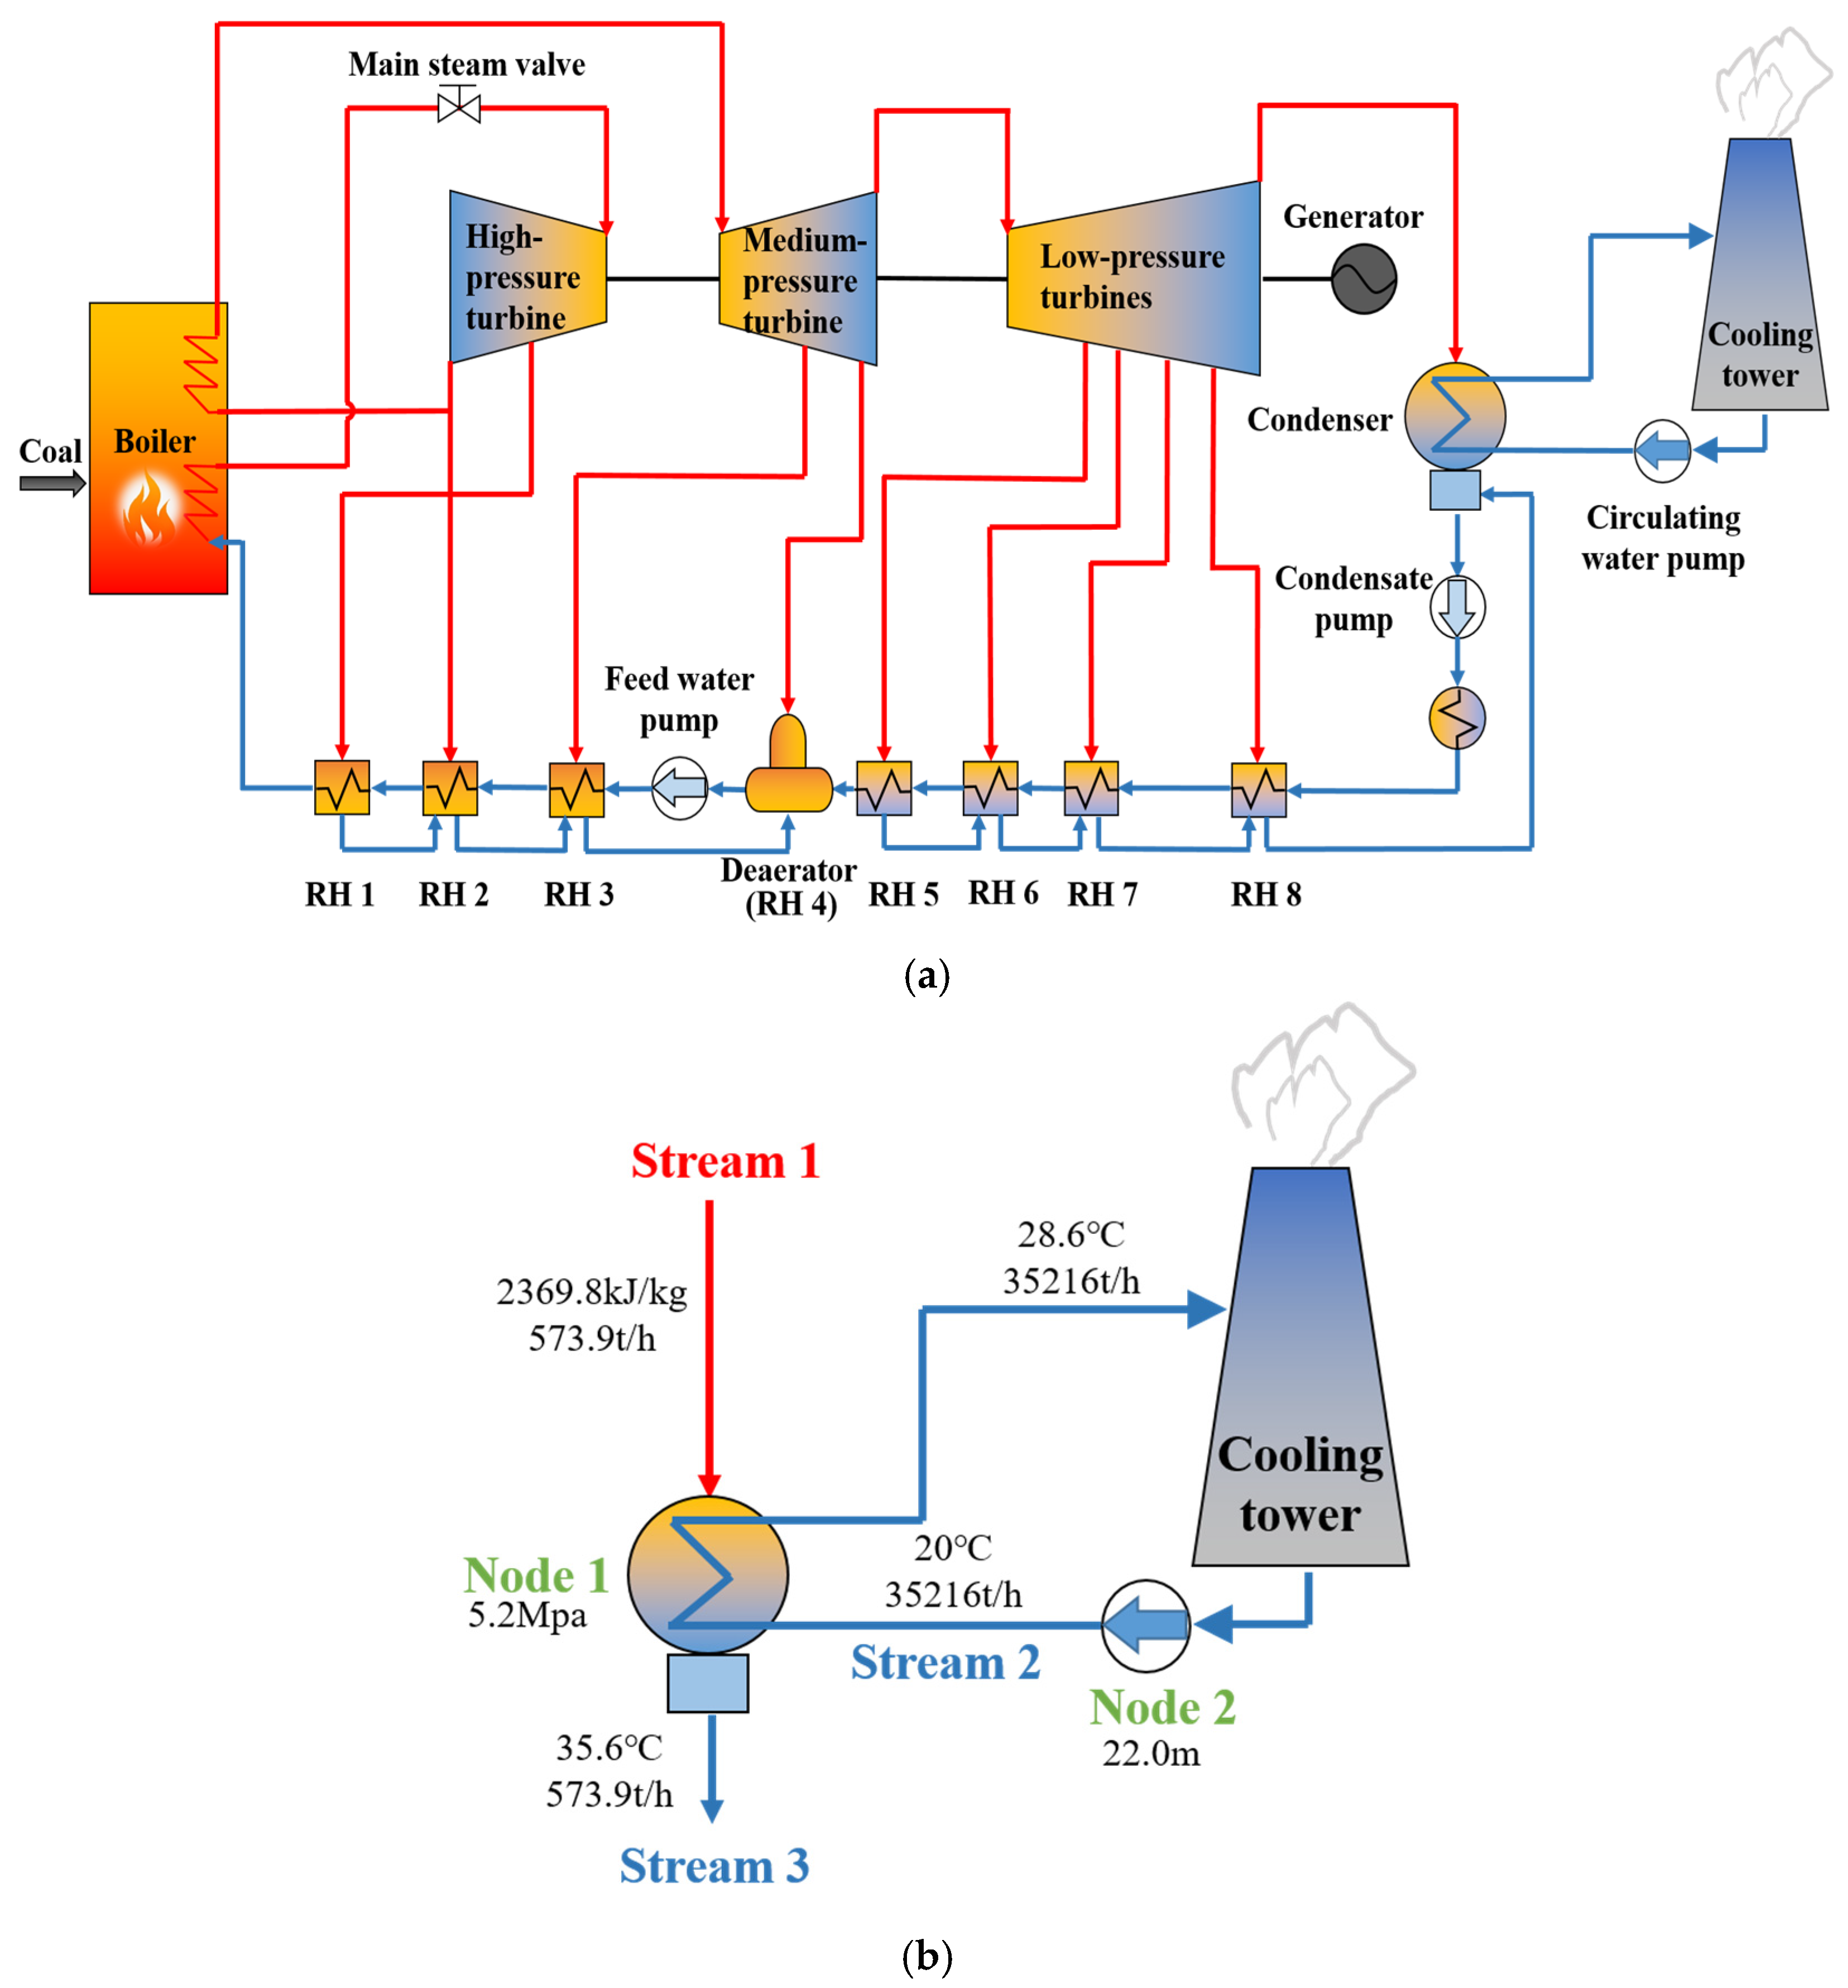
This study focuses on a typical 330 MW subcritical coal-fired power unit, which is common in China. The sketch of the reference power unit is shown in Figure 1. For this power unit, the design temperatures of both the main steam and the reheat steam are 537 °C. The design pressures of the main steam and the reheat steam are 16.7 MPa and 3.2 MPa, respectively. The design of the main steam flow rate is 1002.4 t/h. The main design parameters of the cold-end system of this power unit are shown in Table 1.
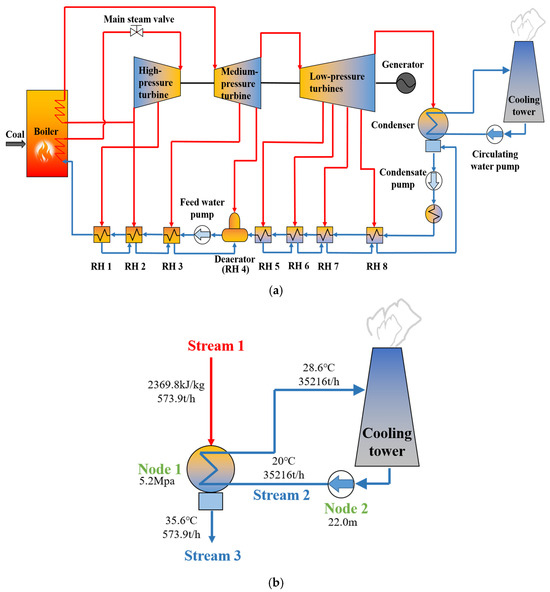
Figure 1.
Sketch of the reference power unit. (a) The thermodynamic system of the reference power unit. (b) The sketch and parameters of the cold-end system.

Table 1.
Design parameters of the cold-end system.
2.2. Model Development of the Cold-End System
2.2.1. Model of the Condenser
For the steady-state model, the heat transfer equations inside the condenser are shown as follows [17]:
where and are the mass flow rates of the exhaust steam and the circulating water, t/h; is the enthalpy of exhaust steam, kJ/kg; is the specific heat capacity of water, kJ/(kg·°C); is the saturation temperature of the steam in the condenser; and and are the inlet and outlet temperatures of the circulating water in the condenser, °C, respectively. The difference between and is defined as the end difference of the condenser, which is taken as 5.7 °C, according to the design data.
In contrast to the steady-state model, the dynamic model considers the influence of the thermal inertia in the condenser on the heat transfer process. The following assumptions are proposed [20]. (a) The metal wall temperature is calculated using the lumped parameter method. (b) The compressibility of the water and the heat loss of the condenser are neglected. The above assumption ignores the internal heat conduction between the metal walls of the condenser, which may lead to an overestimation of the heat transfer rate.
The heat transfer equations inside the condenser during the dynamic processes are shown as follows:
The exhaust steam side:
The circulating water side:
The metal wall:
where is the mass, is the heat transfer coefficient, and is the heat transfer area. The subscripts of are the steam, water, and the metal wall, respectively. Moreover, is the heat released by the metal wall to the circulating water, and is the heat absorbed by the metal wall from the steam. Specifically, denote the heat transfer coefficient of the condensation process, which is determined using Nusselt correlations [21], and denotes the heat transfer coefficient of the forced convection within the tubes, which can be determined using Gnielinski correlations [22].
The saturation temperature of the condenser can be calculated using A.B. Chebyshev’s experiment equations [17]:
where is the back pressure, kPa.
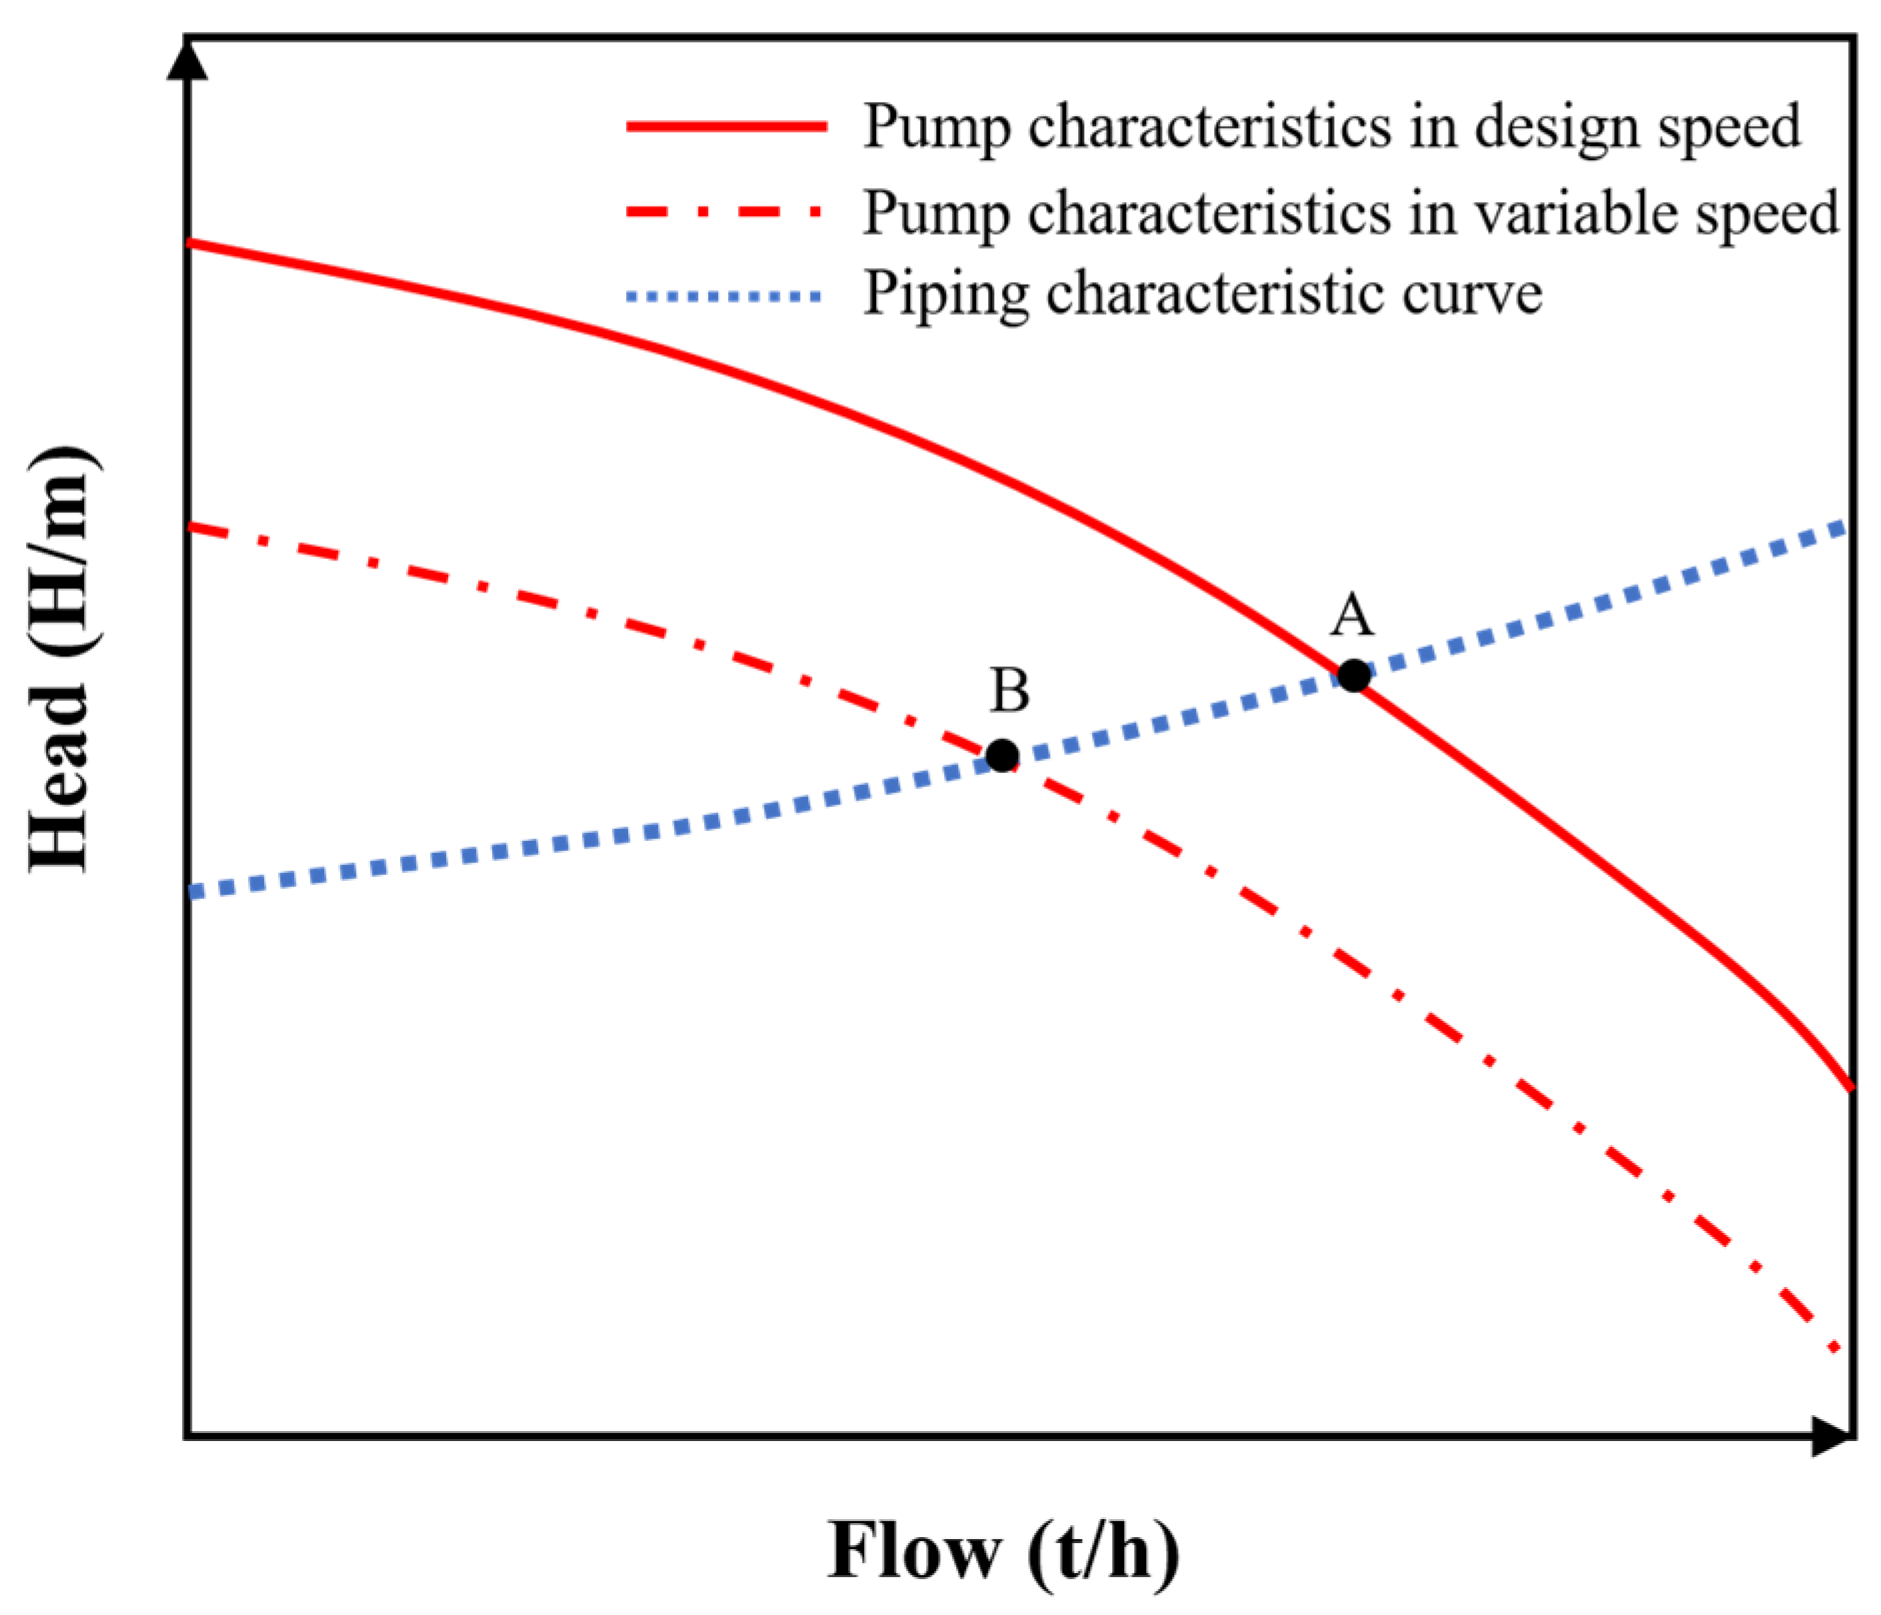
2.2.2. Model of the Circulating Water Pump
The circulating water pump of the reference power unit is a variable frequency pump, and the intersection of its operating characteristic curve and its piping characteristic curve is the pump’s working point, as shown in Figure 2. The operating characteristic curve and the piping characteristic curve can be expressed by Equations (8) and (9), respectively [17]:
where is the pump head, m; is the mass flow rate of the pump, m3/h; and are the total resistance head and static head, m; and are constants determined by the characteristics of the pump and pipeline, which are obtained by fitting experimental data.
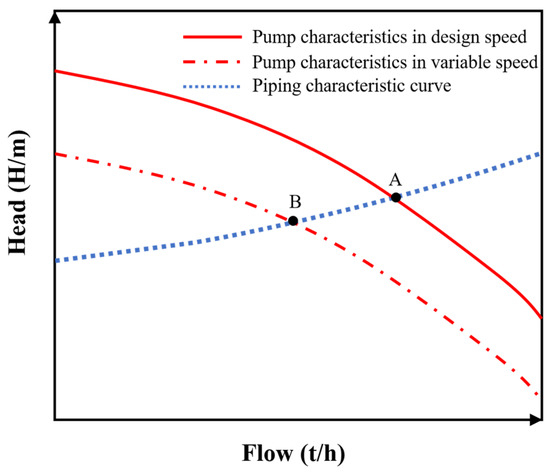
Figure 2.
The operating point of the pump under the off-design condition.
As shown in Figure 2, according to the principle of similarity, the head and flow rate of the off-design condition conform to Equation (10). The points of A and B in Figure 2 are the operating points of the pump under the design condition and off-design condition, respectively.
where is the mass flow rate of the pump under the off-design condition, m3/h; and is the speed ratio, i.e., the actual speed divided by the rated speed. Combining Equations (11) and (13), the operating characteristic curve of the circulating water pump under the off-design condition can be obtained [23]:
The power consumption of the pump can be calculated with
where is the density of water and is the gravitational acceleration, and η is the pump efficiency, which is determined by .
2.2.3. Effect of Back Pressure on Output Power
The influence of the cold-end system on the output power of the unit is reflected in the following two aspects. First, the change in back pressure affects the extracted steam flow into the regenerative heater 5 (RH 5) to RH 8 directly, which consequently alters the generated power in the low-pressure turbines. In addition, the change in circulating water flow affects the power consumed by the circulating water pump, i.e., the internal consumed power. The above two factors together affect the unit’s output power. In this study, the effect of the change in the back pressure on the output power is quantified, based on the steam–water balance equations [24] and the off-design calculation of the turbines.
After the change in back pressure, the steam extraction pressure of at each stage of the low-pressure turbine (RH 5 to RH 8) can be calculated from the Friuli Siegel formula [25]. In this study, the valid pressure range of Equation (13) is between 5.2 kPa and 13 kPa:
where is extraction steam pressure of the RH i; is the exhaust steam pressure; and is the maintained steam flow rate after extracting to RH i. The subscript of denotes the design condition.
The mass flow rate of the extracted steam into RH 5 to RH 8 can be calculated by:
where are the extraction steam enthalpy drop, the drainage water enthalpy drop, and the feedwater enthalpy rise of the RH i, respectively. More detailed information on Equation (14) is provided in our previous publication [24].
The change in the output power of the unit can then be calculated with
where indicates the output power increment due to the reduction in back pressure, which can be calculated through Equation (16); and denotes the pump power increment due to the reduction in back pressure:
where and are the enthalpy of exhaust steam before and after the change in back pressure. To further illustrate how back pressure influences unit output, a case study is presented in Appendix C for the reference of interested readers.
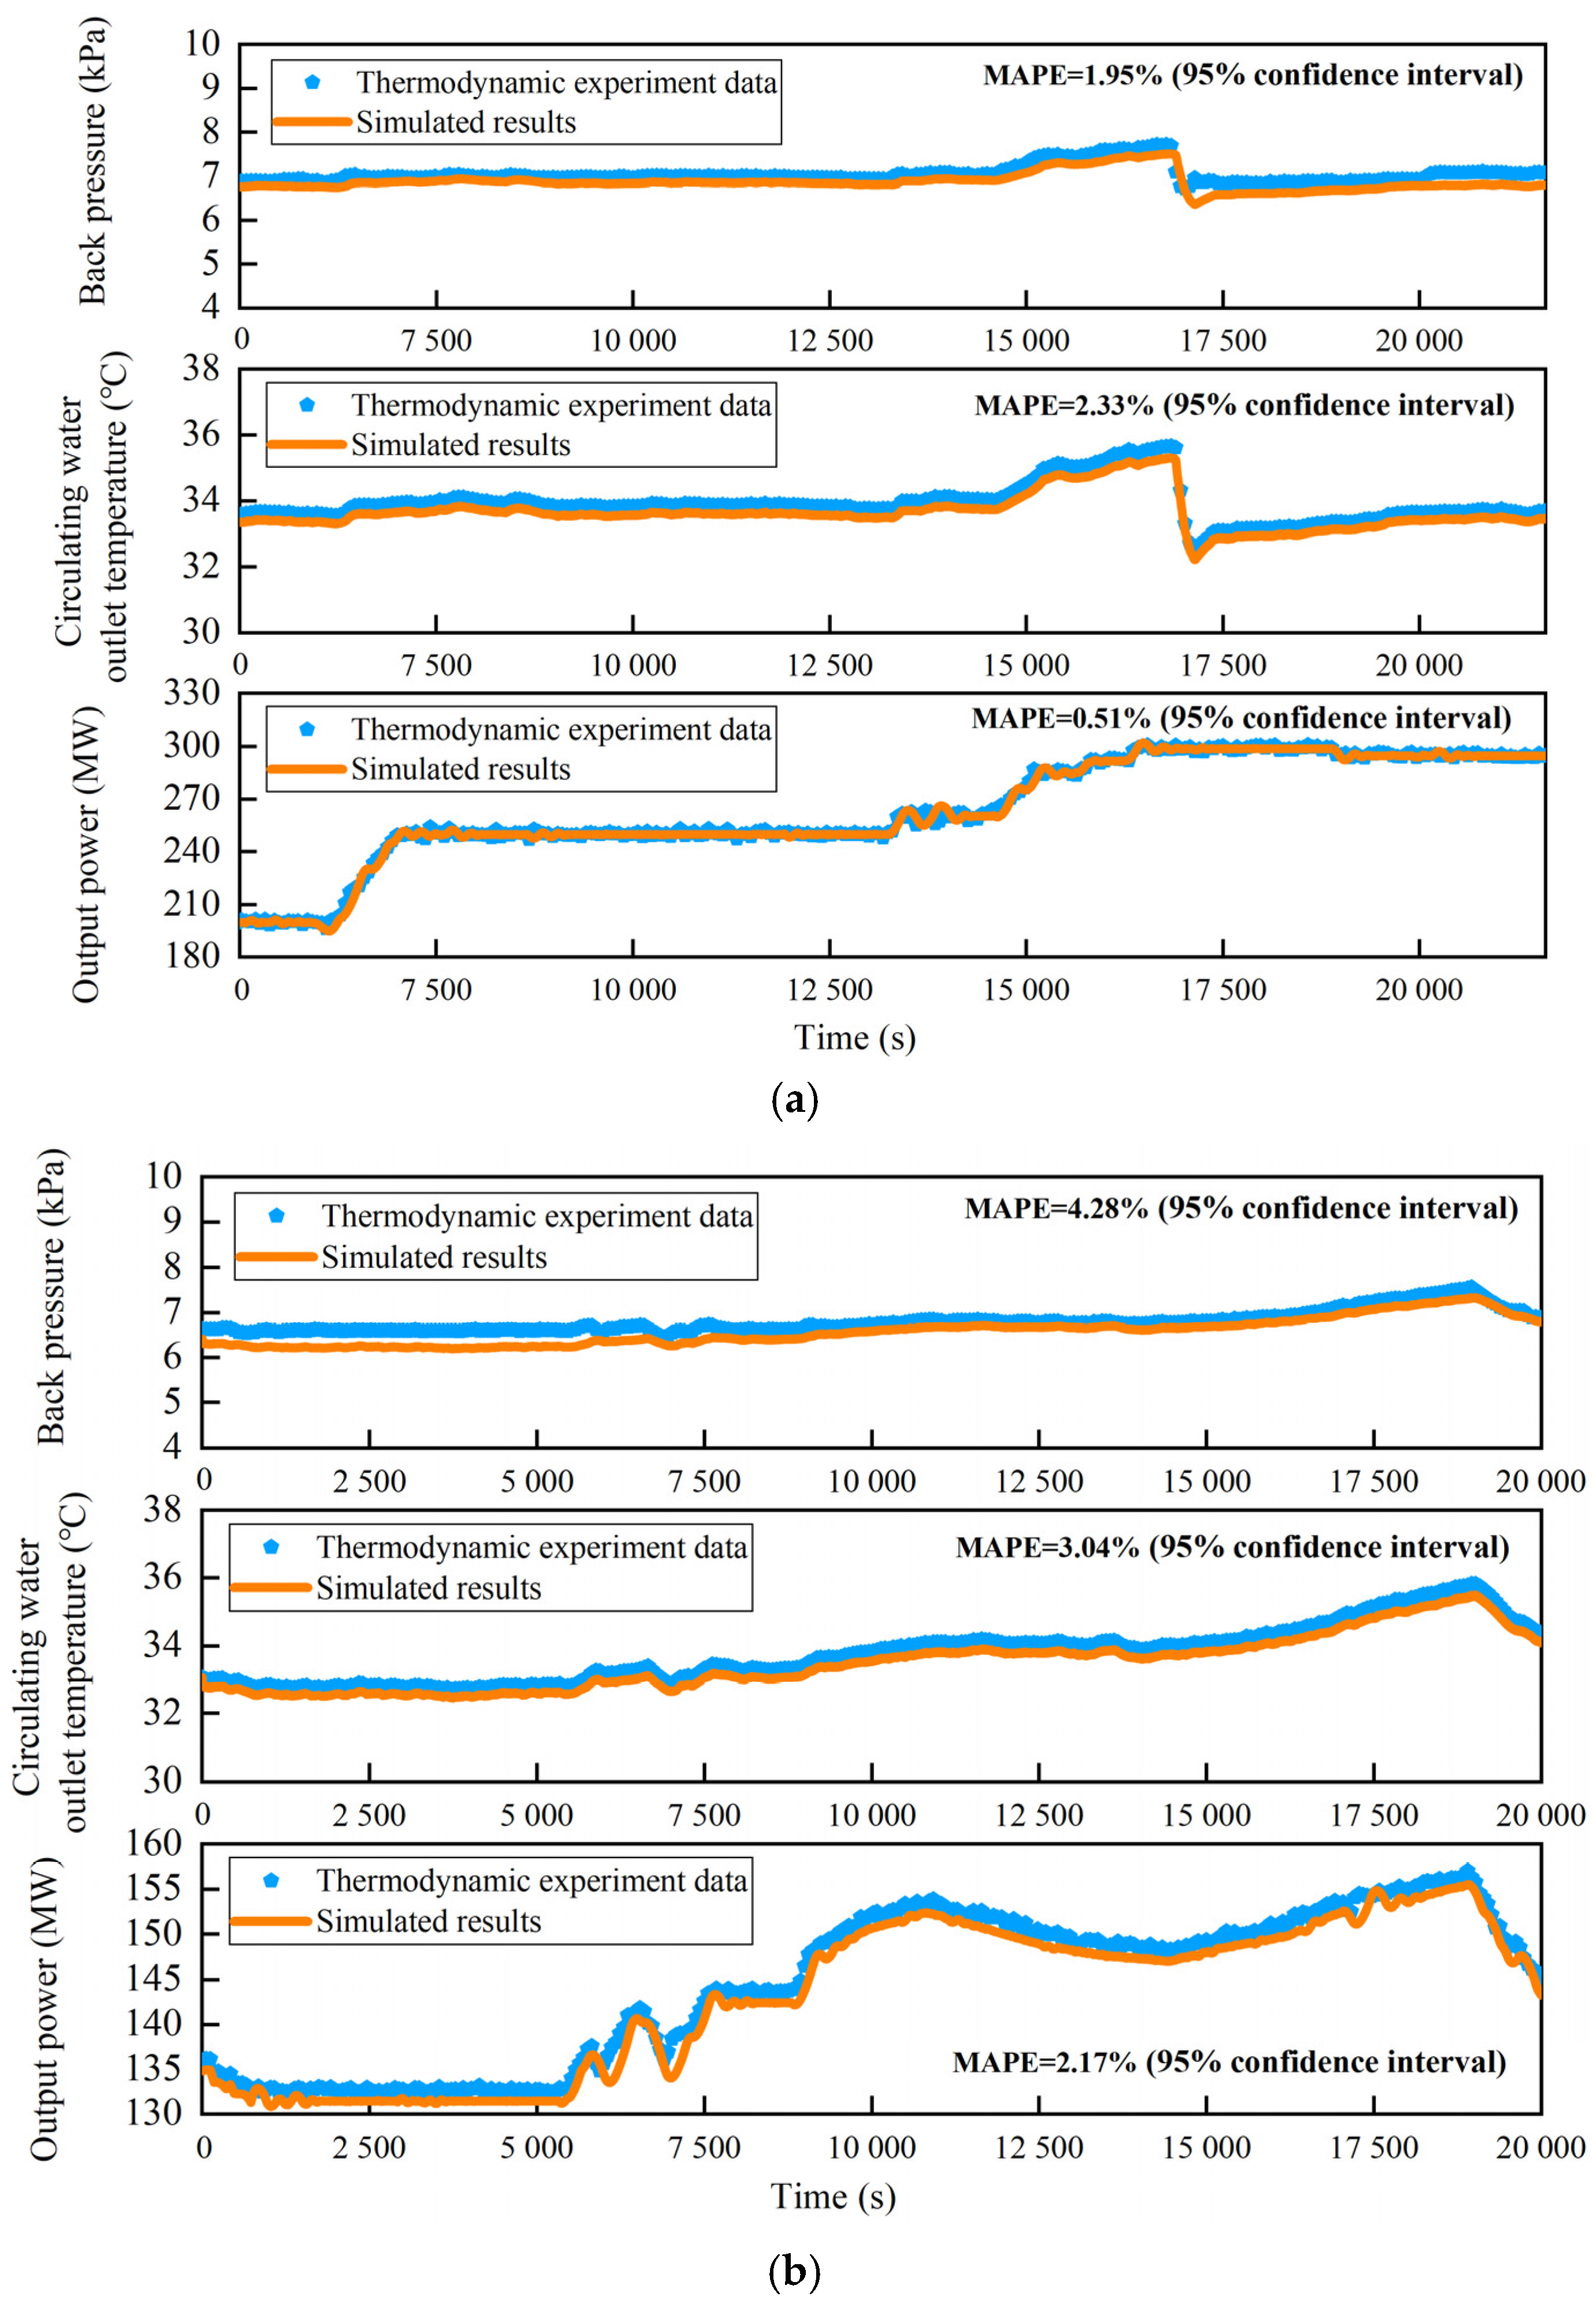
3. Model Validation
The dynamic model of the cold-end system of the 330 MW power unit is developed via MATLAB R2020a/Simulink. The simulated results of the unit’s back pressure, circulating water outlet temperature, and output power are compared with the measured data from a thermodynamic experiment, as shown in Figure 3. Model validation under two working conditions was carried out, namely the common load range (i.e., 50–90% load, as shown in Figure 3a) and the low load range (i.e., 30–50% load, as shown in Figure 3b). The experiment was conducted in April 2024, with the ambient temperature ranging from 20 to 25 °C. The time step of the simulation and the measured data is 30 s, and the duration of both conditions is 6 h. The mean absolute percentage error (MAPE) [26] was selected as the indicator to assess the precision of the proposed models.
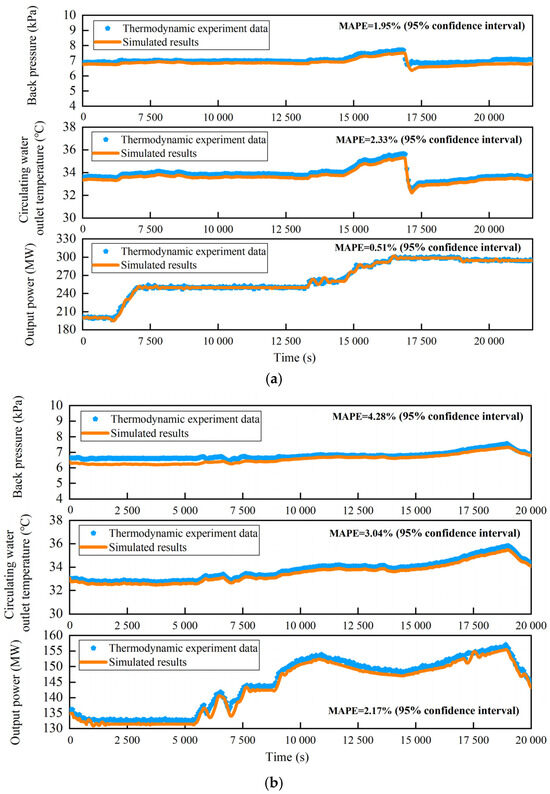
Figure 3.
Model validation results. (a) Common load range (50~90% load). (b) Low load range (30~50% load).
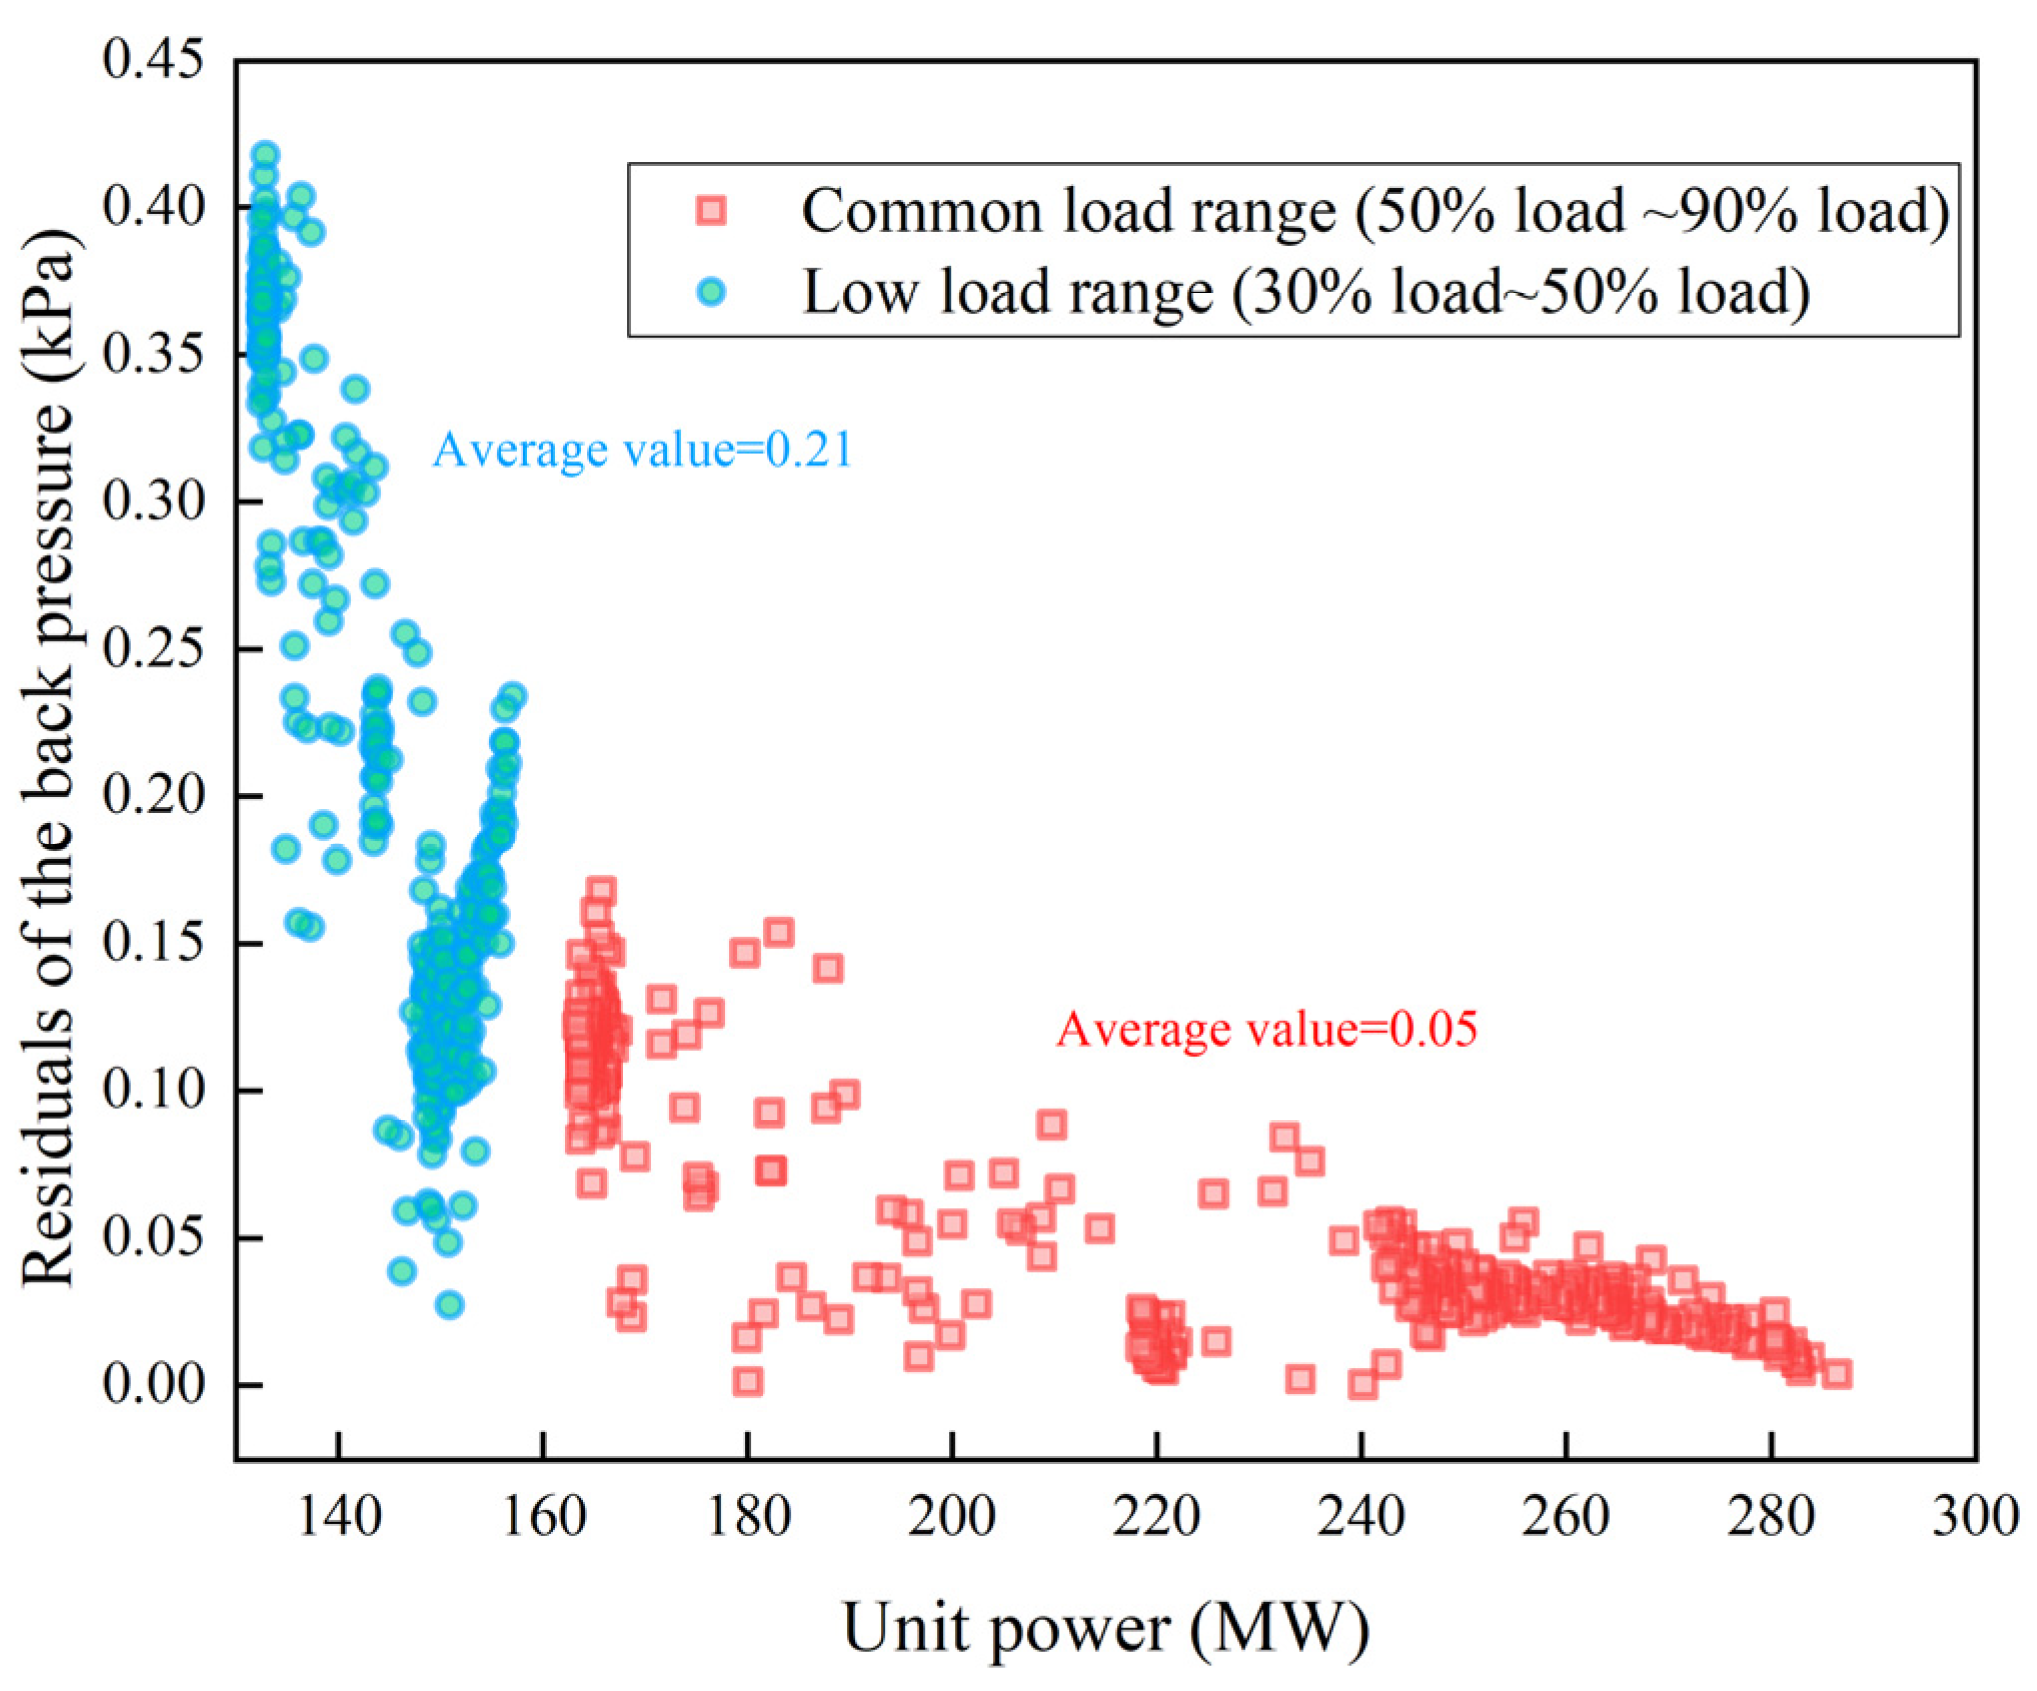
The results show that when the power unit operates at the common load range, the MAPEs of the unit’s back pressure, circulating water outlet temperature, and output power are 1.95%, 2.33% and 0.51%, respectively. In contrast, the MAPEs of the unit under the low load range are 4.28%, 3.04%, and 2.17%, respectively. The confidence intervals of all the MAPEs are 95%. It can be seen that the model error under low load is larger than that under high load, which is also reflected in the residual plot shown in Figure 4. The reason is that the model parameters are set according to the design conditions, and the error will inevitably increase under low load. Overall, the model error is within 5%, meeting the engineering requirements.

Figure 4.
Residual plots of the back pressure validation.
Moreover, from the foregoing results, the simulated back pressure is observed to be lower than the measured value. This discrepancy is due to the employment of a lumped parameter modeling approach, which overlooks the internal heat conduction through the metal wall of the condenser, thereby leading to an overestimation of the heat transfer rate during transient operations.
4. Results and Discussion
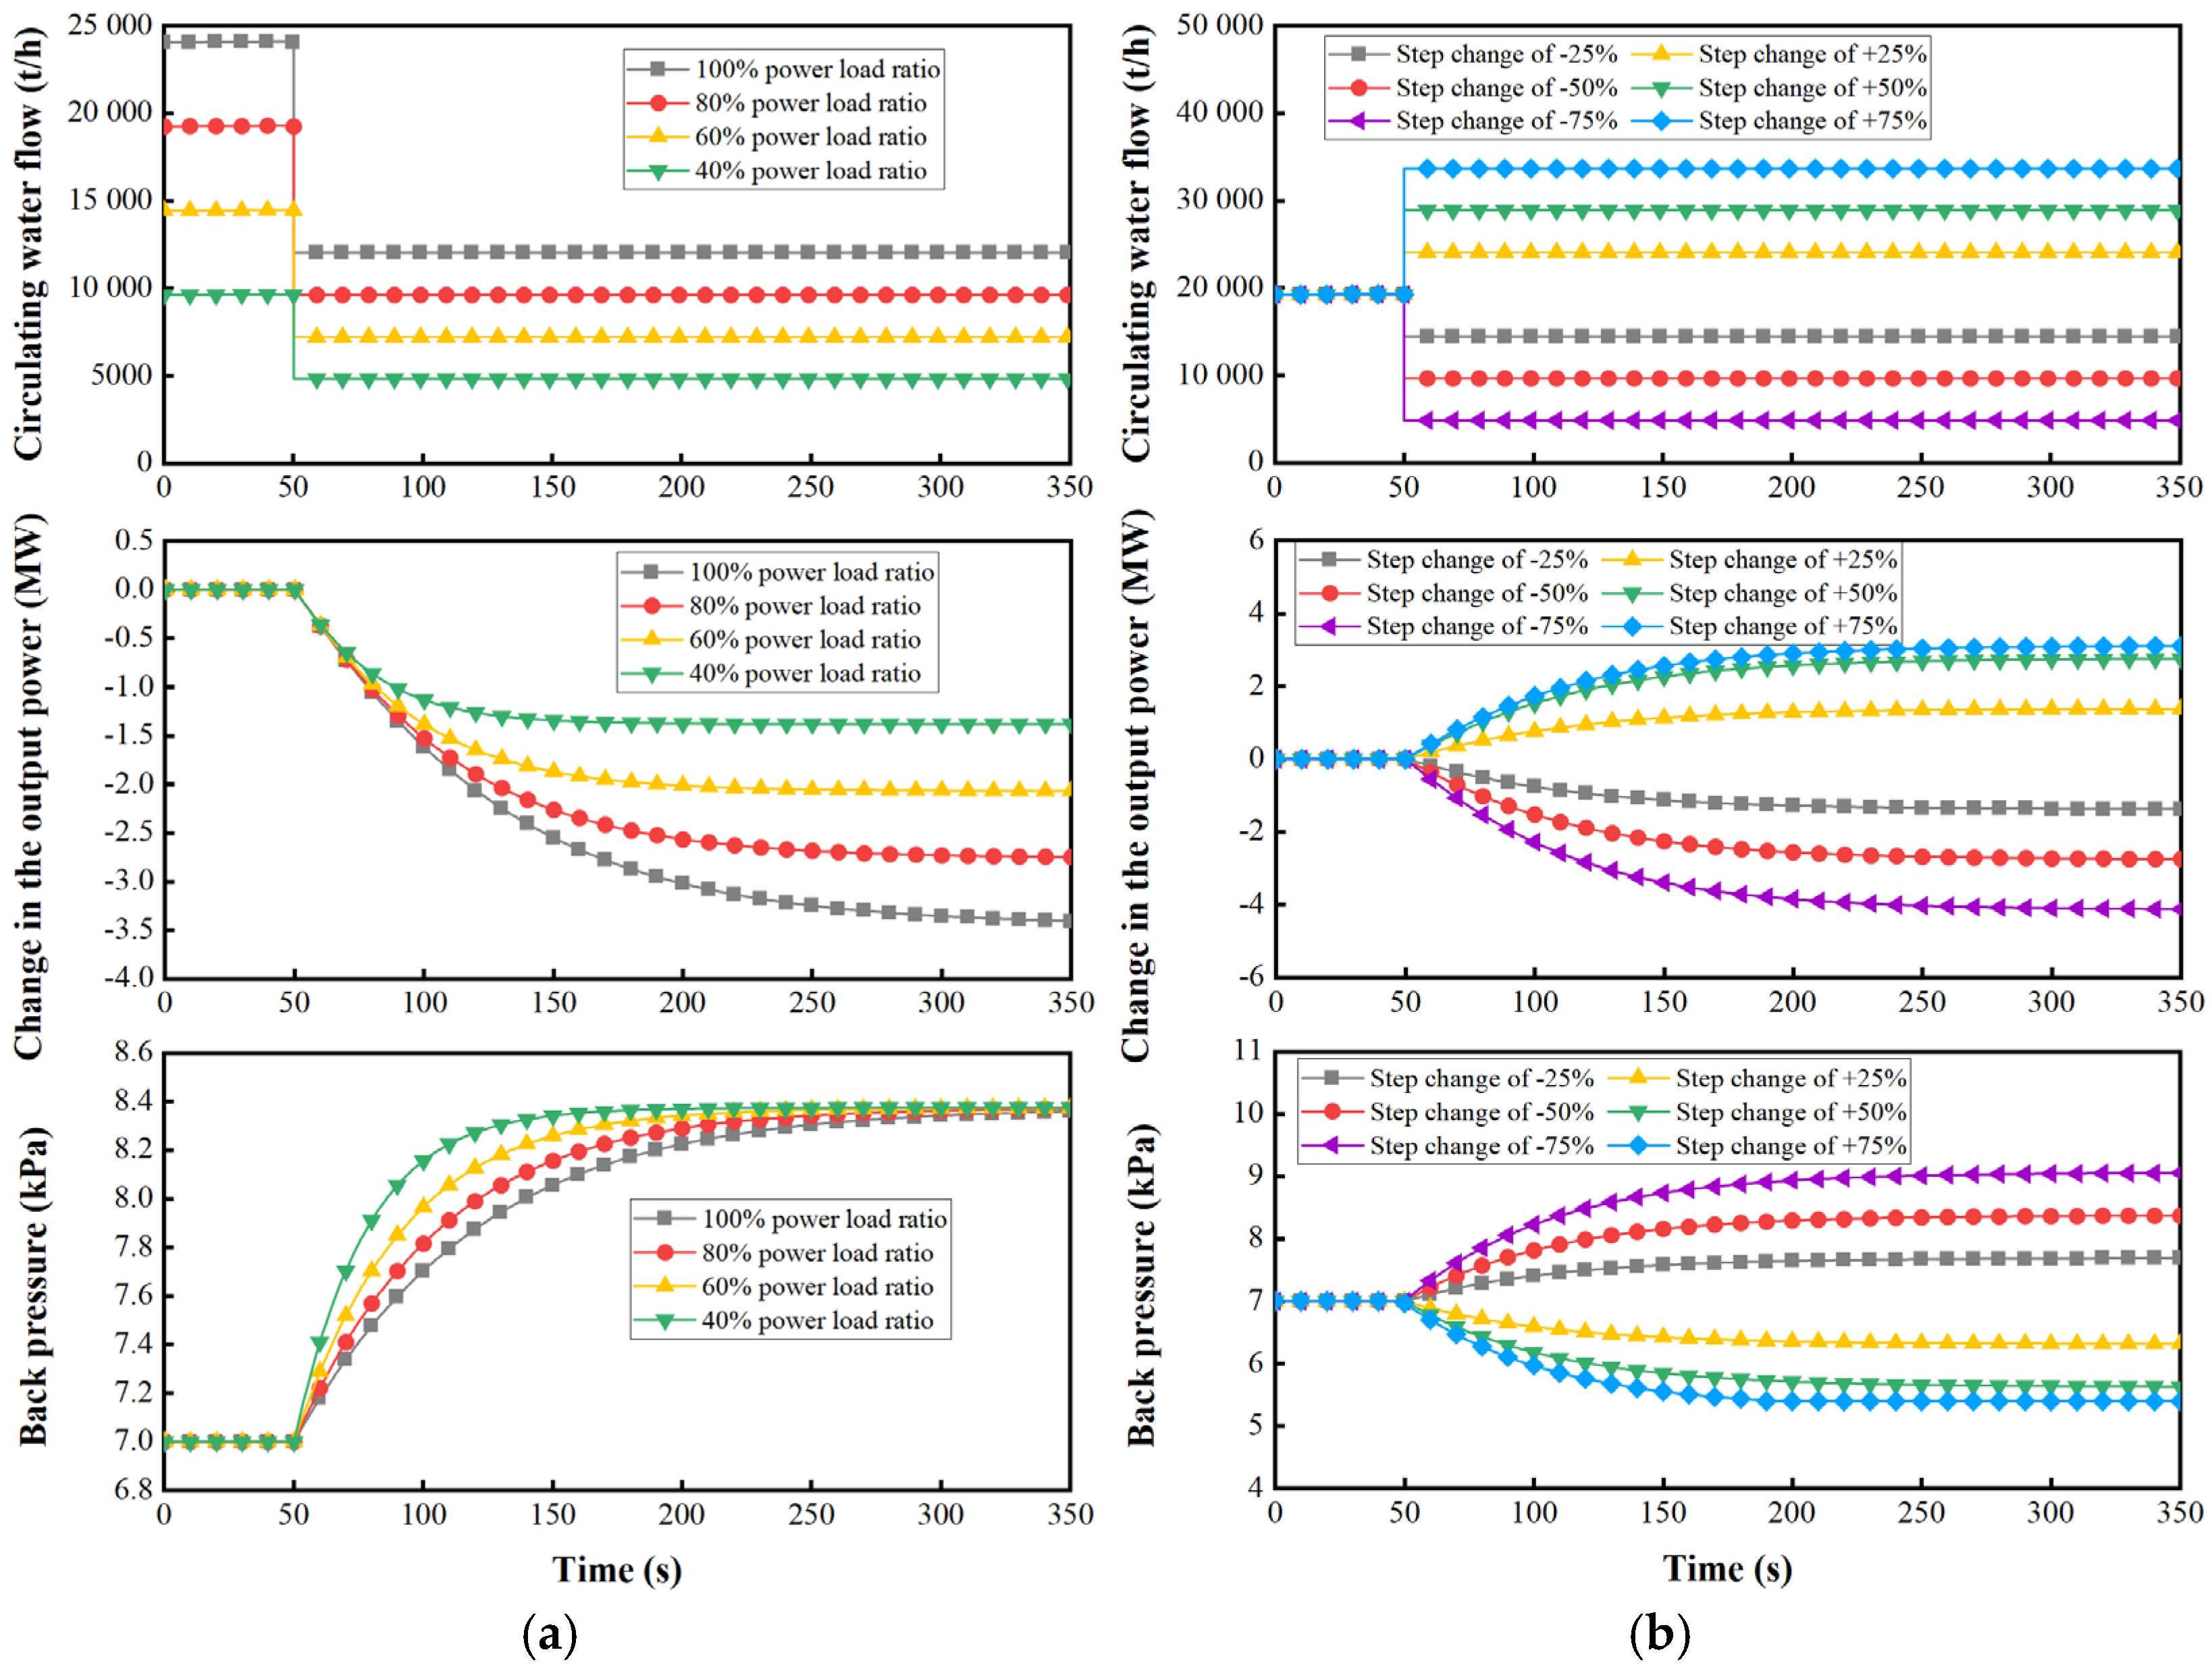
4.1. Dynamic Characteristics of the End-Cold System
Adjusting the condenser’s circulating water flow is an effective method of cold-end optimization. The dynamic characteristics of the condenser directly affect the improvement of the ramp rate and AGC response achieved by the cold-end optimization. Therefore, it is necessary to investigate the dynamic response characteristics of the cold-end system after a step change in the circulating water flow. Figure 5a shows the dynamic characteristics after a step change of −50% in the circulating water flow under various unit’s load ratios, and Figure 5b shows the dynamic characteristics after various step changes (i.e., −25%, −50%, −75%, +25%, +50%, and +75%) under the same unit’s load ratio of 80%.
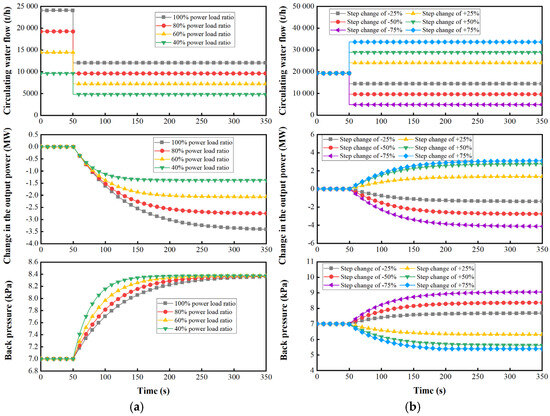
Figure 5.
The cold-end system’s dynamic characteristics under step changes in circulating water flow. (a) Step change under various load ratios. (b) Various step changes under the same load ratio.
As shown in Figure 5a, the load ratio of the power unit does not affect the final stabilized value of the back pressure, but it affects the required time to reach the stabilized value. The lower the power load ratio, the faster the back pressure reaches the stabilized value. The reason is that the quantity of circulating water in the system is less at a low load ratio; thus, the thermal inertia of the system is small, and the response speed is fast. At 40% of the unit’s power load ratio, the back pressure and output power are nearly stable at the 200th second. Therefore, the cold-end optimization can be applied to improve the AGC response of the power unit.
As shown in Figure 5b, the magnitude of the step change only affects the final stabilized value but not the required time to reach the stabilized value. The greater the magnitude of the step change in circulating water flow, the greater the magnitude of the changes in the output power and the back pressure. However, it is noteworthy that when the step amplitude is large (+75%), the back pressure no longer decreases proportionally as expected, but stabilizes at approximately 5.2 kPa due to the terminal difference of the condenser. This indicates that there is a limit to reducing back pressure by increasing the circulating water flow. Conversely, based on the reference value of the common back pressure of 7 kPa (the average actual back pressure in 2023), the operational space for increasing back pressure and reducing unit power by decreasing the circulating water flow is much larger.
4.2. Application of the Cold-End Optimization in Load-Variation Processes
4.2.1. Control Strategy of the Cold-End Optimization
The cold-end optimization is applied to enhance the ramp rate and AGC responsiveness of the power unit through the control strategy shown in Figure 6. When the deviation of the current output power from the power command is detected, the following actions are executed. On the one hand, the boiler load is adjusted to follow the instruction, according to the coordinated control system [27]. On the other hand, the power deviation is transferred to the cold-end system. First, the optimal circulating water flow rate () that reduces the power deviation to zero is calculated. Then, the circulating water flow rate is changed to its optimal value by a proportion integration differentiation (PID) controller, and the output power of the unit is recalculated. Subsequently, the updated power deviation is transferred to the cold-end system again to adjust the circulating water flow rate in real time. The main parameters involved in the above control strategy are shown in Table 2.
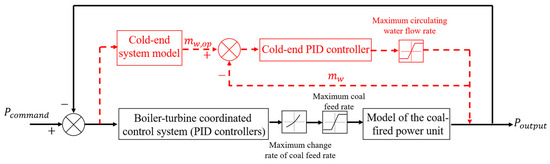
Figure 6.
Control strategy of the cold-end optimization.
Table 2.
Main parameters of the control strategy.
4.2.2. Performance Improvement in the Load-Variation Processes
In this section, the load-variation processes between 80% and 100% load are simulated, with ramp rates of +3% Pe/min and −3% Pe/min. This simulation is conducted based on two benchmark back pressures, i.e., 7.0 kPa and 11.8 kPa. The former is the average of the unit’s actual operating back pressure in the year 2023. The latter is the rated back pressure in summer. Several indicators are selected to evaluate the performance of the load-variation process, including the integrated absolute error (IAE) and AGC assessment indicators [4]. The used AGC assessment indicators include the load change rate indicator K1, the load-adjustment accuracy indicator K2, the load response speed indicator K3, and the comprehensive performance assessment indicator KP.
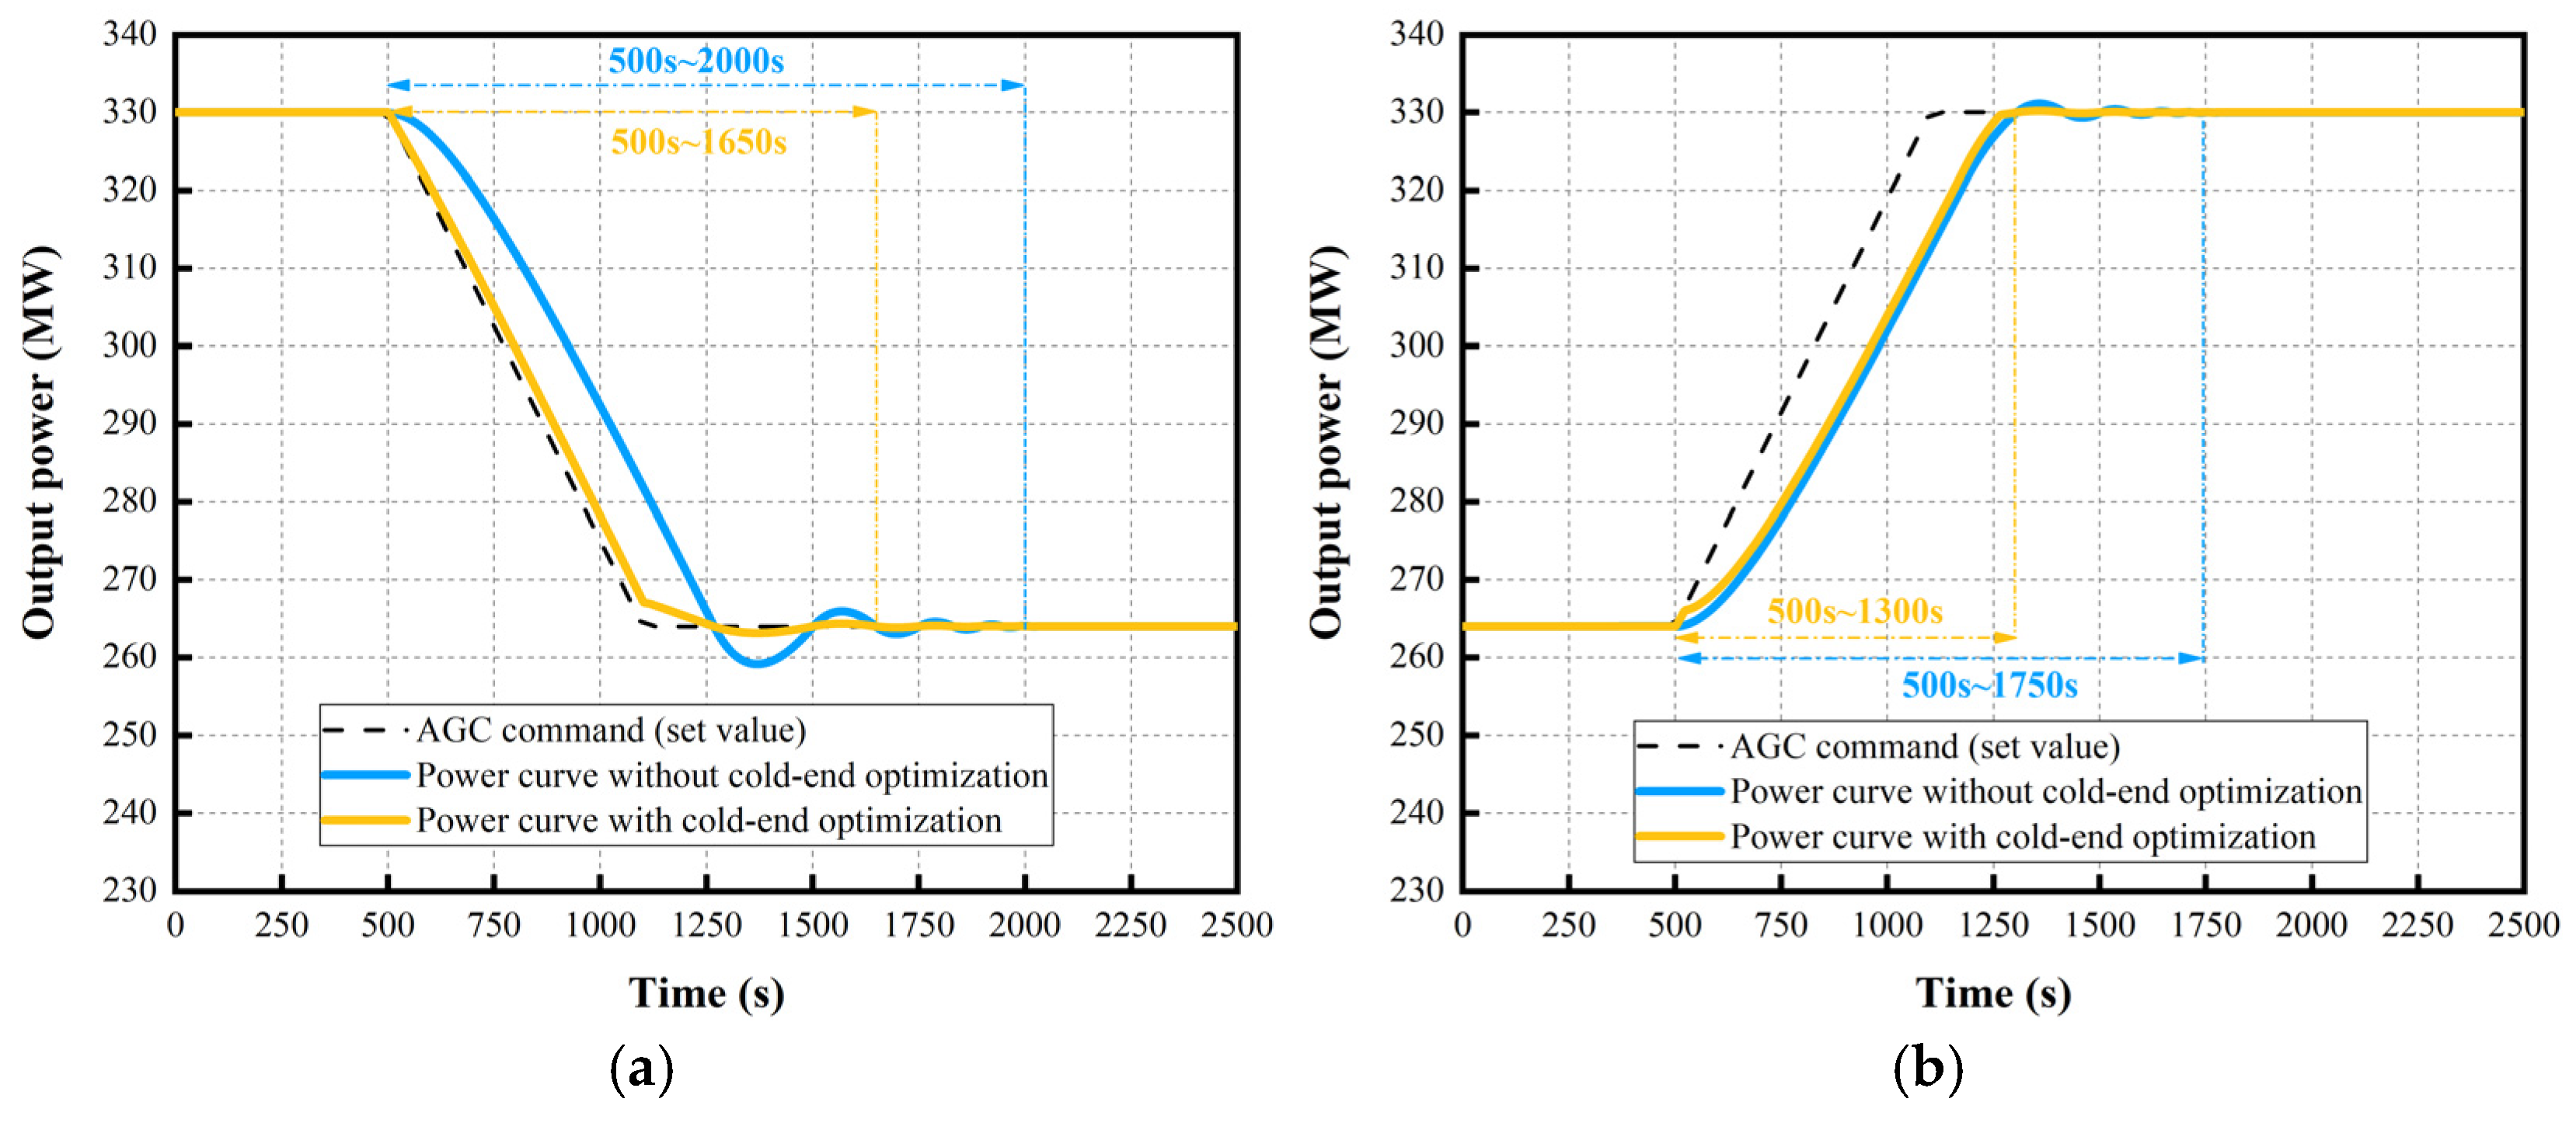
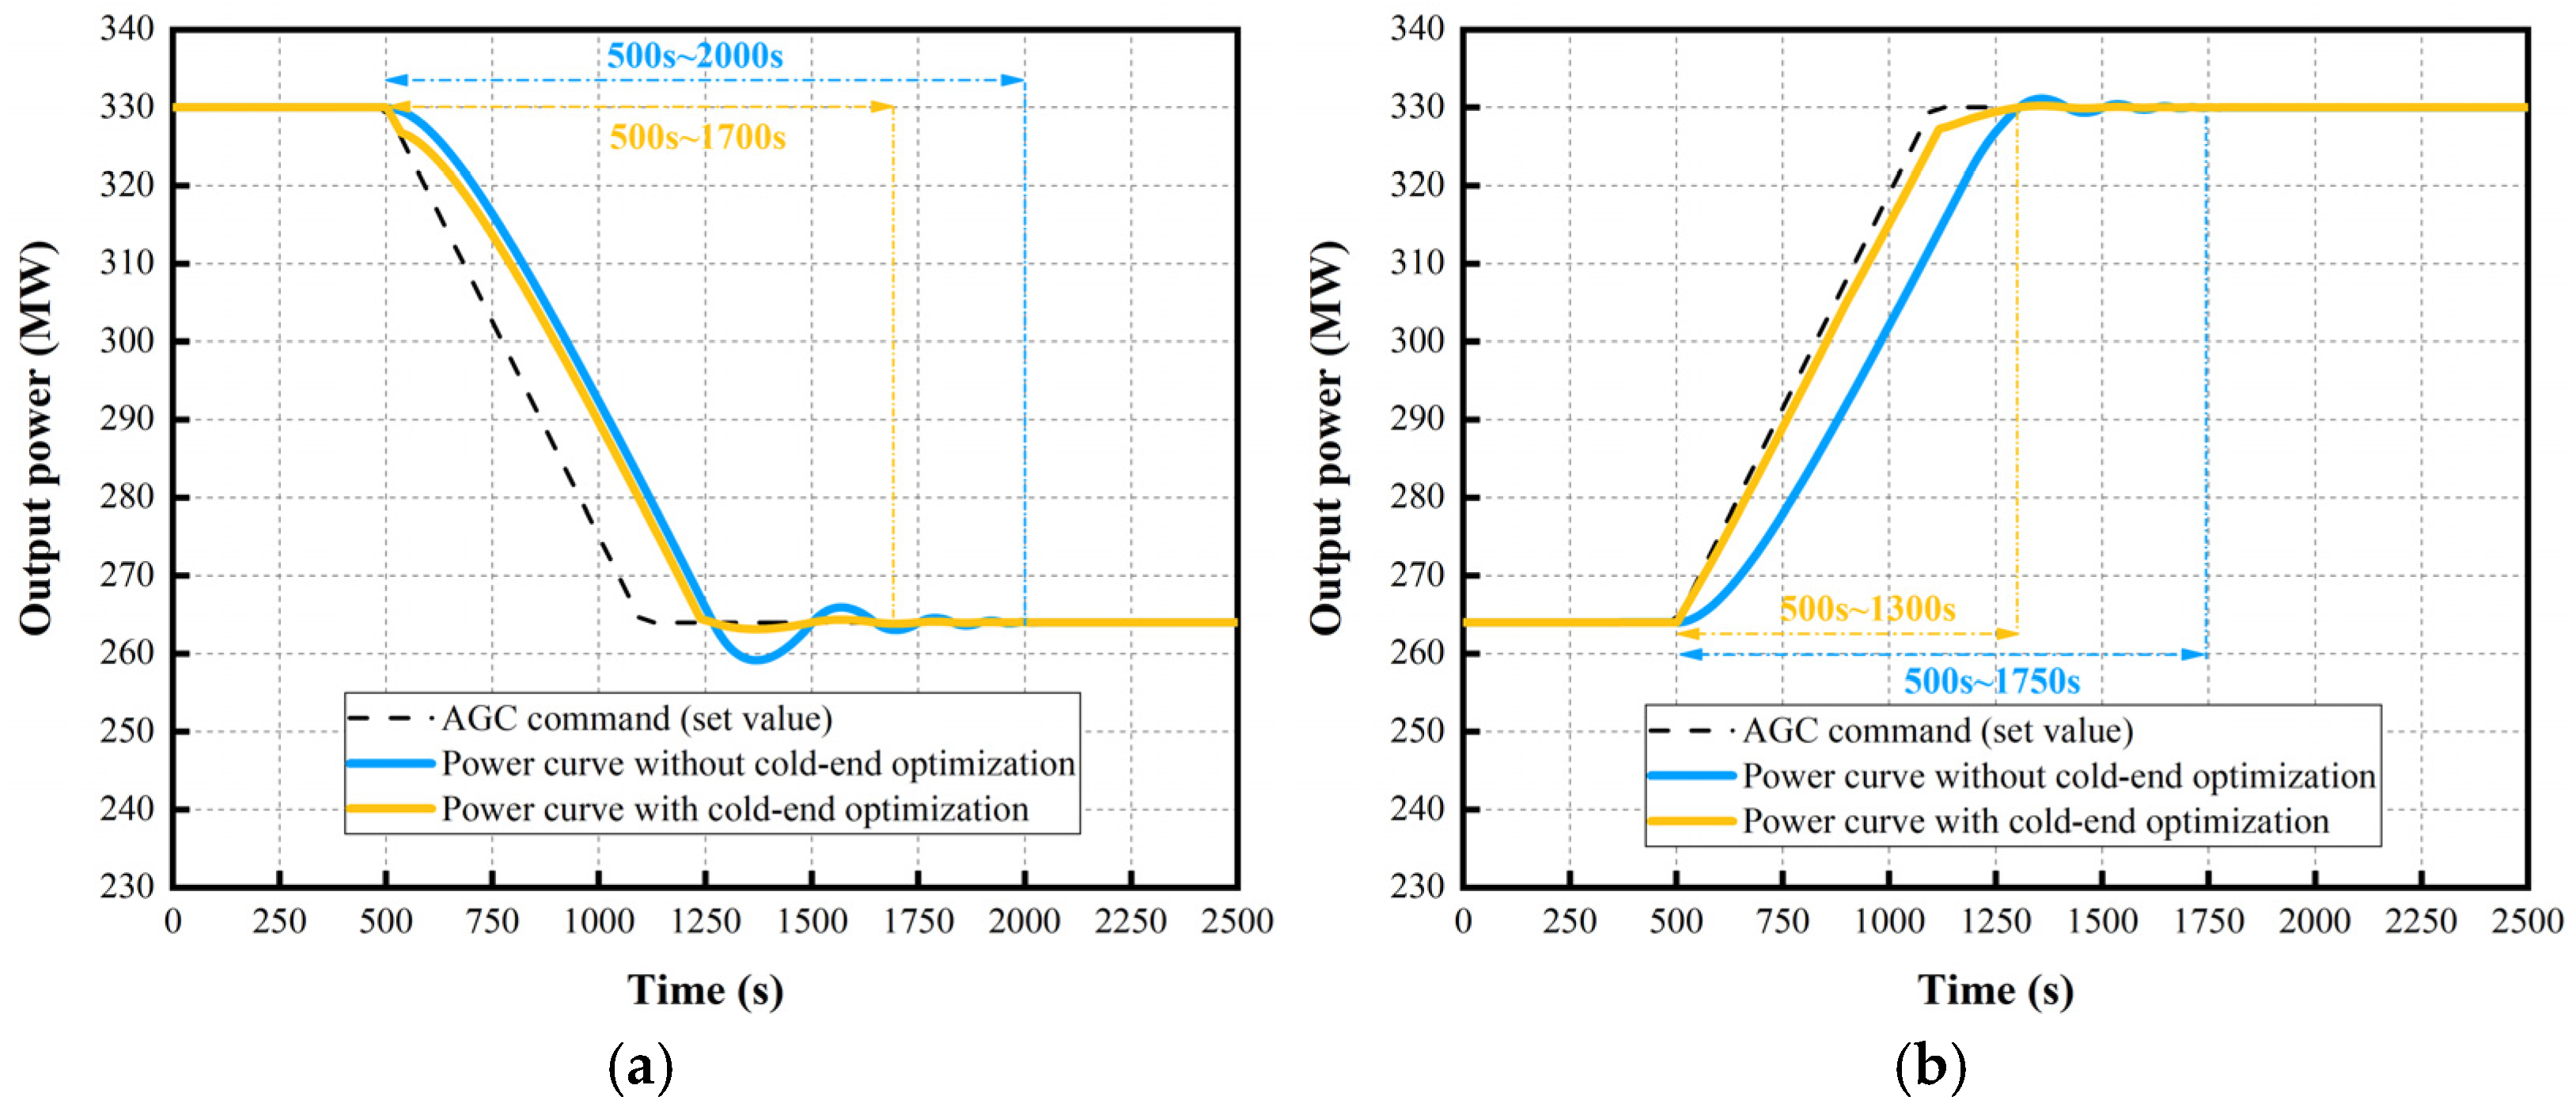
When the power unit is operated with a back pressure of 7 kPa, the power curves before and after the cold-end optimization are shown in Figure 7. The circulating water flow rate and the unit’s back pressure are shown in Figure 8. As shown in Figure 7a, in response to the −3% Pe/min command, the cold-end optimization improves the AGC efficacy significantly. The deviation of the output power of the unit from the AGC command curve is obviously reduced, and the ramp rate is increased remarkably. The required time to reach the targeted load is also reduced. In contrast, Figure 7b shows that in response to the +3% Pe/min command, the cold-end optimization slightly improves the AGC response, and the effect is not as obvious as the load-decrease process. Moreover, the required time for the unit’s load to stabilize is effectively reduced. The specific real-time regulations of the circulating water flow and the back pressure are provided in Appendix A.
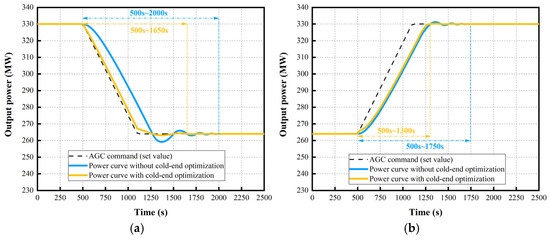
Figure 7.
Power curves before and after the cold-end optimization (back pressure: 7 kPa). (a) Ramp rate: −3% Pe/min; (b) Ramp rate: +3% Pe/min.
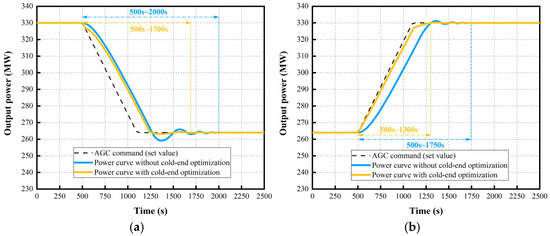
Figure 8.
Power curves before and after the cold-end optimization (back pressure: 11.8 kPa). (a) Ramp rate: −3% Pe/min; (b) Ramp rate: +3% Pe/min.
After optimizing the operation of the cold-end system, based on the back pressure of 7 kPa, the performance indicators of the unit during AGC are shown in Table 3. The results show that during the load-decrease process with a ramp rate of −3% Pe/min, the IAE decreases from 2.91 MWh to 0.44 MWh, a decrease of about 85%, and the comprehensive performance indicator KP increases from 2.96 to 5.03. In contrast, during the load-increase process, the IAE decreases from 2.63 MWh to 2.18 MWh, decreasing by about 17%, and the comprehensive performance indicator KP increases from 3.66 to 4.27. It is noteworthy that K1, K2, and K3 only increased by a small margin in the load-increase process, as the condenser terminal difference constrained the effectiveness of continuously increasing the circulating water flow to increase unit power. Therefore, at a reference back pressure of 7 kPa, cold-end optimization assists the unit in load reduction more effectively than in load increase.
Table 3.
AGC indicators before and after the cold-end optimization (back pressure: 7 kPa).
When the power unit is operated with a back pressure of 11.8 kPa, the power curves before and after the cold-end optimization are shown in Figure 8. Comparing Figure 8a with Figure 8b, it can be found that the unit’s performance in response to the load-increase AGC command is significantly better than in response to the load-decrease AGC command. Moreover, compared to the load-increase process, K1, K2, and K3 are increased by a smaller margin in the load-decrease process. The reason is that the back pressure of the unit is relatively high in summer. Limited by the maximum back pressure of 13 kPa of the centralized control regulations, the unit can easily reduce its back pressure and increase its output power by reducing the circulating water flow, but it is difficult to increase the circulating water flow to realize an increase in the back pressure and load reduction. In addition, the required time for the unit’s load to stabilize is also effectively reduced. The specific real-time regulations of the circulating water flow and the back pressure are also provided in Appendix A.
After optimizing the operation of the cold-end system, based on a back pressure of 11.8 kPa, the performance indicators of the unit during the AGC processes are shown in Table 4. The results show that during the load-decrease process with a ramp rate of −3% Pe/min, the IAE decreases from 2.91 MWh to 2.41 MWh, a decrease of about 17%, and the comprehensive performance indicator KP increases from 2.96 to 5.28. Moreover, during the load-increase process, the IAE decreases from 2.63 MWh to 0.39 MWh, decreasing by about 85%, and the comprehensive performance indicator KP increases from 3.66 to 5.28.
Table 4.
AGC indicators before and after the cold-end optimization (back pressure: 11.8 kPa).
Therefore, it can be concluded that when the back pressure of the unit is relatively low, the cold-end optimization is more effective in improving the unit’s response to the load-decrease AGC commands. On the contrary, when the unit operates with a relatively high back pressure, the cold-end optimization is more suitable for improving the unit’s response to the load-increase AGC commands. Typically, the coal-fired power unit’s back pressure is relatively higher during summer operation, and therefore, the cold-end optimization is more suitable for rapidly increasing load. In contrast, during winter operation, the unit’s back pressure is relatively lower, and the cold-end optimization is more suitable for load-decrease adjustment.
It should be noted that the results in this section are based on theoretical calculations and aim to investigate the maximum potential of cold-end optimization to enhance the unit’s AGC response. When regulating the cold-end operation of a real-world power unit, the safe adjustable range of the back pressure can be set in accordance with the actual demand and operating characteristics of the actual power unit, in order to practically guide the engineering application.
4.3. Application of the Cold-End Optimization in Actual AGC Response
In this section, the feasibility of the cold-end optimization in enhancing the unit’s response to actual AGC signals was investigated, based on two scenarios, i.e., summer and winter operating conditions. The main difference between the two scenarios is electricity demand patterns. In summer, cooling needs cause a sharp rise in power consumption, requiring the power units in China to quickly increase output. In winter, however, centralized heating (not electric) dominates, so the power units in China often reduce output to help the grid use more renewable energy.
4.3.1. Summer Scenario
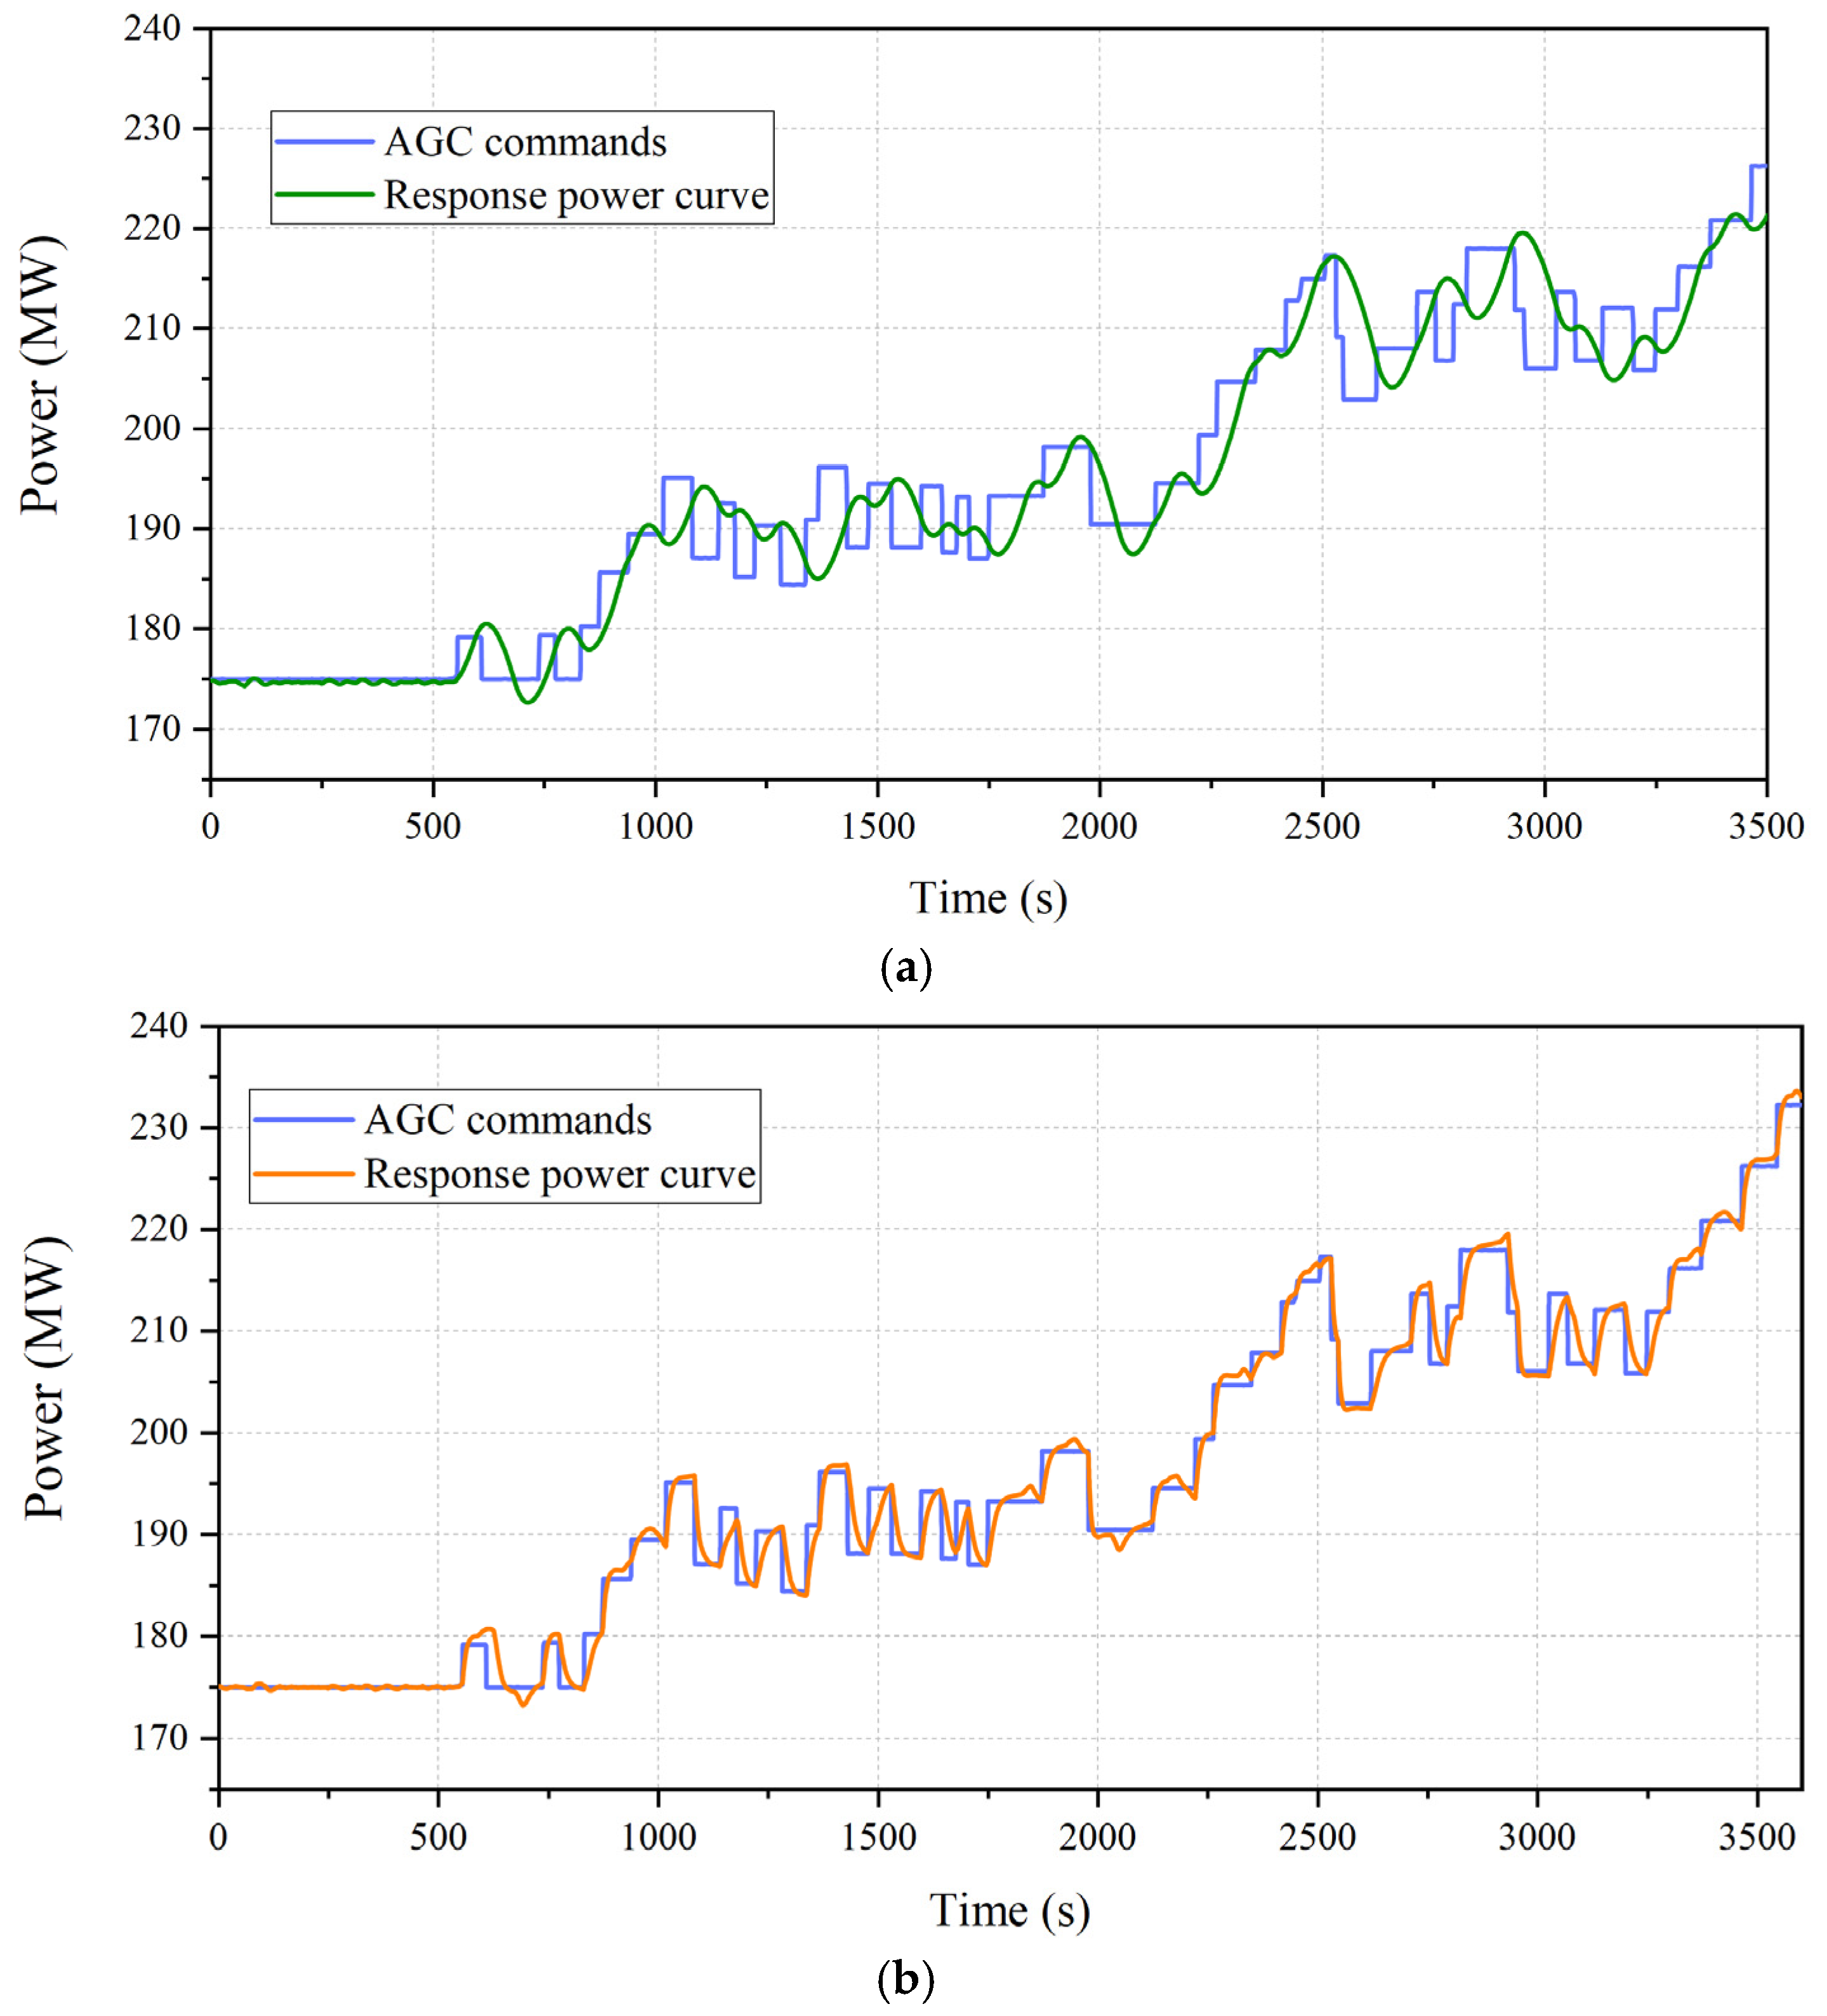
In the summer scenario, the load-increase AGC commands were studied. The power curves of the reference power unit with and without the cold-end optimization in response to the AGC comments are compared, as displayed in Figure 9.
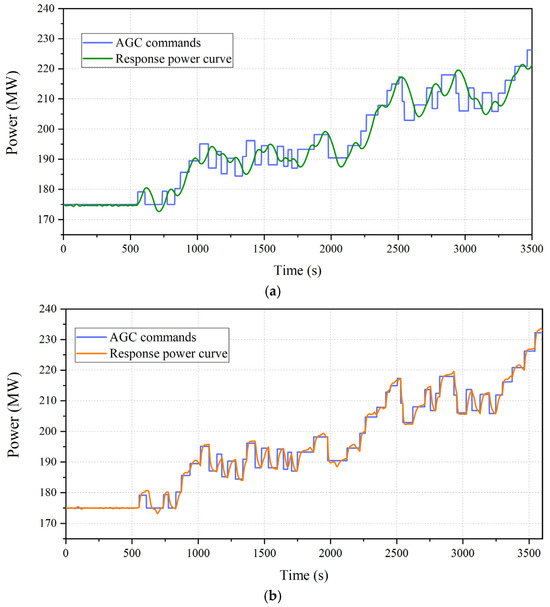
Figure 9.
Unit’s response to actual AGC signals in the summer scenario. (a) Before the cold-end optimization. (b) After the cold-end optimization.
It can be seen from Figure 9a that the original coal-fired power unit has insufficient ramp rate, overshooting, and reverse regulation many times in response to the actual AGC signals. Moreover, as shown in Figure 9b, after the application of the cold-end optimization, the AGC response quality is noticeably enhanced, which improves the phenomenon of overshooting and reverse regulation to a certain extent.
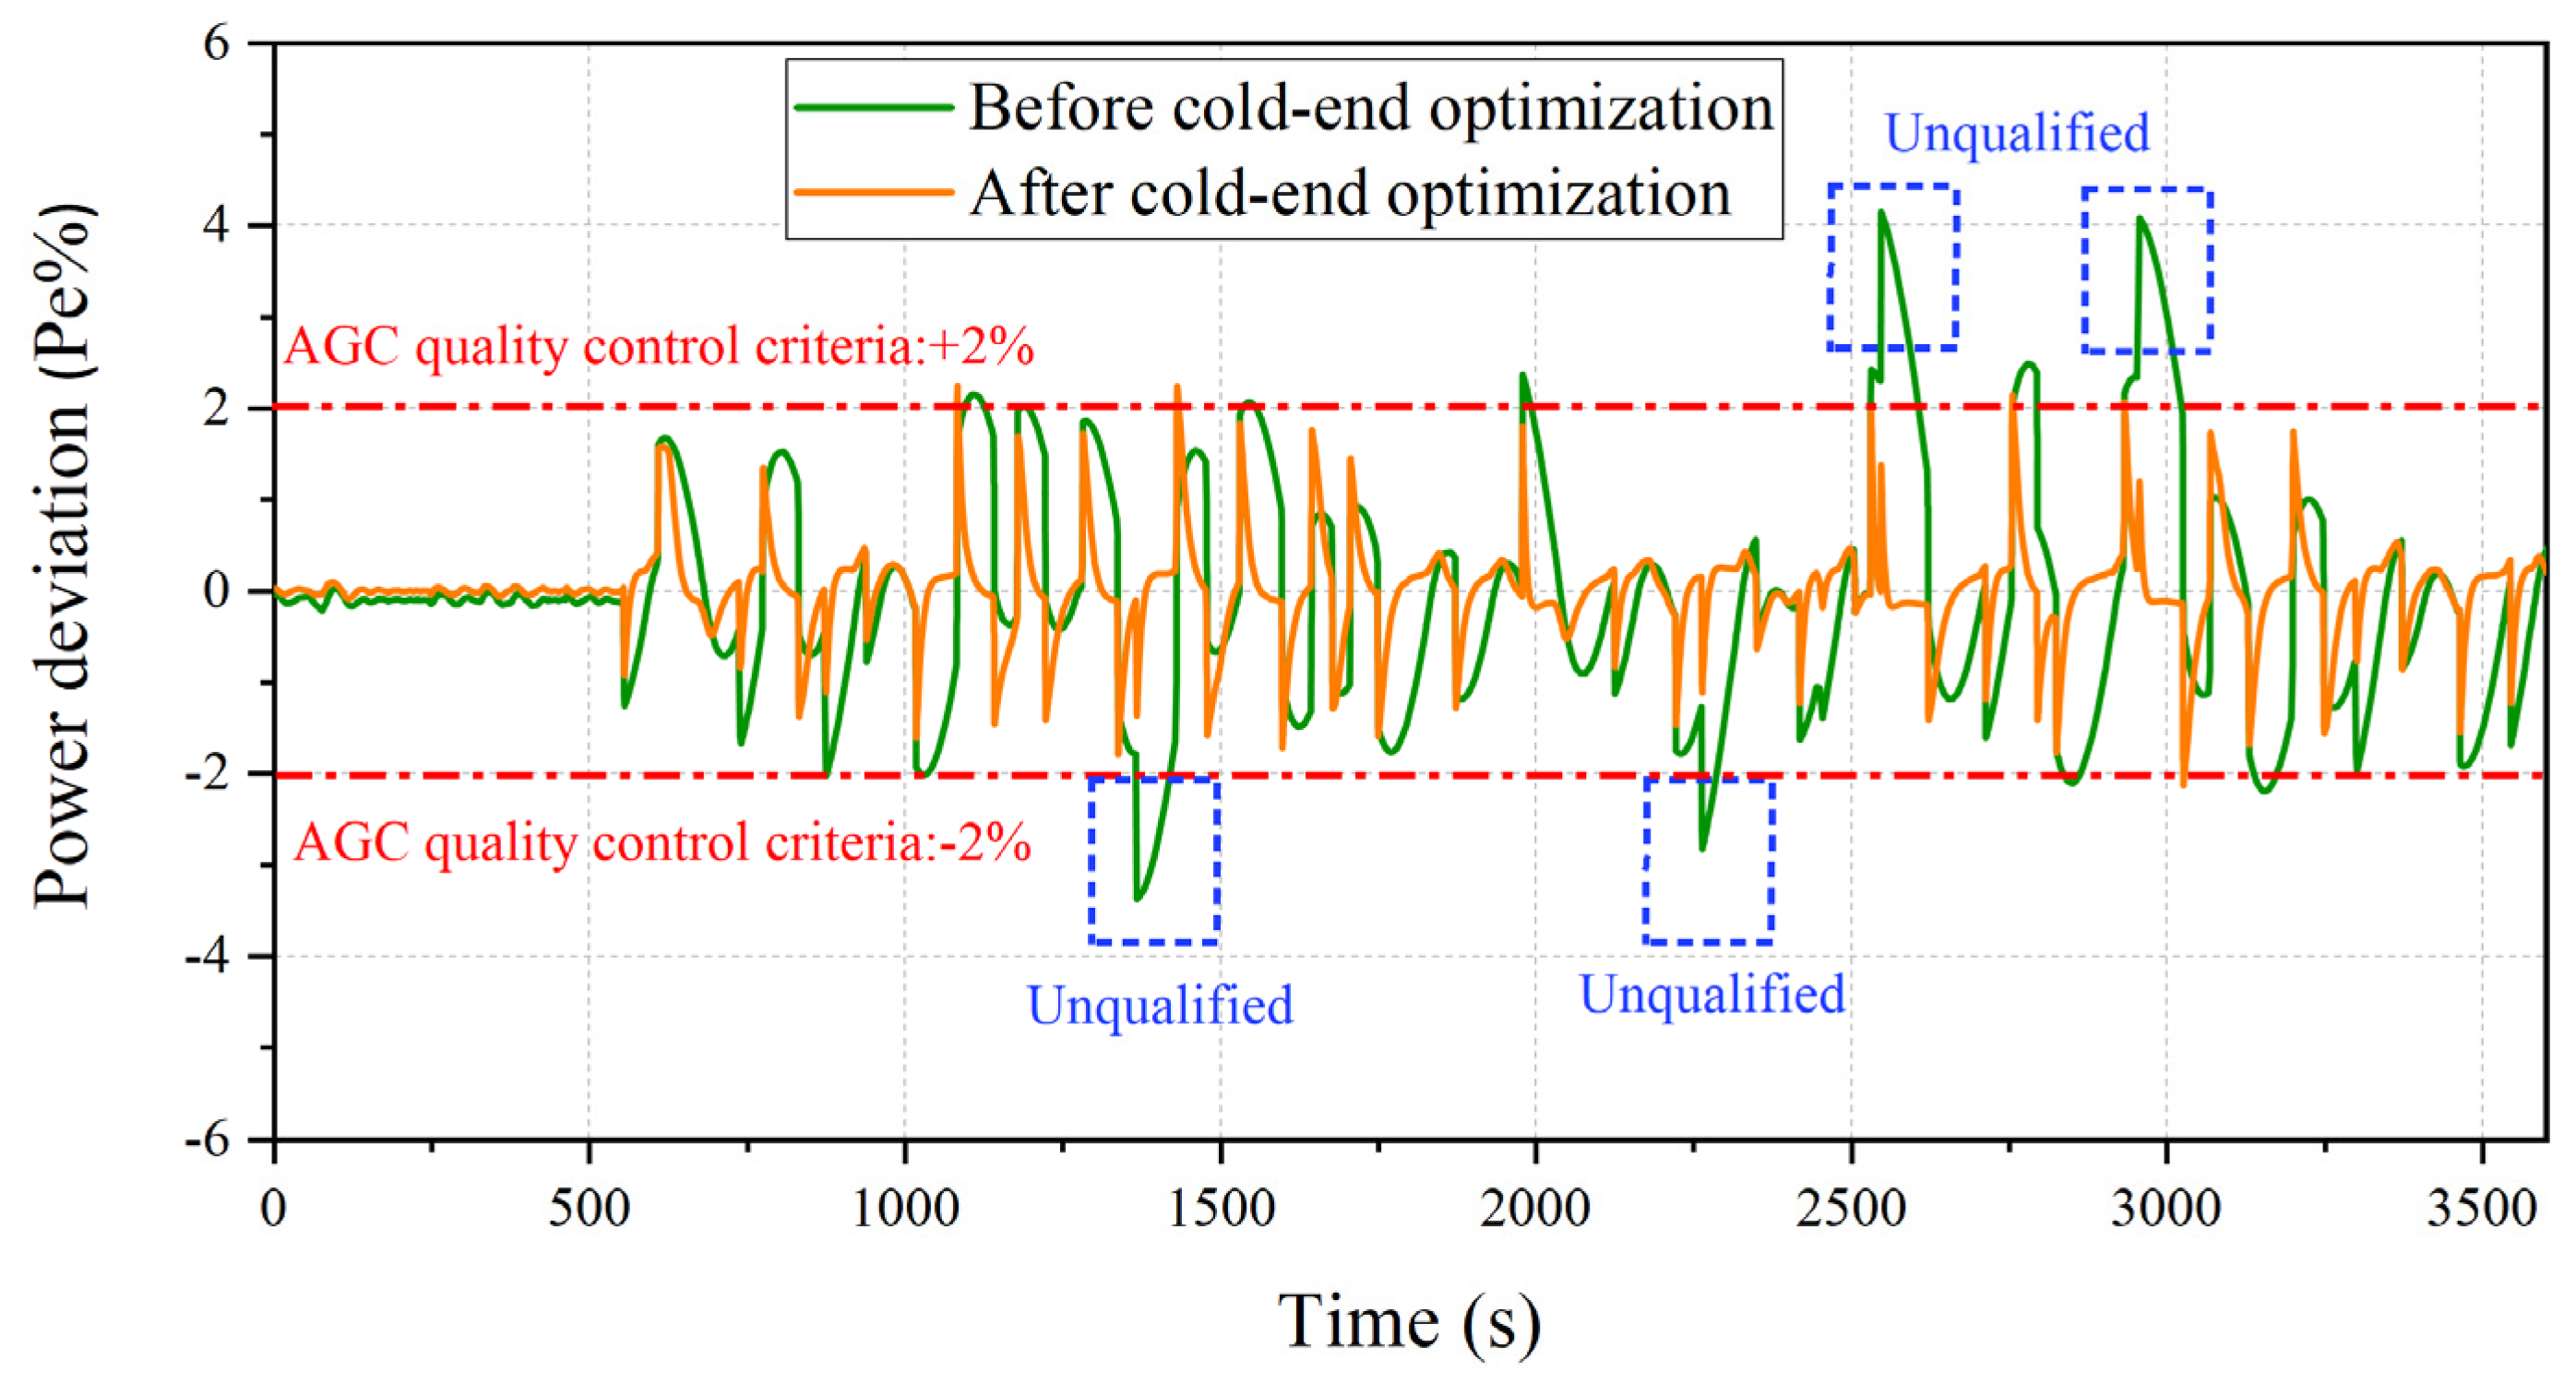
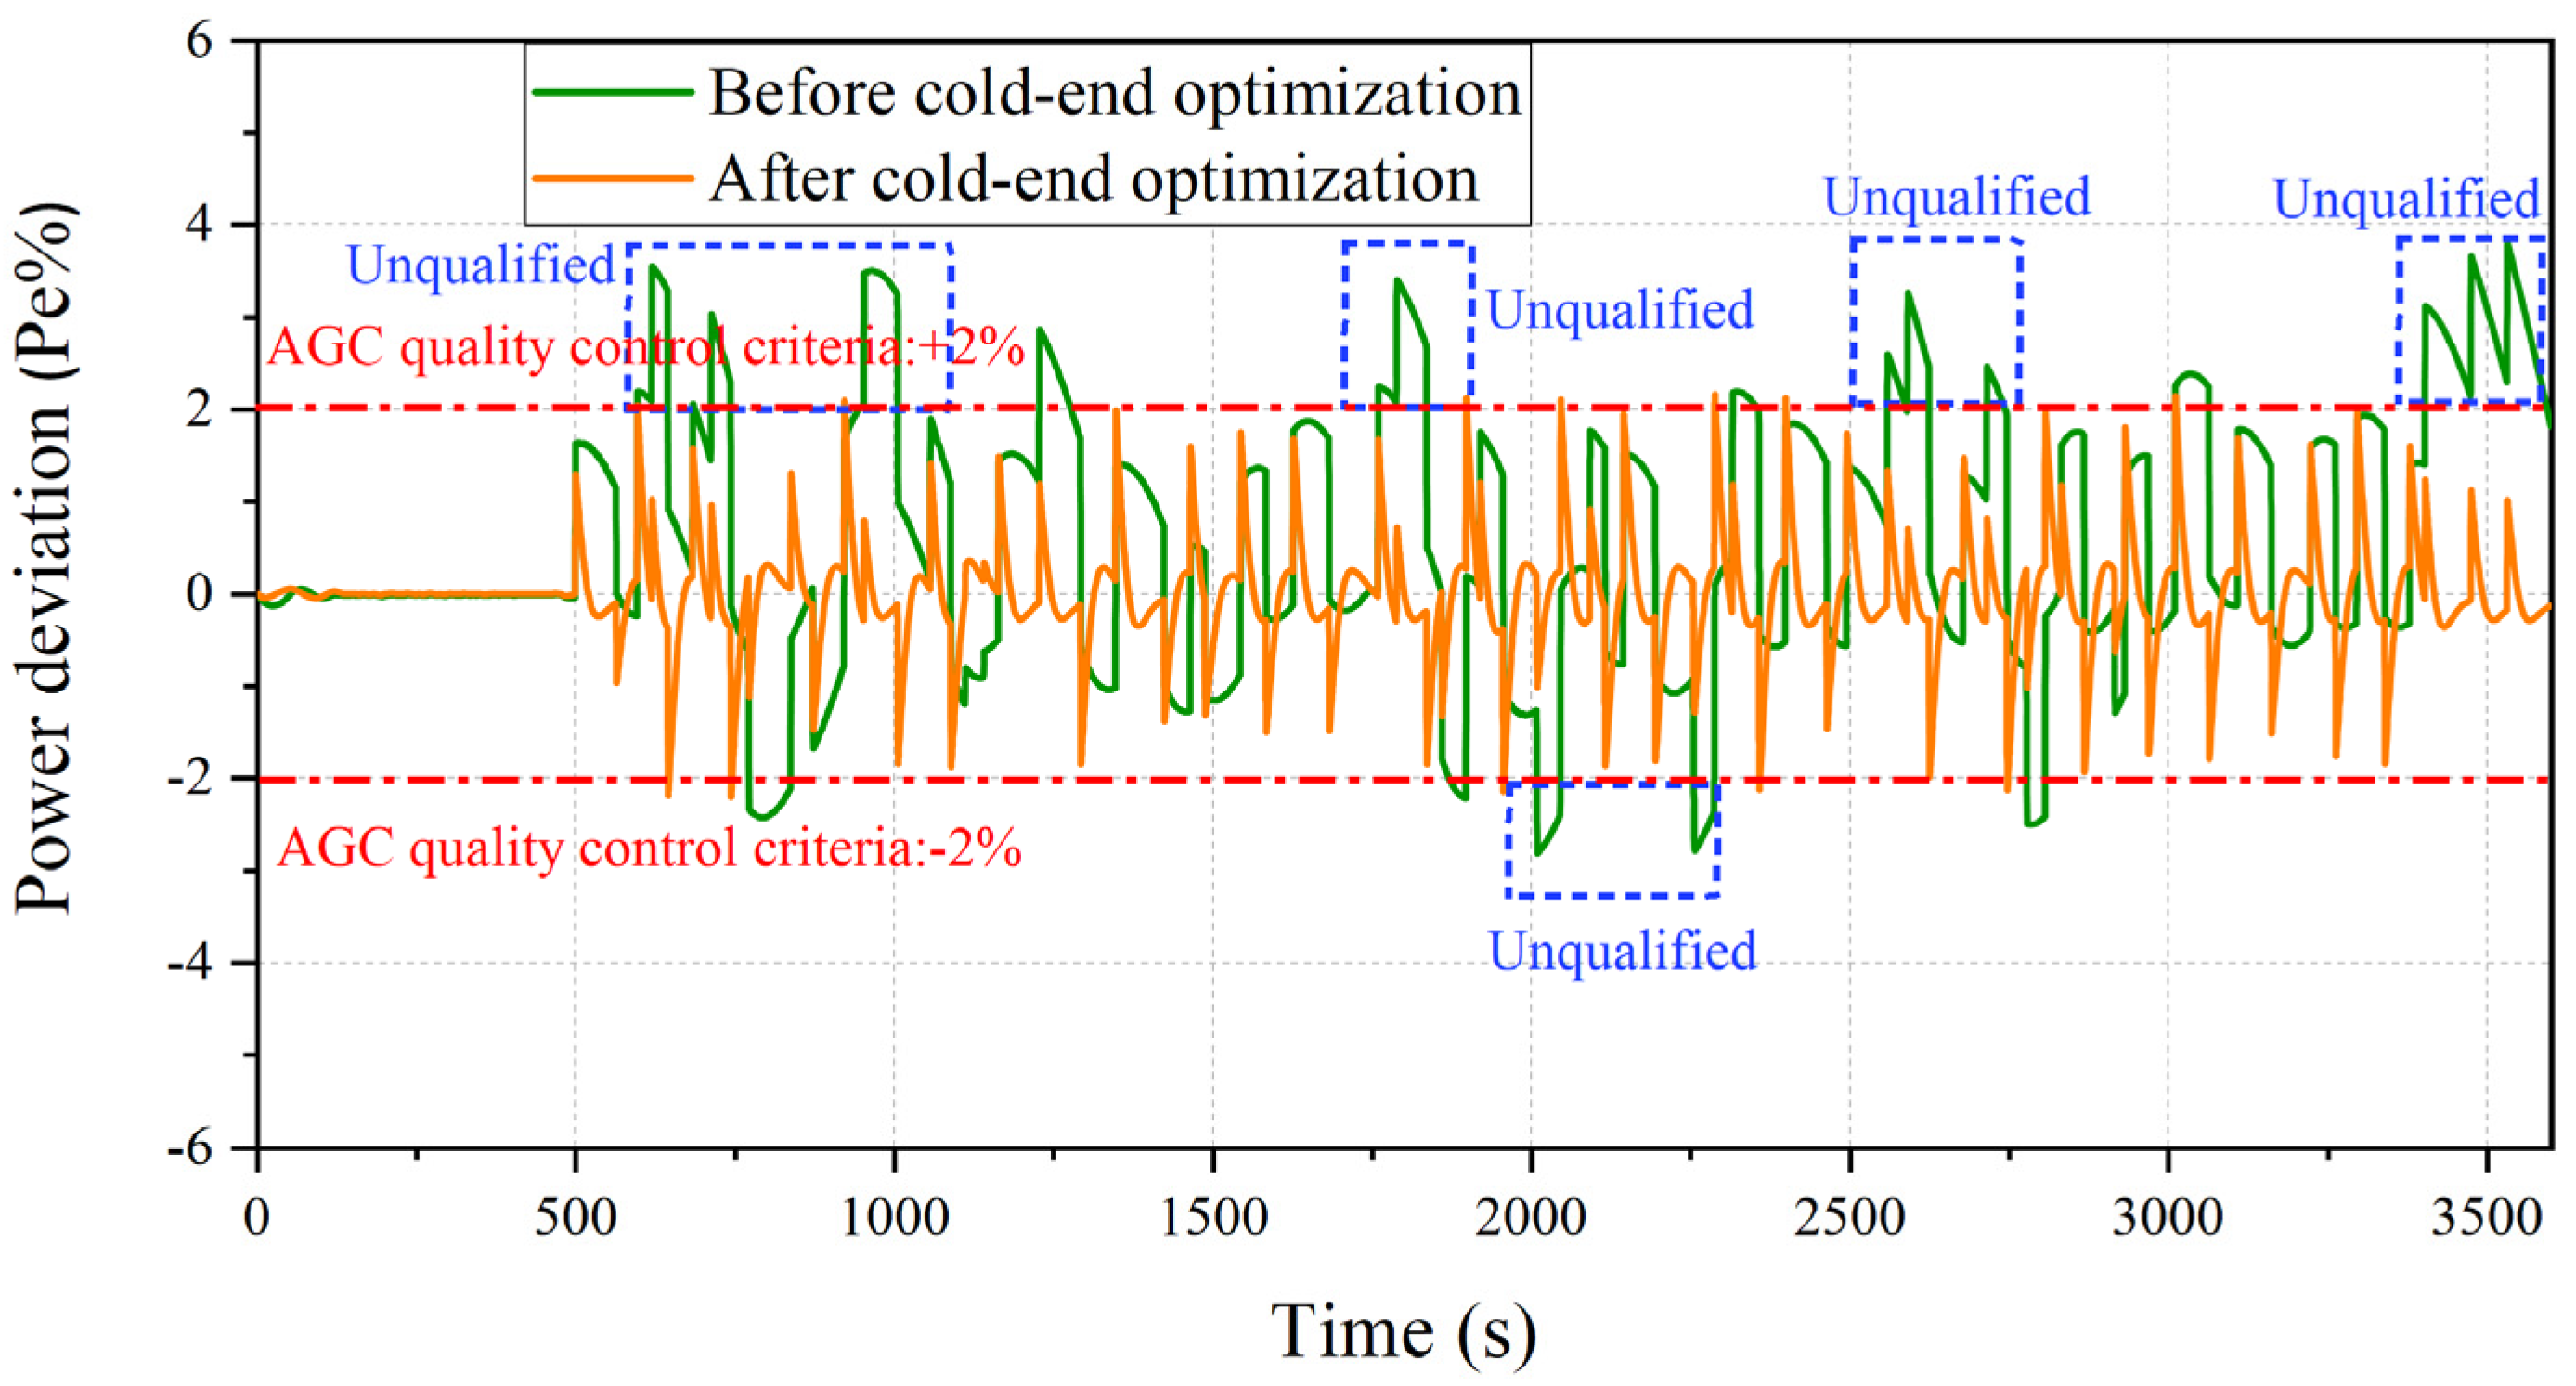
According to the quality control requirements of China’s AGC market [28], a coal-fired power unit must control the power deviation no larger than ±2% of the designed load. During the response to the above AGC signal, the real-time power deviation is shown in Figure 10.
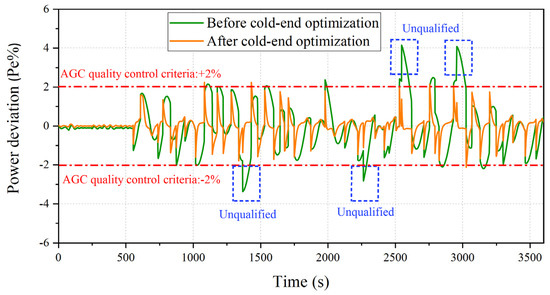
Figure 10.
Real-time AGC power deviation in the summer scenario.
It can be seen that the unqualified response number is significantly reduced. The average value of the power deviation is reduced from 0.61% Pe to 0.45% Pe, with a decrease of 26.2%. During the response to the above AGC signals, the comprehensive performance indicator KP is increased from 2.27 to 4.63. The profit gain from the AGC auxiliary service market can be calculated with [29]:
where is the required power regulation magnitude, MW; and is the compensatory price, which is taken as 5 CHY/MW. The results show that the profit from responding to the one-hour AGC signals is raised from CHY 3648 to CHY 5077, with an increase of 39.2%.
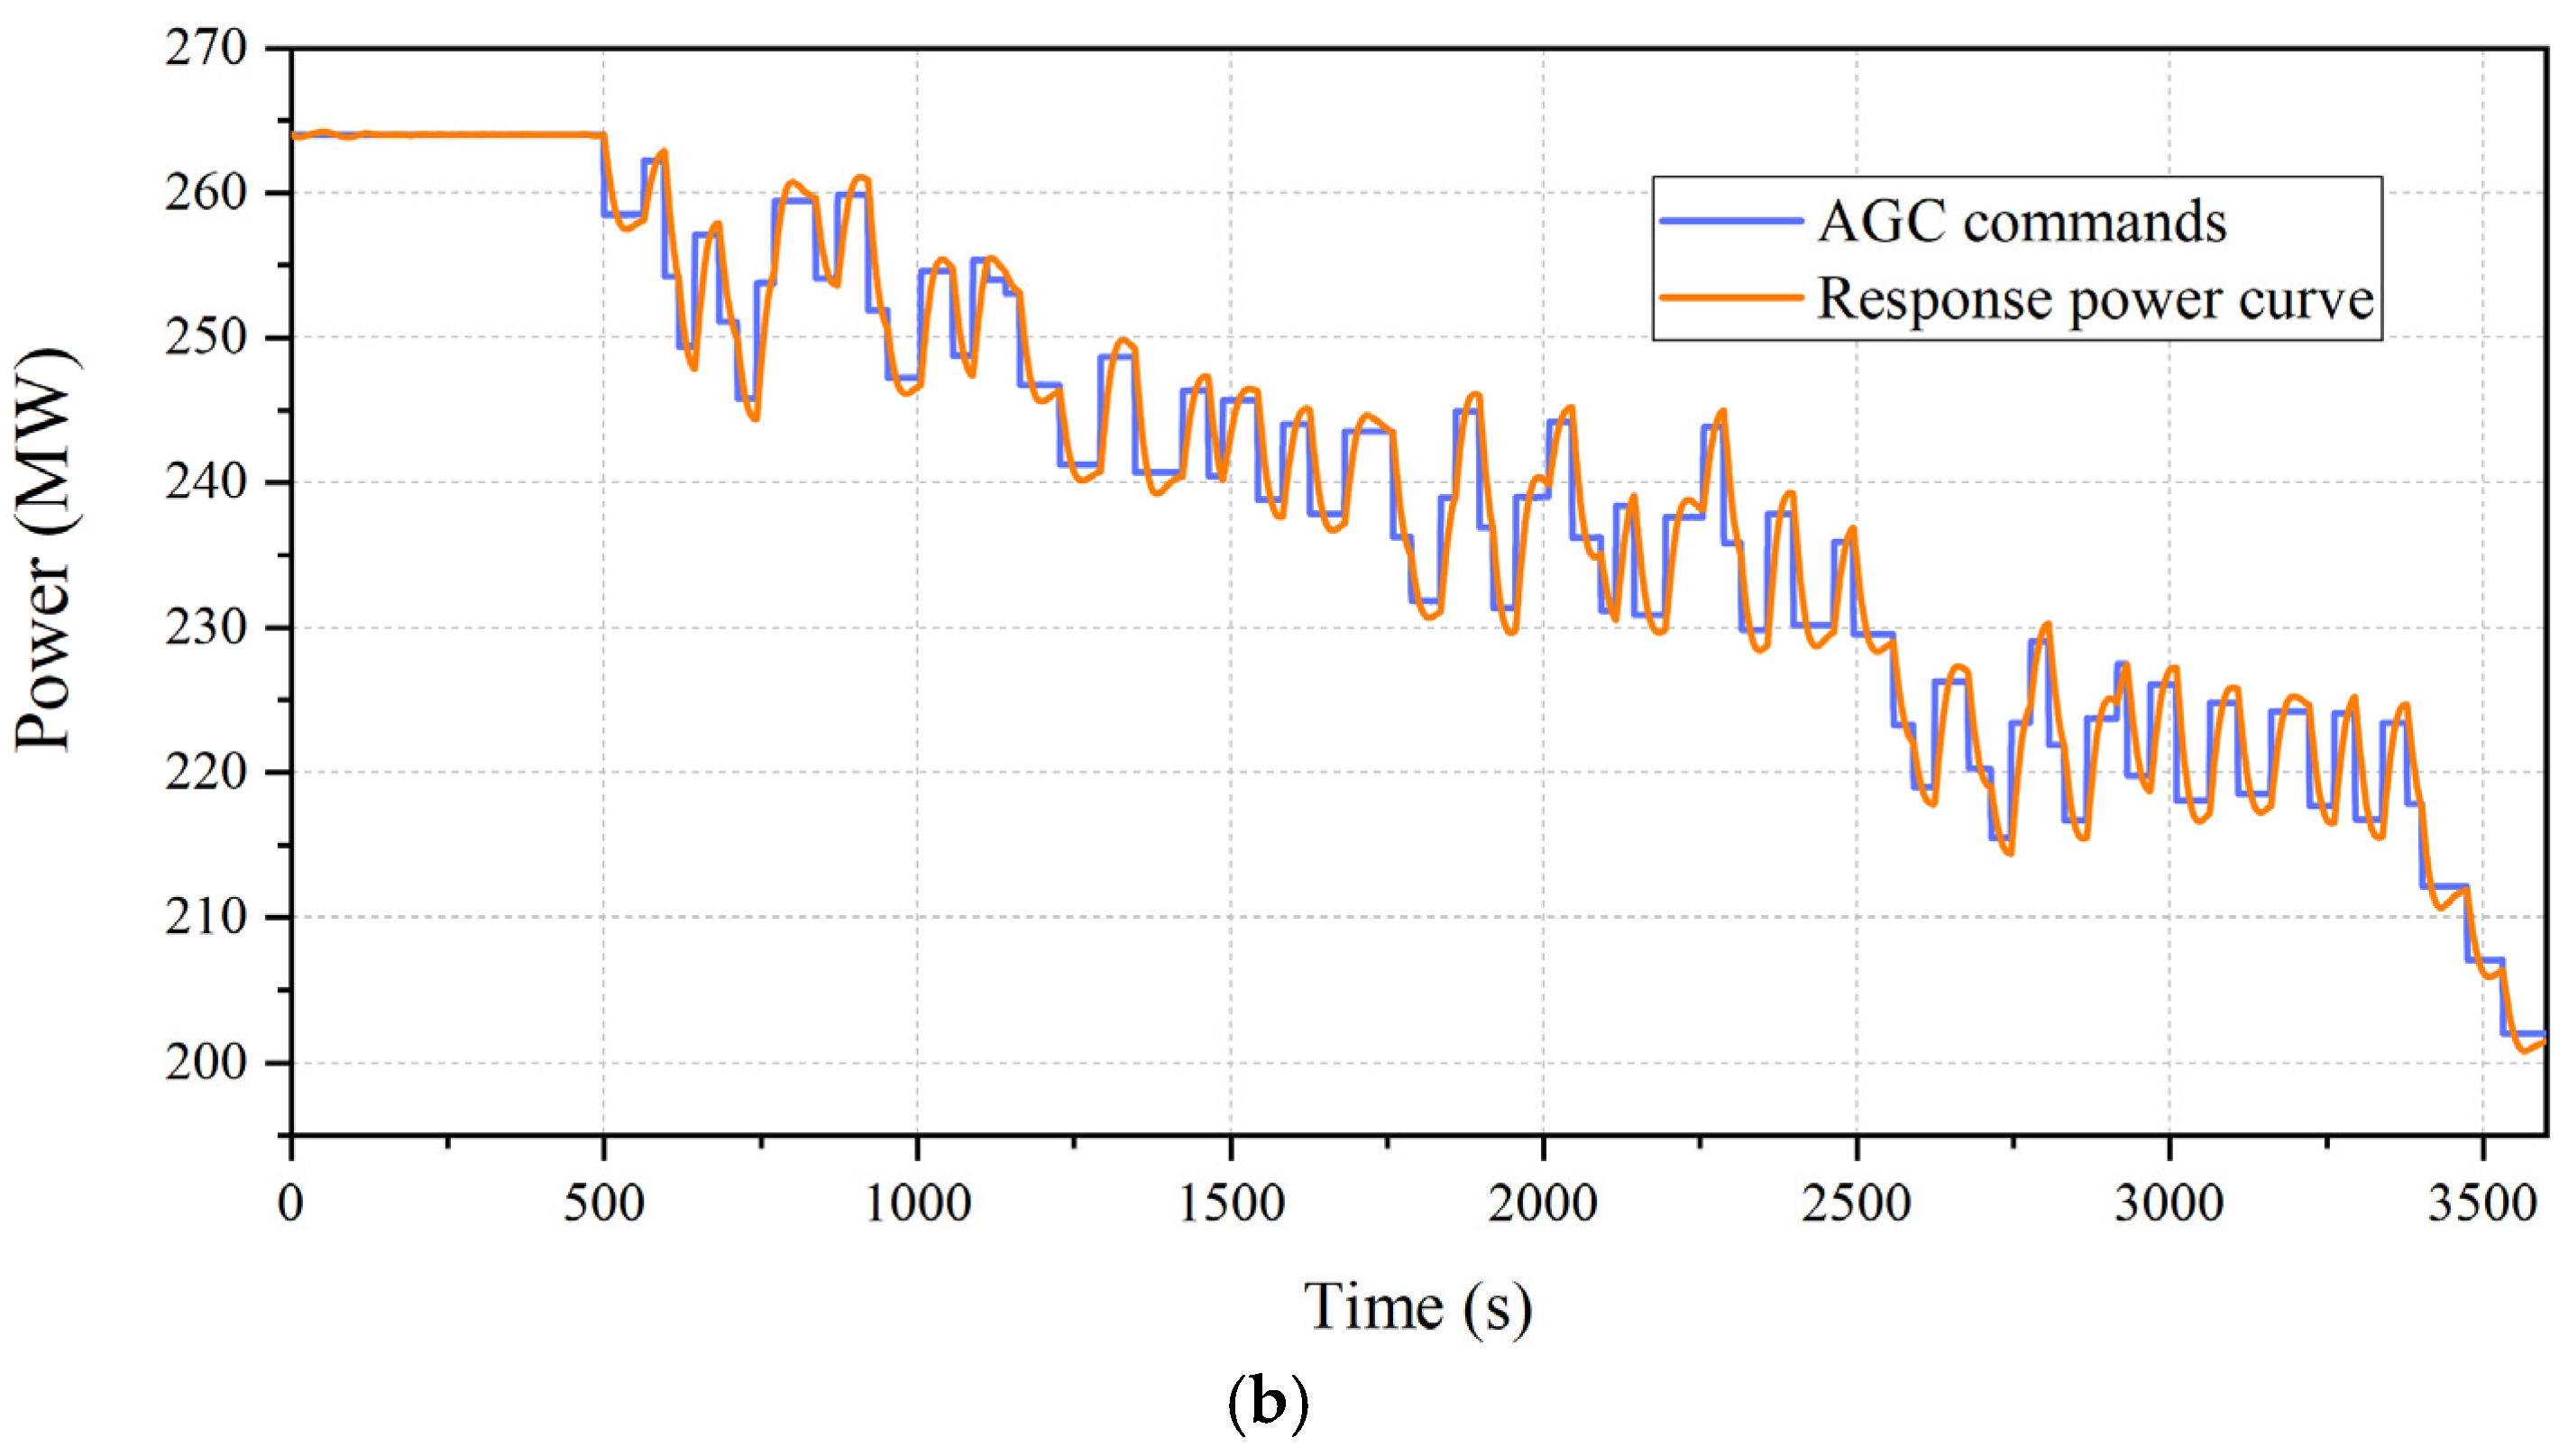
4.3.2. Winter Scenario
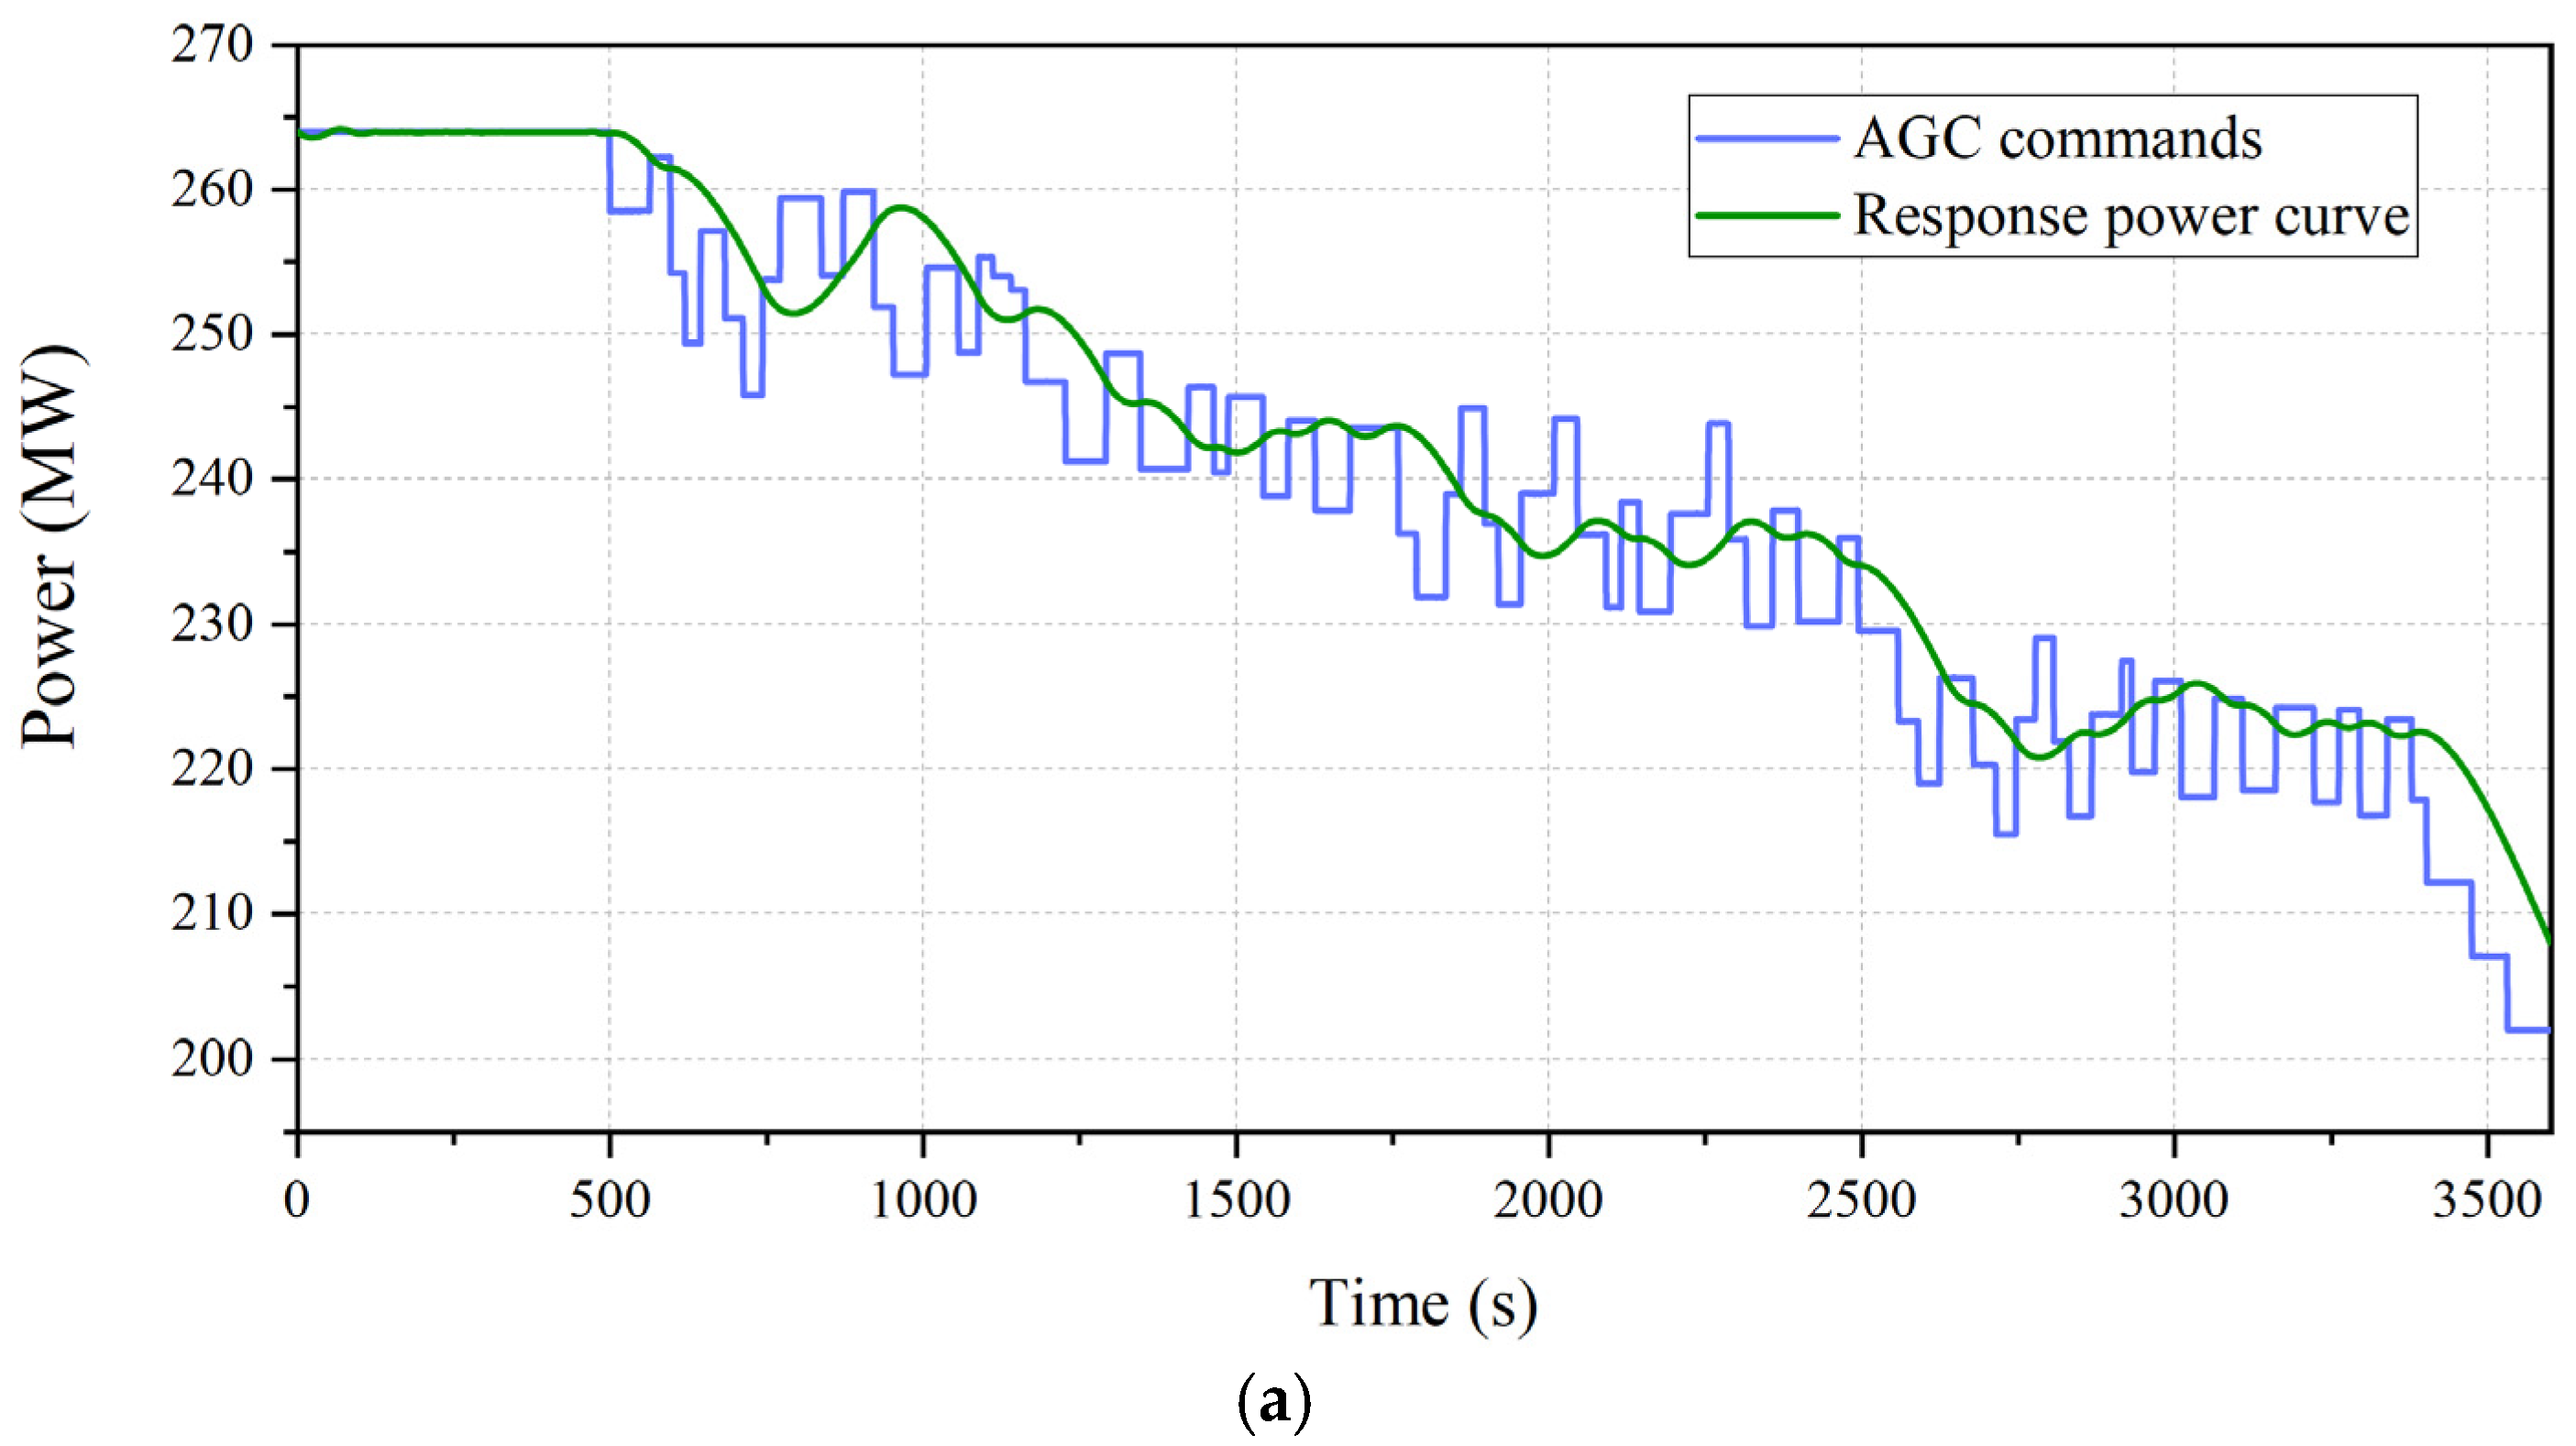
In the winter scenario, the load-decrease AGC commands were studied. The power curves of the reference power unit with and without the cold-end optimization in response to the AGC comments are shown in Figure 11, and the real-time AGC power deviations in the winter scenario are compared in Figure 12.

Figure 11.
Unit’s response to actual AGC signals in the winter scenario. (a) Before the cold-end optimization. (b) After the cold-end optimization.

Figure 12.
Real-time AGC power deviation in the winter scenario.
It can be seen in Figure 11 that the response quality of the unit was noticeably enhanced after the application of the cold-end optimization. The ramp rate, adjustment accuracy, and response speed were improved. Moreover, as shown in Figure 12, the unqualified response number was also significantly reduced in the winter scenario. During the response to the above AGC signals in the winter scenario, the comprehensive performance indicator KP is increased from 2.08 to 4.34. The results show that the profit from responding to the one-hour AGC signals is raised from CHY 3118 to CHY 4442, with an increase of 42.5%.
The results in this section show that cold-end optimization can effectively enhance the unit’s AGC response and bring considerable additional profits in both summer and winter. This is because the unit’s operating back pressure is relatively high in summer, which precisely favors the load-increase demand (see Table 4). Moreover, in winter, the operating back pressure is low, which ideally supports the load reduction demand (see Table 3). These characteristics exactly align with the typical AGC commands for each season.
4.4. Comparison of the Cold-End Optimization and Other Flexibility Technologies
In this section, the proposed cold-end optimization is compared with other flexibility technologies in terms of the enhancement effect on AGC response, cost, and safety risks, as listed in Table 5. The other technology candidates for comparison include two major categories: external flexibility technologies and internal flexibility technologies. The former includes lithium battery [30], flywheel [31], and molten salt thermal energy storage [32], and the latter includes condensate throttling [20], high-pressure extraction steam throttling [12], and feedwater active regulation [13].
Table 5.
Comparison of the flexibility technologies of the coal-fired power unit.
The results show that compared with the integration of external devices, the proposed cold-end optimization has significant advantages in terms of cost and risk, although the effect of improving the AGC response is slightly worse than that of batteries and flywheels. Moreover, compared with unit internal adjustment methods, the operational safety risk is lower, due to the fact that cold-end optimization technology will not affect the operation of the boiler. To sum up, cold-end optimization stands for a feasible and promising technology for improving the load-adjustment flexibility of coal-fired power plants.
5. Conclusions
In this paper, the optimized operation approach of the cold-end system is proposed to improve the flexibility of coal-fired power units, based on dynamic simulations. The applications of cold-end optimization in the load-variation process and the actual AGC response are studied. The main conclusions are as follows:
- (a)
- The dynamic characteristics of the cold-end system under a step change of −50% in the circulating water flow were studied. The results show that the load ratio of the power unit rate does not affect the final stabilized value of the back pressure, but it affects the required time to reach the stabilized value. The lower the power load ratio, the faster the back pressure reaches the stabilized value. In addition, the load ratio of the power unit affects the magnitude of the final power change, and the larger the load ratio is, the greater the impact of the variation of the circulating water flow on the changed power.
- (b)
- The cold-end optimization can be used to improve the unit’s AGC response. When the back pressure of the unit is 7.0 kPa, the cold-end optimization is more effective in improving the unit’s response to the load-decrease commands, in which the comprehensive performance indicator KP increases from 2.96 to 5.03. On the contrary, when the unit operates with a relatively high back pressure (11.8 kPa), the cold-end optimization is more suitable for improving the unit’s response to the load-increase commands, in which the comprehensive performance indicator KP increases from 2.96 to 5.28.
- (c)
- The feasibility of the cold-end optimization in enhancing the unit’s response to actual AGC signals was investigated under two scenarios. The results show that the AGC response quality is noticeably enhanced, which improves the phenomenon of overshooting and reverse regulation. The comprehensive performance indicator KP increased from 2.27 to 4.63 in the summer scenario, while it increased from 2.08 to 4.34 in the winter scenario. Moreover, the profits under the two scenarios were raised by 39.2% and 42.5%, respectively.
- (d)
- The cold-end optimization is compared with other flexibility technologies. The results show that compared with the integration of external flexibility devices, the cold-end optimization has significant advantages in terms of cost and risk, although the effect of improving AGC response is slightly worse than that of batteries and flywheels. Moreover, compared with the unit internal adjustment methods, the operational safety risk is lower, due to the fact that the cold-end optimization technology will not affect the operation of the boiler.
This study provides deep insights and transferable ideas for improving the ramp rate and accuracy of the AGC responses of coal-fired power units. However, while the research focuses on studying the feasibility of cold-end optimization for flexibility improvement, the discussion on the control system remains insufficient. Therefore, future work should incorporate advanced control theories to enhance control robustness, which is critical for the practical implementation of the proposed cold-end optimization approach.
Author Contributions
Y.Z.: writing, original draft preparation. X.F.: writing, review, and editing. Z.K.: review and editing. Z.Y.: review and editing. J.L.: review and editing. W.Z.: review and editing. L.Z.: conceptualization, review, and editing. J.S.: investigation, review, and editing. All authors have read and agreed to the published version of the manuscript.
Funding
This research is financially supported by Project of Shandong Zhongshi Yitong Group Co., Ltd. (YTZB20230919).
Data Availability Statement
The original contributions presented in this study are included in the article. Further inquiries can be directed to the corresponding author.
Conflicts of Interest
Authors Yanpeng Zhang and Jinxu Lao were employed by the Shandong Zhongshi Yitong Group Co., Ltd. Authors Xinzhen Fang and Zijiang Yang were employed by the Shandong Zhengyuan Industrial Development Co., Ltd. Author Zihan Kong was employed by the Shandong Wangrui Materials Co., Ltd. Authors Wei Zheng and Lingkai Zhu were employed by the State Grid Shandong Electric Power Research Institute. The remaining author declares that the research was conducted in the absence of any commercial or financial relationships that could be construed as a potential conflict of interest.
Appendix A
Figure A1 shows the specific real-time regulations of the circulating water flow and the back pressure, based on a back pressure of 7 kPa. The results show that the rapid load decrease in the power unit can be achieved by reducing the circulating water flow to increase the back pressure (see Figure A1a). However, as shown in Figure A1b, the rapid load increase in the power unit could not be achieved by continuously increasing the circulating water flow due to the restriction of the choked back pressure (5.2 kPa).
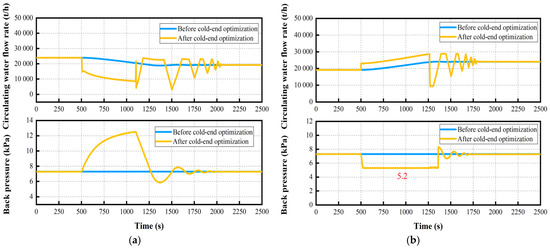
Figure A1.
Circulating water flow rate and the unit’s back pressure (back pressure: 7 kPa). (a) Ramp rate: −3% Pe/min; (b) Ramp rate: +3% Pe/min.
Figure A1.
Circulating water flow rate and the unit’s back pressure (back pressure: 7 kPa). (a) Ramp rate: −3% Pe/min; (b) Ramp rate: +3% Pe/min.
Figure A2 shows the specific real-time regulations of the circulating water flow and the back pressure, based on a back pressure of 11.8 kPa.
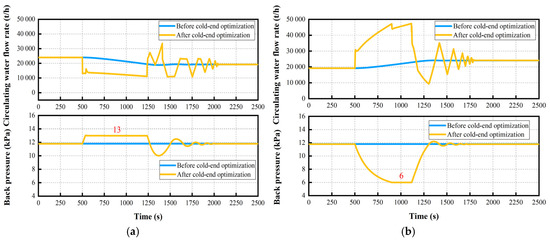
Figure A2.
Circulating water flow rate and the unit’s back pressure (back pressure: 11.8 kPa). (a) Ramp rate: −3% Pe/min; (b) Ramp rate: +3% Pe/min.
Figure A2.
Circulating water flow rate and the unit’s back pressure (back pressure: 11.8 kPa). (a) Ramp rate: −3% Pe/min; (b) Ramp rate: +3% Pe/min.
Appendix B
Table A1 lists the modeling parameters for both the cold-end system and pumps.
Table A1.
Main modeling parameters.
Table A1.
Main modeling parameters.
| Items | Value |
|---|---|
| 4.18 kJ/kg | |
| 3396 W/(m2·K) | |
| 2251 W/(m2·K) | |
| 155 t | |
| 18,232 m2 | |
| −7.08 × 10⁻⁹ | |
| −3.599 × 10⁻⁵ | |
| 32 | |
| 3.63 × 10⁻⁹ |
Appendix C
In Appendix C, a case study is presented to illustrate how back pressure influences unit output. Table A2 shows the power variation of the unit and the underlying mechanism when the back pressure changes from 5.2 kPa to 6.2 kPa. The results show that when the back pressure increases from 5.2 kPa to 6.2 kPa, the values of m5 to m8 rise, leading to a decrease in the unit’s power output by 2.519 MW. Meanwhile, the increase in back pressure causes a reduction in the condenser circulating water flow, resulting in a decrease in pump power by 0.251 MW. Overall, the unit’s power decreases by 2.268 MW.
Table A2.
Mechanism of back pressure influence on unit power output.
Table A2.
Mechanism of back pressure influence on unit power output.
| Parameter | Variation |
|---|---|
| +1.0 kPa | |
| +2.89 t/h | |
| +2.78 t/h | |
| +3.10 t/h | |
| +4.22 t/h | |
| −2.519 MW | |
| −0.251 MW | |
| −2.268 MW |
References
- National Energy Administration. China Electricity Industry Statistics 2023. Available online: https://www.nea.gov.cn/2024-01/26/c_1310762246.htm (accessed on 13 June 2025).
- The State Council Information Office of China. Renewable Energy Accounts for 56 pct of China’s Total Installed Capacity. Available online: https://english.www.gov.cn/archive/statistics/202501/28/content_WS6798de96c6d0868f4e8ef410.html (accessed on 13 June 2025).
- Zhang, Z.; Chen, Y.; Ma, T.; Tian, H.; Liu, J.; Zhou, M.; Wang, W. Multi-type energy storage expansion planning: A review for high-penetration renewable energy integration. Renew. Sustain. Energy Rev. 2025, 219, 115853. [Google Scholar] [CrossRef]
- Wang, C.; Chen, F.; Xu, P.; Cao, H.; Wang, W.; Sun, Q. Dynamic simulation of a subcritical coal-fired power plant with the emphasis on flexibility. Appl. Energy 2025, 392, 125976. [Google Scholar] [CrossRef]
- Liu, M.; Wang, S.; Zhao, Y.; Tang, H.; Yan, J. Heat–power decoupling technologies for coal-fired CHP plants: Operation flexibility and thermodynamic performance. Energy 2019, 188, 116074. [Google Scholar] [CrossRef]
- Wang, C.; Song, J. Performance assessment of the novel coal-fired combined heat and power plant integrating with flexibility renovations. Energy 2023, 263, 125886. [Google Scholar] [CrossRef]
- Li, J.; Li, X.; Yan, P.; Zhou, G.; Liu, J.; Yu, D. Thermodynamics, flexibility and techno-economics assessment of a novel integration of coal-fired combined heating and power generation unit and compressed air energy storage. Appl. Energy 2023, 339, 120924. [Google Scholar] [CrossRef]
- Wang, C.; Song, J.; Zheng, W.; Zhu, L.; Guo, J.; Wang, W. Integration of compressed air energy storage into combined heat and power plants: A solution to flexibility and economy. Energy Convers. Manag. 2023, 290, 117215. [Google Scholar] [CrossRef]
- Zhang, K.; Liu, M.; Zhao, Y.; Yan, H.; Yan, J. Design and performance evaluation of a new thermal energy storage system integrated within a coal-fired power plant. J. Energy Storage 2022, 50, 104335. [Google Scholar] [CrossRef]
- Miao, L.; Liu, M.; Zhang, K.; Zhao, Y.; Yan, J. Energy, exergy, and economic analyses on coal-fired power plants integrated with the power-to-heat thermal energy storage system. Energy 2023, 284, 129236. [Google Scholar] [CrossRef]
- Zhang, K.; Zhao, Y.; Liu, M.; Gao, L.; Fu, Y.; Yan, J. Flexibility enhancement versus thermal efficiency of coal-fired power units during the condensate throttling processes. Energy 2021, 218, 119534. [Google Scholar] [CrossRef]
- Liu, Z.; Wang, C.; Fan, J.; Liu, M.; Xing, Y.; Yan, J. Enhancing the flexibility and stability of coal-fired power plants by optimizing control schemes of throttling high-pressure extraction steam. Energy 2024, 288, 129756. [Google Scholar] [CrossRef]
- Chen, C.; Zhao, C.; Liu, M.; Wang, C.; Yan, J. Enhancing the load cycling rate of subcritical coal-fired power plants: A novel control strategy based on data-driven feedwater active regulation. Energy 2024, 312, 133627. [Google Scholar] [CrossRef]
- Wang, H.; Qiu, B.; Zhao, F.; Yan, T. Method for increasing net power of power plant based on operation optimization of circulating cooling water system. Energy 2023, 282, 128392. [Google Scholar] [CrossRef]
- Naderi, E.; Azizivahed, A.; Asrari, A. A step toward cleaner energy production: A water saving-based optimization approach for economic dispatch in modern power systems. Electr. Power Syst. Res. 2022, 204, 107689. [Google Scholar] [CrossRef]
- Wang, P.; Wang, Y.; Wang, B. Optimization operation of steam turbine cold end and best back pressure research and application. Turbine Technol. 2016, 58, 55–57+60. (In Chinese) [Google Scholar]
- Wang, W.; Zeng, D.; Liu, J.; Niu, Y.; Cui, C. Feasibility analysis of changing turbine load in power plants using continuous condenser pressure adjustment. Energy 2014, 64, 533–540. [Google Scholar] [CrossRef]
- Wang, W.; Zeng, D.; Liu, J.; Niu, Y.; Cui, C. An improved coordinated control strategy for boiler-turbine units supplemented by cold source flow adjustment. Energy 2015, 88, 927–934. [Google Scholar] [CrossRef]
- Li, Y.; Zhao, L.; Zhang, X.; Wei, H.; Du, X. Energy consumption during transient operation of coal-fired generating units with cold end system back pressure regulation. Appl. Therm. Eng. 2024, 248, 123188. [Google Scholar] [CrossRef]
- Han, Z.; Xiang, P. Modeling condensate throttling to improve the load change performance of cogeneration units. Energy 2020, 192, 116684. [Google Scholar] [CrossRef]
- Dhir, V.; Lienhard, J. Laminar Film Condensation on Plane and Axisymmetric Bodies in Nonuniform Gravity. ASME J. Heat Mass Transf. 1971, 93, 97–100. [Google Scholar] [CrossRef]
- Yao, L.; Xiao, X.; Wang, Y.; Yao, X.; Ma, Z. Dynamic modeling and hierarchical control of a concentrated solar power plant with direct molten salt storage. Energy 2022, 252, 123999. [Google Scholar] [CrossRef]
- Wang, W.; Liu, J.; Zeng, D.; Li, Z.; Cui, C. Variable-speed technology used in power plants for better plant economics and grid stability. Energy 2012, 45, 588–594. [Google Scholar] [CrossRef]
- Wang, C.; Song, J.; Zheng, W.; Liu, Z.; Lin, C. Analysis of economy, energy efficiency, environment: A case study of the CHP system with both civil and industrial heat users. Case Stud. Therm. Eng. 2022, 30, 101768. [Google Scholar] [CrossRef]
- Wang, R.; Du, X.; Shi, Y.; Deng, W.; Wang, Y.; Sun, F. A novel system for reducing power plant electricity consumption and enhancing deep peak-load capability. Energy 2024, 295, 131031. [Google Scholar] [CrossRef]
- Afram, A.; Janabi-Sharifi, F. Gray-box modeling and validation of residential HVAC system for control system design. Appl. Energy 2015, 137, 134–150. [Google Scholar] [CrossRef]
- Yin, J.; Liu, M.; Zhao, Y.; Wang, C.; Yan, J. Dynamic performance and control strategy modification for coal-fired power unit under coal quality variation. Energy 2021, 223, 120077. [Google Scholar] [CrossRef]
- DLT 657-2015; Code for Acceptance Test of Modulating Control System in Fossil Fuel Power Plant. China Electricity Council: Beijing, China, 2015. Available online: https://std.samr.gov.cn/hb/search/stdHBDetailed?id=8B1827F21C35BB19E05397BE0A0AB44A (accessed on 23 June 2025).
- Shandong Energy Regulatory Office of National Energy Administration of the People’s Republic of China. Implementing Rules for the Management of Electricity Auxiliary Services in Shandong Province. Available online: https://sdb.nea.gov.cn/dtyw/tzgg/202309/t20230919_110474.html (accessed on 23 June 2025).
- Wang, S.; Yan, H.; Li, J.; Zhang, Y.; Ma, H.; Han, Z.; Xu, C. Power distribution strategy of energy storage system auxiliary secondary frequency regulation considering battery life. Clean Coal Technol. 2024, 30, 95–101. (In Chinese) [Google Scholar]
- Yang, T.; Liu, Z.; Zeng, D.; Zhu, Y. Simulation and evaluation of flexible enhancement of thermal power unit coupled with flywheel energy storage array. Energy 2023, 281, 128239. [Google Scholar] [CrossRef]
- Wang, C.; Liu, F. Dynamic performance of a power plant integrating with molten salt thermal energy storage. Appl. Therm. Eng. 2025, 262, 125223. [Google Scholar] [CrossRef]

Disclaimer/Publisher’s Note: The statements, opinions and data contained in all publications are solely those of the individual author(s) and contributor(s) and not of MDPI and/or the editor(s). MDPI and/or the editor(s) disclaim responsibility for any injury to people or property resulting from any ideas, methods, instructions or products referred to in the content. |
© 2025 by the authors. Licensee MDPI, Basel, Switzerland. This article is an open access article distributed under the terms and conditions of the Creative Commons Attribution (CC BY) license (https://creativecommons.org/licenses/by/4.0/).