Article

Short-Term Wind Power Prediction Model Based on PSO-CNN-LSTM

1
Electric Power Science Research Institute, State Grid Gansu Electric Power Company, Lanzhou 730070, China
2
School of Information Science & Engineering, Lanzhou University, Lanzhou 730070, China
*
Author to whom correspondence should be addressed.
Energies 2025, 18(13), 3346; https://doi.org/10.3390/en18133346
Submission received: 28 April 2025 / Revised: 27 May 2025 / Accepted: 3 June 2025 / Published: 26 June 2025

Abstract

Power is fundamental to modern energy systems. As a key renewable source, wind energy’s inherent fluctuations pose significant challenges to power grid operation. The accurate forecasting of wind power integration is therefore essential to enhance grid stability, optimize renewable utilization, and advance cleaner energy transitions alongside sustainable energy development. To improve short-term wind power prediction accuracy, this study constructs a hybrid particle swarm optimization (PSO)-CNN-LSTM model for seasonal forecasting. To explicitly address seasonal impacts, the model design incorporates four-season dataset partitioning (spring, summer, autumn, winter), with prediction validity systematically verified per season. The predictive performance of the proposed PSO-CNN-LSTM hybrid algorithm is evaluated against benchmark models using four statistical metrics: RMSE, MAE, MSE, and R2. The results demonstrate that the PSO-CNN-LSTM model achieves lower RMSE, MAE, and MSE values compared to alternative models. Concurrently, its higher R2 value indicates superior alignment between model predictions and the dataset. A comparative analysis of the four models confirms that the PSO-CNN-LSTM framework delivers precise seasonal power generation forecasts with enhanced adaptability and higher prediction accuracy.

1. Introduction

Globally, with the increase in local energy demand and the deterioration of pollution levels, environmental problems are becoming more serious. Climate warming and energy shortages have become pressing global problems to be solved [1,2,3]. With the change in climate conditions and the growing demand for energy across the world, various methods of producing renewable energy have been studied [4]. As a sustainable and renewable form of energy, wind power boasts significant development potential and aligns with the demands of environmentally friendly practices [5]. It is widely used across the world. By 2021, China achieved global leadership in wind energy, with its onshore capacity exceeding 300 million kW and offshore installations surpassing those of all other nations [6].
However, wind power generation is seriously affected by environmental factors, with high randomness, volatility, and uncertainty, which brings great challenges to power grid integration, electricity dispatch, and consumption [7,8]. The research shows that, when the accuracy of wind speed prediction can be improved by about 10%, the power generation of a wind turbine will increase by about 30% compared with the expected value [9]. Nevertheless, wind speed exhibits inherent stochasticity, rendering precise forecasting challenging. This data volatility impedes model training, ultimately yielding substantial prediction inaccuracies [10]. Therefore, the accurate prediction of wind power can not only ensure the safe and stable operation of the power grid and improve efficiency but also help to reduce carbon dioxide emissions and promote the sustainable transformation to clean energy. To date, most studies have found that wind power prediction methods can be roughly divided into three categories: physical methods, statistical methods, and artificial intelligence algorithms [11,12,13,14,15,16]. Based on the existing research results, as shown in Figure 1, this paper presents a flow chart of wind power prediction technology. The physical model is used to estimate wind power through physical factors and meteorological data. Physical modeling approaches demand extensive parameter specifications and computationally expensive simulations, rendering them impractical for operational wind forecasting [17,18]. In the three dimensions of computational efficiency, prediction accuracy, and short-term applicability, statistical methods have significant advantages [19]. In the fields of engineering, economics, and natural sciences, statistical methods can effectively deal with the correlation of observations in massive amounts of data. In the current research, statistical methods such as time series analysis and Kalman filtering are mainly used [20]. Compared with traditional technologies, AI shows a stronger ability to capture the nonlinear characteristics of wind speed time series, which provides an effective way to improve short-term prediction accuracy [21]. In the field of power prediction, the time scale is the core basis of classification, as follows: Ultra-short-term prediction focuses on power changes in the next 4 h, and outputs prediction results with a resolution of 15 min [22]. Short-term prediction covers the next 72 h, and its time resolution is also 15 min. Medium- and long-term forecasts produce a macro assessment, using monthly, quarterly, and annual time scales to assess the overall power generation potential of wind farms [23]. Ultra-short-term wind power forecasting is critical for ensuring stable power grid operation. This technology leverages the high-precision foresight of power fluctuations to effectively mitigate the inherent intermittency and volatility of wind generation, thereby reducing associated scheduling pressures and safety margin risks. Consequently, wind power prediction algorithms and models—serving as key technologies for ensuring grid safety and economic operation—have been extensively investigated by researchers worldwide. Numerous studies have developed diverse prediction techniques employing distinct methodologies to address these inherent risks and challenges. Zong et al. [24] first used discrete wavelet transform (DWT) to decompose and normalize the original data. Subsequently, each model component generated by decomposition is input into the long-term and short-term memory (LSTM) network. In order to optimize the performance of the model, the particle swarm optimization (PSO) algorithm is introduced to optimize the hyperparameters of the LSTM and, therefore, to achieve the best prediction effect and finally obtain the prediction results. Xiong et al. [25] first introduced DWT to decompose and normalize the original data, and then input each component into the LSTM network; in addition, they used the PSO algorithm to optimize the network hyperparameters to achieve optimal prediction performance, and finally output the predicted value. Kong Z et al. [26] proposed the use of a CNN to extract spatial features and organize them into a time series input GRU network to capture the temporal features. Yu [27] and Zhang et al. [28] constructed prediction models integrating spatio-temporal features based on a CNN and LSTM.
Traditional LSTM models exhibit limitations including a large parameter scale, high computational resource consumption, and slow training speeds. While LSTM mitigates the vanishing gradient problem inherent in RNNs through gating mechanisms, it remains challenged in modeling dependencies within very long sequences. Furthermore, existing LSTM approaches often demonstrate insufficient uncertainty handling, prediction inaccuracy, and low generalization capability, rendering them inadequate for reliable power forecasting.
To address these shortcomings, this paper proposes four LSTM-based power prediction methods. It specifically explores the optimization of a CNN-LSTM model using the PSO algorithm. Building on the fundamental principles of LSTM neural networks and the PSO algorithm, we establish a PSO-CNN-LSTM model for short-term wind power prediction across different seasons.
Simulation experiments utilize a comprehensive year-long dataset comprising measured power output and meteorological data from a wind farm in Gansu Province. This dataset fully encompasses the meteorological characteristics of all four seasons. Within this study, a hybrid prediction architecture integrating PSO, CNN, and LSTM is designed and implemented. Comparative evaluations against multiple benchmark models demonstrate that the proposed PSO-CNN-LSTM hybrid framework achieves a significantly superior prediction accuracy, with its error metrics systematically lower than those of alternative methods.

2. Methodology

2.1. Influencing Factors of Wind Power

Wind turbine energy conversion efficiency is constrained by multiphysics coupling effects. Wind speed—the primary determinant of wind power—exhibits inherent strong stochastic fluctuations that limit the accuracy of conventional prediction methods. Beyond wind speed, meteorological parameters (wind direction, ambient temperature, atmospheric pressure, and relative humidity) collectively govern turbine operation. These parameters induce nonlinear interactions through aerodynamic characteristics, mechanical transmission, and electrical conversion processes. Furthermore, they manifest spatiotemporal complexities: temporal non-stationarity and spatial distribution heterogeneity arising from geographical variations (e.g., turbulence intensity, vertical wind shear, and terrain elevation). This multidimensional variability significantly increases the dynamic complexity and uncertainty of wind power forecasting.
Leveraging annual wind speed/wind direction time series observations (Figure 2), we construct a wind rose diagram characterizing the statistical distribution of wind resources. This analysis quantifies the dominant wind direction frequency and typical wind speed magnitude ranges within the study area.

2.2. Data Preprocessing

This study utilizes 67,780 meteorological datasets sampled at 5-min intervals from a Gansu Province wind farm (March 2021 to February 2022) for simulation analysis. Within the seasonal division framework (Table 1), we implement four hybrid models—CNN-LSTM, PSO-LSTM, QPSO-LSTM, and PSO-CNN-LSTM—to forecast seasonal power output. Given multivariate dependencies, identifying key predictors influencing power generation is essential. For each season, the dataset is partitioned into 70% for training/validation and 30% for testing. To eliminate feature scale disparities and enhance data comparability, min–max normalization (Equation (1)) transforms all values to the [0, 1] range.
x i * = x i x m i n x m a x x m i n
The Pearson correlation coefficient was used to quantitatively analyze the linear correlation strength between multiple variables (see Formula (2), range [−1, 1]).
ρ x , y = E X Y E X E Y E X 2 E X 2 E Y 2 E Y 2 = n i = 1 n x i y i i = 1 n x i i = 1 n y i n i = 1 n x i 2 i = 1 n x i 2 n i = 1 n y i 2 i = 1 n y i 2
Through the correlation test of wind power and its key environmental driving factors (wind speed, wind direction, temperature, air pressure, humidity), the core input feature set of the prediction model is screened based on the statistical significance standard (p < 0.01). Figure 3 shows the correlation coefficient distribution between environmental factors and wind power, and quantitatively reveals the multivariate coupling strength.
A correlation analysis shows that (Figure 2) wind speed and temperature are significantly positively correlated with wind power, while wind direction, humidity, and air pressure are negatively correlated. In view of the strongest positive Pearson correlation of wind speed (Figure 3), this study established it as the core driving variable of the prediction model. Figure 4 further reveals the dynamic coupling mechanism of wind speed and power under different operating conditions through the joint distribution characteristics of wind speed/power bivariate time series.

2.3. The Composition Module of Deep Network

The PSO-CNN-LSTM hybrid prediction model constructed in this study will be compared with the four benchmark models of CNN-LSTM, CNN-LSTM-ATT, PSO-LSTM, and QPSO-LSTM. The network architecture of each model is described in detail below.

2.3.1. LSTM Model

LSTM, a special RNN structure with memory cell characteristics, effectively captures the remote correlation in time series through selective forgetting and memory update mechanisms, and overcomes the gradient attenuation defect of the basic RNN model. As a key variant of recurrent neural network, LSTM is widely used because of its ability to extract temporal features efficiently. In wind power prediction, there are complex dependencies between power values at different time points, and LSTM can capture this feature well [29]. The main feature of the LSTM model is that it retains the unit state in the previous input mode. The core advantage of LSTM lies in its gating mechanism’s ability to filter feature information. The input gate, forgetting gate, and output gate work together to achieve directional extraction of key timing features through differentiated weight adjustment [30].
The core of the LSTM unit consists of three gating structures: input gate, forget gate, and output gate [31]. The gating mechanism of the LSTM achieves long-term dependence modeling through differentiated information screening: the forget gate controls the historical information retention strength of cell state; the input gate regulates the injection weight of new features to the cell state; the output gate determines the output feature mapping of the current cell state. This mechanism effectively alleviates the problem of gradient disappearance in long-term sequential training, so as to accurately capture the long-term sequential dependence characteristics of wind power. However, the hyperparameters (such as hidden layer dimension, and learning rate) of the existing LSTM network are mostly dependent on empirical settings, which makes it difficult to ensure that the model converges to the global optimal solution and restricts the upper limit of its prediction accuracy [32]. The LSTM resolves the vanishing gradient problem inherent in traditional RNNs, enabling the effective modeling of nonlinear relationships between meteorological conditions and turbine parameters for wind power prediction [33]. The unit structure is illustrated in Figure 5.

2.3.2. CNN Model

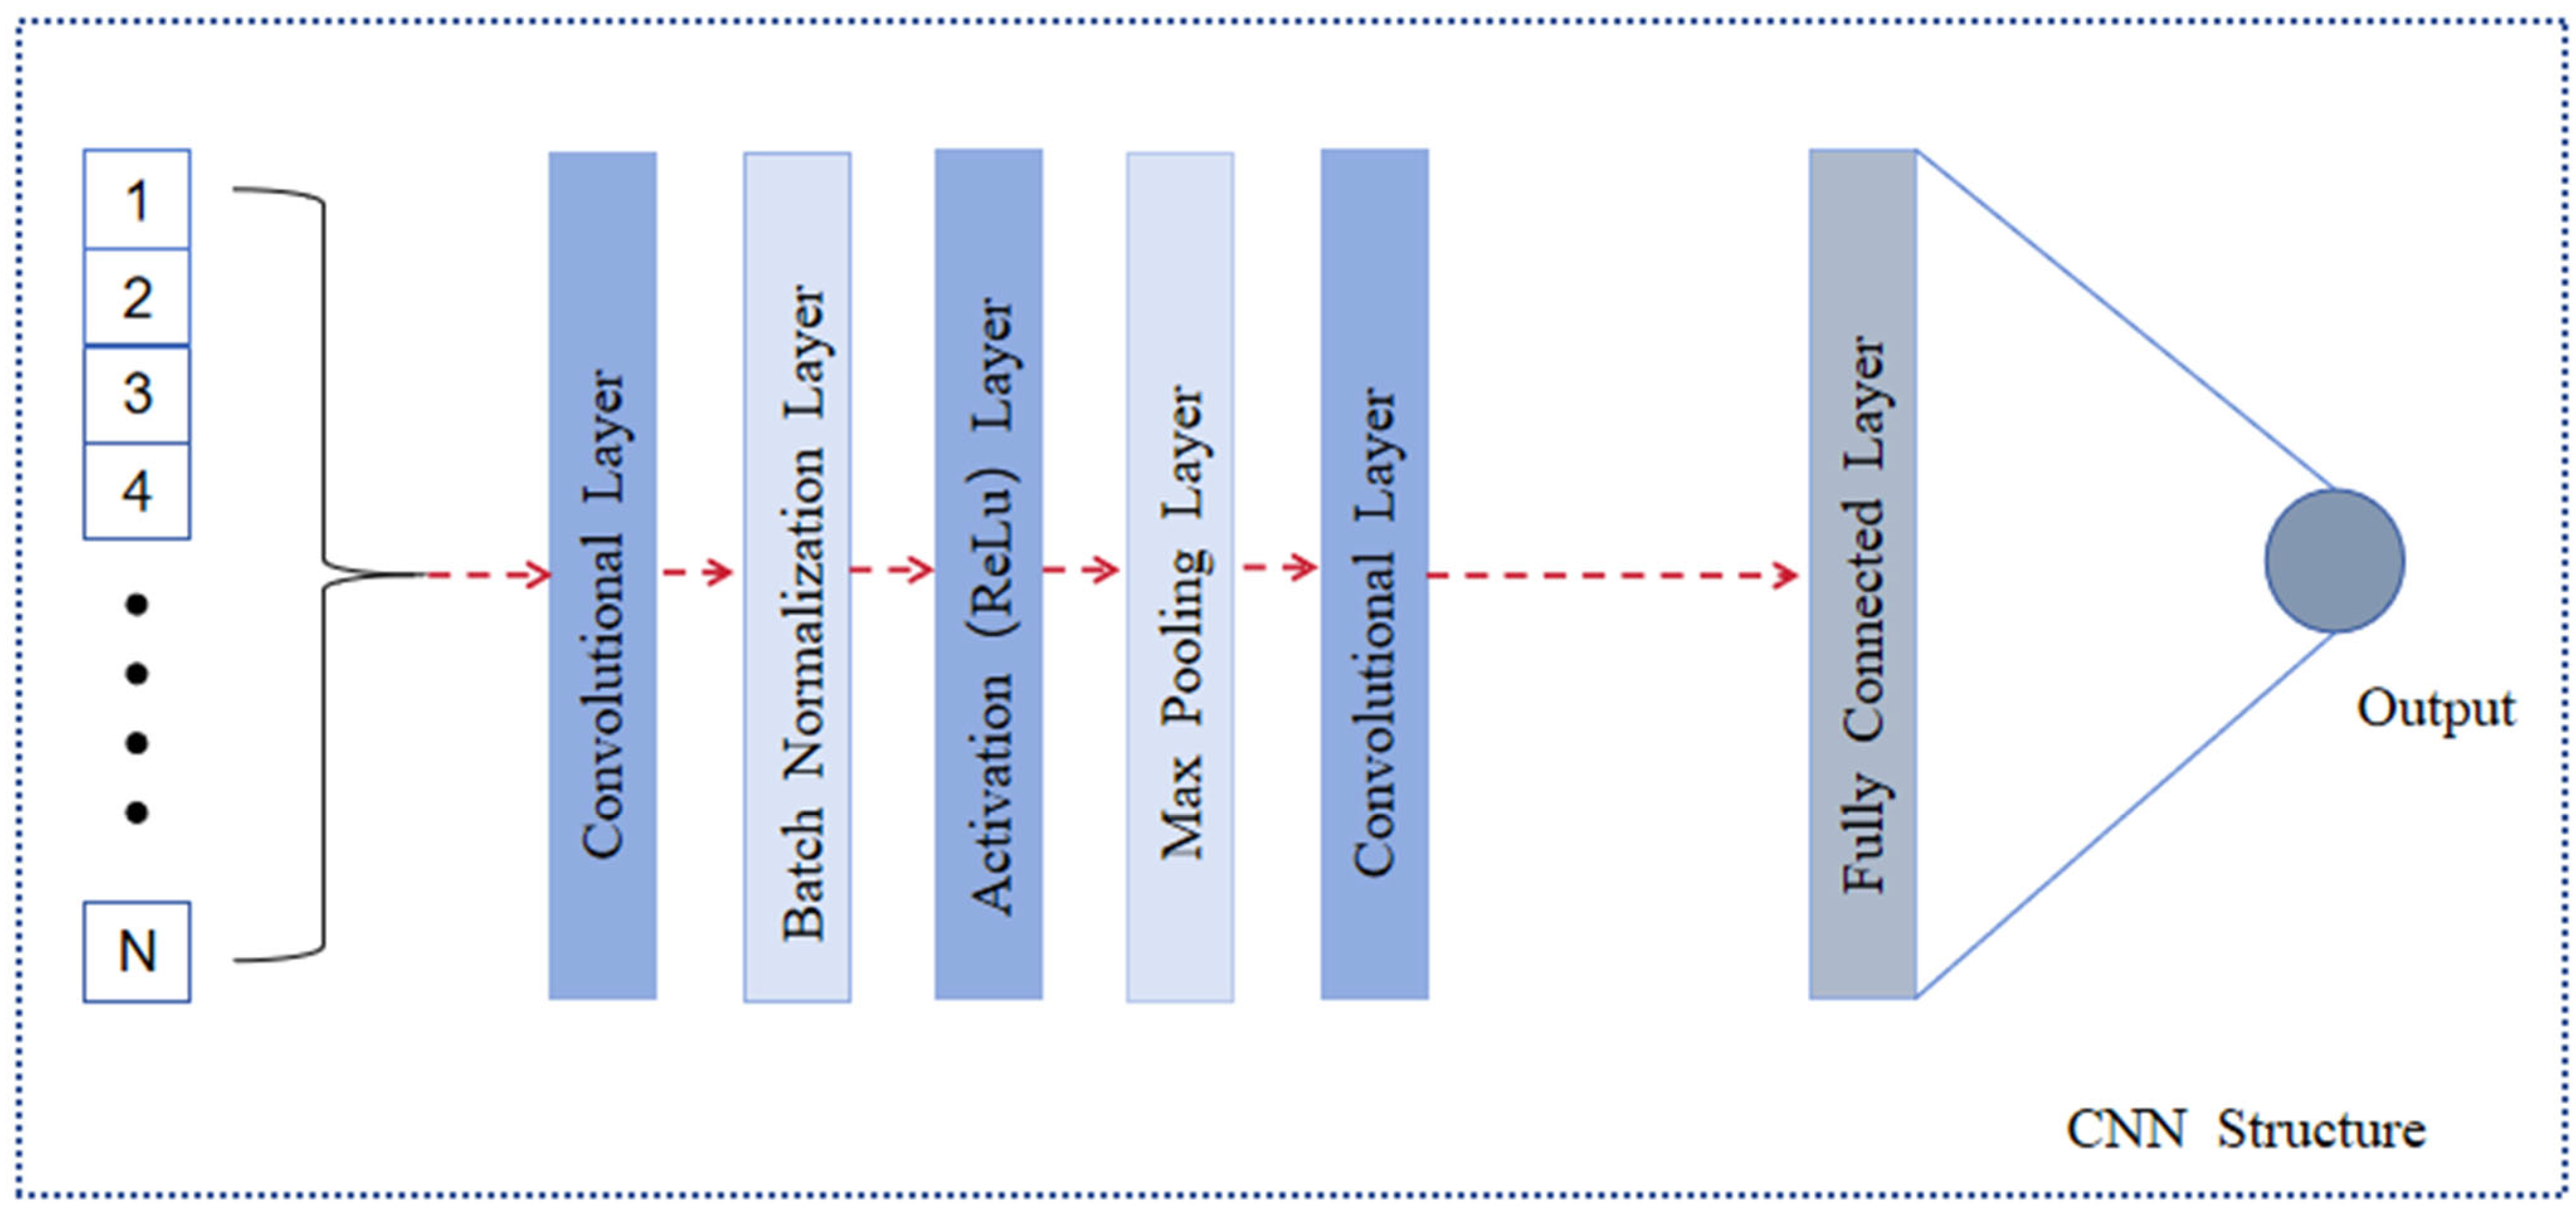
The hierarchical feature extraction mechanism of CNN is inspired by the biological discovery of cat brain visual pathway. The algorithm realizes the efficient training of the deep architecture through a local connection and weight sharing strategy. It is a learning algorithm that successfully trains the multi-layer network structure [34]. The CNN was originally designed for two-dimensional/three-dimensional data structure design (such as image recognition and medical image diagnosis), but its feature extraction ability is also suitable for univariate one-dimensional time series data modeling [35]. CNN excels at capturing relationships within multi-dimensional time series data through its spatial structure. It consists mainly of convolution and pooling layers, which leverage local connections, weight sharing, and other techniques to significantly reduce the number of parameters, enhance feature extraction, speed up training, and improve generalization [36].
The core components are the convolution and pooling layers, with the convolution layer responsible for extracting information from the input data. The convolutional layer’s formula is provided in Equation (3):
M c , t = f M train , t K + b = f j M train , j K t j + b j
The pooling layer is a neural network layer that performs a down-sampling operation on the input data [37]. By aggregating the input feature maps according to certain rules, the amount of data is reduced, the feature dimension is reduced, and the key feature information is retained. The anti-interference ability of the network is improved. The maximum pooling layer’s formula is given in Equation (4).
M p = max M C , t m , n
The CNN structure diagram is shown in Figure 6.

2.3.3. CNN-LSTM Module

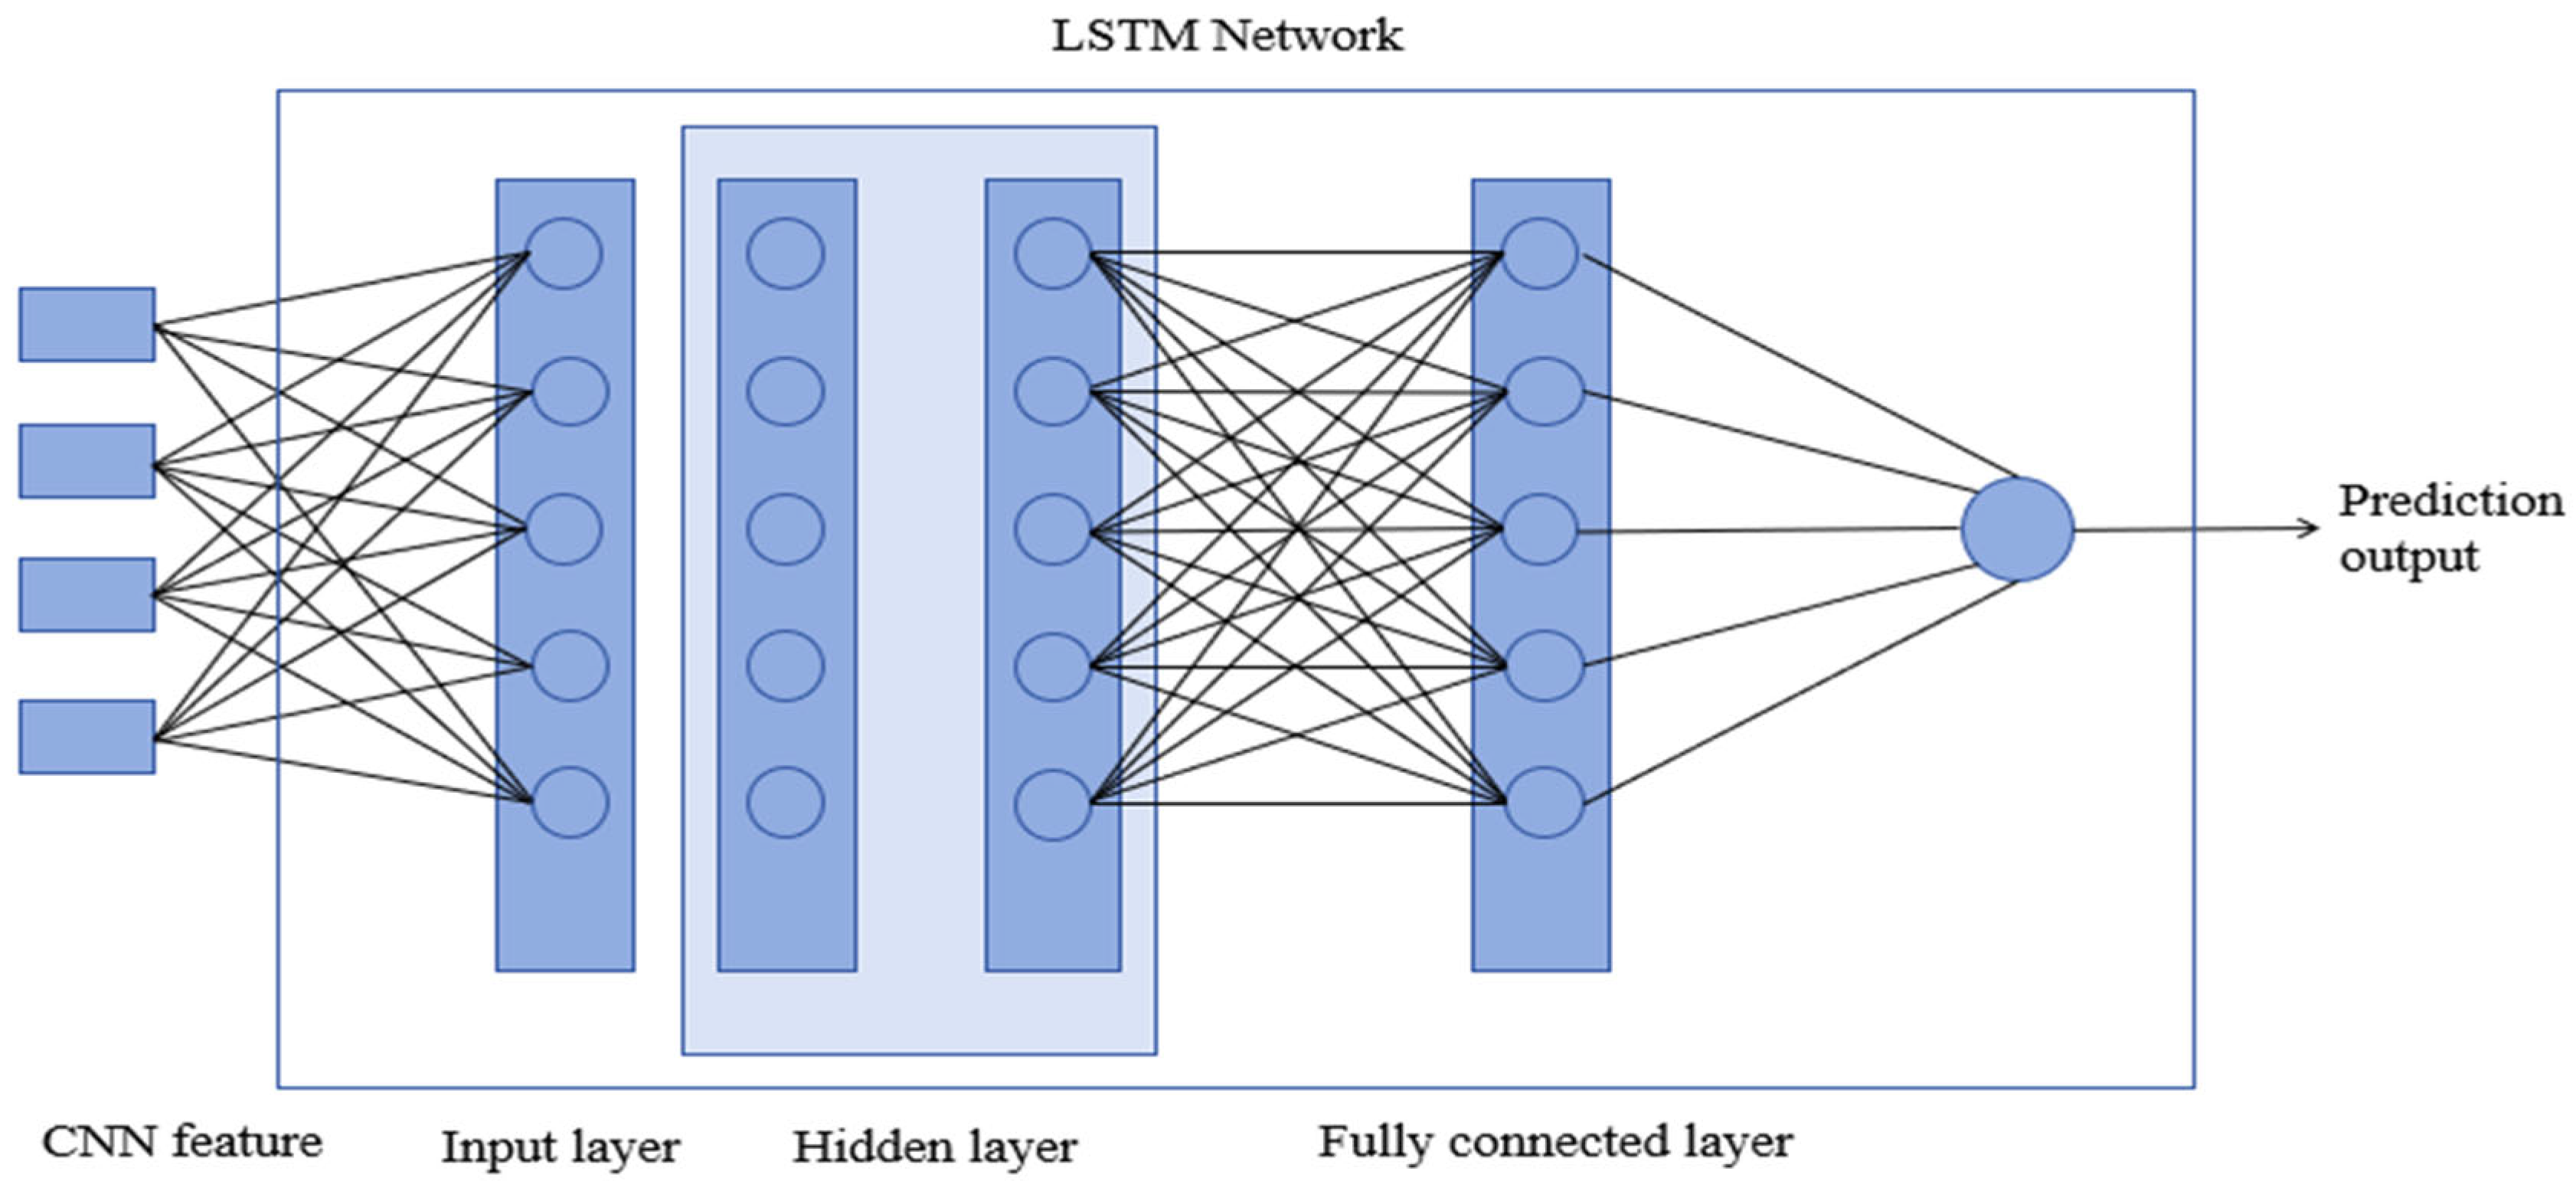
The hybrid CNN-LSTM architecture employs a distinctive dual-pathway design. Initially, raw data enters the convolutional module where sliding kernel operations along spatial dimensions identify localized patterns. Subsequently, the LSTM layer processes sequential data to capture temporal dependencies. This framework integrates processed sequence data from LSTM with convolutional feature maps, enabling comprehensive spatiotemporal feature extraction for accurate predictive analysis. Figure 7 illustrates the CNN-LSTM model’s schematic architecture.

3. Intelligent Optimization Algorithm

3.1. Particle Swarm Algorithm

Kennedy and Eberhart first proposed PSO in 1995. Compared with other optimization algorithms, the PSO algorithm is easy to implement and less controlled, so it has attracted the attention of many scholars in the past few years. The sociological behavior of flocks of birds and schools of fish inspired the PSO algorithm, which is an algorithm based on swarm intelligence [38]. It finds the optimal solution by simulating the motion of particles in the search space. The flow chart is shown in Figure 8.

3.2. Quantum Particle Swarm Optimization

Traditional PSO algorithms are often limited by particle position constraints, reducing movement randomness and increasing susceptibility to premature convergence in local optima. To enhance global optimization performance, QPSO was developed as an extension of conventional PSO [39]. Drawing inspiration from quantum mechanical principles, QPSO employs wave functions to estimate particle existence probabilities within spatial regions. Compared with standard PSO, QPSO demonstrates three key advantages: fewer adjustable parameters, improved computational efficiency, and enhanced global search capability.

3.3. Intelligent Optimization Algorithm Combined with LSTM

Traditional LSTM models exhibit limitations in time-series forecasting applications, including insufficient prediction accuracy and limited generalization capability, rendering them inadequate for power prediction tasks. This study employs PSO and QPSO to optimize key LSTM hyperparameters—learning rate and iteration count—thereby determining optimal configurations and establishing enhanced models. Since PSO-LSTM and QPSO-LSTM architectures differ solely in optimization strategy while sharing identical construction workflows, we present the QPSO-LSTM implementation as representative. Figure 9 illustrates the integrated QPSO-LSTM prediction framework.

3.4. PSO Algorithm Optimizes Hybrid CNN-LSTM Model

The PSO-CNN-LSTM hybrid architecture integrates complementary strengths of PSO, CNN, and LSTM networks for wind power time-series forecasting. Its core innovation employs PSO to globally optimize CNN-LSTM hyperparameters, overcoming limitations of manual parameter tuning that often converge to local optima. Functionally, the CNN module serves as a spatial feature extractor where multi-scale convolutional kernels automatically capture local fluctuation patterns and short-term spatiotemporal correlations in power sequences. Simultaneously, the LSTM module models long-term dependencies between meteorological parameters and power generation through gated memory mechanisms. A dedicated feature fusion layer enables multi-scale spatiotemporal feature coupling, significantly enhancing the modeling capacity for nonstationary wind power series (Figure 10).

3.5. Statistical Method

This paper evaluates prediction accuracy using RMSE, MAE, MSE, and R2. The expressions are shown as Equations (5)–(7), respectively:
MAE = 1 N i = 1 n y ^ y
MAPE = 100 % n i = 1 n y ^ y y
R 2 = i = 1 n y ^ y ¯ 2 i = 1 n y y ¯ 2
Among them, the smaller the values of RMSE, MAE, and MAPE, the better the fitting effect and the higher the accuracy. R2 is an index to evaluate the fitting degree of the model. The closer the value is to 1, the better the fitting effect of the model on the data is [40].

4. Case Study

Figure 11 presents the seasonal distribution of average power output. The data indicate significantly higher power generation during spring compared to winter. This seasonal variation stems from meteorological factors: elevated wind speeds in spring enhance wind power conversion efficiency, whereas reduced wind velocities in winter substantially diminish turbine performance and overall output. Concurrently, extended daylight hours and reduced cloud cover during spring improve photovoltaic efficiency. Conversely, prevalent overcast conditions, snowfall, and haze during winter reduce solar irradiance and cause snow accumulation on panels, further diminishing the photovoltaic yield.
In order to verify the generalization ability of the proposed PSO-CNN-LSTM model, two extreme weather scenarios of strong wind and saturated humidity (relative humidity > 95%) were selected as test sets. Figure 12 shows the comparison of prediction error indicators (including MAE, RMSE, and MAPE) of different models under such challenging conditions. The empirical results show that the hybrid architecture still maintains a significant accuracy advantage under non-stationary boundary conditions.
The model performance shown in Figure 13a,b is basically the same, indicating that the relative performance of each model is stable under different weather conditions. Overall, the PSO-CNN-LSTM model has the best comprehensive performance under these evaluation indicators, and may offer more advantages in tasks such as predicting power.
Figure 12 presents the summer power prediction scatter plot comparing actual versus predicted values. The coefficient of determination (R2), ranging from 0 to 1, quantifies prediction accuracy where values approaching 1 indicate superior model fit. An analysis reveals PSO-CNN-LSTM data points cluster significantly closer to the regression line than comparator models, demonstrating enhanced predictive capability. This alignment indicates robust performance, while comparative models exhibit substantial dispersion from the regression line, reflecting their inferior predictive accuracy. Similar performance advantages for PSO-CNN-LSTM are observed across other seasons.
To further evaluate the model’s efficacy, we analyzed 275 five-minute interval data points from 2 June 2021, partitioned into daytime (06:00–18:00) and nighttime (18:00–06:00) subsets. The dataset was equally divided: first 50% for training, remaining 50% for testing. Model errors were quantified to enable precise performance comparisons (Table 2).
Table 2 demonstrates clear performance differentials:
Daytime: PSO-CNN-LSTM achieves peak R2 (0.9995), indicating near-perfect fit. CNN-LSTM shows the lowest R2 (0.9758);
Nighttime: PSO-CNN-LSTM maintains exceptional performance (R2 = 0.9999), while CNN-LSTM (R2 = 0.9948) underperforms relative to other models.
Across both temporal phases, PSO-CNN-LSTM dominates all evaluation metrics, confirming its robustness for diurnal power forecasting. CNN-LSTM consistently ranks lowest, particularly during daytime where its error metrics (RMSE = 0.0382, MAE = 0.0248, MSE = 0.0015) substantially exceed alternatives. While all models exhibit nighttime performance improvements, PSO-CNN-LSTM, QPSO-LSTM, and PSO-LSTM demonstrate superior error control and goodness-of-fit, establishing them as preferred candidates for prediction tasks.
Wind power exhibits random and unstable characteristics due to different meteorological factors. In order to understand the change in power more directly and clearly, Figure 13 visualizes the histogram of the corresponding power data of the four seasons through normal distribution fitting in order.
From Figure 14, we can clearly see that the power distribution shows a trend whereby the number of records is large in the low-power section, and the number of records decreases first; it increases first and then decreases with the increase in power. This shows that the frequency of wind power at the low power level is high, and that at the high power level is lower. Figure 15 compares the seasonal power prediction performance of all benchmark models.
A comparative model performance analysis reveals significant differences, as quantified in Table 3. The PSO-CNN-LSTM model achieves near-perfect seasonal R2 values (spring: 0.9999; summer: 0.9999; autumn: 0.9996; winter: 0.9998). The CNN-LSTM-ATT implementation demonstrates that attention mechanisms substantially enhance baseline CNN-LSTM accuracy, though PSO-CNN-LSTM maintains superior performance across all seasons. Key observations include the following: Spring: PSO-CNN-LSTM yields RMSE = 2.1514 and MAE = 1.6311, outperforming CNN-LSTM (RMSE = 2.7239, MAE = 2.0678) and CNN-LSTM-ATT (33.42% higher RMSE, 27.73% higher MAE).
Summer: PSO-CNN-LSTM achieves optimal metrics (RMSE = 0.5469, MAE = 0.4237).
Across all seasons, PSO-CNN-LSTM demonstrates significantly lower prediction errors (RMSE, MAE, MSE) and superior R2 values compared to benchmark models, confirming its enhanced forecasting accuracy.

5. Conclusions

This study proposes PSO-CNN-LSTM, a novel hybrid framework for short-term wind power forecasting. The model innovatively integrates CNN, LSTM networks, and PSO to optimize CNN-LSTM hyperparameters. It achieves joint spatiotemporal feature representation through synergistic coupling of CNN’s spatial feature extraction and LSTM’s temporal modeling capabilities. By leveraging PSO’s global optimization strength, the framework simultaneously determines optimal LSTM hyperparameters and network topology, effectively mitigating traditional LSTM limitations and significantly enhancing predictive performance.
A comprehensive empirical analysis compares CNN-LSTM, PSO-LSTM, QPSO-LSTM, and the proposed PSO-CNN-LSTM. The results demonstrate PSO-CNN-LSTM’s consistent superiority over benchmark models (CNN-LSTM, CNN-LSTM-ATT, QPSO-LSTM), evidenced by significantly elevated R2 values and substantially reduced error metrics (RMSE, MAE, MSE)
This hybrid architecture represents a substantial advancement in wind power forecasting accuracy, overcoming traditional modeling limitations. Its validated performance provides an effective solution for power prediction in high-renewable-penetration grids.

Author Contributions

Conceptualization, Q.L.; methodology, Z.Z.; software, J.Z. (Jialin Zhang) and P.G.; validation, Q.Z.; formal analysis, Z.Z.; investigation, P.G.; resources, J.Z. (Jianmei Zhang) and H.Z.; data curation, J.Z. (Jianmei Zhang); writing—original draft preparation, Q.L.; writing—review and editing, J.Z. (Jialin Zhang); visualization, H.Z.; supervision, Q.Z.; All authors have read and agreed to the published version of the manuscript.

Funding

This research was funded by Key Research and Development Program of Gansu Province (Research on Uncertainty of Renewable Energy Output Considering Wide-Area Spatiotemporal Correlation) grant number [24YFGA056], and the APC was funded by [SCIENCE AND TECHNOLOGY DEPARTMENT OF GANSU PROVINCE].

Data Availability Statement

Data is unavailable due to privacy or ethical restrictions.

Acknowledgments

This work is supported by Key Research and Development Program of Gansu Province (24YFGA056, Research on Uncertainty of New Energy Output Considering Wide-Area Spatiotemporal Correlation).

Conflicts of Interest

Authors Qingquan Lv, Jialin Zhang, Jianmei Zhang, Zhenzhen Zhang, Qiang Zhou, Pengfei Gao and Haozhe Zhang were employed by the company Electric Power Science Research Institute, State Grid Gansu Electric Power Company. The remaining authors declare that the research was conducted in the absence of any commercial or financial relationships that could be construed as a potential conflict of interest.

References

  1. Zha, W.T.; Liu, J.; Li, Y.L.; Liang, Y.Y. Ultra-short-term power forecast method for the wind farm based on feature selection and temporal convolution network. ISA Trans. 2022, 129, 405–414. [Google Scholar] [CrossRef]
  2. Wang, J.J.; Shu, S.Q.; Xu, S.L. A point-interval wind speed prediction model based on entropy clustering and hybrid optimization weighted strategy. Renew. Energy 2025, 244, 122653. [Google Scholar] [CrossRef]
  3. Lv, Y.L.; Hu, Q.; Xu, H.; Lin, H.Y.; Wu, Y.F. An ultra-short-term wind power prediction method based on spatial-temporal attention graph convolutional model. Energy 2024, 293, 130751. [Google Scholar] [CrossRef]
  4. Bazionis, I.K.; Karafotis, P.A.; Georgilakis, P.S. A review of short-term wind power probabilistic forecasting and a taxonomy focused on input data. IET Renew. Power Gener. 2022, 16, 77–91. [Google Scholar] [CrossRef]
  5. Mi, X.W.; Liu, H.; Li, Y.F. Wind speed prediction model using singular spectrum analysis, empirical mode decomposition and convolutional support vector machine. Energy Convers. Manag. 2019, 180, 196–205. [Google Scholar] [CrossRef]
  6. Zhang, C.; Deng, W. Research on the development status and trend of China’s wind power industry. Electromech. Prod. Dev. Innov. 2023, 36, 206–208. [Google Scholar]
  7. Li, T.; Ai, L.J.; Yang, Q.S.; Zhang, X.X.; Li, H.; Lu, D.W.; Shen, H.T. Short-term wind power prediction based on multiscale numerical simulation coupled with deep learning. Renew. Energy 2025, 246, 122951. [Google Scholar] [CrossRef]
  8. He, Y.; Wang, W.; Li, M.; Wang, Q.H. A short-term wind power prediction approach based on an improved dung beetle optimizer algorithm, variational modal decomposition, and deep learning. Comput. Electr. Eng. 2024, 116, 109182. [Google Scholar] [CrossRef]
  9. Ackermann, T.; Söder, L. Wind energy technology and current status: A review. Renew. Sustain. Energy Rev. 2020, 4, 315–374. [Google Scholar] [CrossRef]
  10. Yildiz, C.; Acikgoz, H.; Korkmaz, D.; Budak, U. An improved residual-based convolutional neural network for very short-term wind power forecasting. Energy Convers. Manag. 2021, 228, 113731. [Google Scholar] [CrossRef]
  11. Xu, L.B.; Wang, W.; Zhang, T.; Yang, L.; Wang, S.Y.; Li, Y.D. Ultra-short-term wind power prediction based on the average influence value of neural network. Autom. Electr. Power Syst. 2017, 41, 40–45. [Google Scholar]
  12. Yue, X.Y.; Peng, X.G.; Li, L. Short-term wind power forecasting based on support vector machine optimized by whale. Proc. CSU-EPSA 2020, 32, 146–150. [Google Scholar]
  13. Chitsazan, M.A.; Fadali, M.S.; Trzynadlowski, A.M. Wind speed and wind direction forecasting using echo state network with nonlinear functions. Renew. Energy 2019, 131, 879–889. [Google Scholar] [CrossRef]
  14. Lai, G.K.; Chang, W.C.; Yang, Y.M. Modeling long and short-term temporal patterns with deep neural networks. arXiv 2018, arXiv:1703.07015v3. [Google Scholar]
  15. Ku, X.Y.; Wang, S.P. Research on advertising click-through rate prediction model based on convolution-LSTM network. Comput. Eng. Appl. 2019, 55, 193–197. [Google Scholar]
  16. Peng, S.M.; Zhu, J.C.; Wu, T.Z.; Yuan, C.C.R.; Cang, J.J.; Zhang, K.; Pecht, M. Prediction of wind and PV power by fusing the multi-stage feature extraction and a PSO-BiLSTM model. Energy 2024, 131345. [Google Scholar] [CrossRef]
  17. Li, L.J.; Li, Y.; Zhou, B.; Wu, Q.W.; Gong, Z.; Shen, X.Y.; Liu, H.L. An adaptive time-resolution method for ultra-short-term wind power prediction. Int. J. Electr. Power Energy Syst. 2020, 118, 105814. [Google Scholar] [CrossRef]
  18. Wang, H.Z.; Lei, Z.X.; Zhang, X.; Zhou, B.; Peng, J.C. A review of deep learning for renewable energy forecasting. Energy Convers. Manag. 2019, 198, 111799. [Google Scholar] [CrossRef]
  19. Liu, L.; Liu, J.C.; Ye, Y.; Liu, H.; Chen, K.; Li, D.; Dong, X.; Sun, M.Z. Ultra-short-term wind power forecasting based on deep Bayesian model with uncertainty. Renew. Energy 2023, 205, 598–607. [Google Scholar] [CrossRef]
  20. Wu, Q.; Zheng, H.L.; Zhu XGuo Liu, G.Q. Promoting wind energy for sustainable development by precise wind speed prediction based on graph neural networks. Renew. Energy 2022, 199, 977–992. [Google Scholar] [CrossRef]
  21. Li, K.; Shen, R.F.; Wang, Z.G.; Yan, B.W.; Yang, Q.S.; Zhou, X.H. An efficient wind speed prediction method based on a deep neural network without future information leakage. Energy 2023, 267, 126589. [Google Scholar] [CrossRef]
  22. Xue, Y.S.; Yu Chen Zhao, J.H.; Li, K.; Liu, X.Q.; Wu, Q.W.; Yang, G.Y. Review on short-term and ultra-short-term wind power prediction. Autom. Electr. Power Syst. 2015, 39, 141–151. [Google Scholar]
  23. Liu, D.G.; Wang, W.Q.; Zhang, H.E.; Qiu, G.; Hao, H.Y.; Li, G.Q.; Xiao, G.L. The application of Markov modified combination model in the prediction of medium and long-term available power of wind power in Xinjiang. Power Grid Technol. 2020, 44, 3290–3296. [Google Scholar]
  24. Zong, C.S.; Gao, Q.Z.; Wu, S. Short-term wind power prediction based on DWT-PSO-LSTM. J. Phys. Conf. Ser. 2023, 2520, 012037. [Google Scholar] [CrossRef]
  25. Xiong, B.R.; Lou, L.; Meng, X.Y.; Wang, X.; Ma, H.; Wang, Z.X. Short-term wind power forecasting based on attention mechanism and deep learning. Electr. Power Syst. Res. 2022, 206, 107776. [Google Scholar] [CrossRef]
  26. Kong, Z.Q.; Tang, B.P.; Deng, L.; Liu, W. Condition monitoring of wind turbines based on spatio-temporal fusion of SCADA data by convolutional neural networks and gated recurrent units. Renew. Energy 2020, 146, 760–768. [Google Scholar] [CrossRef]
  27. Yu, G.Z.; Liu, C.Q.; Tang, B.; Chen, R.U.; Liu, L.; Cui, C.Y.; Hu, Y.; Shen, L.X.; Muyeen, S.M. Short term wind power prediction for regional wind farms based on spatial-temporal characteristic distribution. Renew. Energy 2022, 199, 599–612. [Google Scholar] [CrossRef]
  28. Zhang, J.A.; Liu, D.; Li, Z.J.; Han, X.; Liu, H.; Dong, C.; Wang, J.Y.; Liu, C.Y.; Xia, Y.P. Power prediction of a wind farm cluster based on spatiotemporal correlations. Appl. Energy 2021, 302, 17568. [Google Scholar] [CrossRef]
  29. Zhu, S.Q.; Zhang, J.H.; Yu, L.F. Short-term power load forecasting based on QPSO-LSTM. Inf. Rec. Mater. 2024, 25, 240–242. [Google Scholar]
  30. Ewees, A.A.; Al-qaness, M.A.A.; Abualigah, L.; Elaziz, M.A. HBO-LSTM: Optimized long short term memory with heap-based optimizer for wind power forecasting. Energy Convers. Manag. 2022, 268, 116022. [Google Scholar] [CrossRef]
  31. Houran, M.A.; Bukhari, S.M.S.; Zafar, M.H.; Mansoor, M.; Chen, W.J. COA-CNN-LSTM: Coati optimization algorithm-based hybrid deep learning model for PV/wind power forecasting in smart grid applications. Appl. Energy 2023, 349, 121638. [Google Scholar] [CrossRef]
  32. Tong, J.J.; Yang, Y.Y.; Xu, X.Y.; Zhang, G.W.; Yuan, F.; Xiang, G. Shore Power System Load Forecasting Model Based on QPSO-LSTM Network. In Proceedings of the 2024 IEEE 10th International Power Electronics and Motion Control Conference (IPEMC2024-ECCE Asia), Chengdu, China, 17–20 May 2024; pp. 2450–2455. [Google Scholar]
  33. Xin, P.; Wang, H. Short-Term Wind Power Forecasting Based on VMD-QPSO-LSTM. In Proceedings of the 2024 IEEE 4th International Conference on Power, Electronics and Computer Applications (ICPECA), Shenyang, China, 26–28 January 2024; pp. 474–478. [Google Scholar]
  34. Wang, J.N.; Zhu, H.Q.; Zhang, Y.J.; Cheng, F.; Zhou, C. A novel prediction model for wind power based on improved long short-term memory neural network. Energy 2023, 265, 126283. [Google Scholar] [CrossRef]
  35. Jin, K.H.; McCann, M.T.; Froustey, E.; Unser, M. Deep convolutional neural network for inverse problems in imaging. arXiv 2016, arXiv:1611.03679. [Google Scholar] [CrossRef] [PubMed]
  36. Faruque, M.O.; Hossain, M.A.; Islam, M.R.; Alam, S.M.M.; Karmaker, A.K. Very short-term wind power forecasting for real-time operation using hybrid deep learning model with optimization algorithm. Clean. Energy Syst. 2024, 9, 100129. [Google Scholar] [CrossRef]
  37. Li, R.; Ma, T.; Zhang, X.; Hui, X.; Liu, Y.P.; Yin, X.G. Short-term wind power prediction based on convolutional long short-term memory neural network. Acta Energiae Solaris Sin. 2021, 42, 304–311. [Google Scholar]
  38. Sun, Y.; Zhou, Q.B.; Sun, L.; Sun, L.P.; Kang, J.C.; Li, H. CNN–LSTM–AM: A power prediction model for offshore wind turbines. Ocean. Eng. 2024, 301, 117598. [Google Scholar] [CrossRef]
  39. Hong, Y.Y.; Rioflorido, C.L.P.; Zhang, W.N. Hybrid deep learning and quantum-inspired neural network for day-ahead spatiotemporal wind speed forecasting. Expert Syst. Appl. 2024, 241, 122645. [Google Scholar] [CrossRef]
  40. Sun, S.Z.; Wang, Y.; Meng, Y.; Wang, C.X.; Zhu, X.H. Multi-step wind speed forecasting model using a compound forecasting architecture and an improved QPSO-based synchronous optimization. Energy Rep. 2022, 8, 9899–9918. [Google Scholar] [CrossRef]
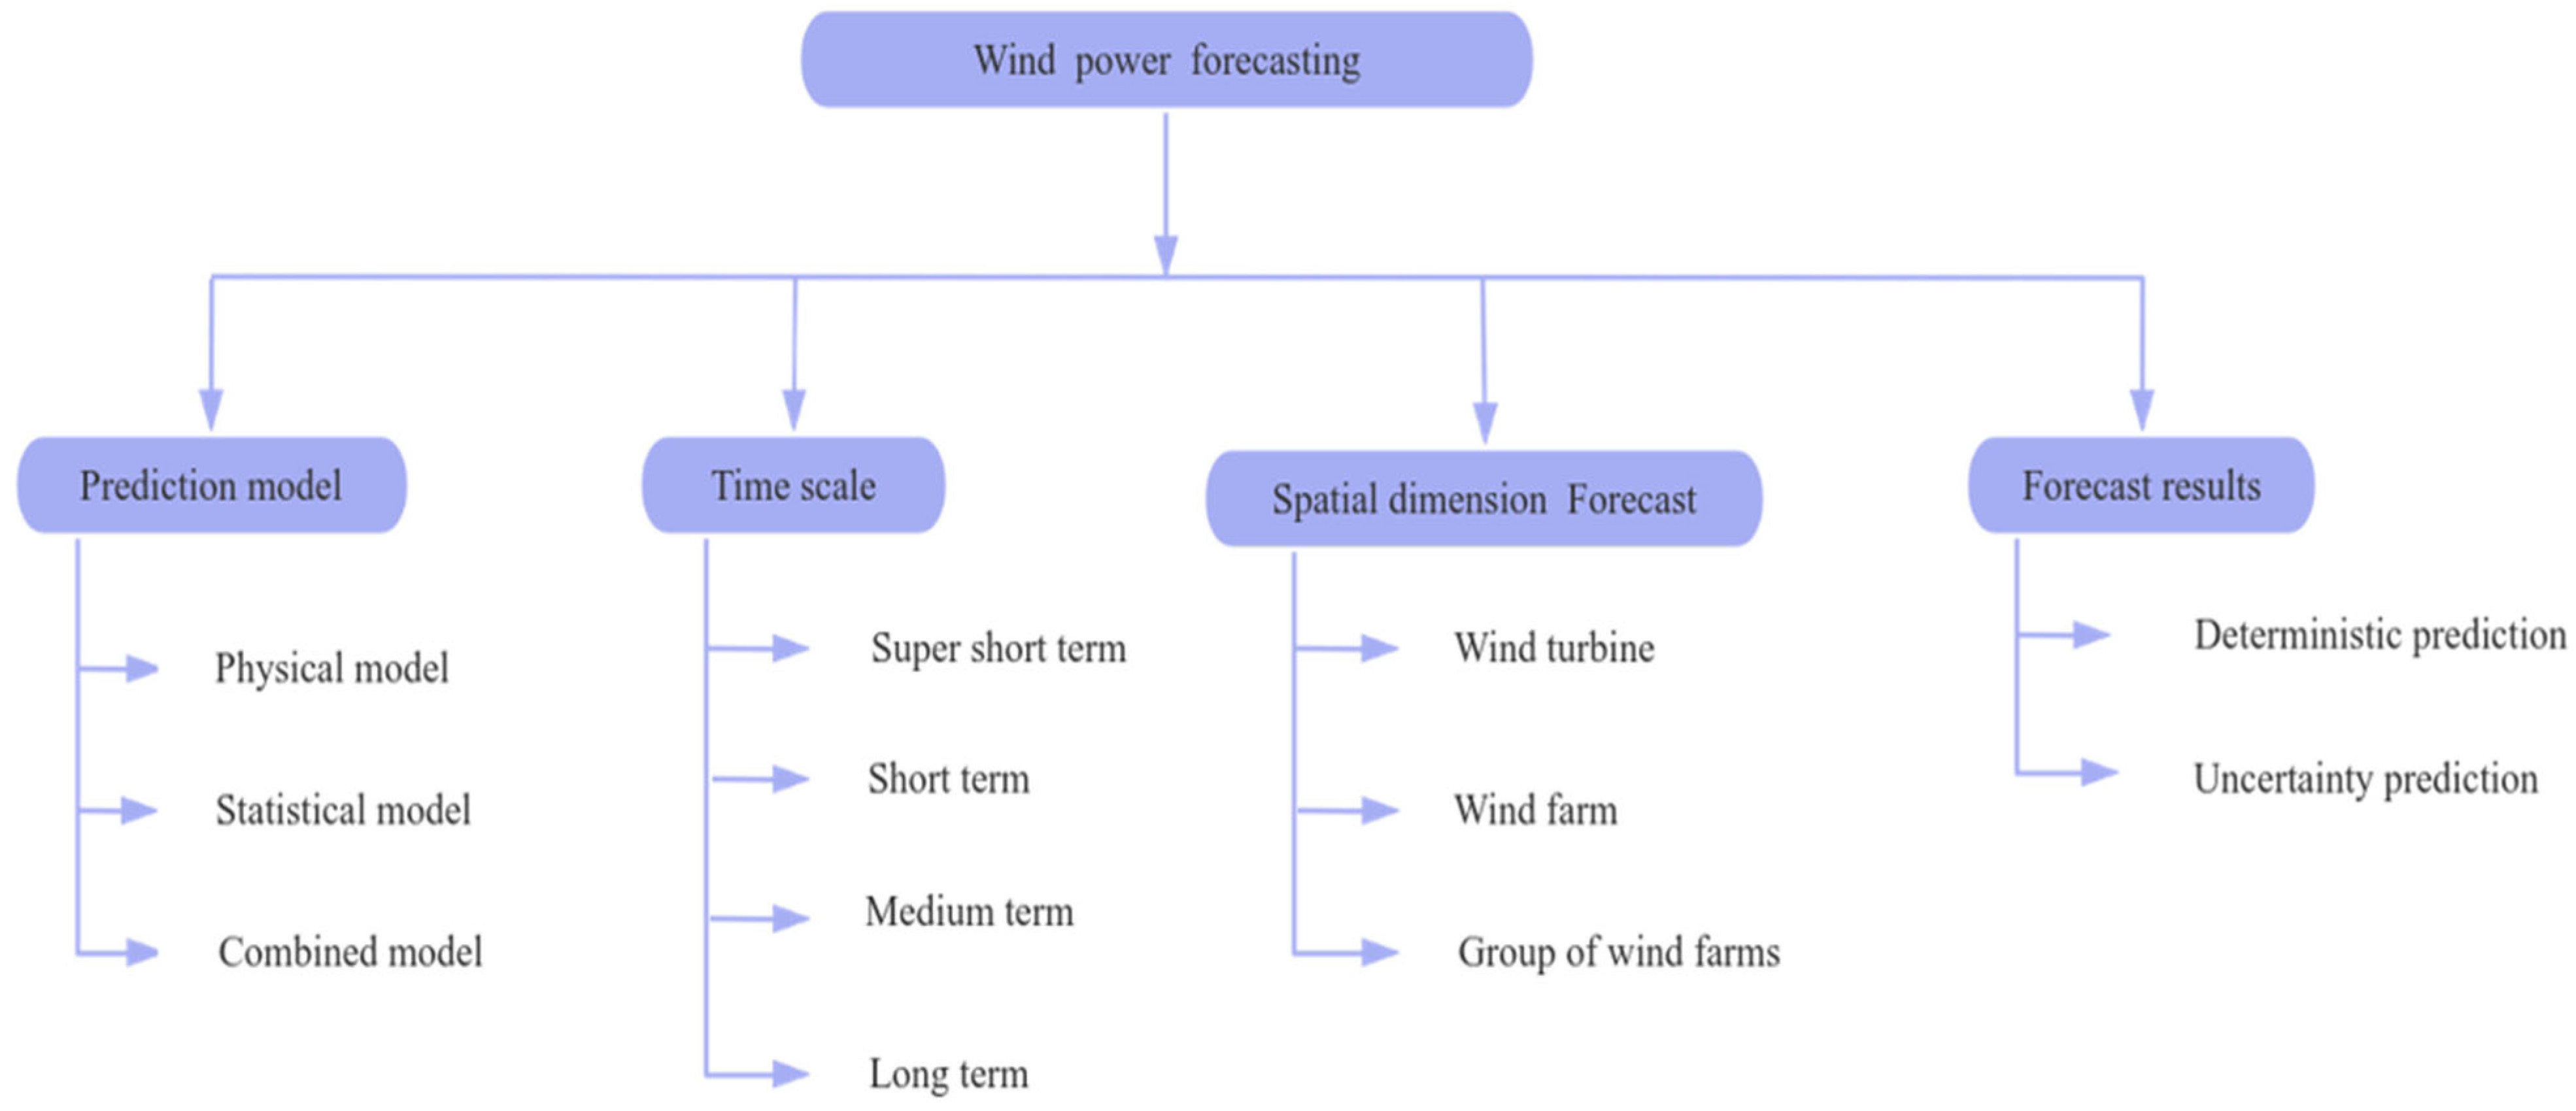
Figure 1. Wind power prediction technology method.
Energies 18 03346 g001
Figure 2. Annual wind speed/wind direction rose diagram.
Energies 18 03346 g002
Figure 3. Pearson correlation coefficient diagram of wind power and environmental factors.
Energies 18 03346 g003
Figure 4. (a) Wind speed time series; (b) power time series.
Energies 18 03346 g004
Figure 5. LSTM unit structure.
Energies 18 03346 g005
Figure 6. CNN structure diagram.
Energies 18 03346 g006
Figure 7. The structure prediction process of CNN-LSTM model.
Energies 18 03346 g007
Figure 8. Particle swarm model flow chart.
Energies 18 03346 g008
Figure 9. QPSO-LSTM prediction flow chart.
Energies 18 03346 g009
Figure 10. Parameter logic structure flow chart of PSO model.
Energies 18 03346 g010
Figure 11. Seasonal mean power and wind speed.
Energies 18 03346 g011
Figure 12. Radar chart of evaluation index under extreme weather. (a) High-humidity weather; (b) gale weather.
Energies 18 03346 g012
Figure 13. The scatter plot of actual value and predicted value of power of different prediction models in summer. (a) CNN-LSTM model; (b) PSO-CNN-LSTM model; (c) PSO-CNN model; (d) QPSO-LSTM model.
Energies 18 03346 g013
Figure 14. (a) Spring; (b) summer; (c) autumn; (d) winter. Normal distribution fitting histogram.
Energies 18 03346 g014
Figure 15. Yearly seasonal prediction for (a) spring; (b) summer; (c) autumn; (d) winter.
Energies 18 03346 g015aEnergies 18 03346 g015b
Table 1. Partitioning into seasons.
DatasetMonthsSeasonData Point
1March 2021–May 2021Spring17,233
2June 2021–August 2021Summer18,724
3September 2021–November 2021 Autumn13,846
4December 2021–February 2022Winter19,917
Table 2. Comparison of model statistical indicators considering day and night.
TimeModelsR2RMSEMAEMSE
daytimeCNN-LSTM0.98783.08272.40489.5030
CNN-LSTM-ATT0.98932.87972.22478.2927
QPSO-LSTM0.99771.34021.07991.7961
PSO-LSTM0.99741.41571.04902.0042
PSO-CNN-LSTM0.99940.67070.54200.4499
nightCNN-LSTM0.99781.13190.79111.2811
CNN-LSTM-ATT0.99960.49090.33380.2410
QPSO-LSTM0.99940.59350.41490.3523
PSO-LSTM0.99960.49090.33380.2410
PSO-CNN-LSTM0.99990.21360.15220.0456
Table 3. Comparison of model statistical indicators considering all seasons.
SeasonModelsR2RMSEMAEMSE
SpringCNN-LSTM0.99712.73292.06787.4198
CNN-LSTM-ATT0.99842.04161.61894.1681
QPSO-LSTM0.99931.36821.15391.8719
PSO-LSTM0.99961.06240.76981.1287
PSO-CNN-LSTM0.99990.57250.43670.3278
SummerCNN-LSTM0.99742.58751.99986.6952
CNN-LSTM-ATT0.99851.98291.52993.9320
QPSO-LSTM0.99304.29853.451618.4770
PSO-LSTM0.99970.85840.69130.7369
PSO-CNN-LSTM0.99990.54690.42370.2991
AutumnCNN-LSTM0.99452.75432.23457.5863
CNN-LSTM-ATT0.99422.82672.36787.9901
QPSO-LSTM0.99781.73641.50063.0151
PSO-LSTM0.99940.92570.74320.8570
PSO-CNN-LSTM0.99960.71830.59460.5159
WinterCNN-LSTM0.99522.95742.26758.7465
CNN-LSTM-ATT0.99632.59312.07696.7240
QPSO-LSTM0.99891.43510.97792.0595
PSO-LSTM0.99941.05840.779321.1203
PSO-CNN-LSTM0.99980.63500.52330.4032
Disclaimer/Publisher’s Note: The statements, opinions and data contained in all publications are solely those of the individual author(s) and contributor(s) and not of MDPI and/or the editor(s). MDPI and/or the editor(s) disclaim responsibility for any injury to people or property resulting from any ideas, methods, instructions or products referred to in the content.