
Investigations on the Effect of Inclination Angle on the Aerodynamic Performance of a Two-Stage Centrifugal Compressor of a Proton Exchange Membrane Fuel Cell System

 ,
,
Abstract
1. Introduction
2. Research Method
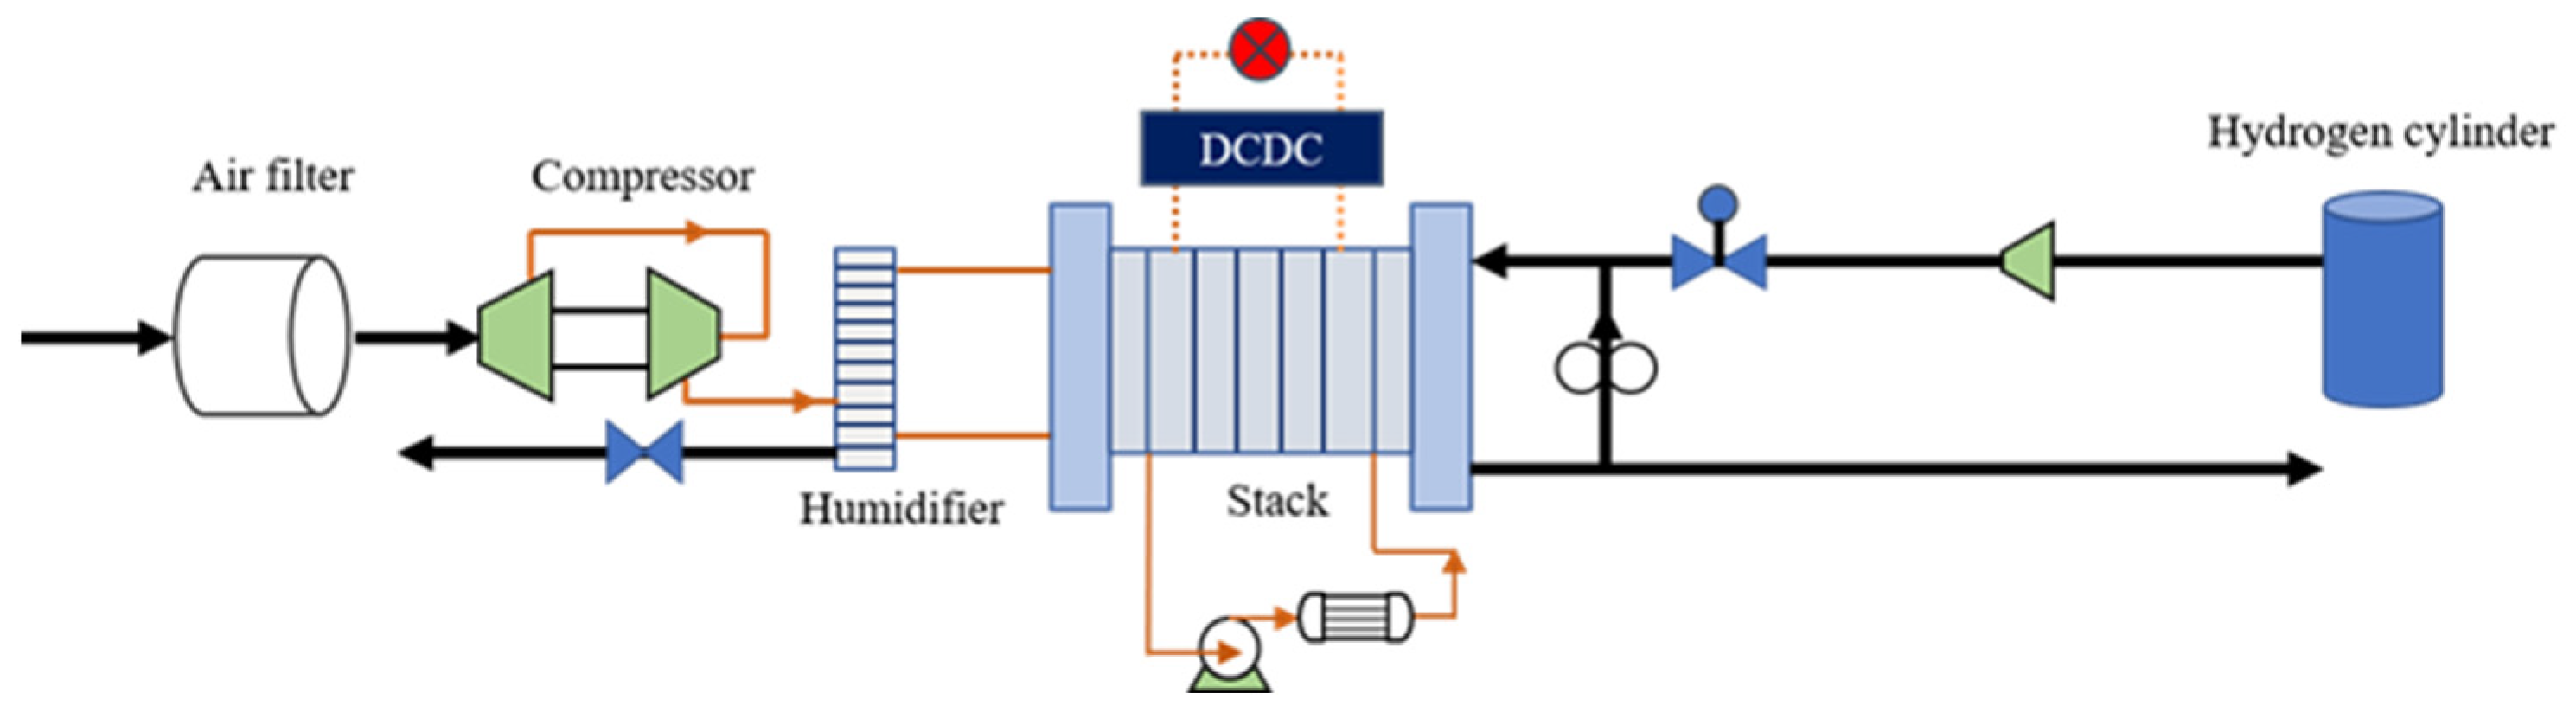
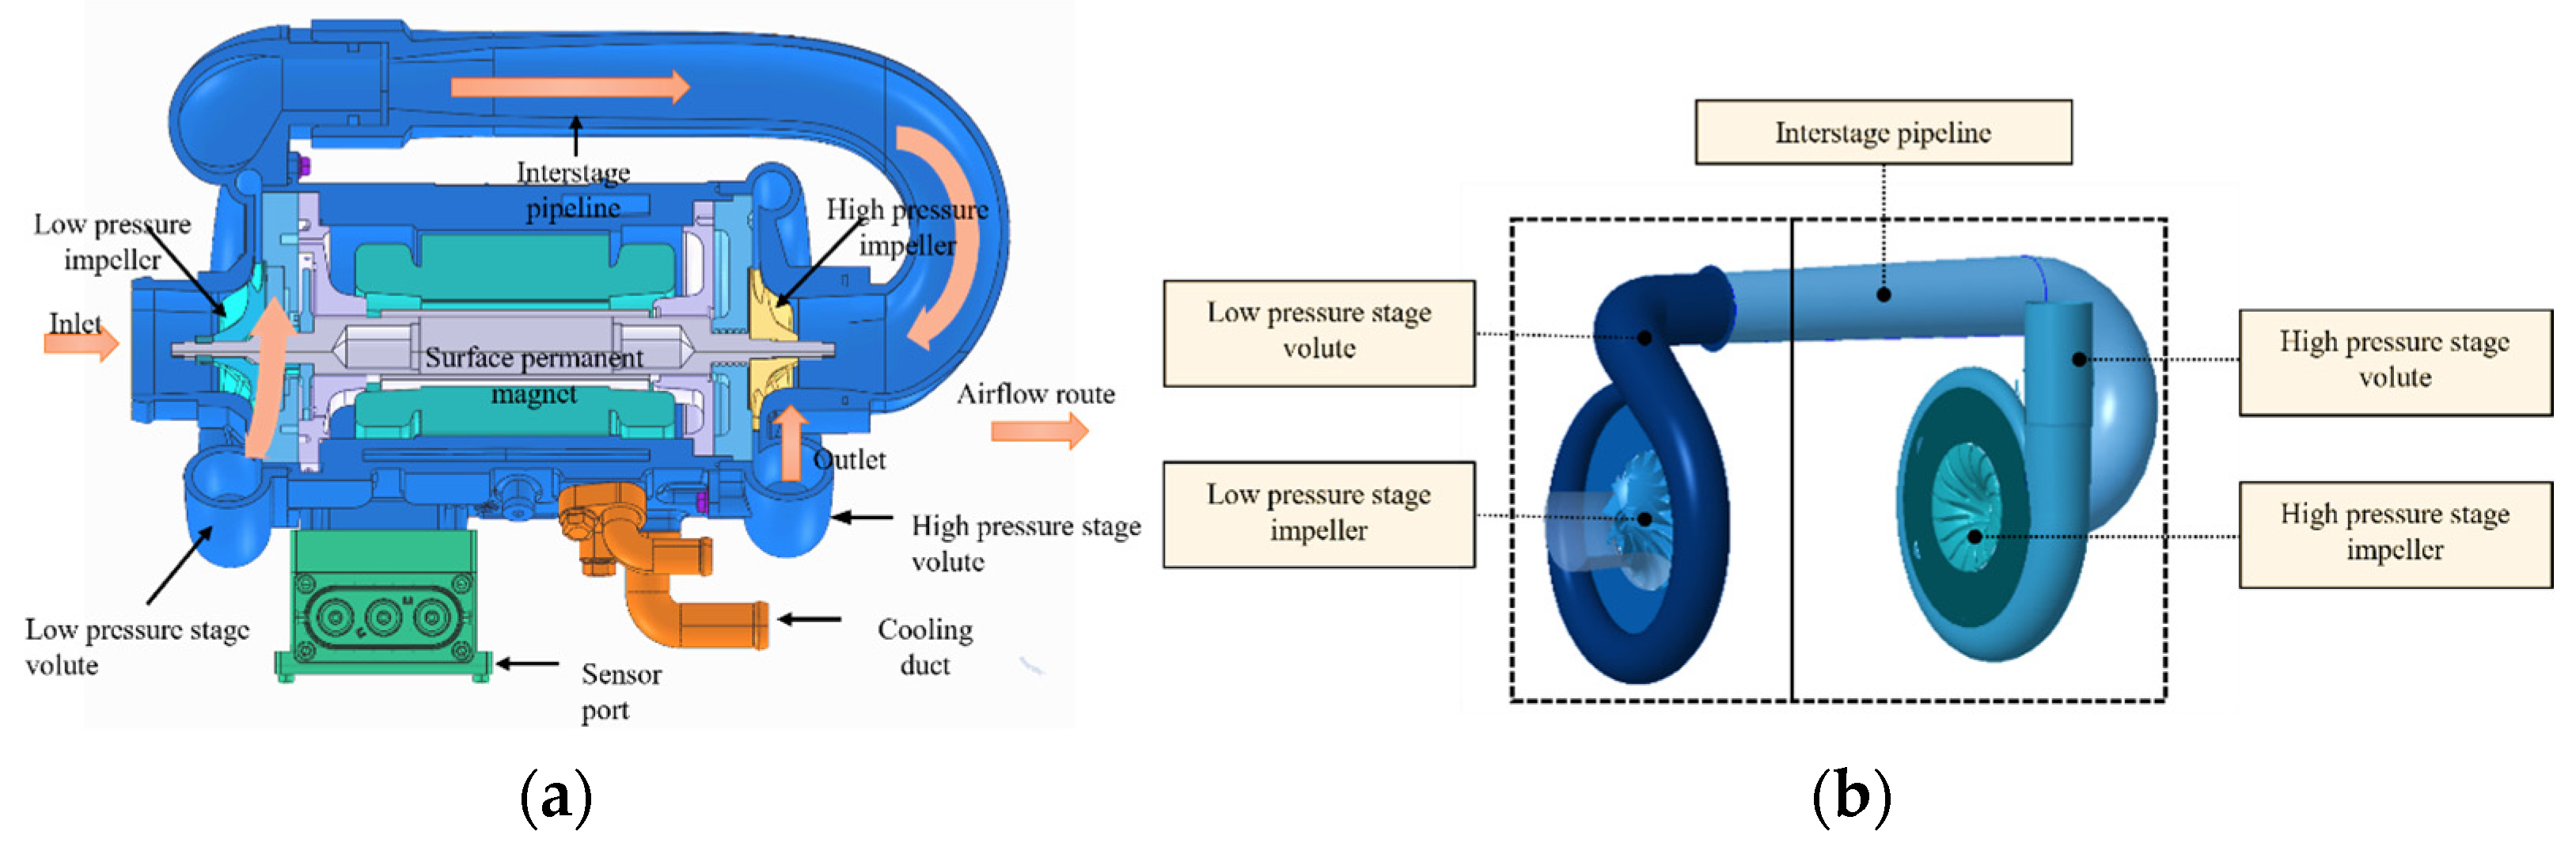
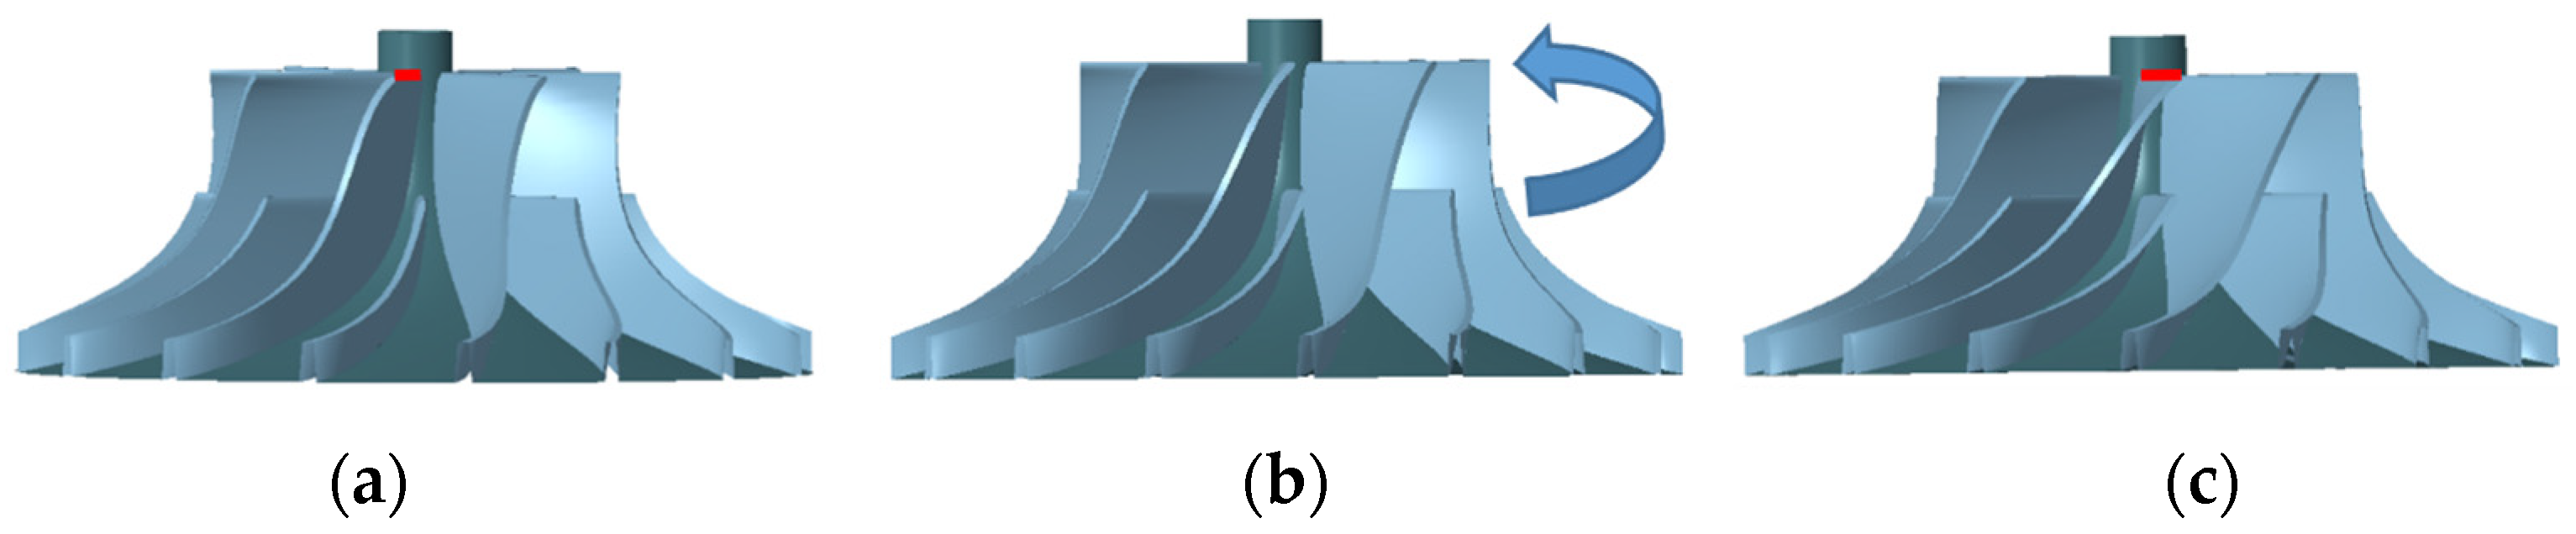
2.1. Research Model
2.2. Numerical Method
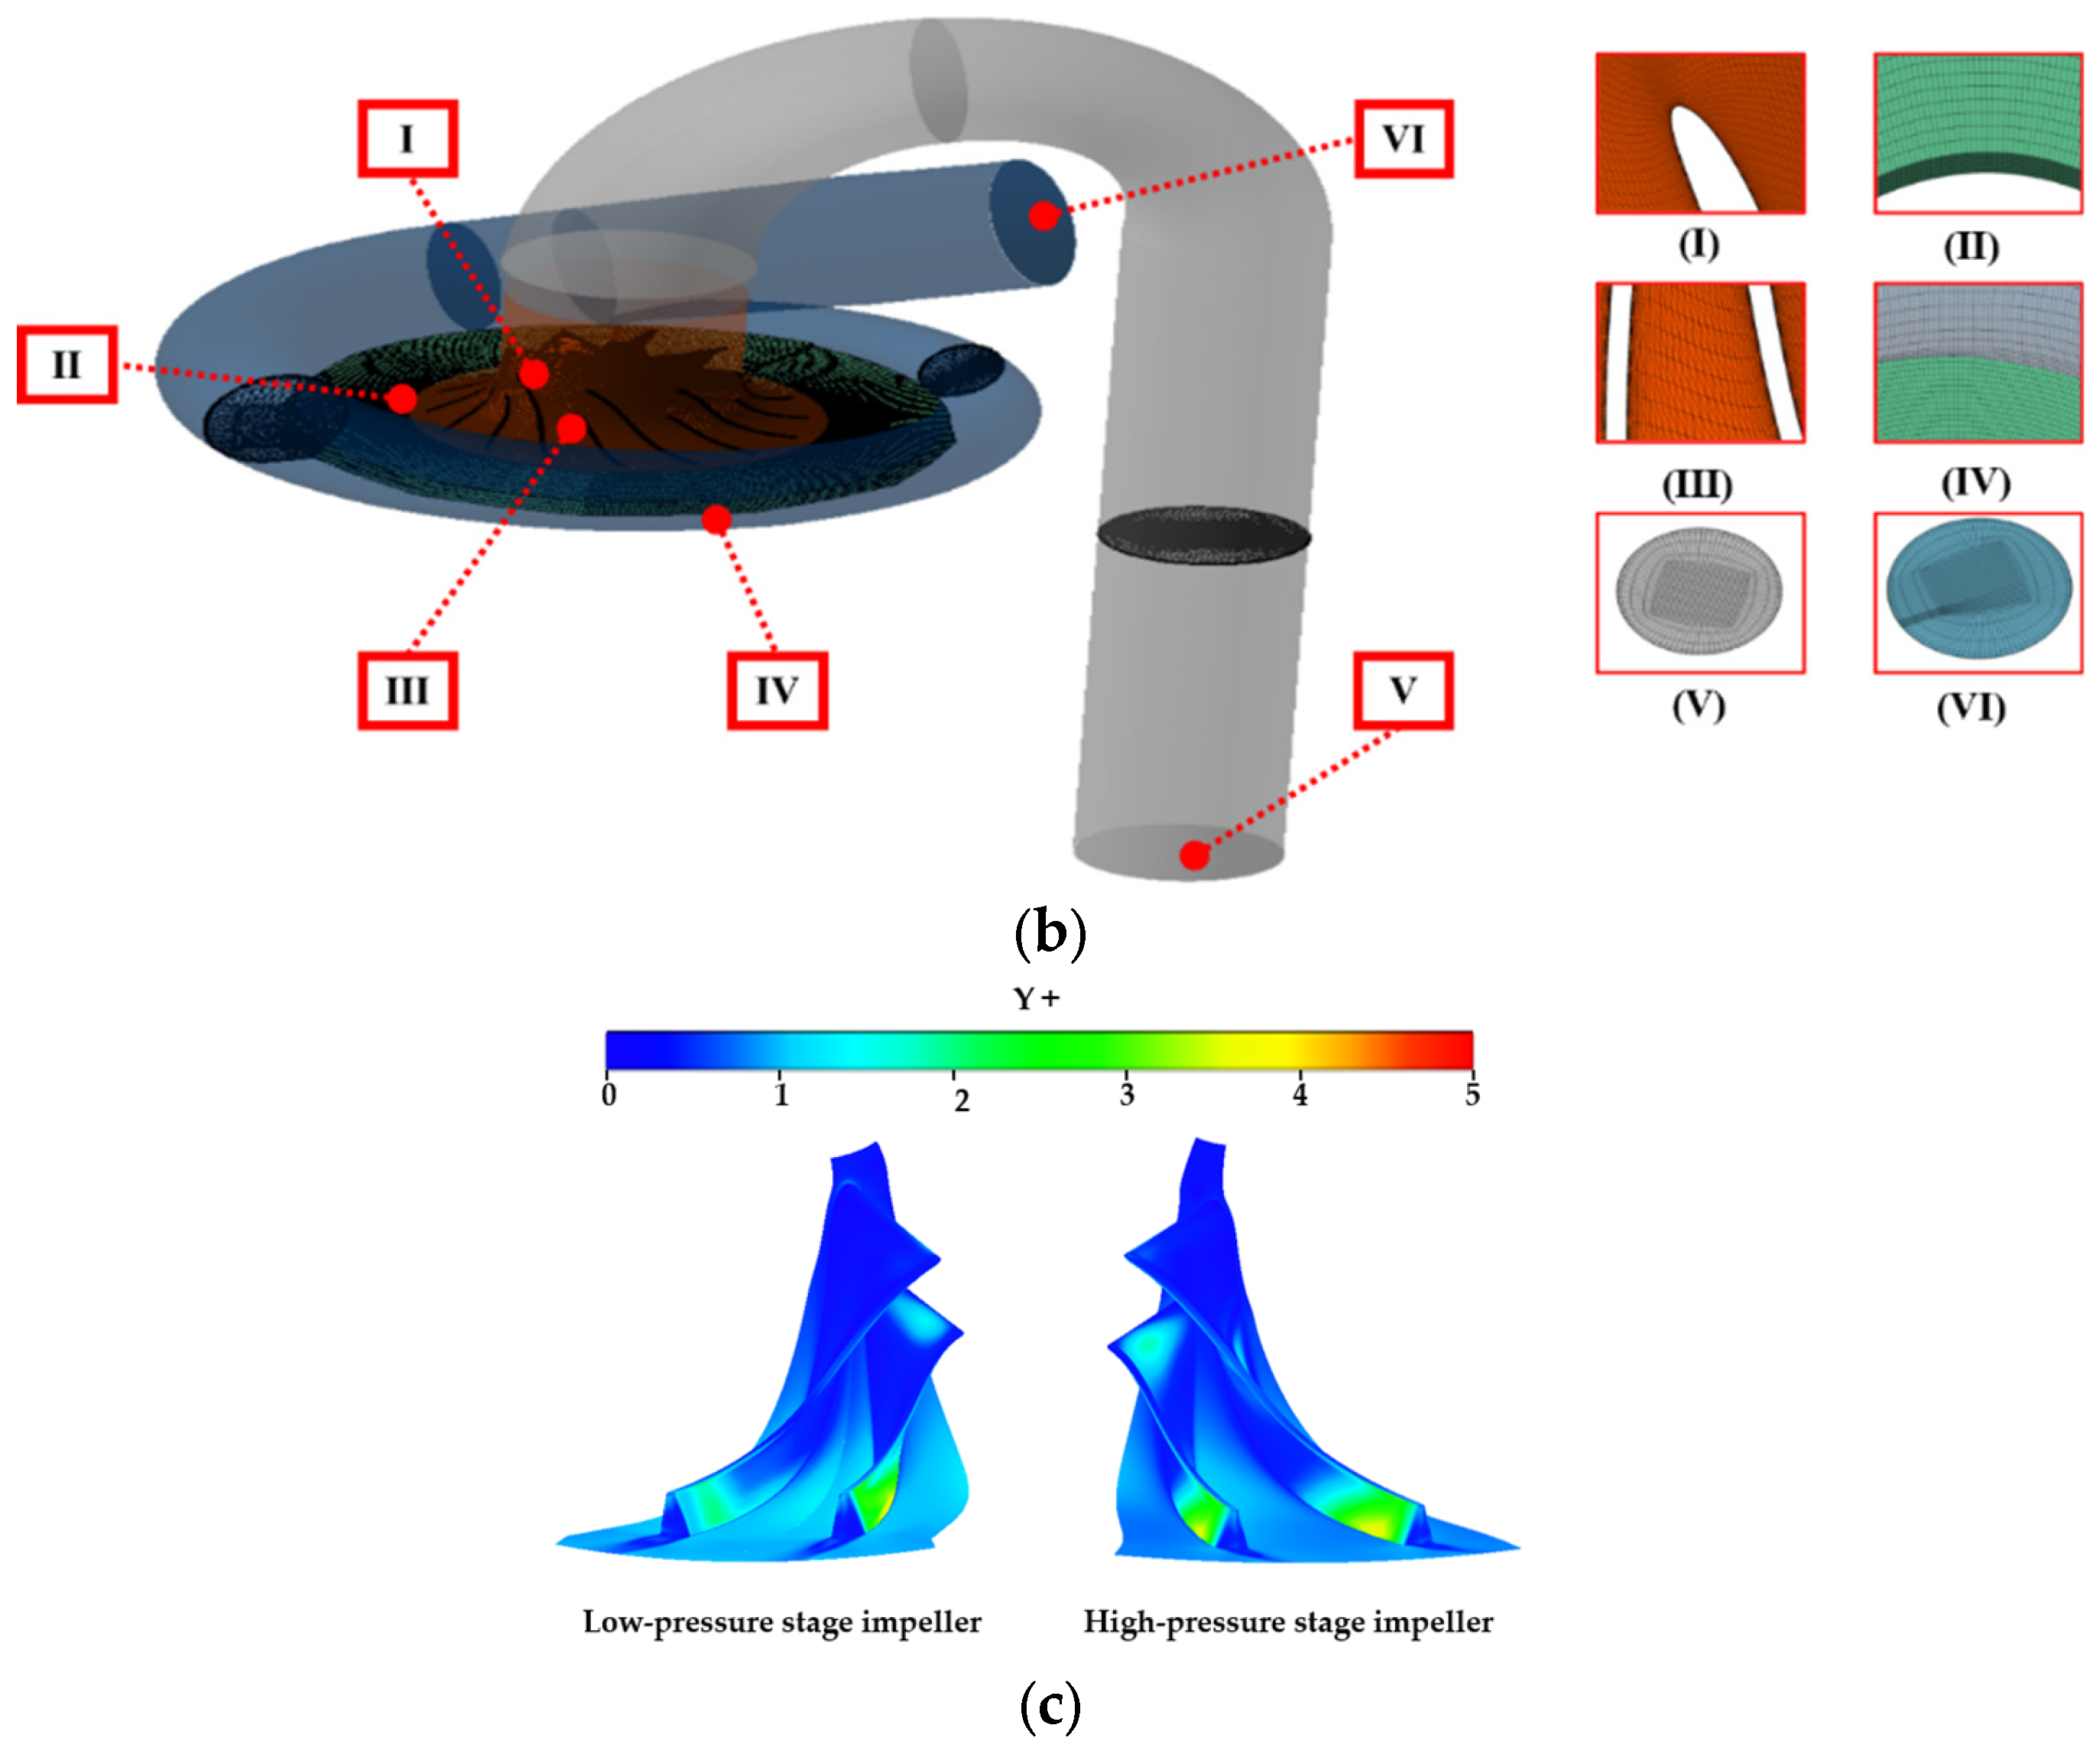
2.2.1. Mesh Generation
2.2.2. CFD Method
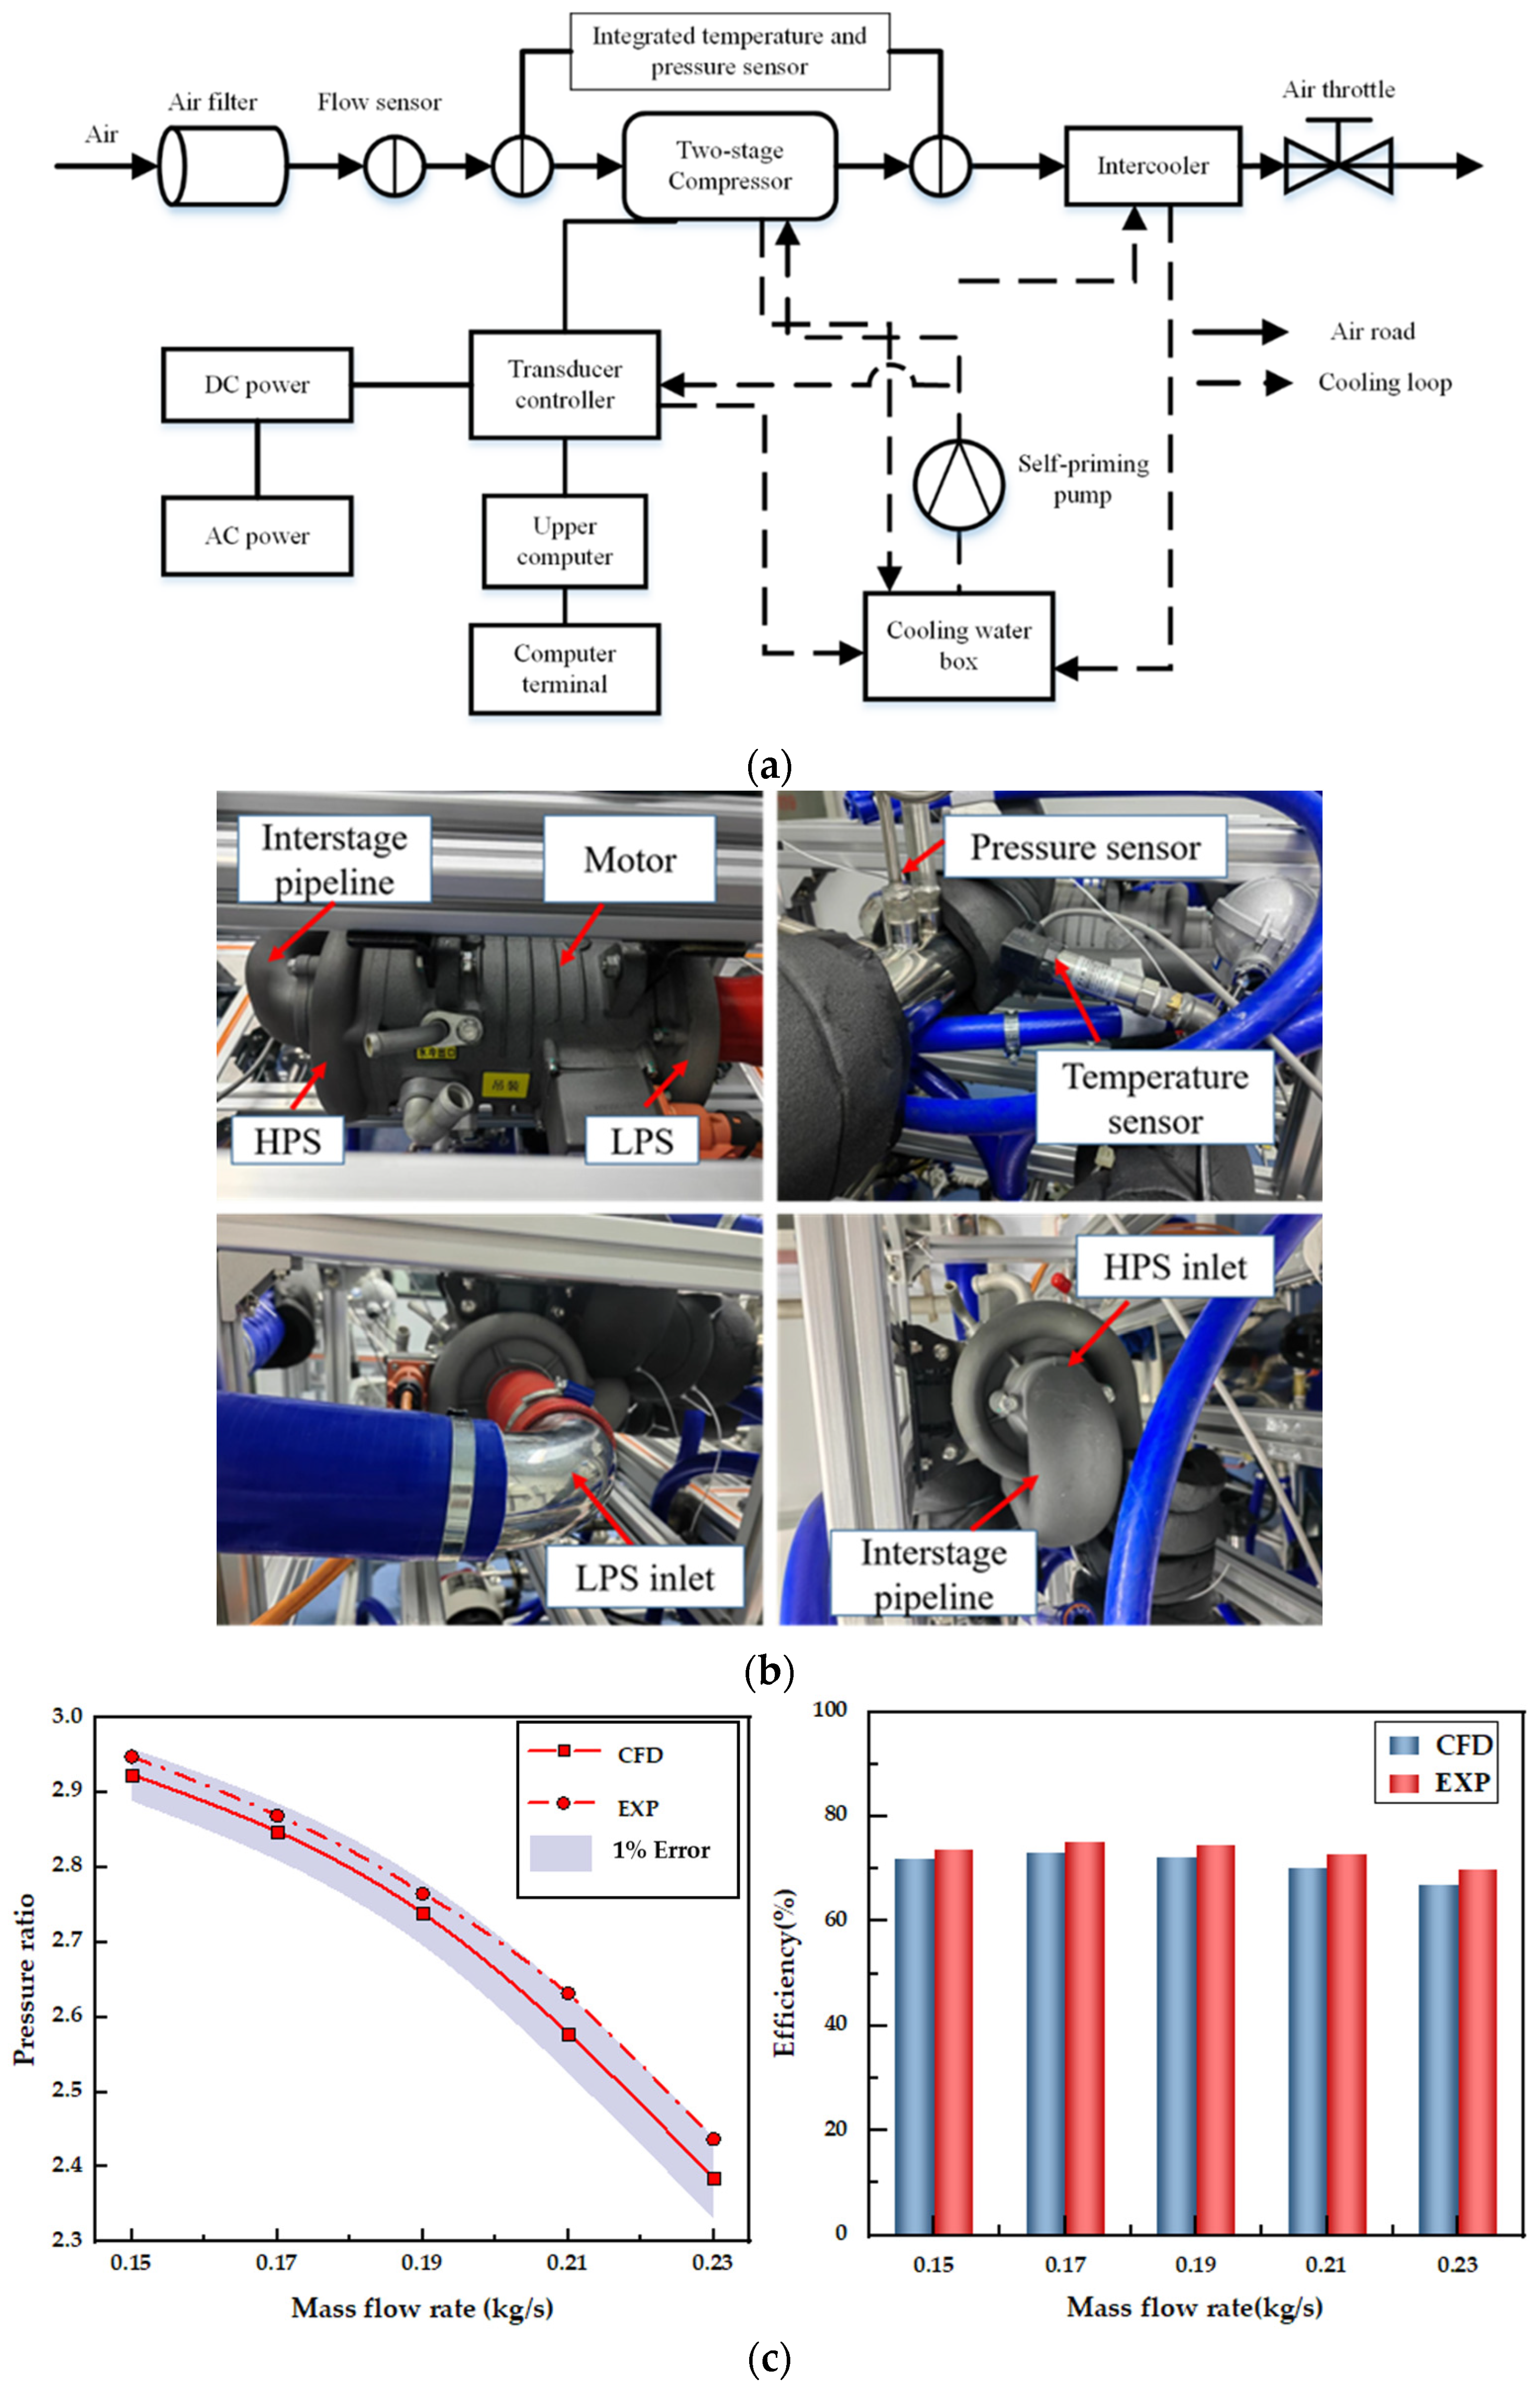
2.3. CFD Method Validation
3. Results and Discussion
3.1. Compressor Performance Analysis
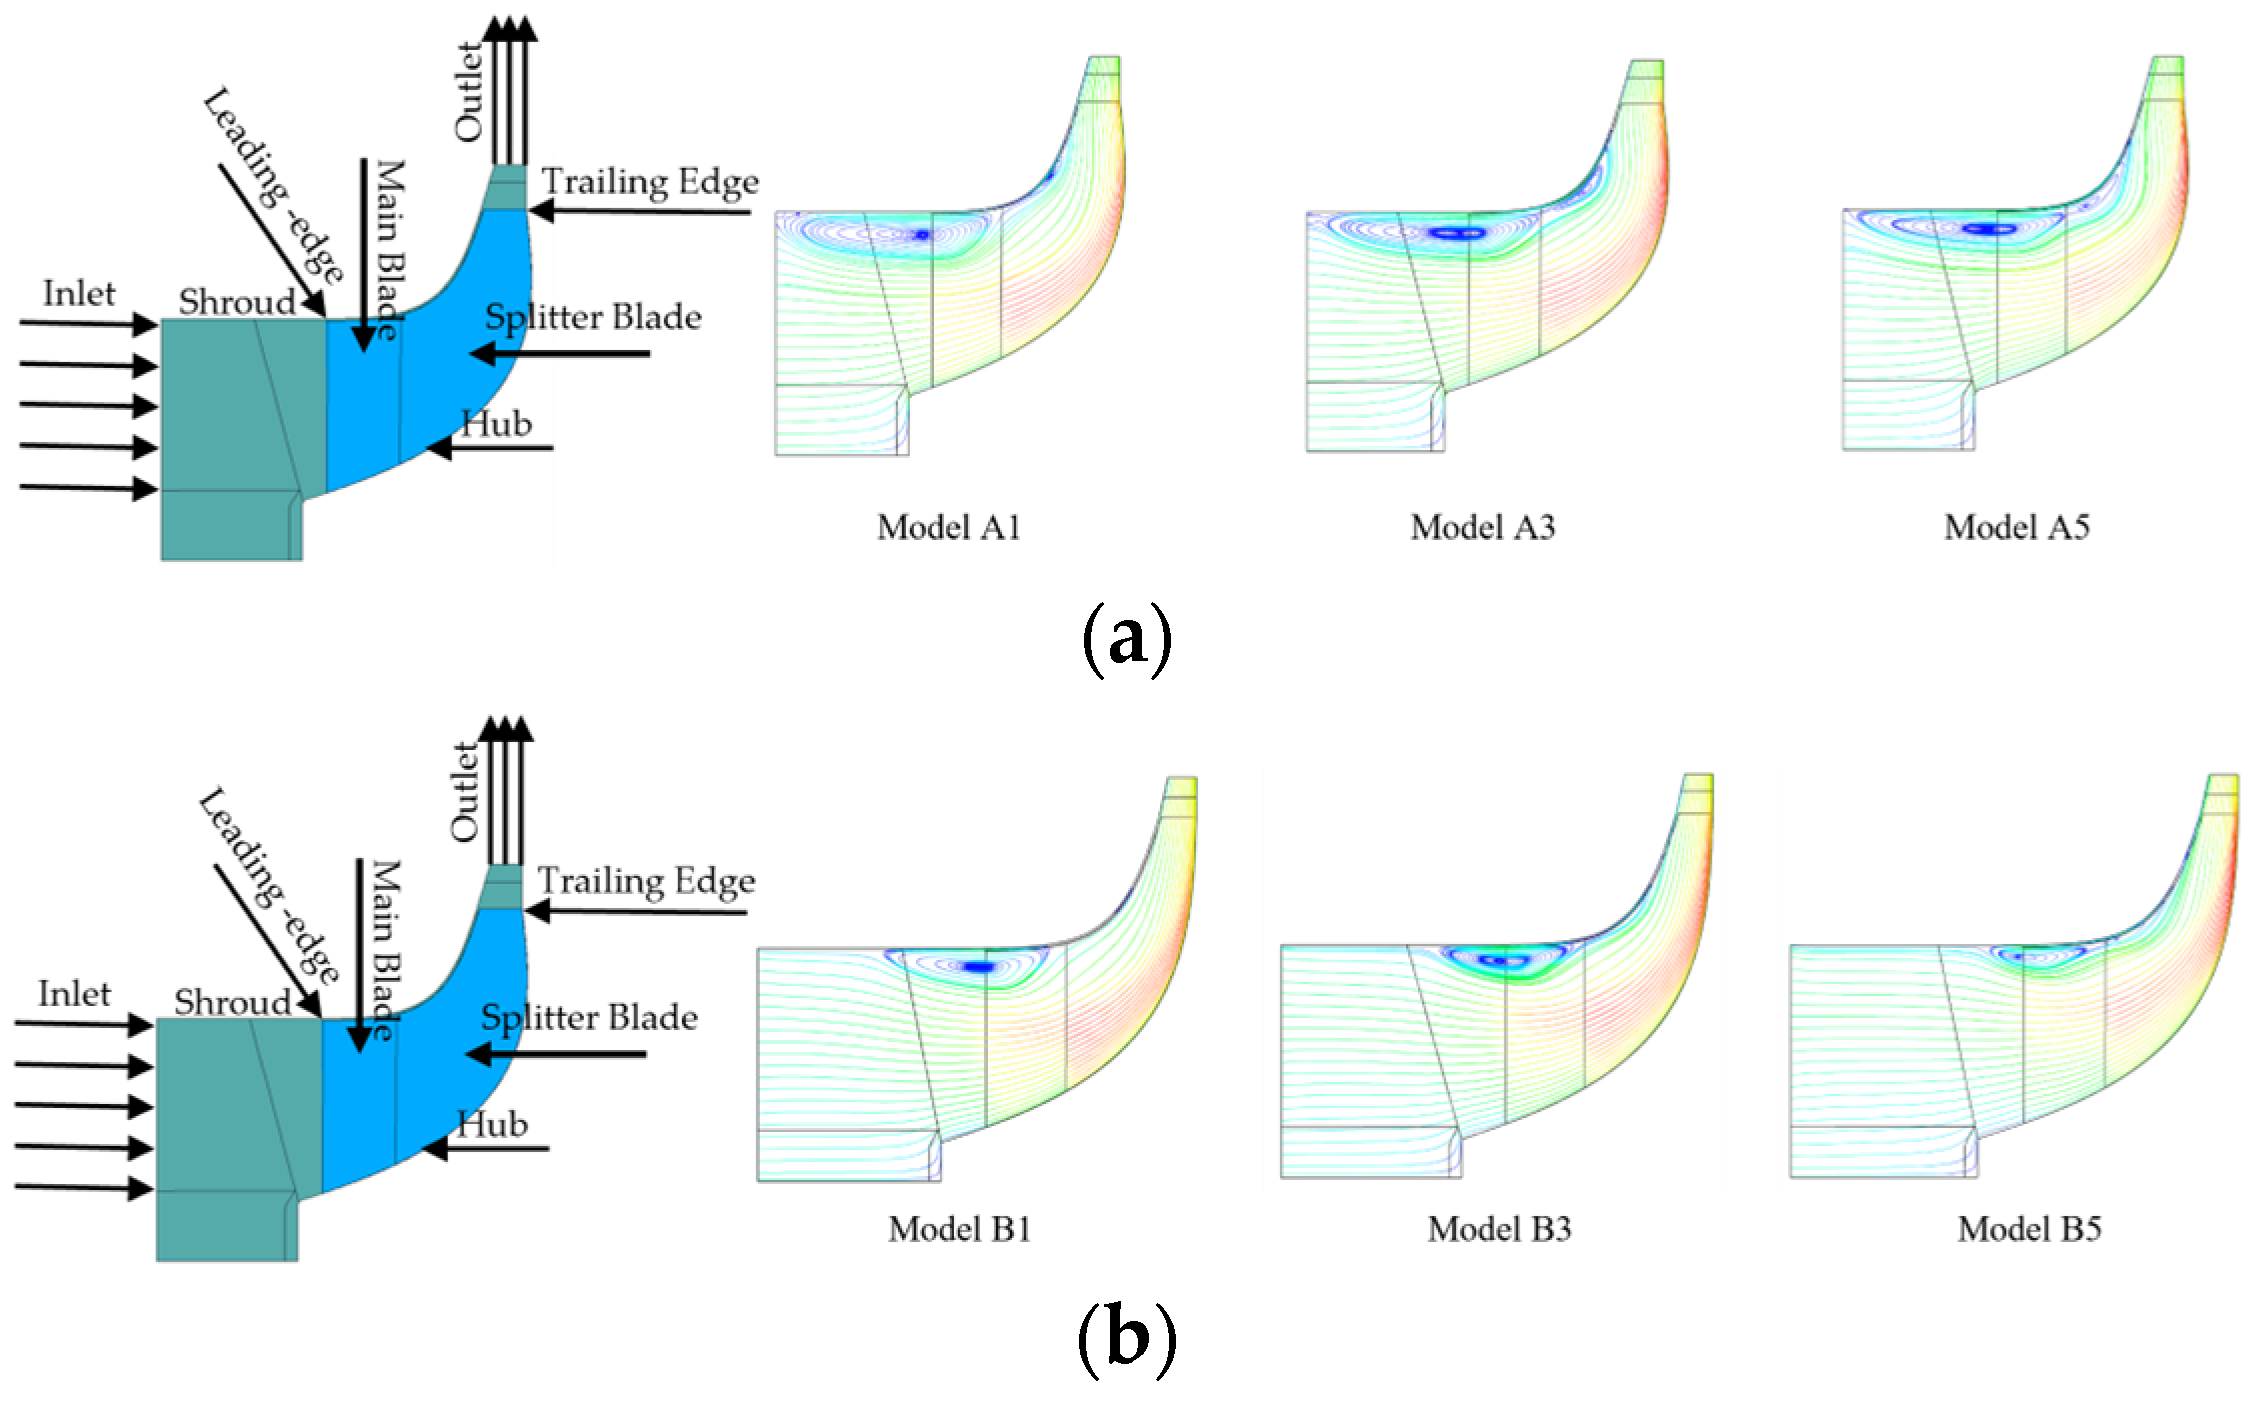
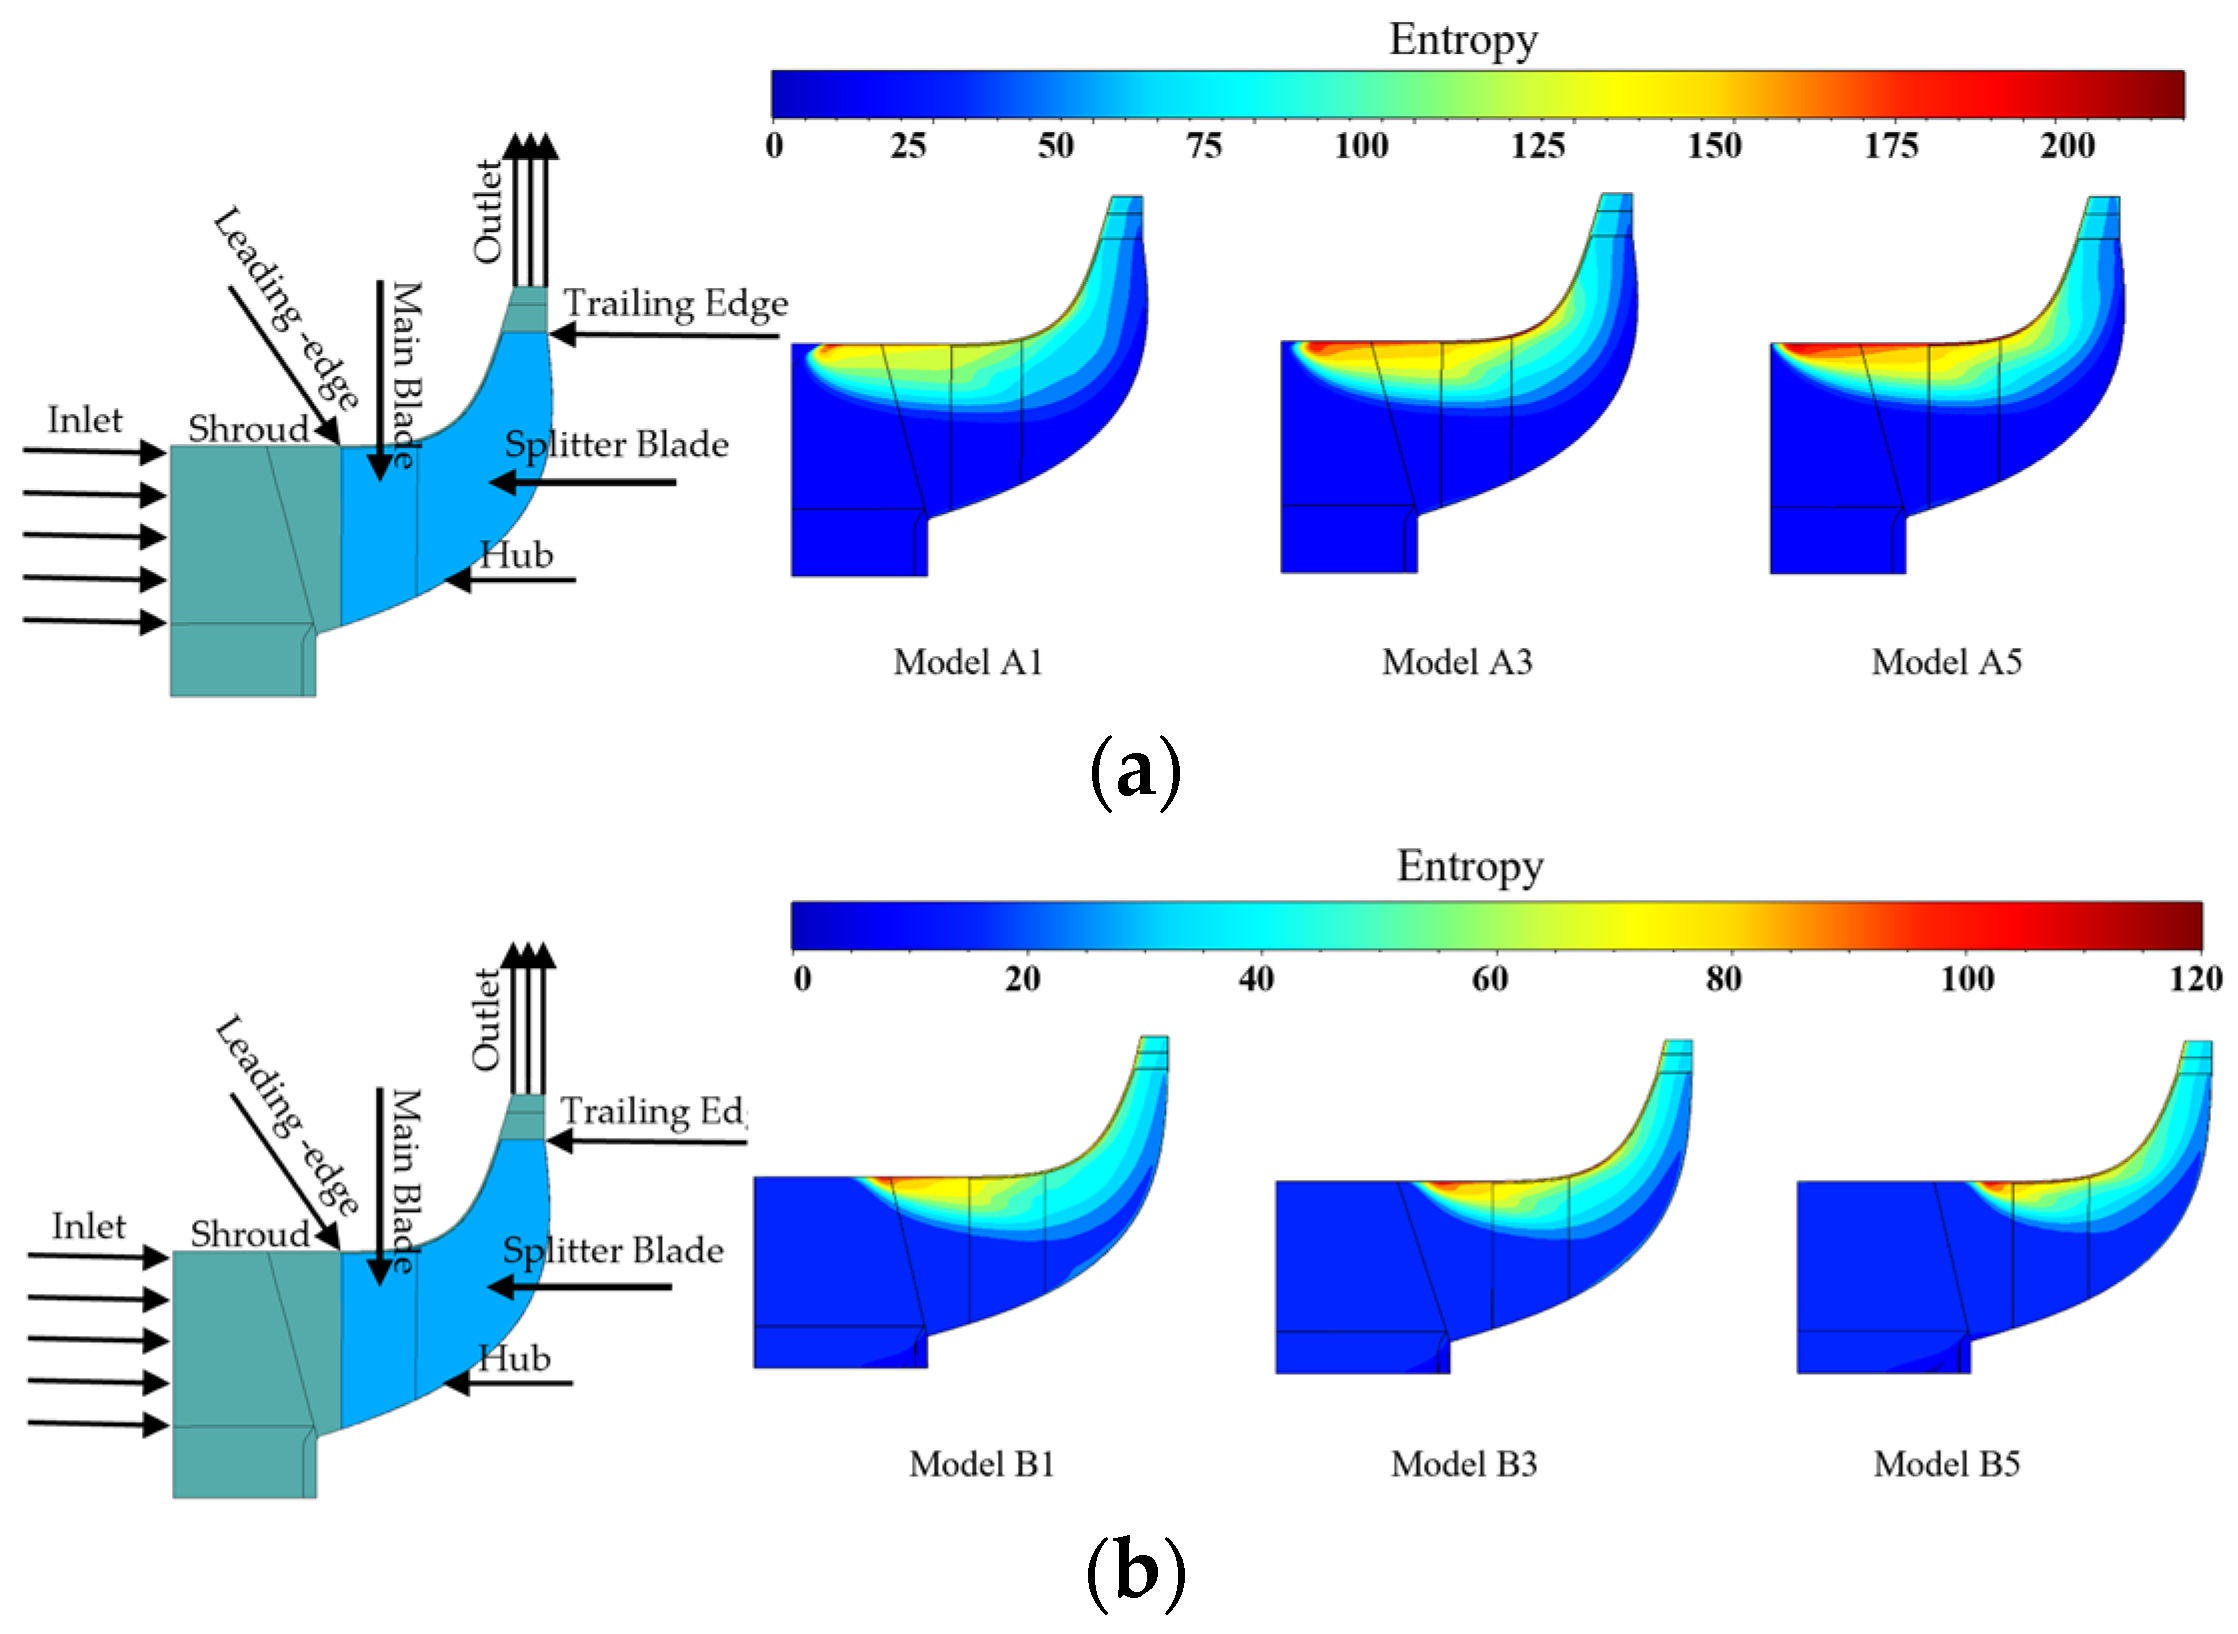
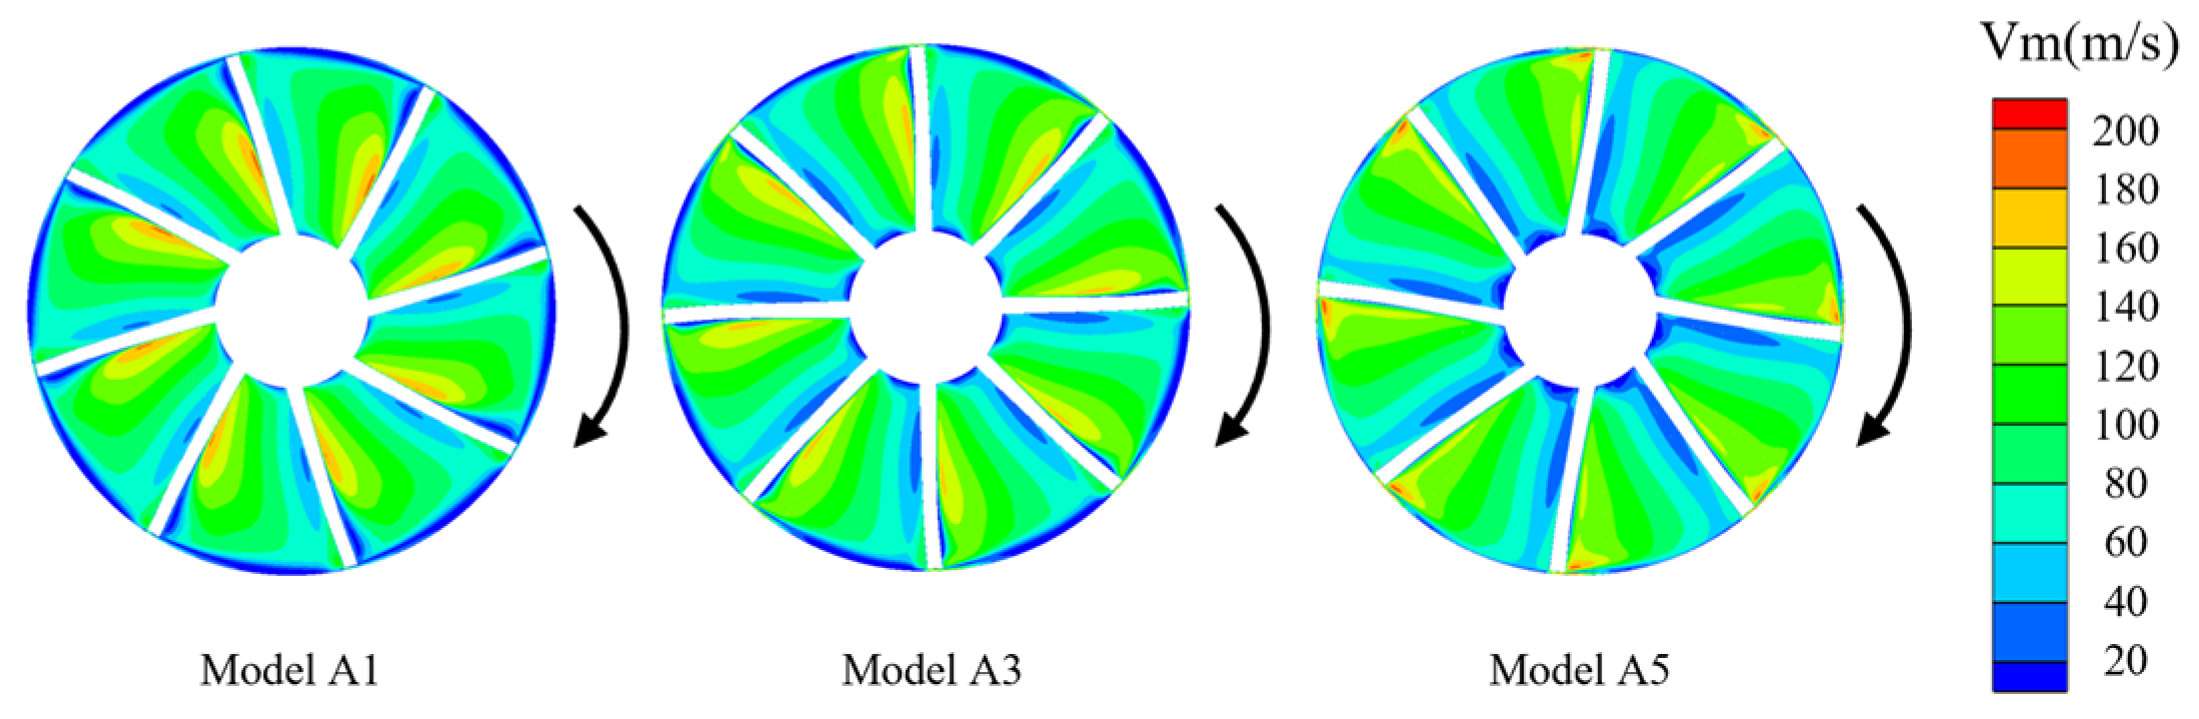
3.2. Flow Characteristic Analysis
3.2.1. Internal Flow Field Analysis
3.2.2. Impeller Blade Load Analysis
4. Conclusions
- (1)
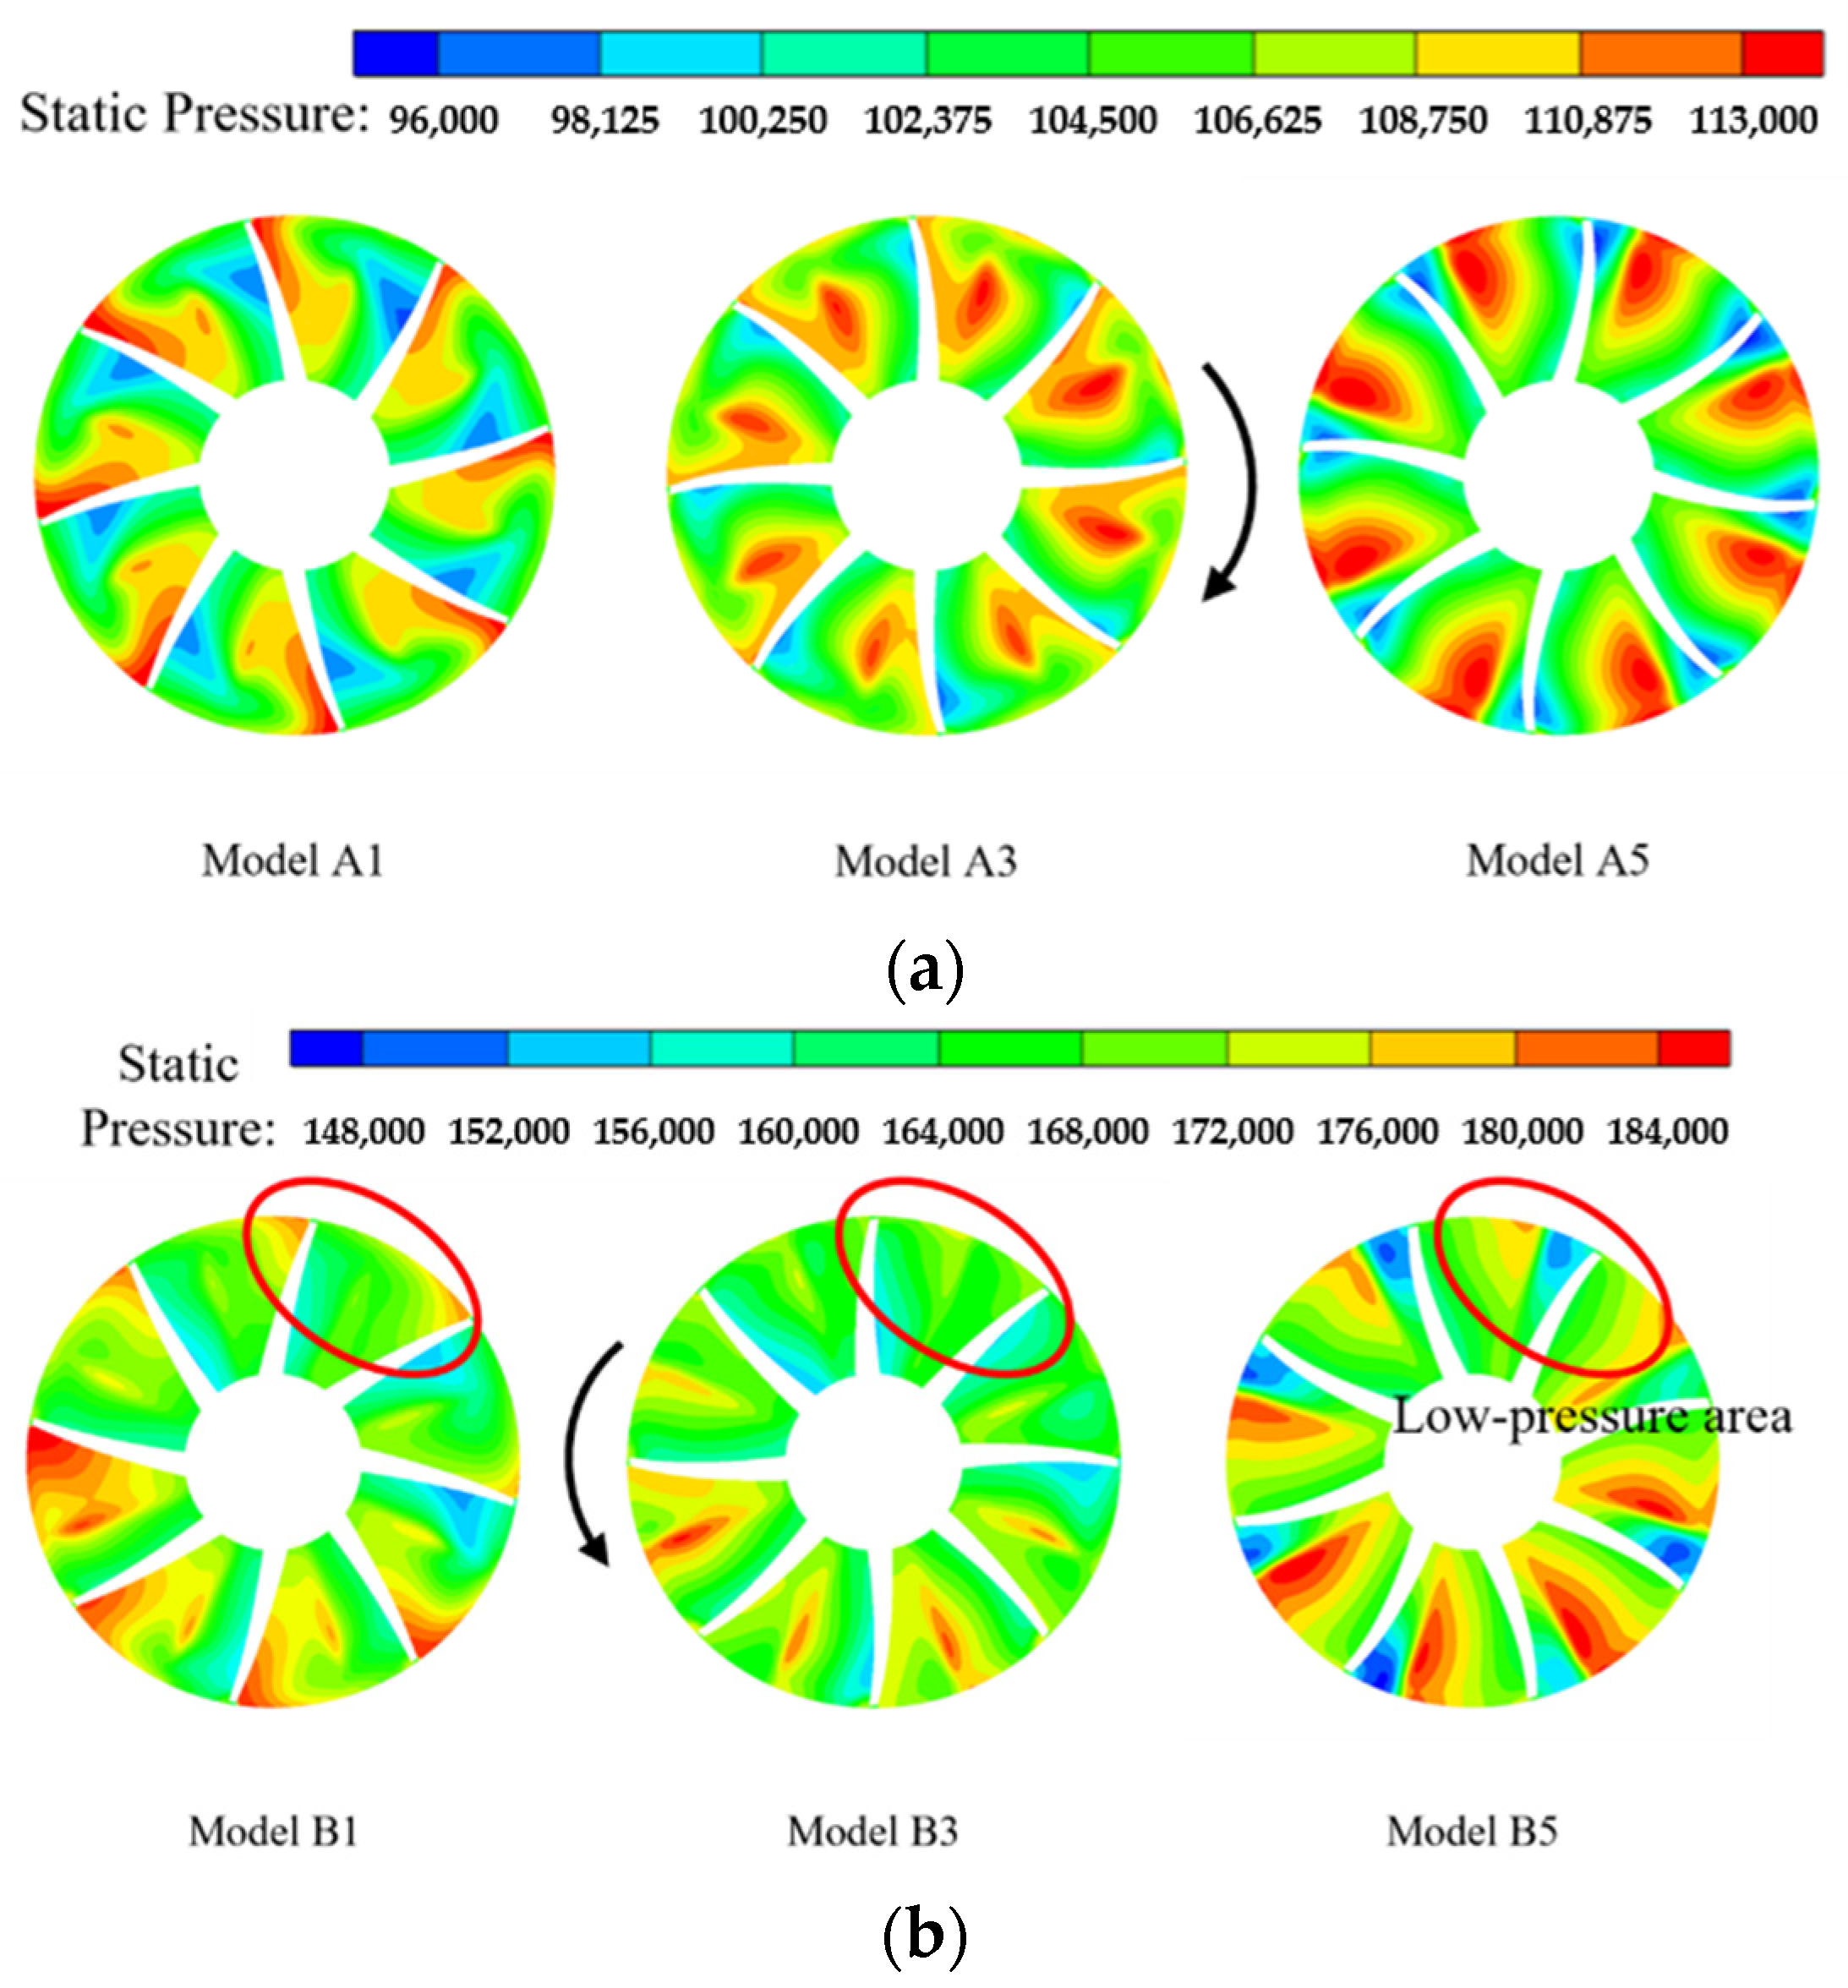
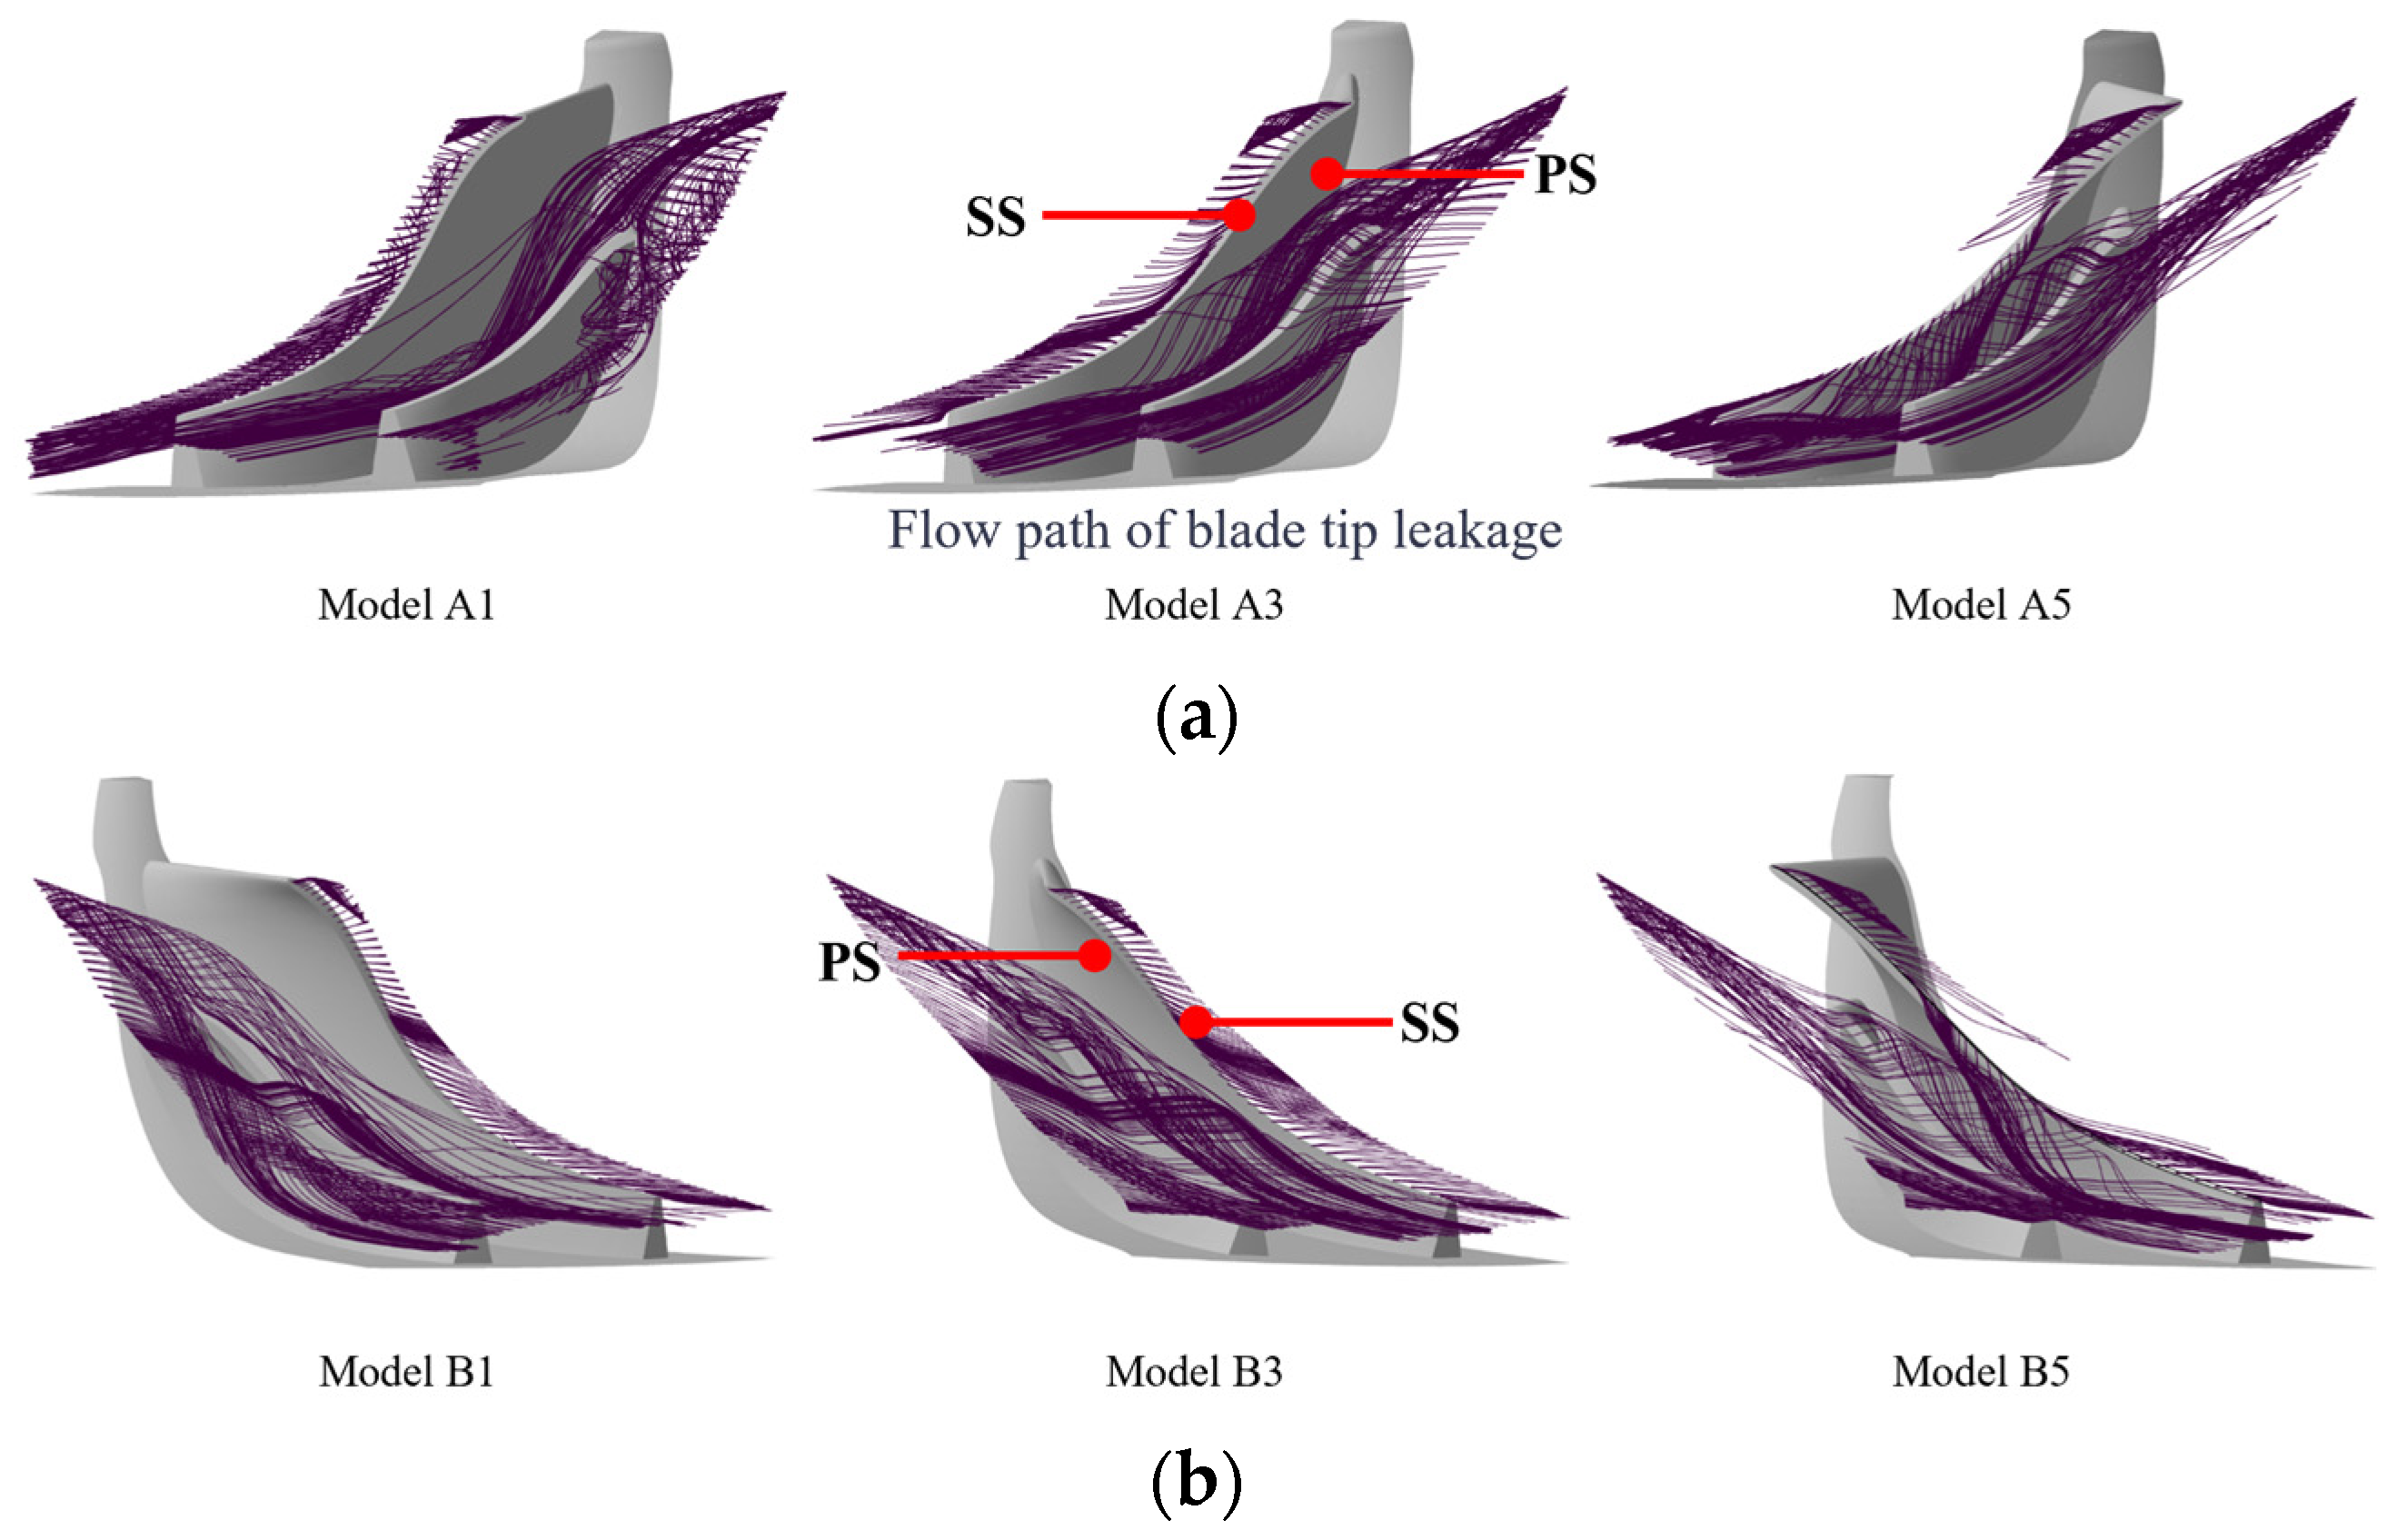
- The +15° inclined impeller exhibits superior stability under near-stall conditions. For the low-pressure stage (LP-A5 model), the impeller’s work capacity improves, the pressure ratio increases, and the stall margin expands by approximately 5%. These enhancements are attributed to optimized incidence angle alignment, which suppresses tip leakage vortices and delays flow separation.
- (2)
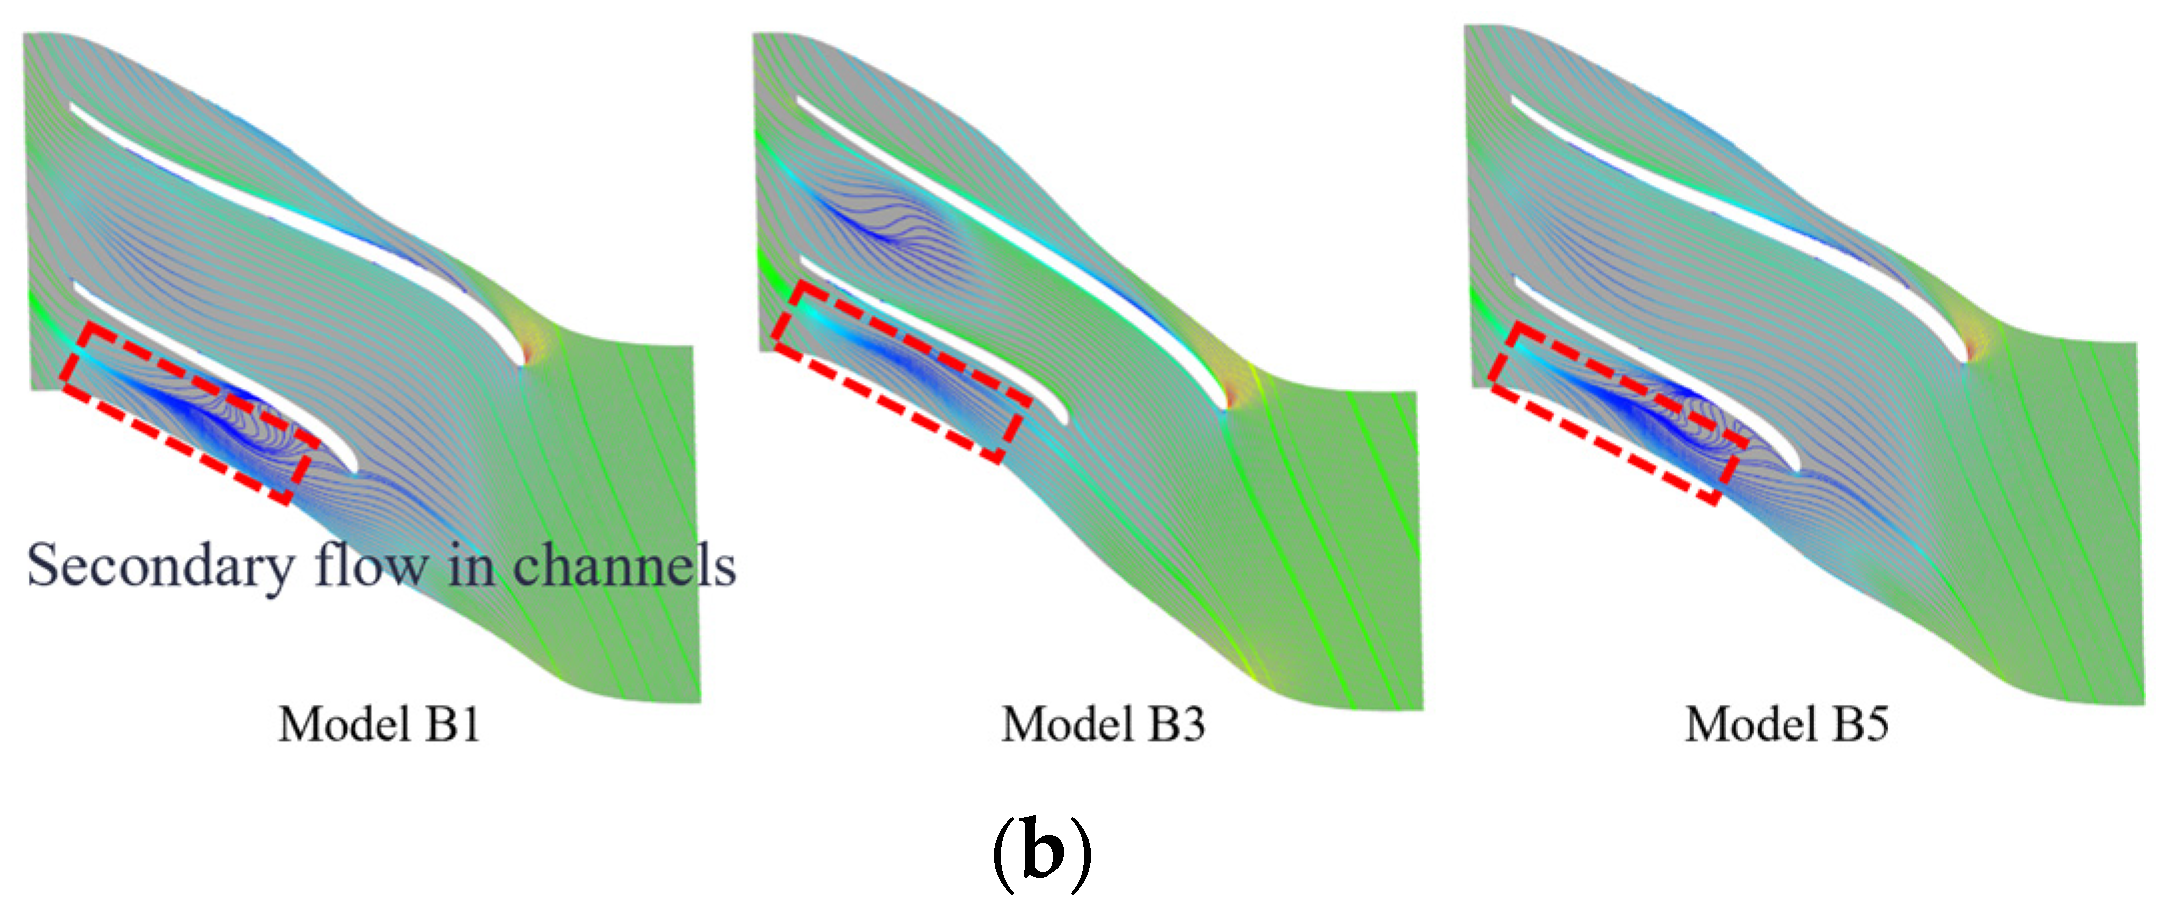
- The −15° inclined impeller demonstrates excellent performance under high-flow conditions. Geometrically constrained channels formed between the main and splitter blades reduce streamwise pressure gradients. Enhanced kinetic energy at high flow rates overcomes boundary layer resistance, suppresses secondary flow development, and ensures smoother internal airflow.
- (3)
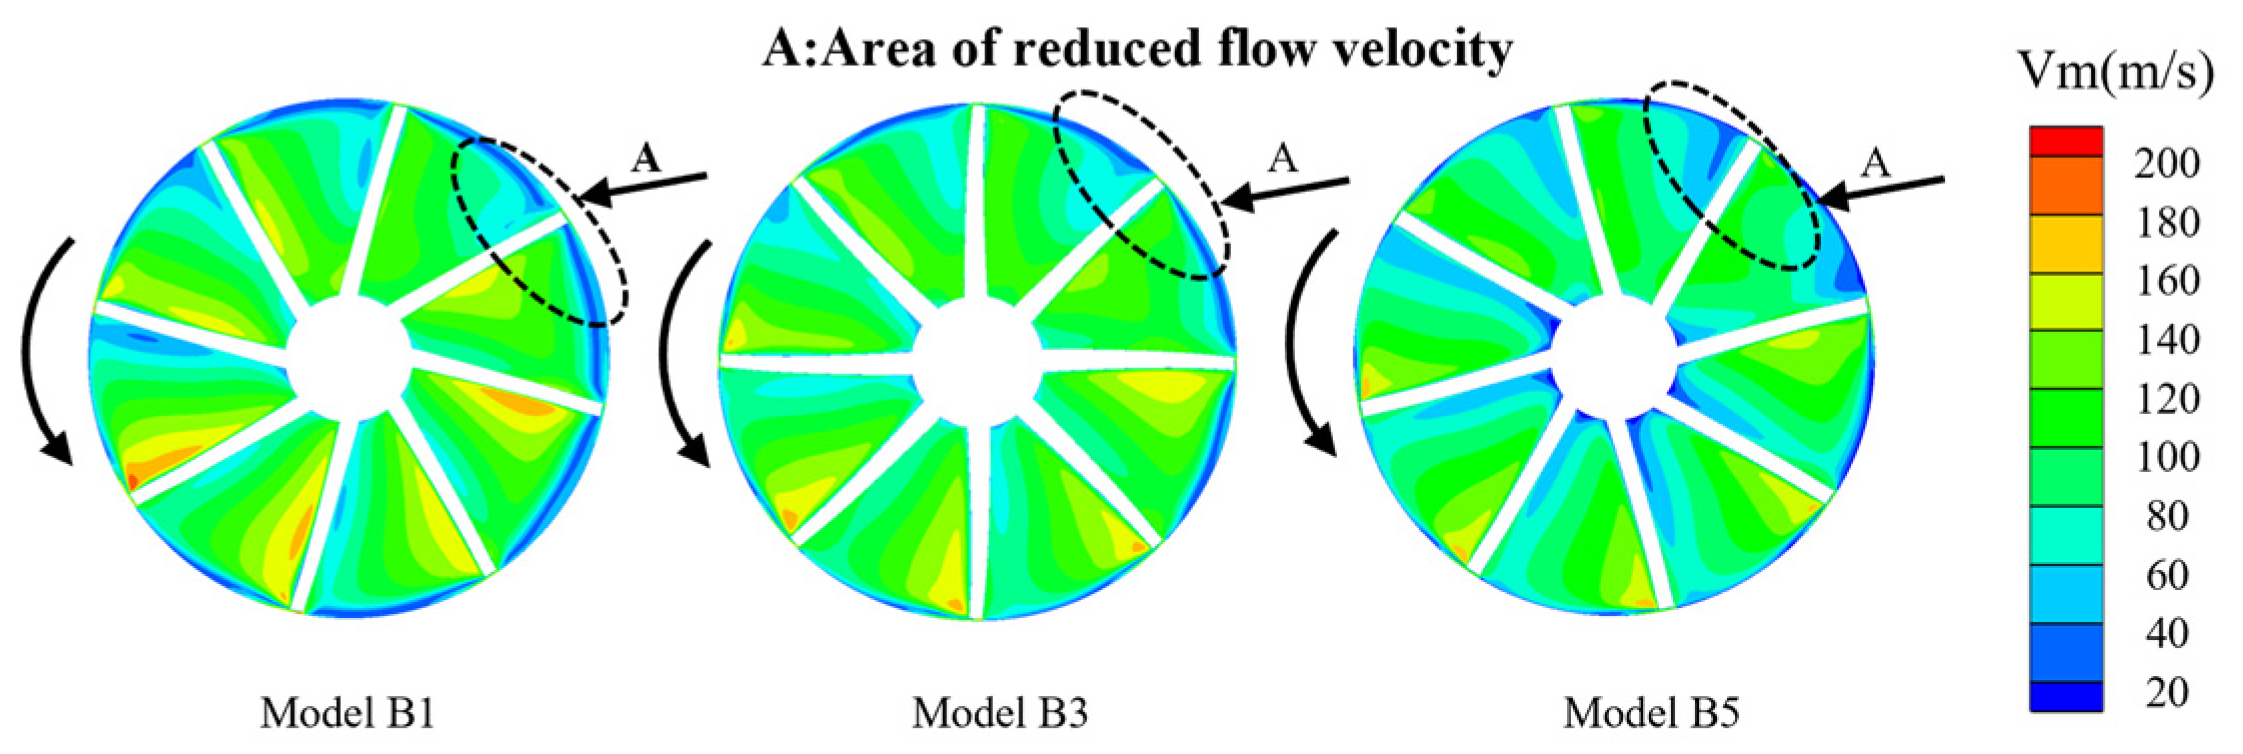
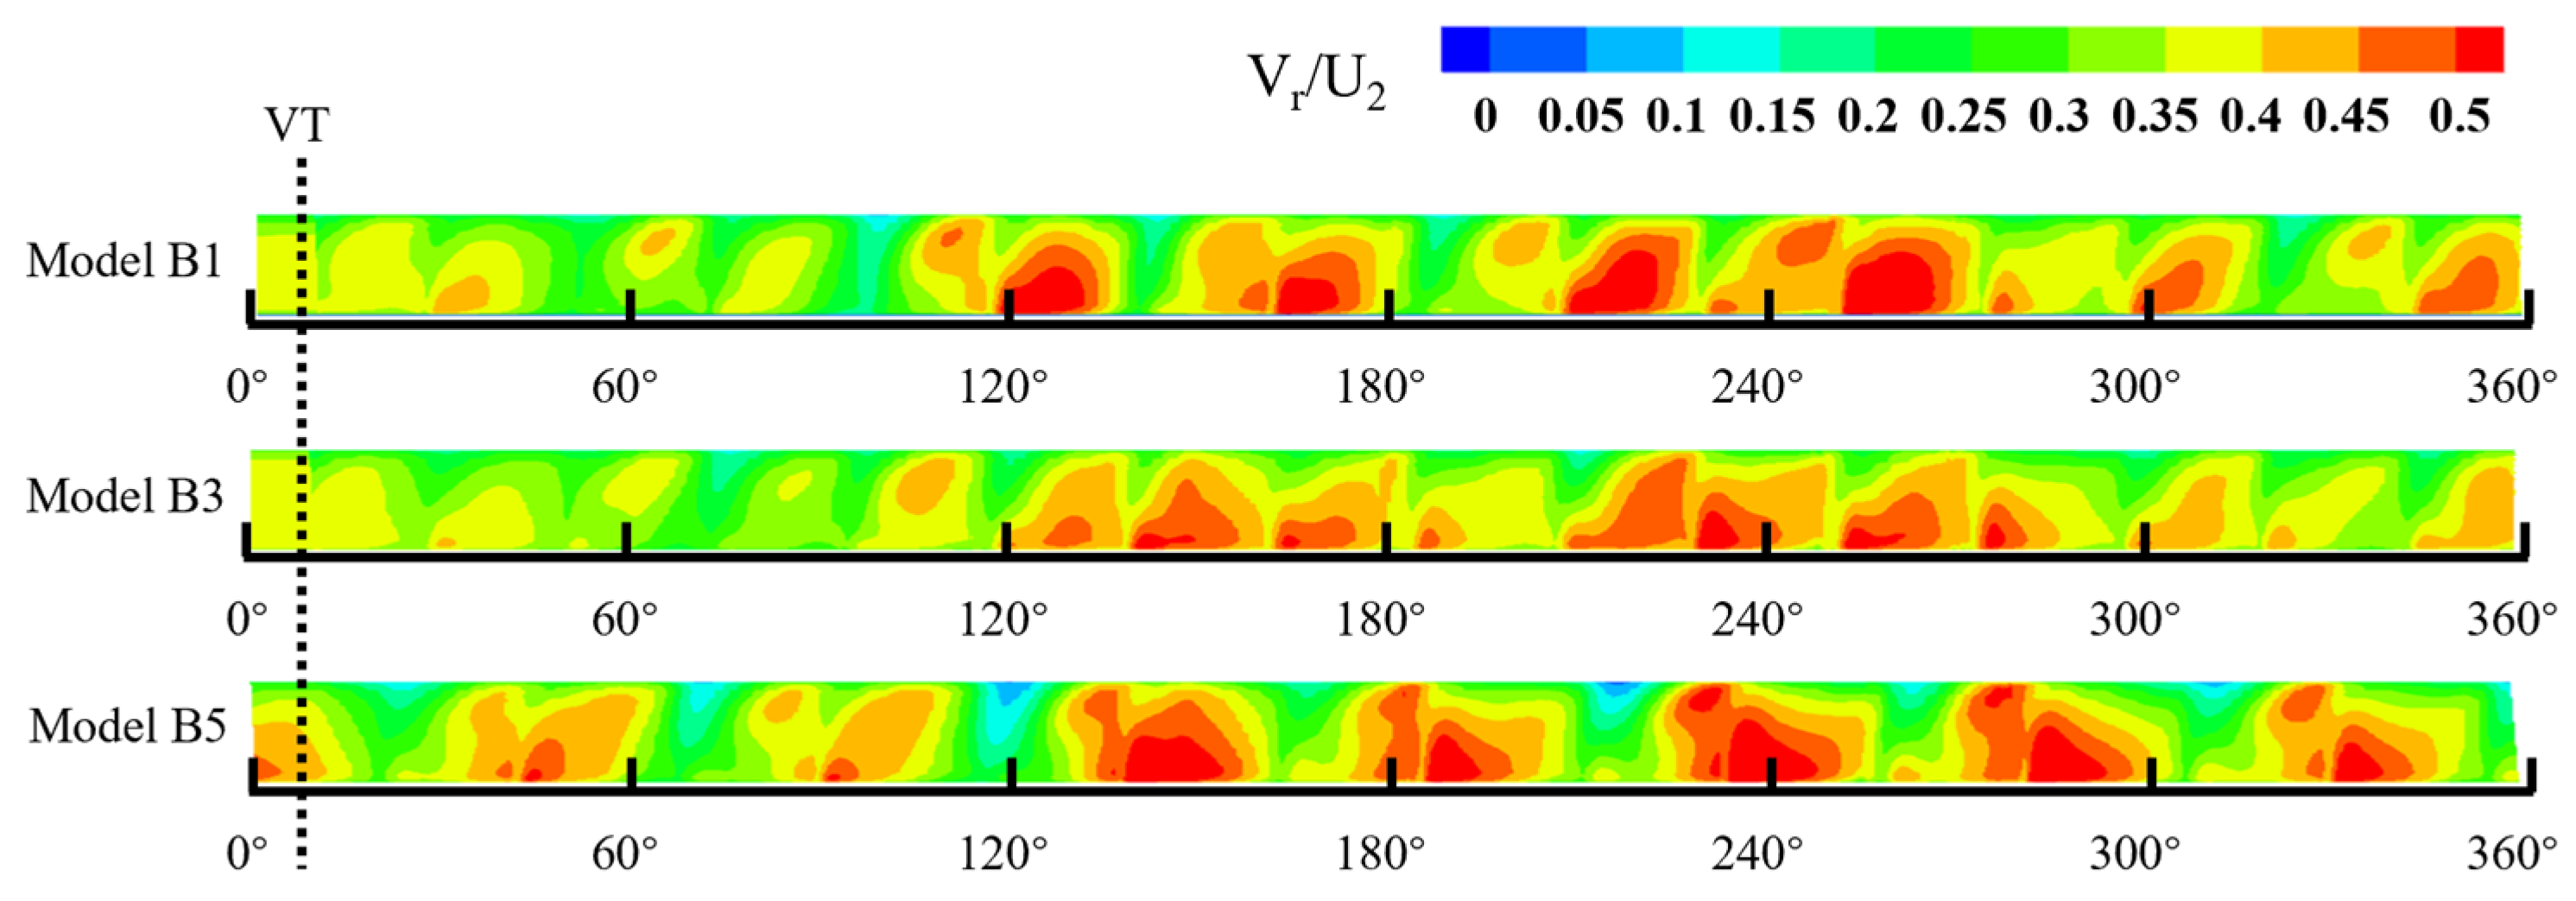
- The negative inclination effectively reduces the incidence angle deviations induced by interstage pipeline distortion. Compared with the baseline model (B3), the B1 model shows reduced outlet pressure fluctuation amplitude and significantly improved flow uniformity in the high-pressure stage passages. In contrast, the +15° configuration (B5 model) increases local entropy due to expanded tip separation zones, potentially compromising operational stability. Additionally, the −15° impeller reduces blade load fluctuations, thereby extending the operational lifespan.
Author Contributions
Funding
Data Availability Statement
Conflicts of Interest
Abbreviations
| PEMFC | Proton exchange membrane fuel cell |
| CFD | Computational fluid dynamics |
| LPS | Low-pressure stage |
| HPS | High-pressure stage |
| AC | Alternating current |
| DC | Direct current |
| LE | Leading edge |
| RMS | Root mean square |
References
- Wang, G.; Yu, Y.; Liu, H. Progress on design and development of polymer electrolyte membrane fuel cell systems for vehicle applications: A review. Fuel Process. Technol. 2018, 179, 203–228. [Google Scholar] [CrossRef]
- Mao, L.; Jackson, L.; Jackson, T. Investigation of polymer electrolyte membrane fuel cell internal be- haviour during long term operation and its use in prognostics. J. Power Sources 2017, 362, 39–49. [Google Scholar] [CrossRef]
- Petrone, G.; Zamboni, W.; Spagnuolo, G. An interval arithmetic-based method for parametric identification of a fuel cell equivalent circuit mode. Appl. Energy 2019, 242, 1226–1236. [Google Scholar] [CrossRef]
- Zhang, H.; Li, X.; Liu, X. Enhancing fuel cell durability for fuel cell plug-in hybrid electric vehicles through strategic power management. Appl. Energy 2019, 241, 483–490. [Google Scholar] [CrossRef]
- Liu, F.; Zhao, F.; Liu, Z. The impact of fuel cell vehicle deployment on road transport greenhouse gas emissions: The China case. Int. J. Hydrogen Energy 2018, 43, 22604–22621. [Google Scholar] [CrossRef]
- Cunningham, J.; Hoffman, M.; Friedma, M. A comparison of high-pressure and low-pressure operation of PEM fuel cell system. SAE Tech. Pap. 2001, 1, 538. [Google Scholar]
- Ahluwalia, R.; Wang, X.; Peng, J. Fuel Cells Systems Analysis; U.S. Department of Energy: Washington, DC, USA, 2015. [Google Scholar]
- Wan, T.; Guan, J.; Xu, S. Improved empirical parameters design method for centrifugal compressor in PEM fuel cell vehicle application. Int. J. Hydrog. Energy 2017, 42, 5590–5605. [Google Scholar] [CrossRef]
- Venturi, M.; Sang, j.; Knoop, A. Air supply system for automotive fuel cell application. SAE Tech. Pap. 2012, 1, 1225. [Google Scholar]
- Gelfi, S.; Stefanopoulou, A.G.; Pukrushpan, J.T.; Peng, H. Dynamics of Low-Pressure and High-Pressure Fuel Cell Air Supply Systems. In Proceedings of the American Control Conference, Denver, CO, USA, 4–6 June 2003; Volume 3, pp. 2049–2054. [Google Scholar]
- Zheng, X.; Zhang, Y.; He, H.; Qiu, Z. Design of a Centrifugal Compressor With Low Specific Speed for Automotive Fuel Cell. In Turbo Exp: Power for Land, Sea, and Air; ASME: New York, NY, USA, 2008; Volume 6, pp. 1531–1536. [Google Scholar]
- Zhang, Y.; Xu, S.; Wan, Y. Performance improvement of centrifugal compressors for fuel cell vehicles using the aerodynamic optimization and data mining methods. Int. J. Hydrogen Energy 2020, 45, 11276–11286. [Google Scholar] [CrossRef]
- Chen, H.; Zhuge, W.; Zhang, Y.; Ma, X. Performance improvement of a centrifugal compressor for the fuel cell vehicle by tip leakage vortex control. J. Therm. Sci. 2021, 30, 2099–2111. [Google Scholar] [CrossRef]
- Dai, Y.; Engeda, A.; Cave, M. A flow field study of the interaction between a centrifugal compressor impeller and two different volute. Proc. Inst. Mech. Eng. Part C J. Mech. Eng. Sci. 2010, 22, 345–356. [Google Scholar] [CrossRef]
- Zheng, X.; Liu, A. Investigation of the instability mechanisms in a turbocharger centrifugal compressor with a vaneless diffuser by means of unsteady simulations. Proc. Inst. Mech. Eng. Part D J. Automob. Eng. 2017, 23, 1558–1567. [Google Scholar] [CrossRef]
- Smith, L.H.; Yeh, H. Sweep and Dihedral Effects in Axial-Flow Turbomachinery. J. Fluids Eng. 1963, 85, 401. [Google Scholar] [CrossRef]
- Howard, J.H.G.; Ashrafizaadeh, M. A Numerical Investigation of Blade Lean Angle Effects on Flow in a Centrifugal Impeller. In Proceedings of the ASME 1994 International Gas Turbine and Aeroengine Congress and Exposition. Volume 1: Turbomachinery, The Hague, The Netherlands, 13–16 June 1994. [Google Scholar]
- Yang, C.; Zhang, H.; Yang, D. Casing wall static pressure distribution behavior in a centrifugal compressor with asymmetric inlet/outlet structures. Proc. Inst. Mech. Eng. 2019, 23, 37–51. [Google Scholar] [CrossRef]
- Harrison, S. The Influence of Blade Lean on Turbine Losses. ASME. J. Turbomach. 1992, 11, 184–190. [Google Scholar] [CrossRef]
- Harada, H.; Konomi, S. Centrifugal Turbomachinery. United States Patent 6,338,610 B1, 13 July 2000. [Google Scholar]
- Ganesh, C.S.; Nagpurwala, Q.H. Effect of Leading-Edge Sweep on the Performance of a Centrifugal Compressor Impeller. Sastech J. 2010, 9, 55–62. [Google Scholar]
- Wadia, A.R.; Hah, C.; Rabe, D. The Impact of Forward Sweep on Tip Clearance Flows in Transonic Compressors. In Proceedings of the 24th International Congress of the Aeronautical Science, Yokohama, Japan, 29 August–3 September 2004; pp. 1–10. [Google Scholar]
- Oh, J.; Buckley, C.W.; Agrawal, G.L. Numerical Study on the Effects of Blade Lean on High-Pressure Centrifugal Impeller Performance. In Turbo Expo: Turbine Technical Conference and Exposition; ASME: Vancouver, BC, Canada, 2011; Volume 7, pp. 1957–1969. [Google Scholar]
- Erdmenger, R.R.; Michelassi, V. Impact of Main and Splitter Blade Leading Edge Contour on the Performance of High-Pressure Ratio Centrifugal Compressors. In Turbo Expo: Turbine Technical Conference and Exposition; ASME: Düsseldorf, Germany, 2014; Volume 2D:V02DT42A042. [Google Scholar]
- Wang, S.; Jin, D.A. forward-curved blade centrifugal compressor for anode recirculation in proton exchange membrane fuel cells. Int. J. Hydrogen Energy 2024, 53, 736–748. [Google Scholar] [CrossRef]
- Zhang, L.; An, G.; Lang, J. Investigation of the unsteady flow mechanism in a centrifugal compressor adopted in the compressed carbon dioxide energy storage system. J. Energy Storage 2024, 104, 114488. [Google Scholar] [CrossRef]
- Ding, J.; Wang, S.; Xu, H. The effect of aspiration configuration on aerodynamic performance in compound lean compressor cascades of gas turbines. Appl. Therm. Eng. 2018, 130, 264–278. [Google Scholar] [CrossRef]
- Wang, H.; Yang, D. Effect of interstage pipeline on the performance of two-stage centrifugal compressors for automotive hydrogen fuel cells. Appl. Sci. 2023, 13, 503. [Google Scholar] [CrossRef]
- Spalart, P.R.; Allmaras, S. A one-equation turbulence model for aerodynamic flows. In Proceedings of the 30th aerospace sciences meeting and exhibit, Reno, NV, USA, 6–9 January 1992; pp. 5–21. [Google Scholar] [CrossRef]


| Parameters | Low-Pressure Stage | High-Pressure Stage |
|---|---|---|
| Number of main blades | 8 | 8 |
| Number of splitter blades | 8 | 8 |
| Inlet diameter of impeller (mm) | 55 | 50 |
| Diffuser inlet diameter (mm) | 80 | 74 |
| Volute outlet diameter (mm) | 41 | 41 |
| Tip leading-edge clearance (mm) | 0.3 | 0.3 |
| Tip trailing edge clearance (mm) | 0.3 | 0.3 |
| Model Set Name | Negative Leading Edge | Positive Leading Edge | |
|---|---|---|---|
| Low-pressure stage impeller | Model A1 | −15° | —— |
| Model A2 | −5° | —— | |
| Model A3 | 0° | 0° | |
| Model A4 | —— | +5 | |
| Model A5 | —— | +15° | |
| High-pressure stage impeller | Model B1 | −15° | —— |
| Model B2 | −5° | —— | |
| Model B3 | 0° | 0° | |
| Model B4 | —— | +5 | |
| Model B5 | —— | +15° | |
| Mesh Set Name | Number of Elements | Design Condition Pressure Ratio | Near-Stall Condition Pressure Ratio | Near-Clogging Operating Condition Pressure Ratio | |
|---|---|---|---|---|---|
| Low-pressure stage | Mesh-A1 | 2,057,103 | 1.807 | 1.836 | 1.605 |
| Mesh-B1 | 2,260,417 | 1.800 | 1.842 | 1.597 | |
| Mesh-C1 | 2,463,661 | 1.801 | 1.840 | 1.599 | |
| Mesh-D1 | 2,666,905 | 1.801 | 1.840 | 1.600 | |
| High-pressure stage | Mesh-A2 | 1,931,984 | 1.525 | 1.576 | 1.453 |
| Mesh-B2 | 2,123,516 | 1.520 | 1.569 | 1.446 | |
| Mesh-C2 | 2,315,048 | 1.521 | 1.570 | 1.450 | |
| Mesh-D2 | 2,506,580 | 1.519 | 1.570 | 1.451 | |
| Test Instrumentation | Manufacturer | Range |
|---|---|---|
| High-speed motor | Syco Tec (Germany) | 0~120,000 rpm |
| Pressure and temperature integrated sensor | SANTANA (Germany) | 0~4 MPa |
| Self-priming pump (RJm-70-600) | 0–3 m3/h | |
| Air filter assembly (AF005) | Beijing SinoHytec Co., Ltd. (China) | |
| Flow sensor (0281006196) | SHENAN (China) | 8–500 kg/h |
| Intake air cooler (SN2107050015) | TOYOTA (Japan) |
Disclaimer/Publisher’s Note: The statements, opinions and data contained in all publications are solely those of the individual author(s) and contributor(s) and not of MDPI and/or the editor(s). MDPI and/or the editor(s) disclaim responsibility for any injury to people or property resulting from any ideas, methods, instructions or products referred to in the content. |
© 2025 by the authors. Licensee MDPI, Basel, Switzerland. This article is an open access article distributed under the terms and conditions of the Creative Commons Attribution (CC BY) license (https://creativecommons.org/licenses/by/4.0/).
Share and Cite
Wang, W.; Yang, D.; Guo, L.; Wu, R.; Zhou, X.; Zhang, Q.; Kong, Q.; Hu, L. Investigations on the Effect of Inclination Angle on the Aerodynamic Performance of a Two-Stage Centrifugal Compressor of a Proton Exchange Membrane Fuel Cell System. Energies 2025, 18, 3199. https://doi.org/10.3390/en18123199
Wang W, Yang D, Guo L, Wu R, Zhou X, Zhang Q, Kong Q, Hu L. Investigations on the Effect of Inclination Angle on the Aerodynamic Performance of a Two-Stage Centrifugal Compressor of a Proton Exchange Membrane Fuel Cell System. Energies. 2025; 18(12):3199. https://doi.org/10.3390/en18123199
Chicago/Turabian StyleWang, Wenke, Dengfeng Yang, Li Guo, Rui Wu, Xiangyi Zhou, Qian Zhang, Qingyi Kong, and Leon Hu. 2025. "Investigations on the Effect of Inclination Angle on the Aerodynamic Performance of a Two-Stage Centrifugal Compressor of a Proton Exchange Membrane Fuel Cell System" Energies 18, no. 12: 3199. https://doi.org/10.3390/en18123199
APA StyleWang, W., Yang, D., Guo, L., Wu, R., Zhou, X., Zhang, Q., Kong, Q., & Hu, L. (2025). Investigations on the Effect of Inclination Angle on the Aerodynamic Performance of a Two-Stage Centrifugal Compressor of a Proton Exchange Membrane Fuel Cell System. Energies, 18(12), 3199. https://doi.org/10.3390/en18123199