Author Contributions
Conceptualization, T.L., J.X., H.Z. and Y.L.; Methodology, Y.L.; Validation, T.L., J.X. and H.Z.; Formal analysis, T.L.; Investigation, T.L., J.X. and H.Z.; Resources, J.C., K.L., Y.W. and Y.L.; Writing—original draft, T.L.; Writing—review & editing, Y.L.; Visualization, J.C., K.L. and Y.W.; Supervision, Y.L.; Project administration, Y.L. All authors have read and agreed to the published version of the manuscript.
Figure 1.
Schematic of the simulated horizontal pipeline.
Figure 1.
Schematic of the simulated horizontal pipeline.
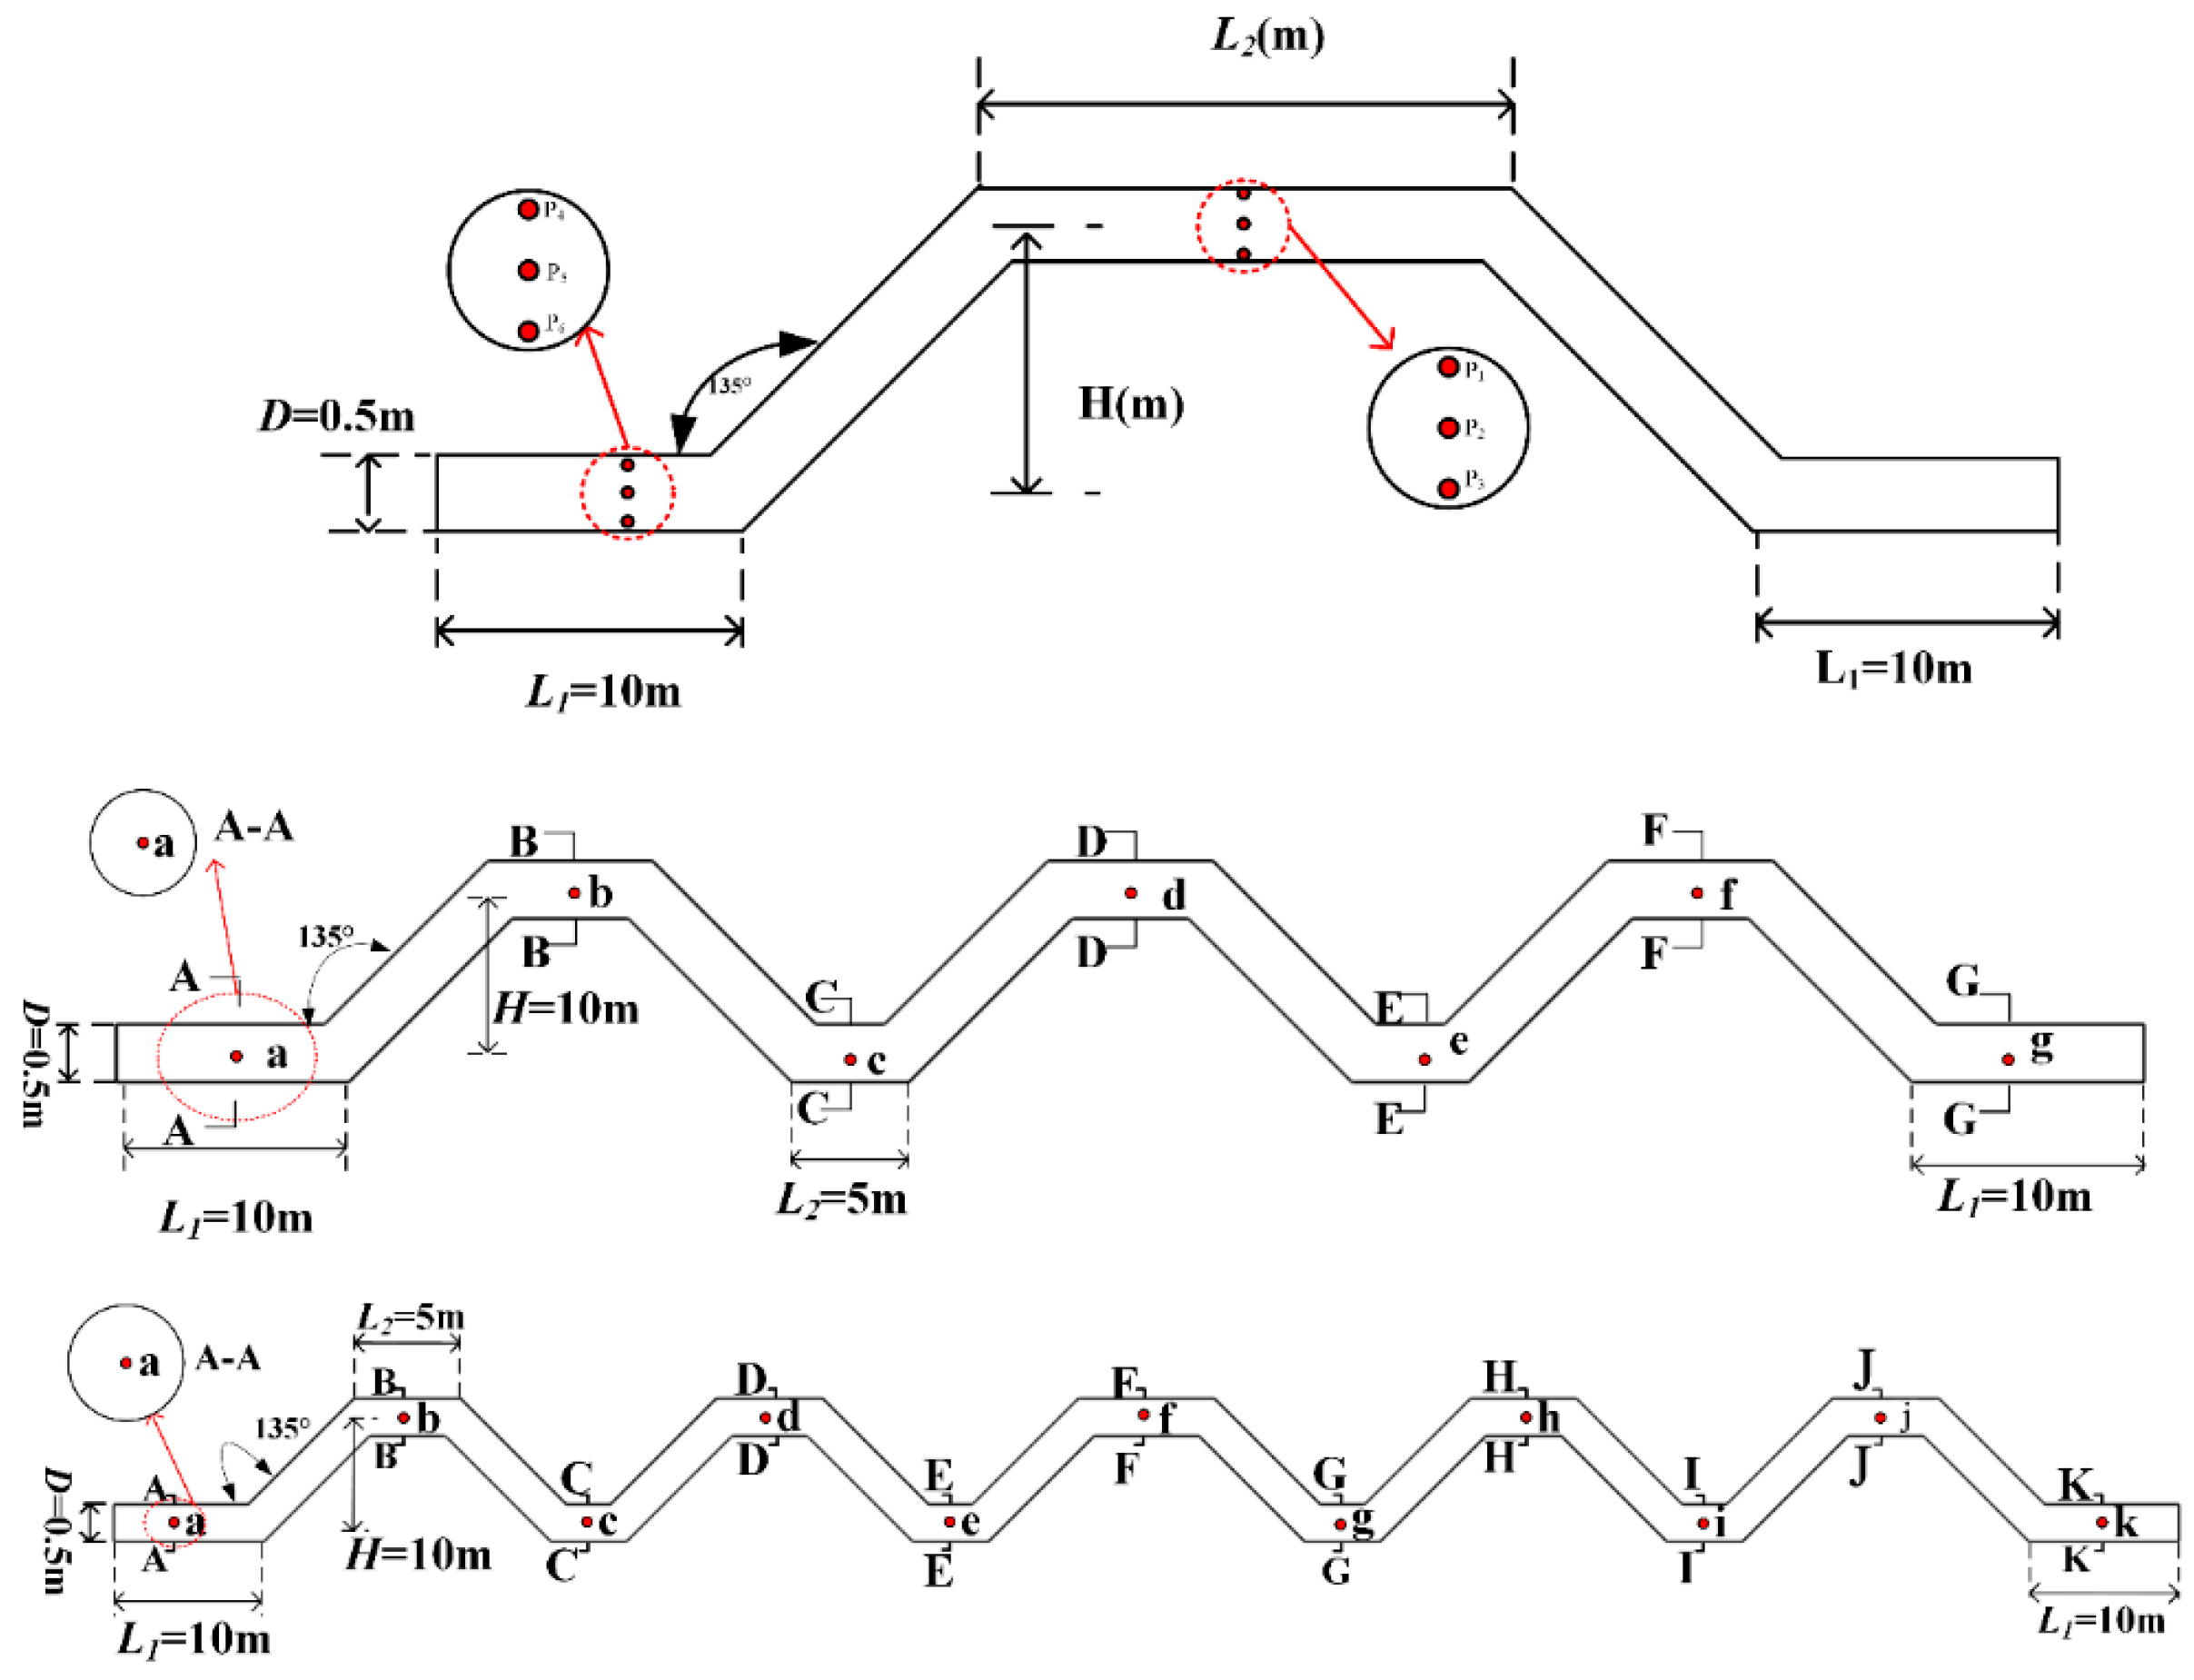
Figure 2.
Wavy Pipelines Model. L1 = bottom horizontal pipe length (m); L2 = top span length (m); H = elevation difference (m); D = pipe diameter (m).
Figure 2.
Wavy Pipelines Model. L1 = bottom horizontal pipe length (m); L2 = top span length (m); H = elevation difference (m); D = pipe diameter (m).
Figure 3.
Meshing of the horizontal pipeline.
Figure 3.
Meshing of the horizontal pipeline.
Figure 4.
Meshing of the undulating pipeline.
Figure 4.
Meshing of the undulating pipeline.
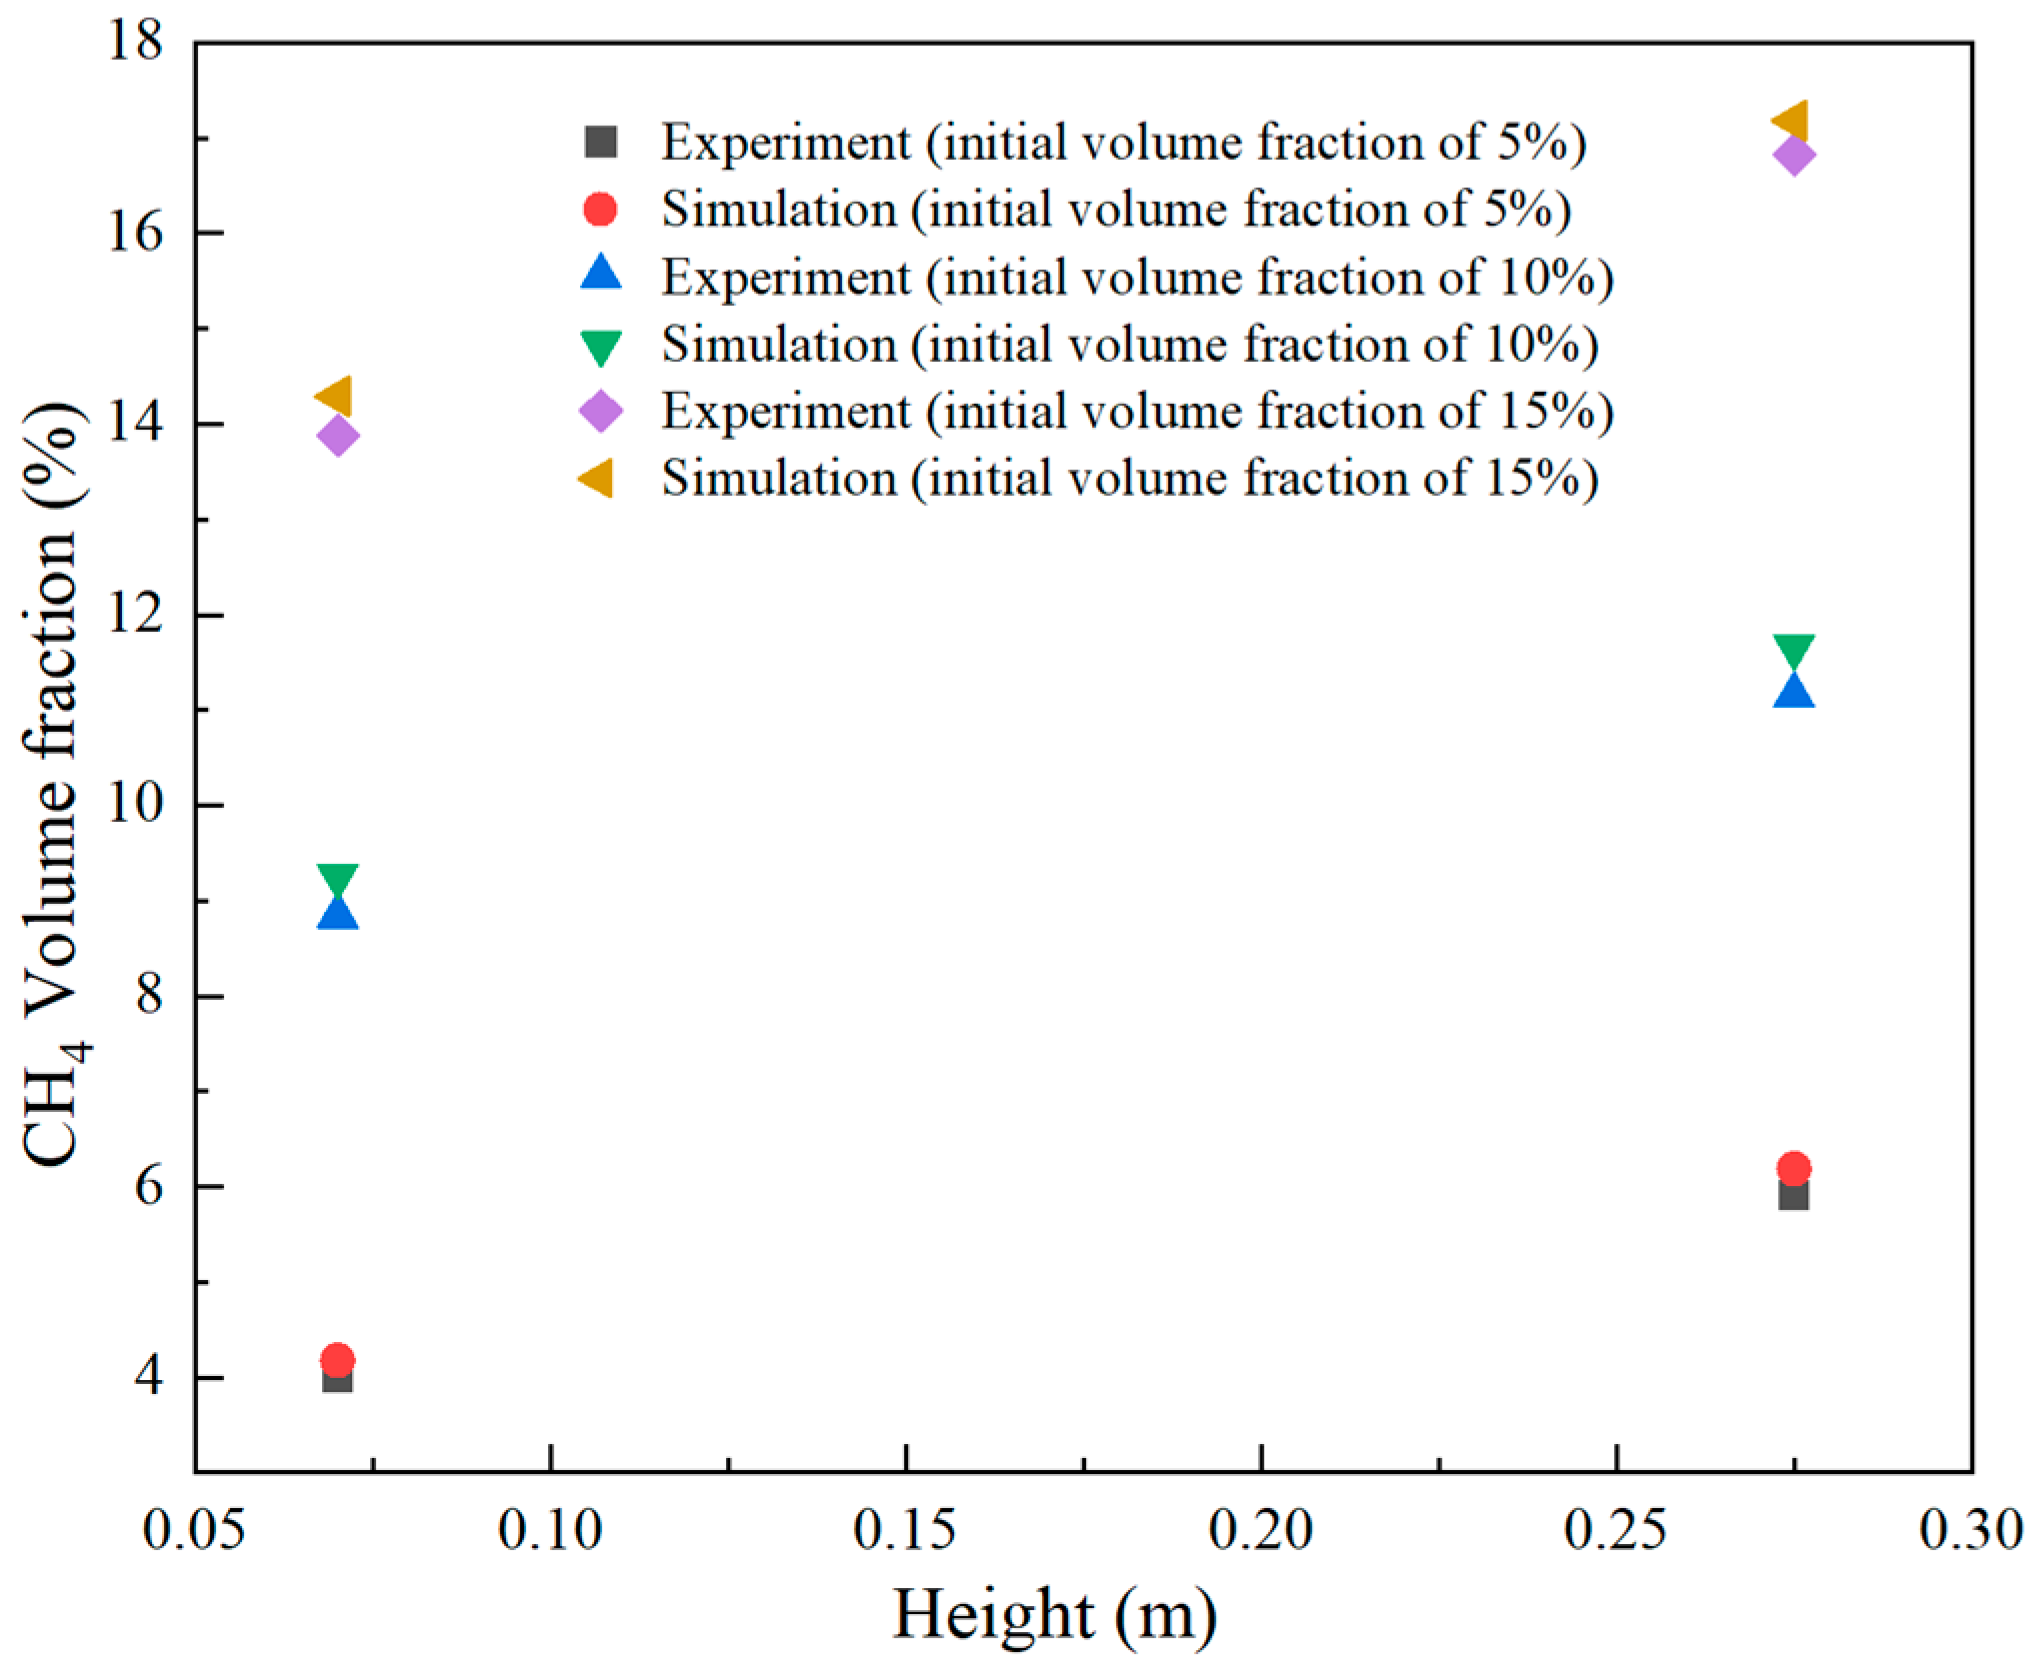
Figure 5.
After stabilization, comparison of experimental and simulation results for methane volume fractions at different positions inside the tank.
Figure 5.
After stabilization, comparison of experimental and simulation results for methane volume fractions at different positions inside the tank.
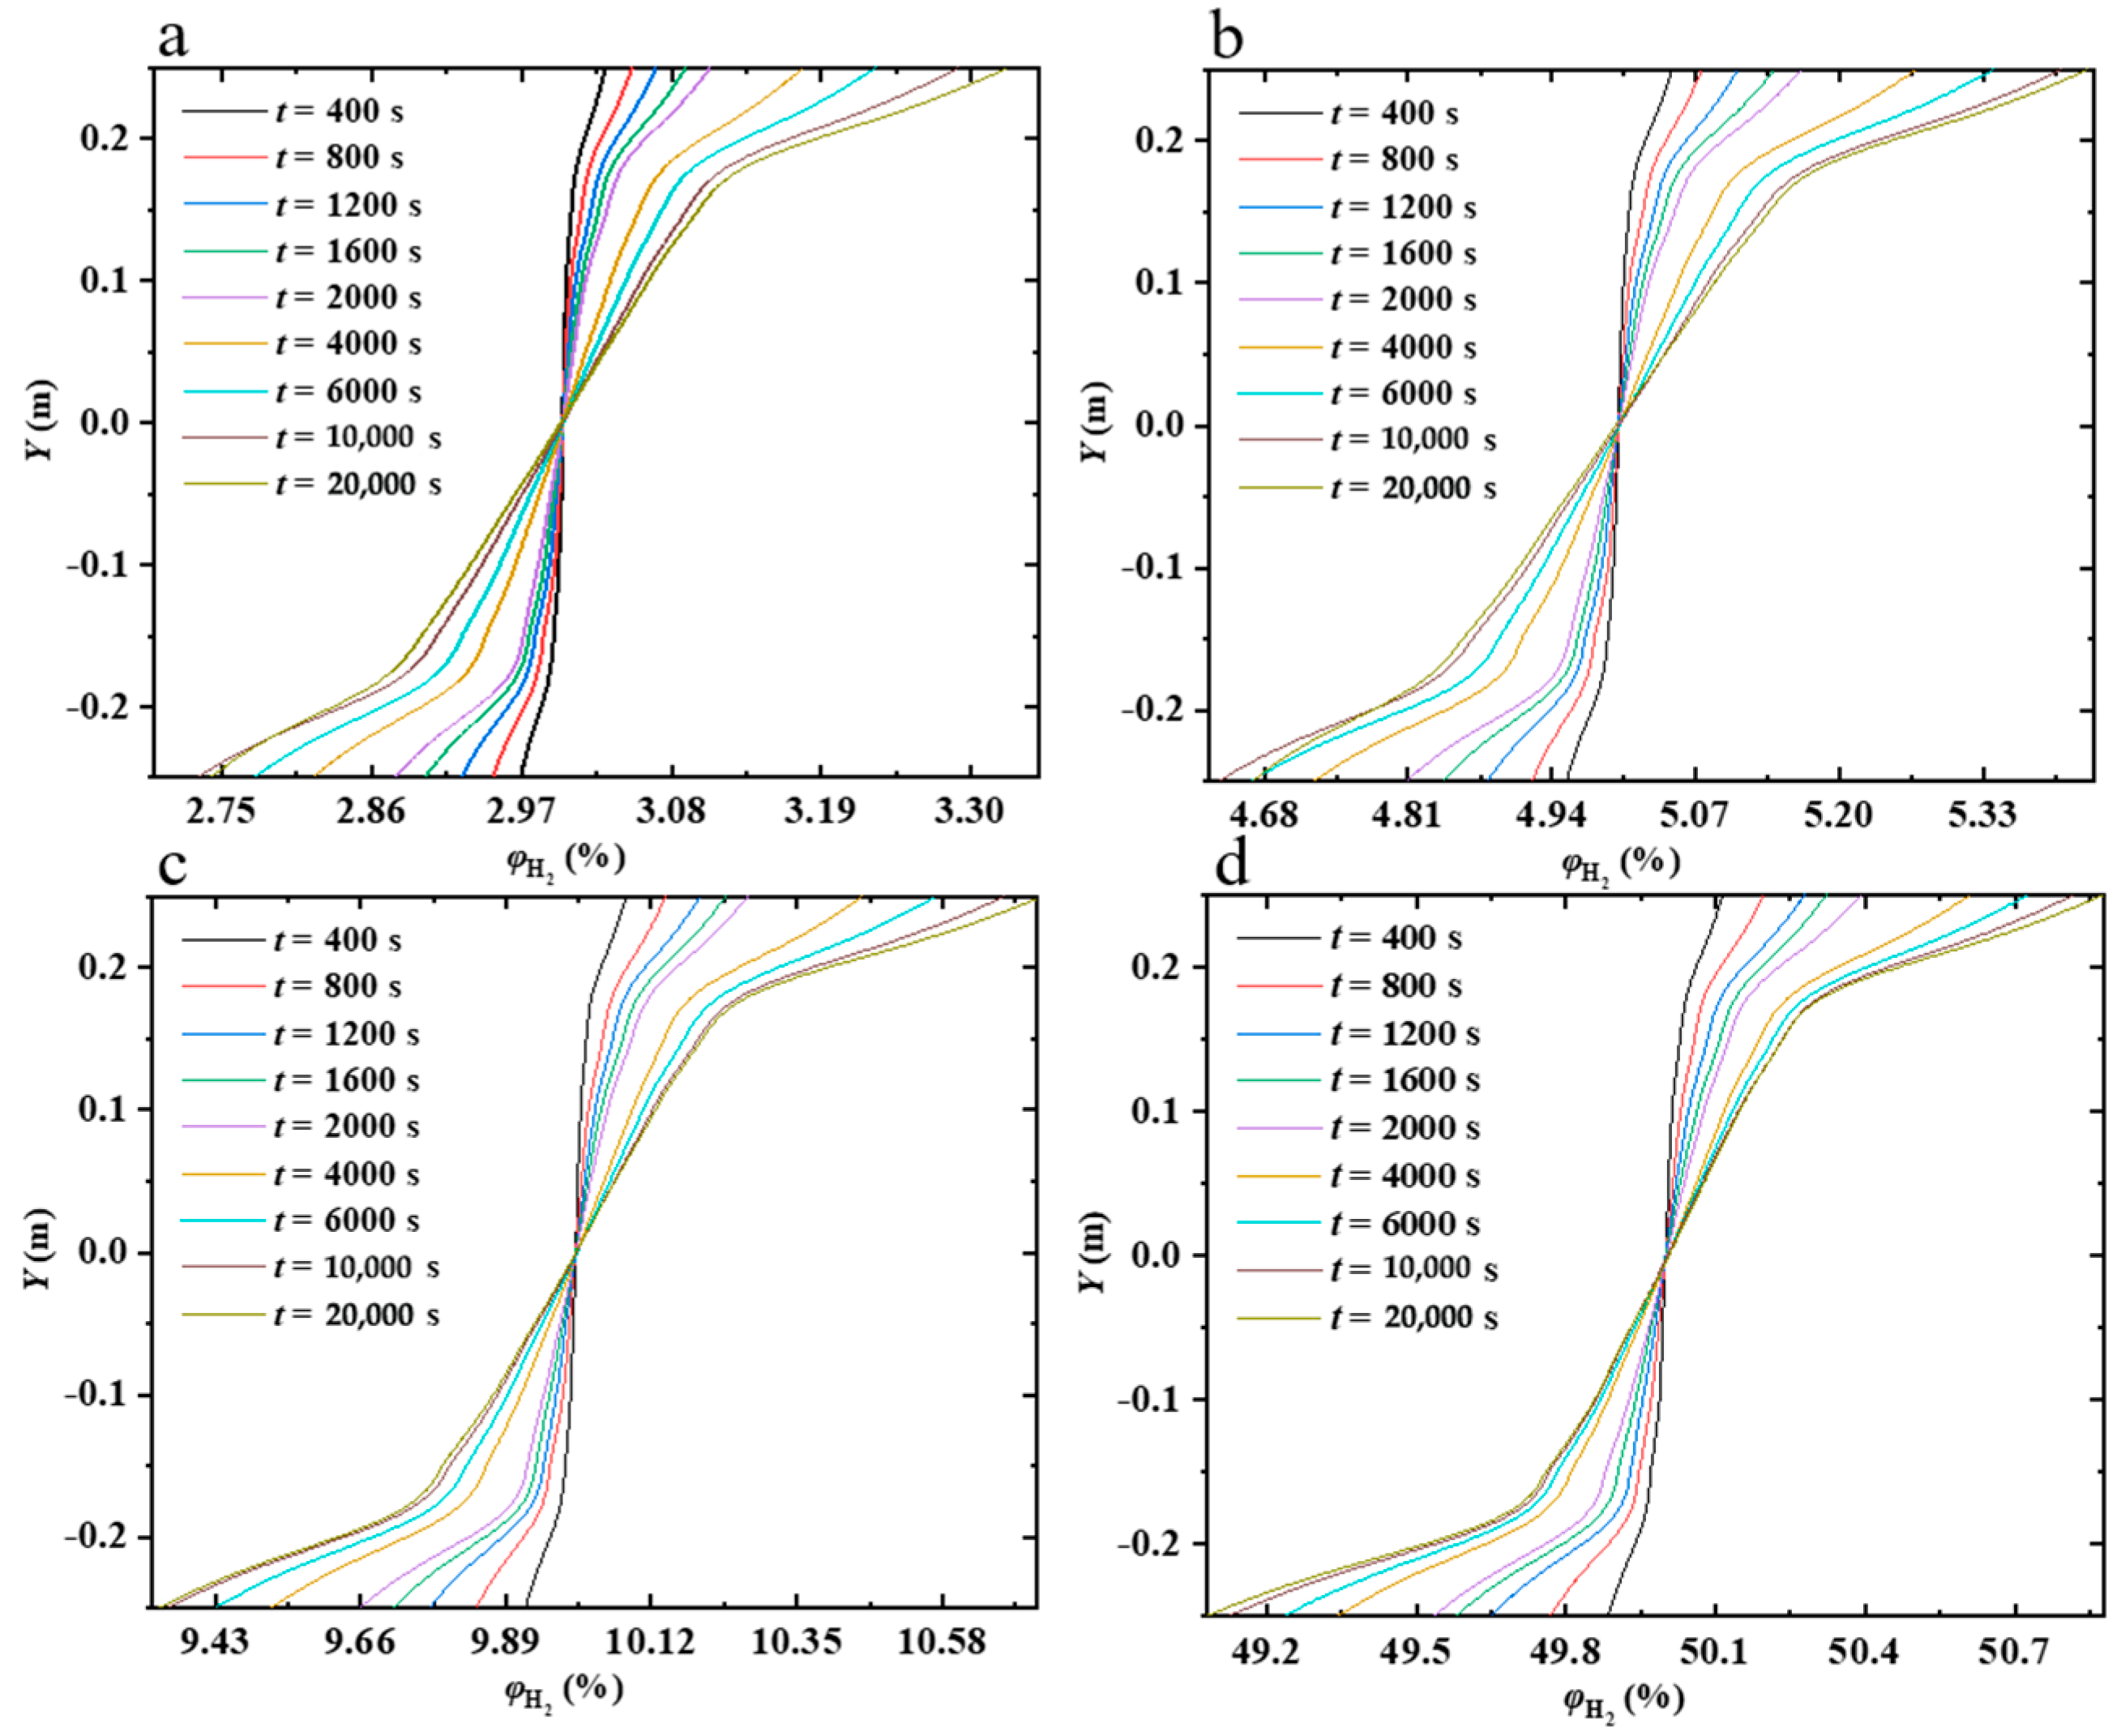
Figure 6.
Variation of hydrogen concentration along the vertical line in horizontal pipes with hydrogen concentrations of 3% (a), 5% (b), 10% (c), and 50% (d).
Figure 6.
Variation of hydrogen concentration along the vertical line in horizontal pipes with hydrogen concentrations of 3% (a), 5% (b), 10% (c), and 50% (d).
Figure 7.
Contour plot of hydrogen concentration variation over time at the z = 15 m cross-section in horizontal pipes with hydrogen concentrations of 3% (a), 5% (b), 10% (c), and 50% (d).
Figure 7.
Contour plot of hydrogen concentration variation over time at the z = 15 m cross-section in horizontal pipes with hydrogen concentrations of 3% (a), 5% (b), 10% (c), and 50% (d).
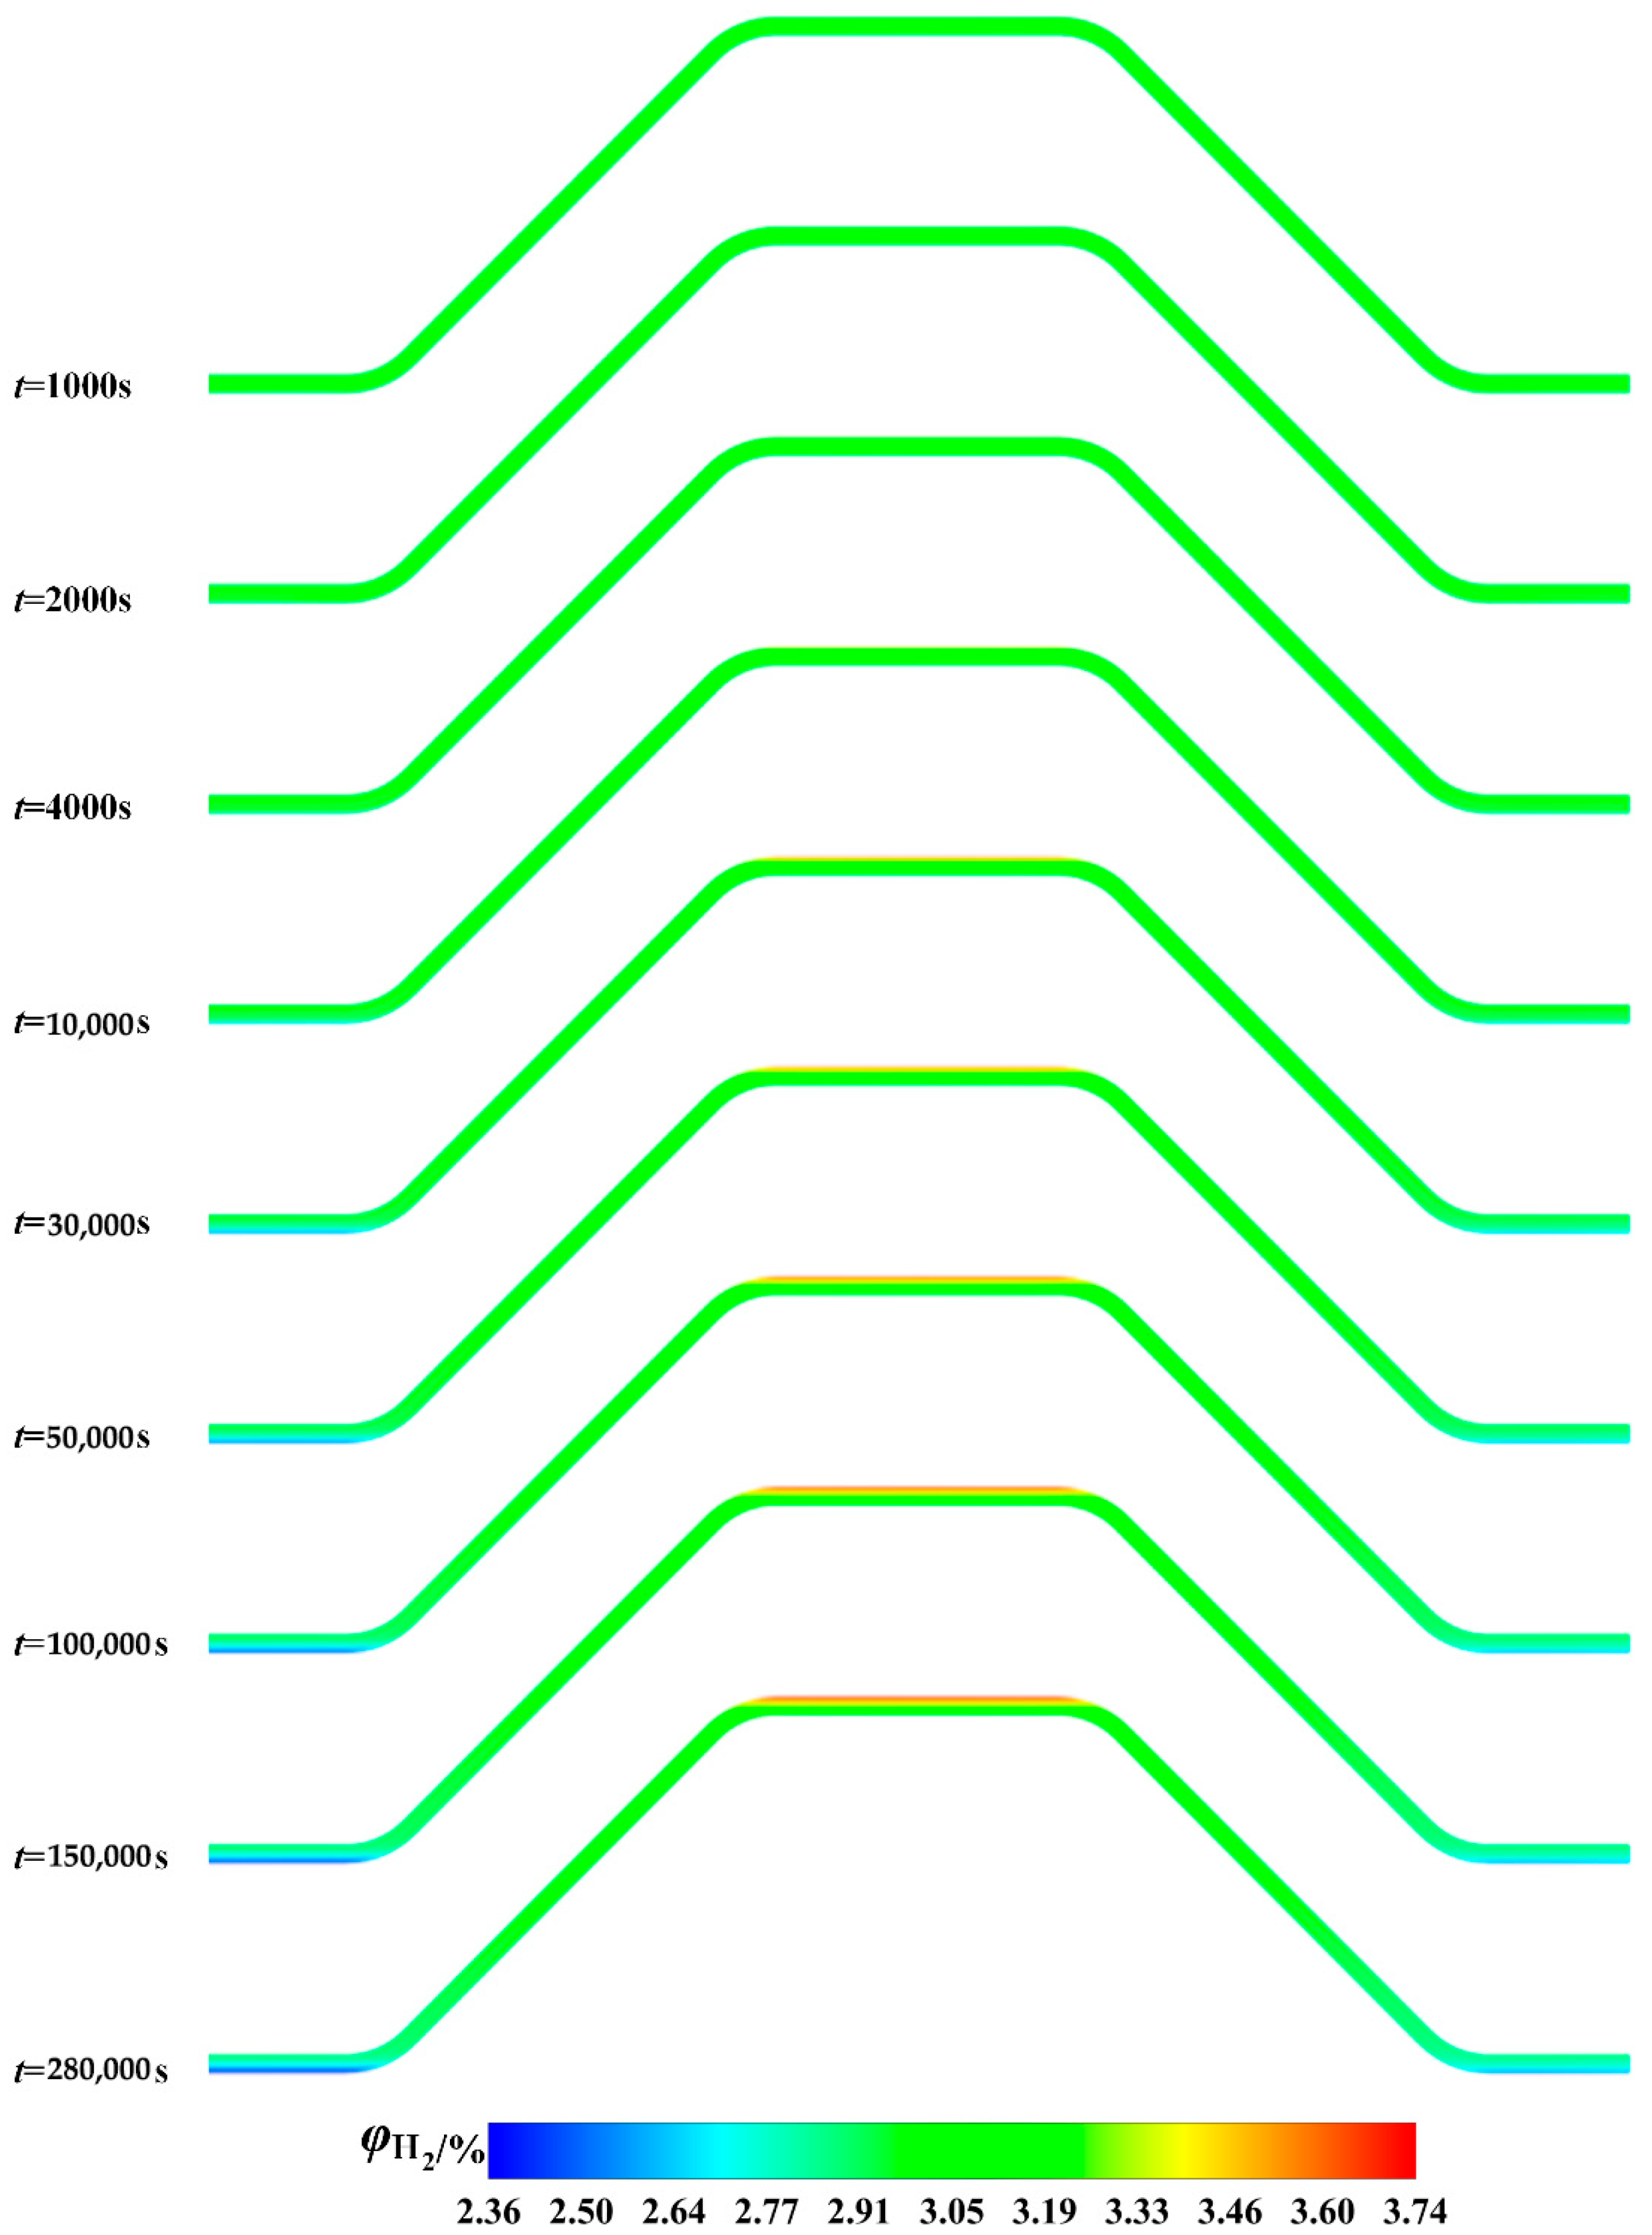
Figure 8.
Hydrogen concentration on the vertical cross-section of the undulating pipeline at different time points (elevation difference: 10 m).
Figure 8.
Hydrogen concentration on the vertical cross-section of the undulating pipeline at different time points (elevation difference: 10 m).
Figure 9.
Hydrogen concentration at cross-sections of the upper and lower horizontal segments in the undulating pipeline at different time points (elevation difference: 10 m).
Figure 9.
Hydrogen concentration at cross-sections of the upper and lower horizontal segments in the undulating pipeline at different time points (elevation difference: 10 m).
Figure 10.
Hydrogen concentration vs. time curves at six monitoring points (elevation difference: 10 m).
Figure 10.
Hydrogen concentration vs. time curves at six monitoring points (elevation difference: 10 m).
Figure 11.
Schematic of the undulating pipeline with 50 m top span length. “A-A” – “D-D” are hydrogen concentration monitoring surfaces, and “a” – “d” are hydrogen con-centration detection points.
Figure 11.
Schematic of the undulating pipeline with 50 m top span length. “A-A” – “D-D” are hydrogen concentration monitoring surfaces, and “a” – “d” are hydrogen con-centration detection points.
Figure 12.
Hydrogen concentration on the vertical cross-section at different time points (top span length: 50 m).
Figure 12.
Hydrogen concentration on the vertical cross-section at different time points (top span length: 50 m).
Figure 13.
Hydrogen concentration vs. time curves at four monitoring points (top span length: 50 m).
Figure 13.
Hydrogen concentration vs. time curves at four monitoring points (top span length: 50 m).
Figure 14.
Hydrogen concentration at cross-sections of the upper and lower horizontal segments at different time points (top span length: 50 m).
Figure 14.
Hydrogen concentration at cross-sections of the upper and lower horizontal segments at different time points (top span length: 50 m).
Figure 15.
Schematic of the undulating pipeline (n = 3). “A-A” – “G-G” are hydrogen concentration monitoring surfaces, and “a” – “g” are hydrogen concentration detection points.
Figure 15.
Schematic of the undulating pipeline (n = 3). “A-A” – “G-G” are hydrogen concentration monitoring surfaces, and “a” – “g” are hydrogen concentration detection points.
Figure 16.
Hydrogen concentration on the vertical cross-section at different time points (n = 3).
Figure 16.
Hydrogen concentration on the vertical cross-section at different time points (n = 3).
Figure 17.
Hydrogen concentration vs. time curves at monitoring points (n = 3).
Figure 17.
Hydrogen concentration vs. time curves at monitoring points (n = 3).
Figure 18.
Hydrogen concentration at cross-sections of the upper and lower horizontal segments at different time points. (n = 3).
Figure 18.
Hydrogen concentration at cross-sections of the upper and lower horizontal segments at different time points. (n = 3).
Table 1.
Hydrogen Pipelines in Different Regions of the World.
Table 1.
Hydrogen Pipelines in Different Regions of the World.
| Regions | Pipeline Length |
|---|
| km | Miles |
|---|
| U.S. | 2608 | 1621 |
| Europe | 1598 | 993 |
| Rest of World | 337 | 209 |
| World total | 4542 | 2823 |
Table 2.
Hydrogen Pipelines of Different Global Companies.
Table 2.
Hydrogen Pipelines of Different Global Companies.
| Companies | Pipeline Length |
|---|
| km | Miles |
|---|
| Air Liquide | 1936 | 1203 |
| Air Products | 1140 | 708 |
| Linde | 244 | 152 |
| Praxair | 739 | 459 |
| Others | 483 | 300 |
| World total | 4542 | 2823 |
Table 3.
The concentration variation in the hydrogen and methane mixture at different heights.
Table 3.
The concentration variation in the hydrogen and methane mixture at different heights.
| Height (m) | H2/CH4 | H2 Percentage | CH4 Percentage |
|---|
| 0 | 0.2500 | 20.00% | 80.00% |
| 30 | 0.2504 | 20.03% | 79.97% |
| 60 | 0.2508 | 20.05% | 79.95% |
| 90 | 0.2513 | 20.08% | 79.92% |
| 120 | 0.2517 | 20.11% | 79.89% |
| 1000 | 0.2642 | 20.90% | 79.10% |
Table 4.
Simulation parameters.
Table 4.
Simulation parameters.
| Pipeline Type | Internal Pressure (MPa) | φH2,I (%) | H (m) | L2 | n |
|---|
| Horizontal pipeline | 3 | 3, 5, 10, 50 | - | - | - |
| 5 | 3, 5, 10, 50 | - | - | - |
| 8 | 3, 5, 10, 50 | - | - | - |
| Undulating pipeline | 8 | 3 | 10, 30, 50 | 10 | 1 |
| 8 | 10 | 10 | 5 | 3, 5 |
| 8 | 10 | 10 | 10, 50, 100 | 1 |
Table 5.
Grid independence verification.
Table 5.
Grid independence verification.
| Pipeline Type | Mesh Count | P1 Stabilized Hydrogen Concentration (%) | Variation Rate (%) |
|---|
| Horizontal pipeline | 75,462 | 3.56 | - |
| 254,566 | 3.70 | 3.93 |
| 446,213 | 3.72 | 0.54 |
| Undulating pipeline | 101,245 | 3.63 | - |
| 405,612 | 3.74 | 3.03 |
| 620,145 | 3.75 | 0.27 |
Table 6.
Static stratification results for the horizontal pipe at 3 MPa internal pressure.
Table 6.
Static stratification results for the horizontal pipe at 3 MPa internal pressure.
| Internal Pressure (MPa) | φH2, I (%) | φH2, max (%) | Stabilization Time (s) |
|---|
| 3 | 3 | 3.33 | 10,000 |
| 5 | 5.43 | 10,000 |
| 10 | 10.73 | 10,000 |
| 50 | 50.90 | 10,000 |
Table 7.
Static stratification results in horizontal pipelines at 5 MPa and 8 MPa internal pressures.
Table 7.
Static stratification results in horizontal pipelines at 5 MPa and 8 MPa internal pressures.
| Internal Pressure (MPa) | φH2,I (%) | φH2,max (%) | Stabilization Time (s) |
|---|
| 5 | 3 | 3.50 | 10,000 |
| 5 | 5.70 | 10,000 |
| 10 | 11.07 | 10,000 |
| 50 | 51.18 | 10,000 |
| 8 | 3 | 3.70 | 10,000 |
| 5 | 5.73 | 10,000 |
| 10 | 11.54 | 10,000 |
| 50 | 51.6 | 10,000 |
Table 8.
Static stratification simulation results for undulating pipelines with different elevation differences.
Table 8.
Static stratification simulation results for undulating pipelines with different elevation differences.
| Internal Pressure (MPa) | L2 (m) | n | H (m) | φH2,I (%) | φH2,max |
|---|
| 8 | 10 | 1 | 10 | 3 | 3.74% |
| 30 | 6.63% |
| 50 | 9.98% |
Table 9.
Comparison of Simulation Results for Settling Stratification in Wavy pipelines with Different L2.
Table 9.
Comparison of Simulation Results for Settling Stratification in Wavy pipelines with Different L2.
| Internal Pressure (MPa) | L2 (m) | n | H (m) | φH2,I (%) | φH2,max |
|---|
| 8 MPa | 10 m | 1 | 10 m | 10 | 10.65% |
| 50 m | 10.45% |
| 100 m | 10.38% |
Table 10.
Comparison of Settling Stratification Simulation Results for Different Numbers of Spans.
Table 10.
Comparison of Settling Stratification Simulation Results for Different Numbers of Spans.
| Internal Pressure (MPa) | L2 (m) | n | H (m) | φH2,I | φH2,max |
|---|
| 8 MPa | 5 m | 3 | 10 m | 10% | 10.8% |
| 5 | 10.78% |


