1. Introduction
Vertical axis wind turbines (VAWTs) are modern devices crafted to harness wind power and transform it into electricity [
1]. Unlike the classic horizontal axis wind turbines (HAWTs) with blades spinning around a horizontal axis, VAWTs feature blades rotating around a vertical axis, akin to a large eggbeater or spinning top [
2].
The operational principle of a VAWT is based on the interaction between its blades and the wind [
3]. When the wind blows, it exerts a force on the blades, prompting them to spin around the central vertical axis. This rotational movement propels a generator or alternator positioned at the turbine’s base, converting mechanical energy into electrical power [
4]. Vertical axis wind turbines (VAWTs) are versatile, capable of generating electricity from winds blowing in all directions, making them suitable for various environments [
5].
Various types of VAWTs exist, each with distinct designs and operational attributes. For instance, Savonius turbines feature curved blades that capture wind energy through drag forces, making them optimal for low wind speeds [
6]. Conversely, Darrieus turbines use airfoil-shaped blades to generate lift forces, enabling efficient operation at higher wind speeds [
7]. Additionally, helical, gyromill, and cycloturbine designs offer alternative options, each with its own set of advantages in efficiency, scalability, and environmental impact [
8].
Vertical axis wind turbines (VAWTs) bring the following advantages, which make them a strong candidate for environments where wind conditions are inconsistent. Unlike horizontal axis wind turbines (HAWTs), which must face the wind to operate efficiently, VAWTs can capture wind from any direction without relying on orientation mechanisms. This makes them particularly effective in locations like highways, where wind patterns fluctuate due to moving vehicles [
9]. Another practical benefit is their design: with most components located near the ground, VAWTs are easier and safer to maintain [
10].
However, these benefits come with trade-offs. VAWTs generally produce less power than HAWTs under steady wind conditions because parts of the rotor move against the wind during rotation, increasing drag. They can also be more difficult to start without external assistance and may experience greater stress on the blades due to constantly changing aerodynamic forces. Despite these limitations, their compact footprint and ability to function well in turbulent air make VAWTs a promising option for generating renewable energy in areas where conventional turbines may not be feasible [
11]. VAWTs are also much smaller in size than HAWTs, which makes them a good candidate for tight locations like proximity to moving vehicles on the sides of highways.
Highway VAWTs are specially crafted for deployment alongside highways and roads, offering a promising pathway for renewable energy production. These turbines exploit the inconsistent wind flow generated by passing vehicles, leveraging strategically positioned guide vanes or deflectors to amplify energy capture [
12]. By tapping into the kinetic energy of passing traffic, highway VAWTs provide a unique opportunity to generate clean, sustainable electricity while minimizing the environmental impact associated with conventional energy sources [
13].
Literature Review
Research Gaps Identified:
Most existing studies model VAWT performance under natural wind conditions which are steady or ideal, without considering the effects of passing highway vehicles on the wind entering the turbine.
Few studies directly compare different turbine geometries or layouts under the same traffic-induced wind scenarios but do not incorporate guides for directing the wind into the turbine.
The influence of guide vane design and placement on performance under dynamic traffic conditions remains underexplored.
Novel Contributions of This Study:
This study presents a parametric optimization study on improvements in energy capture of VAWTs using guides and compares the results to data available in the literature.
Using CFD allows researchers to visualize and evaluate transient airflows generated by vehicles, providing insight into actual turbine behavior during operation.
The findings offer practical guidance for enhancing turbine systems designs and positioning to maximize energy capture from roadside traffic.
Tian et al. [
14] examined a lab-developed Banki-type VAWT using 2D CFD simulations in Fluent. Tested at 2 m/s wind speed, the turbine reached a power coefficient (
of 0.278 at a tip speed ratio (TSR) of 0.5 with a 60° windshield. While the rated power was not reported, the study showed a 66.9% efficiency improvement, confirming the benefit of aerodynamic modifications.
Jeon et al. [
15] analyzed a lab-developed helical Savonius-type wind turbine using wind tunnel experiments. The rotor had a diameter of 210 mm and a height of 315 mm, with a swept area of 0.066 m
2. While partially blocked end plates were less effective, using circular end plates on both sides improved the power coefficient by 36%. The rated power was not reported, but the study demonstrated the significance of blockage correction in performance evaluation.
Santhakumar et al. [
16] tested a lab-developed modified Savonius-type VAWT installed along a four-lane highway during monsoon season. They found that placing the turbine in the median strip between lanes L2 and L3 yielded the highest power output, reaching 110 W. The study demonstrated the practical potential of integrating wind energy systems into road infrastructure.
Tian et al. [
17] conducted a computational fluid dynamics study to evaluate a Banki-type vertical axis wind turbine designed for use near highways. The turbine, developed as a research prototype, featured 20 arc-shaped blades, with a diameter and height of 1 m each. In the simulation, it was placed 1.5 m from a vehicle moving at 30 m/s, while the rotor spun at 4 radians per second. Using a sliding mesh method, the study captured how airflow from the moving vehicle interacted with the turbine. Under these conditions, the turbine produced 43.02 joules of energy from a single vehicle pass.
Subramanian et al. [
18] performed a three-dimensional CFD analysis to investigate how blade solidity and airfoil shape affect VAWT performance. The study compared two- and three-bladed rotor configurations using S1046 (National Renewable Energy Laboratory, Golden, CO, USA) and DU21-A17 (Delft University of Technology, Delft, The Netherlands) airfoils. Results showed that two-bladed turbines performed better at high tip speed ratios due to stronger vortex interactions, while three-bladed turbines were more efficient at low tip speed ratios thanks to improved wind engagement. The models were lab-developed, and although rated power was not specified, performance trends were analyzed through power and torque coefficients.
Hu et al. [
13] conducted a 3D CFD study to evaluate the performance of vertical wind energy harvesting devices installed near highways. Among various configurations, a lab-developed rectangular model with four blades and a height of 1.55 m demonstrated the best performance, achieving the highest angular velocity and torque output. While rated power was not specified, the study highlighted the effectiveness of multi-blade configurations for energy capture in turbulent roadside environments.
Pan et al. [
19] developed a lab-scale portable wind energy system for isolated railway tunnels, combining S-rotor and H-rotor configurations. Tested under a wind speed of 11 m/s, the system achieved an output power of 0.86 W with an efficiency of 23.2%. The study highlighted the potential of hybrid small-scale turbines in confined environments where wind flow is intermittent and channeled.
Tian et al. [
20] conducted a 3D CFD-based optimization study of a lab-developed Savonius wind turbine, focusing on novel blade shapes with semi-elliptical sides. Out of 68 simulated configurations, the most effective design featured flatter, thicker blades, which improved flow separation and torque characteristics. At a tip speed ratio of 0.7, the optimized turbine reached a maximum average power coefficient of 0.258, marking a 4.41% improvement over the traditional curved-blade design. While the rated power was not specified, the study confirmed the aerodynamic benefits of shape modification in small-scale VAWTs.
Nimvari et al. [
21] used 3D CFD simulations to evaluate the performance of a lab-developed Savonius-type VAWT equipped with porous deflector plates. By adjusting deflector porosity, position, and height, the optimized configuration significantly enhanced turbine efficiency. The starting torque coefficient nearly doubled, and the maximum power coefficient increased by approximately 10% at a tip speed ratio of 1. Although the rated power was not specified, the findings support the aerodynamic advantages of deflector-assisted VAWT designs.
Toudabari et al. [
22] used 3D CFD simulations to investigate the performance of a lab-developed straight-bladed Darrieus VAWT under various highway vehicle configurations. The study found that the presence and positioning of vehicles, particularly the inclusion of a second vehicle, significantly affected turbine efficiency by modifying wake interactions. The optimal setup produced 6.82 joules of energy per vehicle pass, highlighting the potential benefits of vehicle-induced flow manipulation in highway wind energy systems.
Matias et al. [
23] used two-dimensional CFD simulations to assess how windshield angles influence the performance of a lab-developed Banki-type vertical axis wind turbine. The rotor, consisting of 20 arc-shaped blades with a 1 m diameter and height, was tested alongside both a car and a bus traveling at 28 m/s. Windshields were placed in front of the turbine at angles ranging from 30° to 150°. Results indicated that a 60° windshield enhanced turbine output by 16.14% when paired with a car, while the same configuration reduced performance by 12.69% when used with a bus. Although rated power was not specified, the study demonstrated the aerodynamic sensitivity of Banki turbines to upstream modifications.
Hu et al. [
24] conducted a 3D CFD simulation study to evaluate the energy harvesting potential of different vertical axis wind turbine arrays along highways. Three designs—Banki, Rectangular, and Combined—were compared. Among them, the Combined Configuration demonstrated superior performance by effectively capturing vehicle-induced wakes. The study also showed that larger vehicles, such as trucks, produced stronger airflow and enhanced energy extraction. Although rated power was not reported, the findings underscored the value of aerodynamic optimization in designing VAWT systems for roadside environments.
Hu et al. [
25] used 3D CFD simulations to examine how varying traffic patterns impact the performance of lab-developed vertical axis wind turbines placed along highways. Across seven modeled scenarios, Case 7—where heavy trucks filled all traffic lanes—resulted in the highest performance, achieving a power coefficient of 28.2% and an average output of 76.27 W. In contrast, Case 1, featuring only cars in the passing lane, yielded the lowest output with a
of 23.9% and 17.94 W. These results highlight the importance of consistent and heavy traffic flow in enhancing the energy capture potential of highway wind systems.
5. Set-Up
The simulations are based on the incompressible Reynolds-Averaged Navier–Stokes (RANS) equations, which govern the conservation of mass and momentum in turbulent flow. The shear stress transport (SST)
k–
ω turbulence model is employed to accurately capture the flow separation and near-wall behavior around the turbine blades. Pressure-velocity coupling is handled using the SIMPLE algorithm. Second-order upwind schemes are used for spatial discretization of momentum and turbulence quantities to maintain numerical accuracy. The fluid is assumed to be air at standard atmospheric conditions, with constant density and viscosity. The setup details are summarized in
Table 6.
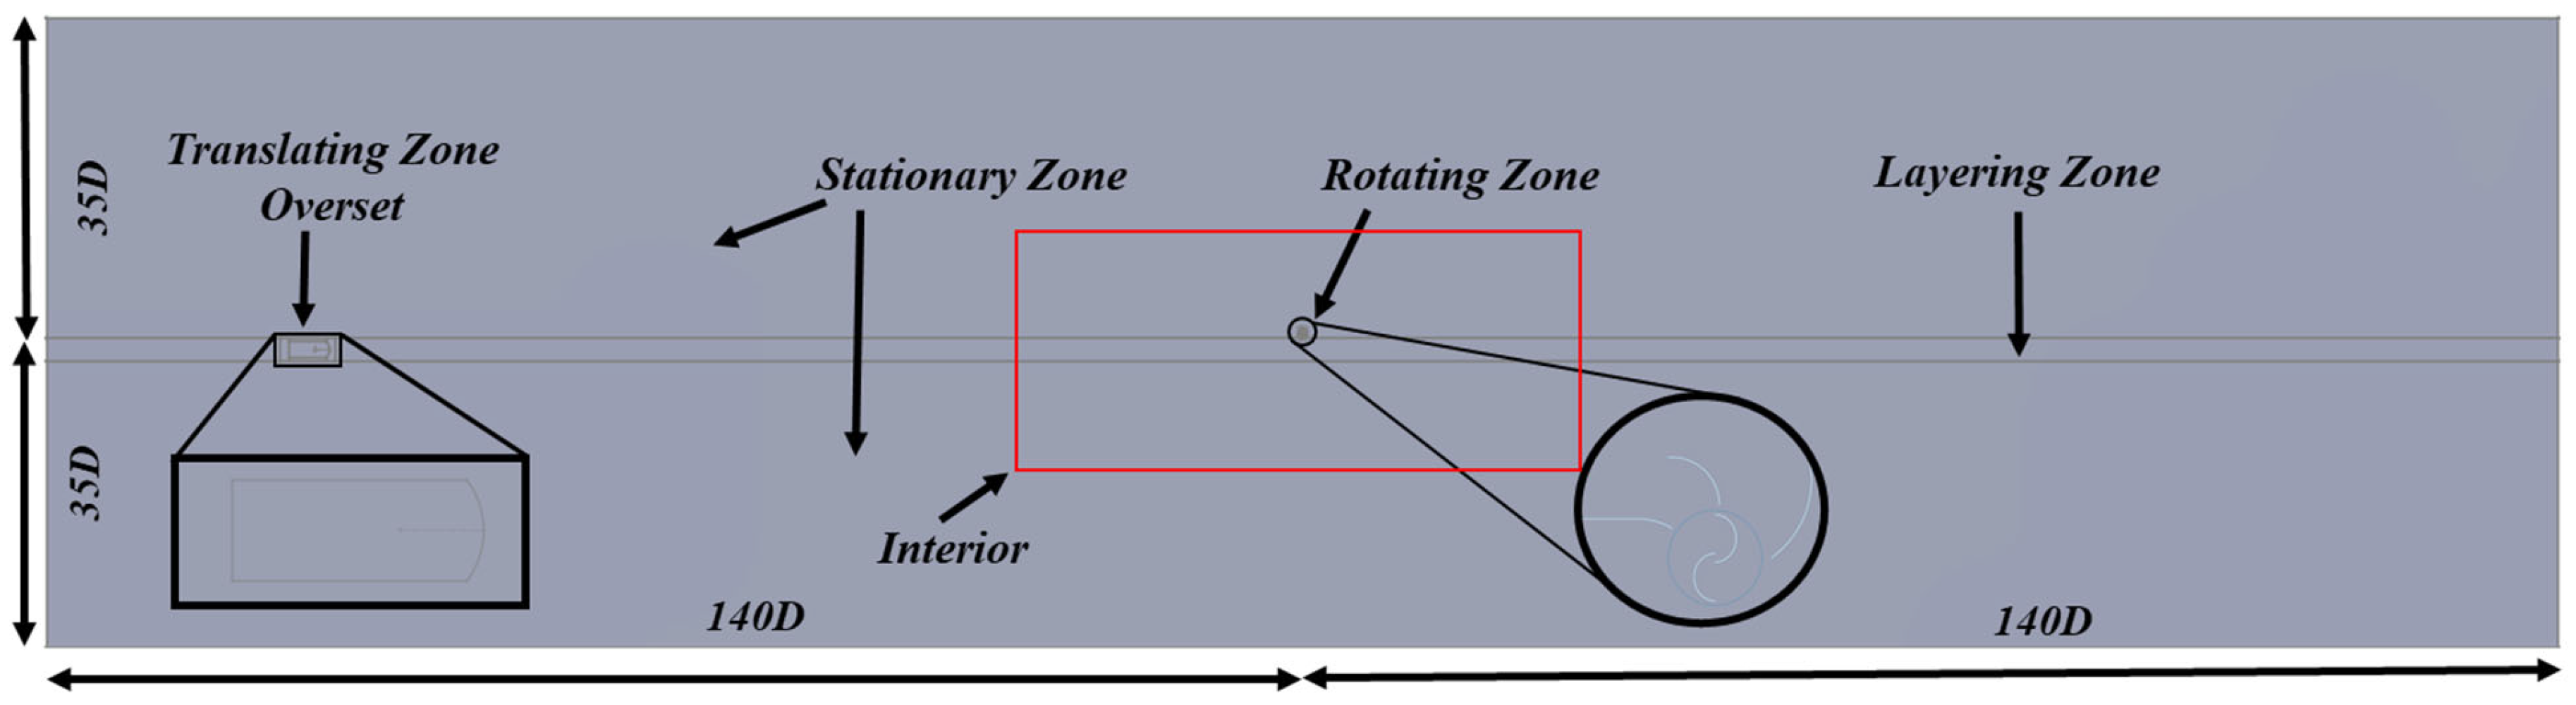
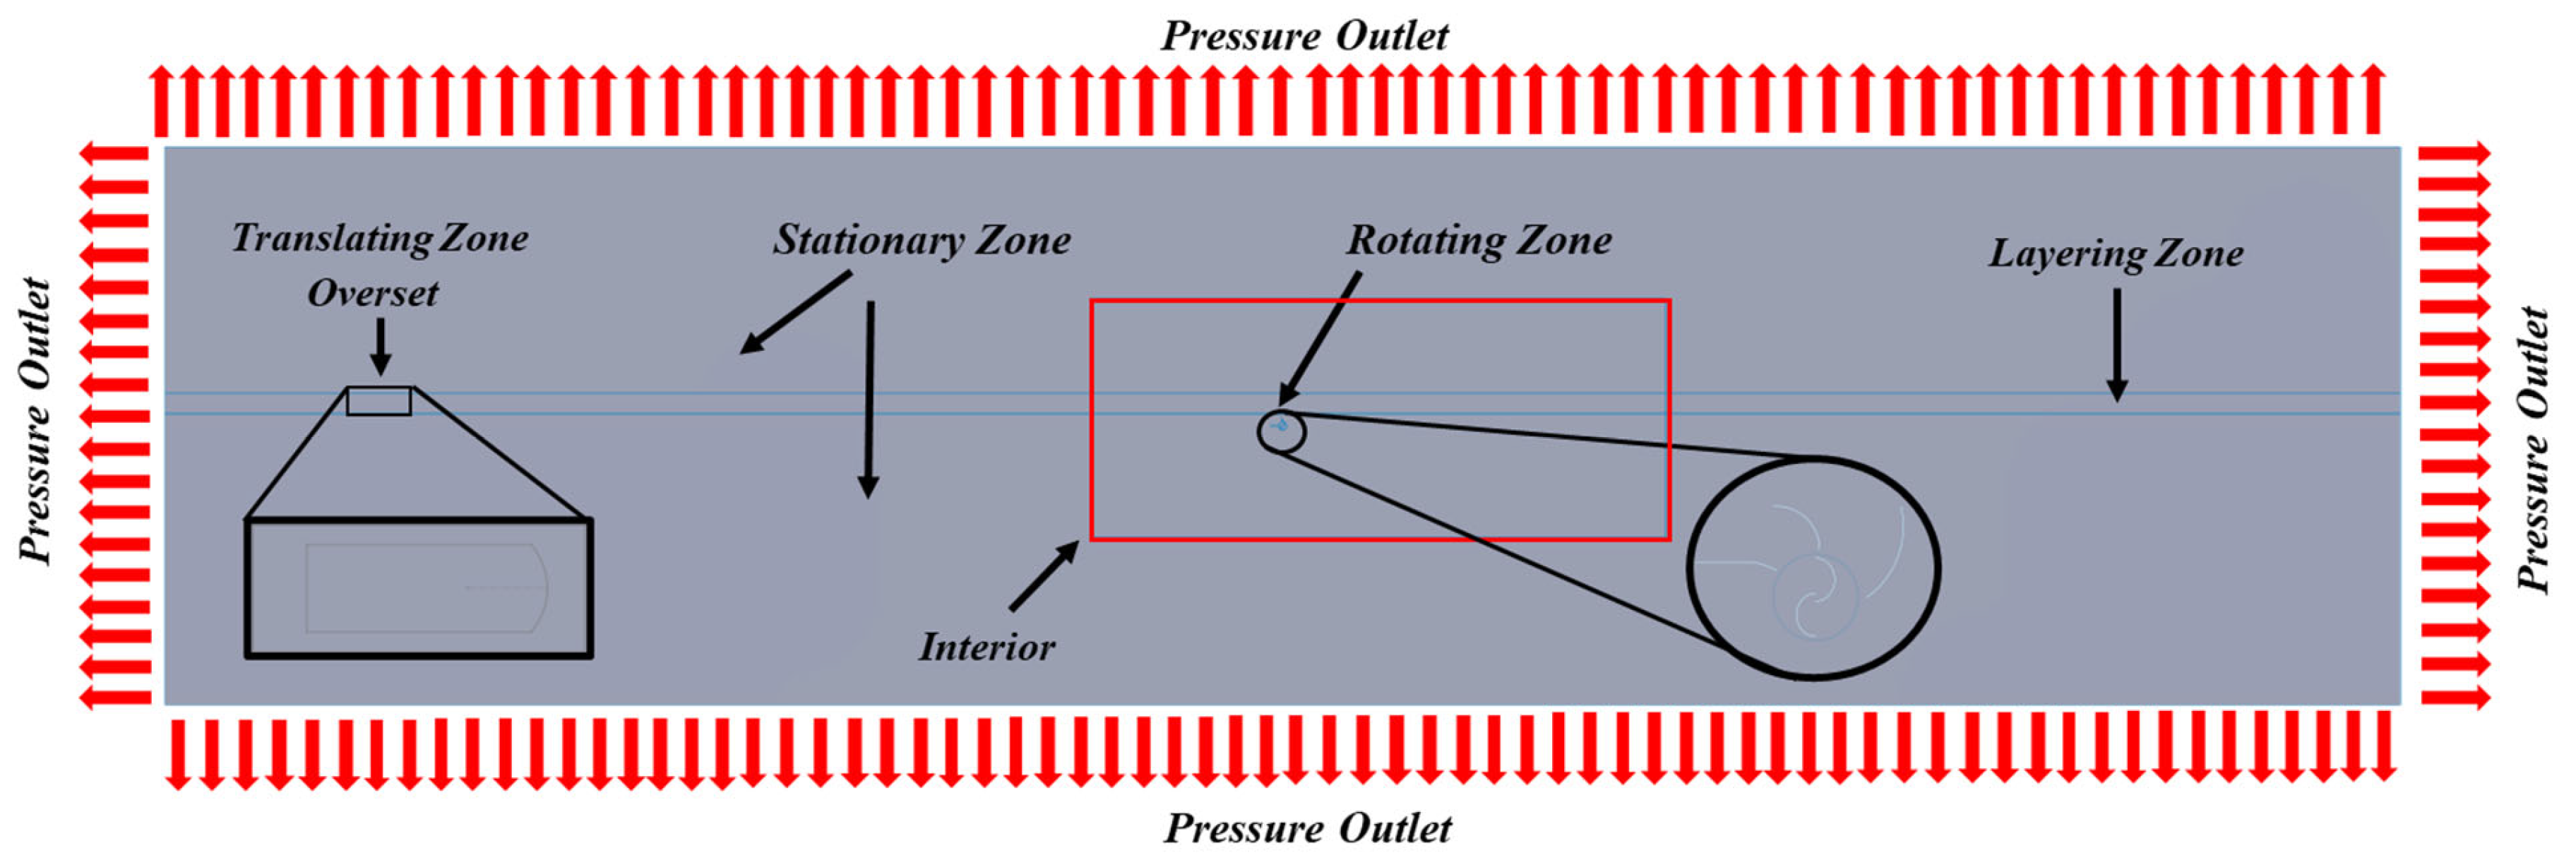
To account for the complex interactions between the different zones, the simulation employed the overset and sliding mesh methods. The overset method allowed for the combination of the layering and translating zones, enabling the integration of the different mesh regions.
The rotating zone had a mesh motion model with an angular velocity of 6.6767 rad/s. Similarly, the translating zone utilized a mesh motion setup with a translational velocity of 32 m/s. The car and the turbine blades were both set up as moving walls, with the car in translational motion and the blades in rotational motion.
The pressure, momentum, turbulent kinetic energy, and specific dissipation rate were discretized using a second-order upwind scheme, while the transient formulation employed a second-order implicit method. The residual convergence criteria were set to 1 × 10⁻⁶.
The maximum time step was calculated as 1.953125 × 10⁻³ s, allowing us to accurately track the car’s position when its front end reached −2 m from the center of the turbine. This is the point where the turbine produced its peak torque; however, a finer time step of 1.25 × 10⁻³ s was selected to enhance stability and accuracy. The model ran for a total duration of 7 s, with up to 30 iterations per time step to better capture the flow dynamics.
To ensure convergence of the transient simulation, several steps were taken. First, the mesh quality was assessed and refined through a grid convergence study. As shown in
Table 5, energy output varied less than 2% across increasingly refined meshes, indicating mesh independence. Second, a conservative time step of 1.25 milliseconds was selected based on the Courant–Friedrichs–Lewy (CFL) condition to capture the fast-changing transient effects induced by passing vehicles. Third, each time step was solved using 30 inner iterations, and residual convergence criteria were set to
for pressure, momentum, turbulent kinetic energy, and specific dissipation rate. This ensured that numerical solutions at each time were well-resolved before proceeding to the next step. Finally, temporal accuracy was maintained using a second-order implicit transient formulation. Together, these practices confirm the numerical stability and convergence of the sliding mesh simulation throughout the full vehicle–turbine interaction period.
6. Results
The performance of each VAWT configuration is assessed based on the total energy output (
E) generated during a single vehicle pass. This energy is computed by integrating the instantaneous power (
) over time, as described in Equations (1) and (2), using the trapezoidal rule. Here,
is calculated as the product of instantaneous torque (
)and angular velocity (
), evaluated at each time step. The indices
i and
i + 1 refer to consecutive time instances, and n denotes the total number of steps in the simulation. A similar approach was adopted by Matias et al. [
23], where energy was calculated by summing the area under the power–time curve, incorporating both positive and negative values. This method allows for a realistic representation of transient aerodynamic effects, such as periods of reverse torque, which are inherent to VAWT operation in vehicle-induced flow environments [
23].
Various guide vane configurations have been investigated, consistently revealing that three-guide designs produced higher energy generation from the winds created by passing vehicles.
Table 7 presents the numerical testing conducted on the highway VAWT. A total of nine two-guide models and six three-guide models, along with the non-guided configuration, were assessed for a single-passenger vehicle (car) passing. Across all scenarios, a consistent trend emerged: the three-guide VAWT designs outperformed the two-guide designs, which, in turn, surpassed the non-guided setup. Additionally, Model 1-Bus HW and Model 14-Bus HW, as depicted in
Table 8, showcased significant energy generation improvements even for single bigger vehicles passing when using the same three-guide design as in Model 14 with a car.
Table 9 offers a side-by-side comparison between the current study and previous work on vertical axis wind turbines, all for a single-passenger vehicle on one-way highway flow conditions. Prior research applied 2D CFD simulations with sliding mesh techniques to evaluate different turbine types of similar size and under similar vehicle speeds.
These three turbines—Banki, Darrieus, and Savonius—were selected due to their contrasting aerodynamic behaviors and common use in low-speed or confined environments. The Banki turbine, derived from crossflow designs, uses densely packed blades and is valued for its compact size and stable torque. The Darrieus model performs well at higher tip speed ratios but is limited by its poor self-starting behavior. The Savonius turbine, by contrast, is widely known for its excellent self-starting ability and reliability in unstable wind, making it ideal for roadside and urban settings. Comparing them under identical highway-induced wind conditions allowed us to assess their real-world energy harvesting potential.
In the present study, the Elliptical turbine with three guide vanes produced the highest energy output at 127.26 J—an increase of over 240% compared to the baseline Elliptical setup without guide vanes. This result highlights the impact of guide vanes in improving performance. On the other hand, the Savonius and Banki turbines yielded significantly lower energy capture, with the Darrieus model producing 83% less energy.
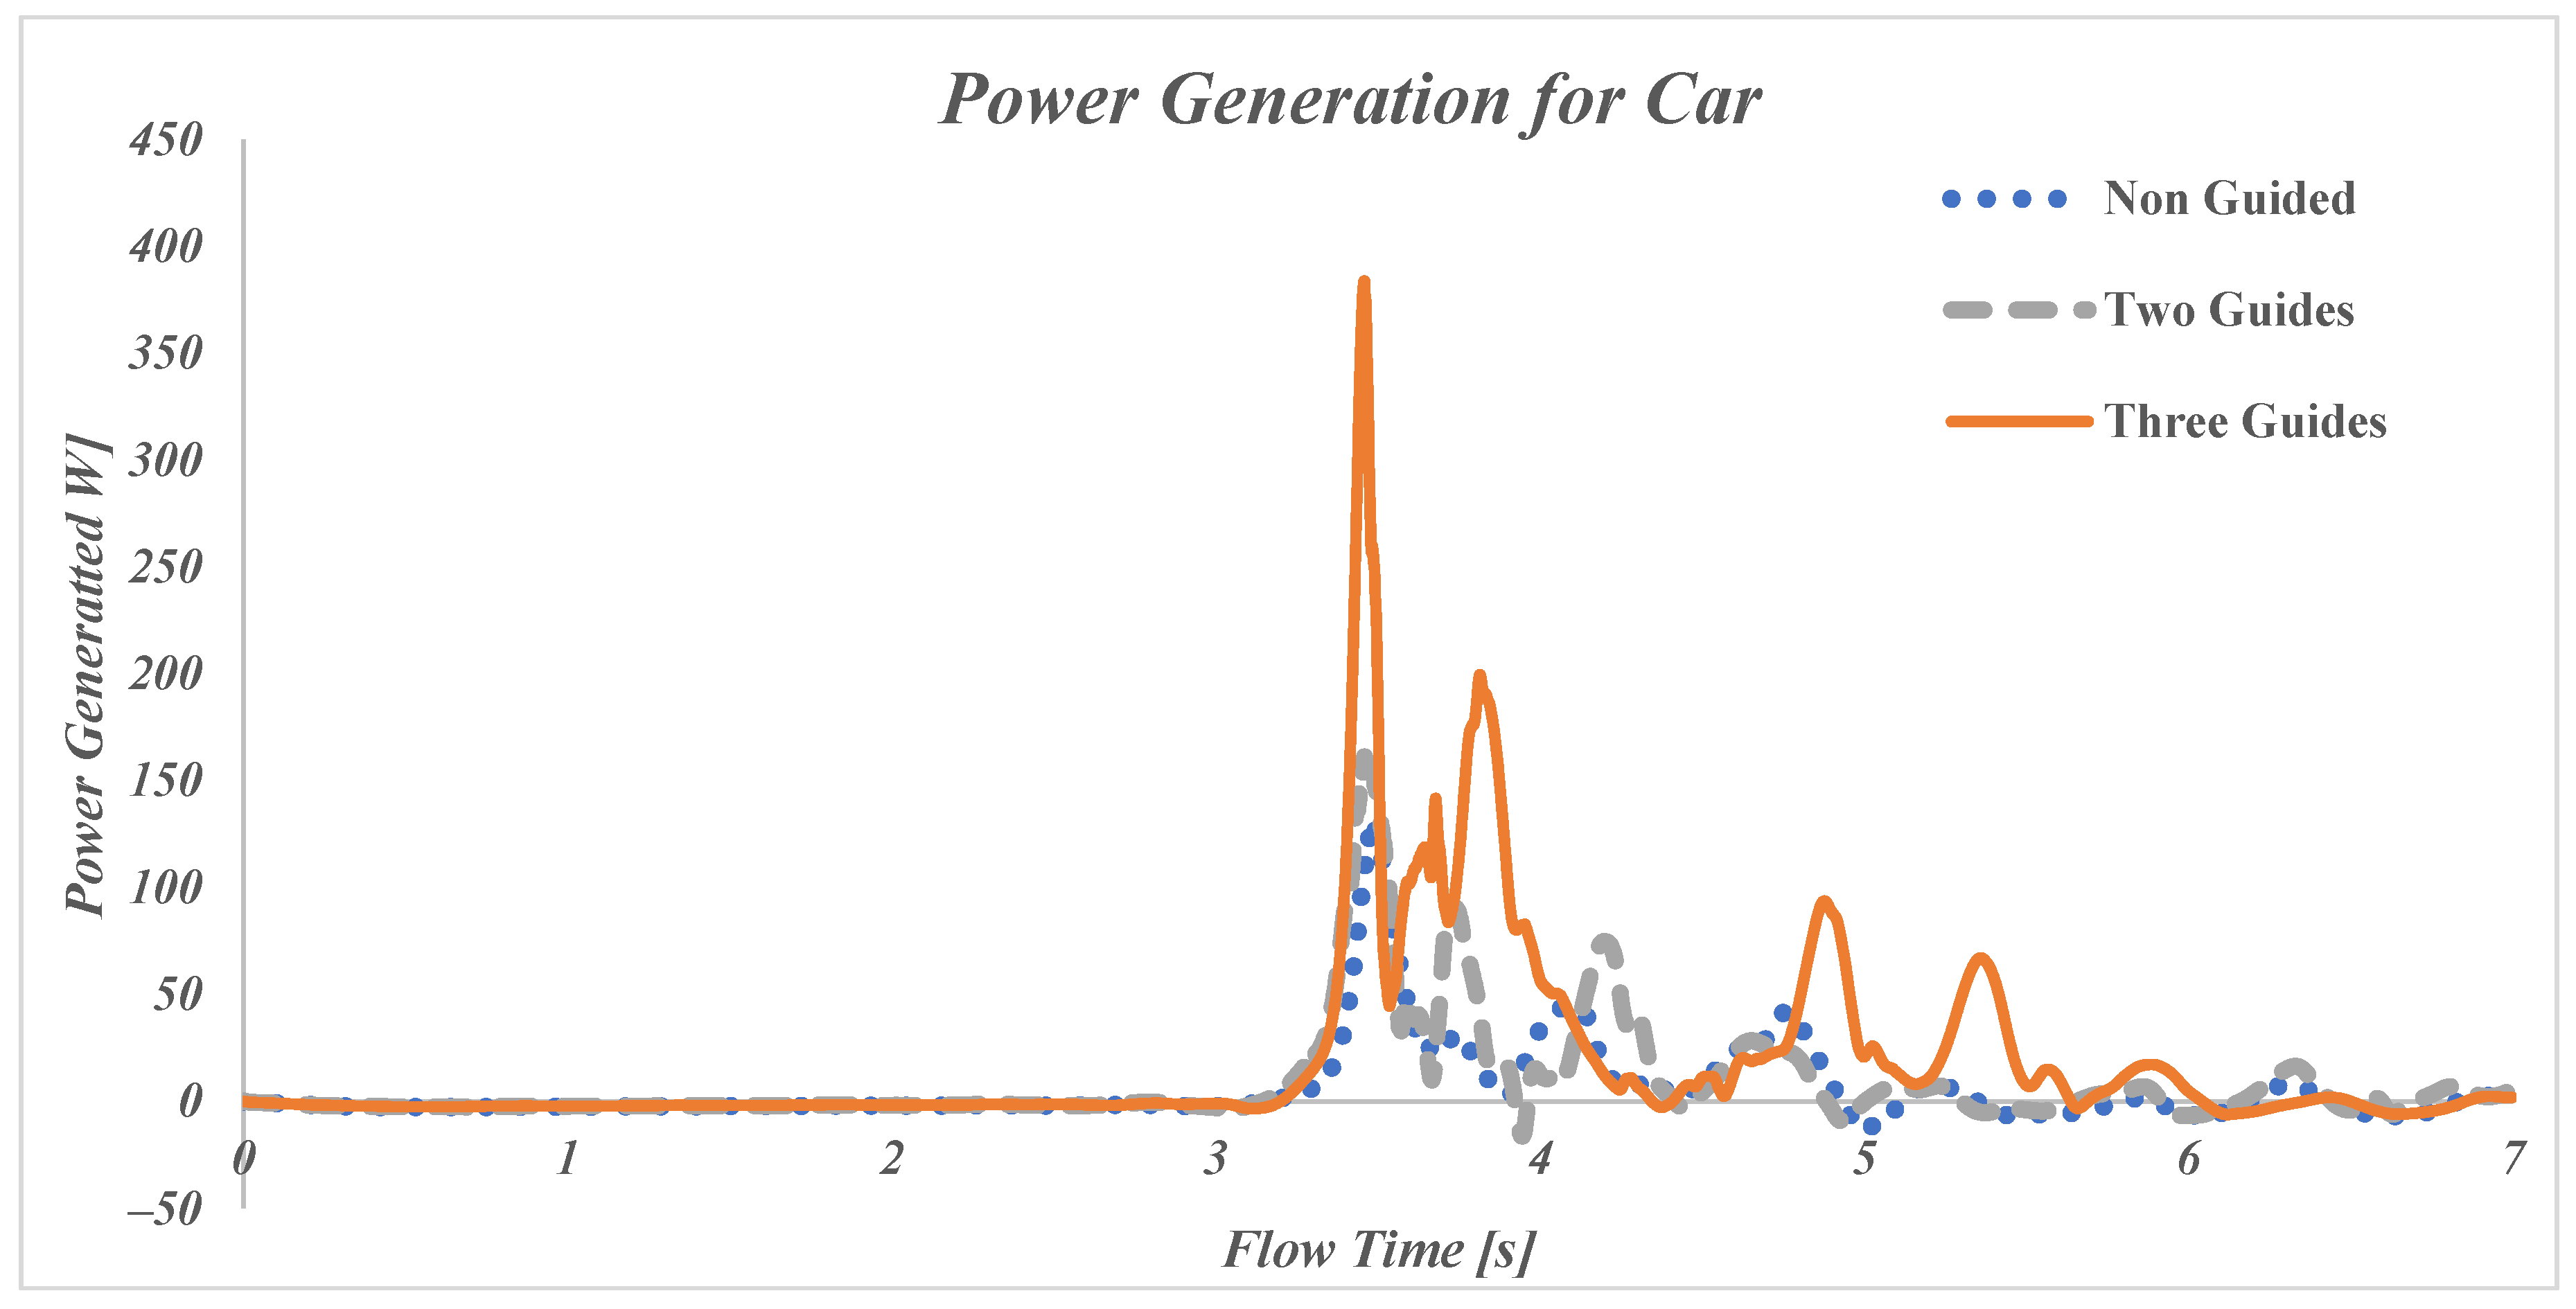
The vehicle is pushing air in front and to the side of it, and when the wind reaches the turbine, there is a power generation peak. In the first few seconds (0–3 s), the power output is minimal for all three setups. This is expected because the vehicle has not reached the turbine. Around the 3.35 s mark, all configurations experience a noticeable increase in power.
After the initial peak, between 4 and 7 s, there are multiple subsequent peaks, but they decay as the vehicle moves past the turbine. The power output declines and fluctuates for all configurations. These fluctuations are caused by the Von-Karman vortices formed behind moving vehicles.
Out of all configurations for a car as the vehicle, the turbine with three guide vanes performs the best, achieving a peak power output of roughly 384 W (
Figure 8). The setup with two guide vanes shows a smaller initial peak, similar to the non-guided configuration, but the following peaks are larger and thus generate higher power overall compared to the non-guide turbine. The turbine without guide vanes generates the least power, which indicates that it struggles to efficiently capture and utilize the airflow created by the vehicle motion, specifically after it passes the turbine.
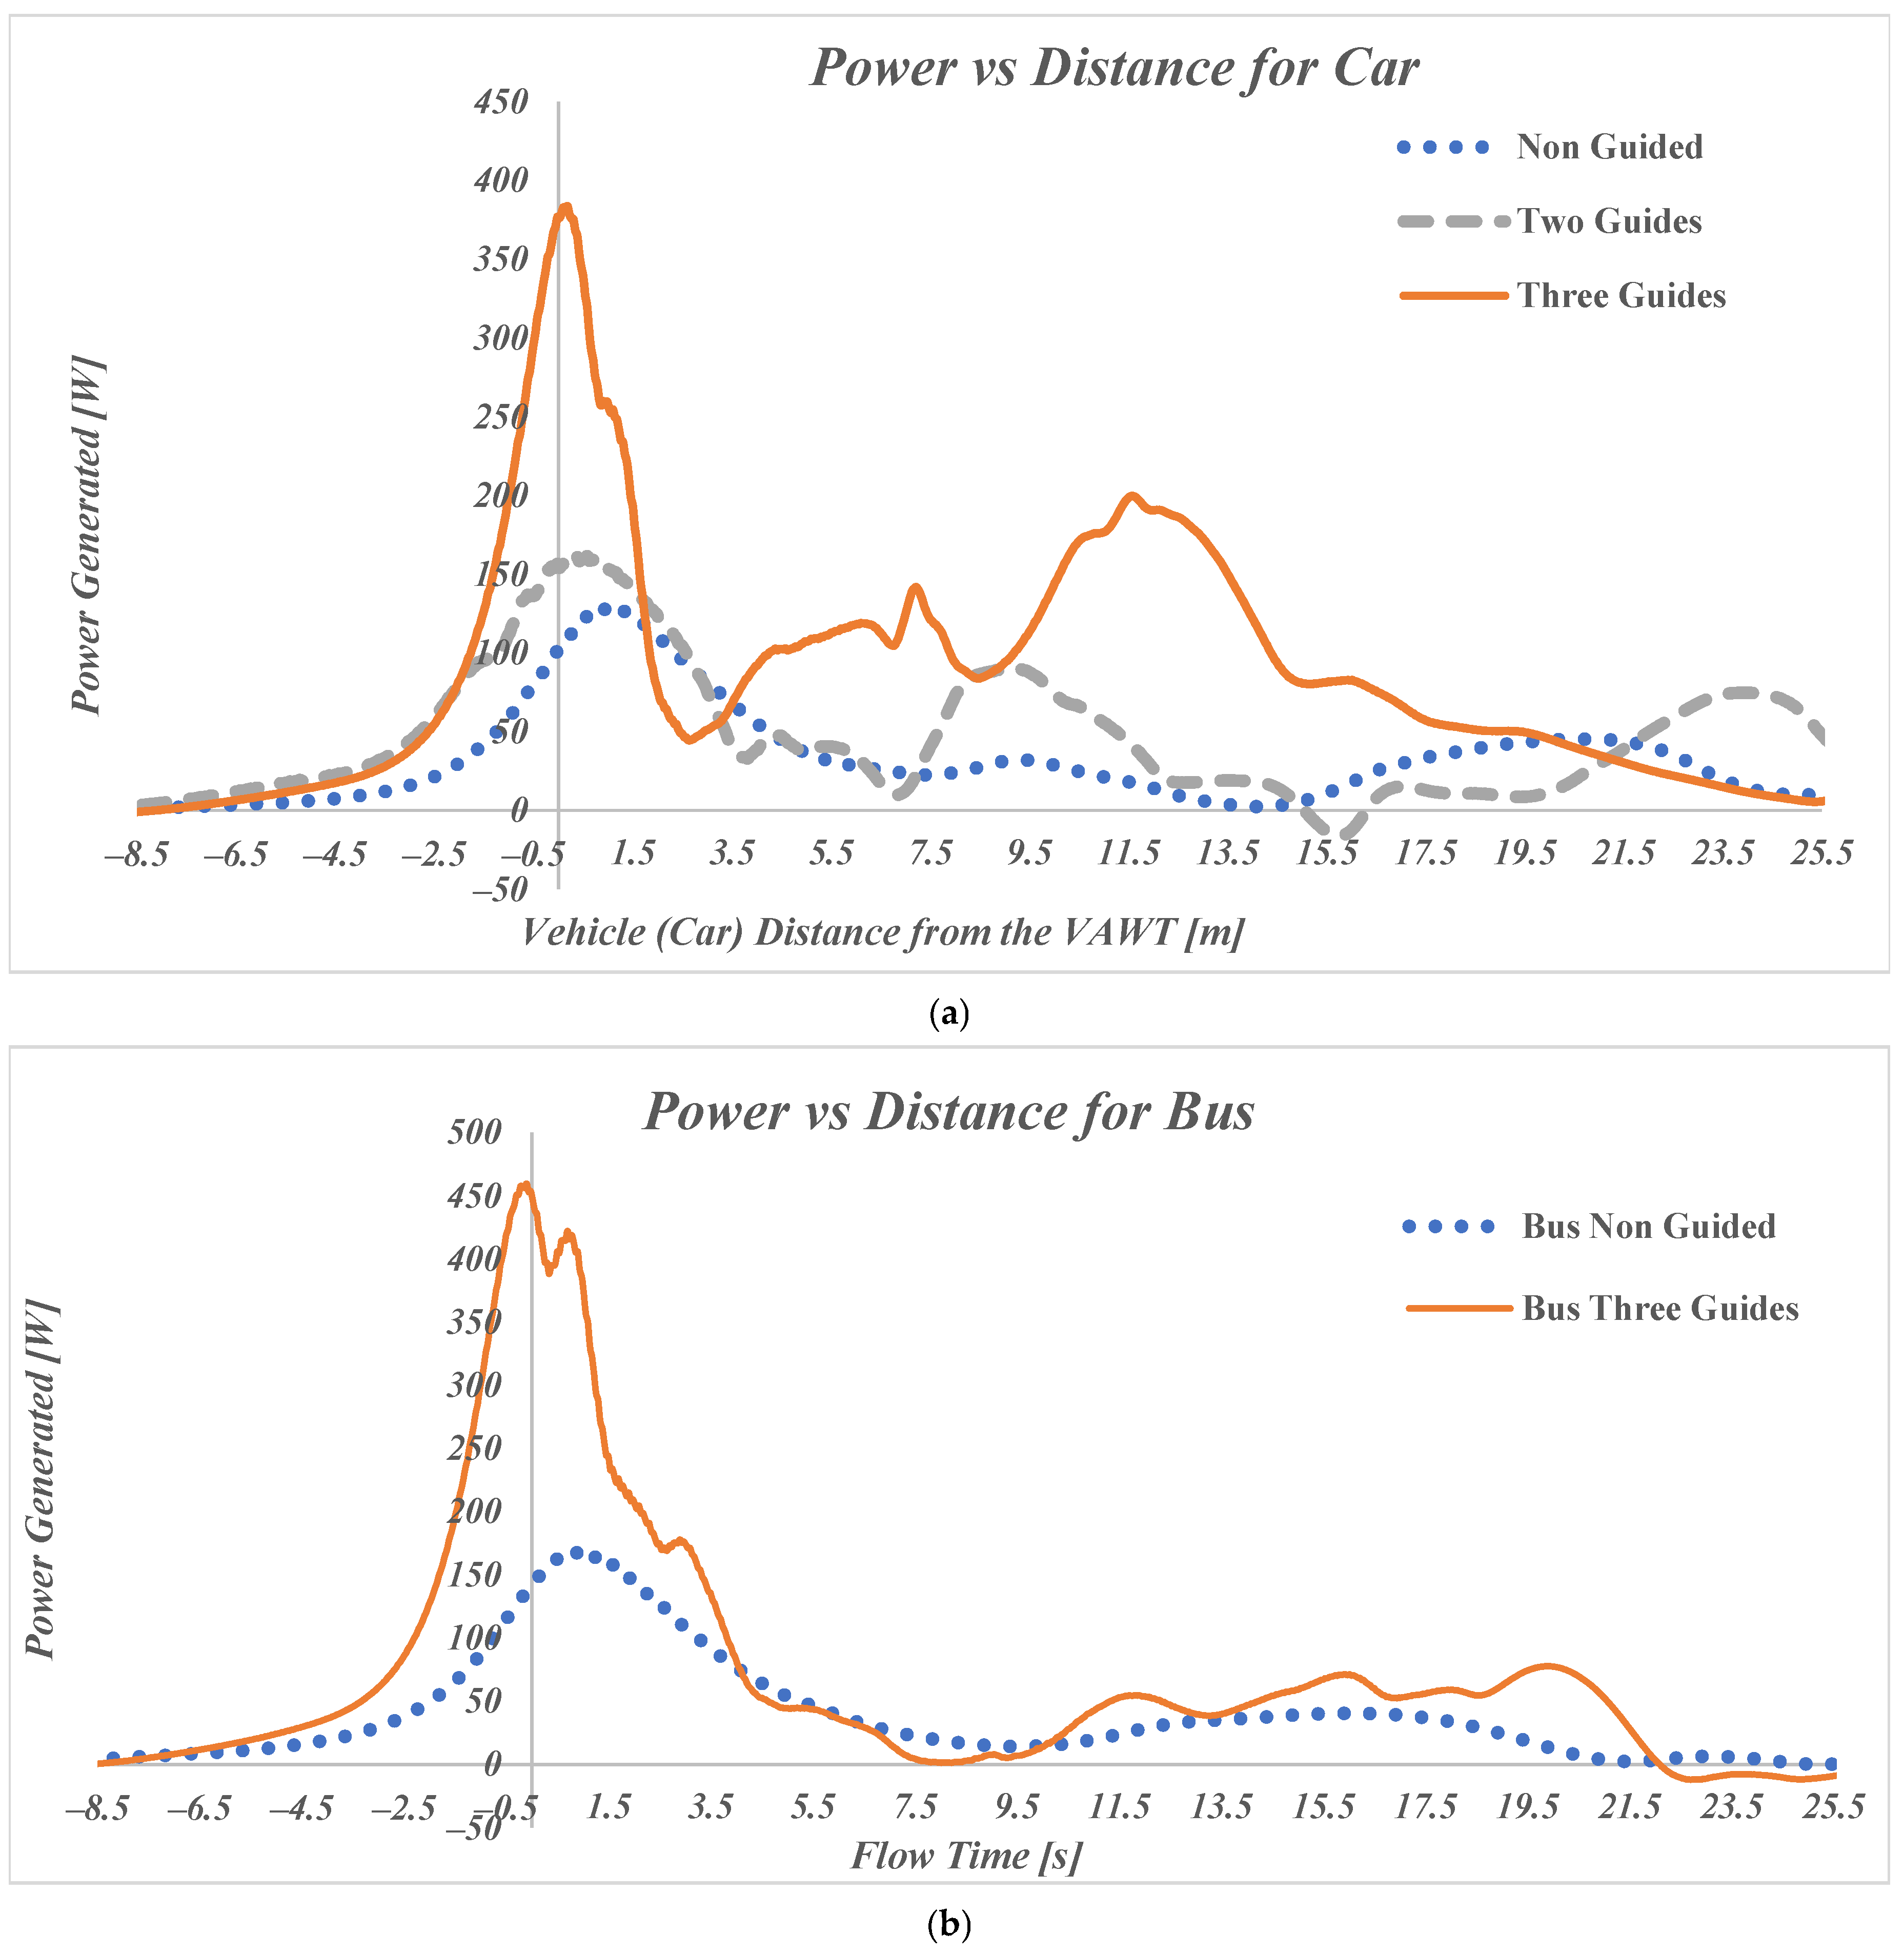
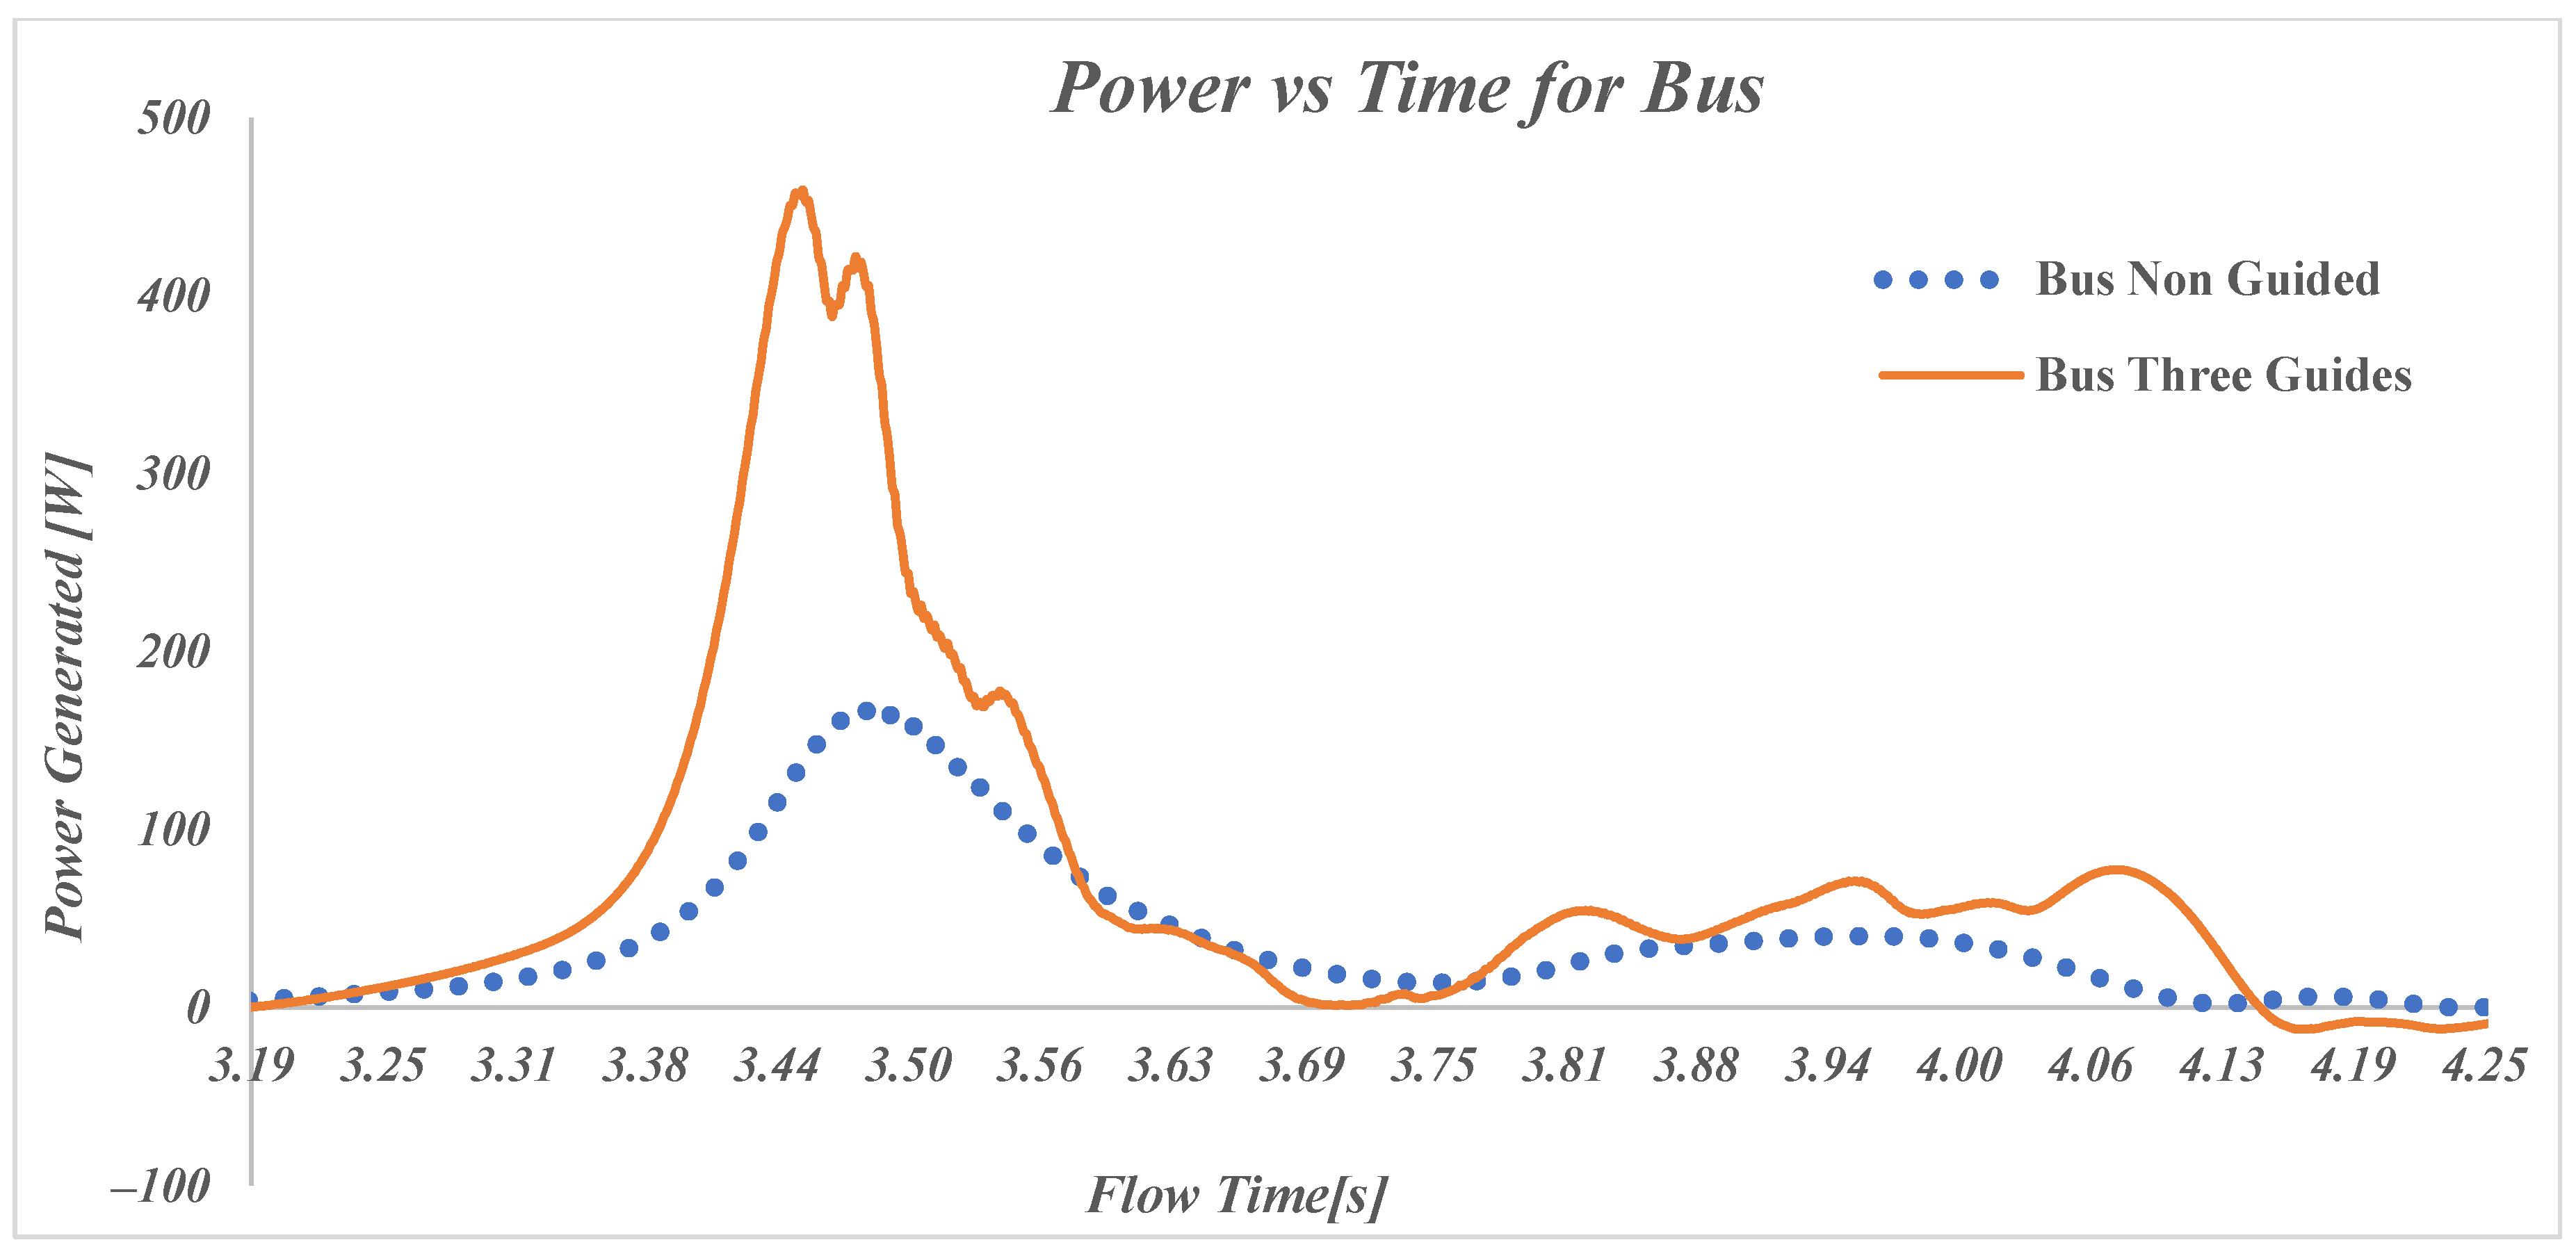
Figure 9 shows the power generated by a VAWT when a single bus is driving past it, comparing two setups: one without guide vanes (“Bus Non-Guide”, “Model 1-Bus HW”) and one with three guide vanes (“Bus Three Guide”, “Model 14-Bus HW”).
The results are similar to the car results in
Figure 8, with an increase in the peak power generation to nearly 460 W. This is significantly higher than the setup without guide vanes, which struggles to make full use of the airflow. The three guide vanes clearly help direct the airflow better, leading to improved performance. After the initial peak, from 4 to 7 s, the power output drops for both guided and non-guided setups, with both starting to fluctuate, while the three-guide setup shows improved power generation.
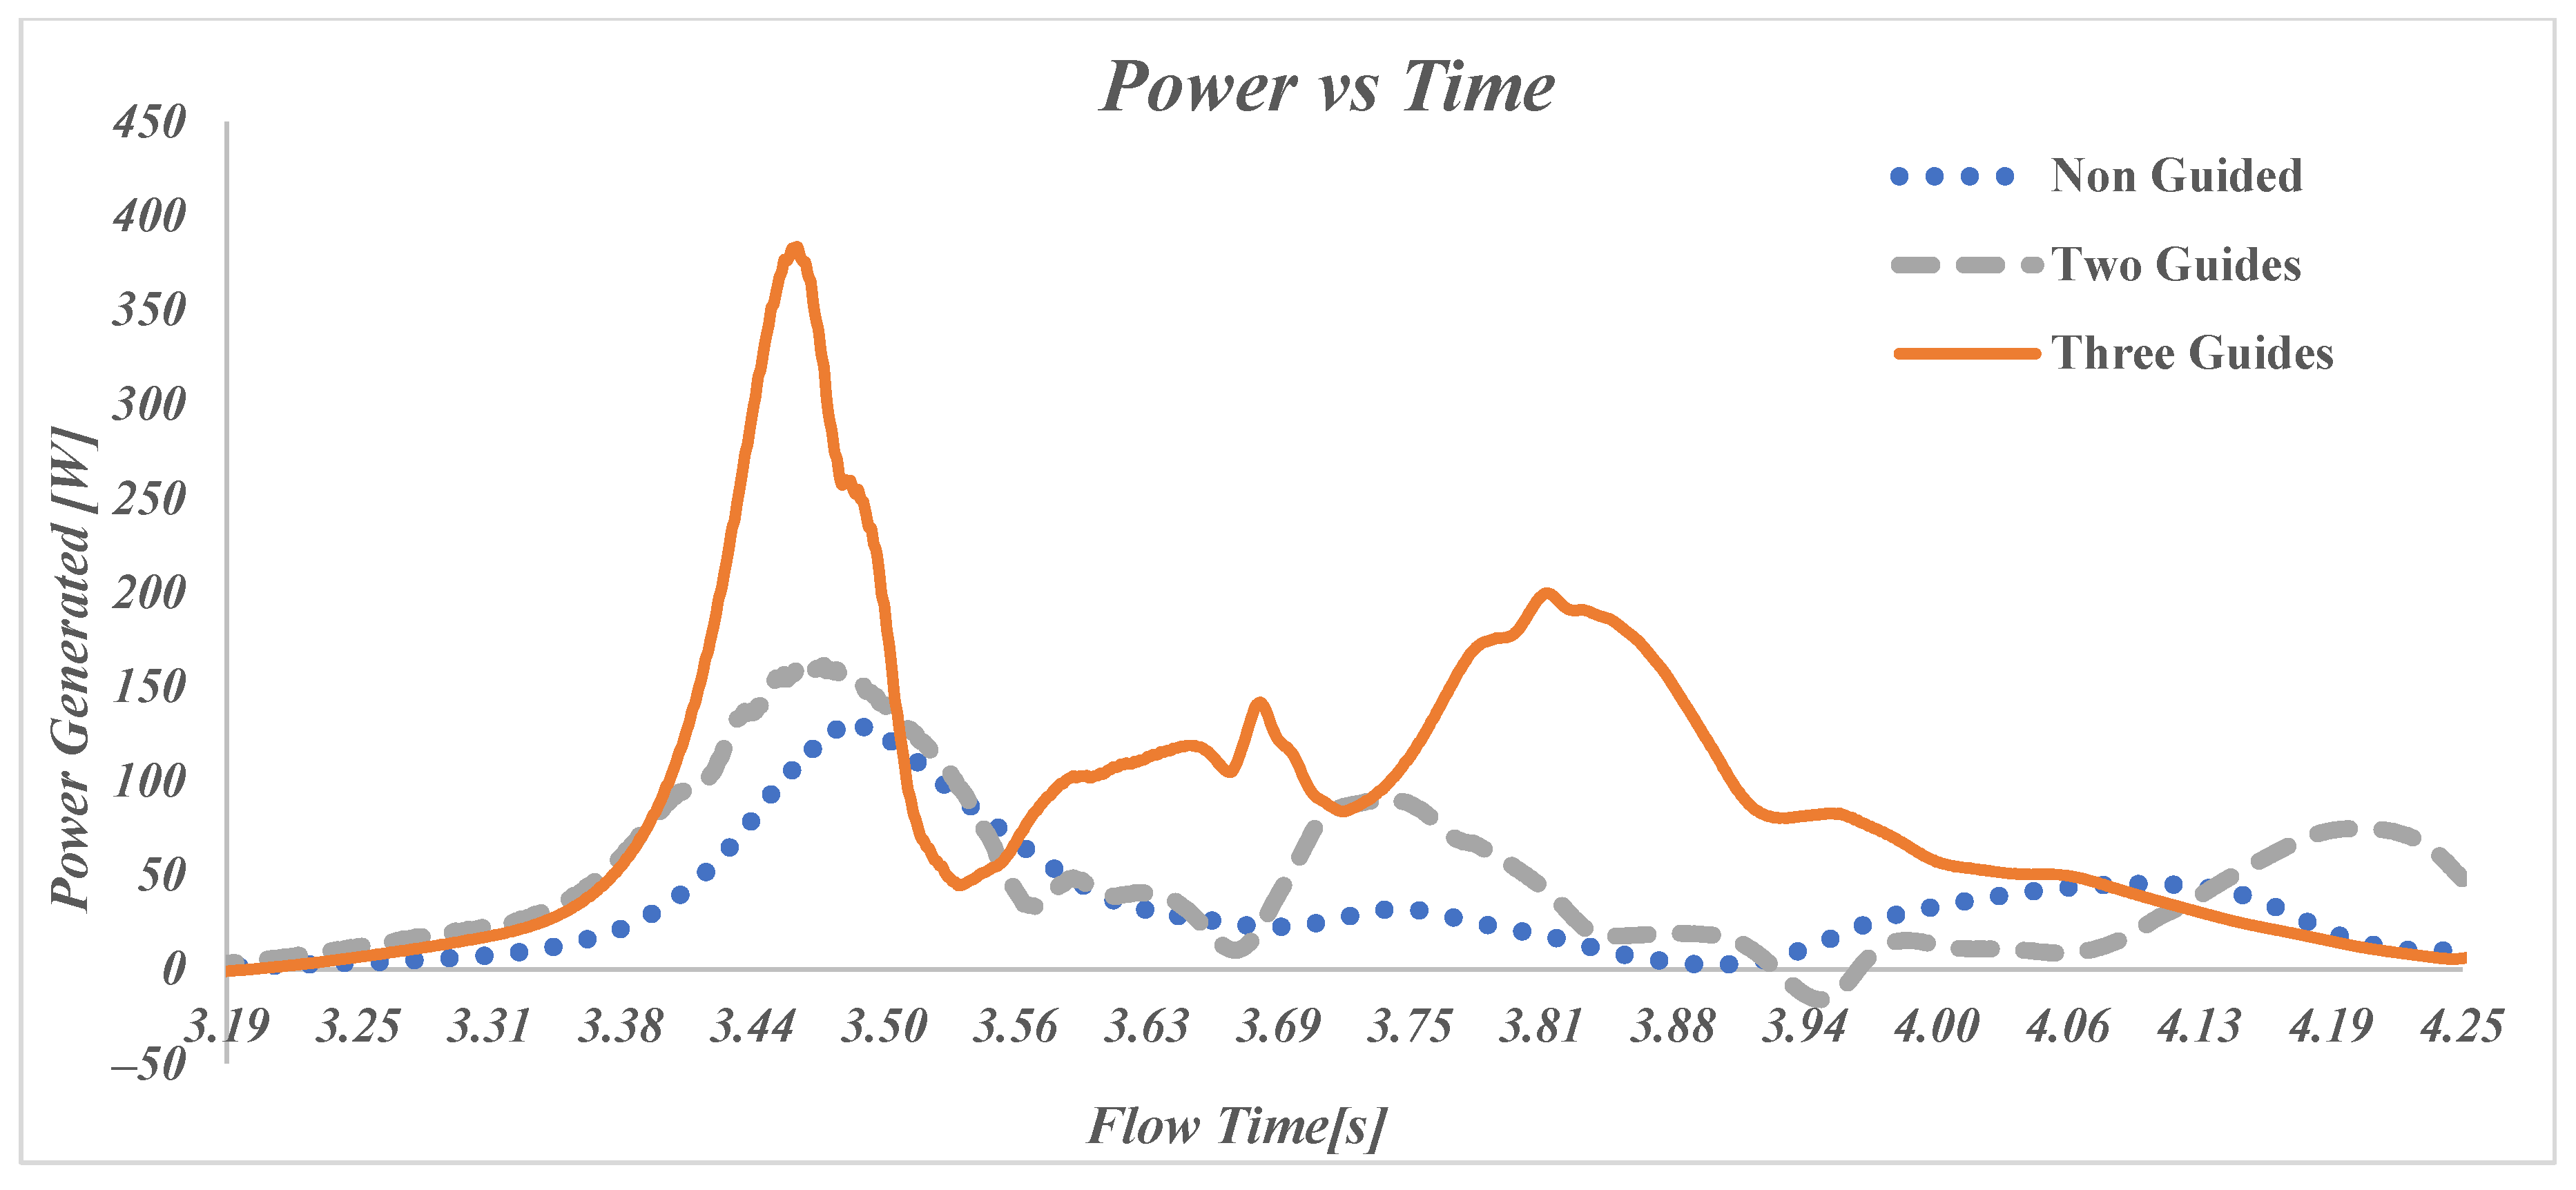
Figure 10 and
Figure 11 show a detail of the relationship between the power output of the VAWT and time and distance from the vehicle’s front edge to the turbine, respectively, for a car, covering a range from −8.5 m to 25.5 m. These two plots capture the car’s approach, passage, and movement away from the turbine. The data are presented for the three different turbine configurations: no guide (“Model 1 HW”) (dotted blue line), two guides (“Model 9 HW”) (gray dashed line), and three guides (“Model 14 HW”) (orange line).
In the non-guided case, where no additional guiding structures are used around the turbine, the power generated is low. As the car approaches the turbine (around −2 m, or 3.4 s), the power generation starts to grow, reaching a modest peak of around 130 W when the front of the car is 0.98 m past the turbine center. After the car passes the turbine, the power generation drops rapidly and stays relatively low as the distance increases. This configuration highlights the basic performance of the turbine without any external modifications to guide or direct airflow.
The two-guide setup shows a wider and slightly higher peak in power generation, reaching around 160 W at an earlier position of the car, around 0.58 m. This configuration allows the turbine to capture more wind energy from the car as it approaches and passes it. The additional guides help channel the air more effectively into the turbine, increasing its ability to generate power. As the car moves away, the power generation drops like for the non-guided case, indicating that the improved effectiveness is partially due to the first guide generating a wider initial peak and to the secondary guide increasing the size of the following peaks.
The three-guide setup offers the most substantial performance boost. In this configuration, power generation peaks at over 384 W as the car approaches the turbine indicating an improved airflow into the turbine generated by the first two guides. The peak moves even further in front of the turbine to 0.18 m, suggesting that the guides are able to direct flow to the turbine earlier and thus not waste the available wind energy. The power output remains high even after the car passes the turbine, demonstrating the effectiveness of the second and third guides in optimizing wind flow into the turbine. The guides reduce fluctuations in the airflow and direct it more consistently into the advancing blade, enabling the turbine to generate more power over a longer distance. The advancing blade is the concave blade that captures the air flow while the returning blade is the convex blade that is generating drag and thus reducing the turbine efficiency. This figure emphasizes the importance of aerodynamic modifications (guides) in improving the turbine’s performance.
Figure 12 is similar to
Figure 10 but focuses on the power generated by the VAWT as a bus passes by, over the same time range of 3.1875 s to 4.25 s. The graph compares two different configurations: Non-Guided (“Model 1-Bus HW”) and Three-Guides (“Model 14-Bus HW”). Similarly, as for the car models, the initial peak is much larger when using three guides (460 W for Bus versus 384 W for car) but it does not drop as sharply. This is due to the higher amount of wind that is generated by a larger vehicle. The max power generation also occurs earlier than for the car model at −0.1 m. For the immediate time after the bus passes, the turbine shows a lower improvement in power generation as in the case of the car suggesting that larger vehicles could benefit from a different optimal geometry of the guides. Even though the improvement in energy generation for the bus (79.7 Joules more than Non-Guided Bus,
Table 8) is lower than for the car (88 Joules more than Non-Guided Car,
Table 7), it is still significant and proves the effectiveness of the guides in the highway application.
To further understand the interaction between the guides and the turbine, velocity contours and vector fields are generated from the CFD models, providing a detailed picture of the airflow dynamics. The scope of the guide vanes is to direct the airflow toward the advancing blade while at the same time guiding the airflow away from the returning blade, making the turbine more efficient at capturing energy from the wind. By comparing cases with and without guide vanes, this study highlights their importance in improving the overall performance of the turbine system.
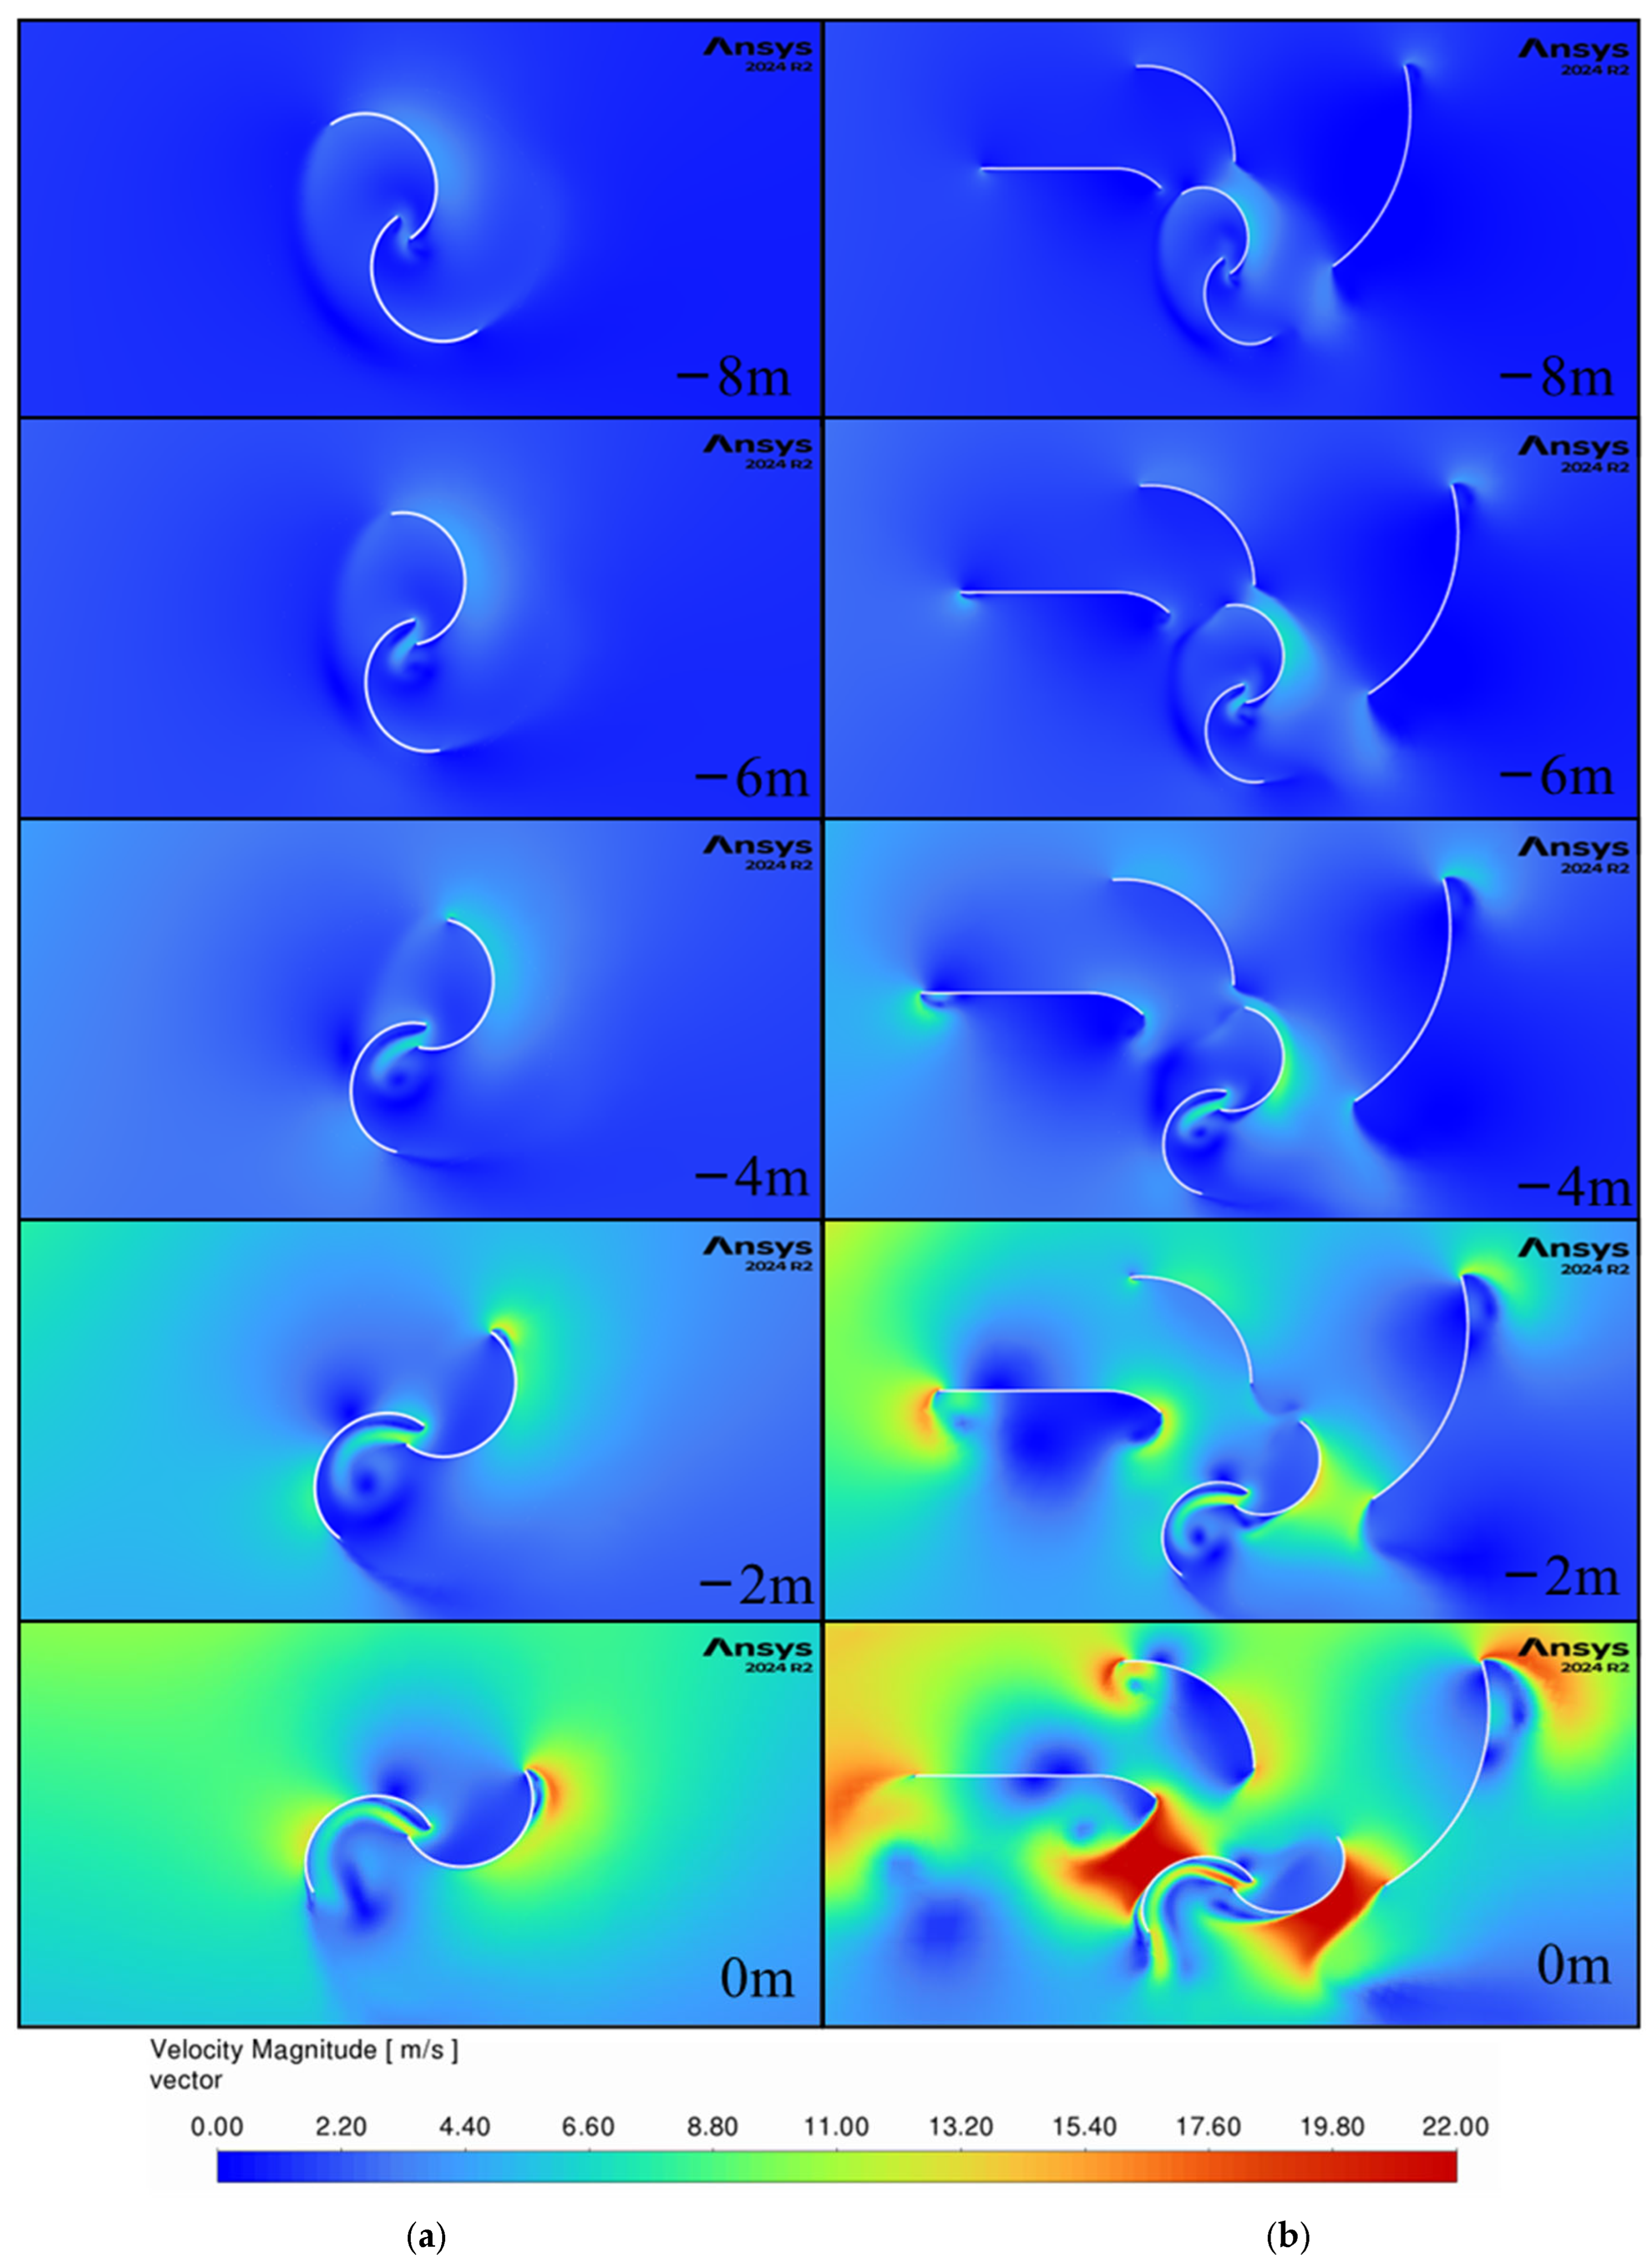
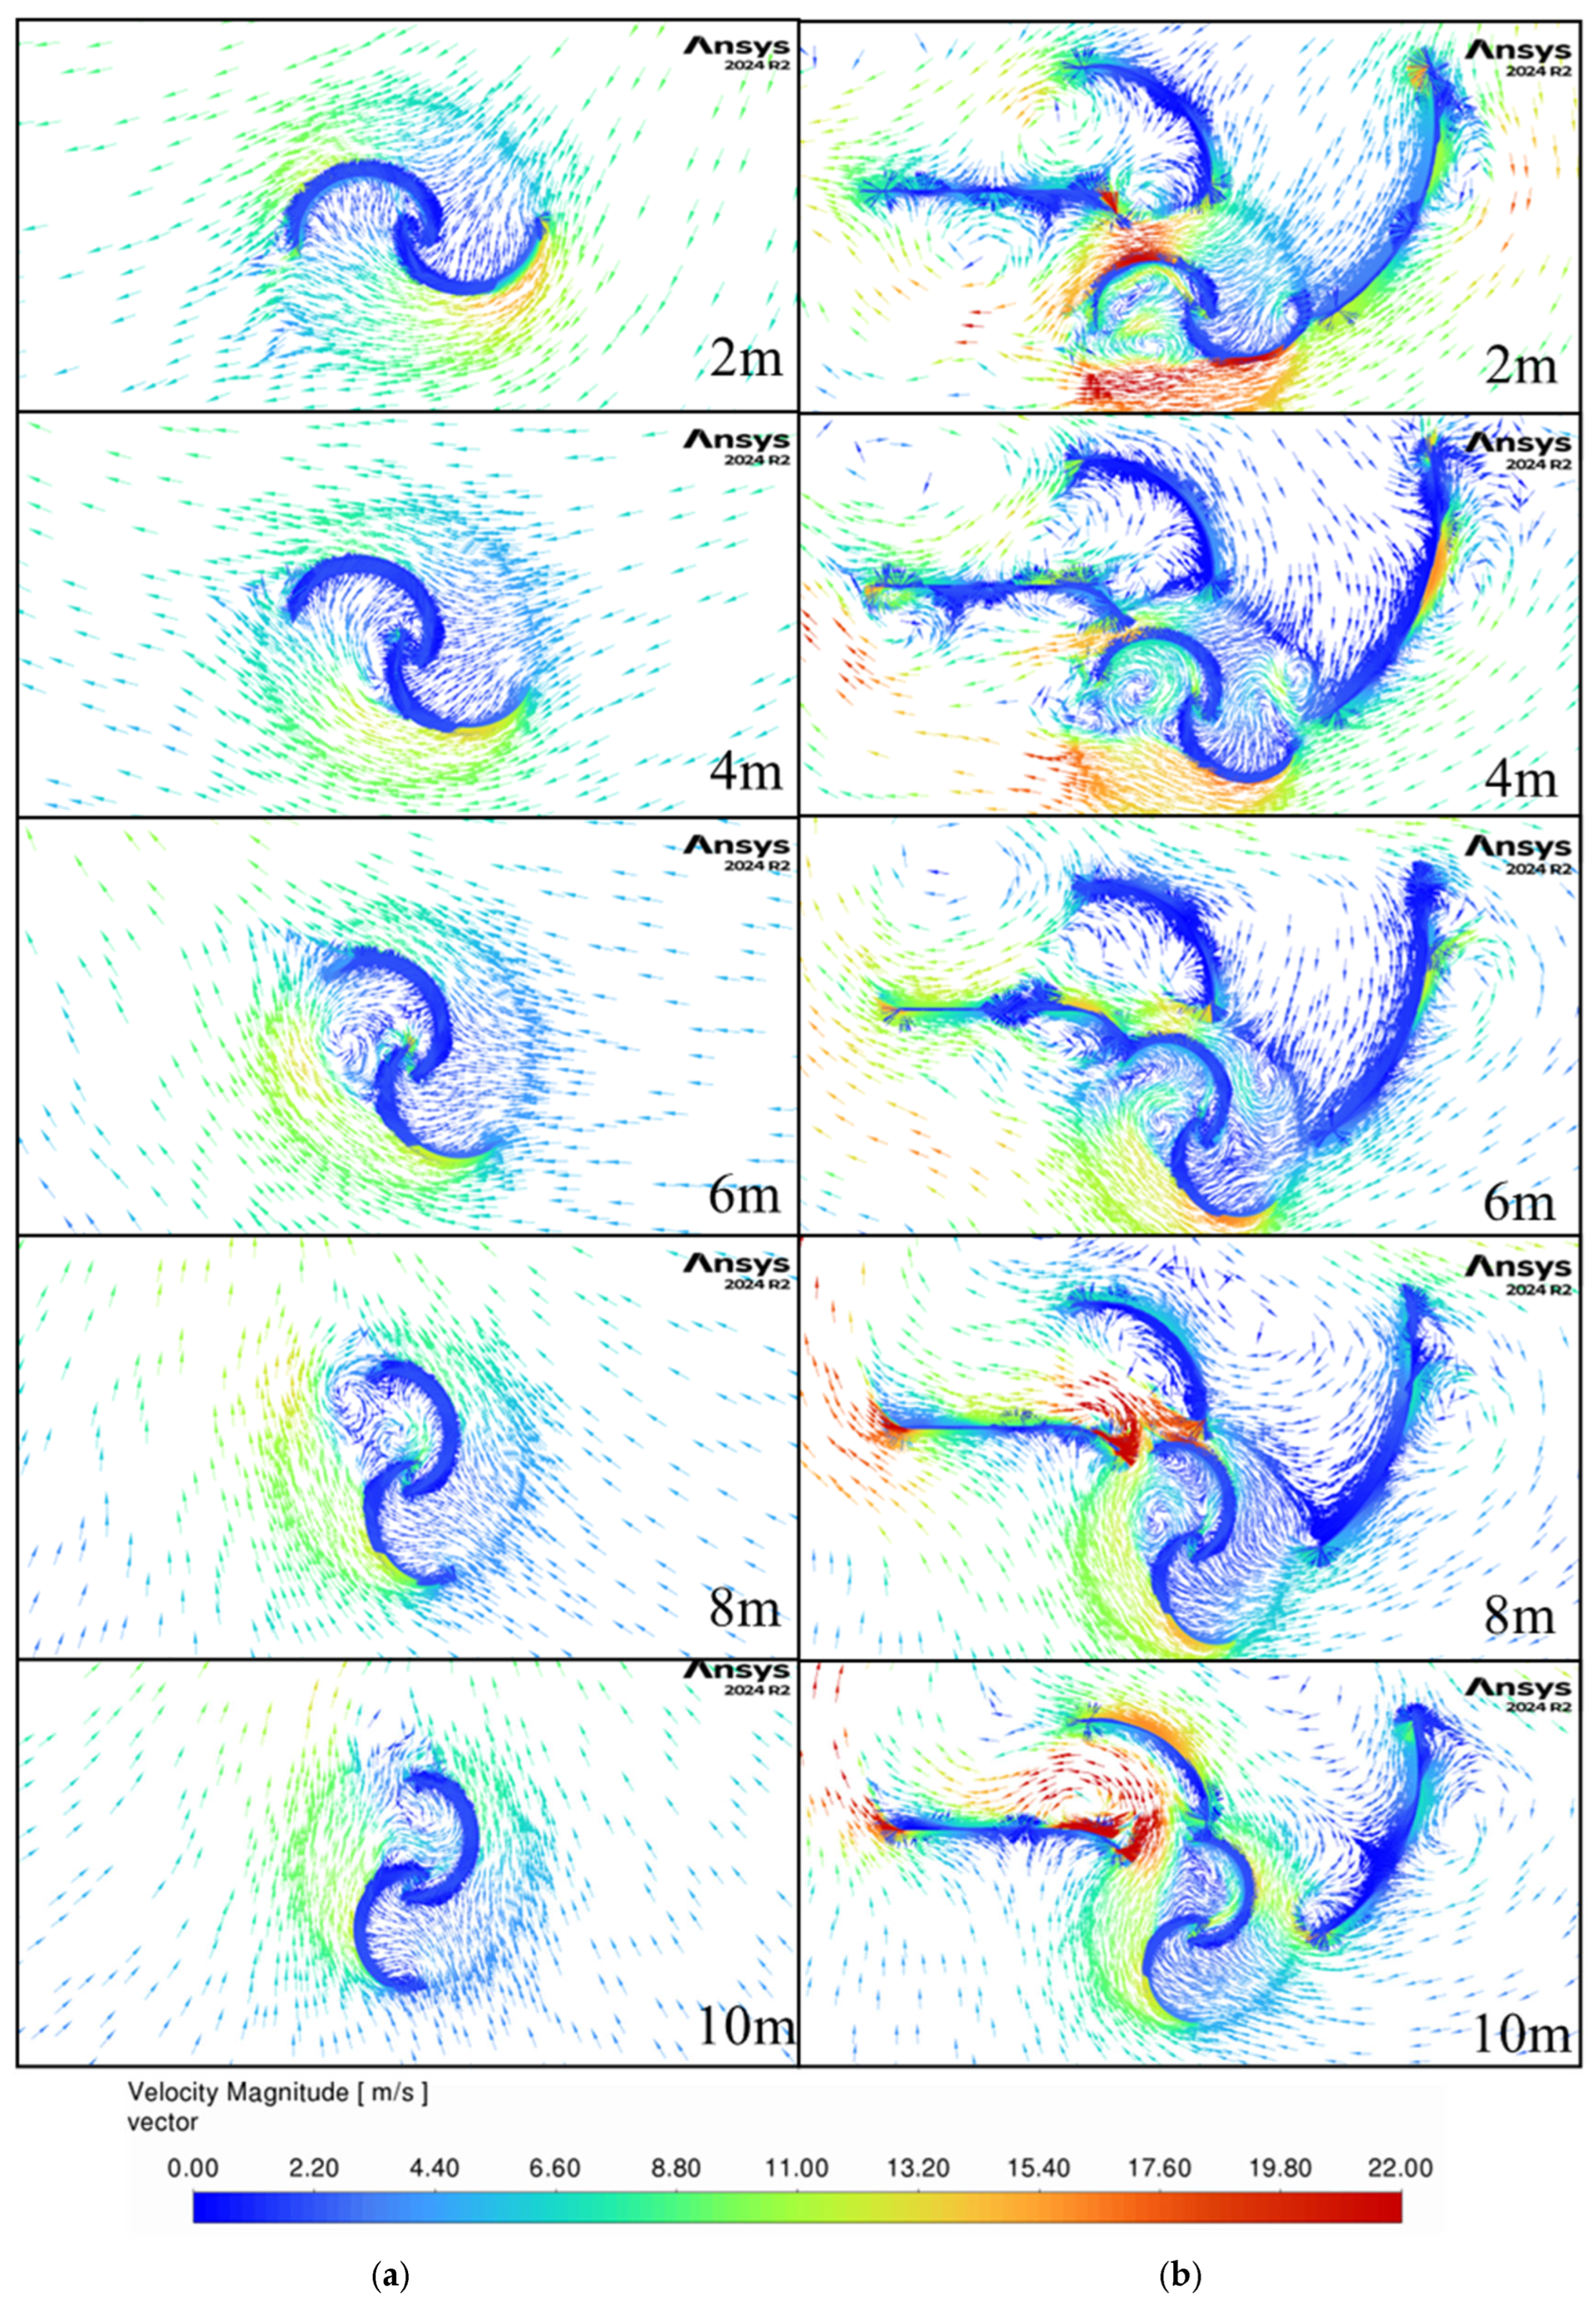
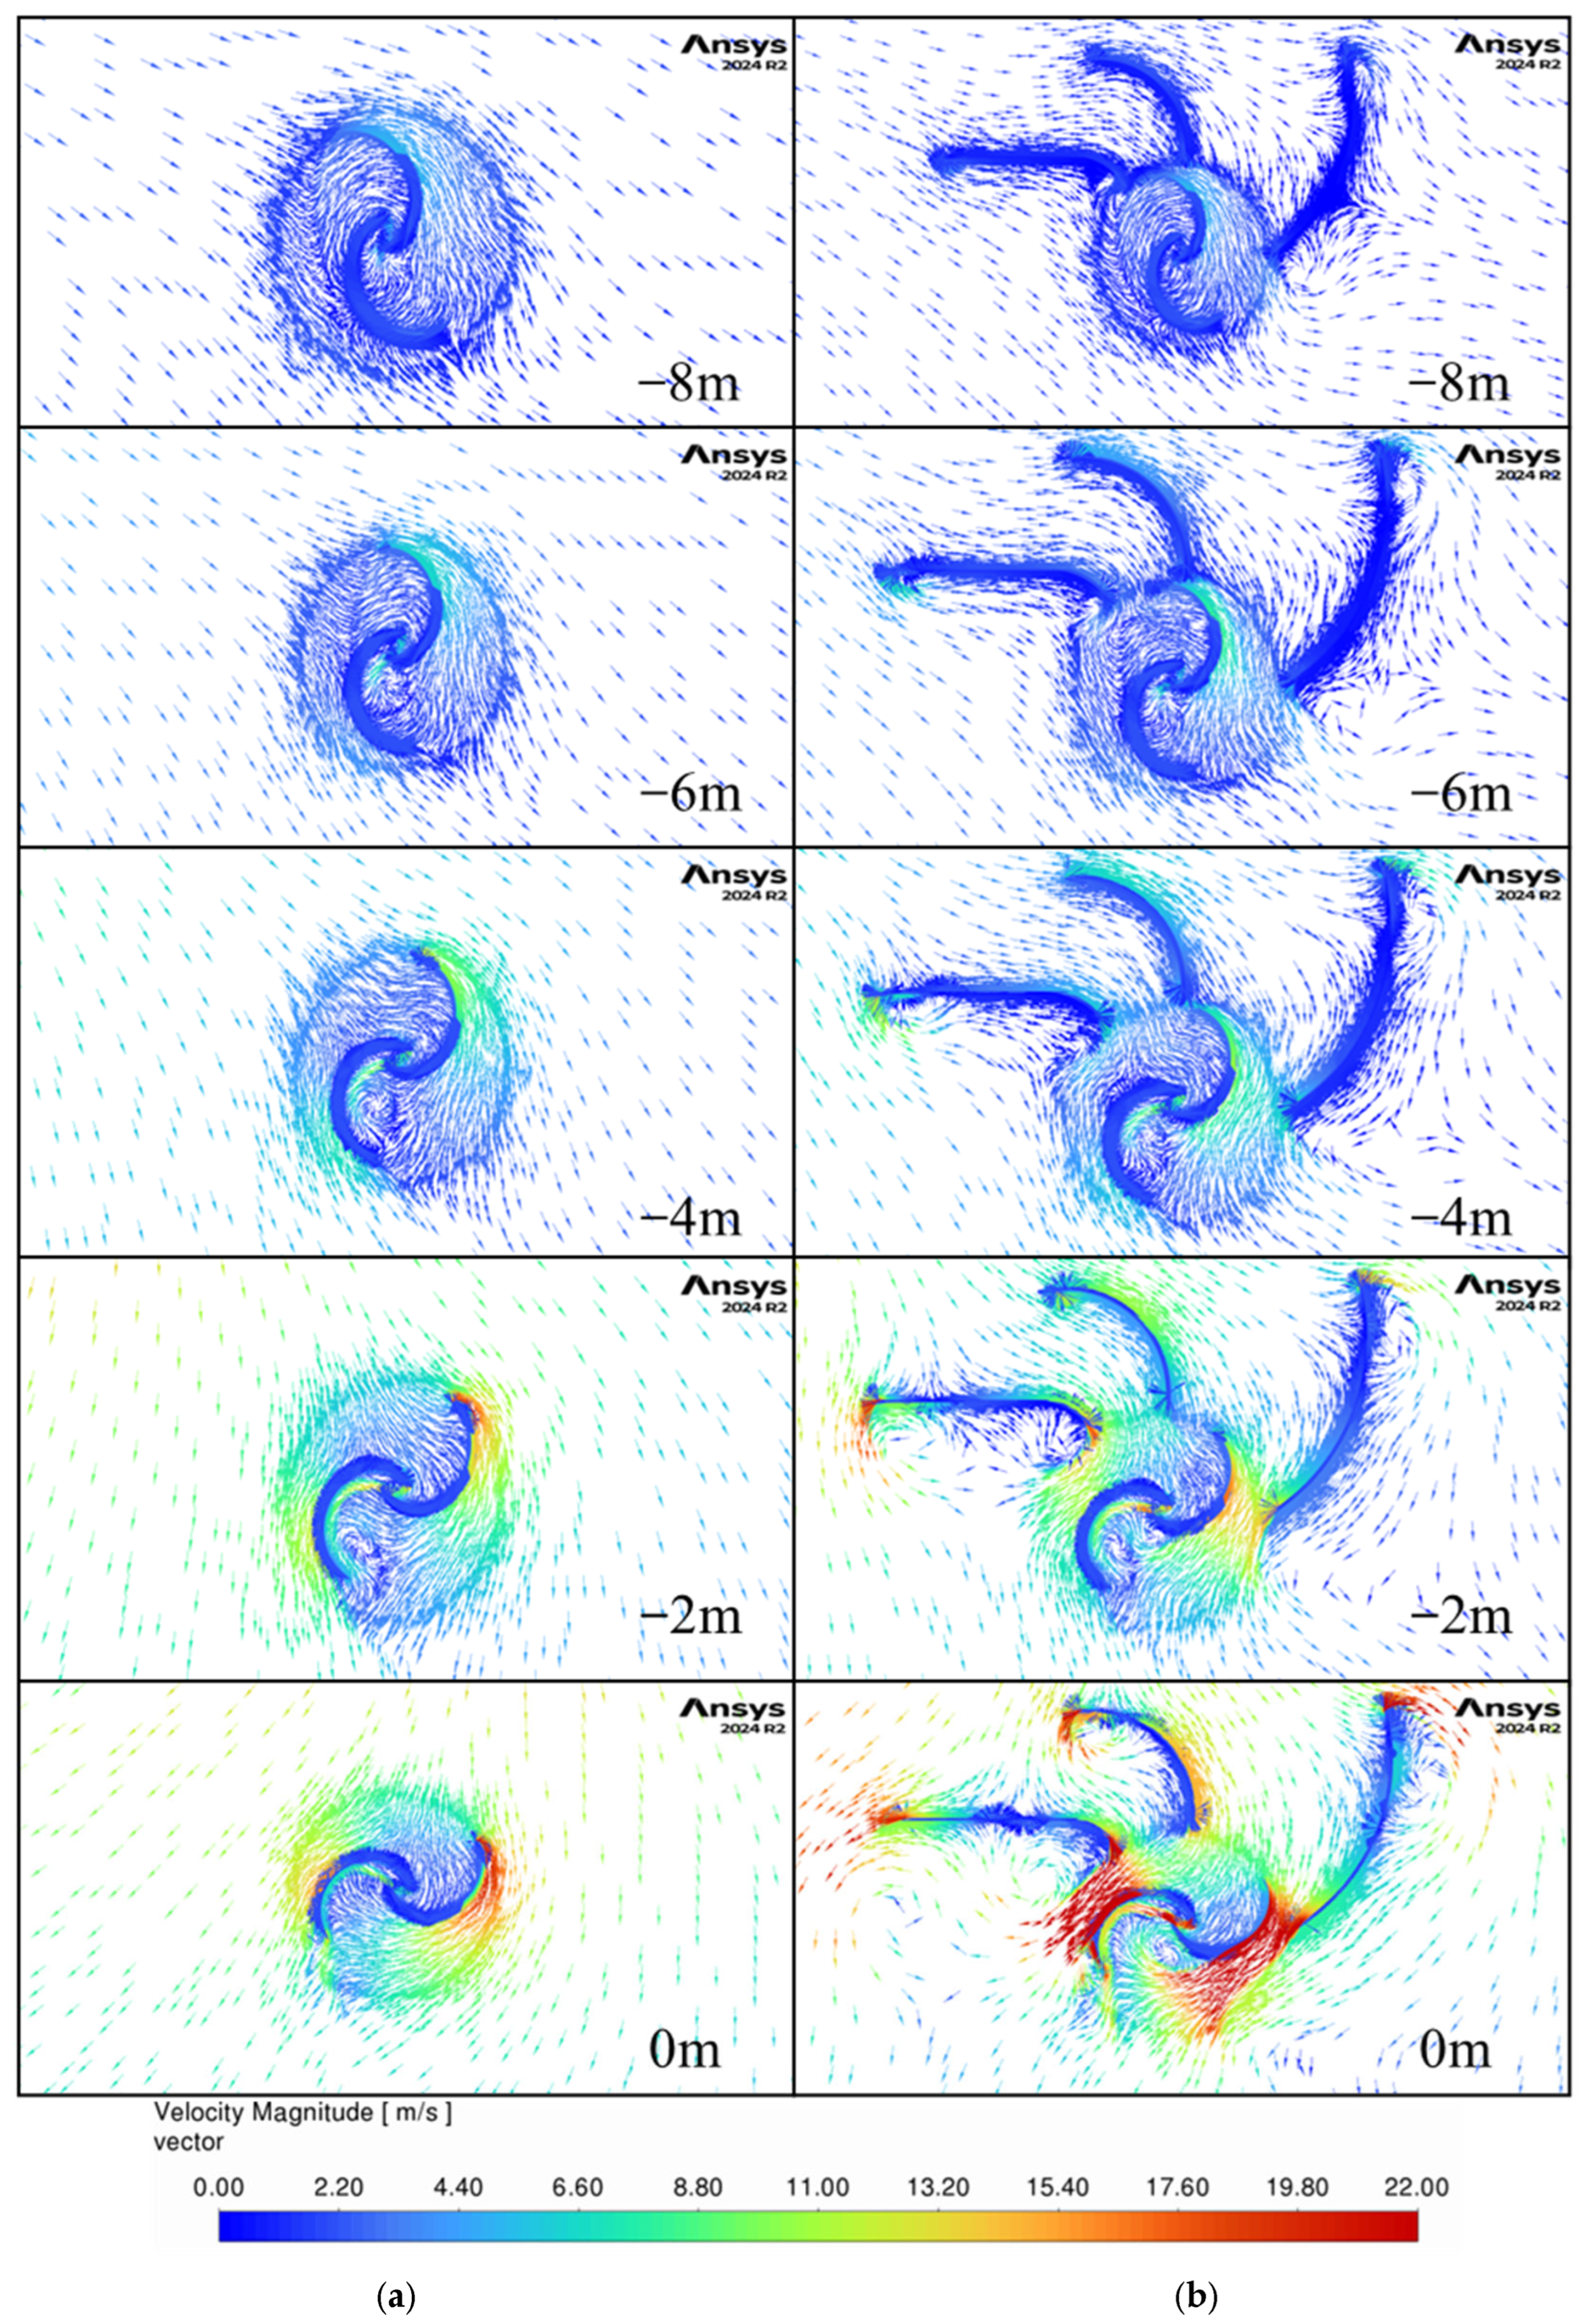
Figure 13 and
Figure 14 present contours of velocity magnitude and velocity vectors for both non-guided (“Model 1 HW”) and three-guide (“Model 14 HW”) configurations starting when the car is 8 m in front of the turbine and ending when the front of the car is 0 m from the center of the turbine.
Without guide vanes, the airflow is slower and dispersed, as shown by the large uniform velocity areas. It also flows in the same direction for the entire width of the turbine, which will generate negative torque on the returning blade and thus reduce the overall efficiency of the turbine. In contrast, the three-guide configuration generates larger velocities, and the flow is guided around the turbine which leads to larger energy generation. There is an area of high velocities around the retuning blade at the 0 m location that increases the drag on it and results in the first power drop in
Figure 11 at this location. This highlights an area of potential further optimization of the guide geometry.
Between −2 and 0 m, the generated wind becomes faster reaching velocities of up to 22 m/s for the guided setup suggesting that between these points the wind energy is the highest, as shown in the initial peak in
Figure 8.
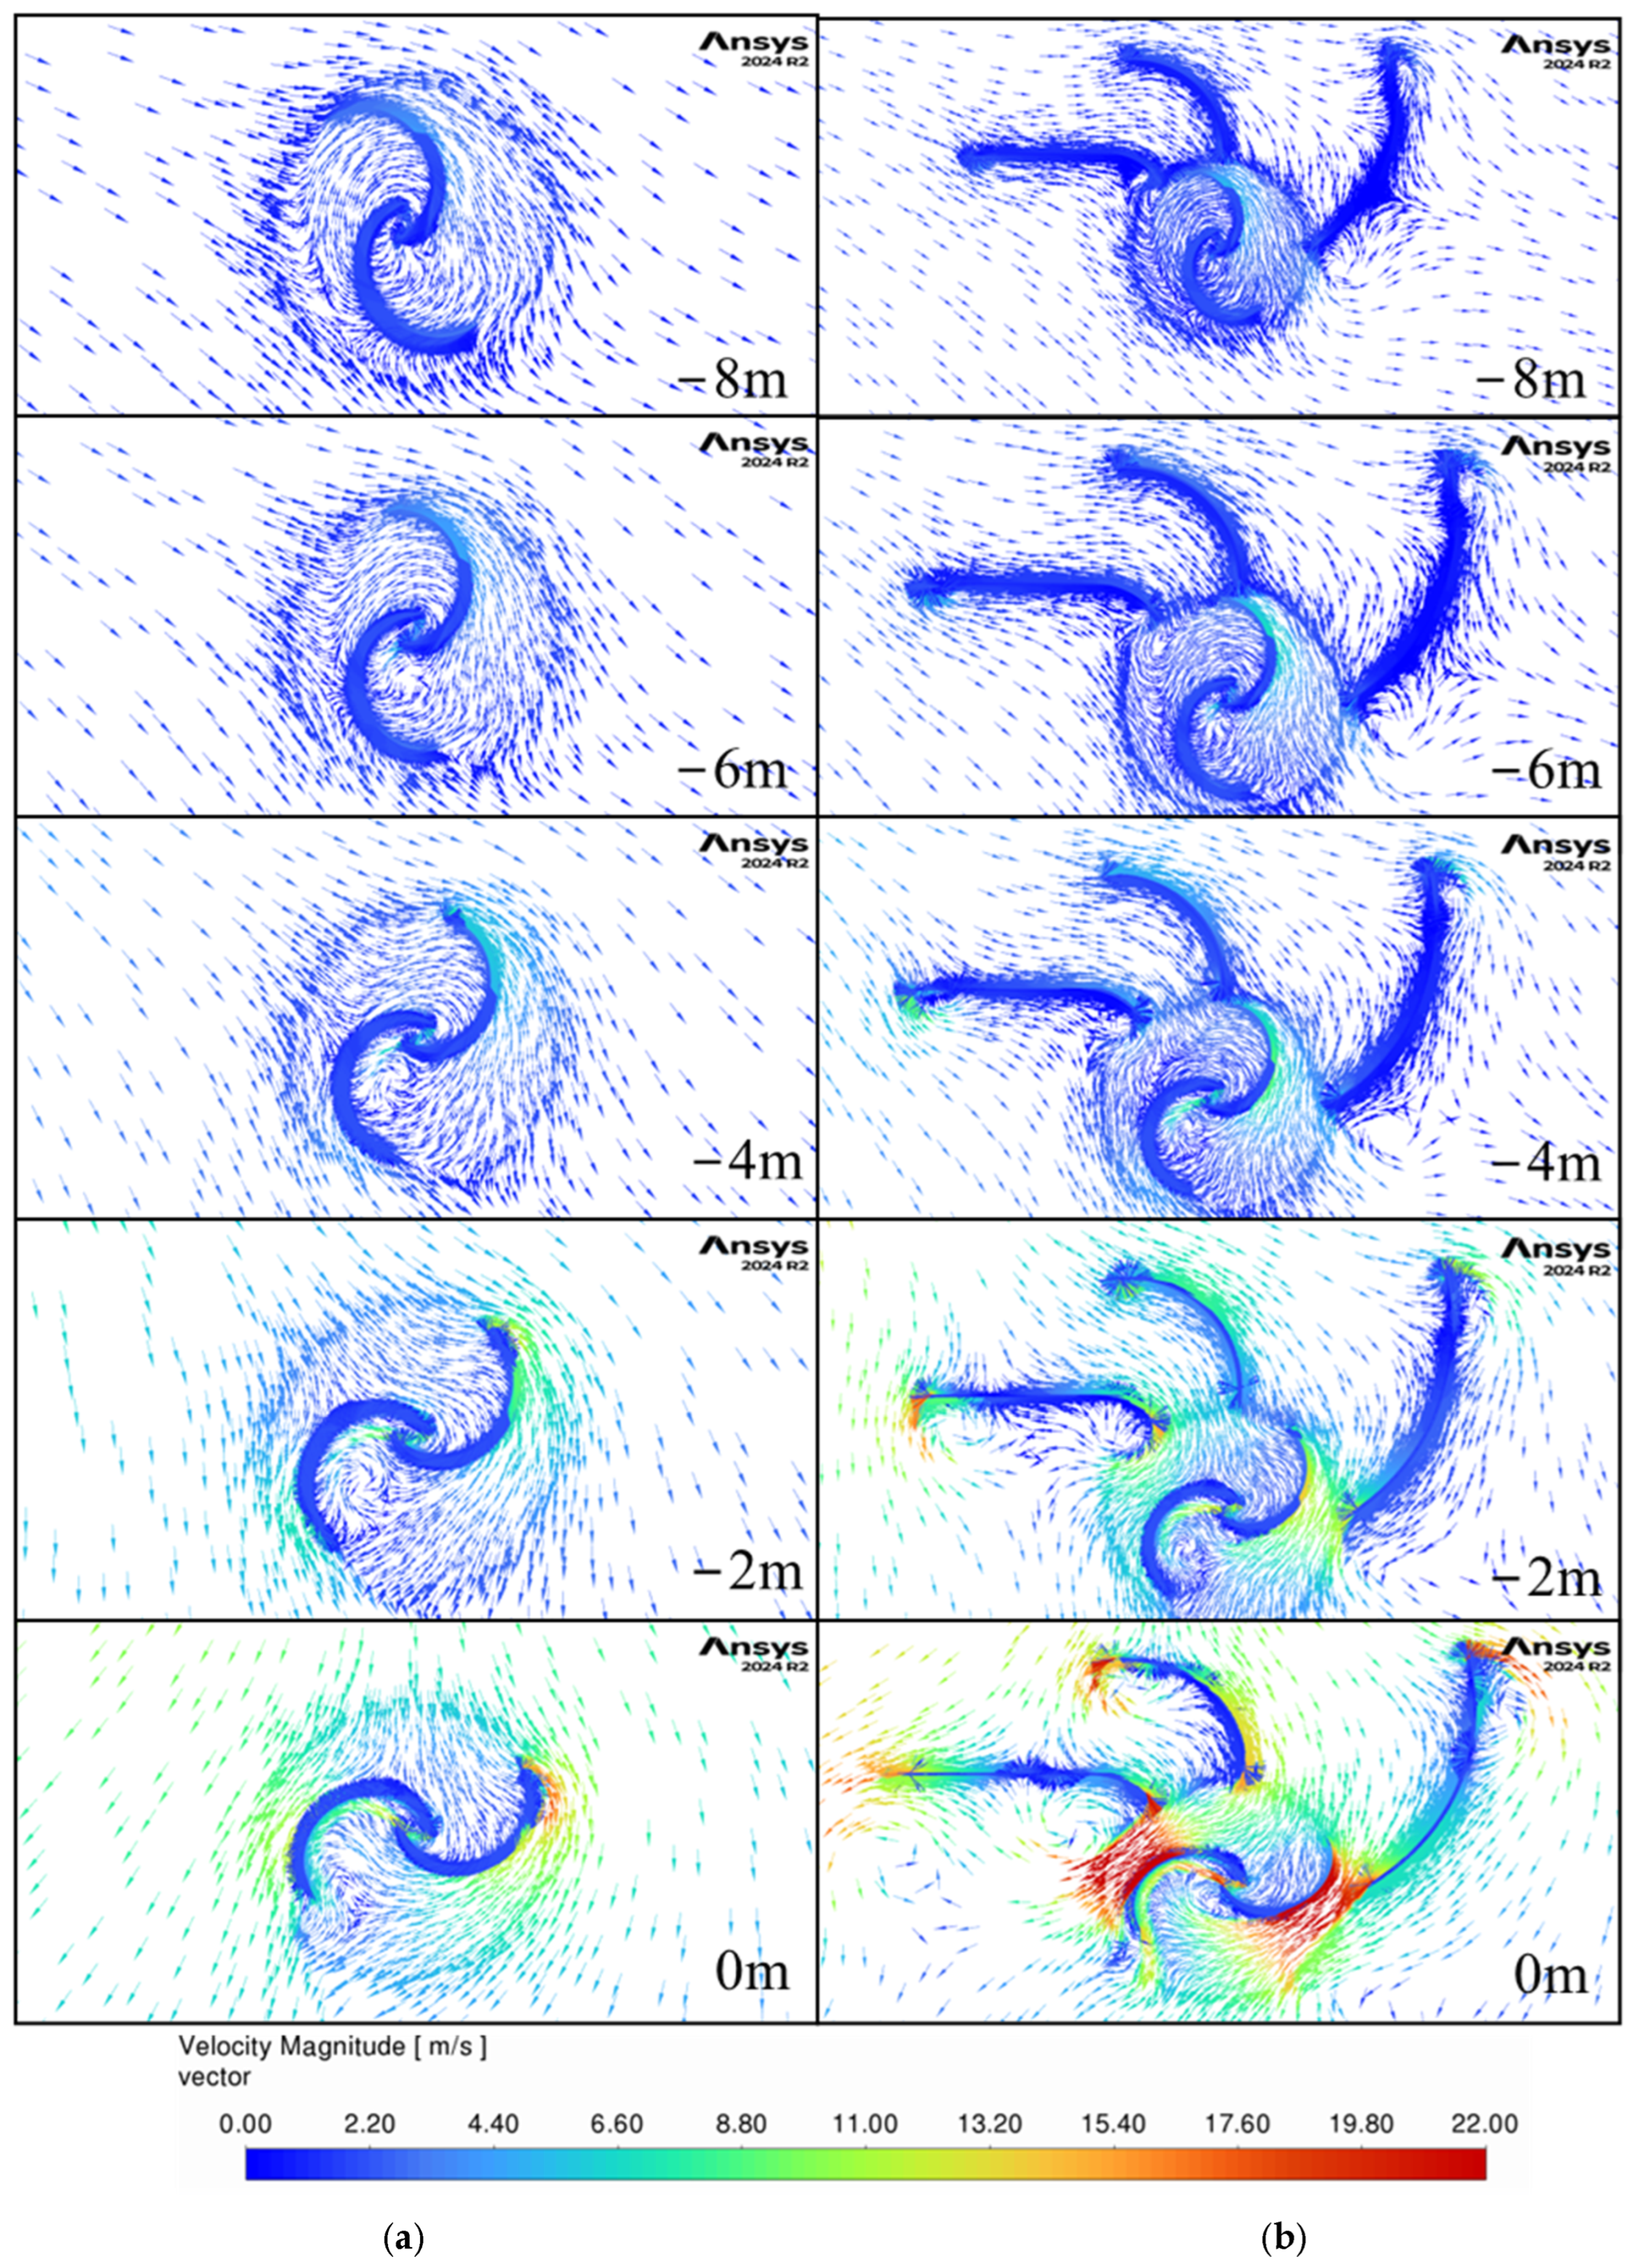
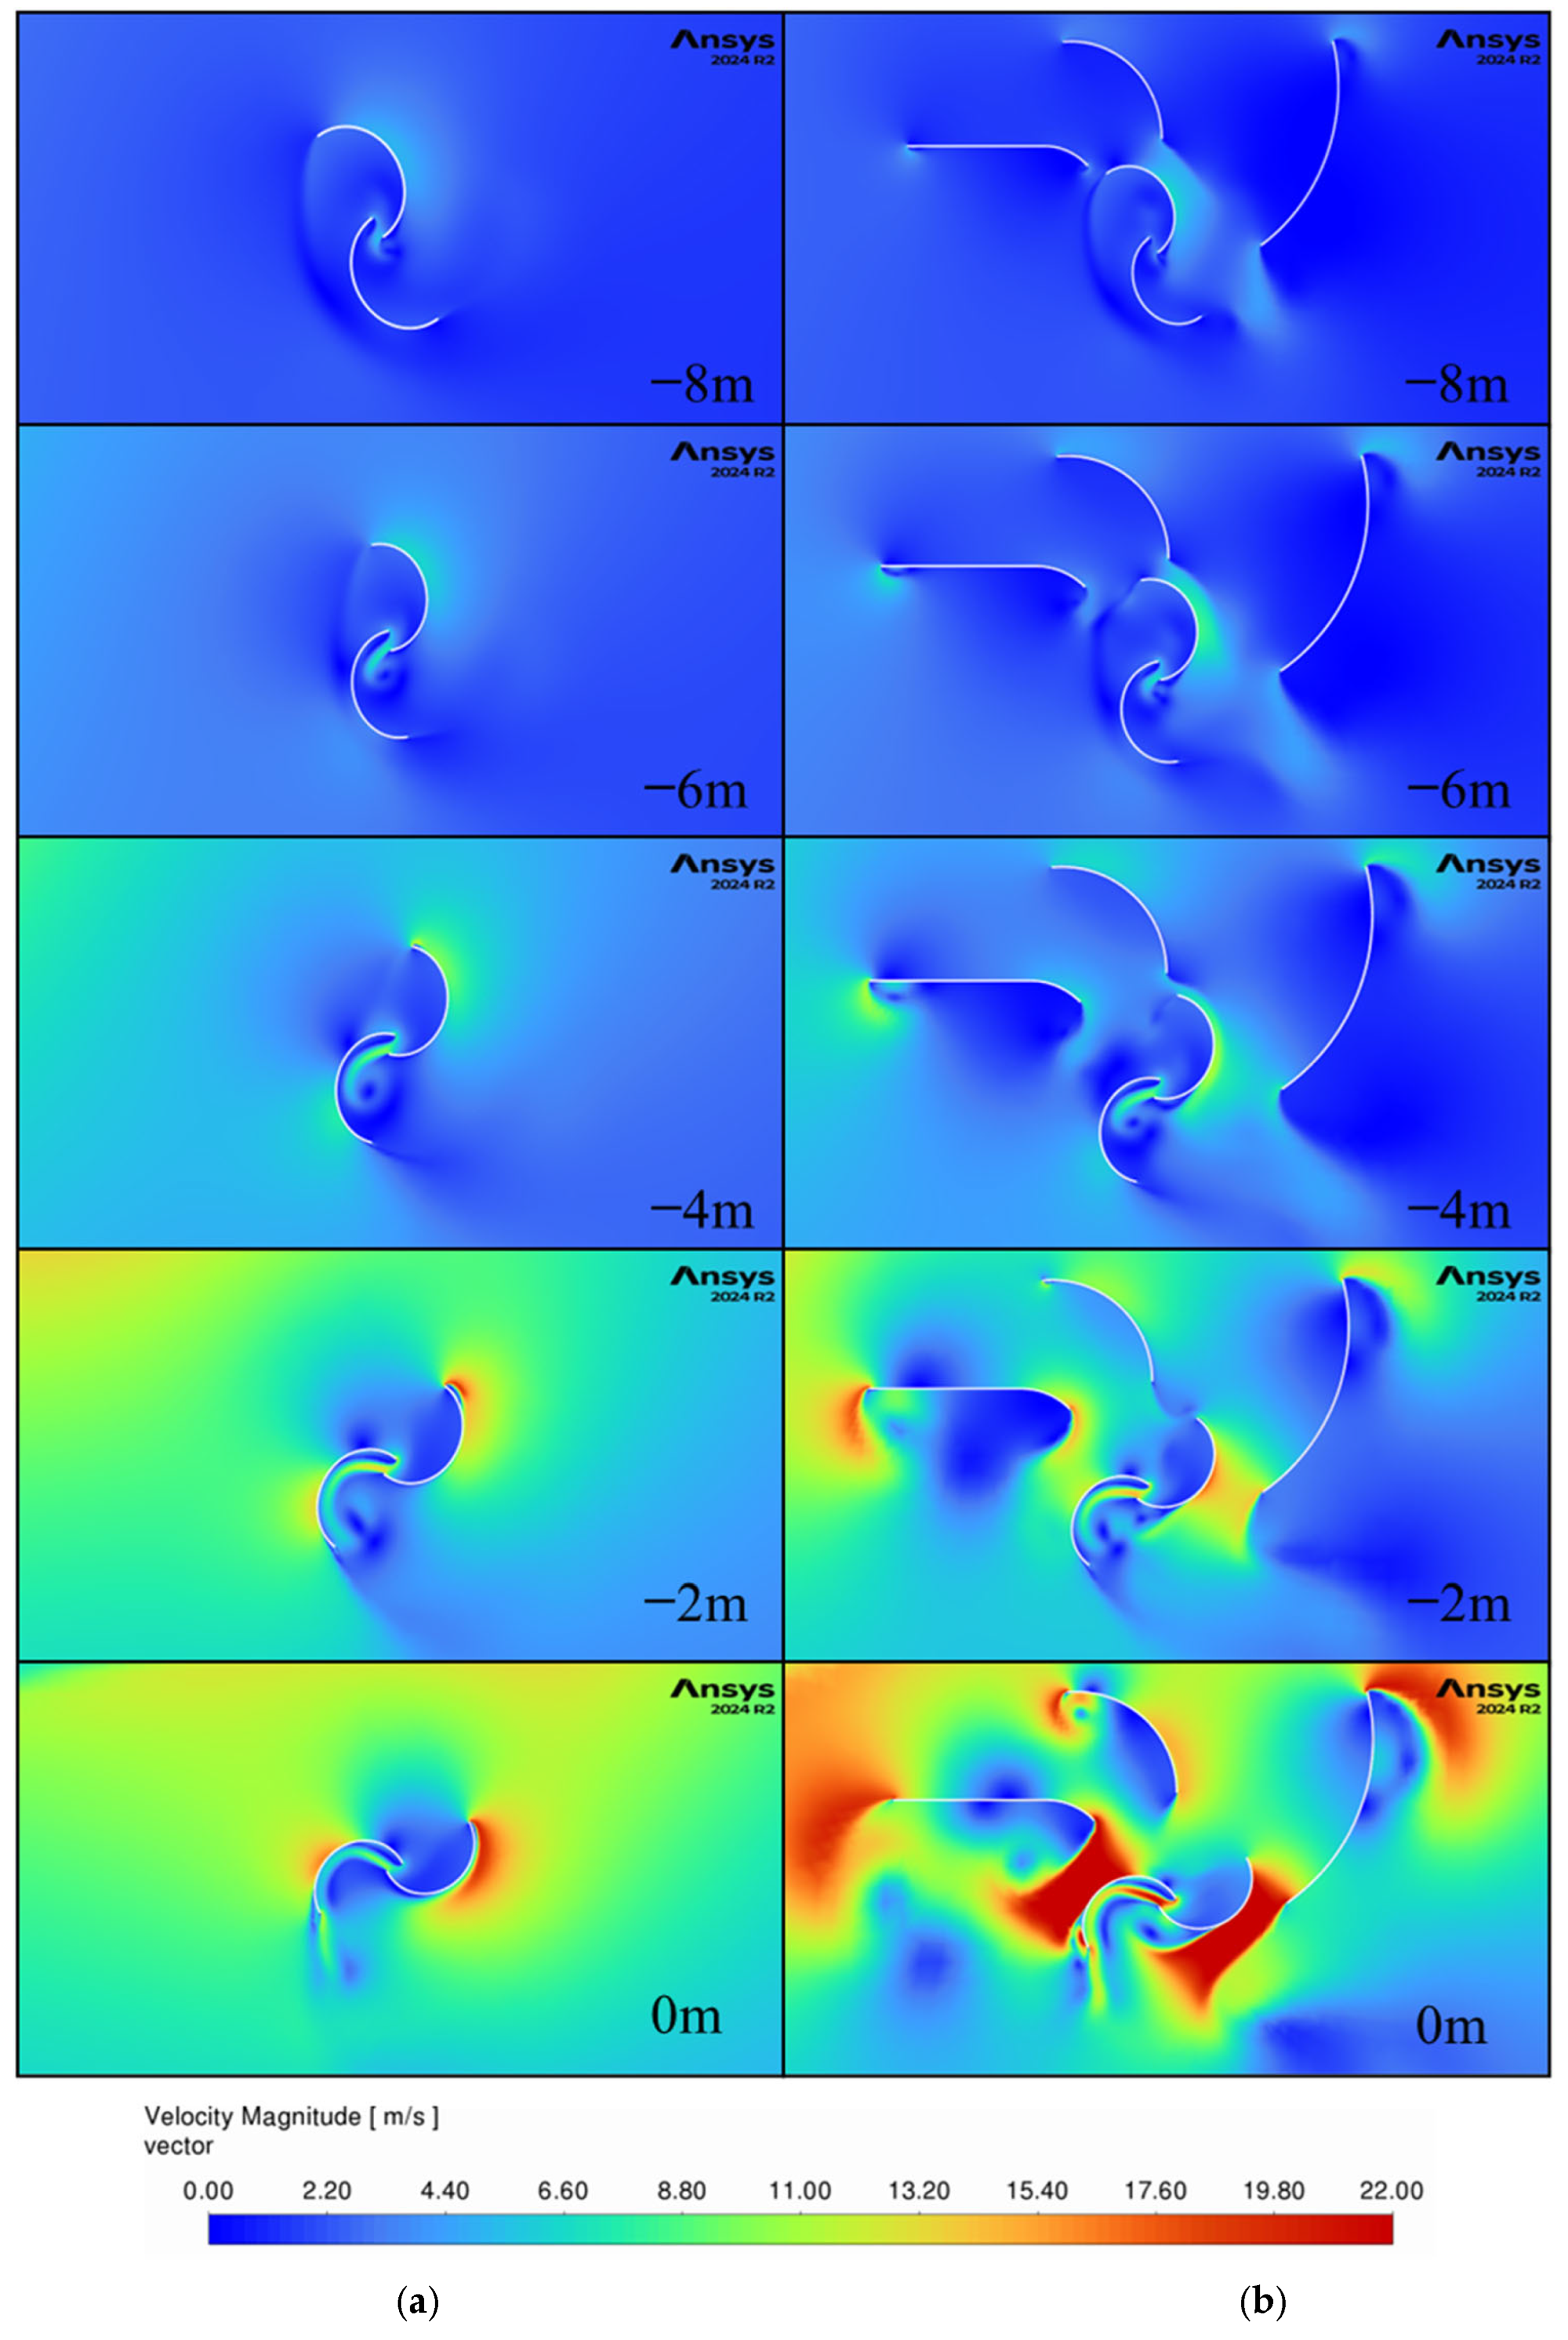
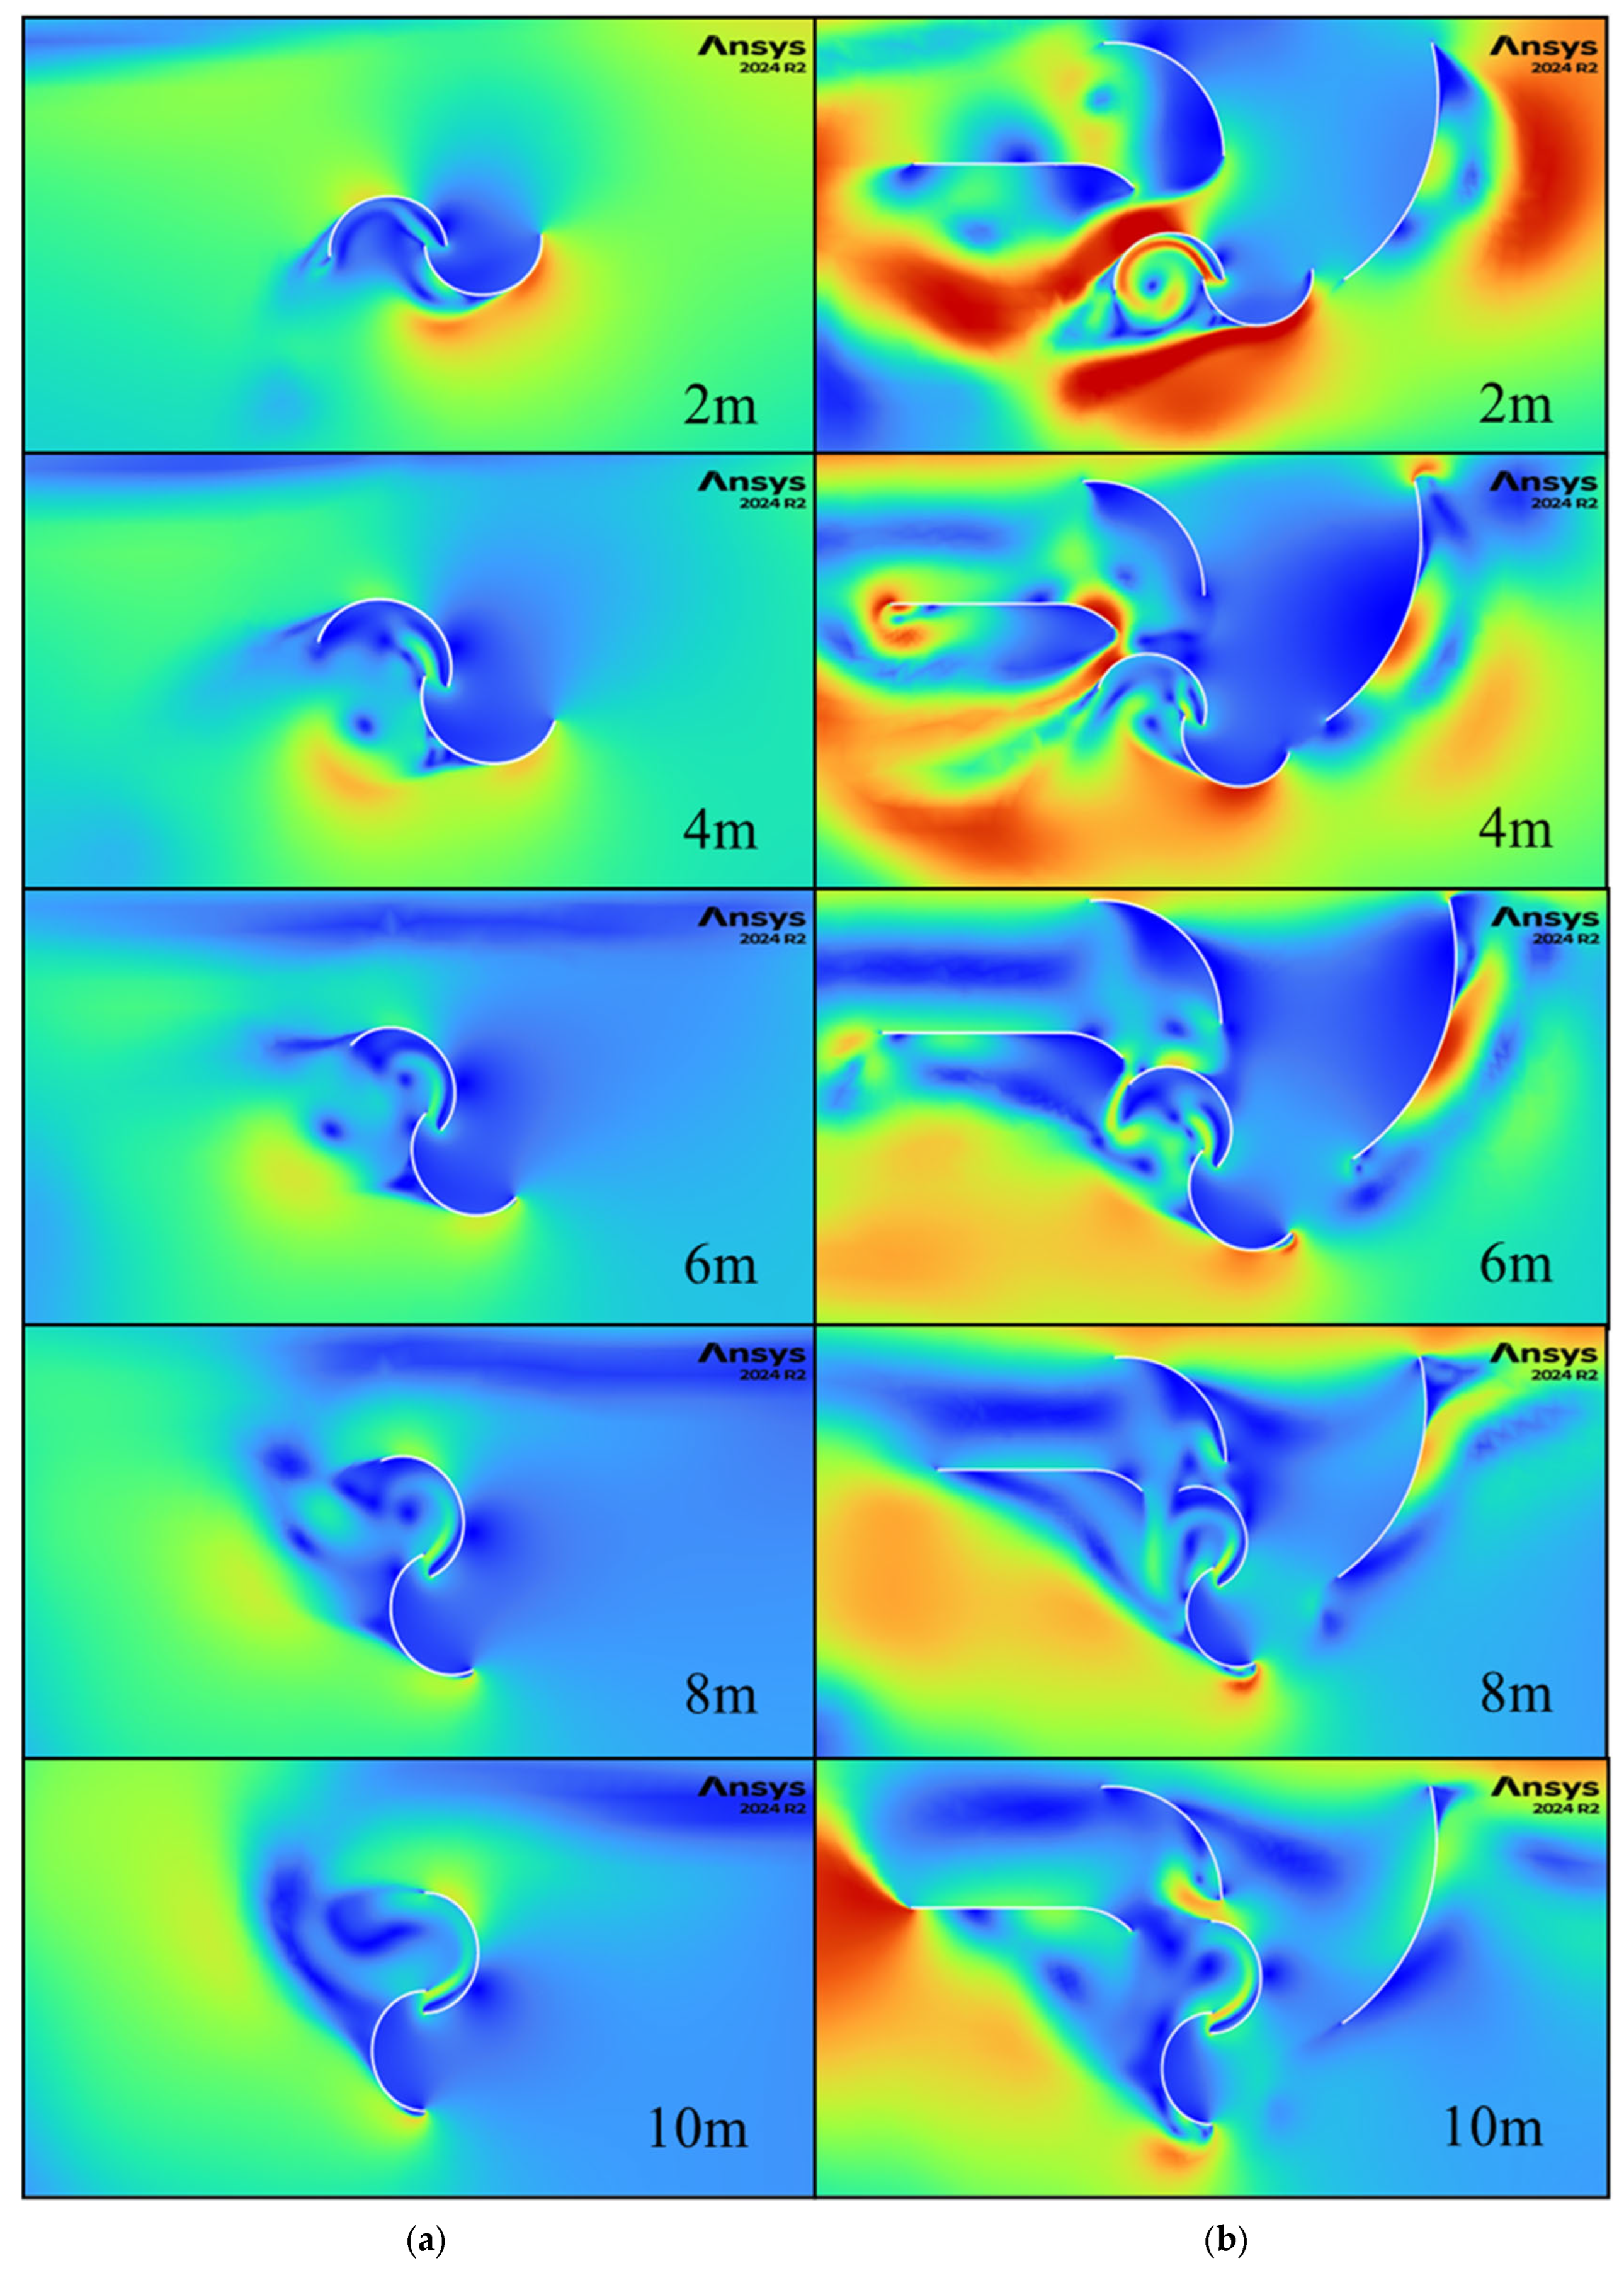
Figure 15 and
Figure 16 show the airflow as the car goes past the turbine for the same non-guided and three-guide configurations. Without guide vanes, the wind quickly slows down and yet again has a relatively uniform direction for the entire width of the turbine. This once more negatively affects the returning blade as it enters the flow and reduces the turbine’s ability to generate power after the vehicle has passed. Interestingly, the flow direction changes by almost 180 degrees as vortices are generated by the car. This occurs for both guided and non-guided setups, and it showcases the complexity and the transient nature of the flow generated by moving vehicles.
For the guided configuration, one can see that in the beginning, the first guide directs the airflow around the returning blade, while later, guide two starts blocking the flow on the returning blade, and finally, guide 3 also drives the flow around the returning blade as well. This validates the change from two to three guides and suggests that adding more guides could further improve the efficiency of the turbine. Guide two, which was not optimized in this study, is not as efficient at guiding the flow around the returning blade, and this generated the second drop in power generation seen in
Figure 11. Thus, the three-guide design will benefit from an optimization of the geometry of guide two.
Figure 17 and
Figure 18 examine the airflow when the car is further behind the turbine. The same findings as for the other car locations past the turbine are present with the direction of the flow rotating further clockwise around the turbine. Also notable is the fact that large velocity flow is still moving around the turbine even when the vehicle is three car lengths past the turbine and the guides are helping capture more of the wind energy, which led to the improvements found in this work.
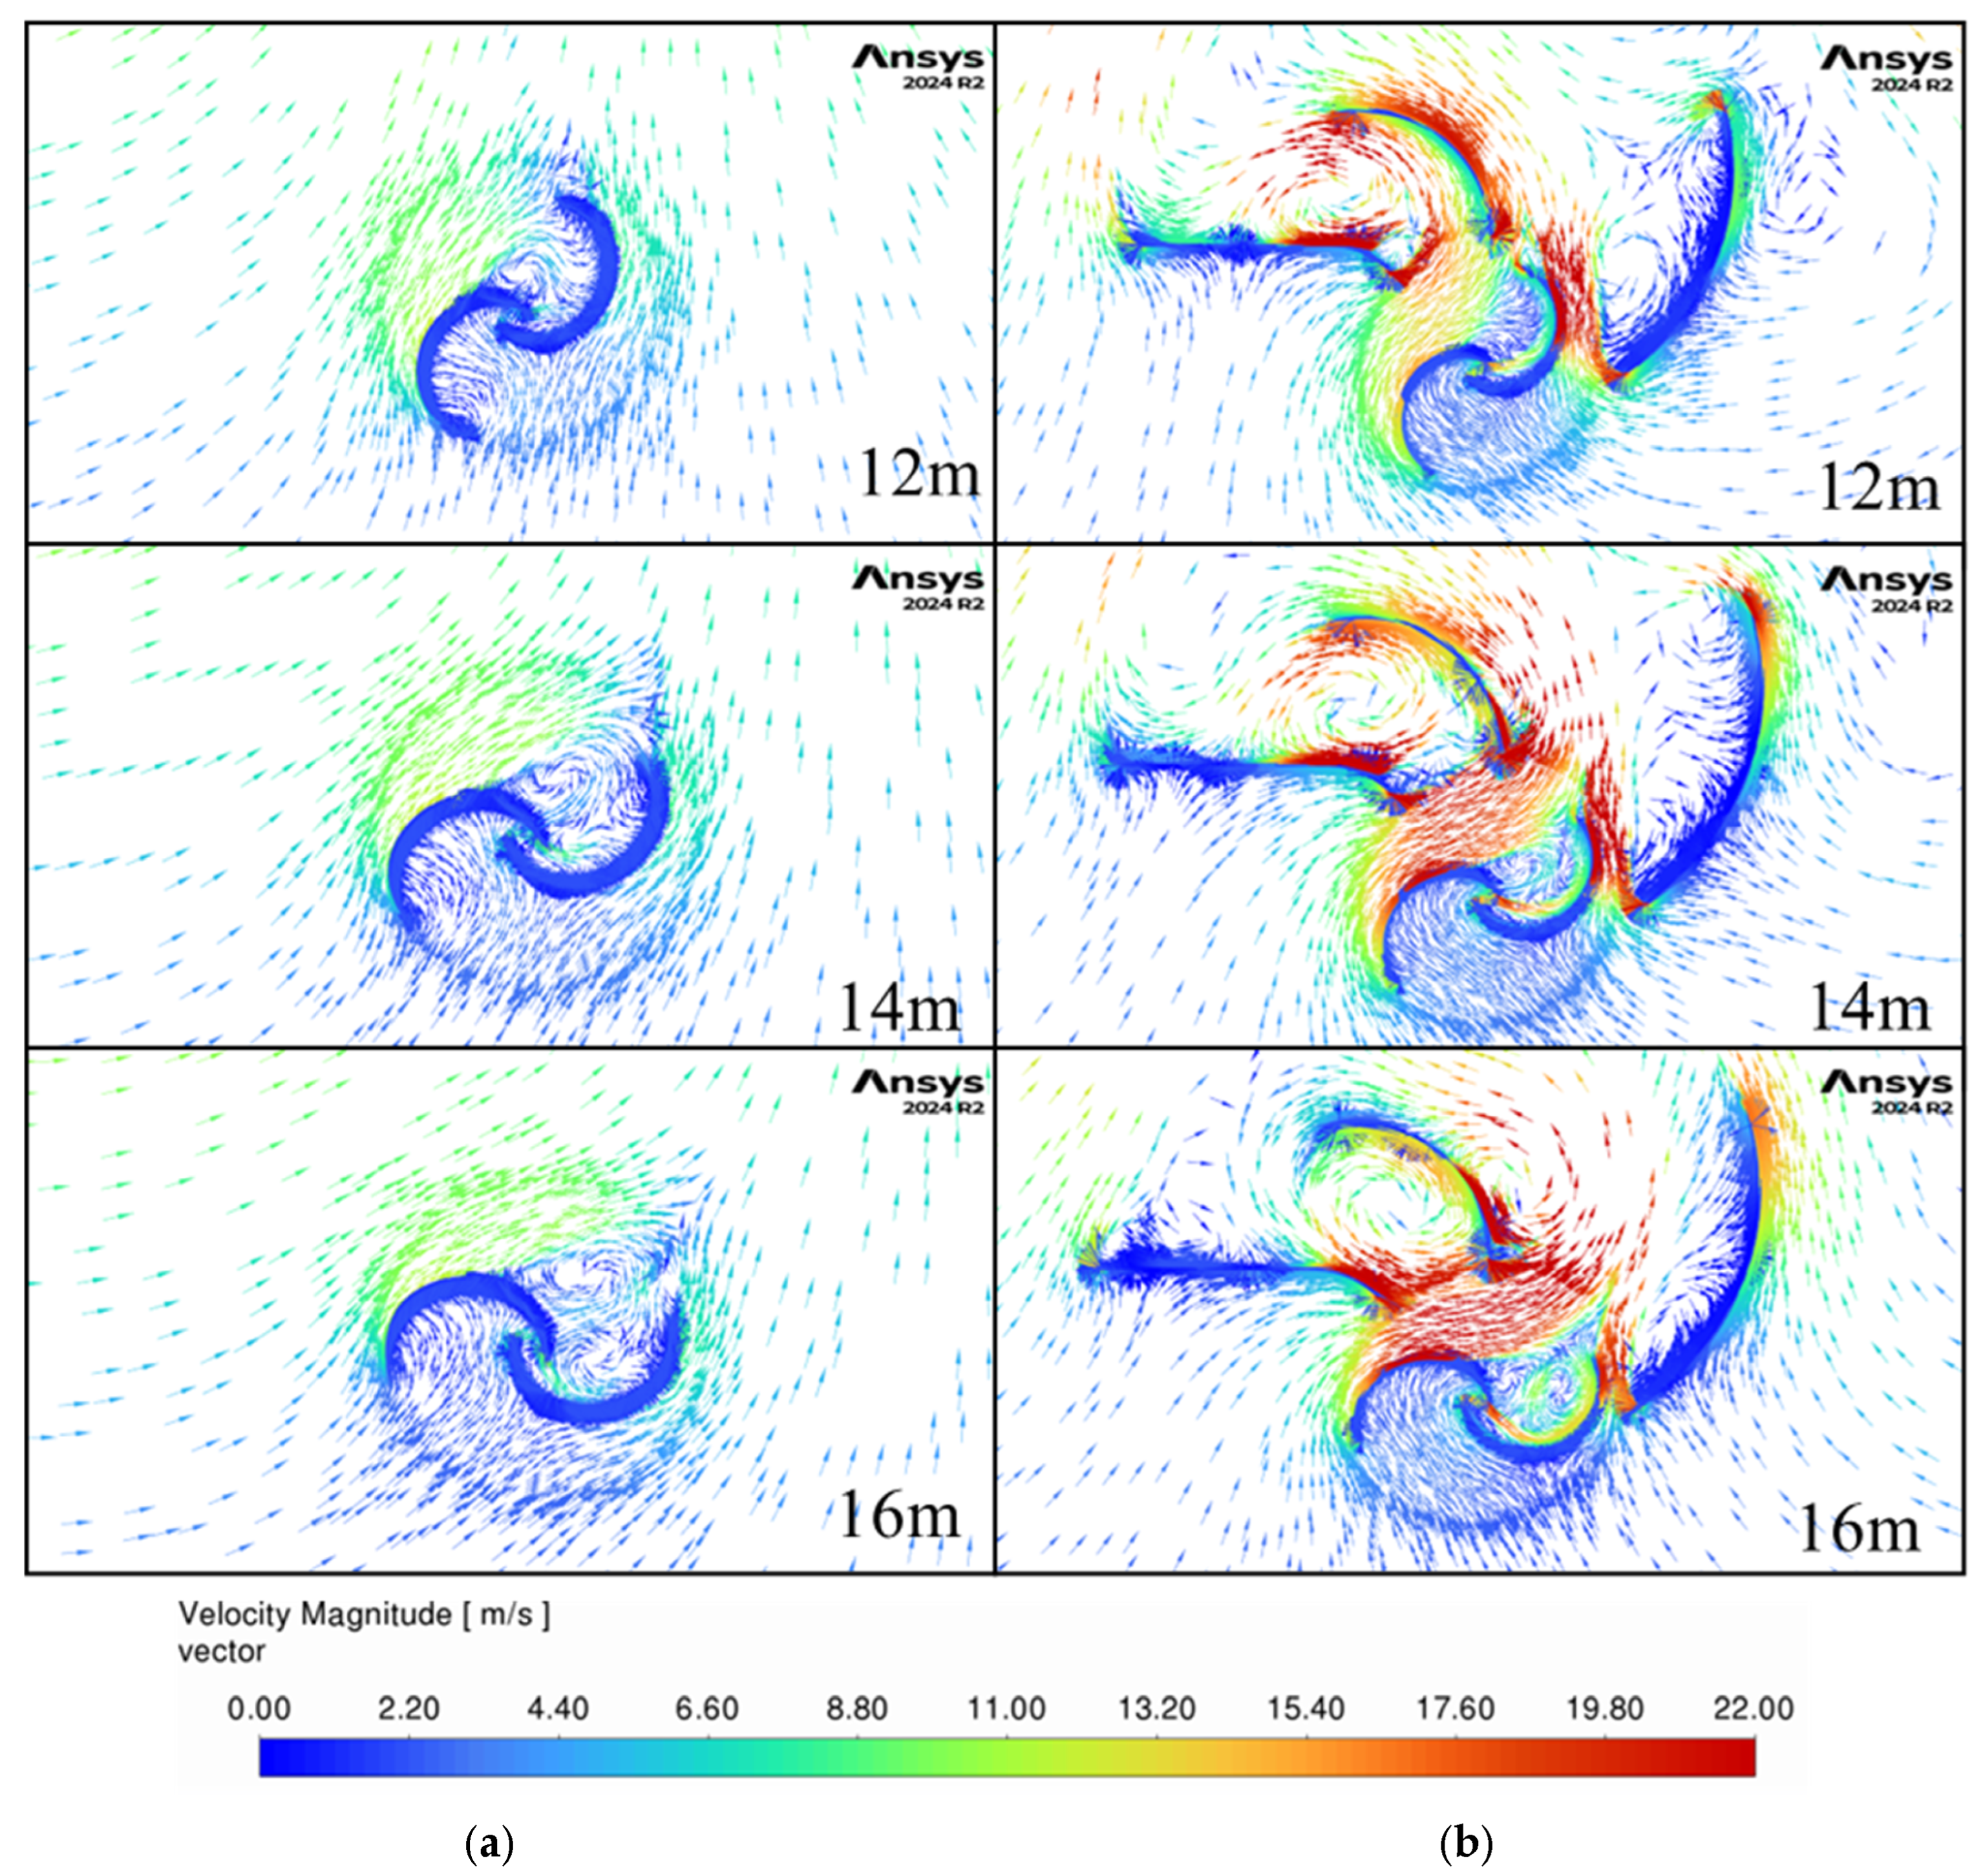
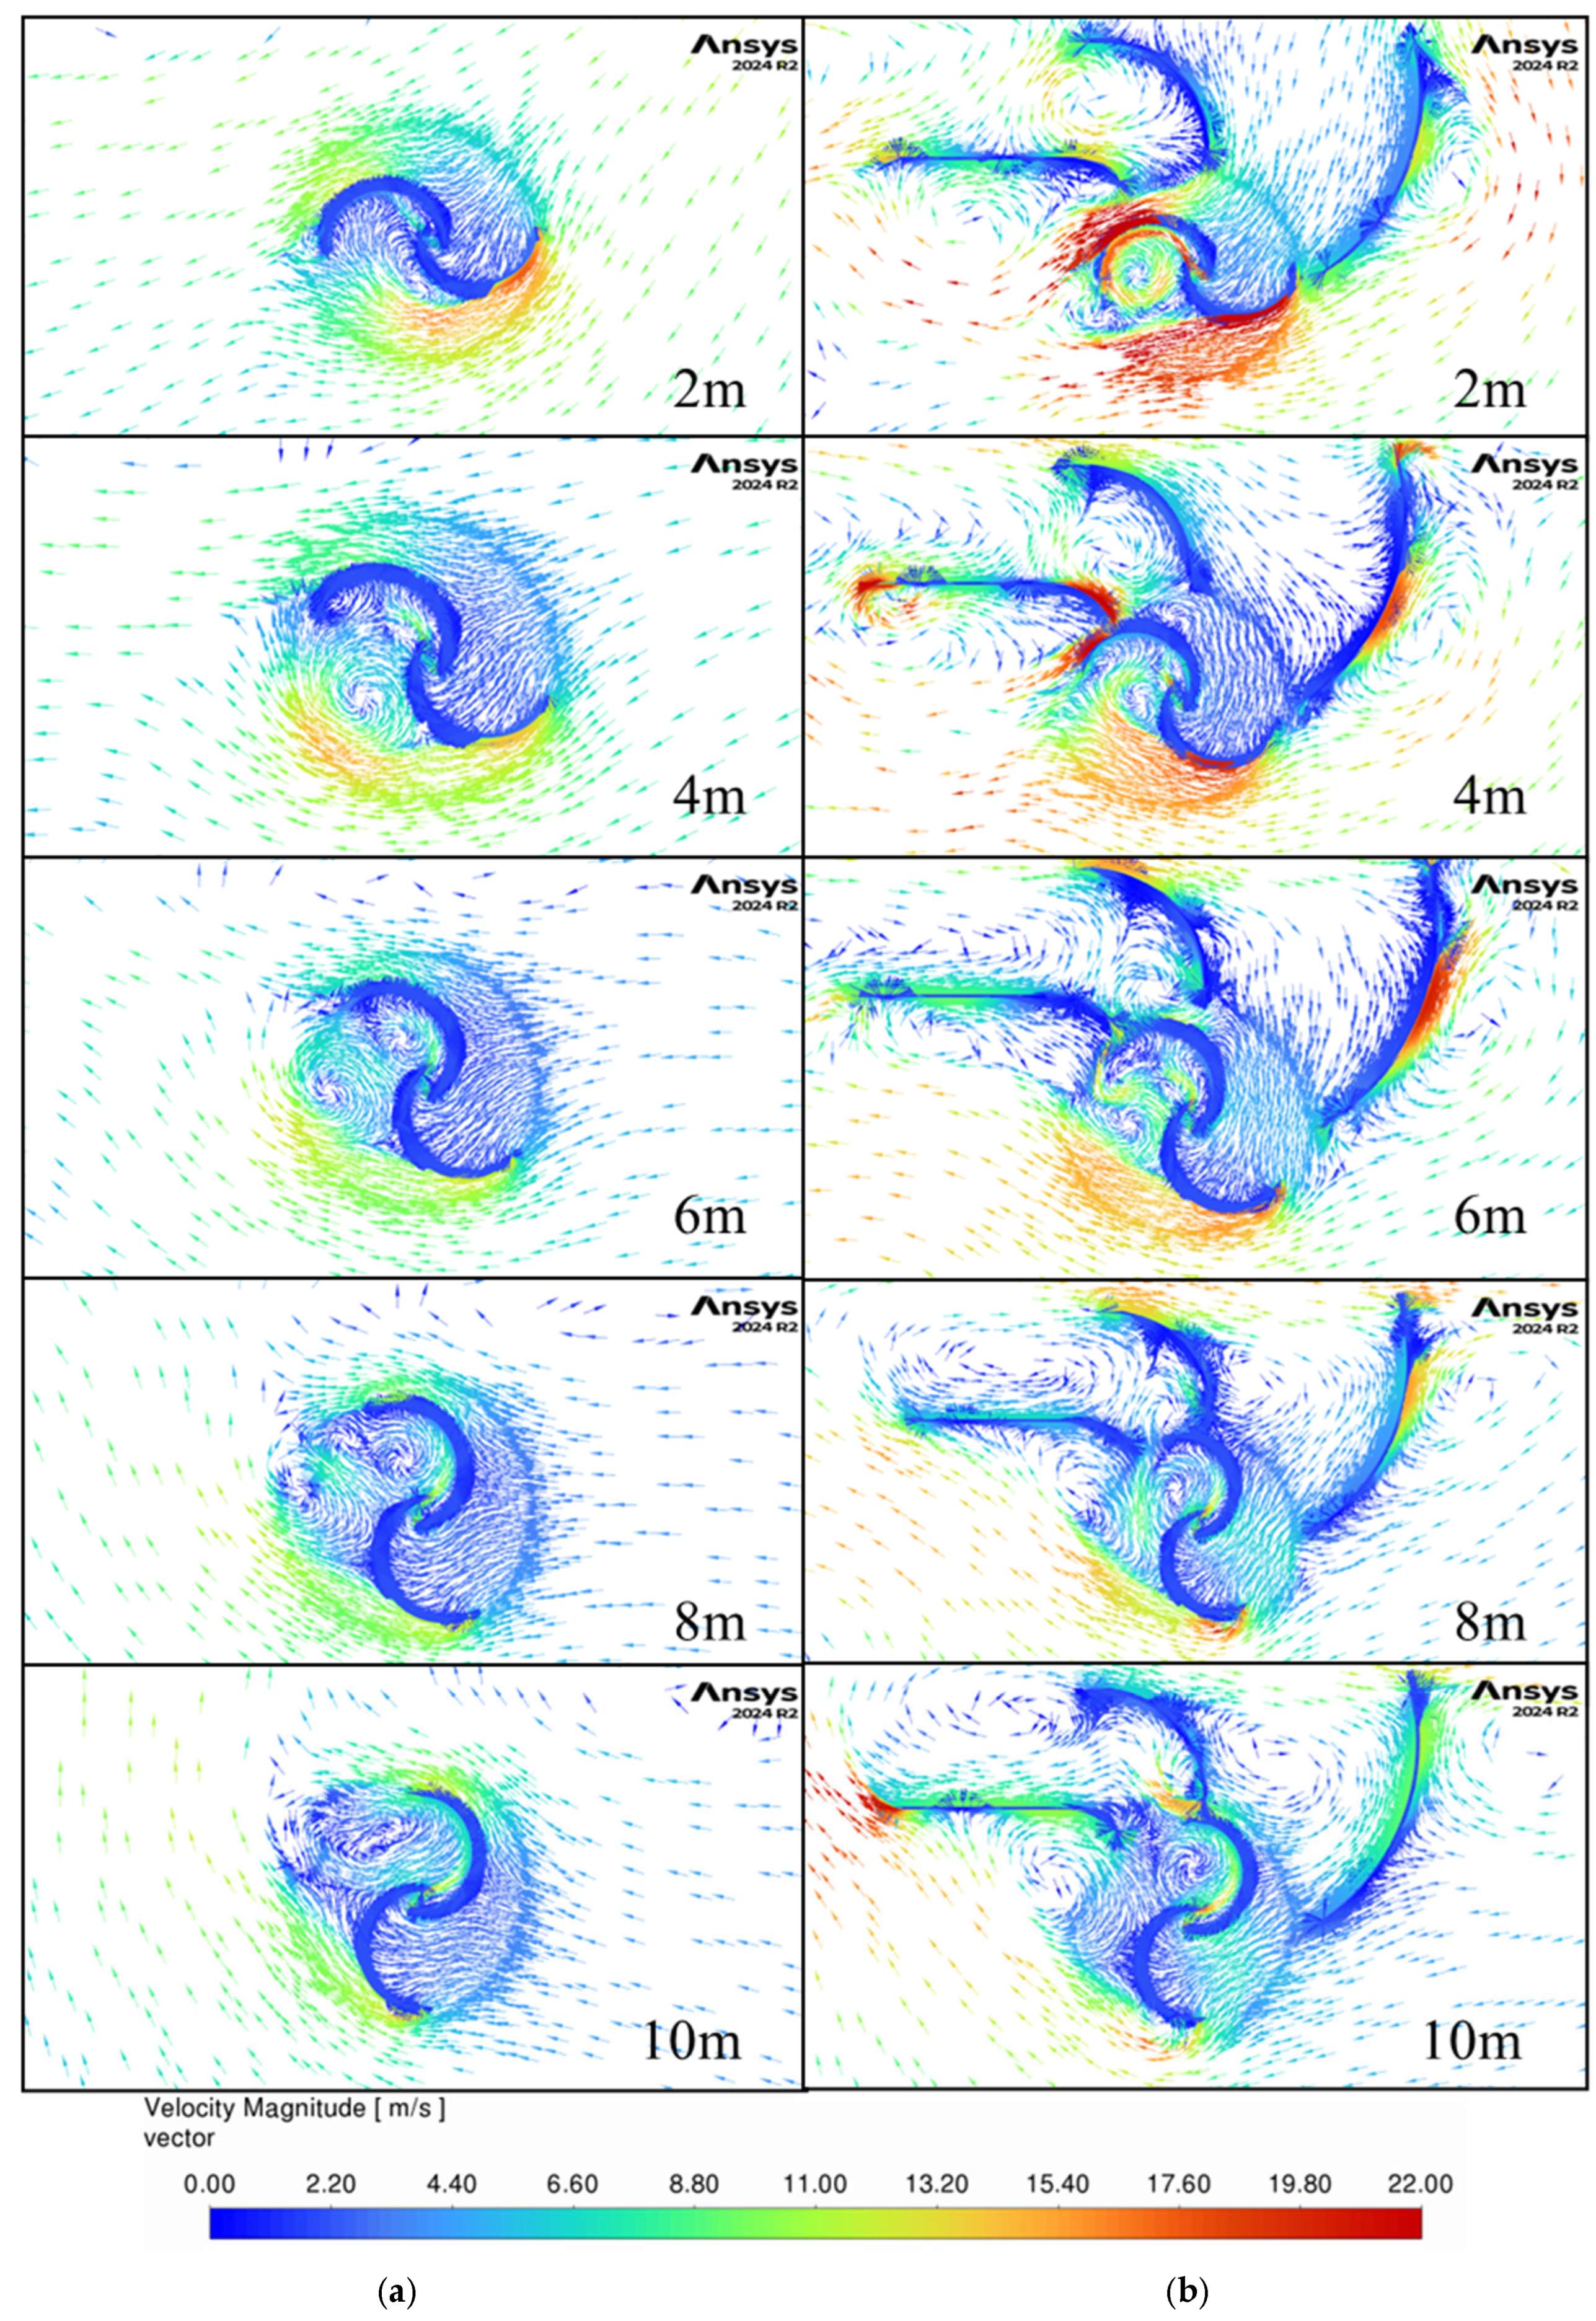
Figure 19 and
Figure 20 present the velocity contours and vectors as the bus approaches the turbine and reaches its center (0 m) for the non-guided (“Model 1-Bus HW”) and the three-guide (“Model14-Bus HW”) configurations, as presented in
Table 8. The airflow looks similar to the case of a car approaching the turbine, with a noticeable increase in velocity magnitudes at earlier locations. This increased airflow is due to the larger size of the bus compared to the car. The bus model shows the same increase in velocity around the returning blade at 0 m, reinforcing the need for further optimization of the guides’ geometry.
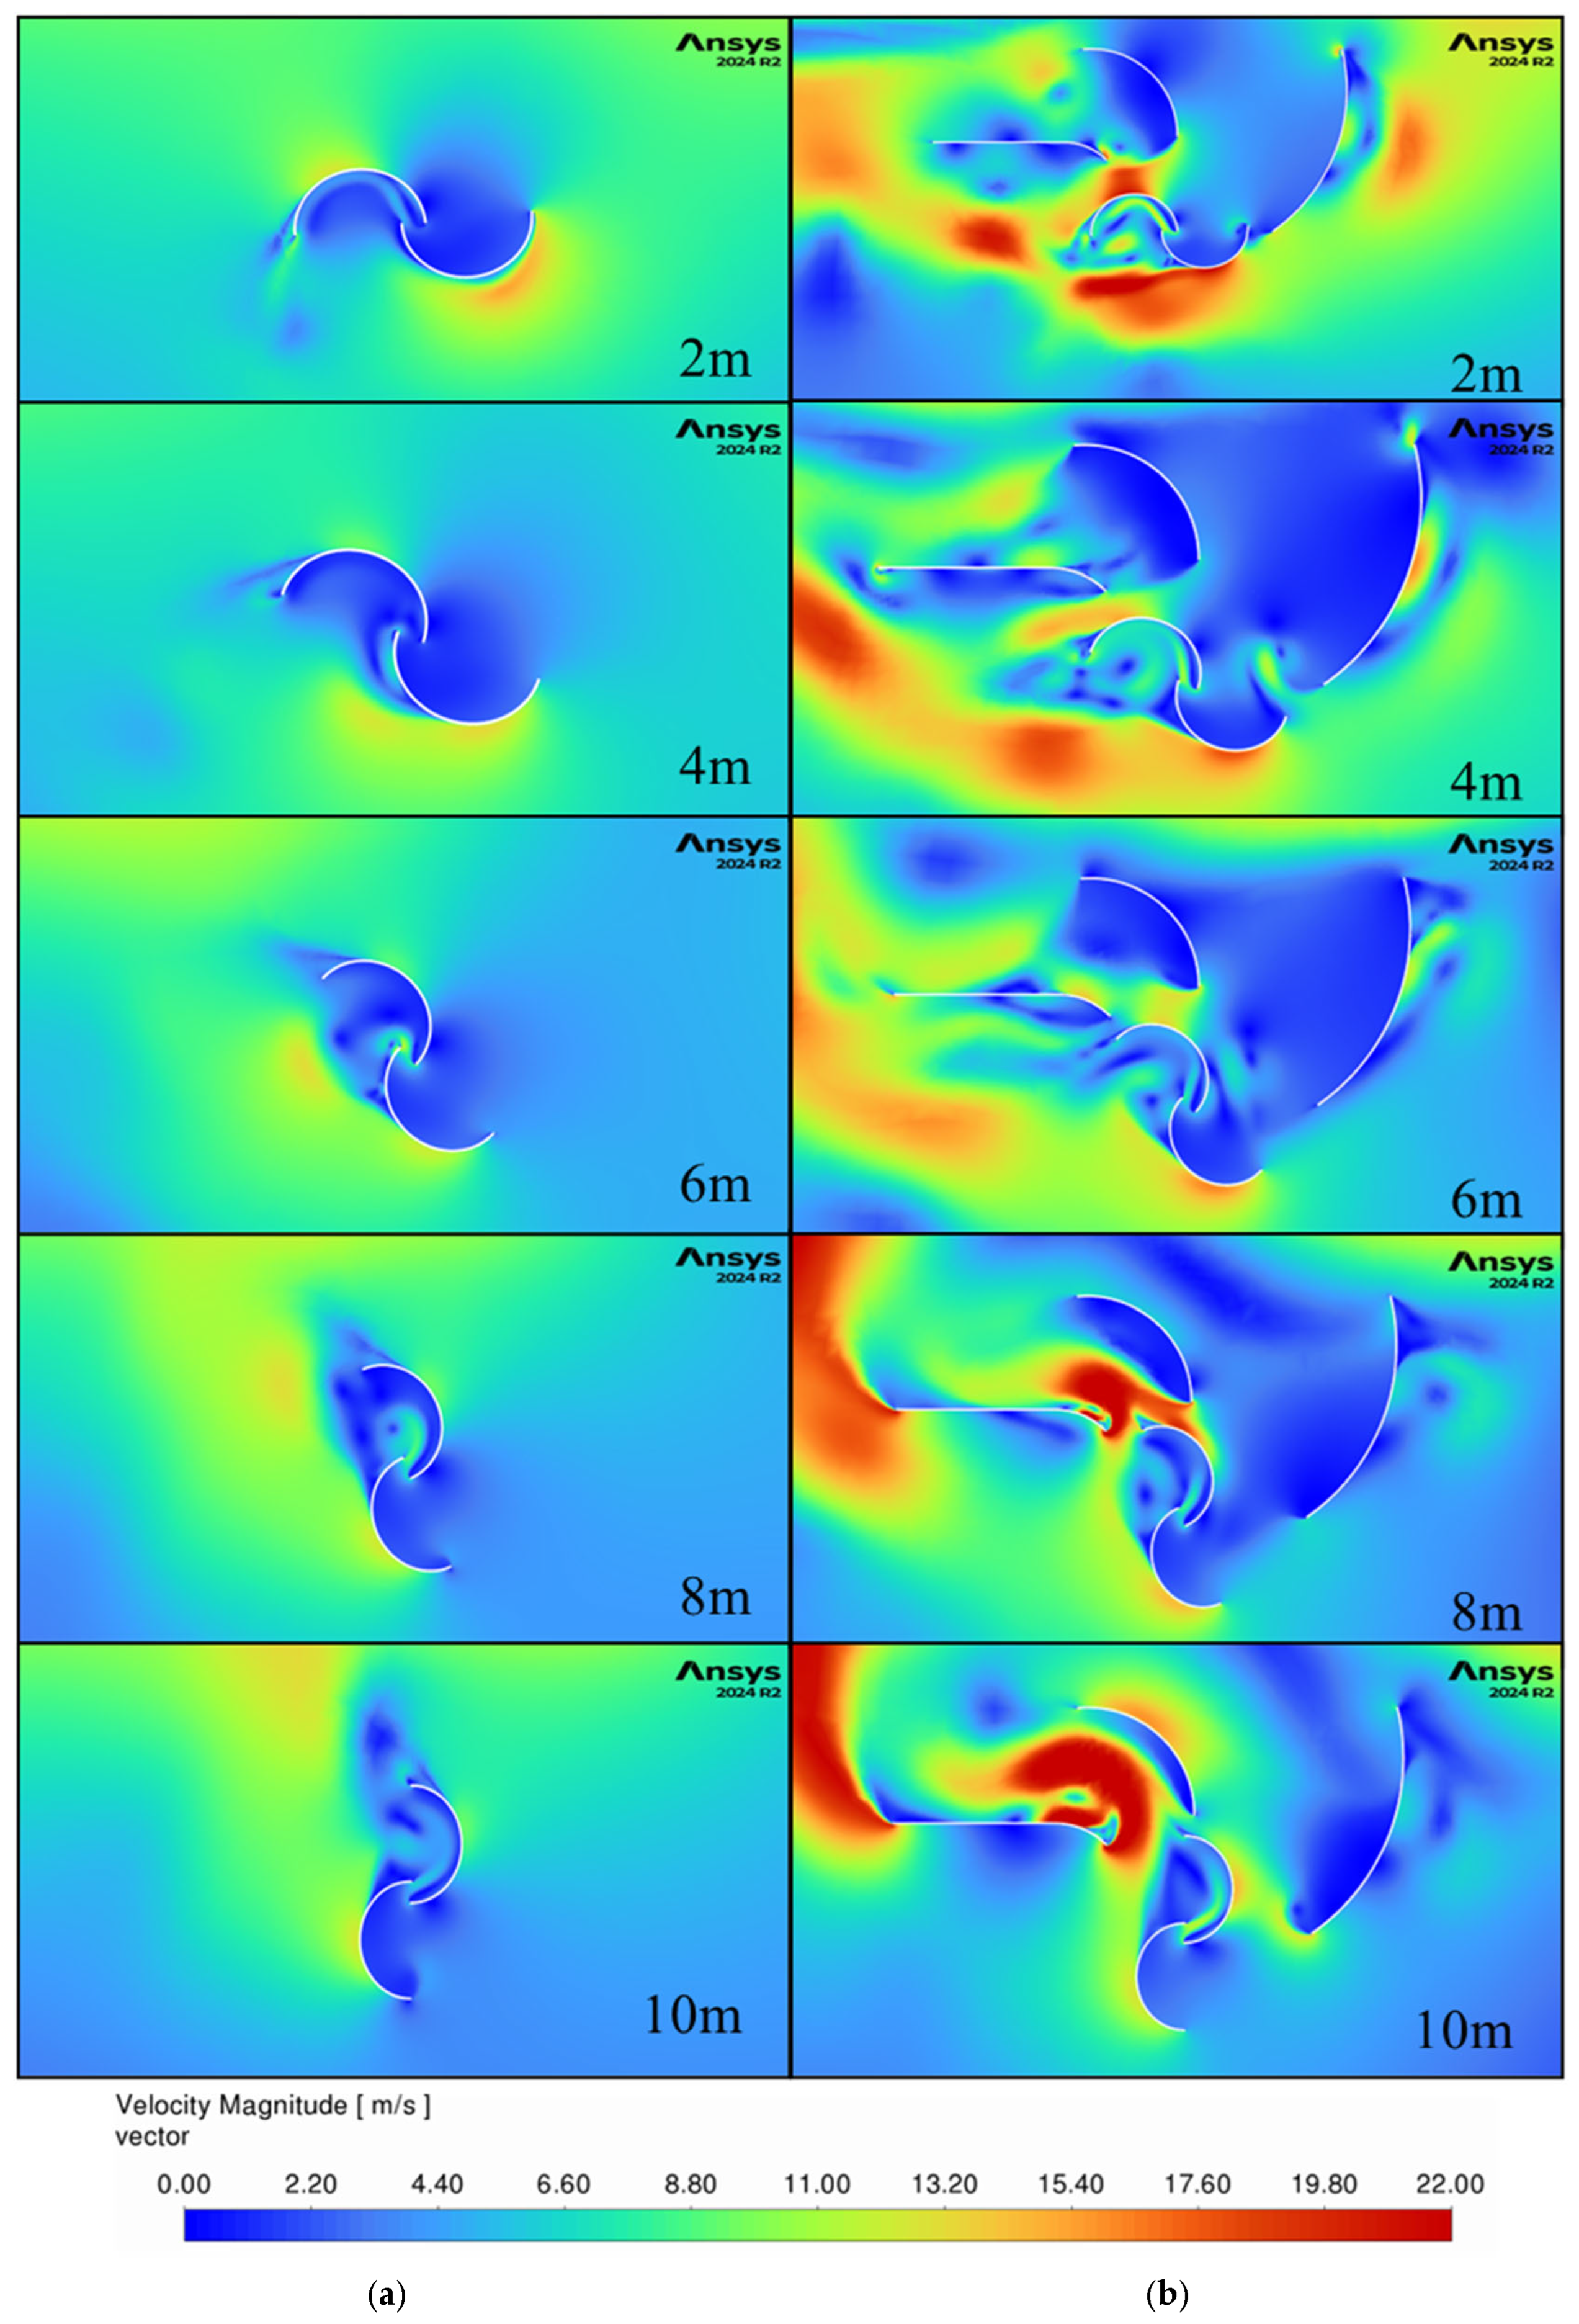
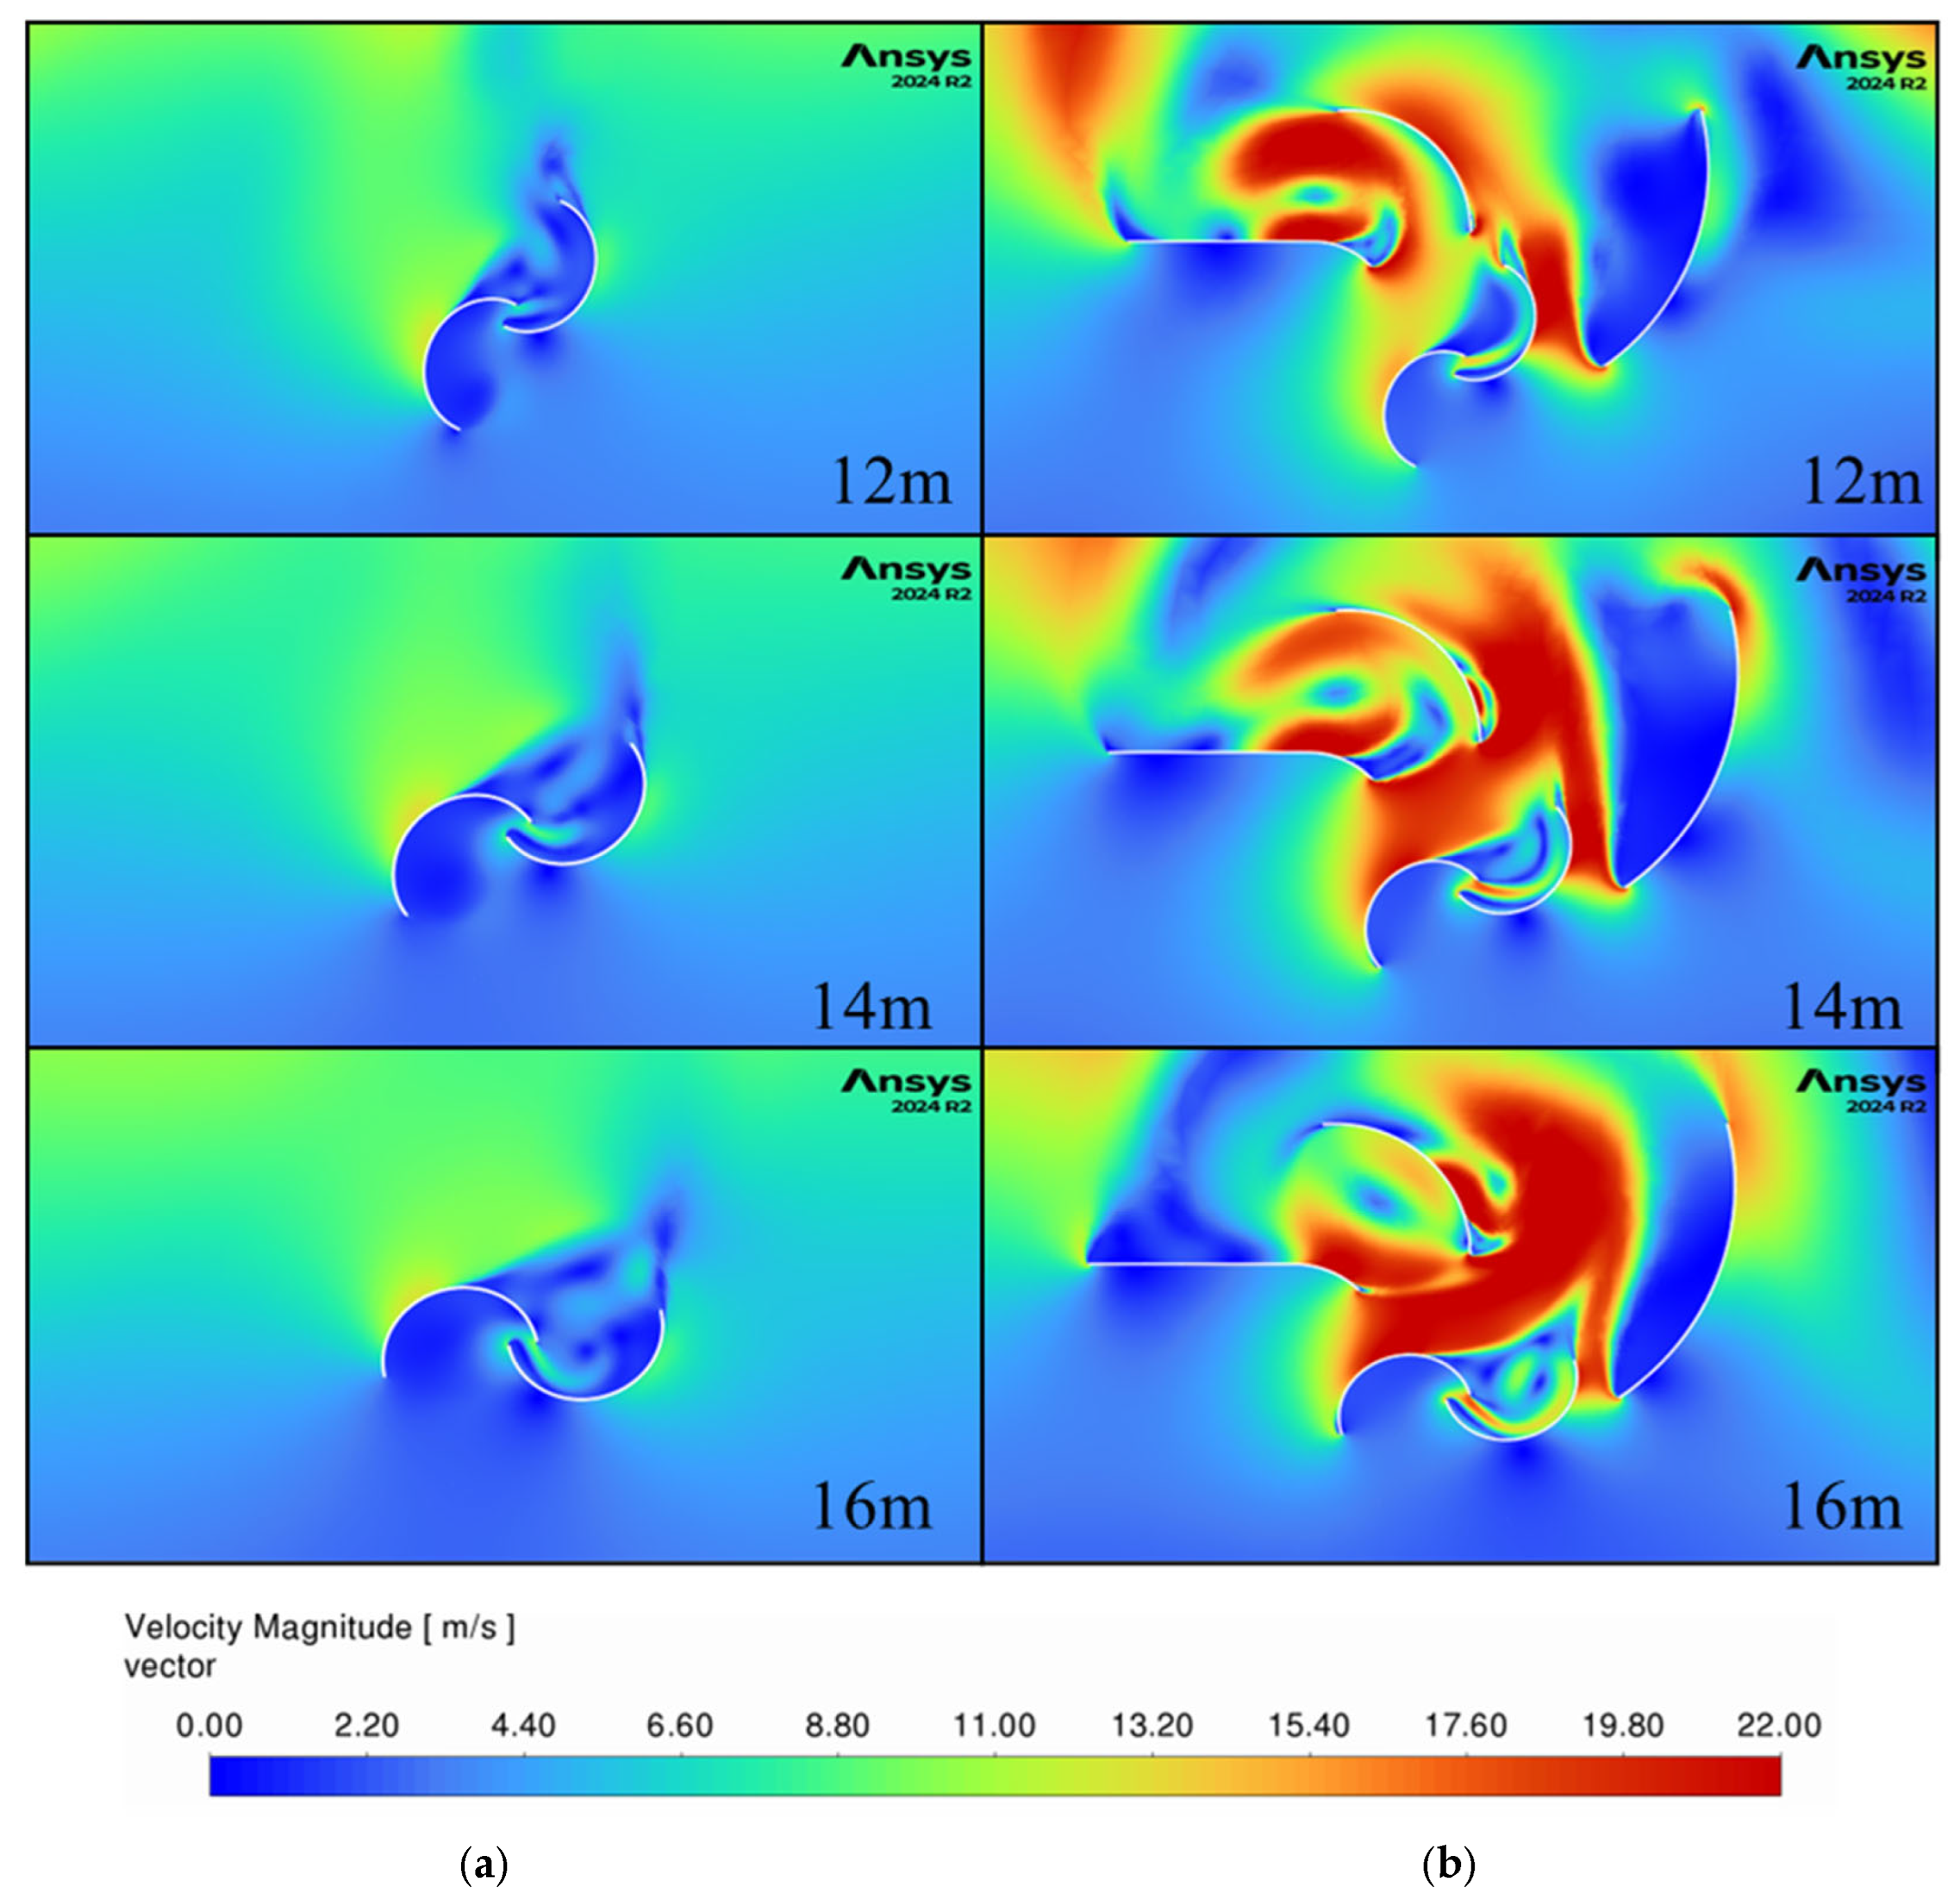
Figure 21 and
Figure 22 show the velocity contours and vectors as the bus moves past the turbine until the front of the bus is 10 m from the center of the turbine. At this location, the back of the bus was 2 m past the turbine center, and thus the vortices that form behind the vehicle did not have as much time to develop as for the car model. This can be observed in the velocity direction for the non-guided configurations between the car in
Figure 16 and the bus in
Figure 22, with the bus model flow rotating less clockwise than the car model by almost 90 degrees. Additionally, the velocity magnitudes are larger than for the car model, and this generates larger vortices behind the returning blade of the non-guided model, decreasing the pressure, which further increases the drag on the blades. The guided model shows smaller vortices behind the returning blades, suggesting that the guides are helping the returning blade as well as directing flow into the advancing blade.
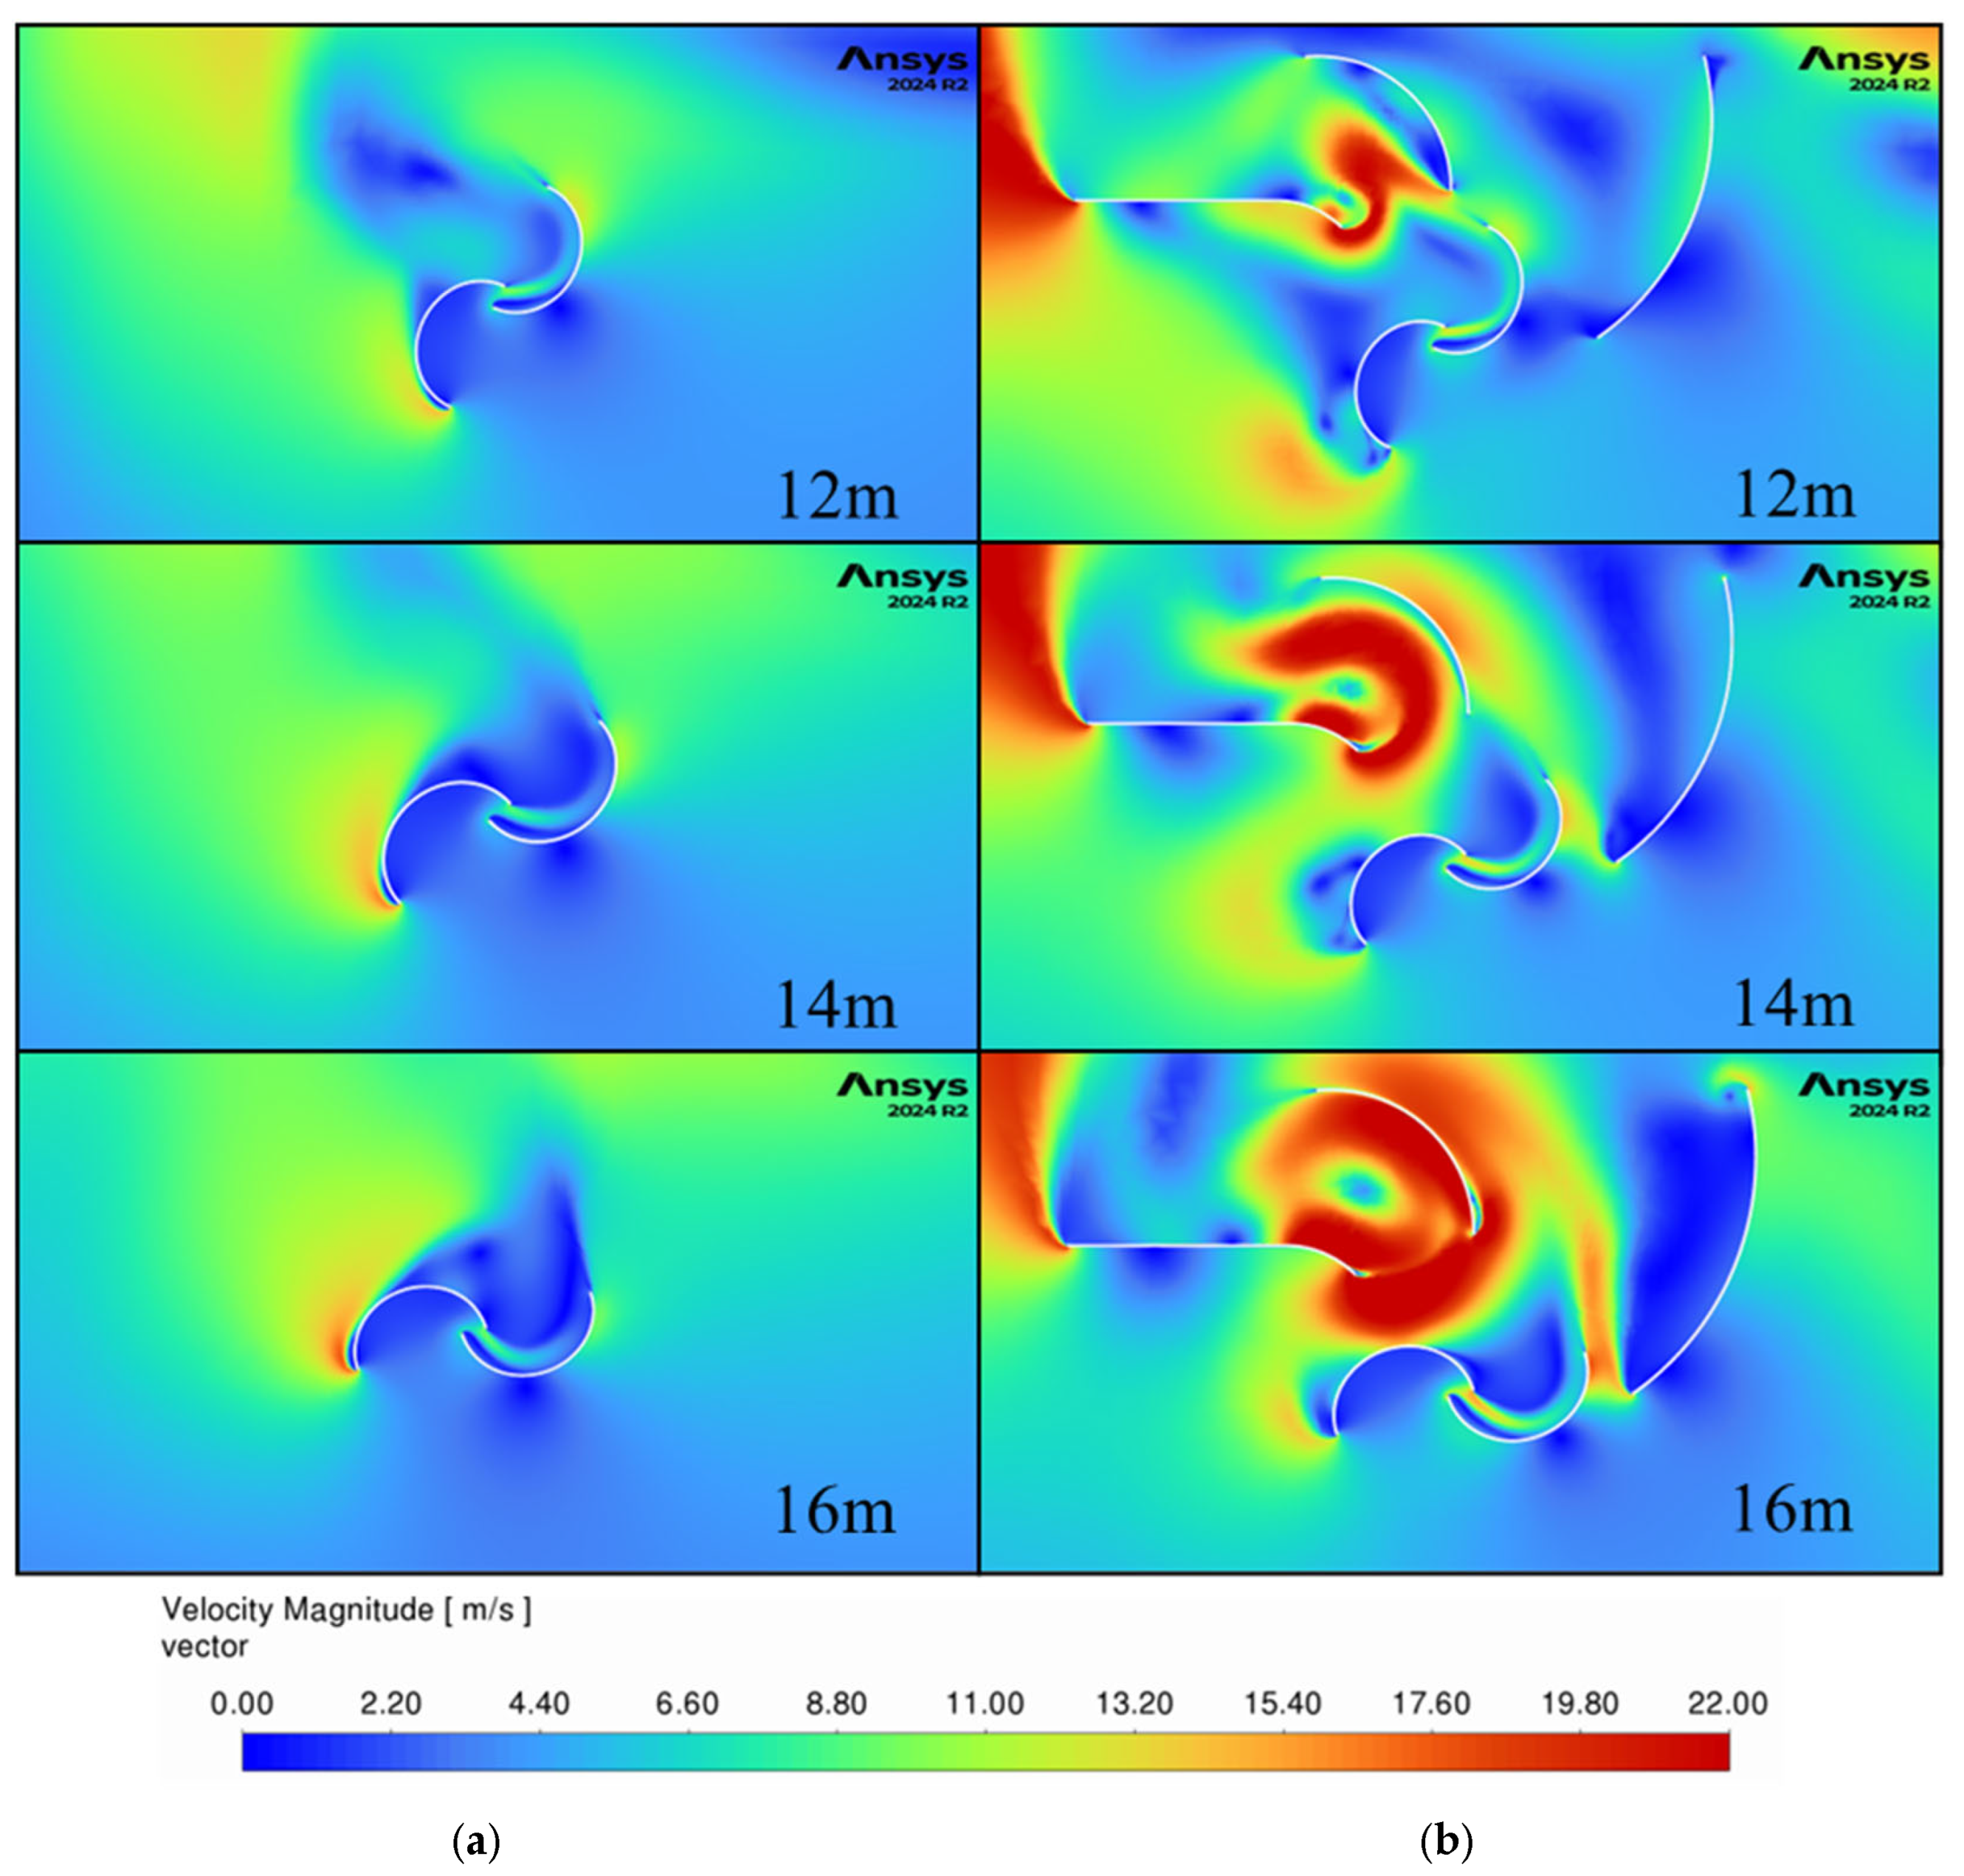
Figure 23 and
Figure 24 show the velocity contours and vectors for the bus model at 12 m to 16 m from the turbine. Compared to the car model, the same larger velocity magnitudes are present even when the back of the bus is 8 m past the turbine. This fact indicates that the guides will help the turbine capture energy between passing vehicles in a real scenario without much of a drop in efficiency.
7. Conclusions
This study presented a comparative CFD investigation of several vertical axis wind turbine (VAWT) configurations—Banki, Darrieus, Savonius, and an elliptical model—subjected to highway-induced wind generated by moving vehicles. The elliptical turbine equipped with three guide vanes yielded the highest energy output of 127.26 J, marking a significant 240% improvement over its baseline version without guide vanes. In contrast, the Savonius, Banki, and Darrieus turbine performances—reported in previous studies—were significantly lower than the optimized elliptical turbine presented in this work, with the Darrieus turbine showing an 83% lower energy output.
The improved performance of the three-guide configuration is attributed to key aerodynamic mechanisms. The guide vanes redirect airflow more effectively toward the advancing blade while shielding the returning blade from adverse flow, thus reducing drag and enhancing net torque. The placement of multiple guides allows them to direct the wind into the turbine as it changes direction. These improvements were made possible by analyzing the wind velocity vectors generated by the CFD models. This controlled flow management significantly increases the energy capture of the turbine, especially during peak vehicle-induced wind conditions.
Despite these encouraging results, this study has several limitations. The simulations were conducted under idealized conditions with constant vehicle speed, fixed turbine rotational speed, and without environmental disturbances such as crosswinds or turbulence. Structural effects like vibration, stress accumulation, and fluid–structure interaction (FSI) were also excluded. Additionally, only single-vehicle, one-way traffic scenarios were considered to allow parametric studies, but these do not fully represent real highway flow dynamics.
Future research should explore the integration of FSI to assess turbine durability and evaluate performance under more dynamic traffic and environmental conditions. Investigating two-way highway flow scenarios, where wake interactions and opposing airflow patterns can influence turbine behavior, will provide a more realistic assessment of energy harvesting potential. Three-dimensional modeling as well as multiple consecutive vehicles passing should also be considered. Experimental testing, either via wind tunnel testing or on-site measurements, is important to compare the simulation predictions and increase confidence in the design. Further studies on adaptive rotation control, turbine spacing, energy storage integration, and economic feasibility will also support the practical deployment of roadside VAWT systems.


